Creating enegr y uf ute r – a bold vision
110
Creating a new energy future – a bold vision ANNUAL REPORT 2021
Transcript of Creating enegr y uf ute r – a bold vision

Creating a newenergy future – a bold vision
ANNUAL REPORT 2021

Our vision

1
Creating a new energy future – a bold vision
isn’t linear.
In pursuing our vision over the past few years, we’ve had to be flexible and adaptable. We haven’t been afraid to challenge the status quo. As leaders of the transformation of the energy sector, we know the ‘same old’ just won’t cut it. We have the confidence to forge new solutions and for our people to work differently, to think differently. We have collaborated with global technology companies and thought leaders who share our view that innovation and digitalisation are key to meeting the future needs of energy systems and fast-evolving customer demands. As governments, businesses and consumers urgently take action to decarbonise, at Vector we are clear on our vision – creating a new energy future. It’s bold.

VECTOR ANNUAL REPORT 2021 /
2

About this report
This report, dated 23 August 2021, is a review of Vector’s financial and operational performance for the year ended 30 June 2021.
The financial statements have been prepared in accordance with appropriate accounting standards and have been independently audited by KPMG.
The financial and operational information has been compiled in line with NZX Listing Rules and recommendations for investor reporting.
The report has drawn from a wide range of information sources. This includes: our stakeholders, customers, communities, sustainability framework, value drivers, risk register, Board reports, asset management plan, financial statements and our operational reports.
Throughout the report, we have focused on what matters most to our stakeholders and our business.
Care has been taken to ensure all information in this report is accurate, including internal assurance and verification processes and Board approval.
Forward-looking statements in this report are based on best-available information and assumptions regarding Vector’s businesses and performance, the economy and other future conditions, circumstances and results. As with any forecast, forward-looking statements are subject to uncertainty. Vector’s actual results may vary from those expressed or implied in these forward-looking statements.
Performance snapshot 4
Chair and Group Chief Executive report 6
Chief Financial Officer report 12
Our people and safety 14
Regulated networks 16
Gas trading 20
Metering 21
Our climate and sustainability 22
Our Board 26
Our management team 28
Governance report 30
Entrust, majority shareholder of Vector 39
Joint ventures and investments 40
Operating statistics 41
Financial performance trends 42
Non-GAAP financial information 44
Financials 45
Independent auditor’s report 90
Statutory information 96
Financial calendar and directory 106
Contents
3
Creating a new energy future – a bold vision

Performance snapshot
680,099NO. OF 9KG BOTTLE SWAPS
590,799TOTAL ELECTRICITY CONNECTIONS
$529.5MGROSS CAPEX INVESTED ACROSS THE GROUP
$513.5MADJUSTED EBITDA1
10.9%GROWTH IN EBITDA FOR OUR METERING BUSINESS
BUSINESS PERFORMANCE
PEOPLE & COMMUNITIES
340,500RESIDENTS IN THE ENTRUST DISTRICT BENEFITTED BY MORE THAN $95 MILLION (2020) THANKS TO ENTRUST’S SHAREHOLDING IN VECTOR
94VECTOR LIGHTS SHOWS FOR THE PEOPLE OF AUCKLAND AND VISITORS
100+TRAINED MENTAL HEALTH FIRST RESPONDERS
0
2000
4000
6000
8000
10,000
12,000
14,000
16,000
FY21FY20FY19FY18FY17
11,135
9,138
11,000
12,231
14,995NEW ELECTRICITY CONNECTIONS OVER THE PAST 5 YEARSAUCKLAND’S GROWTH CONTINUES, WITH MORE NEW ELECTRICITY CONNECTIONS EACH YEAR $194.6M
GROUP NET PROFIT AFTER TAX
1.9MADVANCED METERS ACROSS NEW ZEALAND & AUSTRALIA
116,472TOTAL GAS CONNECTIONS
1. EBITDA from continuing operations adjusted for fair value changes, associates, third-party contributions, and significant one-off gains, losses, revenues and/or expenses. Refer to Non-GAAP reconciliation on page 44.
VECTOR ANNUAL REPORT 2021 /
4

CLIMATE CHANGE
SHAREHOLDER
16.75CENTS PER SHARE FULL-YEAR DIVIDEND
INNOVATION
CLOSE TO
200PARTICIPANTS IN OUR EV SMART CHARGING TRIAL
30NUMBER OF HIGHLY SKILLED DIGITAL AND ENGINEERING ROLES CREATED ACROSS VECTOR AND AMAZON WEB SERVICES, BUILDING THE NEW ENERGY PLATFORM
2NUMBER OF SUSTAINABLE ENERGY ASSOCIATION NZ AWARDS WON BY VECTOR POWERSMART
12%REDUCTION IN OUR CARBON FOOTPRINT IN THE PAST YEAR (SCOPE 1, 2, AND 3)
5
Creating a new energy future – a bold vision

Real progress with Symphony
This is a crucial time in our industry, and Vector is well positioned to respond to the challenges and opportunities decarbonisation will bring. We see this as an opportunity to do things differently; to be flexible, adaptable, and to innovate.
The past twelve months have seen a dramatic sharpening of focus around the world and in New Zealand on climate change, and the efforts that will be required across the world to transition to a low emissions future. In New Zealand, the recommendations put forward by the Climate Change Commission illustrate that our energy system must rapidly shift to a more localised, consumer-centric model. Not only is our energy infrastructure critical to our daily lives, but also to our collective future through its role in enabling the decarbonisation of transport and industry. Legacy energy systems across the whole sector are increasingly unable to meet these new challenges, and must become vastly more sophisticated and adaptable. Vector is well advanced globally in developing and operating digital platforms to manage these changing requirements.
SIMON MACKENZIEGROUP CHIEF EXECUTIVE
JONATHAN MASONCHAIR
That’s why our vision is bold, because the path isn’t straight and we can’t rely on solutions of the past.
Our Symphony strategy puts the customer at the centre of the energy system, using data analytics and technology to create new solutions and options to help people manage the transition to a low-carbon system. It will also result in a more affordable transition for customers, since the new solutions we deploy alleviate the pressure to invest in heavy infrastructure, and this has a beneficial flow-on effect on the prices our customers pay for the services we provide. Fundamentally, it is about creating customer choice, delivering decarbonisation at the same time as
VECTOR ANNUAL REPORT 2021 /
6
Chair & Group Chief Executive Report

reliable and affordable energy solutions for customers.
Over the past twelve months we have seen continued progress against our Symphony strategy across our portfolio of businesses, as they deliver for our
DividendThis year, shareholders will receive a final dividend of 8.50 cents per share imputed at 10.5%, taking the full-year partially imputed dividend to 16.75 cents per share. The final dividend will be paid to investors who are on the register at 9 September 2021 and distributed to investors on 16 September 2021.
LOOKING BACK
Business performanceThis report contains separate performance overviews and highlights of three of our key business segments; Regulated Networks, Gas Trading, and Metering. However, this year has also seen notable developments among our other businesses.
We are excited by the establishment of Vector Technology Services (VTS). VTS will be focused on taking to market key proprietary solutions to accelerate and support other companies who are on their own digital transformation journeys to have access to world leading solutions (page 8).
HRV has delivered a solid result despite the challenges of Covid-19 and continues to show improvement in what is a challenging and competitive environment, making a positive financial contribution.
Vector Powersmart had a challenging year that has seen a number of its projects in the Pacific Islands impacted by Covid-19 issues. However there are ever increasing opportunities arising in New Zealand as solar farms and developments expand. As such Vector Powersmart is well positioned to advise and construct these solutions in New Zealand whilst also continuing with projects in the Pacific when travel permits.
Vector Fibre has delivered a steady performance over the year. High speed telecommunications services are critical to customers, and we see Vector Fibre as key to this opportunity as it leverages its fibre assets in the wholesale market.
customers, and at a group level as we continue to reimagine what energy systems are capable of. We’ve also continued to look outside the energy sector to find other companies that can help us achieve our goals.
As we summarise in this report, this strategy has enabled us to deliver a strong financial result in the face of continued disruption from Covid-19, particularly in Auckland and parts of Australia. We commend our teams who have continued to respond to customer needs with urgency, commitment and adaptiveness, even as we continue to find ways to contribute positively to the global challenge of decarbonisation.
Strong earnings Vector has delivered a strong result for FY21, recording adjusted earnings before interest, tax depreciation and amortisation (adjusted EBITDA1) of $513.5 million. This was up $23.5 million or 4.8% on last year’s result and is in line with guidance provided at the half-year result.
Group net profit after tax was $194.6 million or $97.3 million higher than the prior year’s result due to a number of factors including higher earnings, lower interest cost, the impact of a non-cash impairment in last year’s result, and an increase in capital contributions.
Total capital expenditure for the year was $529.5 million, an increase of $40.8 million or 8.3% on the prior year. The increase reflected continued investment in infrastructure to support Auckland’s growth, and, in our Australian metering business, increasing deployments of advanced meters, and increasing stock levels to counteract risks associated with global production shortages linked to Covid-19.
$513.5MADJUSTED EBITDA1, UP $23.5 MILLION OR 4.8% ON LAST YEAR’S RESULT
1. EBITDA from continuing operations adjusted for fair value changes, associates, third-party contributions, and significant one-off gains, losses, revenues and/or expenses. Refer to Non-GAAP reconciliation on page 44.
“Our long-standing vision to create a new energy future is also long-term
in its aspiration. We are proud of the steps we are taking along the way.
7
Creating a new energy future – a bold vision

Enabling growth in Auckland We continue to invest in the integrity and reinforcement of the electricity network supporting Auckland’s growth, using a mix of traditional and non-wired solutions. Our aim is to keep pace with growth while also ensuring the investments we make are efficient, so that future costs are affordable for our customers, and the network is ready for the demands placed on it from electrification.
In determining our capital investment approach for the network, we must navigate the complexities of a growing city and multiple other infrastructure and investment pipelines, including major projects such as light rail or large housing developments, which require significant planning and investment from us.
LOOKING FORWARD
At the centre of the energy transitionElectrification of the economy is at the heart of New Zealand’s decarbonisation efforts. The electrification of transport will be part of this, as will distributed energy resources such as solar and batteries, new customer technology solutions such as Vehicle-to-Home charging, and new business models such as peer to peer trading, enabling customers to trade their excess energy.
Vector Property Services is a new unit established to look at opportunities within our property portfolio.
Ongoing impacts from Covid-19As an essential services provider, in the past twelve months we have maintained our focus on ensuring the safety of our people and communities in the face of Covid-19, and ensuring our ability to continue providing our essential products and services.
We have seen significant workforce and supply chain challenges across several of our businesses, including metering, and the procurement of common equipment such as cabling for our electricity distribution business. Through careful planning and strong management we have been successful in mitigating disruption to our work programmes. We have also had success in managing the impacts of fluctuations in commodity prices. We see these challenges as likely to persist over the short term and are working to mitigate their impact and reduce our exposure.
We continually evolve our internal policies and the ways we support our staff to work safely, and their wellbeing, under changing Covid-19 restrictions. We are executing a comprehensive plan to support the Covid-19 vaccine rollouts across New Zealand and Australia with information, access to medical experts to answer individual questions, and other practical support for our people (page 14).
Electricity network quality performance We are pleased to report that in the last regulatory year to 31 March 2021, we have seen improving network quality performance within our regulatory System Average Interruption Duration Index (SAIDI) limit. This follows a sustained focus on improving network performance for our customers over previous years. We acknowledge the efforts of our own people and our Field Service Providers in this outcome and we remain committed to continuing this focus.
$194.6MGROUP NET PROFIT AFTER TAX, $97.3 MILLION HIGHER THAN THE PRIOR YEAR’S RESULT
Developing new revenue opportunities We have further developed our strategy to leverage the infrastructure and technology we use in our existing businesses in order to create commercial opportunities, such as providing solutions to third parties.
Vector Technology Services has been established to take to market solutions developed as part of our digital transformation journey. This has led to investment efficiencies through our choice to partner with others to develop these solutions, which Vector as a customer benefits from, and which avoid the need for us to seek alternative solutions from third party vendors. We are exploring global opportunities for key priority solutions including the New Energy Platform created through our strategic alliance with Amazon Web Services (AWS), Distributed Energy Resource Management Systems (DERMS), cyber security, and others. As an example, VTS is now providing cyber security services to another New Zealand electricity distribution business, leveraging Vector’s 24/7 security operations centre.
Vector Property Services has been established to explore the commercial potential of our property and facilities assets, in the context of the opportunities to partner with third parties to better utilise some of our passive land, building and tunnel assets, such as co-location of other infrastructure, and broader development in line with our Symphony strategy.
VECTOR ANNUAL REPORT 2021 /
8
Chair & Group Chief Executive Report

Vector has long embraced this future and our role in bringing it about, in the countries we already operate in and beyond.
Our Symphony strategy unites our teams on a clear path into the future and directs our activity, often in ways that put our people at the forefront of emerging technology and new solutions. One clear example from the past twelve months is our work to demonstrate the potential for smart, algorithmically controlled, electric vehicle (EV) charging technology to enable lower transport emissions and more efficient capital investment in the infrastructure needed to support it (page 24). Another is our work with leading global companies, such as Amazon Web Services, to develop new products and services, such as the New Energy Platform (page 21). We are proud of the opportunities Vector provides for our people to contribute meaningfully to a low-carbon future.
Energy affordability Alongside decarbonisation, long-term energy affordability continues to be central to our strategy and our ownership model. Earlier this year we saw the vulnerability of our current system to ‘dry year’ risk, where some businesses faced high electricity prices. The importance of energy affordability is set to become even more significant in
the context of enabling electrification to lower our carbon emissions.
At a consumer level, our ownership model, being majority-owned by Entrust, ensures our incentives are aligned to deliver for our customers and shareholders and places our focus on getting the energy transition right. We do not seek to build our way to electrification, since that would be unaffordable for our customers. Instead, we seek to optimise the use of our existing infrastructure through digital solutions, and build where we need to.
Our Symphony strategy aims to find solutions to deliver affordable, reliable and clean energy. Our innovations in data analytics, enabling distributed energy solutions for homes and businesses, such as solar, batteries, and electric vehicle (EV) charging, and the digitalisation of the electricity network are designed to deliver value aligned with this strategy.
Evolving our thinking on climate risk and opportunityWe are evolving our thinking on climate risk and opportunity as we prepare ourselves and others for the opportunities a decarbonised future will bring. Vector has adopted a science-based target for our own emissions reduction plans, which complements our earlier commitment to achieve net zero emissions by 2030.
We are committed to supporting decarbonisation in New Zealand, through what we call our carbon ‘handprint’, which is how we enable others to reduce their carbon footprint.
Our Smart EV Charging trial in Auckland is an example of our handprint in action (page 24). Smart solutions like this would enable car owners to switch to EVs knowing they will be able to charge them reliably and keep power affordable for all.
Climate-related financial disclosuresNew Zealand is the first country to enshrine a Task Force on Climate-related Financial Disclosures (TCFD)
reporting obligation on major private sector entities. While that reporting will not become mandatory until 2024, we are embarking on this journey in advance of that deadline. Our reasoning is simple: it is in our interest to lead the transformation of the energy sector and to provide our stakeholders with the information that serves their long-term interests.
We are developing, for the first time, our responses in relation to recommendations from the TCFD. Our TCFD report will show that climate change brings both risks and opportunities for Vector, and that with our diverse portfolio of energy solutions businesses, we are well positioned to embrace the significant opportunities presented by the energy transition. We are also able to accelerate the energy transition for the New Zealand economy. We intend to publish our first TCFD report soon.
Cyber security in the context of ‘Crimeware-as-a-Service’Perpetrators of cyber threats have vastly increased their sophistication in recent years, to the point where, in a mirror of our modern, global economy, the cybercrime economy has seen a decisive shift towards a ‘Crimeware-as-a-Service’ model. At the same time, digital platforms that reduce cost, and improve efficiency and effectiveness, continue to become increasingly important.
We continue to increase our cyber security capabilities and have several key partnerships in place with global leaders in cyber security. While building this capability to protect our own business, we are creating tools that can be used by other organisations in New Zealand via VTS.
As the barriers to conducting cybercrime continue to lower, we have seen a number of large-scale, severe, well-publicised security events. We are also seeing increasing criticality for electricity distribution, particularly in the context of electrification. Against this context, we are maintaining significant investment
“It is in our interest as a company to lead the transformation of the energy sector and to
provide our stakeholders with the information that serves their long-term interests.
9
Creating a new energy future – a bold vision

to continue to build on what we have established so far, and to further evolve the Vector cyber security capabilities against our cyber security strategy and roadmap.
Regulation and policy for a new energy futureThe Climate Change Commission’s advice for the Government has highlighted a number of opportunities to improve the regulatory and policy landscape to better enable decarbonisation. A number of its recommendations align with views we have championed previously, including increasing recognition of the opportunities presented by distributed energy resources, developing a national energy strategy, and accelerating the adoption of electric vehicles. We look forward to continued positive engagement with our regulators and the Government to find solutions together.
We share the Commission’s view that electricity networks should be appropriately equipped, resourced and incentivised to innovate so that they can play their role in helping electrification happen faster, and more equitably. In particular, we agree with the Commission’s comment, in its final advice, that our regulatory framework should be “sufficiently adaptive to enable Electricity Distribution Businesses to undertake the innovation and investment required to meet climate change outcomes”.
We also note the Clean Car Discount scheme and the National Charging Infrastructure Plan. The uptake of EVs is something Vector has been preparing for over the past few years, most recently with our EV Smart Charging trial. This has underscored the need for EV charging to be smart, and connected to electricity network management systems. We strongly advocate for a standard requiring this for new EV chargers, otherwise our ability to use this technology to benefit EV owners, and all electricity customers, may be constrained.
The future of gas We were pleased to see the Climate Change Commission’s final advice recognises the complexities of a transition away from the use of fossil gas as an energy source in homes, businesses and industry.
In particular, we support the need for careful planning and industry involvement around any transition away from gas. A balanced transition, rather than one that fails to plan sufficiently, is most likely to meet the objectives of Government, customers, and gas asset owners. If a clear transition path cannot be agreed, there are likely to be significant customer cost implications. For example, under the Climate Change Commission’s demonstration transition pathway, the cost to households, consumers and commercial buildings for appliance replacement and building modifications to transition away from gas could total $5.3 billion by 2050. There would also be major disruptions for businesses and households, as the investment requirements of maintaining gas infrastructure are passed to a declining customer base. A managed transition acknowledges the role low-emissions gases such as biomethane or hydrogen could play in the future, using existing infrastructure. This is something that we are exploring, along with others in the industry (page 19).
We will continue to engage with New Zealanders and the Government, both together with our industry as part of the Gas Infrastructure Group, and on our own behalf, as final decisions are worked through on the best possible transition plan.
Upholding the regulatory compact on gas distributionWe note the Commerce Commission is tasked with resetting prices for regulated gas pipelines businesses from 1 October 2022. As part of this process, Vector intends to reconsider and possibly republish our 10-year forecasts for our gas distribution business in December, as we learn more at that time about
the Government’s implementation of the Climate Change Commission’s recommendations around natural gas. Vector maintains that an active dialogue between regulators, the Government and industry around this reset is necessary to ensure any regulatory compacts are upheld, especially at a time when confidence needs to be maintained to justify the significant ongoing investments required to maintain the integrity of existing gas network infrastructure.
FINAL WORDSAcross our group we provide infrastructure, products and services that are increasingly critical for our decarbonisation efforts. We must continue to leverage new technology, and business models, to provide our customers with cleaner, more reliable and affordable energy solutions into the future.
In the coming year, while ensuring we deliver essential services efficiently and safely to our customers remains paramount, we are also focusing on delivering growth in our Australian metering business, developing and growing VTS, successfully responding to the challenges we’re seeing around resources, enabling Auckland growth, and ensuring a sensible gas transition.
We are strongly positioned to enable decarbonisation and continue delivering strong results to our shareholders.
Jonathan MasonChair
Simon MackenzieGroup Chief Executive
VECTOR ANNUAL REPORT 2021 /
10
Chair & Group Chief Executive Report

“Given our strategy, we are ideally positioned to help solve big
challenges like decarbonisation, and continue to deliver a strong
result to our shareholders.
SOUTHERN PAPRIKA, ONE OF OUR COMMERCIAL CUSTOMERS IN WARKWORTH
11
Creating a new energy future – a bold vision

A strong financial result
Vector’s financial performance for the year reflects a strong result with adjusted EBITDA1 of $513.5 million. This was up $23.5 million or 4.8% on last year’s result. Group net profit after tax was $194.6 million which was $97.3 million or 100% higher than the prior year. The result was largely due to increased earnings, higher capital contributions and lower interest cost being partially offset by higher depreciation and amortisation. The prior year also included a non-cash impairment of $32.0 million.
SEGMENT ADJUSTED EBITDA1
Adjusted EBITDA1 for our Regulated Networks was $350.7 million, up $13.1 million or 3.9% against the prior year. Adjusted EBITDA1 includes a full-year impact of the Commerce Commission’s DPP3 price reset, which came into effect on 1 April 2020 and saw prices reduce by 6.9%, and the retention of loss rental rebates (LRRs) in order to partially mitigate future electricity distribution price increases, and to offset the impact of electricity volume reductions on revenue under the new revenue cap regulatory regime. Despite the adverse impact of the DPP3 reset and inflation forecast assumptions used to set DPP3, the Regulated Networks delivered a solid result in the period. During the year we retained a total of $22.8 million of LRRs, and we have announced our intention to pass on a credit of $20 to Auckland electricity account holders later in the year, representing a distribution of about $12 million of LRRs directly to customers.
Gas Trading adjusted EBITDA1 was $27.4 million, down $6.5 million against
Cash flowOperating cash flow was 25.6% higher at $499.1 million. This increase was largely due to an increase in capital contributions and lower tax paid as a result of the reduction in the level of dividend imputation.
Capital expenditureGross capital expenditure was $529.5 million, $40.8 million (8.3%) higher than last year. This increase reflected ongoing investment in infrastructure to support Auckland’s continued growth, and increasing deployments of advanced meters as market demand continues to accelerate in Australia. Note this increase in capital expenditure was partly funded by a $36.1 million increase in capital contributions recognised as income under IFRS.
In FY21 we invested $314.7 million gross capital expenditure to facilitate Auckland’s growth, and improve the safety, reliability and resilience of our electricity and gas networks. This maintains the high level of network capital expenditure invested over recent years for replacements and upgrades, improving network quality performance within regulatory limits, and to improve reliability.
Balance sheetVector continues to maintain a strong balance sheet. Our 30 June 2021 gearing, as measured by economic net debt to economic net debt plus adjusted equity, rose to 56.5% from 55.2% at the beginning of the year. We remain an ‘investment-grade’ credit risk with a Baa1 rating from Moody’s and BBB from Standard & Poor’s.
DividendThis year, shareholders will receive a final dividend of 8.50 cents per share imputed at 10.5%, taking the full-year partially imputed dividend to 16.75 cents per share. The final dividend will be paid to investors who are on the register at 9 September 2021 and distributed to investors on 16 September 2021.
1. EBITDA from continuing operations adjusted for fair value changes, associates, third-party contributions, and significant one-off gains, losses, revenues and/or expenses. Refer to Non-GAAP reconciliation on page 44.
$171.6MADJUSTED EBITDA1 FOR VECTOR’S METERING SEGMENT GREW 10.9% TO $171.6M
the prior year total of $33.9 million. The reduction in earnings was mainly due to the sale of the Kapuni gas treatment plant and associated assets, which took place in March 2020. After normalising for this sale, adjusted EBITDA1 was flat due largely to improved natural gas and Ongas LPG margins offset by lower Liquigas tolling revenue. Vector continues to retain an economic interest in the performance of the Kapuni plant, with the net present value of future income recognised as a $81.7 million receivable on the balance sheet and $6.3 million of interest income included in FY21 profit.
Adjusted EBITDA1 for Vector’s metering segment grew $16.8 million or 10.9% to $171.6 million, as a result of continued growth in advanced meter deployments in New Zealand and Australia.
Cloud-computing adjustmentsThe recently announced interpretation of the International Financial Reporting Standards (IFRS) in relation to cloud-computing arrangements by the interpretations committee for the International Accounting Standards Board requires that certain project implementation costs be expensed. This has had a $2.3 million impact on adjusted EBITDA1 for the year ended 30 June 2021.
Capital contributionsCapital contributions grew by 41.8% to $122.5 million during the year, resulting from a change in policy requiring 100% customer funding for electricity connections and continued connection growth. Given the challenges of keeping pace with Auckland growth, we continue to review the level of customer capital contributions.
VECTOR ANNUAL REPORT 2021 /
12
Chief Financial Officer Report

Climate Change Commission reportWe await with interest to see the Government’s response to the Climate Change Commission’s report and how the Commerce Commission incorporates any policy changes into the regulatory frameworks for the gas and electricity industries, and any impacts on our gas trading businesses. There is also the DPP3 reset of gas distribution prices due to come into force from 1 October 2022. Vector is working closely with other industry players, regulators and government officials in ensuring there is a smooth transition to a new decarbonised energy system. Vector will re-test the carrying value of its electricity and gas assets at 31 December 2021 as part of its interim reporting obligations, by which time we hope to have more clarity on the outlook for these businesses.
10
12
14
16
18
2021202020192018201720162015201420132012201120102009
DIVIDEND DECLARED CENTS PER SHARE
GROUP CAPITAL EXPENDITURE$ MILLION
0
50
100
150
200
250
300
350
400
450
500
550
FY21FY20FY19FY18FY17
381.2367.4
425.1
488.7529.5
JASON HOLLINGWORTHCHIEF FINANCIAL OFFICER
13
Creating a new energy future – a bold vision

Our people and safety
None of us could have anticipated the pressures that Covid-19 would bring, and the range of stresses and unexpected worries which have continued to play a large part in our employees’ lives over the past twelve months. We have maintained a focus on care and wellness for our people throughout the year, recognising our role in providing a supportive and inclusive workplace, in relation to physical and mental health.
Covid-19 support and vaccinationsThroughout the year we have continued to evaluate and adapt our response to Covid-19, to ensure our ability to deliver our essential services is not compromised.
To help our people navigate the continued disruption, we have implemented a number of programmes aimed at providing extra support and information. This has included a vaccination information campaign, to provide access to factual, relevant information about the Covid-19 vaccination. This multi-channel campaign has included external subject matter experts such as doctors, written communications in multiple languages, video, staff Q&A sessions, and has been tailored for relevance across New Zealand and Australia.
Mental health and wellbeingThis year we have been consistent in proactively helping our people find ways to access support if they are having a hard time.
In recognition that mental wellbeing is a continuum and we must be vigilant about how concerns may manifest across our large workforce, we have begun to roll out a Mental Health First Responder programme, to improve our ability to help our people through tough times. So far we have more than one hundred trained mental health first
We remain focused on our critical health and safety risks, our controls, and on assuring our confidence in those controls. Vector has now moved the reporting and management of HSE incidents to Vector’s group incident management system, Active Risk Manager (ARM). This enables incidents that occur in our businesses, importantly including ‘near-miss’ incidents, to be linked with our critical HSE risks, which drives a data-driven and continually improving understanding of where our focus is best applied to develop HSE improvements.
Attracting and developing diverse talent Vector remains committed to diversity and inclusion as we recognise the importance of a dynamic workplace to drive a range of views that are representative of our communities and customers.
At 30 June 2021, the proportion of female executives was 25%, however this does not include Fiona Michel who is currently on secondment. In the past twelve months, we have seen a slight gender composition shift with the number of female employees increasing from 35.1% to 35.6% across the organisation.
Our ethnicity profile has moved slightly, with our Māori representation reducing by 1.1% to 5.0%, Pasifika representation has increased by 1.9% to 5.0%, Asian representation up by 5.0% to 19.1%, and MELAA (Middle Eastern, Latin American and African) representation has increased by 1.3% to 2.3%.
Age-wise, in the past year our employees aged 20 to 39 has remained unchanged at 49.8%. Those aged 40 and over has increased slightly by 1.6% to 49.4%, while employees aged under 20 years declined by 1.6% to 0.6% and 0.2% recorded as unknown.
responders who can provide another avenue for any of our Vector people to find support, including referrals to appropriate care where necessary.
We are now looking to pilot a mental health leadership course for all people leaders, and create a champions forum to raise awareness and assist in normalising and destigmatising mental health.
We have also run programmes covering mindfulness, and weekly informal learning opportunities, covering a range of topics from an introduction to New Zealand Sign Language, to the human impacts of hybrid working.
Progress towards our Group safety goalsTo track our progress against our safety goals, Vector continues to measure safety performance across the Group, including Lost Time Injury Frequency Rate (LTIFR) and Total Recordable Injury Frequency Rate (TRIFR). Beyond tracking progress, these measures are critical for indicating which areas require ongoing improvement.
In the last year we observed a 21% increase in LTIFR and a 30% increase in TRIFR across the Group. This can be attributed to low-level manual handling, slips, trips and fall injuries. The severity rate, which measures number of lost days per 1 million hours worked, improved by 24%.
In alignment with our Symphony strategy, our approach to managing and improving safety across the Group continues to evolve, to one where the unique needs of our different businesses, employees and customers directly inform our safety management thinking and practices. This is being reflected in a review Vector is undertaking of its Health Safety and Environment Management System (HSEMS) to reflect the latest HSE developments and continue to enhance the practical application and usability of the HSEMS at all levels of our businesses.
VECTOR ANNUAL REPORT 2021 /
14
Our people and safety

18.7%20-29
31.2%30-39
23.6%40-49
17.8%50-59
8.0%60+
0.6%UNDER 20
0.2%UNKNOWN
EMPLOYEES BY AGE
35.6%FEMALE
64.4%MALE
0.1%DIVERSE
EMPLOYEES BY GENDER
19.6%
24.3%
26.3%
5.0%
5.7%
6.5%
10.2%
2.2%
ASIAN
NZ EUROPEAN
NZ MĀORI
OTHER
PASIFIKA
UNKNOWN
0.3%PREFERNOT TO SAY
EUROPEAN
MELAA*
EMPLOYEES BY ETHNICITY
* Middle East, Latin America and Africa
Pasifika poetry Five of our people have become published poets this year, with their poems included in the Pasifika Niu Leaders Aotearoa anthology. This collection was published in celebration of Vector’s Growing Pasifika Niu Leaders programme,
first developed in response to the under-representation of Pasifika employees in our leadership roles. Since inception in 2017 we have invited other organisations to participate and since then have seen 60 Pasifika leaders graduate.
REBECCA GEORGE AND TIOATA TUILOMA, TWO VECTOR PEOPLE WHO HAVE
GRADUATED FROM OUR GROWING PASIFIKA NIU LEADERS PROGRAMME
15
Creating a new energy future – a bold vision

Regulated networks
Increased revenueRevenue increased 0.9% to $767.5 million, due to an increase in capital contributions which were up $35.4 million to $121.1 million. This increase was partially offset by the full-year impact of the Commerce Commission’s lower DPP3 revenue allowance and lower pass-through costs. Despite the adverse impact of the DPP3 reset and inflation forecast assumptions used to set DPP3, the regulated networks delivered a solid result in the period. The increase in capital contributions reflects continued connection growth and a change in capital contribution policy where we now seek 100% contribution for electricity connections. Underlying revenue was down $10.9 million (2.4%) driven by the impacts of the DPP3 price reset and volume reductions. 590,799
TOTAL ELECTRICITY CONNECTIONS, AN INCREASE OF 1.9%
Mt Albert undergroundingThe Mt Albert undergrounding project was proudly funded by Entrust, the majority shareholder of Vector, and was delivered by Vector. The area, bound by Oakley Creek, New North Road, Carrington Road and Unitec, consists of 16 streets, with a combined street length of 5.4km, 166 poles and benefitting 867 customers. It is a significant project and will result in the removal of 10.2km of overhead electricity lines. The project commenced in October 2019 and is nearing completion.
Where possible, Vector aims for a ‘dig-once’ approach, so residents benefit not only from underground power services, but also potentially from telecommunications, street lighting and pavement upgrades, resulting in an all-round visually enhanced street appeal at the end of the project.
It takes a large crew to pull off an undergrounding project of this scale. Vector provides project ambassadors, who frequently communicate with residents and property owners about the project, how they will be impacted, and time frames.
ENTRUST TRUSTEES (FROM LEFT) DR PAUL HUTCHISON, WILLIAM CAIRNS
AND ALASTAIR BELL AT THE SITE OF THE MT ALBERT UNDERGROUNDING PROJECT
Strong connection growth across electricity and gasNew electricity connections increased to 14,995 from 12,231 in the prior year. We also added 3,844 new gas connections, up from 3,201 a year earlier. Total electricity connections stood at 590,799 up 1.9% from 580,060 a year earlier. While total gas connections were 116,472, up 2.2% from 113,960 a year ago.
Both electricity and gas volumes have been impacted by Covid-19. Volumes transported across the electricity network were up only slightly at 8,325 GWh from 8,315 GWh a year earlier. Auckland gas distribution volumes were down 1.4% at 14.1 PJ from 14.3 PJ a year earlier.
VECTOR ANNUAL REPORT 2021 /
16
Regulated networks

Maintaining high levels of capital expenditureGross regulated capex decreased by 0.8% to $314.7 million compared to $317.1 million a year earlier. Capex net of capital contributions was 16.3% lower than the prior year at $193.6 million. Capex continues to be at high levels due to higher growth capex reflecting the continued growth in connections and infrastructure projects, as well as investment to improve the reliability and resilience of our networks.
Improving network reliabilityWe have seen notable improvements in network availability over the past year. We measure these improvements through mechanisms such as SAIDI, where we achieved compliance within the regulatory limit and other measures that monitor how effective we are in keeping the lights on.
Continued innovation in work practice and technology across our teams and our Field Service Providers, has contributed to these results. We are gratified to see that the field work supporting this effort has been delivered safely, especially in the context of ongoing disruption and adaptation to Covid-19.
Ongoing capital investment in making the electricity network more resilient has also contributed to improved performance, including field deployment this year of digital solutions that link asset assessment tools used by our Field Service Providers with our asset information systems in real time. This enables further evolution in our risk-based approach to asset management.
Together with our Field Service Providers, we are maintaining our focus on improving network performance for our customers, including how we respond to severe weather events, such as the June 2021 tornado in Papatoetoe, Auckland.
“We are continuing
to transform our electricity
network through a combination of new engineering
solutions and digitalisation to meet the needs
of the future.
17
Creating a new energy future – a bold vision

Delivering for customers through lockdownsAs a provider of essential services, across three Auckland lockdowns this year we have refined our processes for quickly adapting to the changes these bring for us and our customers. The task is not simple; we can have hundreds of
jobs planned on the electricity network each month, every one involving careful planning, coordination between delivery teams, traffic management and other infrastructure providers, and notification to customers. We have improved our ability to quickly determine which jobs should be postponed or proceed as
VECTOR ANNUAL REPORT 2021 /
18
Regulated networks

Gas Infrastructure Future Working Group Vector is a member of the Gas Infrastructure Future Working Group, established in May 2021, to offer constructive input to the Government’s response to the Climate Change Commission’s advice in relation to the future of gas in New Zealand. The working group comprises Vector, PowerCo and Firstgas, with regulators and other parties as observers.
The working group recognises that New Zealand currently does not have a coordinated plan or planning process to address the consumer effects and complexities of significantly reducing or transitioning away from natural gas if the decision is made that piped natural gas should be a much smaller part of the energy mix or removed from the energy mix altogether.
The working group is undertaking research to better understand the problem and potential solutions by assessing the policy, practical and stakeholder implications if gas was phased out under a wind-down scenario, and the feasibility of incorporating green gas (such as biogas or hydrogen gas) under a repurposing scenario.
The working group intends to provide a findings report that draws out insights from the research and makes recommendations to the Government on policy decisions that may affect the future of gas in New Zealand.
planned. We take into consideration the increased inconvenience of temporary power outages to customers who may suddenly find themselves trying to work and school their children from home.
This work has been informed by data that shows, compared with 2019, customers are less accepting of planned outages occurring on a weekday afternoon. We consider this to be a sign of changing customer preferences as a result of Covid-19 lockdowns requiring more people to be at home during the day, as well as reflecting the increasing criticality of electricity supply to daily life.
Working together for AucklandWe have worked collaboratively with a number of other Auckland agencies this year to develop innovative arrangements that benefit the city.
Through a new Electricity Resilience Targeted Rate, adopted by Auckland Council in its 10-year Budget 2021-2031, there will be an enhanced maintenance programme for existing street trees owned by the council, improving power supply security and public safety around power lines, while public tree planting, in line with the council’s Urban Ngahere (Forest) strategy, will also be boosted.
We have also developed operational processes with Auckland Transport and Waka Kotahi NZ Transport Agency that enable our first responder Field Service Providers to use bus lanes and priority access motorway on-ramps. We are still working towards the ability to use flashing lights to help designate our first responders as emergency vehicles. These provisions enable faster access to emergency sites involving electricity assets, such as car crashes with power poles.
We continue to engage with large customers and developers making plans for Auckland, whether expanding their existing operations, or considering moving to the region to ensure their access to safe, reliable and secure infrastructure.
Evolving for the futureWhile we continue to invest in improving network availability, we are also continuing to transform our electricity network through a combination of new engineering solutions and digitalisation to meet the needs of the future. Our ongoing Smart EV Charging trial (page 24) has demonstrated how optimising existing infrastructure using new technology can reduce the cost of EV uptake while securing reliable charging.
Our programme to implement an Advanced Distribution Management System is progressing and is an important component of improved optionality, network resilience, flexibility and innovation.
We have implemented a new Default Distributor Agreement, imposed by the Electricity Authority, with all electricity retailers who use our network, which we hope will provide us better access to electricity consumption data from customer smart meters. This is an important step towards ongoing digitalisation as it improves our visibility
of network performance at the customer end, and will help our ability to plan and innovate to meet future needs.
The insights we gain from our data analytics includes modelling that combines all Vector customer and energy information with wider data sources, such as building characteristics and socioeconomics. This continues to set us apart from other electricity distributors through facilitating a bottom-up view of network planning that starts with the customer. This approach is strongly aligned with our Symphony strategy to put the customer at the centre of the energy system, and provides us a granular view of changing energy consumption patterns, and new technology adoption.
We take our responsibilities around management, privacy and security of all data seriously, and our commitment remains firm as our industry evolves. We are focused on ensuring we have the right security and protections in place to make sure that, as custodians of the data, we look after it in accordance with our privacy obligations.
We are continuing
to transform our electricity
network through digitalisation to meet the needs
of the future.
“We take into consideration the increased inconvenience of temporary power outages to customers who may
suddenly find themselves trying to work and school their children from home.
19
Creating a new energy future – a bold vision

acquisition, ordering and account management services.
Over the year we have also continued the roll-out of a Vector Ongas brand covering our 9kg Bottle Swap, LPG and natural gas products and services for residential and commercial customers. This visual identity revitalises our proposition in a competitive market.
Challenging commercial gas marketNatural gas supply was constrained due to local factors such as lower production, as well as other factors such as import delays due to Covid-19 disruption. In this challenging market, we worked hard with our customers to find solutions to secure supply.
Gas trading
45,043TONNES OF LPG SALES, AN INCREASE OF 3.9%
VolumesThe Vector Ongas LPG business continued to strengthen during the year. LPG bulk and cylinder sales were higher compared to the prior year. Overall LPG sales were up 3.9% at 45,043 tonnes.
Bottle Swap 9kg volumes were down 3.1% to 680,099 bottles from 701,923 bottles a year earlier. This decline is partly attributable to the impact of Covid-19 as the prior year saw an unseasonal increase in the number of swaps during March 2020 in the lead-up to the first lockdown in New Zealand.
Liquigas LPG tolling volumes were down 11.8% to 102,351 tonnes from 116,024 tonnes a year earlier.
Natural gas sales volumes were down 3.8 PJ to 8.6 PJ from 12.4 PJ in the prior period due to a tight gas market and the loss of a major customer from January 2020.
Working to improve customer experienceOur gas teams have continued to focus on improving our ability to deliver to our customers’ expectations in an environment where ensuring adequate resources has been challenging.
We have also focused this year on streamlining and improving the online ordering process across our range of gas products. We have taken a significant step in this activity with the launch of a new customer portal offering online
Lowering delivery emissions and collaborating on city centre air quality In March 2021 Vector Ongas was proud to announce that it is one of five businesses participating in an electric truck trial with Fuso New Zealand, for its deliveries in Auckland’s city centre.
The area has the highest population density of anywhere in New Zealand and exceeds air quality limits for nitrogen dioxide and particulate matter.
With the trial set to run over FY22, our involvement is an exciting opportunity for Vector to explore how zero-emissions distribution capabilities can help lower our carbon emissions, and gain insights into the impact on electricity demand around Auckland from charging behaviour introduced by these new technologies. Our participation in the trial will also see Vector provide valuable data that will inform future decision-making for improving air quality in Auckland city centre, aligned with Auckland Council’s wider Zero Emissions Area, which is an emissions reduction strategy within the City Centre Masterplan.
VECTOR ANNUAL REPORT 2021 /
20

MeteringOur Metering business has had a strong year. We commend the resilience of our metering teams and acknowledge the support of our customers, in particular those in Australia in the face of continued disruption from Covid-19 resurgences throughout the past twelve months.
responsiveness and added capacity. As a Living Wage accredited employer, we are also proud of the local employment this will generate, in the form of close to 200 roles, through our delivery subcontractors.
Leading the way with advanced gas metersWe have begun the roll-out of advanced gas meters in New Zealand, and are seeing high levels of consumer satisfaction throughout the process. Advanced gas metering provides consumers with access to more data more often about their gas usage, giving them the ability to make more informed energy choices. The advanced gas data service is the first on the New Energy Platform developed under the strategic alliance with AWS.
Maturing and challenging ourselves on safetyWe strive to be leaders in health and safety and are encouraged by feedback from our customers on the strength of our health and safety performance.
We continually look to challenge the way we operate to ensure it is in the safest way possible for our staff and the people around them, and are looking to improve efficiencies for our field staff. To do this, we are placing a higher emphasis on the presence of positive and safe work practices, while recognising that our people are experts at their job, and are therefore part of any solution to safety concerns.
Service development in AustraliaWe have improved our service offering in Australia with the introduction of remote re-energisation and de-energisation services. These services have already enabled innovative consumer products in New Zealand.
Increased revenueMetering revenue increased 10.6% to $227.0 million from $205.2 million a year earlier driven by the increase in our advanced meter fleet.
Growth in installationsIn the year to 30 June 2021 we have installed 33,578 advanced meters in New Zealand and 117,472 additional advanced meters in Australia. Our advanced meter base grew 8.8% to 1.86 million from 1.71 million in the year before. We have now deployed nearly 400,000 advanced meters in Australia and are averaging over 10,000 meter installations per month.
Increased capital investmentTotal metering capex invested increased by 24.0% to $165.3 million with the high level of spend reflecting the continued deployment of advanced meters in Australia, 4G modem replacement programme, roll-out of advanced gas meters, investment in our digital platforms and an increase in stock levels to help mitigate Covid-19 related supply concerns.
Next-generation connectivityThis year we commenced a modem replacement programme. This programme will upgrade approximately 1.1 million meters with 4G modems in advance of the expected shutdown of the 2G mobile network in New Zealand. It is expected to take three years to complete and will enable us to continue to provide services to our customers for a longer period of time. This programme will lay the foundation for future innovation for our retailer customers, through providing an IoT-ready platform with faster speeds, better
Building the New Energy Platform One year into the strategic alliance between Vector and Amazon Web Services, we have made solid progress against our stated aim to create the New Energy Platform.
The first services to be delivered from the New Energy Platform are the advanced gas data services. The platform stores, processes and delivers advanced gas meter data which has been enabled through technology we have built and deployed through this strategic alliance. We are now developing the capability to provide electricity meter data at five-minute intervals for our Australian customers. This is the next step in our data services transformation programme, and will enable us to provide data services to other parties, such as network operators.
The strategic alliance is a multi-year agreement, and one of a handful across the world. It will benefit our energy and utility customers and, ultimately, consumers in New Zealand, Australia, and beyond, through more flexible, efficient and faster processing of data. The alliance has resulted in the creation of 30 new digital roles in New Zealand, shared across the two companies, and all engaged in product development on cutting-edge public cloud computing services.
21
Creating a new energy future – a bold vision

Our climate and sustainability
TASK FORCE FOR CLIMATE-RELATED FINANCIAL DISCLOSUREWe are preparing our first report aligned with the Task Force on Climate-related Financial Disclosure (TCFD). This means the climate-related risks and opportunities we face will be disclosed in a manner which is consistent with others, and which will show how they are incorporated into our risk management and strategic planning processes.
We believe this is important to empower markets to channel investment towards the solutions, opportunities, and business models needed for a new energy future.
We intend to publish our first TCFD report soon.
SUSTAINABLE DEVELOPMENT GOALSThe United Nations’ Sustainable Development Goals (SDGs) provide our business with a global framework, while establishing the issues the world needs to address in order to become more sustainable. Over the past twelve months we have further refined our focus to five priority SDGs that we will actively contribute to in the short term. Each goal can be referenced back to our overarching focus on the challenges of climate change and the transition to a low-carbon economy.
Affordable and Clean EnergyWe are keenly aware that if sustainable solutions are not affordable, inequality is likely to be exacerbated. Within this,
and core to our Symphony strategy, we strongly advocate that decarbonisation cannot just work with more large-scale generation and transmission. Rather customers must be actively informed through demand-side technologies and platforms. We are engaging with customers and stakeholders including regulatory bodies, and policy makers, to share this view and work towards meeting future decarbonisation goals more efficiently.
Our strategic alliance with AWS to build the New Energy Platform (page 21) will benefit our energy and utility customers, and ultimately, consumers, through more efficient and faster processing of data.
Sustainable Cities and Communities
We are proud of the contribution we will make to regenerating Auckland’s tree canopy through our
arrangement with Auckland Council on the Electricity Resilience Targeted Rate. This funds tree planting to compensate for canopy lost due to tree maintenance around power lines.
Recognising our role in enabling the transition to sustainable transport, we have continued our EV Smart Charging trial (page 24) to help keep the decarbonisation of transport as affordable as possible.
Responsible Consumption and Production
As a founding member of the Battery Industry Group we have been involved in creating a battery traceability
platform to prepare the supply chain for an increased uptake of electric vehicles. The proposed product stewardship scheme for large batteries was delivered to the Ministry for the Environment in April 2021.
To extend our responsibility beyond our own actions we have published a Supplier Code of Conduct on our website outlining our sustainability expectations from the suppliers we work with. This covers their social, environmental, and ethical responsibilities. We will be working with suppliers to meet expectations, including collecting more data to help us identify decarbonisation opportunities.
Partnerships for the Goals Our actions around climate and sustainability require collaboration with businesses, government and other
organisations as a key foundation for achieving the SDGs. Vector is a founding member of the Climate Leaders Coalition, a partner of the Sustainable Finance Forum, and member of the Sustainable Business Council, which has underpinned our support for the Paris Agreement and the establishment of the Climate Change Commission. Our participation in these coalitions also signals our commitment to reducing our own carbon emissions to help with New Zealand’s transition to a low-carbon economy.
Vector will continue to develop partnerships within New Zealand and globally to create a new energy future that aligns with the SDGs. One of our more recent examples is our strategic alliance with AWS (page 21).
As we invest in innovation and digital solutions, we are seeking to avoid an inefficient transition to a low-carbon world, which would ultimately lead to higher costs for our customers. We are keenly aware that if sustainable solutions are not affordable, inequality is likely to be exacerbated.
VECTOR ANNUAL REPORT 2021 /
22

CLIMATE ACTION: DECARBONISATION
The transition to a low-carbon economy will require commitment from the whole energy sector. Vector has
included decarbonisation as an intrinsic part of our Symphony strategy, making climate action a priority goal. Identifying areas to decarbonise, both internally and externally, and working on strategies to achieve our targets has been a focus throughout the past year.
Our carbon footprintThis year we sought to gain a more comprehensive understanding of emissions created across our entire value chain. In addition, the divestment of the Kapuni gas treatment plant represented a significant change in emissions. To allow for meaningful and useful comparisons over time we recalculated our emissions for FY20, and reset our base year to the same.
Vector measures its greenhouse gas emissions in alignment with the Greenhouse Gas Protocol. All applicable Scope 3 emissions that are material and accurately quantifiable are reported, along with otherwise relevant Scope 3 emissions.** Some embodied emissions for purchased products were also identified as material, however due to limited embodied emission data availability, are not included in this disclosure. It is our intention to work
alongside our suppliers to increase data availability and report on any other material sources in the future.
In the past year, our carbon footprint (Scopes 1, 2, and 3) reduced by 12%, a reduction of just over 210,000 tonnes of CO2 equivalent (tCO2e). Within Scope 1, this is primarily due to a reduction in gas leaks on our gas network as well as lower diesel consumption for the use of generators on our electricity network. We are continuing to refine our gas loss reduction plan, and investigate methods to reduce back-up diesel combustion. We have also developed a strategy for switching our remaining light combustion vehicles to electric vehicles.
Within Scope 2, electricity line losses have increased, while our company’s own electricity consumption has reduced by 4%.
Our indirect emissions covered in Scope 3 also reduced noticeably.
To a large extent this can be linked to a reduction in sales volumes by Ongas Natural Gas, but also reduced fuel use by our Field Service Providers for network maintenance and a significant reduction in business travel. We are actively investigating renewable options for our natural gas and LPG business.
* Although only divested in March 2020, Kapuni emissions are excluded in the updated FY20 footprint calculation to facilitate future comparisons to FY20 as our base year.
** Scope 3 emission sources include upstream well-to-tank emissions for fossil-gas (Category 1) and fuel (Category 3), fuel consumed by field service providers (Category 1), T&D losses for consumed electricity (Category 3), business travel (Category 6), combustion of sold and distributed fossil-gas (Category 11), and investments with more than 10% share (Category 15, accounting for proportional Scope 1 and 2 emissions).
12%REDUCTION IN OUR CARBON FOOTPRINT IN THE PAST YEAR (SCOPE 1, 2, AND 3)
EMISSION TREND IN tCO2e
YEAR ENDED 30 JUNE FY20* FY21 Change from FY20 baseline
Scope 1 23,669 19,330 -18%
Scope 2 33,439 34,520 +3%
Scope 3** 1,758,042 1,550,748 -12%
SCOPE 1 SCOPE 2
897Electricity Consumption
592SF6
Leakage
2,971Fuel Combustion
145Refrigerant Leakage
2,465Vehicle Fleet
1,082Gas Metering Fugitive Emissions
33,622Electricity Losses
12,074Natural Gas Distribution Fugitive Emissions
FY21 MAJOR SCOPE 1 AND SCOPE 2 EMISSIONS
23
Creating a new energy future – a bold vision

Enabling the electrification of transport Vector is committed to supporting decarbonisation in New Zealand. A substantial increase in electric vehicles is a key part of the country’s decarbonisation plans and we note the announcement of the Clean Car Discount earlier this year. Our role as an enabler of the electrification of transport is a crucial part of our carbon handprint – how we help others reduce their carbon footprint.
Our EV Smart Charging trial in Auckland has shown that smart, dynamic charging, using new digital platforms, enables us to add more EVs into the system while managing the load on the network. This softens demand peaks as more and more people come home at the end of the day and plug their cars in to charge.
This helps us lower the need for capital investment to meet increased peak demand, ensuring we can keep power as affordable and reliable as possible.
With 90% of EV charging happening at the home, this type of innovation will help New Zealand achieve our carbon emission reduction goals and ensure the changes are affordable. We are pleased to see the Climate Change Commission recommending EV smart charging in their final advice to the Government.
Science-based reduction targetEstablishing a robust carbon emissions inventory for our new FY20 base year formed the basis for setting a science-based emissions reduction target, in line with the requirements of the Paris Agreement.
Vector is targeting a reduction of absolute Scope 1 & 2 greenhouse gas (GHG) emissions (excluding electricity line losses) of 53.5% by FY30 from a FY20 base year. The target is aligned with methodology by the Science Based Target initiative, consistent with reductions required to keep global warming to 1.5C, and in line with our earlier commitment to achieve net carbon zero operations by 2030. In FY21 we made a reduction of 18% towards this target.
53.5%OUR SCIENCE-BASED REDUCTION TARGET IN ABSOLUTE SCOPE 1 & 2 GHG EMISSIONS (EXCLUDING ELECTRICITY LINE LOSSES) BY FY30 FROM A FY20 BASE YEAR
DECARBONISATION CONT.
VECTOR ANNUAL REPORT 2021 /
24
Our climate and sustainability

Our carbon handprintWe aim to provide solutions that give our customers the choice and opportunities to help lower their emissions. This is our carbon handprint; using our position as a leading New Zealand energy solutions business to help widen the scope for decarbonisation beyond what is in our own ability to control.
Our work to demonstrate the effectiveness of EV smart charging technology supports efficient investment in the infrastructure required to support an affordable transition to electric vehicles. This helps keep the costs of the transition down for our customers, and in turn helps their ability to choose lower carbon technology.
We provide home heating solutions through our HRV business that enable people to make energy efficient choices, and have installed or serviced over 60,000 products across New Zealand in FY21.
Our Vector Powersmart business provides a range of services relating to commercial-scale solar installations and battery energy storage systems, facilitating business and industry to decarbonise their energy use.
Global carbon challengeTo enable the decarbonisation of 3/4 of global greenhouse gas emissions
WHAT NEW ZEALAND IS TARGETING4
Transportation 20%
Energy Industry 7%
Manufacturing 9%
Other 6%
Electricity & Heat: 5%
‒ Renewable energy use (50% by 2035)
‒ Energy efficiency
Food, Beverage, Paper, and Chemical: 7%
‒ Switching boilers to biomass / electricity
Refining & solid fuel manufac-ture: 2%
Light Vehicle: 16%
‒ Reducing travel demand
‒ Mode shift from light vehicles to public transport, walking and cycling
‒ Vehicle fuel efficiency
‒ Vehicle electrification
Aviation: 1%
Heavy Duty: 2%
By trialling solutions locally
Impacts can be scaled globally
GLOBAL CO2e EMISSION BREAKDOWN1
Industry Waste
Agriculture Energy 75% of global greenhouse gas emissions2
NEW ZEALAND CO2e EMISSION BREAKDOWN3
Agriculture 48%
Energy 42%
Industry Waste
Our local handprintSupporting New Zealand to decarbonise its energy sector
‒ Low-carbon fuels
25
Creating a new energy future – a bold vision
1. Climate Watch, 2018, https://www.climatewatchdata.org/ghg-emissions, accessed July 2021 2. International Energy Agency, Net Zero by 2050, published 20213. Ministry for the Environment, New Zealand’s Greenhouse Gas Inventory 1990 - 2019, published 20214. Ināia tonu nei: a low emission future for Aotearoa, Climate Change Commission 2021

JONATHAN MASONMBA, MA, BA
INDEPENDENT NON-EXECUTIVE DIRECTOR AND CHAIR
―
Appointed on 10 May 2013
Jonathan Mason has extensive commercial experience. He has worked in financial management positions in the oil and gas, chemicals, forest products and dairy industries in New Zealand and the USA for International Paper, ExxonMobil Corporation, Carter Holt Harvey, Cabot Corporation and Fonterra. Jonathan also
has experience as a non-executive director on boards in both New Zealand and the USA and his current directorships include Air New Zealand Limited, Westpac New Zealand Limited and Zespri Group Limited. He is also an Adjunct Professor of Management at the University of Auckland, focusing on finance.
MICHAEL BUCZKOWSKIBE (Electrical), MBA (With Dist)
NON-INDEPENDENT NON-EXECUTIVE DIRECTOR
―
Appointed on 14 November 2018
Michael Buczkowski is an experienced Trustee and Deputy Chairman of Entrust. He was General Manager Operations at Ricoh from 2007 to 2018 and, prior to that, Managing Director of Hirepool and also Director of Owens Industrial (NZX top 40).
His professional experience includes: Consulting Electrical Engineer at Beca, registered Electrical Engineer from 1984 to 2004 as well as international consulting expertise in the energy sector.
ALASTAIR BELL BCom, CA, CMInstD, PMP, JP
NON-INDEPENDENT NON-EXECUTIVE DIRECTOR
―
Appointed on 23 September 2019
Alastair Bell is a chartered accountant, chartered director and qualified member of the Project Management Institute. He has more than 30 years’ experience in the corporate, public and not-for-profit sectors. Alastair balances his professional life between board roles and leading a consultancy specialising in business and infrastructure projects.
He is an elected Trustee of Entrust, chairing the Entrust board’s Communications and Dividend Committee. Formerly, he was Deputy Chair of Foundation North and Chair of its Audit, Finance and Risk Committee. Alastair is also Chair of the Orakei Community Association and a trustee of the Motutapu Restoration Trust.
Our Board
VECTOR ANNUAL REPORT 2021 /
26

TONY CARTERBE (Hons), ME, MPhil
INDEPENDENT NON-EXECUTIVE DIRECTOR
―
Appointed on 1 May 2019
BRUCE TURNERBE (Hons), ME, BCom
INDEPENDENT NON-EXECUTIVE DIRECTOR
―
Appointed on 16 April 2019
Bruce Turner is a highly experienced senior executive with deep experience across the dairy and energy sectors, both in New Zealand and internationally. Working in the energy industry for more than 30 years, Bruce was extensively involved in the development of the energy industries in New Zealand, Singapore and Europe as a member of the dispatch rules working group, the NZEM Rules Committee, the MARIA governance board and the development of industry common quality
standards. He was a member of the Electricity Authority’s Security and Reliability Council and heavily involved in sector reforms. As well as the Vector board, Bruce’s governance experience includes joint venture boards for both Mercury and Fonterra. Bruce is an advisory board member at the University of Colorado’s JP Morgan Center for Commodities, and was a member of the AUT Business School Industry Advisory Board (retired by rotation).
Tony Carter was Managing Director of Foodstuffs New Zealand Ltd for 10 years until he retired in 2010. Tony is currently Chair of Datacom Ltd, My Food Bag Group Ltd and TR Group Ltd, and a director of ANZ Bank New Zealand Ltd.* He was previously Chair of
Air New Zealand Ltd until 2019 and Chair of Fisher & Paykel Healthcare Limited until August 2020. He was made a Companion of the New Zealand Order of Merit in 2020.* Tony is retiring from the board of ANZ Bank
New Zealand Limited in August.
DAME PAULA REBSTOCKBSc (Econ), Dip & MSc (Econ)
INDEPENDENT NON-EXECUTIVE DIRECTOR
―
Appointed on 16 April 2019
Dame Paula Rebstock is a leading Auckland-based economist and company director, who was made a Dame Companion of the New Zealand Order of Merit in 2015. She is Chair of ACC*, NZ Healthcare Investments (Asia Pacific Healthcare Group)*, Kiwi Group Holdings, National Hauora Coalition, Ngāti
Whātua Ōrākei Whai Maia and the New Zealand Defence Force Board and a director of SeaLink Group. Dame Paula is the former Chair of the New Zealand Commerce Commission.* Dame Paula was appointed to the board of NZ
Healthcare Investments in July 2021 and she retires from the board of ACC on 31 July 2021.
27
Creating a new energy future – a bold vision

FIONA MICHELMBA
CHIEF PEOPLE AND CULTURE OFFICER – ON SECONDMENT*
―
Fiona Michel is responsible for people, capability and culture at Vector. She has worked in the technology, banking, insurance and public sectors for over two decades in New Zealand and overseas. Fiona has won awards in New Zealand and Australia for achievement in human resources, leadership, culture transformation and industrial relations. She has a Master of Business Administration from the University of Auckland and is an alumnus of Harvard Business School. Professionally, Fiona is a graduate of the Australian Institute of Company Directors, a Chartered Fellow of the Chartered Institute of Personnel and Development in the United Kingdom and a Fellow Certified Practitioner and Non-Executive Director of the Australian Human Resources Institute.* While Fiona Michel is on secondment Sarah Williams is
responsible for Human Resources and John Rodger is responsible for Health and Safety and Property.
JASON HOLLINGWORTH MCom (Hons), FCA, CMInstD
CHIEF FINANCIAL OFFICER
―
Jason Hollingworth joined Vector as Chief Financial Officer in May 2019. He has over 30 years’ experience in a range of senior corporate finance roles including being CFO of public listed pay television company Sky TV, CFO of telecommunications company TelstraClear, Investment Manager for the diversified investment company Ngai Tahu Holdings, Executive Director at Asian private power development company AsiaPower and a director of corporate advisory firm Southpac Corporation. Jason has a Master of Commerce degree, is a Fellow of the Institute of Chartered Accountants ANZ and a member of the Institute of Directors.
SIMON MACKENZIEGrad DipBS (Dist), DipFin, NZCE
GROUP CHIEF EXECUTIVE
―
Simon Mackenzie is passionate about the power of technology to transform the energy industry and consumers’ lives. As Group Chief Executive, he has expanded and driven Vector’s portfolio of businesses to embrace innovative technologies and strategies to deliver efficient, sustainable energy solutions to consumers.
Simon was appointed Vector’s Group Chief Executive in 2008. His tertiary qualifications include engineering, finance and business studies, and the Advanced Management Programme at the Wharton School, University of Pennsylvania.
Our management team
VECTOR ANNUAL REPORT 2021 /
28

BRENDA TALACEKLLB, MComLaw (Hons)
CHIEF OPERATING OFFICER, METERING AND ONGAS
―Brenda Talacek is Vector’s Chief Operating Officer, Metering and OnGas, responsible for leading Vector Metering in New Zealand and Australia and OnGas (LPG and Natural Gas). Prior to joining Vector, Brenda held commercial and legal leadership positions at Genesis Energy, and was Senior Associate at New Zealand law firm Kensington Swan. Before joining the Group’s executive team, Brenda led Vector’s Gas Trading business and has held senior positions in our Electricity Networks division. Her leadership and commercial focus have helped to deliver strong growth, an excellent record in safety and customer satisfaction.
MARK TONERLLB (Hons), BCom
CHIEF PUBLIC POLICY AND REGULATORY OFFICER
―With over 20 years’ experience across a range of sectors including energy, telecommunications, aviation and technology, Mark Toner has consistently navigated market, regulatory and policy changes across industries in disruption. Responsible for leading the Group’s regulatory, public policy, decarbonisation and data insights functions, he combines strong stakeholder engagement and reputation management expertise with his commercial and legal background to drive Vector’s vision of creating a new energy future. Mark is a past recipient of the New Zealand Prime Minister’s Business Scholarship and in 2018 completed an Advanced Management Programme at MIT in Boston.
SARAH WILLIAMSBA, Cert. Journalism
CHIEF MARKETING AND COMMUNICATIONS OFFICER
―Sarah Williams is responsible for developing and delivering Vector Group’s Marketing and Communications strategy. She is a seasoned executive with 30 years’ experience in communication-related roles at an executive and board level with broad experience in both the corporate and agency environments. Sarah joined Vector from Porter Novelli, a public relations and marketing agency where she held the position of Managing Director. Her experience ranges from crisis management, stakeholder engagement, reputation management, to consumer PR, internal communications, brand management, digital and social. In 2019, Sarah was inducted into the College of Fellows of the Public Relations Institute of New Zealand in recognition of her significant contribution to the industry and high levels of competence.
NIKHIL RAVISHANKAR BSc, BCom (Hons)
CHIEF DIGITAL OFFICER - RESIGNED*
―Nikhil Ravishankar leads Vector’s digital team and is responsible for managing the company’s digital and IT functions. He is charged with harnessing the performance of both existing and emerging disruptive digital technologies to ensure Vector is able to provide reliable, relevant and innovative services, and compete in the modern customer driven energy marketplace. Prior to joining Vector, Nikhil was with Accenture where he held the position of Managing Director for New Zealand operations and also sat on its Global Advisory Council for Telecommunications and Media practice. Prior to his role at Accenture, he was the Head of Technology Strategy for Spark and was part of their group transformation office.* Vector has appointed Shailesh Manga to the role of
Chief Digital Officer, effective 1 August 2021, following the resignation of Nikhil Ravishankar, announced in June 2021.
JOHN RODGER LLB, BA
CHIEF LEGAL AND ASSURANCE OFFICER AND COMPANY SECRETARY
―John Rodger is Vector’s Chief Legal and Assurance Officer and Company Secretary, responsible for legal, corporate governance, business performance, internal audit, risk, compliance, privacy and government relations. He brings a deep experience managing business performance and resilience in the context of fast-moving and rapidly changing environments. John has significant legal and commercial expertise gained from working across a range of sectors including energy, telecommunications and financial services. John joined Vector in 2006 from O2 in the UK and has held legal roles in major corporates and in professional services firms in London, the Cayman Islands and New Zealand.
PETER RYANBE
CHIEF OPERATING OFFICER, ELECTRICITY, GAS AND FIBRE
―Peter Ryan is responsible for the strategic operations of the electricity, gas and fibre network businesses. He has 20 years’ international experience within the telecommunications industry, leading engineering, field and operational teams in the deployment, operations, and maintenance of mobile and fixed networks. Most recently, Peter was the Chief Network Engineering Officer – Network & Service Operations at NBNCo Australia, where he oversaw the highly successful implementation of the broadband network. He brings a wealth of experience in operations management, performance transformation as well as a proven ability working across technical, operational, and commercial strategy to optimise business objectives.
29
Creating a new energy future – a bold vision

Governance report
This section of the annual report is an overview of Vector’s corporate governance framework and contains information regarding corporate governance at Vector, approved by the Board, for the financial year ended 30 June 2021.
Vector’s Board is committed to maintaining high standards of corporate governance, ensuring transparency and fairness, and recognising the interests of our shareholders and other stakeholders.
The Board has an established set of guiding principles that state that the company will:
‒ be a leading commercial enterprise in Australasia with a reputation for delivering results through sound strategy;
‒ have entrepreneurial agility, being the first to identify opportunities and bring them to market;
‒ be a great employer which values knowledge and talent;
‒ strive to ensure that everyone who does work for Vector goes home healthy and safe;
‒ deal fairly and honestly with its customers; and
‒ be a good corporate citizen.
Vector’s governance practices are informed by the NZX Listing Rules (NZX Rules), the NZX Corporate Governance Code (2020) (NZX Code), the Financial Markets Conduct Act 2013 and the Companies Act 1993. Vector’s governance practices are consistent with the principles in the NZX Code, except that Vector has not adopted a formal protocol for responding to takeovers (NZX Code Recommendation 3.6). Because Entrust holds 75.1% of Vector’s shares, it is not practically possible for a takeover offer of Vector to be made by a party other than Entrust.
Vector’s key corporate governance documents, including board and committee charters and policies which are mentioned in this report, can be found at www.vector.co.nz/investors/governance.
Roles and responsibilities of the Board and managementThe primary objective of the Board is to protect and enhance the value of the company in the interests of Vector and its shareholders.
The Board has overall responsibility for all decision-making within Vector.
Vector’s governance practices are designed to:
‒ enable the Board to provide strategic guidance for Vector and effective oversight of management;
‒ clarify the roles and responsibilities of Vector’s directors and senior executives in order to facilitate Board and management accountability to both Vector and our shareholders; and
‒ ensure a balance of authority so that no single individual has unfettered powers.
To ensure that Vector’s business objectives and strategies are achieved and to deliver value to the company and its shareholders, the Board strives to understand, meet and appropriately balance the expectations of all its stakeholders, including its employees, customers and the wider community.
In carrying out its responsibilities and powers, the Board at all times recognises its overriding responsibility to act honestly, fairly, diligently and in accordance with the law. The Board works to promote and maintain an environment within Vector that establishes these principles as basic guidelines for all of its employees and representatives.
Vector achieves Board and management accountability through its Board charter, which sets out (among other things) matters reserved for the Board and responsibilities delegated to the Group Chief Executive, and a formal delegation of authority framework. The effect of this framework is that, while the Board has statutory responsibility for the activities of the company, this is exercised through
VECTOR ANNUAL REPORT 2021 /
30

the delegation to the Group Chief Executive, who is responsible for the day-to-day leadership and management of the company. The framework also reserves certain matters for the decision of the Board.
The Board charter sets out the expectation that all directors continuously educate themselves to ensure that they may appropriately and effectively perform their duties.
The main functions of the Board include:
‒ reviewing and approving the strategic, business and financial plans prepared by management;
‒ monitoring performance against the strategic, business and financial plans;
‒ appointing, delegating to and reviewing the performance of the Group Chief Executive;
‒ approving major investments and divestments;
‒ ensuring ethical behaviour by the company, Board, management and employees; and
‒ assessing its own effectiveness in carrying out its functions.
A committee or individual director may engage separate independent professional advice in certain situations, at the expense of the company, subject to first obtaining the approval of the Chair of the Board.
Each director has a duty to act in the best interests of the company and the directors are aware of their collective and individual responsibilities to stakeholders for the manner in which Vector’s affairs are managed, controlled and operated.
The Board ensures that there is appropriate training available to all directors to enable them to remain current on how best to discharge their responsibilities and keep up-to-date on changes and trends in areas relevant to their work.
The Board regularly assesses its effectiveness in carrying out its functions and responsibilities. The Board Chair
leads the review and evaluation of the Board as a whole, and of the Board Committees, against their respective charters. The Board Chair also engages with individual directors to evaluate and discuss performance and professional development. The next review, which will be externally facilitated, is planned for FY22.
The Group Chief Executive has responsibility for the day-to-day management of Vector and its businesses. He is supported in this function by the Vector executive team. Details of the members of the executive team are set out on pages 28 and 29 of this annual report and in the About Us section of Vector’s website (www.vector.co.nz/about-us/board-executive-team).
Board membershipVector’s Board comprises experienced directors from diverse backgrounds and who lead the company on behalf of its shareholders and other stakeholders. The directors are committed to maintaining high standards of corporate governance, ensuring transparency and fairness and recognising the interests of our stakeholders.
Vector’s Constitution and the NZX Rules set certain requirements in relation to the Board structure. The Board must have a minimum of three and a maximum of nine directors, with at least two being ordinarily resident in New Zealand.
Our Board comprises six directors, all of whom are non-executive. Biographies are set out on pages 26 and 27 of this report and include information on the year of appointment, skills, experience and background of each director. The current directors possess an appropriate mix of skills, expertise and diversity to enable the Board to discharge its responsibilities and deliver the company’s strategic priorities. The Board looks to strengthen its oversight of issues in all disciplines, as required, through expert advice.
Director independenceThe Nominations Committee has responsibility on behalf of the Board for making determinations as to the independence status of all directors. The committee’s assessment of independence is guided by the NZX Rules and the commentary to NZX Code Recommendation 2.4.
The Board has reviewed the position and relationships of all directors in office and considers that four of the non-executive directors are independent. Those directors are Jonathan Mason who is Vector’s Chair, Dame Paula Rebstock who is Deputy Chair, Tony Carter and Bruce Turner. Michael Buczkowski and Alastair Bell represent Vector’s majority shareholder Entrust, and are therefore not independent directors. Directors are required to inform the Board of all relevant information which may affect their independence. The Nominations Committee is responsible for assessing director independence on an ongoing basis.
Only independent directors are eligible to be the Board Chair. The roles of Board Chair, Audit Committee Chair, Risk and Assurance Committee Chair and Group Chief Executive are each held by different people.
Ownership of Vector shares by directors is encouraged but is not a requirement. Directors’ ownership interests are listed on page 105 of the annual report.
The Board does not have a tenure policy. However, it recognises that a regular refreshment programme leads to the introduction of new perspectives, skills, attributes and experience.
Director period of appointment
0-3 years 3-9 years 9 years +
Number of directors 5 1 0
31
Creating a new energy future – a bold vision

Attendance at meetingsAttendance records of Board and committee meetings are provided in the table below.
COMMITTEE FULL BOARD AUDIT COMMITTEE
RISK AND ASSURANCE COMMITTEE
REMUNERATION COMMITTEE
NOMINATIONS COMMITTEE AGM
TOTAL MEETINGS 12 6 7 3 2 1
A Bell 12 6 2† 3 2 1
M Buczkowski 12 4† 7 2 1
A Carter 12 6 2† 3 2 1
J Mason (Chair) 11 6 7 2 2 1
A Paterson* 4 2 3 1 2 1
P Rebstock 10 6 7 3 2 1
B Turner 12 6 7 2 1* Alison Paterson ceased to be a director on 25 September 2020.† Director attending the committee meeting who is not a member of the committee.
Board committeesThere are currently four Board committees: an Audit Committee, a Nominations Committee, a Remuneration Committee and a Risk and Assurance Committee.
Members of each committee are appointed by the Board. Each committee has a written charter that is approved by the Board and sets out its mandate. The charters are reviewed at least every two years, with any proposed changes recommended to the Board for approval. All charters are available on Vector’s website.
The Company Secretary has unfettered access to the Chair of the Board and the Audit Committee.
The members and chairs of each committee are:
COMMITTEE MEMBERS
Audit Committee Paula Rebstock (Chair)Alastair BellTony CarterJonathan Mason Bruce Turner
Nominations Committee Jonathan Mason (Chair)Alastair BellMike BuczkowskiTony CarterPaula Rebstock Bruce Turner
Remuneration Committee Tony Carter (Chair)Alastair BellJonathan Mason Paula Rebstock
Risk and Assurance Committee Bruce Turner (Chair)Michael BuczkowskiJonathan Mason Paula Rebstock
VECTOR ANNUAL REPORT 2021 /
32
Governance report

Nominations CommitteeThe Board is responsible for appointing directors. It seeks diversity in the skills, attributes, perspectives and experience of its members across a broad range of criteria so it represents the diversity of shareholders, business types and regions in which the company operates. The Board has a Nominations Committee, the purpose of which is to assist the Board in fulfilling its responsibility to have an efficient mechanism for examining of the selection and appointment practices of the company.
The Nominations Committee’s responsibilities broadly include management of the appointment process for new directors and the re-election of existing directors and is also responsible for coordinating director appointments with Entrust, consistent with Entrust’s rights under the Vector Constitution. For as long as Entrust holds at least 50.01% of Vector’s shares, the Nominations Committee undertakes consultation with Entrust prior to finalising any Board recommendation regarding a director nomination or appointment.
When considering an appointment, the Nominations Committee will undertake a thorough check of the candidate and his or her background. A director is appointed by ordinary resolution of the shareholders or the Board may fill a casual vacancy. Where the Board determines a person is an appropriate candidate, or has appointed a director as a casual vacancy, shareholders are notified and provided with appropriate information to enable them to vote on whether to elect or re-elect a director.
The Nominations Committee also has responsibility for reviewing the Board’s composition and succession plans to ensure that the company has access to the most appropriate balance of skills, qualifications, experience, perspectives and background to effectively govern the company.
Other responsibilities of the Nominations Committee include recommending procedures for the regular review of
the performance of the Board and committees; making determinations as to the independence status of all directors; and ensuring there is an appropriate induction and education programme and that letters of engagement are in place for new directors.
All new directors enter into a written agreement with Vector, which sets out the terms of their appointment.
The Nominations Committee’s charter requires that the nominations committee shall comprise not less than three members, being directors of Vector, a majority of whom shall be independent directors.
An invitation may be extended to non-committee member directors, the Group Chief Executive and/or management to attend meetings of the committee.
Audit CommitteeThe purpose of the Audit Committee is to assist the Board in its oversight of the quality and integrity of Vector’s external financial reporting, the independence and performance of the external auditors, and the effectiveness of internal control systems for financial reporting and accounting records. The Audit Committee supervises the financial information flow to ensure accuracy and objectivity of financial summaries.
The Audit Committee provides a formal forum for communication between the Board and the external auditors, ensures the independence of the external auditors, has oversight of audit planning, reviews and recommends audit fees, considers audit opinions and evaluates the performance of the external auditors. Oversight of the company’s external audit arrangements to safeguard the integrity of financial reporting is the responsibility of the Audit Committee. Included within the committee’s responsibilities in its charter is the requirement to ensure that audit independence is maintained, both in fact and appearance.
The NZX Rules and the Audit Committee’s charter requires that the
committee must comprise not less than three members, being directors of Vector, at least one of whom must have an adequate accounting or financial background and a majority of whom are acknowledged as independent by the Board pursuant to its charter. The chair shall be an independent director and shall not be the chair of the Board.
All members of the Audit Committee have specialist financial skills and experience.
The Group Chief Executive and the Chief Financial Officer have a standing invitation to attend Audit Committee meetings.
Remuneration CommitteeThe purpose of the Remuneration Committee is to assist the Board in overseeing the appointment, performance and remuneration of the Group Chief Executive and members of the executive team (including succession planning) and reviewing and monitoring the Remuneration Policy. Evaluations are based on criteria that include the performance of Vector and the accomplishment of strategic objectives.
The Remuneration Committee’s charter requires the committee to comprise not less than three members, being directors of Vector, a majority of whom shall be independent directors.
The Group Chief Executive may be invited to attend meetings where the Remuneration Committee thinks this is appropriate.
Risk and Assurance CommitteeThe purpose of the Risk and Assurance Committee is to assist the Board in fulfilling its responsibilities to protect the interests of shareholders, customers, employees and the communities in which Vector operates through establishing a sound risk management framework and rigorous processes for internal control.
The Risk and Assurance Committee charter requires the committee to comprise not less than three members,
33
Creating a new energy future – a bold vision

being directors of Vector. Only Committee members attend Committee meetings unless an invitation is extended to other directors, the Group Chief Executive, management and/or other guests.
External auditorThe role of the external auditor is to audit the financial statements of the company in accordance with applicable auditing standards in New Zealand and to report on its findings to the Board and shareholders of the company.
The effectiveness, performance and independence of the external auditor is reviewed annually by the Audit Committee. The Board, after considering the recommendations of the Audit Committee, considers and reviews the appointment of external auditors. The Board requires the rotation of the audit partner for the statutory audit after no more than five years. The company’s external auditor is KPMG. Graeme Edwards has been the Audit Partner since 2019 and Laura Youdan has been the Assurance Partner since 2018. All services provided by KPMG are considered on a case-by-case basis by the Audit Committee to ensure there is no actual or perceived threat to independence in accordance with the policy. The Audit Partner and Assurance Partner have provided the Audit Committee with written confirmation that, in their view, they were able to operate independently during the year.
KPMG has provided the Board with the required independence declaration for the financial year ended 30 June 2021.
The Audit Committee has determined that there are no matters that have affected the auditor’s independence.
It is the Board’s policy that all non-audit services proposed to be undertaken by the external auditor must be pre-approved by the Audit Committee. The Audit Committee considered and gave its approval for the auditor to undertake certain non-audit related matters. Fees paid to KPMG are included in Note 8 of the notes to the financial statements on page 62 of the annual report.
KPMG was paid $1.2m for audit related services in the financial year to 30 June 2021. KPMG did not provide any non-audit related services. Non-audit work did not exceed 25% of the amount paid for audit work. Further detail is provided on page 62 of this annual report.
The auditor is regularly invited to meet with the Audit Committee including without Management present.
The auditor has been invited to attend the Annual Shareholders’ Meeting and will be available to answer questions about the audit process and the independence of the auditor.
Risk managementAt Vector, we recognise that rigorous risk and opportunity management is essential for corporate stability and performance, and supports us in our
pursuit to create a new energy future. To drive sustainable growth and ensure business resilience, we must anticipate risks to our operations while capitalising on opportunities as they arise.
Vector’s enterprise risk management (ERM) framework provides a flexible and purpose-built approach to the application of risk management across Vector and is consistent with the Australian/New Zealand Risk Management Standard “AS/NZS ISO 31000:2018 Risk management – Principles and Guideline”. Our risk management processes and tools are embedded within our business operations to drive consistent, effective and accountable decision-making.
Consistent with the “Three Lines of Defence” principle, all Vector people are responsible for applying Vector’s ERM framework within their individual roles to proactively identify, analyse, escalate and treat risks. This risk mindset has been implemented through:
‒ awareness of risk management’s value at operational, Executive and Board level;
‒ relatable and easily applied risk management policies, processes and tools;
‒ integration of specialised risk partners throughout the business; and
‒ continuous training and education, both formal and informal.
Our key and emerging risks
Strategic Risks
1 Adverse impacts, government responses, and unexploited opportunities from climate change
2 Failure to adapt to economic, financial, environmental, customer and/or social changes to maximise opportunity and value
3 Uncertain, adverse or underutilised legislative, policy or regulatory settings in all operating jurisdictions
4 Reputational damage / loss of trust & confidence with key stakeholders
5 Electricity network fails to adapt and transition to changing demand, affordability & regulatory policy causing inefficient capital spend and reliability challenges
6 Rapid digitalisation and technology change
7 Funding, liquidity, cashflow and credit risk due to uncertain economic conditions and market risks
Operational Risks
8 Serious harm or fatality event, including mental health & wellbeing
9 Major/repeated disruption of critical services
10 Cyber security compromise
11 External shock event, including natural disaster and response to the Covid-19 pandemic
12 Breach of SAIDI & SAIFI
13 Failure or poor performance of critical third parties (including service providers, suppliers and partnerships)
14 Failure to collect, protect or create value from information
15 Inability to develop, retain and recruit talent
Emerging Risks
16 Gas businesses adversely impacted by changing climate change policy and regulation
VECTOR ANNUAL REPORT 2021 /
34
Governance report

Vector continues to review and mature its ERM to reflect its key and emerging risks. We engage external advisers to assist us to incorporate the latest developments in risk management and to reflect the current operating environment.
The Board is responsible for ensuring that key business and financial risks are identified, and that appropriate controls and procedures are in place to effectively manage those risks. The Risk and Assurance Committee has overall responsibility for ensuring that the company’s risk management framework is appropriate and that it appropriately identifies, considers and manages risks.
To support the identification of emerging risks and opportunities, Group Risk monitors the changing business landscape, assessing the influence of macro-economic trends on Vector’s operating environment. These perspectives, along with the material risks from the individual business unit risk profiles, inform the development of the Group Key Risk Profile which provides both the Board and Executive team with a consolidated view of:
1. the strategically focused risks which could have a significant impact on the long term value and sustainability of Vector’s business;
2. the material operational risks facing Vector as part of its business as usual activities which require significant oversight and control; and
3. emerging risks acknowledged as having the potential to increase in materiality over time.
Health and SafetyVector is committed to ensuring that it has best-practice health and safety practices. Our commitments and requirements for health and safety are set out in the Health and Safety Policy. Vector will conduct its business activities in such a way as to protect the health and safety of all workers of Vector and its related companies, the public and visitors in its work environment. We are committed to continual and progressive improvement in its health
and safety performance. Page 14 of the annual report contains Vector’s performance in these areas, including its Total Recordable Injury Frequency Rate (TRIFR) and Lost Time Injury Frequency Rate (LTIFR).
The Board has delegated day-to-day responsibility for the implementation of health and safety standards and practices to management. The Board is committed to providing effective resources and systems at all levels of the organisation to fulfil its commitment to employees, customers, shareholders and stakeholders.
Internal auditVector’s internal audit function is overseen by the Risk and Assurance Committee and provides independent and objective assurance on the effectiveness of governance, risk management and internal controls across all business operations. The team follows a co-sourced model, drawing on both in-house and external expertise, and has unrestricted access to all Vector staff, records and third parties. The team liaises closely with KPMG, as Vector’s external auditor, to share the outcomes of the internal audit programme to the extent that they are relevant to the financial statements.
Ethical and responsible behaviourDirectors and employees are expected to act legally, ethically, responsibly and with integrity in a manner consistent with Vector’s policies, procedures and values.
The Code of Conduct and Ethics covers a wide range of areas and provides guidance regarding personal integrity, business integrity, customers and society, people, and assets and information. It outlines the responsibilities of Vector’s people and explains the standards of conduct and ethics.
At Vector our vision and values are the foundation of our business; they reflect who we are and how we do business. Together as a team, as well as with
our customers, partners and the wider community, each and every one of us has an important role to play in bringing our values to life.
The purpose of our Code is to provide a framework for ethical decision-making. However, the Code is not a substitute for good judgement. As Vector employees, we strive to carry out our work in accordance with our values, and this Code should be used as a practical set of guiding principles to help us make decisions in our daily jobs.
The procedure for advising the company of a suspected breach is set out in the Whistleblower Policy. People at Vector have a range of options to speak up if they notice something that’s not right, including raising a concern with a relevant manager. These options include in person, by phone, email, post, online form and all options can be done anonymously.
A comprehensive set of policies has been put in place to assist directors, staff and contractors to act and make decisions in an ethical and responsible manner.
The Board has implemented formal procedures to handle trading in Vector’s securities by directors and employees of Vector in the Insider Trading Policy, with approval from the Chair and the Company Secretary being required before trading can occur. The fundamental rule in the policy is that trading with insider information is prohibited at all times. The requirements of the policy are separate from, and in addition to, the legal prohibitions on insider trading in New Zealand.
The policy provides that shares may not be traded at any time by any individual holding “material information” (as defined in the NZX Rules). A blackout period is imposed for all directors, senior officers and certain other people between the day before the end of the half-year and full-year balance dates and the day after the release to NZX of the result for that period.
35
Creating a new energy future – a bold vision

Diversity and inclusionThe Board’s commitment to creating and maintaining both a diverse workforce and an inclusive workplace for all employees is reflected in the Diversity and Inclusion Policy. A Diversity Council, made up of senior management representatives, provides governance over the implementation of the policy. The Diversity Council also provides guidance and direction in relation to the activity of the Diversity Committee, which consists of employee representatives from across the business.
The Board is satisfied with the initiatives being implemented by the Group and its performance with respect to the Inclusion and Diversity Policy.
Vector is committed to:
‒ adding to, nurturing and developing the collective relevant skills, and diverse experience and attributes of Vector’s people;
‒ ensuring that Vector’s culture and management systems are aligned with and promote the attainment of diversity and inclusion;
‒ providing an environment in which all people are treated with fairness and respect, and have equal opportunities available at work; and
‒ being recognised as an organisation that exemplifies diversity and inclusion in action.
Vector recruits, promotes and compensates based on merit, regardless of gender, gender identity, ethnicity, disability, religion, age, nationality, sexual orientation, or socio-economic background.
It is a company policy that people in the workplace are treated with respect in accordance with the company’s philosophies of equal employment opportunities, and anti- harassment and discrimination policies.
Vector’s workforce is made up of many individuals with diverse skills, values, backgrounds and experiences. We respect and value the benefit of this diversity.
“Diversity” at Vector refers to all characteristics that make individuals different from each other, including gender, gender identity, ethnicity, disability, age, sexual orientation, religion and socio-economic background.
“Inclusion” at Vector means providing a work environment where everyone feels comfortable to bring themselves to work, where they have an opportunity to fully participate in achieving our business objectives and where each person is valued for their unique perspectives, skills and experiences.
Responsibility for workplace diversity and the setting of measurable objectives for approval by the Board is held by management on behalf of the Board.
Gender statistics:Vector’s gender statistics are as follows:
AS AT 30 JUNE 2021 AS AT 30 JUNE 2020
Position Female Male Diverse Female Male Diverse
Directors 1 (17%) 5 (83%) 2 (29%) 5 (71%)
Executive team 2* (25%) 6 (75%) 4 (44%) 5 (56%)
Direct reports to the executive team 19 (34%) 37 (66%) 18 (35%) 34 (65%)
Across the Vector group 451 (36%) 816 (64%) 1 (0.1%) 431 (35%) 797 (65%) 1 (0.1%)
REMUNERATIONVector’s goal is to provide a fair, reasonable and competitive remuneration for its directors. This will ensure we can attract and retain high-calibre directors who have the skills, experience and knowledge to increase entity value, to the benefit of all shareholders.
Vector’s directors do not participate in an executive remuneration or share scheme. Directors do not receive any options, bonus payments or incentive-based remuneration. The company does not have a scheme for retirement benefits to be given to directors.
The Remuneration Committee is responsible for reviewing or the review of directors’ remuneration and, from time to time, making recommendations in relation to the level of fees in accordance with the Remuneration Policy.
Directors’ fees were last approved by shareholders at the 2013 annual shareholders’ meeting. Directors receive a single fee for membership of the Board and committees. All Directors are also entitled to be reimbursed for costs associated with carrying out their duties. Fees payable to Vector’s directors for the 2021 financial year were as follows:
DIRECTOR FEE ($)
J Mason 176,138
A Bell 100,650
M Buczkowski 100,650
A Carter 100,650
A Paterson 50,325
P Rebstock 100,650
B Turner 100,650
* Fiona Michel is currently on secondment.
VECTOR ANNUAL REPORT 2021 /
36
Governance report

Remuneration frameworkVector’s remuneration framework is designed to attract and retain high-performing individuals, to support the delivery of the company’s strategy and vision, and reward our people appropriately and competitively. The Remuneration Committee assists the Board in overseeing the Remuneration Policy.
Vector’s Remuneration Policy is that of a total remuneration framework which comprises fixed remuneration, plus an at-risk component in the form of a Short-Term Incentive (STI). STI is a variable element of remuneration and is only paid, at the Board’s discretion, if financial and health and safety gates are met, and company performance goals have been achieved. From FY22, the STI will only apply to executive team members and their direct reports. Employees who were previously eligible for STI have received an adjustment to their fixed remuneration based on historic STI performance.
Vector has not provided any joining bonus to Executives in the last financial year. Vector does not provide “termination payments” to outgoing Executives, nor does it provide retirement payments at greater rates for Executives than other staff (if any at all).
Fixed remunerationFixed remuneration is reviewed annually based on data from independent remuneration specialists. Employees’ fixed remuneration is based on a matrix of their own performance and their current position in their salary band
when compared with Vector’s internal role bands and the market.
Short-Term IncentivePrior to any STI payment being available to eligible employees the conditional gateway goals (Health and Safety – no fatalities; Financial – achieving at least 95% of budget) must be met.
The STI Scheme for FY21 recognises Group and business unit-level achievement of financial, customer, operational, health and safety and sustainability performance outcomes within the at-risk component of employees’ remuneration. The STI Scheme does not reward individual performance.
The at-risk percentage of fixed remuneration for the FY21 STI Scheme ranges from 5% to 50% of base salary depending on the complexity of the role.
Company performance goals are set and reviewed annually by the Board to align with business and financial objectives. The percentage split applicable to performance goals can vary by business unit. For this financial year, Vector’s group goals were:
‒ 40% Financial;
‒ 40% Customer;
‒ 10% Health and Safety; and
‒ 10% Decarbonisation.
Customer goals include measures of customer satisfaction, as well as operational performance such as electricity network standards as set by the Commerce Commission (SAIDI/SAIFI), gas response to emergency and
the achievement of customer service level agreements.
STI payments are determined following a review of company performance and paid out at between 0% and 100% for the Group Chief Executive, executive leadership team, and all eligible employees. Performance against the at-risk STI element is capped at 100%.
As an example of how STI is calculated, an employee with fixed remuneration of $80,000 and an STI element of 10% may receive between $0 and $8,000 (0% to 100% of their STI) depending, at the Board’s discretion, on the level of company performance once the gateways have been achieved.
STI Scheme payments relating to the financial year ended 30 June 2021 are delivered as a taxable cash payment and are payable on completion of the annual audited financial statements. Payments relating to the 2021 financial year are therefore paid in the 2022 financial year.
Group Chief Executive remunerationThe Board rewards the Group Chief Executive with fixed remuneration and an at-risk component in the form of a Short-Term Incentive. There are no long-term incentive or any share option schemes available at Vector.
The Group Chief Executive’s fixed remuneration is reviewed periodically by the Board, by external remuneration specialists using relevant market peer benchmarks, as is the case with the executive leadership team and all senior leadership roles.
The Group Chief Executive’s STI and fixed remuneration are set out below.
GROUP CHIEF EXECUTIVE REMUNERATION
FIXED REMUNERATION AT-RISK REMUNERATIONTOTAL
REMUNERATION
SALARY BENEFITS SUBTOTAL STI SUBTOTAL
FY21 $1,430,550.00 – $1,430,550.00 * $1,430,550.00
FY20 $1,402,500.00 – $1,402,500.00 $481,758.75 $1,884,258.75* STI will be paid September 2021 for FY21.
DESCRIPTION OF THE GROUP CHIEF EXECUTIVE STI SCHEME FOR PERFORMANCE PERIOD ENDING 30 JUNE 2021
Scheme Description Performance Measures Percentage of Maximum Awarded
STI Set to a maximum of 50% of fixed remuneration for FY21 on-plan performance where the highest levels of company performance measures are achieved.
Company Performance measures: 40% Financial40% Customer10% Health & Safety10% Decarbonisation
If met, will be paid in September 2021.
37
Creating a new energy future – a bold vision

Investor engagementVector recognises the rights of shareholders as the owners of the company and encourages their ongoing active interest in the company’s affairs by:
‒ communicating with them effectively;
‒ ensuring they have full access to information about the company, including through the Vector website;
‒ conducting shareholder meetings in locations and at times convenient to the majority of shareholders, where possible; and
‒ providing shareholders with adequate opportunity to ask questions about, and comment upon, relevant matters, and to question directly the external auditors at shareholder meetings.
Vector’s Board is committed to maintaining open and transparent communications with investors and other stakeholders and it supports a programme for two-way engagement with shareholders, debt investors, the media and the broader investment community.
Annual and interim reports, NZX releases, quarterly reports on operational performance, governance policies and charters and a wide variety of corporate information are posted on our website. Vector conducts detailed market briefings in conjunction with the release of the annual and interim financial results. Transcripts of the briefings are available at the annual reports page of the Investor section of the website.
Each shareholder is entitled to receive a hard copy of each annual and interim report.
We have a Shareholder Meetings page in the Investors section on our website where documents relating to meetings are available.
Vector’s Constitution includes provisions relating to Entrust, Vector’s majority shareholder. In addition, Vector and Entrust are parties to a Deed Recording Essential Operating Requirements, which includes certain policy, consultation, pricing reporting and the energy solutions programme obligations.
The Board is committed to reporting Vector’s financial and non-financial information in an objective, balanced, and clear manner. The Board takes an active role in overseeing financial and non-financial reporting. The annual report is an important document for communicating financial reporting and also reports on strategic progress and operational performance. It contains the financial statements that are prepared to comply with generally accepted accounting practice. The Board contributes to and reviews the annual report.
A series of key performance indicators is used to link results to strategy. Vector is committed to transparent reporting of non-financial objectives, such as environmental, social, and governance factors.
Shareholders may raise relevant matters for discussion at the Annual Shareholders’ Meeting either in person or by emailing the company with a question to be asked. Shareholders can also contact the company to ask questions, or express views, about matters affecting Vector. A dedicated email address is available for shareholder/investor queries, which is: [email protected]. Contact details for Vector’s head office are available on the website and at page 106 of the annual report. Vector is committed to complying with its obligations under the NZX Rules and the Companies Act 1993, both of which contain specific requirements to obtain shareholder approval for certain significant matters affecting Vector. Where voting on a matter is required, the Board encourages investors to attend the meeting or to send in a proxy vote. Notices of meeting are usually available at least 20 working days prior to the meeting on the Shareholder Meetings page in the Investors section of the website.
Continuous disclosureThe Board is committed to the provision of accurate, timely, orderly, consistent and credible disclosure and compliance with the continuous disclosure requirements of the Financial Markets Conduct Act 2013 and the NZX Rules. The
Board supports the principle that high standards of reporting and disclosure are essential for proper accountability between the company and its investors, employees and stakeholders.
It achieves these commitments, and the promotion of investor confidence, by ensuring that trading in its shares takes place in an efficient, competitive and informed market. Vector’s Continuous Disclosure Policy, Shareholder Relations Policy and Stakeholder Relations Policy set out protocols to facilitate effective and compliant disclosure.
The accountabilities of individual directors and employees are documented in the Continuous Disclosure Policy. Vector has also established procedures to follow if potential material information is raised by an employee or a director and a management disclosure committee which meets regularly to discuss continuous disclosure matters.
Significant market announcements, including the preliminary announcement of the half-year and full-year results, the financial statements for those periods, and any advice of a change in earnings forecast are approved by the Board. The Chair will consult with directors on any other matters for which the issue or form of the disclosure is determined by the Chair to be a matter for the Board.
VECTOR ANNUAL REPORT 2021 /
38
Governance report

Entrust, majority shareholder of Vector
Consumer trust Entrust was formed more than 25 years ago to ensure that stewardship over Auckland’s electricity network remains in the hands of Aucklanders. Entrust acts in the interests of its 340,500 families and businesses in Auckland, Manukau, northern Papakura and eastern Franklin. Entrust protects the $3 billion investment in Vector through its role in the appointment of directors to Vector’s Board.
Enabling projects with direct benefit Entrust has an agreement with Vector that requires an average of $10.5 million to be invested in projects in the Entrust District every year.
In the year to 30 June 2021, key undergrounding projects have been undertaken in Mt Albert, Powell Street & Himikera Ave (Avondale), Ngahue Drive (Stonefields), Bella Vista Road (Herne Bay), Laings Road & Bucklands Beach Road (Bucklands Beach), and Pacific Parade (Surfdale).
KAREN SHERRY PAUL HUTCHISON
MICHAEL BUCZKOWSKI (DEPUTY CHAIR)WILLIAM CAIRNS (CHAIR)
ALASTAIR BELL
Here for the community Entrust is proud of the work it has undertaken for its beneficiaries and all Aucklanders.
Passing on a share of Vector’s profits to beneficiaries Vector’s growth and operating performance enables Entrust to distribute an annual dividend to beneficiaries through its 75.1% stake in Vector.
Advocacy on behalf of energy consumers Entrust regularly advocates on behalf of energy consumers on important matters such as the Climate Change Commission’s advice on initiatives to reduce greenhouse gas emissions, and other regulatory matters
IN SEPTEMBER 2020, EACH OF ENTRUST’S 340,500 BENEFICIARIES RECEIVED A $280 DIVIDEND – THAT’S MORE THAN $95 MILLION GOING STRAIGHT INTO THE AUCKLAND ECONOMY.
MORE THAN 233 UNDERGROUNDING PROJECTS HAVE BEEN COMPLETED SINCE THE PROGRAMME BEGAN, IN AUCKLAND, MANUKAU AND NORTHERN PAPAKURA.
39
Creating a new energy future – a bold vision

Vector has investments in a number of businesses that complement our network businesses and strengthen our capabilities in the energy services field.
50%
TREESCAPE
Vector holds a 50% shareholding in Tree Scape Limited, one of Australasia’s largest specialist tree and vegetation management companies, with depots throughout New Zealand and in Queensland and New South Wales. Treescape employs more than 600 staff. Its customers include councils, utilities, government agencies, construction companies and developers. Treescape implements Vector’s planned vegetation management programme, which plays a major role in minimising the impact of severe weather on Vector’s electricity network.
On 10 July 2021, Vector and the other shareholders of Tree Scape Limited agreed the conditional sale of all of the shares of the company. Subject to the conditions being satisfied, the sale is anticipated to complete by the end of August 2021.
www.treescape.co.nz
60.25%
LIQUIGAS
NGC Holdings Limited (a wholly owned subsidiary of Vector) holds a 60.25% shareholding in Liquigas Limited, New Zealand’s leading company for tolling, storage and distribution of bulk LPG. Liquigas has staff and depots in Auckland, New Plymouth, Christchurch and Dunedin.
www.liquigas.co.nz
8.1%
mPREST
Vector holds a 8.1% shareholding in mPrest Systems (2003) Limited. The mPrest technology allows companies to better monitor, analyse, and control energy networks and connect traditional infrastructure like electricity lines and substations with new technology like solar and battery energy solutions.
www.mprest.com
Joint ventures and investments
VECTOR ANNUAL REPORT 2021 /
40

YEAR ENDED 30 JUNE 2021 2020
ELECTRICITY
Customers1, 5 590,799 580,060
New connections 14,995 12,231
Net movement in customers2 10,739 8,935
Volume distributed (GWh) 8,325 8,315
Network length (km)1 19,168 18,999
SAIDI (minutes)3, 4
Normal operations unplanned 86.3 116.7
Normal operations planned 46.5 50.8
Major network events 0.0 3.4
Total 132.8 170.9
GAS DISTRIBUTION
Customers1, 5 116,472 113,960
New connections 3,844 3,201
Net movement in customers2 2,512 2,318
Volume distributed (PJ) 14.1 14.3
GAS TRADING
Natural gas sales (PJ)6 8.6 12.4
Gas liquid sales (tonnes)7 45,043 43,338
9kg LPG bottles swapped8 680,099 701,923
Liquigas LPG tolling (tonnes)9 102,351 116,024
TECHNOLOGY
Electricity: advanced meters1, 10 1,864,724 1,713,674
Electricity: legacy meters1 61,831 69,527
Electricity: prepay meters1 15 28
Electricity: time-of-use meters1 12,671 12,556
Gas: advanced meters1 596 0
Gas: legacy meters1 234,279 230,862
Data Management and service connections1 8,359 8,472
1. As at 30 June.2. Net number of customers added during the period, includes disconnected,
reconnected and decommissioned ICPs. 3. SAIDI minutes for the regulatory year - 12 months ended 31 March (audited). 4. SAIDI in relation to normal operations and major network events has been updated
in accordance with the DPP3 regulatory guidelines.5. Billable ICPs.6. Excludes gas sold as gas liquids. 7. The group completed the sale of its interests in the Kapuni Gas Treatment Plant
(KGTP) and co-generation facility on 31 March 2020. As a result, we have changed the
methodology of calculating liquids volumes to reflect continuing activities only. LPG volumes include LPG sold by the OnGas business. LPG and Natural Gasoline sold by KGTP is now excluded. Comparatives have been restated to reflect this.
8. Number of 9kg LPG bottles swapped and sold during the year.9. The group has revised the methodology for Liquigas LPG tolling to reflect new
contractual terms and calculates product tolling domestic and exports. Product further tolled in South Island has been removed.
10. The number of advanced meters as at 30 June 2021 includes 177,397 meters managed but not owned by Vector (30 June 2020: 168,793).
Operating statistics
41
Creating a new energy future – a bold vision

YEAR ENDED 30 JUNE ($ MILLION) 2021 2020 2019 2018 2017
PROFIT OR LOSS
Revenue 1,279.3 1,294.0 1,318.6 1,328.4 1,226.7
Adjusted EBITDA1 513.5 490.0 485.8 470.1 474.4
Depreciation and amortisation (270.1) (262.8) (246.8) (225.9) (199.6)
Adjusted EBIT 243.4 227.2 239.0 244.2 274.8
Net profit 194.6 97.3 84.0 149.8 168.9
BALANCE SHEET
Total equity 2,335.4 2,259.7 2,349.4 2,457.9 2,448.3
Total assets 6,519.5 6,380.9 6,061.0 5,808.0 5,574.6
Economic net debt (borrowings net of cash and short-term deposits) 3,073.2 2,882.3 2,627.5 2,377.8 2,220.1
CASH FLOW
Operating cash flow 499.1 397.3 348.1 389.9 335.7
Capital expenditure (516.2) (476.4) (418.4) (386.8) (354.3)
Dividends paid (165.8) (167.0) (164.1) (163.9) (161.0)
KEY FINANCIAL MEASURES
Adjusted EBITDA/revenue 40.1% 37.9% 36.8% 35.4% 38.7%
Adjusted EBIT/revenue 19.0% 17.6% 18.1% 18.4% 22.4%
Equity/total assets 35.8% 35.4% 38.8% 42.3% 43.9%
Return on assets (adjusted EBITDA/assets) 7.9% 7.7% 8.0% 8.1% 8.5%
Gearing2 56.5% 55.2% 52.2% 48.8% 47.1%
Net interest cover (adjusted EBIT/net interest costs) (times) 2.2 1.8 1.8 1.8 2.0
Earnings (NPAT) per share (cents) 19.3 9.5 8.3 14.8 16.7
Dividends declared, cents per share 16.75 16.50 16.50 16.25 16.00
1. Refer to Non-GAAP reconciliation on page 44.2. Gearing is defined as economic net debt to economic net debt plus adjusted equity. Adjusted equity means total equity adjusted for hedge reserves.
Five year financial performance
VECTOR ANNUAL REPORT 2021 /
42

REGULATED NETWORKS GAS TRADING
METERING CORPORATE AND OTHER
INTER-SEGMENT
REVENUE$ MILLION
1,318.6 1,294.0 1,279.3 1,328.4
1,226.7
FY17 FY18 FY19 FY20 FY21-100
150
400
650
900
1150
1400
ADJUSTED EBITDA$ MILLION
470.1 485.8 490.0 513.5
0
100
-100
200
300
400
500
600
700
474.4
FY21FY20FY19FY18FY17
REGULATED NETWORKS
GAS TRADING
METERING
CORPORATE AND OTHER
TOTAL GROUP
NET PROFIT$ MILLION
0
50
100
150
200
FY21FY20FY19FY18FY17
84.03
97.34
149.82
194.6
168.91
1. FY17 includes a $15.0 million gain from a tax dispute settlement.
2. FY18 includes a $16.7 million one-off tax gain.
3. FY19 includes a $46.6 million non-cash impairment.
4. FY20 includes a $32.0 million non-cash impairment.
43
Creating a new energy future – a bold vision
OPERATING CASH FLOWS$ MILLION
0
50
100
150
200
250
300
350
400
450
500
550
FY21FY20FY19FY18FY17
348.1
397.3
499.1
389.9
335.7
43.5%
56.5%
FY21FY20
55.2%44.8%
7.2%
31.2%
2.1%
59.5%
FY21FY206.1%
64.9%
1.7%
27.3%
CAPITAL EXPENDITURE
REGULATED NETWORKS GAS TRADING
METERING CORPORATE AND OTHER ECONOMIC NET DEBT ADJUSTED EQUITY
SOURCE OF FUNDING – GEARINGAS AT 30 JUNE

Vector’s standard profit measure prepared under New Zealand Generally Accepted Accounting Practice (GAAP) is net profit. Vector has used non-GAAP profit measures when discussing financial performance in this document. The directors and management believe that these measures provide useful information as they are used internally to evaluate the performance of business units, to establish operational goals and to allocate resources. For a more comprehensive discussion on the use of non-GAAP profit measures, please refer to the policy ‘Reporting non-
2021 2020
YEAR ENDED 30 JUNE ($ MILLION)
Segment adjusted EBITDA REPORTED
SEGMENT EBITDA
LESS CAPITAL CONTRIBUTIONS
AND OTHER MOVEMENTS
SEGMENT ADJUSTED
EBITDA
REPORTED SEGMENT
EBITDA
LESS CAPITAL CONTRIBUTIONS
AND OTHER MOVEMENTS
SEGMENT ADJUSTED
EBITDA
Metering 171.6 – 171.6 154.8 – 154.8
Gas Trading 27.4 – 27.4 33.9 – 33.9
Unregulated segments 199.0 – 199.0 188.7 – 188.7
Regulated segment 471.8 (121.1) 350.7 423.3 (85.7) 337.6
Corporate and other (36.5) 0.3 (36.2) (38.2) 1.9 (36.3)
TOTAL 634.3 (120.8) 513.5 573.8 (83.8) 490.0
GAAP To Non-GAAP Reconciliation
YEAR ENDED 30 JUNE ($ MILLION)
Group EBITDA and adjusted EBITDA 2021 2020
Reported net profit for the period (GAAP) 194.6 97.3
Add back: net interest costs 108.6 126.5
Add back: tax (benefit)/expense 61.0 55.2
Add back: depreciation and amortisation 270.1 262.8
Add back: impairment – 32.0
EBITDA 634.3 573.8
Adjusted for:
Associates (share of net (profit)/loss) (1.8) (0.3)
Capital contributions (122.5) (86.4)
Fair value change on financial instruments 3.5 3.4
Gain on sale of Kapuni gas interests – (0.5)
Adjusted EBITDA 513.5 490.0
GAAP profit measures’ available on our website (vector.co.nz).
Non-GAAP profit measures are not prepared in accordance with New Zealand International Reporting Standards (NZ IFRS) and are not uniformly defined; therefore, the non-GAAP profit measures reported in this document may not be comparable with those that other companies report and should not be viewed in isolation from or considered as a substitute for measures reported by Vector in accordance with NZ IFRS.
Non-GAAP financial information
Definitions:EBITDA
Earnings before interest, taxation, depreciation, amortisation and impairments from continuing operations
Adjusted EBITDA
EBITDA from continuing operations adjusted for fair value changes, associates, third-party contributions, and significant one-off gains, losses, revenues and/or expenses.
VECTOR ANNUAL REPORT 2021 /
44

Creating a new energy future – a bold vision
45
Financials

2021 FINANCIAL STATEMENTS
These financial statements for the year ended 30 June 2021 are dated 23 August 2021, and signed for and on behalf of Vector Limited by:
Director 23 August 2021
Director 23 August 2021
And management of Vector Limited by:
Group Chief Executive 23 August 2021
Chief Financial Officer 23 August 2021
Financial Statements
CONTENTS
Financial Statements
Profit or Loss 47
Other Comprehensive Income 48
Balance Sheet 49
Cash Flows 50
Changes in Equity 51
Notes to the Financial Statements 52
Independent Auditor’s Report 90
VECTOR ANNUAL REPORT 2021 /
46
Financial Statements
Financial Statements

Profit or lossfor the year ended 30 June
NOTE2021
$M2020
$M
Revenue 7 1,279.3 1,294.0
Operating expenses 8 (643.3) (717.6)
Depreciation and amortisation (270.1) (262.8)
Interest costs (net) 9 (108.6) (126.5)
Impairment 11 – (32.0)
Associates (share of net profit/(loss)) 6 1.8 0.3
Fair value change on financial instruments 21.2 (3.5) (3.4)
Gain on sale of Kapuni gas interests – 0.5
Profit/(loss) before income tax 255.6 152.5
Income tax benefit/(expense) 15 (61.0) (55.2)
Net profit/(loss) for the period 194.6 97.3
Net profit/(loss) for the period attributable to
Non-controlling interests 1.4 1.9
Owners of the parent 193.2 95.4
Basic and diluted earnings per share (cents) 24.3 19.3 9.5
47
Creating a new energy future – a bold vision

NOTE2021
$M2020
$M
Net profit/(loss) for the period 194.6 97.3
Other comprehensive income net of tax
Items that may be re-classified subsequently to profit or loss:
Net change in fair value of hedge reserves 21.3 46.9 (20.6)
Translation of foreign operations 0.8 3.5
Share of other comprehensive income of associate 6 0.1 (0.1)
Items that will not be re-classified to profit or loss:
Fair value change on investment 14.1 (0.5) (2.8)
Other comprehensive income for the period net of tax 47.3 (20.0)
Total comprehensive income for the period net of tax 241.9 77.3
Total comprehensive income for the period attributable to
Non-controlling interests 1.4 1.9
Owners of the parent 240.5 75.4
Other Comprehensive Income for the year ended 30 June
VECTOR ANNUAL REPORT 2021 /
48
Financial Statements

NOTE2021
$M2020
$M
CURRENT ASSETS
Cash and cash equivalents 17.4 28.3
Trade and other receivables 10 83.2 88.6
Contract assets 105.5 92.7
Derivatives 21 38.0 –
Inventories 12.4 9.4
Contingent consideration 5 8.2 5.2
Intangible assets 2.0 2.4
Income tax 15 28.7 33.7
Investment classified as held for sale 6 12.2 –
Total current assets 307.6 260.3
NON-CURRENT ASSETS
Receivables 10 1.7 1.7
Derivatives 21 65.3 220.4
Contingent consideration 5 73.5 79.5
Investment in associate 6 – 8.9
Investment in private equity 14.1 12.3 12.8
Intangible assets 11 1,292.3 1,283.4
Property, plant and equipment (PPE) 12 4,625.8 4,367.7
Right of use assets (ROU) 13.1 36.1 35.8
Income tax 15 102.8 110.0
Deferred tax 16 2.1 0.4
Total non-current assets 6,211.9 6,120.6
Total assets 6,519.5 6,380.9
CURRENT LIABILITIES
Trade and other payables 17 221.7 200.8
Provisions 18 21.3 27.8
Borrowings 20 232.3 374.7
Derivatives 21 0.9 9.5
Contract liabilities 65.0 53.4
Lease liabilities 13.2 8.4 8.2
Income tax 1.8 0.1
Total current liabilities 551.4 674.5
NON-CURRENT LIABILITIES
Provisions 18 8.7 7.8
Borrowings 20 2,838.3 2,760.9
Derivatives 21 164.7 95.4
Contract liabilities 30.2 38.6
Lease liabilities 13.2 29.0 29.6
Deferred tax 16 561.8 514.4
Total non-current liabilities 3,632.7 3,446.7
Total liabilities 4,184.1 4,121.2
EQUITY
Equity attributable to owners of the parent 2,319.7 2,242.8
Non-controlling interests in subsidiaries 15.7 16.9
Total equity 2,335.4 2,259.7
Total equity and liabilities 6,519.5 6,380.9
Net tangible assets per share (cents) 24.3 102.5 95.7
Gearing ratio (%) 24.3 56.5 55.2
Balance Sheetas at 30 June
49
Creating a new energy future – a bold vision

NOTE2021
$M2020
$M
CASH FLOWS FROM OPERATING ACTIVITIES
Receipts from customers 1,268.9 1,312.9
Interest received 2.9 2.0
Payments to suppliers and employees (626.3) (717.2)
Interest paid (125.3) (134.0)
Income tax paid (21.1) (66.4)
Net cash flows from/(used in) operating activities 23.1 499.1 397.3
CASH FLOWS FROM INVESTING ACTIVITIES
Proceeds from sale of PPE and software intangibles 0.2 0.5
Purchase and construction of PPE (474.9) (436.7)
Purchase and development of software intangibles (41.3) (39.7)
Proceeds from contingent consideration 4.4 –
Other investments 0.2 (0.3)
Net cash flows from/(used in) investing activities (511.4) (476.2)
CASH FLOWS FROM FINANCING ACTIVITIES
Proceeds from borrowings 3 530.0 797.1
Repayment of borrowings 3 (350.0) (541.6)
Dividends paid 3 (165.8) (167.0)
Lease liabilities payments (11.0) (8.9)
Redemption of preference shares from non-controlling interests 3 (1.8) –
Net cash flows from/(used in) financing activities 23.2 1.4 79.6
Net increase/(decrease) in cash and cash equivalents (10.9) 0.7
Cash and cash equivalents at beginning of the period 28.3 27.6
Cash and cash equivalents at end of the period 17.4 28.3
Cash and cash equivalents comprise:
Bank balances and on-call deposits 12.8 23.2
Short-term deposits 4.6 5.1
17.4 28.3
Cash flows for the year ended 30 June
VECTOR ANNUAL REPORT 2021 /
50
Financial Statements

Changes in equityfor the year ended 30 June
NOTE
ISSUED SHARE
CAPITAL$M
TREASURY SHARES
$M
HEDGE RESERVES
$M
OTHER RESERVES
$M
RETAINED EARNINGS
$M
NON- CONTROLLING
INTERESTS$M
TOTAL EQUITY
$M
Balance at 30 June 2019 880.0 (0.4) (61.1) (1.5) 1,515.4 17.0 2,349.4
Net profit/(loss) for the period – – – – 95.4 1.9 97.3
Other comprehensive income – – (20.6) 0.6 – – (20.0)
Total comprehensive income – – (20.6) 0.6 95.4 1.9 77.3
Dividends 3 – – – – (165.0) (2.0) (167.0)
Employee share purchase scheme transactions – 0.1 – (0.1) – – –
Total transactions with owners – 0.1 – (0.1) (165.0) (2.0) (167.0)
Balance at 30 June 2020 880.0 (0.3) (81.7) (1.0) 1,445.8 16.9 2,259.7
Net profit/(loss) for the period – – – – 193.2 1.4 194.6
Other comprehensive income – – 46.9 0.4 – – 47.3
Total comprehensive income – – 46.9 0.4 193.2 1.4 241.9
Dividends 3 – – – – (165.0) (0.8) (165.8)
Employee share purchase scheme transactions – 0.1 – (0.1) – – –
Redemption of preference shares 3 – – – – – (1.8) (1.8)
Reclassification to investment held for sale 6 – – – 1.4 – – 1.4
Total transactions with owners – 0.1 – 1.3 (165.0) (2.6) (166.2)
Balance at 30 June 2021 880.0 (0.2) (34.8) 0.7 1,474.0 15.7 2,335.4
51
Creating a new energy future – a bold vision

Notes to the Financial Statements
VECTOR ANNUAL REPORT 2021 /
52
Notes to the Financial Statements
Notes to the Financial Statements
Note 1 Company information 53
Note 2 Summary of significant accounting policies 53
Note 3 Significant transactions and events 54
Note 4 Segment information 55
Note 5 Contingent consideration 58
Note 6 Investment held for sale 58
Note 7 Revenue 59
Note 8 Operating expenses 62
Note 9 Interest costs (net) 62
Note 10 Trade and other receivables 63
Note 11 Intangible assets 64
Note 12 Property, plant and equipment (PPE) 66
Note 13 Leases 68
Note 14 Investments 69
Note 15 Income tax expense/(benefit) 71
Note 16 Deferred tax 72
Note 17 Trade and other payables 72
Note 18 Provisions 73
Note 19 Fair values 74
Note 20 Borrowings 76
Note 21 Derivatives and hedge accounting 78
Note 22 Financial risk management 82
Note 23 Cash flows 86
Note 24 Equity 87
Note 25 Related party transactions 88
Note 26 Contingent liabilities 89
Note 27 Events after balance date 89

1. Company information
Reporting entity Vector Limited is a company incorporated and domiciled in New Zealand, registered under the Companies Act 1993 and listed on the NZX Main Board (NZX). The company is an FMC reporting entity for the purposes of Part 7 of the Financial Markets Conduct Act 2013. The financial statements comply with this Act.
The financial statements presented are for Vector Limited Group (“Vector” or “the group”) as at, and for the year ended 30 June 2021. The group comprises Vector Limited (“the parent”) and its subsidiaries (together referred to as “the group”).
In accordance with the Financial Markets Conduct Act 2013, where a reporting entity prepares consolidated financial statements, parent company disclosures are not required.
Vector Limited is a 75.1% owned subsidiary of Entrust which is the ultimate parent entity for the group.
The primary operations of the group are electricity and gas distribution, natural gas and LPG sales, metering, telecommunications and new energy solutions.
2. Summary of significant accounting policies
Statement of compliance The financial statements comply with New Zealand equivalents to International Financial Reporting Standards (NZ IFRS), and other applicable Financial Reporting Standards, as appropriate for Tier 1 for-profit entities. They also comply with International Financial Reporting Standards.
Basis of preparation The financial statements have been prepared in accordance with New Zealand Generally Accepted Accounting Practice (NZ GAAP) as appropriate to Tier 1 for-profit entities.
They are prepared on the historical cost basis except for the following items, which are measured at fair value:
— the identifiable assets and liabilities acquired in a business combination; and
— certain financial instruments, and
— contingent receivable and investment in private equity, as disclosed in the notes to the financial statements.
The presentation currency is New Zealand dollars ($). All financial information has been rounded to the nearest 100,000, unless otherwise stated.
The statements of profit or loss, other comprehensive income, cash flows and changes in equity are stated exclusive of GST. All items in the balance sheet are stated exclusive of GST except for trade receivables and trade payables, which include GST.
Significant accounting, estimates and judgements
Vector’s management is required to make judgements, estimates, and apply assumptions that affect the amounts reported in the financial statements. They have based these on historical experience and other factors they believe to be reasonable. The table below lists the key areas of judgements and estimates in preparing these financial statements:
KEY AREAS JUDGEMENTS / ESTIMATES NOTE
Valuation of contingent consideration receivable Estimates 5,19
Intangible assets: valuation of goodwill Estimates 11
Property, plant and equipment: classification of costs Judgements 12
Leases: assessment of lease term for perpetual leases and leases with renewal options Judgements 13
Valuation of derivative financial instruments Estimates 19,21
53
Creating a new energy future – a bold vision

2. Summary of significant accounting policies continued
New standards and interpretations adopted
IAS 38 Intangible Assets interpretation: configuration or customisation costs in a cloud computing arrangement
The group has adopted a new interpretation from the IFRS Interpretations Committee (IFRIC) issued in April 2021 on the International Accounting Standard 38 Intangible Assets (“IAS 38”). The interpretation considers how an entity accounts for configuration or customisation costs in a cloud computing arrangement. An entity does not recognise an intangible asset in a cloud computing arrangement if the contract does not contain a lease of the underlying software or if the entity has no control of the underlying software. The assessment is done as at commencement of the contract.
The group has assessed the impact of the interpretation and recognised $2.3 million of cloud computing configuration and customisation costs as an expense in the current financial year profit or loss. The identified costs represent up-front costs incurred at the implementation phase of new cloud computing arrangements whereby the group has not recognised an intangible asset under IAS 38.
The group has also assessed the Balance Sheet impact of the interpretation at 30 June 2019 and 30 June 2020 as not material. The 2020 comparatives are therefore not restated.
Amendment to NZ IAS 1: Presentation of Financial Statements
The group has elected to early adopt the Amendment to NZ IAS 1: Presentation of Financial Statements, Classification of Liabilities as Current or Non-current retrospectively, effective from 1 July 2020. Adoption of the amendment has no impact on the group’s financial results for the year ended 30 June 2021, and no changes to comparative information for the year ended 30 June 2020 were made.
3. Significant transactions and events
Significant transactions and events that have impacted the financial year ended 30 June 2021:
Loss rental rebates On 26 August 2020, we released our 2020 Annual Report and noted that we would not be distributing loss rental rebates (LRRs) in September 2020, but retaining the LRRs with a view to offset the impact of any electricity volume reductions on revenue and mitigate potential future prices increases for consumers under the new revenue cap regulatory regime effective 1 April 2020. Any excess LRRs not required to mitigate such revenue shortfalls will be returned to customers at a later date.
To this effect, Vector have recognised a total of $22.8 million as income in the current year profit or loss, comprising LRRs received in the current and prior financial years. Consistent with the approach stated earlier, and as communicated in Vector’s media release on 30 June 2021, the board have approved the distribution of excess LRRs not required to mitigate revenue shortfalls to customers. The provision for distribution to customers of $11.9 million provides for $20 per customer on the Vector electricity network. Refer to note 18.
Sale of investment in Tree Scape Limited
In May 2021, the Vector board resolved to enter into a sale and purchase agreement with other current shareholders of Tree Scape Limited to sell all ordinary and paid up shares in the company to Blair Mill Investments LLC or its nominated subsidiary. As a result, the investment was classified as a non-current asset held for sale in the same month. Equity accounting ceased from 1 June 2021. Refer to note 6 for details.
On 20 July 2021, Vector and the shareholders signed a sale and purchase agreement to sell all the shares in the company to Blair Mill NZ Holdings Limited for cash, subject to conditions being satisfied. The target completion date is 31 August 2021. The group will use the proceeds from the sale to repay group debt as it matures.
Climate Change Commission Advice
On 31 May 2021, the Climate Change Commission (“the CCC”) finalised their advice to the New Zealand Government (“the Government”) on its first three emissions budgets and direction for its emissions reduction plan 2022 – 2025. The Government has until 31 December 2021 before it communicates its position on the CCC’s advice.
The Government’s response to the CCC advice will likely have significant implications for Vector’s businesses and specifically, our gas distribution network and gas trading operations. Refer to Note 11 for further detail.
VECTOR ANNUAL REPORT 2021 /
54
Notes to the Financial Statements

Redemption of preference shares
The shareholders of Liquigas Limited, of which the group owns 60.25%, resolved to redeem 4,427,863 non-participating, redeemable preference shares in May 2021 for a total consideration of $4.4 million, at $1 per share. $1.8 million of the consideration was paid to non-controlling interest holders in accordance with their shareholding.
Debt programme The $350.0 million floating rate notes, credit wrapped by MBIA Insurance Corporation were repaid on 27 October 2020. These were refinanced as part of our ongoing debt management activities.
In October 2020, Vector issued $170.0 million of wholesale bonds at a fixed rate of 1.575% maturing in October 2026.
During the year ended 30 June 2021, the group drew down a net of $360.0 million (2020: repaid a net of $245.0 million) from the bank facilities. Refer to note 20.
Dividends Vector Limited’s final dividend for the year ended 30 June 2020 of 8.25 cents per share was paid on 21 September 2020, with a supplementary dividend of 0.44 cents per non-resident share. The total dividend paid was $82.5 million.
Vector Limited’s interim dividend for the year ended 30 June 2021 of 8.25 cents per share was paid on 8 April 2021, with a supplementary dividend of 0.44 cents per non-resident share. The total dividend paid was $82.5 million.
Liquigas Limited, a subsidiary of the group, paid a final dividend in June 2021 of $0.8 million to the company’s non-controlling interests.
4. Segment information
Segments Vector report on three reportable segments in accordance with NZ IFRS 8 Operating Segments. These segments are reported internally to the group chief executive. This reporting is used to assess performance and make decisions about the allocation of resources.
The segments are unchanged from those reported in Vector’s annual report for the year ended 30 June 2020. The segments are:
Regulated Networks Auckland electricity and gas distribution services.
Gas Trading Natural gas and LPG sales, storage, and transportation.
Metering Metering services.
Segment information is prepared and reported in accordance with Vector’s accounting policies.
Intersegment transactions included in the revenues and operating expenses for each segment are on an arm’s length basis.
Segment profit The measures of segment profit reported to the group chief executive are earnings before interest and tax (EBIT) and earnings before interest, tax, depreciation, amortisation and impairments (EBITDA). Both are non-GAAP measures that do not have a standardised meaning under NZ IFRS.
Activities not reported in segments
Other activities engaged by the group comprise shared services and other business activities. Revenues generated by these activities are incidental to Vector’s operations and/or do not meet the definition of an operating segment under NZ IFRS 8. The results for these activities are reported in the reconciliations of segment information to the group’s financial statements.
Interest costs (net), fair value change on financial instruments and associates (share of net profit/(loss)) are not allocated to the segments.
Geographical information The group derives the majority of the revenue from external customers in New Zealand.
Major customers Vector engages with three major customers, each of which contribute greater than ten percent of the group’s revenue. These customers are large energy retailers. For the year ended 30 June 2021, the customers contributed $191.3 million (2020: $216.5 million), $152.4 million (2020: $159.1 million) and $135.0 million (2020: $158.5 million) respectively, which is reported across all segments.
55
Creating a new energy future – a bold vision

4. Segment information continued
2021
REGULATED NETWORKS
$M
GAS TRADING
$MMETERING
$M
INTER–SEGMENT
$MTOTAL
$M
External revenue:
Sales 625.2 209.0 225.7 – 1,059.9
Third party contributions 121.1 – – – 121.1
Other 18.8 – – – 18.8
Intersegment revenue 2.4 – 1.3 (3.7) –
Segment revenue 767.5 209.0 227.0 (3.7) 1,199.8
External expenses:
Electricity transmission expenses (179.7) – – – (179.7)
Gas purchases and production expenses – (128.9) – – (128.9)
Metering services cost of sales – – (26.4) – (26.4)
Network and asset maintenance (68.7) (6.3) (9.2) – (84.2)
Employee benefit expenses (16.0) (11.4) (10.9) – (38.3)
Other expenses (31.3) (31.3) (8.9) – (71.5)
Intersegment expenses – (3.7) – 3.7 –
Segment operating expenses (295.7) (181.6) (55.4) 3.7 (529.0)
Segment EBITDA 471.8 27.4 171.6 – 670.8
Depreciation and amortisation (134.5) (12.0) (89.9) – (236.4)
Segment profit/(loss) 337.3 15.4 81.7 – 434.4
Segment capital expenditure 314.7 11.2 165.3 – 491.2
Reconciliation to revenue, profit/(loss) before income tax and capital expenditure reported in the financial statements:
2021REVENUE
$M
PROFIT/(LOSS) BEFORE
INCOME TAX$M
CAPITAL EXPENDITURE
$M
Reported in segment information 1,199.8 434.4 491.2
Amounts not allocated to segments (corporate activities):
Revenue 78.1 78.1 –
Third party contributions 1.4 1.4 –
Employee benefit expenses – (56.5) –
Other operating expenses – (70.8) –
Elimination of transactions with segments – 13.0 –
Depreciation and amortisation – (33.7) –
Interest costs (net) – (108.6) –
Fair value change on financial instruments – (3.5) –
Associates (share of net profit/(loss)) – 1.8 –
Capital expenditure – – 38.3
Reported in the financial statements 1,279.3 255.6 529.5
VECTOR ANNUAL REPORT 2021 /
56
Notes to the Financial Statements

4. Segment information continued
2020
REGULATED NETWORKS
$M
GAS TRADING
$MMETERING
$M
INTER–SEGMENT
$MTOTAL
$M
External revenue:
Sales 656.9 256.4 203.9 – 1,117.2
Third party contributions 85.7 – – – 85.7
Other 15.6 – – – 15.6
Intersegment revenue 2.7 – 1.3 (4.0) –
Segment revenue 760.9 256.4 205.2 (4.0) 1,218.5
External expenses:
Electricity transmission expenses (200.8) – – – (200.8)
Gas purchases and production expenses – (153.2) – – (153.2)
Metering services cost of sales – – (25.2) – (25.2)
Network and asset maintenance (68.4) (13.8) (9.1) – (91.3)
Employee benefit expenses (18.9) (13.8) (7.4) – (40.1)
Other expenses (49.5) (37.7) (8.7) – (95.9)
Intersegment expenses – (4.0) – 4.0 –
Segment operating expenses (337.6) (222.5) (50.4) 4.0 (606.5)
Segment EBITDA 423.3 33.9 154.8 – 612.0
Gain from sale of Kapuni gas interests – 0.5 – – 0.5
Depreciation and amortisation (131.2) (14.9) (81.3) – (227.4)
Segment profit/(loss) 292.1 19.5 73.5 – 385.1
Segment capital expenditure 317.1 8.2 133.3 – 458.6
Reconciliation to revenue, profit/(loss) before income tax and capital expenditure reported in the financial statements:
2020 REVENUE
$M
PROFIT/(LOSS) BEFORE
INCOME TAX$M
CAPITAL EXPENDITURE
$M
Reported in segment information 1,218.5 385.1 458.6
Amounts not allocated to segments (corporate activities):
Revenue 74.8 74.8 –
Third party contributions 0.7 0.7 –
Impairment (refer to note 11.1) – (32.0) –
Employee benefit expenses – (54.2) –
Other operating expenses – (66.9) –
Elimination of transactions with segments – 10.0 –
Depreciation and amortisation – (35.4) –
Interest costs (net) – (126.5) –
Fair value change on financial instruments – (3.4) –
Associates (share of net profit/(loss)) – 0.3 –
Capital expenditure – – 30.1
Reported in the financial statements 1,294.0 152.5 488.7
57
Creating a new energy future – a bold vision

5. Contingent consideration
NOTE2021
$M
Carrying value of contingent consideration
Balance at 30 June 2020 84.7
Unwinding of discount 9 6.3
Payments received (3.4)
Fair value movement 21.2 (5.9)
Balance at 30 June 2021 81.7
Comprising:
Current 8.2
Non-current 73.5
Key accounting estimate The fair value of the contingent consideration was estimated by calculating the present value of the future expected cash flows payable by Todd Petroleum Mining Company Limited to Vector. The future period of payment is not fixed by the contract but is dependent on the remaining useful life of the Kapuni gas treatment plant (KGTP), which is directly correlated to the volume of gas available at the Kapuni gas field and the rate at which the gas is extracted. The values of future cash flows are highly dependent on the future sale prices of gas products (LPG and oil) in the market. Underpinning this all is the assumption that there is an active market for processed gas products in the future and government policy relating to the transition of New Zealand to a low carbon economy.
Management have re-estimated the same unobservable inputs when calculating the fair value of the contingent consideration at balance date. Refer to note 19 for details and sensitivity analysis around significant unobservable inputs used in measuring fair values.
Payments received $1.0 million of payments received this year was classified as part of trade and other receivables at 30 June 2020. Refer to note 10.
6. Investment held for sale Vector owns 50% of Tree Scape Limited, an associate of the group whose principal activity is vegetation management. An associate is an entity over which the group has significant influence. Significant influence is the power to participate in the financial and operating policy decisions of the investee but is not control or joint control over those policies.
In May 2021, the Vector board resolved to enter into a sale and purchase agreement with other current shareholders of Tree Scape Limited to sell all ordinary and paid up shares in the company to Blair Mill Investments LLC or its nominated subsidiary. Vector’s investment was classified as held for sale at the time of board approval, as the board have deemed the sale as highly probable – with an expectation completion would be within one year from May 2021 - and that the investment was available for immediate sale in its present condition.
The financial results and assets and liabilities of Tree Scape Limited are recognised in these financial statements using the equity method of accounting for 11 months of the financial year up to and including May 2021. From 1 June 2021, Vector’s investment was measured at the lower of carrying amount and fair value less costs to sell.
VECTOR ANNUAL REPORT 2021 /
58
Notes to the Financial Statements

6. Investment held for sale continued
2021(11 MONTHS)
$M
2020(12 MONTHS)
$M
Carrying amount of associate prior to classification as held for sale
Balance at 1 July 8.9 8.7
Share of net profit/(loss) of associate 1.8 0.3
Share of other comprehensive income of associate 0.1 (0.1)
Balance at 31 May (2020: 30 June) 10.8 8.9
Equity accounted earnings of associate
Profit/(loss) before income tax 2.5 0.4
Income tax benefit/(expense) (0.7) (0.1)
Share of net profit/(loss) of associate 1.8 0.3
Total recognised revenues and expenses 1.8 0.3
2021$M
At classification as held for sale
Carrying amount using the equity method 10.8
Foreign currency translation reserve transferred from equity 1.4
Investment reclassified to held for sale 12.2
7. Revenue
7.1 Revenue from contracts with customers
2021$M
2020$M
Regulated networks – sale of distribution services 644.0 672.5
Regulated networks - third party contributions 121.1 85.7
Gas trading sales 209.0 256.4
Metering services 225.7 203.9
Other 79.5 75.5
Total 1,279.3 1,294.0
Revenue streams Satisfaction of performance obligation
Regulated networks – sale of distribution services
The group receives revenue from business customers and energy retailers who sell energy to end customers for electricity and gas distribution services in Auckland.
Revenue from electricity and gas distribution services are measured at the value of consideration received, or receivable, to the extent that pricing is measured by the regulator within a defined revenue path.
Revenue is recognised over time on a basis that corresponds with end consumers’ pattern of electricity and gas consumption. Customers are billed monthly in arrears for distribution services, measured in units of electricity and gas distributed. Revenue from distribution services therefore includes an accrual for services provided but not billed at the end of the month.
The accrual is determined based on the group’s estimate of volume distributed in the month using the most recent data available. A large portion of the contract assets at balance date consists of this accrual.
59
Creating a new energy future – a bold vision

Revenue streams Satisfaction of performance obligation
Regulated networks – third party contributions
The group receives contributions from residential and commercial customers towards the construction of distribution system assets in the Auckland electricity or gas distribution networks.
Third party contributions are recognised as revenue over time, reflecting the percentage completion of the underlying construction activity. The group recognises a contract liability to account for consideration received from the customer but where the agreed construction activity is not completed; and conversely a contract asset is recognised to account for activities completed not billed.
The transaction price for third party contributions is netted against estimated rebates payable to commercial customers. A contract liability is recognised to account for payments received from customers for construction activities completed but who are eligible for rebates in the future based on completion of developments.
In the event that a contract combines a contribution towards an agreed construction activity with sale of electricity or gas distribution services, the group unbundles the contract into two performance obligations and recognises revenue in accordance with each obligation’s accounting policy.
Gas trading sales Gas trading sales comprises predominantly three revenue streams: sale of natural gas, and distribution and sale of LPG.
Revenue streams Satisfaction of performance obligationSale of natural gas
The group receives revenue from business customers for providing a supply of natural gas over a contracted time period.
Revenue is recognised over time that corresponds with the customer’s consumption of natural gas and measured at the transaction price of the contract.
The transaction price for a gas supply contract includes variable consideration in the form of indexed pricing, volume pricing, and take or pay arrangements. The group estimates the amount of variable consideration present in each contract using the expected value method. Customers are billed monthly. A contract asset is recognised to account for natural gas supplied but not billed to the customer at balance date.
Sale of LPGSale of LPG comprises bulk LPG sales to commercial customers and bottled LPG sales to both commercial and residential customers.
Revenue is recognised at a point in time when LPG is delivered to a customer’s site.
Billing to a customer occurs after completion of deliveries and at the end of each month with payment terms ranging from 60 days to 90 days.
Distribution of LPG The group provides services in the areas of bulk LPG storage, distribution and management.
Revenue is recognised over time in line with a customer’s consumption of monthly tolling and storage volumes and measured at the transaction price of the contract. The transaction price for a monthly tolling and storage contract includes variable consideration in the form of volume pricing and take or pay arrangements. The group estimates the amount of variable consideration present in each contract using the expected value method.
7. Revenue continued
7.1 Revenue from contracts with customers continued
VECTOR ANNUAL REPORT 2021 /
60
Notes to the Financial Statements

7. Revenue continued
Revenue streams Satisfaction of performance obligation
Metering services The group receives revenue from business customers for providing electricity and gas metering and data services.
Customer is predominantly an energy retailer who has multiple customers (end users) consuming electricity and gas. Metering and metering data services comprise collection and provision of half-hourly data, utilising the group’s electricity and gas meter assets that are fitted at the premises of end users. Metering services are billed to the customer monthly, based on actual and validated metering and data services provided. Customers are billed a number of days after the end of the month to allow for data validation to take place. A contract asset is recognised at the end of each month for services provided but unbilled.
Other revenue streams Other revenue includes telecommunications revenue and revenue from providing energy solution services.
Telecommunications revenue from commercial customers comprise the sale of fibre services. Revenue is recognised at the point in time of supply and customer consumption.
Energy solutions services comprise predominantly the sale of home and commercial ventilation and solar services. Revenue is recognised over time, reflecting the percentage completion of each ventilation and solar system install.
7.2 Revenue in relation to contract liabilities
The following table sets out the expected timing of future recognition of revenue relating to performance obligations not satisfied (or partially satisfied) at balance date:
20211 – 2 YEARS
$M2 – 4 YEARS
$MTOTAL
$M
Electricity distribution services 1.7 1.7 3.4
Telecommunication services 3.3 2.4 5.7
Total 5.0 4.1 9.1
20201 – 2 YEARS
$M2 – 4 YEARS
$MTOTAL
$M
Electricity distribution services 2.6 1.9 4.5
Telecommunication services 3.4 2.2 5.6
Total 6.0 4.1 10.1
Policies No information is provided in relation to the remaining performance obligations at 30 June 2021 or 30 June 2020 that have an original duration of one year or less as permitted by NZ IFRS 15 Revenue from Contracts with Customers.
Revenue recognised Of the revenue recognised this year, $32.6 million was included in the contract liability balance at the beginning of the reporting period. (2020: $30.2 million).
61
Creating a new energy future – a bold vision

8. Operating expenses
NOTE2021
$M2020
$M
Electricity transmission 4 179.7 200.8
Gas purchases and production 4 128.9 153.2
Metering cost of sales 4 26.4 25.2
Energy solutions cost of sales 23.1 23.7
Network and asset maintenance 4 84.2 91.3
Other direct expenses 53.3 75.6
Employee benefit expenses 4 94.8 94.3
Administration expenses 15.7 18.0
Professional fees 8.4 10.9
IT expenses 19.6 16.6
Other indirect expenses 9.2 8.0
Total 643.3 717.6
Fees paid to auditors Fees were paid to KPMG as follows:
— audit or review of financial statements: $459,000 (2020: $562,000);
— regulatory assurance: $718,525 (2020: $663,000);
— other assurance fees: $72,000 (2020: $22,000);
— non-audit fees: nil (2020: $125,000).
Other assurance fees include fees for the audit of guaranteeing group financial statements, bond registers, greenhouse gas calculations, and agreed upon procedures required by certain contractual arrangements. Non-audit fees in the prior year related to fees for compliance services for R&D tax credits.
9. Interest costs (net)
NOTE2021
$M2020
$M
Interest expense 112.4 121.2
Amortisation of finance costs 7.5 7.9
Capitalised interest (4.5) (4.1)
Interest income (2.9) (2.2)
Unwinding of discount of contingent consideration 5 (6.3) (1.7)
Interest on leases 13.3 1.8 1.9
Unwinding of discount of decommissioning provisions 18 0.6 1.7
Interest associated with Commerce Commission settlement – 1.8
Total 108.6 126.5
Policies Interest costs (net) include interest expense on borrowings and interest income on funds invested which are recognised using the effective interest rate method.
Capitalised interest Vector has capitalised interest to PPE and software intangibles while under construction at an average rate of 3.9% per annum (2020: 4.3%).
VECTOR ANNUAL REPORT 2021 /
62
Notes to the Financial Statements

10. Trade and other receivables NOTE
2021$M
2020$M
Current
Trade receivables 60.2 64.0
Interest receivable 10.2 11.0
Prepayments 8.7 9.0
Consideration due from sale of Kapuni gas interests 5 – 1.0
Other taxes and duties receivable 2.0 1.7
Other 2.1 1.9
Balance at 30 June 83.2 88.6
Non-current
Other contract receivables 1.7 1.7
Balance at 30 June 1.7 1.7
At 30 June, the exposure to credit risk for trade and other receivables by type of counterparty was as follows.
2021$M
2020$M
NOT CREDIT IMPAIRED
CREDIT IMPAIRED
NOT CREDIT IMPAIRED
CREDIT IMPAIRED
Business customers 38.6 2.3 55.7 2.4
Mass market customers (includes customer contributions) 15.4 – 4.4 0.3
Third party asset damages – 3.5 – 4.6
Residential and other 3.8 2.2 2.1 1.5
Total gross carrying amount 57.8 8.0 62.2 8.8
Loss allowance – (3.9) – (5.3)
57.8 4.1 62.2 3.5
The following table provides information about the exposure to credit risk and expected credit losses for trade and other receivables as at 30 June.
2021$M
2020$M
CARRYING AMOUNT
LOSS ALLOWANCE
CARRYING AMOUNT
LOSS ALLOWANCE
Not past due 52.7 – 55.0 –
Past due 1-30 days 4.8 – 2.7 –
Past due 31-120 days 2.9 0.4 4.8 0.5
Past due more than 120 days 1.8 3.5 3.2 4.8
Balance at 30 June 61.9 3.9 65.7 5.3
Policies Trade receivables are predominantly billed receivables. Sales to business customers are billed monthly. Trade receivables from mass market, residential and other customers are recognised as they are originated.
Other receivables represent the amount of contractual cash flows that the group expects to collect from third parties but that did not arise from contracts with customers. Where contractual cash flows are expected or contracted to be received after 12 months, the balance is presented as non-current.
63
Creating a new energy future – a bold vision

10. Trade and other receivables continued
Expected credit losses In assessing credit losses for trade receivables, the group applies the simplified approach and records lifetime expected credit losses (“ECLs”) on trade receivables. The group considers both quantitative and qualitative inputs. Quantitative data includes past collection rates, industry statistics, ageing of receivables, and trading outlook. Qualitative inputs include past trading history with the group.
Lifetime ECLs result from all possible default events over the expected life of a trade receivable. The group considers the probability of default upon initial recognition of the trade receivable, based on reasonable and available information on the group’s customers and groups of customers. The group’s trade receivables are monitored in two groups: business customers, and mass market residential customers.
The group’s customer acceptance process includes a check on credit history, profitability, and the customer’s external credit rating if available. Different levels of sale limits are also imposed on customer accounts by nature.
11. Intangible assets
NOTE
CUSTOMER INTANGIBLES
$MEASEMENTS
$MSOFTWARE
$M
TRADE NAMES
$MGOODWILL
$M
CAPITAL WORK IN
PROGRESS$M
TOTAL$M
Carrying amount 30 June 2019 24.1 17.3 65.2 14.0 1,234.3 18.3 1,373.2
Cost 49.9 17.3 299.0 16.8 1,341.0 18.3 1,742.3
Accumulated amortisation (21.9) – (233.8) (2.8) – – (258.5)
Accumulated impairment (3.9) – – – (106.7) – (110.6)
Additions – – – – – 49.0 49.0
Transfers – 0.5 45.3 – – (45.8) –
Sale of Kapuni gas interests – – – – (65.8) – (65.8)
Disposals – – (0.2) – – – (0.2)
Impairment 11.1 (15.4) – – (12.2) (4.4) – (32.0)
Amortisation for the period (4.5) – (34.5) (1.8) – – (40.8)
Carrying amount 30 June 2020 4.2 17.8 75.8 – 1,164.1 21.5 1,283.4
Cost 49.9 17.8 343.2 16.8 1,275.2 21.5 1,724.4
Accumulated amortisation (26.4) – (267.4) (4.6) – – (298.4)
Accumulated impairment (19.3) – – (12.2) (111.1) – (142.6)
Additions – – – – – 50.5 50.5
Transfers – 0.4 40.0 – – (40.4) –
Disposals – – (0.2) – – – (0.2)
Amortisation for the period (1.6) – (39.8) – – – (41.4)
Carrying amount 30 June 2021 2.6 18.2 75.8 – 1,164.1 31.6 1,292.3
Cost 13.1 18.2 372.0 – 1,275.2 31.6 1,710.1
Accumulated amortisation (10.5) – (296.2) – – – (306.7)
Accumulated impairment – – – – (111.1) – (111.1)
VECTOR ANNUAL REPORT 2021 /
64
Notes to the Financial Statements

11. Intangible assets continued
11.1 Goodwill Goodwill by cash generating unit2021
$M2020
$M
Electricity 881.0 881.0
Gas Distribution 169.2 169.2
Gas Trading – –
Natural Gas 10.3 10.3
LPG 40.2 40.2
Liquigas 40.5 40.5
Communications – –
Metering 22.9 22.9
E-Co Products – –
Total 1,164.1 1,164.1
Policies Goodwill represents the excess of the consideration transferred over the fair value of Vector’s share of the net identifiable assets of an acquired subsidiary.
Goodwill is carried at cost less accumulated impairment losses.
Allocation Goodwill is monitored internally at a group level. It is allocated to the group’s cash generating units (“CGUs”), for impairment testing purposes.
This is the highest level permissible under NZ IFRS. The CGUs within the group are: electricity, gas distribution, metering, natural gas, LPG, Liquigas, communications and E-Co Products.
Goodwill is tested at least annually for impairment against the recoverable amount of the CGU to which it has been allocated.
Impairment testing For all segments the recoverable amount of each segment to which goodwill is allocated exceeds the net assets plus goodwill allocated. Therefore, the group has determined that no impairment to goodwill has occurred during the period.
As at 30 June 2020, the group recognised an impairment loss of $32.0 million in respect of goodwill and intangible assets allocated to the E-Co Products CGU.
Key accounting judgements To assess impairment, management must estimate the future cash flows of operating segments including the CGUs that make up those segments. This entails making judgements including:
— the expected rate of growth of revenues;
— margins expected to be achieved;
— the level of future maintenance expenditure required to support these outcomes; and
— the appropriate discount rate to apply when discounting future cash flows.
Assumptions The recoverable amounts attributed to all of the group’s CGUs are calculated on the basis of value-in-use using discounted cash flow models.
Future cash flows are forecast based on actual results and business plans.
For the electricity, gas distribution and metering CGUs, a ten-year period has been used due to the long-term nature of the group’s capital investment in these businesses and the predictable nature of their cash flows. A five-year period has been used for the natural gas, Liquigas, LPG, E-Co Products and communications CGUs.
Terminal growth rates in a range of 0.0% to 1.8% (2020: 0.0% to 2.0%) and post-tax discount rates between 3.7% to 6.5% (2020: 3.9% and 8.2%) are applied. Rates vary for the specific CGU being valued.
Projected cash flows for regulated businesses are sensitive to regulatory uncertainty. Estimated future regulated network revenues and the related supportable levels of capital expenditure are based on default price-quality path determinations issued by the Commerce Commission and are in line with estimates published in the asset management plans.
Climate Change Commission advice
The New Zealand Government (“the Government”) has until 31 December 2021 to set its first three emissions budgets out to 2035 and release the country’s first emissions reduction plan detailing the policies it will use to achieve the budgets. As policies are formalised, their impact on the assumptions used in impairment models will need to be carefully assessed.
65
Creating a new energy future – a bold vision

11. Intangible assets continued11.1 Goodwill continued
Climate Change Commission advice continued
The impact of any policy changes on the Commerce Commission’s regulatory model for the gas distribution network will be fundamental to any revision in assumptions for the valuation of the gas distribution CGU. The timing or extent of this is not yet known. The regulatory model determines the cash flows we can earn from the gas distribution business and hence its value. We will be monitoring any policy developments closely as the next reset for the regulatory default price path for gas distribution is due to come into force from 1 October 2022. Similarly, any policy changes could impact valuation assumptions for the natural gas, LPG and Liquigas CGUs.
Vector performed an assessment for any indicators of impairment as at 30 June 2021. We did not model any potential impacts of the Climate Change Commission (“CCC”) advice during that assessment. While we determined there were no indicators of impairment as this time, we recognise that the Government’s policy response to the CCC advice may have significant risk to the cashflows and expected lives of the group’s gas distribution and gas trading businesses.
11.2 Other intangible assets Other intangible assets are initially measured at cost, and subsequently stated at cost less any accumulated amortisation and impairment losses.
Software and customer intangibles have been assessed as having a finite life greater than 12 months and are amortised from the date the asset is ready for use on a straight-line basis over its estimated useful life. The estimated useful lives (years) are as follows:
Software 3 – 10
Customer intangibles 3 – 10
Easements are not amortised but are tested for impairment at least annually as part of the assessment of the carrying values of assets against the recoverable amounts of the CGUs to which they have been allocated.
12. Property, plant and equipment (PPE)
DISTRIBUTION SYSTEMS
$M
ELECTRICITY AND GAS
METERS$M
LAND, BUILDINGS
AND IMPROVE-
MENTS$M
COMPUTER AND TELCO EQUIPMENT
$M
OTHER PLANT AND EQUIPMENT
$M
CAPITAL WORK IN
PROGRESS$M
TOTAL$M
Carrying amount 30 June 2019 3,110.2 525.5 180.2 94.4 164.2 91.8 4,166.3
Cost 4,280.4 926.7 219.4 198.4 286.0 91.8 6,002.7
Accumulated depreciation (1,170.2) (401.2) (39.2) (104.0) (121.8) – (1,836.4)
Additions – – – – 5.1 439.7 444.8
Transfers 293.2 115.6 8.3 5.3 10.5 (432.9) –
Sale of Kapuni gas interests (17.3) – (2.1) – (11.2) – (30.6)
Disposals (3.2) – (0.2) (0.3) (0.7) – (4.4)
Depreciation for the period (124.2) (59.2) (3.5) (9.9) (11.6) – (208.4)
Carrying amount 30 June 2020 3,258.7 581.9 182.7 89.5 156.3 98.6 4,367.7
Cost 4,458.5 1,039.6 222.2 199.7 289.7 98.6 6,308.3
Accumulated depreciation (1,199.8) (457.7) (39.5) (110.2) (133.4) – (1,940.6)
Additions – – – – 1.3 477.7 479.0
Transfers 314.1 126.1 9.5 11.5 23.7 (484.9) –
Disposals (6.3) (0.2) – – (1.3) – (7.8)
Depreciation for the period (122.4) (67.1) (3.4) (9.1) (11.1) – (213.1)
Carrying amount 30 June 2021 3,444.1 640.7 188.8 91.9 168.9 91.4 4,625.8
Cost 4,755.2 1,161.8 231.3 208.1 313.0 91.4 6,760.8
Accumulated depreciation (1,311.1) (521.1) (42.5) (116.2) (144.1) – (2,135.0)
VECTOR ANNUAL REPORT 2021 /
66
Notes to the Financial Statements

12. Property, plant and equipment (PPE)
Policies PPE is initially measured at cost, and subsequently stated at cost less depreciation and any impairment losses. Cost may include:
— Consideration paid on acquisition
— Costs to bring the asset to working condition
— Materials used in construction
— Direct labour attributable to the item
— Interest costs attributable to the item
— A proportion of directly attributable overheads incurred
— If there is a future obligation to dismantle and/or remove the item, the costs of doing so
Capitalisation of costs stops when the asset is ready for use.
Subsequent expenditure that increases the economic benefits derived from the asset is capitalised.
Uninstalled assets are stated at the lower of cost and estimated recoverable amount.
Depreciation commences when an asset becomes available for use.
Depreciation of PPE, other than freehold land and capital work in progress, is calculated on a straight-line basis and expensed over the useful life of the asset. Useful lives are reviewed regularly and adjusted as appropriate for the revised expectations.
Estimated useful lives (years) are as follows:
Buildings 40 – 100 Meters and meter inspections 2 – 40
Distribution systems 5 – 100 Computer and telco equipment 2 – 50
Leasehold improvements 5 – 20 Other plant and equipment 2 – 55
Key accounting judgements The group’s property, plant and equipment, particularly the group’s distribution assets, are critical to the running of the group’s business. In assessing whether the costs incurred in a project on the group’s assets are capital in nature, management must apply the following judgements:
— Whether the costs incurred are directly attributable to bringing an asset to the location and condition necessary for it to be capable of operating in the manner intended by management;
— Whether subsequent costs incurred represent an enhancement to existing assets or maintain the current operating capability of existing assets;
— Whether overhead costs can be reasonably allocated to the construction or acquisition of an asset.
Capital commitments The estimated capital expenditure for PPE and software intangibles contracted for at balance date but not provided is $206.1 million for the group (2020: $127.0 million).
67
Creating a new energy future – a bold vision

13. Leases
13.1 Right of use assetsLAND,
BUILDINGS AND
IMPROVE-MENTS
$M
OTHER PLANT AND EQUIPMENT
$MTOTAL
$M
Carrying amount 30 June 2019 34.7 3.4 38.1
Additions 4.0 2.7 6.7
Disposals – (0.1) (0.1)
Depreciation for the period (7.0) (1.9) (8.9)
Carrying amount 30 June 2020 31.7 4.1 35.8
Additions 7.2 3.1 10.3
Disposals – – –
Depreciation for the period (7.7) (2.3) (10.0)
Carrying amount 30 June 2021 31.2 4.9 36.1
Cost 49.7 8.3 58.0
Accumulated depreciation (18.5) (3.4) (21.9)
13.2 Lease liabilities maturity analysis
MINIMUM LEASE
PAYMENTS$M
INTEREST$M
PRESENT VALUE
$M
Within one year 9.9 (1.5) 8.4
One to five years 24.0 (3.8) 20.2
Beyond five years 12.8 (4.0) 8.8
Total 46.7 (9.3) 37.4
Current portion 8.4
Non-current portion 29.0
Total 37.4
13.3 Lease expenses included in profit or loss
2021$M
2020$M
Short-term leases 0.2 0.1
Interest on leases 1.8 1.9
13.4 Lease cashflows included in Statement of cash flows
2021$M
2020$M
Total cash outflow in relation to leases 12.2 10.6
VECTOR ANNUAL REPORT 2021 /
68
Notes to the Financial Statements

13. Leases continued
Policies Right of use (“ROU”) assets are measured at cost, less any accumulated depreciation and impairment losses, and adjusted for any remeasurement of lease liabilities. The cost of ROU assets includes the amount of lease liabilities recognised, initial direct costs incurred, restoration obligations, and lease payments made at or before the commencement date less any lease incentives received.
ROU assets are subsequently depreciated using the straight-line method from the commencement date to the end of the lease term.
Key accounting judgements Determining the term of a perpetual lease and a lease with renewal options (single or multiple) can have a material impact on the value of the ROU asset and associated lease liability.
The group has two perpetual leases relating to two LPG storage and transportation sites at Lyttelton and Dunedin with no expiry dates. Management have determined the lease term for the perpetual leases be the same as the lease for the Port Taranaki LPG import facility, on the basis that economic benefits from the perpetual leases are requisite on the group having a continuing right to use the site and associated facilities at Port Taranaki. The end of the lease term for the lease at Port Taranaki is 30 September 2044.
For leases with renewal options, management include one to all available renewal periods in the lease term if it is reasonably certain that the renewal option or options will be exercised. In making this judgement management consider the non-cancellable period of the lease, other leases or assets associated with the lease in question, and other economic factors such as availability of similar leases in the market and costs to identify and negotiate another lease if not renewed.
Several property leases in the group’s portfolio of leases contain renewal options. The group has estimated the impact from potential future lease payments, should it exercise these extension options, to be an increase of $10.0 million (2020: $2.9 million) in the group’s lease liability.
14. Investments
14.1 Investment in private equity
EQUITY INTEREST HELD
INVESTEE PRINCIPAL ACTIVITYCOUNTRY OF INCORPORATION 2021 2020
mPrest Systems (2003) Limited Technology development Israel 8.1% 8.1%
2021$M
2020$M
Fair value of investment
Balance at 1 July 12.8 15.6
Fair value movement recognised in OCI (0.5) (2.8)
Balance at 30 June 12.3 12.8
Policies The investment is accounted for as a financial asset at fair value through other comprehensive income (“OCI”) on the Balance Sheet.
Fair value of the investment is determined using the discounted cash flow method. Refer to note 19 for details on the significant unobservable inputs used in measuring the fair value and related sensitivity analysis.
69
Creating a new energy future – a bold vision

14. Investments continued
14.2 Investments in subsidiariesSignificant entities and holding companies in the group are listed below.
PERCENTAGE HELD
PRINCIPAL ACTIVITY 2021 2020
Trading subsidiaries
NGC Holdings Limited Holding company 100% 100%
Vector Gas Trading Limited Natural gas trading and processing 100% 100%
Liquigas Limited Bulk LPG storage, distribution, and management 60% 60%
On Gas Limited LPG sales and distribution 100% 100%
Vector Metering Data Services Limited Holding company 100% 100%
Advanced Metering Assets Limited Metering services 100% 100%
Advanced Metering Services Limited Metering services 100% 100%
Arc Innovations Limited Metering services 100% 100%
Vector Communications Limited Telecommunications 100% 100%
Vector Energy Solutions Limited Holding company 100% 100%
PowerSmart NZ Limited Energy solutions services 100% 100%
Vector ESPS Trustee Limited Trustee company 100% 100%
E-Co Products Group Limited Holding company 100% 100%
Cristal Air International Limited Ventilation, heating and water systems sales and assembly 100% 100%
Vector Advanced Metering Services (Australia) Pty Limited Metering services 100% 100%
Vector Advanced Metering Assets (Australia) Limited Metering services 100% 100%
Vector Energy Solutions (Australia) Pty Limited Energy solutions services 100% 100%
Vector Technology Services Limited Technology services 100% 100%
Vector Auckland Property Limited Assets holding company 100% 100%
Vector Northern Property Limited Assets holding company 100% 100%
Non-trading subsidiaries
Ventilation Australia Pty Limited Holding company 100% 100%
HRV Australia Pty Limited Ventilation systems and parts sales 100% 100%
Policies Subsidiaries are entities controlled directly or indirectly by the parent. Vector holds over 50% of the voting rights in all entities reported as subsidiaries. The financial statements of subsidiaries are consolidated into the group’s financial statements. Intra-group balances and transactions between group subsidiary companies are eliminated on consolidation.
Amalgamation Vector Kapuni Limited was amalgamated into Vector Gas Trading Limited on 30 June 2021. Vector Kapuni Limited had been non-trading since April 2020.
Geography All subsidiaries are incorporated in New Zealand, except for the following which are incorporated in Australia:
— Vector Advanced Metering Services (Australia) Pty Limited;
— Vector Energy Solutions (Australia) Pty Limited;
— Ventilation Australia Pty Limited;
— HRV Australia Pty Limited.
VECTOR ANNUAL REPORT 2021 /
70
Notes to the Financial Statements

15. Income tax expense/(benefit)
Reconciliation of income tax expense/(benefit) NOTE2021
$M2020
$M
Profit/(loss) before income tax 255.6 152.5
Tax at current rate of 28% 71.6 42.7
Current tax adjustments:
Non-deductible expenses 2.0 1.9
Adjustment relating to sale of Kapuni gas interest – 9.0
Impairment – 9.0
(Over)/under provisions in prior periods (2.6) (1.6)
Other permanent difference – (0.9)
Deferred tax adjustments:
Impact from tax legislation amendment 16 – (3.5)
(Over)/under provisions in prior periods (10.0) (1.4)
Income tax expense/(benefit) 61.0 55.2
Comprising:
Current tax 33.4 27.8
Deferred tax 27.6 27.4
Policies Income tax expense/(benefit) comprises current and deferred tax and is calculated using rates enacted or substantively enacted at balance date.
Current and deferred tax is recognised in profit or loss unless the tax relates to items in other comprehensive income, in which case the tax is recognised as an adjustment in other comprehensive income against the item to which it relates.
Income tax asset As at 30 June 2021, Vector recognised a current income tax asset of $28.7 million (2020: $33.7 million) and a non-current income tax asset of $102.8 million (2020: $110.0 million).
Imputation credits There are no imputation credits available for use as at 30 June 2021 (2020: nil), as the imputation account has a debit balance as of that date.
71
Creating a new energy future – a bold vision

16. Deferred taxDeferred tax liability/(asset)
PPE AND INTANGIBLES
$M
PROVISIONS AND
ACCRUALS$M
HEDGE RESERVES
$MOTHER
$MTOTAL
$M
Balance at 30 June 2019 535.3 (25.5) (23.7) 1.5 487.6
Recognised in profit or loss 23.1 (1.6) – 9.4 30.9
Recognised in other comprehensive income – – (8.0) – (8.0)
Deferred tax associated with sale of Kapuni gas interests 1.0 6.0 – – 7.0
Impact from tax legislation amendment (3.5) – – – (3.5)
Balance at 30 June 2020 555.9 (21.1) (31.7) 10.9 514.0
Recognised in profit or loss 21.3 5.8 – 0.5 27.6
Recognised in other comprehensive income – – 18.1 – 18.1
Balance at 30 June 2021 577.2 (15.3) (13.6) 11.4 559.7
The group’s deferred tax position is presented in the balance sheet as follows:
2021$M
2020$M
Deferred tax asset (2.1) (0.4)
Deferred tax liability 561.8 514.4
Total 559.7 514.0
Policies Deferred tax is:
— Recognised on temporary differences between the carrying amounts of assets and liabilities for financial reporting purposes and the amounts used for taxation purposes.
— Not recognised for the initial recognition of goodwill.
— Measured at tax rates that are expected to be applied to the temporary differences when they reverse.
17. Trade and other payables2021
$M2020
$M
Current
Trade payables 174.7 154.4
Employee benefits 22.7 17.8
Interest payable 24.3 28.6
Balance at 30 June 221.7 200.8
Employee benefits Vector accrues employee benefits which remain unused at balance date, and amounts expected to be paid under short-term cash bonus plans.
VECTOR ANNUAL REPORT 2021 /
72
Notes to the Financial Statements

18. Provisions
NOTE
PROVISION FOR DISTRIBUTION TO
CUSTOMERS $M
DECOMMISSIONING PROVISIONS
$M
PRODUCT WARRANTY
$MOTHER
$MTOTAL
$M
Balance at 30 June 2020 15.5 7.8 3.3 9.0 35.6
Additions 19.2 0.3 – 1.5 21.0
Unwinding of discount – 0.6 – – 0.6
Reversed to profit or loss 3 (22.8) – (0.7) (3.7) (27.2)
Balance at 30 June 2021 11.9 8.7 2.6 6.8 30.0
Comprising:
Current 11.9 – 2.6 6.8 21.3
Non-current – 8.7 – – 8.7
Policies The group recognises a provision when the group has a present obligation – legal or constructive – as a result of a past event, it is more likely than not that the resulting liability will be required to be settled, and the amount required to settle can be reliably estimated.
Provision for distribution to customers
The group’s stated intention to distribute excess loss rental rebates not used to mitigate revenue shortfalls to customers on Vector’s electricity network gives rise to a constructive obligation that forms the basis of the provision.
Decommissioning The decommissioning provisions represent the present value of the future expected costs for dismantling the depot assets situated at various regions in New Zealand. Timing of economic outflows represents management’s best estimate of the end of the useful life of the plant and associated assets.
Product warranty The group provides for restatement costs and warranty claims on products sold or installed. Provisions are recognised when the product is sold, or the service is provided to the customer. Initial recognition is based on historical experience and subsequently revisited at each reporting date.
Other provisions These provisions comprise amounts that may be required to be utilised within one year or a longer period dependent on ongoing negotiations with third parties involved. There are currently no foreseeable uncertainties which would be reasonably expected to lead to material changes in the amounts provided.
73
Creating a new energy future – a bold vision

19. Fair values
NOTE
SIGNIFICANT OBSERVABLE
INPUTS(LEVEL 2 INPUTS)
2021$M
SIGNIFICANT UNOBSERVABLE
INPUTS(LEVEL 3 INPUTS)
2021$M
SIGNIFICANT OBSERVABLE
INPUTS(LEVEL 2 INPUTS)
2020$M
SIGNIFICANT UNOBSERVABLE
INPUTS(LEVEL 3 INPUTS)
2020$M
Assets measured at fair value
Derivative financial instruments 21 103.3 – 220.4 –
Investment in private equity 14.1 – 12.3 – 12.8
Contingent consideration 5 – 81.7 – 84.7
Balance at 30 June 103.3 94.0 220.4 97.5
Liabilities measured at fair value
Derivative financial instruments 21 165.6 – 104.9 –
Balance at 30 June 165.6 – 104.9 –
Policies The table above provides the fair value measurement hierarchy of the group’s assets and liabilities that are measured at fair value.
The group estimates all fair values using the discounted cash flows method. All assets and liabilities for which fair value is measured and disclosed in the financial statements are categorised within the fair value hierarchy, described as follows:
Level 1: Quoted prices (unadjusted) in active markets for identical assets or liabilities; or
Level 2: Inputs other than quoted prices included within level 1 that are observable for the asset or liability, either directly (prices) or indirectly (derived from prices); or
Level 3: Inputs for the asset or liability that are not based on observable market data (unobservable inputs).
Derivative financial instruments
Fair value is calculated using the discounted cash flow method, estimated using observable interest yield curves and/or foreign exchange market prices. The carrying values of the financial instruments are the fair values excluding any interest receivable or payable, which is separately presented in the balance sheet in other receivables or other payables.
Investment in private equity
Fair value is calculated using the discounted cash flow method. In estimating the fair value, the group made assumptions on unobservable inputs, including, amongst others, forecasted future cash flows, an appropriate discount rate and terminal growth rate.
Contingent consideration
Fair value is calculated using the discounted cash flow method. The group made assumptions on unobservable inputs including , amongst others, future raw gas volume from the Kapuni gas field, future LPG prices, future oil prices, foreign exchange rates, and an appropriate discount rate. Further details on the inputs are as follows:
— Future raw gas volume from the Kapuni gas field is based on published forecasts from the Ministry of Business, Innovation and Employment;
— Future LPG prices are based on an independent financial institution’s commodity price forecasts;
— Future oil prices are based on S&P Capital IQ forecast data;
— Future natural gas prices are based on an independent expert’s commodity price forecast;
— Future foreign exchange rates are based on an independent financial institution’s foreign exchange rate forecasts; and
— Discount rate of 8% (2020: 8%), representing market discount rates as applicable to the remaining life of the Kapuni gas field.
VECTOR ANNUAL REPORT 2021 /
74
Notes to the Financial Statements

19. Fair values continued
Description of significant unobservable inputs
The table below summarises the significant level 3 unobservable inputs used by the group in measuring fair values and related sensitivity analyses.
2021 SIGNIFICANT UNOBSERVABLE INPUTS RANGE AND ESTIMATES
SENSITIVITY OF VALUATION TO CHANGES IN INPUTS
LOWVALUATION IMPACT $M HIGH
VALUATION IMPACT $M
Investment in private equity
Forecast cashflows $-1.3 million to $11.7 million
-10.0% -$1.1 10.0% +$1.1
Discount rate 9.2% -1.0% +$2.2 1.0% -$1.7
Terminal growth rate 1.5% -1.0% -$1.0 1.0% +$1.3
Contingent consideration
Discount rate 8.0% -1.0% +$4.6 1.0% -$4.2
Future raw gas volume 254 PJ - 2PJ per annum
-$10.3 + 2PJ per annum
+$10.2
LPG pricing USD $525/tonne long-term
- USD $50/tonne
- $8.6 + USD $50/tonne
+$8.6
Oil pricing USD $70/barrel
long-term- USD $7/
barrel- $4.0 + USD $7/
barrel+$4.0
2020SIGNIFICANT UNOBSERVABLE INPUTS RANGE AND ESTIMATES
SENSITIVITY OF VALUATION TO CHANGES IN INPUTS
LOWVALUATION IMPACT $M HIGH
VALUATION IMPACT $M
Investment in private equity
Forecast cashflows $-3.6 million to $13.8 million
-10.0% -$1.2 10.0% +$1.2
Discount rate 9.8% -1.0% +$2.5 1.0% -$1.9
Terminal growth rate 2.0% -1.0% -$1.1 1.0% +$1.4
Contingent consideration
Discount rate 8.0% -1.0% +$4.3 1.0% -$4.0
Future raw gas volume 210 PJ - 2PJ per annum
-$10.3 + 2PJ per annum
+$10.3
LPG pricing USD $520/tonne long-term
- USD $50/tonne
- $8.1 + USD $50/tonne
+$8.1
Oil pricing USD $60/barrel
long-term- USD $6/
barrel- $3.0 + USD $6/
barrel+ $3.0
75
Creating a new energy future – a bold vision

20. Borrowings
2021 CURRENCYMATURITY
DATE
FACE VALUE
$M
UNAMORTISED COSTS
$M
FAIR VALUE ADJUSTMENT
ON HEDGED RISK
$M
CARRYING VALUE
$M
FAIR VALUE
$M
Bank facilities – floating rate NZD Jul 2021 – Jan 2025 510.0 (1.5) – 508.5 510.4
Capital bonds – 5.7% fixed rate
NZD –307.2 (0.4) – 306.8 321.8
Wholesale bonds - fixed rate NZD Mar 2024 – Oct 2026 410.0 2.0 – 412.0 429.2
Senior notes – fixed rate USD Oct 2021 – Mar 2035 1,613.4 (4.0) (14.1) 1,595.3 1,654.9
Senior bonds – 3.45% fixed rate
NZD May 2025250.0 (2.0) – 248.0 266.1
Balance at 30 June 3,090.6 (5.9) (14.1) 3,070.6 3,182.4
2020 CURRENCYMATURITY
DATE
FACE VALUE
$M
UNAMORTISED COSTS
$M
FAIR VALUE ADJUSTMENT
ON HEDGED RISK
$M
CARRYING VALUE
$M
FAIR VALUE
$M
Bank facilities – floating rate NZD Feb 2021 – Jan 2025 150.0 (1.3) – 148.7 150.3
Capital bonds – 5.7% fixed rate NZD – 307.2 (0.7) – 306.5 337.7
Wholesale bonds – fixed rate NZD Mar 2024 240.0 3.1 – 243.1 274.6
Senior notes – fixed rate USD Oct 2021 – Mar 2035 1,613.4 (4.6) 231.1 1,839.9 1,873.6
Floating rate notes – floating rate NZD Oct 2020 350.0 (0.1) – 349.9 350.0
Senior bonds – 3.45% fixed rate NZD May 2025 250.0 (2.5) – 247.5 276.6
Balance at 30 June 2,910.6 (6.1) 231.1 3,135.6 3,262.8
Policies Borrowings are initially recorded at fair value, net of transaction costs. After initial recognition, borrowings are measured at amortised cost with any difference between the initial recognised amount and the redemption value being recognised in interest costs in profit or loss over the period of the borrowing using the effective interest rate method.
The carrying value of borrowings includes the principal converted at contract rates (face value), unamortised costs and a fair value adjustment for the component of the risk that is hedged. The fair value is calculated by discounting the future contractual cash flows at current market interest rates that are available for similar financial instruments. The fair value of all borrowings, calculated for disclosure purposes, are classified as level 2 on the fair value hierarchy.
VECTOR ANNUAL REPORT 2021 /
76
Notes to the Financial Statements

20. Borrowings continued
Bank facilities New floating rate bank facilities were added as part of our debt management activities.
Capital bonds Capital bonds of $307.2 million are subordinated bonds with the next election date set as 15 June 2022. The interest rate was fixed at 5.7% at the previous election date of 15 June 2017.
Wholesale bonds $240.0 million of fixed rate wholesale bonds were issued at a fixed rate of 4.996% maturing in March 2024.
$170.0 million of fixed rate wholesale bonds were issued at a fixed rate of 1.575% maturing in October 2026.
Senior notesDATE ISSUED
AMOUNT ISSUED NZD
AMOUNT ISSUED USD
DATE OF MATURITY
March 2020 $797.1 million
$500.0 million
$573.9 million (USD $360.0 million) matures in October 2032 and $223.2 million (USD $140.0 million) matures in October 2035.
October 2017 $415.8 million
$300.0 million
$277.2 million (USD $200 million) matures in October 2027.$138.6 million (USD $100.0 million) matures in October 2029.
October 2014 $150.0 million
$130.0 million
$150.0 million (USD $130.0 million) matures in October 2021.
December 2010 $250.5 million
$182.0 million
$250.5 million (USD $182.0 million matures in December 2022.
Covenants All borrowings are unsecured and are subject to negative pledge arrangements and various lending covenants. These have all been met for the years ended 30 June 2021 and 30 June 2020.
77
Creating a new energy future – a bold vision

21. Derivatives and hedge accounting
CASH FLOW HEDGES FAIR VALUE HEDGES COST OF HEDGING TOTAL
2021$M
2020$M
2021$M
2020$M
2021$M
2020$M
2021$M
2020$M
Derivative assets
Cross currency swaps – (23.8) 98.1 251.5 (6.5) (7.6) 91.6 220.1
Interest rate swaps 11.0 – – – – – 11.0 –
Forward exchange contracts 0.7 0.3 – – – – 0.7 0.3
Total 11.7 (23.5) 98.1 251.5 (6.5) (7.6) 103.3 220.4
Derivative liabilities
Cross currency swaps (85.8) – (30.9) – (3.6) – (120.3) –
Interest rate swaps (44.3) (104.5) – – – – (44.3) (104.5)
Forward exchange contracts (1.0) (0.4) – – – – (1.0) (0.4)
Total (131.1) (104.9) (30.9) – (3.6) – (165.6) (104.9)
Key observable market data for fair value measurement 2021 2020
Foreign currency exchange (FX) rates as at 30 June
NZD-USD FX rate 0.6983 0.6454
Interest rate swap rates
NZD 0.26% to 1.88% 0.21% to 0.74%
USD 0.10% to 1.74% 0.16% to 0.88%
Sensitivity to changes in market rates
The graphs below illustrate the impact on derivative valuations of possible changes in interest rates and foreign exchange rates, assuming all other variables are held constant.
Impact on comprehensive income
55.9
51.7
9.0
9.1
-53.8
-58.9
-10.8
-6.8
2021 interest rates (-1%/+1%)
2020 interest rates (-1%/+1%)
2021 foreign exchange rates (-10%/+10%)
2020 foreign exchange rates (-10%/+10%)
Rate increase Rate decrease
Impact on profit or loss
0.7
0.3
3.6
2.7
-0.3
-0.7
1.0
-2.4
2021 interest rates (-1%/+1%)
2020 interest rates (-1%/+1%)
2021 foreign exchange rates (-10%/+10%)
2020 foreign exchange rates (-10%/+10%)
Rate increase Rate decrease
VECTOR ANNUAL REPORT 2021 /
78
Notes to the Financial Statements

21. Derivatives and hedge accounting continued
Policies Vector initially recognises derivatives at fair value on the date the derivative contract is entered into, and subsequently they are re-measured to their fair value at each balance date. All derivatives are classified as level 2 on the fair value hierarchy explained in note 19.
Vector designates certain derivatives as either:
— Fair value hedges (of the fair value of recognised assets or liabilities or firm commitments); or
— Cash flow hedges (of highly probable forecast transactions).
At inception each transaction is documented, detailing:
— The economic relationship and the hedge ratio between hedging instruments and hedged items;
— The risk management objectives and strategy for undertaking the hedge transaction; and
— The assessment (initially and on an ongoing basis) of whether the derivatives that are used in the hedging transaction are highly effective in offsetting changes in fair values or cash flows of hedged items.
The underlying risk of the derivative contracts is identical to the hedged risk component (i.e. the interest rate risk and the foreign exchange risk) therefore the group has established a one-to-one hedge ratio. Effectiveness is assessed by comparing the changes of the hedged items and hedging instruments.
Hedge accounting is discontinued when the hedge instrument expires or is sold, terminated, exercised, or no longer qualifies for hedge accounting.
Fair value hedges Vector has entered into cross currency interest rate swaps (the hedging instruments) to hedge the interest rate risk and foreign currency risk (the hedged risk) arising in relation to its USD senior notes (the hedged items). These transactions have been designated into fair value hedges.
The following are recognised in profit or loss:
— The change in fair value of the hedging instruments; and
— The change in fair value of the underlying hedged items attributable to the hedged risk.
Once hedging is discontinued, the fair value adjustment to the carrying amount of the hedged item arising from the hedged risk is amortised through profit or loss from that date through to maturity of the hedged item.
Cash flow hedges Vector has entered into interest rate swaps and cross currency interest rate swaps (the hedging instruments) to hedge the variability in cash flows arising from interest rate and foreign currency exchange rate movements in relation to its NZD floating rate notes and USD senior notes.
The effective portion of changes in the fair value of the hedging instruments are recognised in other comprehensive income.
The following are recognised in profit or loss:
— any gain or loss relating to the ineffective portion of the hedging instrument; and
— fair value changes in the hedging instrument previously accumulated in other comprehensive income, in the periods when the hedged item is recognised in profit or loss.
Once hedging is discontinued, any cumulative gain or loss previously recognised in other comprehensive income is recognised in profit or loss either:
— at the same time as the forecast transaction; or
— immediately if the transaction is no longer expected to occur.
Market rate sensitivity All derivatives are measured at fair value. A change in the market data used to determine fair value will have an impact on Vector’s financial statements.
The graphs on the previous page show the sensitivity of the financial statements to a range of possible changes in market data at balance date.
79
Creating a new energy future – a bold vision

21. Derivatives and hedge accounting continued
2021 $M
2020$M
DERIVATIVES POSITION AS
PER BALANCE SHEET
AMOUNT AFTER
APPLYING RIGHTS OF
OFFSET UNDER ISDA
AGREEMENTS
DERIVATIVES POSITION AS
PER BALANCE SHEET
AMOUNT AFTER
APPLYING RIGHTS OF
OFFSET UNDER ISDA
AGREEMENTS
Derivative assets 103.3 39.3 220.4 152.1
Derivative liabilities (165.6) (101.6) (104.9) (36.6)
Net amount (62.3) (62.3) 115.5 115.5
Rights to offset Vector enters into derivative transactions under International Swaps and Derivatives Association (ISDA) master agreements. The ISDA agreements do not meet the criteria for offsetting in the balance sheet for accounting purposes. This is because Vector does not have any currently legally enforceable right to offset recognised amounts. Under the ISDA agreements the right to offset is enforceable only on the occurrence of future events such as a default on the bank loans or other credit events. The potential net impact of this offsetting is disclosed in column ‘amount after applying rights of offset under ISDA agreements. Vector does not hold and is not required to post collateral against its derivative positions.
Managing interest rate benchmark reform
The group has no derivative that will be affected by the interbank offered rates (“IBOR”) reform as at 30 June 2021. However, the financial modelling of the fair values for certain hedge relationships will shift from applying USD LIBOR to an alternative benchmark interest rate when the transition happens, currently expected at the end of 2021. The group is in the process of assessing the expected impact of the shift in financial modelling.
21.1 Effects of hedge accounting on the financial position and performanceThe tables below demonstrate the impact of hedged items and the hedging instruments designated in hedging relationships:
— The NZD floating rate exposure includes $1,030.0 million arising from hedging the USD senior bonds (2020: $930.0 million), and in 2020 $350.0 million from the floating rate notes as allowable under NZ IFRS 9 Financial Instruments.
— The interest rate swaps include $350.0 million of forward starting swaps (2020: $500.0 million).
2021
FACE VALUE
$M
WEIGHTED AVERAGE
RATE
ACCUMU-LATED FAIR
VALUE HEDGE
ADJUST-MENTS
$M
CARRYING AMOUNT ASSETS/
(LIABILITIES)$M
CHANGE IN FAIR VALUE
USED FOR MEASURING
INEFFECTIVE-NESS –
CASHFLOW HEDGE
$M
CHANGE IN FAIR VALUE
USED FOR MEASURING
INEFFECTIVE-NESS – FAIR
VALUE HEDGE
$M
HEDGING (GAIN) OR
LOSS RECOGNISED
IN CASH FLOW HEDGE
RESERVE$M
(GAIN) OR LOSS
RECOGNISED IN
COST OF HEDGING
$M
Cash flow hedge – Interest risk
Hedged item: NZD floating rate exposure on borrowings (1,030.0) (33.5)
Hedging instrument: Interest rate swaps (1,380.0) 2.2% (33.3) (33.3) (71.2)
Cash flow and fair value hedges – Interest and exchange risks
Hedged item: USD fixed rate exposure on borrowings (1,613.4) 14.1 (1,595.1) (97.9) 186.7
Hedging instrument: Cross currency swaps – FV and CF (1,613.4) floating (28.8) (85.8) (184.3) 3.4 (2.6)
Ineffectiveness – 2.4
VECTOR ANNUAL REPORT 2021 /
80
Notes to the Financial Statements

21. Derivatives and hedge accounting continued
21.1 Effects of hedge accounting on the financial position and performance continued
2020
FACE VALUE
$M
WEIGHTED AVERAGE
RATE
ACCUMU-LATED FAIR
VALUE HEDGE
ADJUST-MENTS
$M
CARRYING AMOUNT ASSETS/
(LIABILITIES)$M
CHANGE IN FAIR VALUE
USED FOR MEASURING
INEFFECTIVE-NESS –
CASHFLOW HEDGE
$M
CHANGE IN FAIR VALUE
USED FOR MEASURING
INEFFECTIVE-NESS – FAIR
VALUE HEDGE
$M
HEDGING (GAIN)
OR LOSS RECOGNISED
IN CASH FLOW HEDGE
RESERVE$M
(GAIN) OR LOSS
RECOGNISED IN COST OF
HEDGING$M
Cash flow hedge – Interest risk
Hedged item: NZD floating rate exposure on borrowings (1,280.0) (106.2)
Hedging instrument: Interest rate swaps (1,780.0) 3.4% (104.5) (104.5) 26.3
Cash flow and fair value hedges – Interest and exchange risks
Hedged item: USD fixed rate exposure on borrowings (1,613.4) (231.1) (1,839.9) (31.8) (143.7)
Hedging instrument: Cross currency swaps (1,613.4) floating 220.1 23.8 140.3 1.4 (0.9)
Ineffectiveness – (3.4)
Hedging instruments and hedged items are included in the line items “Derivatives” and “Borrowings” respectively in the balance sheet. Ineffectiveness is the sum of the change in fair value of the hedged item and the change in fair value of the hedging instrument. The source of ineffectiveness is largely due to counterparty credit risk on the derivative instruments. Hedge ineffectiveness is included in the “Fair value change on financial instruments” in the profit or loss. Please refer to the asset and liability positions of the hedging instruments in Note 21 derivatives and hedge accounting table above.
21.2 Fair value changes on financial instruments
NOTE2021
$M2020
$M
Recognised in profit or loss
Fair value movement on hedging instruments (184.3) 140.3
Fair value movement on hedged items 186.7 (143.7)
Fair value change on contingent consideration 5 (5.9) –
Total gains/(losses) (3.5) (3.4)
81
Creating a new energy future – a bold vision

21. Derivatives and hedge accounting continued
21.3 Reconciliation of changes in hedge reserves
Hedge reserves2021
CASHFLOW HEDGE
RESERVE$M
COST OF HEDGING
$MTOTAL
$M
Opening balance 76.3 5.4 81.7
Hedging gains or losses recognised in OCI – Interest rate swaps (37.7) – (37.7)
Hedging gains or losses recognised in OCI – Cross currency swaps 2.7 2.7 5.4
Hedging gains or losses recognised in OCI – Forward exchange contracts 2.4 – 2.4
Transferred to profit or loss – Interest rate swaps (33.5) – (33.5)
Transferred to profit or loss – Cross currency swaps 0.7 – 0.7
Recognised as basis adjustment to non-financial assets (2.3) – (2.3)
Deferred tax on change in reserves 18.9 (0.8) 18.1
Closing balance 27.5 7.3 34.8
Hedge reserves2020
CASH FLOW HEDGE
RESERVE$M
COST OF HEDGING
$MTOTAL
$M
Opening balance 56.4 4.7 61.1
Hedging gains or losses recognised in OCI – Interest rate swaps 57.4 – 57.4
Hedging gains or losses recognised in OCI – Cross currency swaps 7.3 1.0 8.3
Hedging gains or losses recognised in OCI – Forward exchange contracts (0.4) – (0.4)
Transferred to profit or loss – Interest rate swaps (31.2) – (31.2)
Transferred to profit or loss – Cross currency swaps (5.9) – –
Recognised as basis adjustment to non-financial assets 0.4 – 0.4
Deferred tax on change in reserves (7.7) (0.3) (8.0)
Closing balance 76.3 5.4 81.7
22. Financial risk management
Risk management framework Vector has a comprehensive treasury policy, approved by the board, to manage financial risks arising from business activity. The policy outlines the objectives and approach that the group applies to manage:
— Interest rate risk;
— Credit risk;
— Liquidity risk;
— Foreign exchange risk; and
— Funding risk.
For each risk type, any position outside the policy limits requires the prior approval of the board. Each risk is monitored on a regular basis and reported to the board.
VECTOR ANNUAL REPORT 2021 /
82
Notes to the Financial Statements

22. Financial risk management continued
22.1 Interest rate risk
Interest rate exposure2021
< 1 YEAR$M
1 – 2 YEARS$M
2 – 5 YEARS$M
> 5 YEARS$M
TOTAL$M
Interest rate exposure: borrowings 967.2 250.5 490.0 1,382.9 3,090.6
Derivative contracts:
Interest rate swaps (1,230.0) 40.0 840.0 350.0 –
Cross currency swaps 1,463.4 (250.5) – (1,212.9) –
Net interest rate exposure 1,200.6 40.0 1,330.0 520.0 3,090.6
Interest rate exposure2020
< 1 YEAR$M
1 – 2 YEARS$M
2 – 5 YEARS$M
> 5 YEARS$M
TOTAL$M
Interest rate exposure: borrowings 500.0 457.2 740.5 1,212.9 2,910.6
Derivative contracts:
Interest rate swaps (1,030.0) – 480.0 550.0 –
Cross currency swaps 1,613.4 (150.0) (250.5) (1,212.9) –
Net interest rate exposure 1,083.4 307.2 970.0 550.0 2,910.6
Policies Vector is exposed to interest rate risk through its borrowing activities.
Interest rate exposures are managed primarily by entering into derivative contracts. The main objectives are to minimise the cost of total borrowings, control variations in the interest expense of the borrowings from year to year, and where practicable to match the interest rate risk profile of the borrowings with the risk profile of the group’s assets.
The board has set and actively monitors maximum and minimum limits for the net interest rate exposure profile.
22.2 Credit risk
Policies Credit risk represents the risk of cash flow losses arising from counterparty defaults. Vector is exposed to credit risk in the normal course of business from:
— Trade receivable transactions with business and mass market residential customers; and
— Financial instruments transactions with financial institutions.
The carrying amounts of financial assets represent the group’s maximum exposure to credit risk.
The group has credit policies in place to minimise the impact of exposure to credit risk and associated financial losses:
— The board must approve placement of cash, short-term cash deposits or derivatives with financial institutions whose credit rating is less than A+. As at 30 June 2021, all financial instruments are held with financial institutions with credit rating above A+;
— The board sets limits and monitors exposure to financial institutions; and
— Exposure is spread across a range of financial institutions. Where we deem there is credit exposure to energy retailers and customers, the group minimises its risk by performing credit evaluations and/or requiring a bond or other form of security.
83
Creating a new energy future – a bold vision

22. Financial risk management continued
22.3 Liquidity risk
Contractual cash flows maturity profile2021
PAYABLE <1 YEAR
$M
PAYABLE1 – 2 YEARS
$M
PAYABLE2 – 5 YEARS
$M
PAYABLE >5 YEARS
$M
TOTALCONTRACTUAL
CASH FLOWS$M
Non-derivative financial liabilities
Trade payables 174.7 – – – 174.7
Contract liabilities 7.3 10.1 11.6 0.8 29.8
Lease liabilities 10.0 7.8 16.2 12.7 46.7
Borrowings: interest 90.7 63.1 140.1 165.4 459.3
Borrowings: principal 1,003.4 260.7 490.0 1,315.7 3,069.8
Derivative financial (assets)/liabilities
Cross currency swaps: inflow (234.7) (300.4) (102.8) (1,309.7) (1,947.6)
Cross currency swaps: outflow 187.3 290.3 134.9 1,489.0 2,101.5
Forward exchange contracts: inflow (61.8) (9.5) – – (71.3)
Forward exchange contracts: outflow 61.9 9.6 – – 71.5
Net settled derivatives
Interest rate swaps 20.9 13.6 3.4 (0.5) 37.4
Group contractual cash flows 1,259.7 345.3 693.4 1,673.4 3,971.8
Contractual cash flows maturity profile 2020
PAYABLE <1 YEAR
$M
PAYABLE1–2 YEARS
$M
PAYABLE2–5 YEARS
$M
PAYABLE >5 YEARS
$M
TOTALCONTRACTUAL
CASH FLOWS$M
Non-derivative financial liabilities
Trade payables 154.4 – – – 154.4
Contract liabilities 10.9 9.9 16.8 1.8 39.4
Lease liabilities 9.8 7.8 15.0 15.7 48.3
Borrowings: interest 96.3 90.5 167.0 214.6 568.4
Borrowings: principal 499.1 507.7 775.2 1,239.5 3,021.5
Derivative financial (assets)/liabilities
Cross currency swaps: inflow (55.8) (253.8) (399.1) (1,454.1) (2,162.8)
Cross currency swaps: outflow 35.7 182.6 341.0 1,448.5 2,007.8
Forward exchange contracts: inflow (33.1) (2.3) – – (35.4)
Forward exchange contracts: outflow 33.0 2.4 – – 35.4
Net settled derivatives
Interest rate swaps 33.8 24.0 47.6 9.3 114.7
Group contractual cash flows 784.1 568.8 963.5 1,475.3 3,791.7
VECTOR ANNUAL REPORT 2021 /
84
Notes to the Financial Statements

22. Financial risk management continued
22.3 Liquidity risk continued
Contractual cash flows The above table shows the timing of non-discounted cash flows for all financial instrument liabilities and derivatives.
The cash flows for bank facilities, included in borrowings, are disclosed on the basis of their contractual repayment terms for the individual drawdowns.
The cash flows for capital bonds, included in borrowings, are disclosed as payable within 0 – 1 year as the next election date set for the capital bonds is 15 June 2022 and the bonds have no contractual maturity date.
Policies Vector is exposed to liquidity risk where there is a risk that the group may encounter difficulty in meeting its day to day obligations due to the timing of cash receipts and payments.
The objective is to ensure that adequate liquid assets and funding sources are available at all times to meet both short-term and long-term commitments. The board has set a minimum headroom requirement for committed facilities over Vector’s anticipated 18-month peak borrowing requirement.
At balance date, in addition to short-term deposits, Vector has access to undrawn funds of $670.0 million (2020: $955.0 million).
22.4 Foreign exchange risk
Policies Vector is exposed to foreign exchange risk through its borrowing activities, foreign currency denominated expenditure, and through our Australian subsidiaries.
Foreign exchange exposure is primarily managed through entering into derivative contracts. The board requires that all significant foreign currency borrowings and expenditure are hedged into NZD at the time of commitment to drawdown or when the exposure is highly probable. Hence, at balance date there is no significant exposure to foreign currency risk.
22.5 Funding risk
Policies Funding risk is the risk that Vector will have difficulty refinancing or raising new debt on comparable terms to existing facilities. The objective is to spread the concentration of risk so that if an event occurs the overall cost of funding is not unnecessarily increased. Details of borrowings are shown in note 20.
The board has set the maximum amount of debt that may mature in any one financial year.
85
Creating a new energy future – a bold vision

23. Cash flows
23.1 Reconciliation of net profit/(loss) to net cash flows from/(used in) operating activities
Reconciliation of net profit/(loss) to net cash flows from/(used in) operating activities NOTE
2021$M
2020$M
Net profit/(loss) for the period 194.6 97.3
Items classified as investing activitiesItems associated with investing activities (8.1) (10.0)
Items classified as financing activitiesItems associated with lease liabilities 0.4 (1.0)
Non-cash itemsDepreciation and amortisation 270.1 262.8Non-cash portion of interest costs (net) (3.7) (7.0)Fair value change on financial instruments 21.2 3.5 3.4Associates (share of net (profit)/loss) 6 (1.8) (0.3)Impairment – 32.0Increase/(decrease) in deferred tax 27.4 27.4Increase/(decrease) in provisions (5.4) 11.2Gain on sale of Kapuni gas interests – (0.5)Other non-cash items 0.8 0.8
290.9 329.8
Changes in assets and liabilitiesTrade and other payables 14.1 2.9Contract liabilities 3.3 (0.3)Contract assets (12.9) 12.7Inventories (3.0) (1.0)Trade and other receivables 5.9 6.9Income tax 13.9 (40.0)
21.3 (18.8)
Net cash flows from/(used in) operating activities 499.1 397.3
23.2 Reconciliation of movement of liabilities to cash flows arising from financing activities
Reconciliation of movement of liabilities to cash flows arising from financing activities
LEASE LIABILITIES BORROWINGS DERIVATIVES TOTAL
Balance at 1 July 2020 37.8 3,135.6 (115.5) 3,057.9
Net draw downs – 180.0 – 180.0Lease liabilities payments (11.0) – – (11.0)
Financing cash flows (11.0) 180.0 – 169.0
Cost of debt raising – (1.0) – (1.0)Fair value changes – (245.2) 177.8 (67.4)Borrowing fees paid – (5.5) – (5.5)Amortisation of debt raising costs – 7.6 – 7.6Premium released – (0.9) – (0.9)ROU asset additions 10.3 – – 10.3Other 0.3 – – 0.3
As at 30 June 2021 37.4 3,070.6 62.3 3,170.3
Policies Cash and cash equivalents are carried at amortised cost. Cash and cash equivalents include deposits that are on call.
VECTOR ANNUAL REPORT 2021 /
86
Notes to the Financial Statements

24. Equity
24.1 Share Capital
Shares The total number of authorised and issued shares is 1,000,000,000 (2020: 1,000,000,000).
All ordinary issued shares are fully paid, have no par value and carry equal voting rights and equal rights to a surplus on winding up of the parent.
At balance date 82,035 shares (2020: 116,948) are allocated to the employee share purchase scheme.
24.2 Capital Management
Policies Vector’s objectives in managing capital are:
— To safeguard the ability of entities within the group to continue as a going concern;
— To provide an adequate return to shareholders by pricing products and services commensurate with the level of risk; and
— Maintain an investment grade credit rating.
Vector manages and may adjust its capital structure in light of changes in economic conditions and for the risk characteristics of the underlying assets. To achieve this Vector may:
— Adjust its dividend policy;
— Return capital to shareholders; or
— Sell assets to reduce debt.
24.3 Financial ratios
Basic and diluted earnings per share
2021$M
12 MONTHS
2020$M
12 MONTHS
Net profit attributable to owners of the parent 193.2 95.4
Weighted average ordinary shares outstanding during the period (number of shares) 999,906,097 999,876,571
Total earnings per share 19.3 cents 9.5 cents
Net tangible assets per share 2021
$M2020
$M
Net assets attributable to owners of the parent 2,319.7 2,242.8
Less total intangible assets (1,294.3) (1,285.8)
Total net tangible assets 1,025.4 957.0
Ordinary shares outstanding (number of shares) 999,917,965 999,883,052
102.5 cents 95.7 cents
Economic net debt to economic net debt plus adjusted equity ratio (“gearing ratio”)
2021$M
2020$M
Face value of borrowings 3,090.6 2,910.6
Less cash and cash equivalents (17.4) (28.3)
Economic net debt 3,073.2 2,882.3
Total equity 2,335.4 2,259.7
Adjusted for hedge reserves 34.8 81.7
Adjusted equity 2,370.2 2,341.4
Economic net debt plus adjusted equity 5,443.4 5,223.7
56.5% 55.2%
87
Creating a new energy future – a bold vision

24.Equity continued
24.4 Reserves
Hedge reserves Hedge reserves comprise the cash flow hedge reserve and cost of hedging.
The cash flow hedge reserve records the effective portion of changes in the fair value of derivatives that are designated as cash flow hedges.
The gain or loss relating to the ineffective portion is recorded in profit or loss within interest costs (net).
During the year, $32.8 million (2020: $37.1 million) was transferred from the cash flow hedge reserve to interest expense.
Cost of hedging records the change in the fair value of the cost to convert foreign currency into New Zealand dollars as required under NZ IFRS 9.
Other reserves Other reserves comprise:
— A share-based payment reserve relating to the employee share purchase scheme. When shares are vested to the employee, the reserve is offset with a reduction in treasury shares.
— A foreign currency translation reserve to record exchange differences arising from the translation of the group’s foreign operations.
— A reserve recording the group’s share of its associate’s other comprehensive income.
— A reserve to record the fair value movements in the group’s investments in financial assets.
25. Related party transactions
2021$M
2020$M
Transactions with Entrust
Dividends paid 123.9 123.9
Distribution to customers – 5.0
2021$M
2020$M
Transactions with joint operation (until 31 March 2020)
Purchases of electricity and steam from Kapuni Energy Joint Venture (“KEJV”) – 7.3
Sale of gas to KEJV – 8.2
Sales of operations and maintenance services to KEJV – 1.5
Sales of administration and other services to KEJV – 0.1
Transactions with associate
Purchase of vegetation management services from Tree Scape Limited 7.7 9.9
Directors’ fees received from Tree Scape Limited 0.1 0.1
Transactions with key management personnel
Salary and other short-term employee benefits 5.8 7.1
Directors’ fees 0.8 0.9
Related parties As noted in note 6, the group’s investment in Tree Scape Limited has been reclassified as held for sale, with a target sale completion date of 31 August 2021. Until the sale is completed, Vector remains a 50% shareholder of Tree Scape Limited, who will continue to transact with the group as a related party.
The Kapuni Energy Joint Venture was a joint operation to which the group was a party with 50% interest. The interest was sold on 31 March 2020 as a part of the sale of Vector’s Kapuni gas interests to Todd Petroleum Mining Company Limited.
Other related parties are Entrust, the group’s ultimate parent entity and key management personnel that include the group’s directors and the executive team.
VECTOR ANNUAL REPORT 2021 /
88
Notes to the Financial Statements

26. Contingent liabilities
Disclosures The directors are aware of claims that have been made against entities of the group and, where appropriate, have recognised provisions for these within note 18.
No material contingent liabilities have been identified.
27. Events after balance date
Loss rental rebates On 23 August 2021, the board have approved the distribution of loss rental rebates to customers on the Vector electricity network at a rate of $20 per household. The distribution is expected to take place in September 2021.
COVID-19 pandemic Australia
On 19 July 2021, the State Government of New South Wales (“NSW Government”) imposed additional restrictions to the area of Greater Sydney which included a pause on construction activity. This has resulted in some disruption to the deployment of meters in the Greater Sydney area. On 28 July 2021, the NSW Government announced a 4-week extension to the lockdown until 28 August 2021. This announcement established a red zone and a green zone within Greater Sydney. We continue to work in green zone areas but have suspended all activity aside from emergency works in the red zones. At the time these financial statements are approved, it is not clear when these restrictions will be lifted and when the deployment of meters will return to normal. The situation in other parts of Australia reflects mainly short-term restrictions which we continue to carefully monitor. Overall, these recent events in Australia have no material impact on the financial statements.
New Zealand
On 17 August 2021 the New Zealand Government announced the country would return to Alert Level 4, where only essential services can operate, in response to signs of community transmission of the virus. Further announcements by the New Zealand Government have extended Alert Level 4 until at least 11:59pm 24 August 2021. As with its previous responses to alert level changes, Vector’s businesses have continued to operate as essential services except for the energy solutions business while the metering segment has seen a slight drop in work volumes. The financial impact from these events therefore has not been significant.
Debt programme As part of our debt management activities, the group replaced the $325.0 million bank facilities, which matured in July 2021, with bank facilities of the same level, and secured net additional facilities of $100.0 million.
Approval The financial statements were approved by the board on 23 August 2021.
Final dividend On 23 August 2021, the board declared a final dividend for the year ended 30 June 2021 of 8.50 cents per share.
No adjustment is required to these financial statements in respect of this event.
89
Creating a new energy future – a bold vision

© 2021 KPMG, a New Zealand partnership and a member firm of the KPMG network of independent member firms affiliated with KPMG International Cooperative (“KPMG International”), a Swiss entity.
Independent Auditor’s Report To the shareholders of Vector Limited
Report on the audit of the consolidated financial statements
Opinion In our opinion, the accompanying consolidated financial statements of Vector Limited (the ’company’) and its subsidiaries (the 'group') on pages 47 to 89:
i. present fairly in all material respects the group’s financial position as at 30 June 2021 and its financial performance and cash flows for the year ended on that date; and
ii. comply with New Zealand Equivalents to International Financial Reporting Standards and International Financial Reporting Standards.
We have audited the accompanying consolidated financial statements which comprise:
— the consolidated balance sheet as at 30 June 2021;
— the consolidated statements of profit or loss and other comprehensive income, changes in equity and cash flows for the year then ended; and
— notes, including a summary of significant accounting policies and other explanatory information.
Basis for opinion
We conducted our audit in accordance with International Standards on Auditing (New Zealand) (‘ISAs (NZ)’). We believe that the audit evidence we have obtained is sufficient and appropriate to provide a basis for our opinion.
We are independent of the group in accordance with Professional and Ethical Standard 1 International Code of Ethics for Assurance Practitioners (Including International Independence Standards) (New Zealand) issued by the New Zealand Auditing and Assurance Standards Board and the International Ethics Standards Board for Accountants’ International Code of Ethics for Professional Accountants (including International Independence Standards) (‘IESBA Code’), and we have fulfilled our other ethical responsibilities in accordance with these requirements and the IESBA Code.
Our responsibilities under ISAs (NZ) are further described in the auditor’s responsibilities for the audit of the consolidated financial statements section of our report.
Our firm has also provided other services to the group in relation to regulatory assurance services, other assurance services and compliance services in relation to R&D tax credits. Subject to certain restrictions, partners and employees of our firm may also deal with the group on normal terms within the ordinary course of trading activities of the business of the group. These matters have not impaired our independence as auditor of the group. The firm has no other relationship with, or interest in, the group.
Materiality
The scope of our audit was influenced by our application of materiality. Materiality helped us to determine the nature, timing and extent of our audit procedures and to evaluate the effect of misstatements, both individually and on the consolidated financial statements as a whole. The materiality for the consolidated financial
VECTOR ANNUAL REPORT 2021 /
90
Independent Auditor’s Report
Independent Auditor’s Report

2
statements as a whole was set at $9.1 million determined with reference to a benchmark of group profit before tax. We chose the benchmark because, in our view, this is a key measure of the group’s performance.
Key audit matters
Key audit matters are those matters that, in our professional judgement, were of most significance in our audit of the consolidated financial statements in the current period. We summarise below those matters and our key audit procedures to address those matters in order that the shareholders as a body may better understand the process by which we arrived at our audit opinion. Our procedures were undertaken in the context of and solely for the purpose of our statutory audit opinion on the consolidated financial statements as a whole and we do not express discrete opinions on separate elements of the consolidated financial statements.
The key audit matter How the matter was addressed in our audit
1. Capitalisation and asset lives (Property, plant and equipment of $4,625.8 million, Software of $107.4 million, with additions during the year of $529.5 million). Refer to Notes 11 and 12 of the financial statements.
Capitalisation of costs and useful lives assigned to these assets are a key audit matter due to the significance of property, plant and equipment and software to the group’s business, and due to the judgement involved in determining the carrying value of these assets, principally:
— the decision to capitalise or expense costs relating to the metering, electricity and gas distribution networks. This decision depends on whether the expenditure is considered to enhance the network (and is therefore capital), or to maintain the current operating capability of the network (and is therefore an expense). There is also judgement when estimating the extent of recovering internal salary costs, particularly within digital projects; and
— the estimation of the useful life of the asset once the costs are capitalised. Estimated lives range between 2 and 100 years, resulting from the diversity of property, plant and equipment and software assets across a portfolio of businesses. There is also judgment when estimating asset lives due to the uncertainty of the impact of technological change.
Our audit procedures in this area included, among others:
— examining the operating effectiveness of controls related to the approval of capital projects;
— assessing the nature of capitalised costs by checking a sample of costs to invoice to determine whether the description of the expenditure met the capitalisation criteria in the relevant accounting standards;
— assessing the useful economic lives stated in the accounting policies of the group by comparing to industry benchmarks and our knowledge of the business and its operations; and
— assessing whether the useful economic lives of each individual asset capitalised in the current period was within the stated policies.
We found no material errors in the nature and amount capitalised in the period and that the estimated useful lives of assets were within an acceptable range when compared to those used in the industry.
2. Impairment assessment of the Electricity distribution, Gas distribution, Gas trading, OnGas, Liquigas and the Metering cash generating units (inclusive of $1,164.1 million of goodwill). Refer to Note 11 of the financial statements.
We considered the impairment assessment of the Electricity distribution and Gas distribution cash generating units to be a key audit matter due to the significance of goodwill of $1,164.1 million to the financial position of the group and the significant
The procedures we performed to evaluate the impairment assessments included:
— assessing whether the methodology adopted in the discounted cash flow models was consistent with
91
Creating a new energy future – a bold vision

3
The key audit matter How the matter was addressed in our audit
judgment used to estimate future pricing of the regulated revenue streams beyond the timeframe of the current Commerce Commission regulatory price paths.
We considered the impairment assessment of the Metering cash generating unit to be a key audit matter due to significant value of intangible assets in the business which operates across two geographical markets.
We considered the impairment assessment of the Gas Trading segments to be a key audit matter due to the competitive margin trading environment and the potential impact of the response on the global climate change.
accepted valuation approaches of NZ IAS 36 Impairment of Assets and within the energy industry;
— evaluating the significant future cash flow assumptions by comparing to historical trends, budgets and where applicable, Asset Management Plans, and regulatory pricing models;
— comparing the discount rates applied to the estimated future cash flows and the terminal growth rates to relevant benchmarks using our own valuation specialists;
— challenging the above assumptions and judgements by performing sensitivity analysis, considering a range of likely outcomes based on various scenarios;
— calculating the regulated asset base (‘RAB’) multiple implied by valuation of the Regulated Network cash generated unit and comparing this to the range of RAB multiples observed in the marketplace; and
— comparing the group’s net assets as at 30 June 2021 of $2,335.4 million to its market capitalisation of $4,050.0 million at 30 June 2021 which implied total headroom of $1,714.6 million.
We found the methodology to be consistent with industry norms, specifically:
— the discount and terminal growth rates were in an acceptable industry range;
— future cash flow assumptions were supported by comparison to the sources we considered above; and
— the overall comparison of the group’s net assets to market capitalisation did not indicate an impairment.
VECTOR ANNUAL REPORT 2021 /
92
Independent Auditor’s Report

4
Other information
The Directors, on behalf of the group, are responsible for the other information included in the group’s Annual Report. Other information comprises the information included in the group’s Annual Report, but does not include consolidated financial statements and our Independent Auditor’s Report thereon. Our opinion on the consolidated financial statements does not cover any other information and we do not express any form of assurance conclusion thereon.
In connection with our audit of the consolidated financial statements our responsibility is to read the other information and, in doing so, consider whether the other information is materially inconsistent with the consolidated financial statements or our knowledge obtained in the audit or otherwise appears materially misstated. If, based on the work we have performed, we conclude that there is a material misstatement of this other information, we are required to report that fact. We have nothing to report in this regard.
Use of this independent auditor’s report
This independent auditor’s report is made solely to the shareholders as a body. Our audit work has been undertaken so that we might state to the shareholders those matters we are required to state to them in the independent auditor’s report and for no other purpose. To the fullest extent permitted by law, we do not accept or assume responsibility to anyone other than the shareholders as a body for our audit work, this independent auditor’s report, or any of the opinions we have formed.
Responsibilities of the Directors for the consolidated financial
statements The Directors, on behalf of the company, are responsible for:
— the preparation and fair presentation of the consolidated financial statements in accordance with generally accepted accounting practice in New Zealand (being New Zealand Equivalents to International Financial Reporting Standards) and International Financial Reporting Standards;
— implementing necessary internal control to enable the preparation of a consolidated set of financial statements that is fairly presented and free from material misstatement, whether due to fraud or error; and
— assessing the ability to continue as a going concern. This includes disclosing, as applicable, matters related to going concern and using the going concern basis of accounting unless they either intend to liquidate or to cease operations, or have no realistic alternative but to do so.
Auditor’s responsibilities for the audit of the consolidated financial
statements Our objective is:
— to obtain reasonable assurance about whether the consolidated financial statements as a whole are free from material misstatement, whether due to fraud or error; and
— to issue an independent auditor’s report that includes our opinion.
Reasonable assurance is a high level of assurance, but is not a guarantee that an audit conducted in accordance with ISAs NZ will always detect a material misstatement when it exists.
93
Creating a new energy future – a bold vision

5
Misstatements can arise from fraud or error. They are considered material if, individually or in the aggregate, they could reasonably be expected to influence the economic decisions of users taken on the basis of these consolidated financial statements.
A further description of our responsibilities for the audit of these consolidated financial statements is located at the External Reporting Board (XRB) website at:
http://www.xrb.govt.nz/standards-for-assurance-practitioners/auditors-responsibilities/audit-report-1/
This description forms part of our independent auditor’s report.
The engagement partner on the audit resulting in this independent auditor's report is Graeme Edwards
For and on behalf of
KPMG Auckland
23 August 2021
VECTOR ANNUAL REPORT 2021 /
94
Independent Auditor’s Report

StatutoryInformation
95
Creating a new energy future – a bold vision

VECTOR ANNUAL REPORT 2021 /
96
Statutory Information
Statutory Information
Interests RegisterEach company in the group is required to maintain an interests register in which the particulars of certain transactions and matters involving the directors must be recorded. The interests registers for Vector Limited and its subsidiaries are available for inspection at their registered offices.
Particulars of entries in the interests registers made during the year ended 30 June 2021 are set out in this Statutory Information section.
Information used by directorsDuring the financial year there were no notices from directors of Vector Limited, or any subsidiary, requesting to use information received in their capacity as a director which would not otherwise have been available to them.
Indemnification and insurance of directors and officersAs permitted by the constitution and the Companies Act 1993, Vector Limited has indemnified its directors, and those directors who are directors of subsidiaries against potential liabilities and costs they may incur for acts or omissions in their capacity as directors. In addition, Vector Limited has indemnified certain senior employees against potential liabilities and costs they may incur for acts or omissions in their capacity as employees of Vector Limited, or directors of Vector subsidiaries or associates.
During the financial year, Vector Limited paid insurance premiums in respect of directors and certain senior employees’ liability insurance which covers risks normally covered by such policies arising out of acts or omissions of directors and employees in their capacity as such. Insurance is not provided for criminal liability or liability or costs in respect of which an indemnity is prohibited by law.
DonationsVector Limited made donations of $10,981 during the year ended 30 June 2021. Subsidiaries of Vector Limited made donations of $26,677 during the year ended 30 June 2021. No political donations were made during the year ended 30 June 2021.
Credit ratingAt 30 June 2021 Vector Limited had a Standard & Poor’s credit rating of BBB/stable, and a Moody’s credit rating of Baa1/stable.
NZX Regulation waivers and rulingsNo new waivers were granted in the year ended 30 June 2021.
Exercise of NZX powersNZX did not exercise any of its powers set out in Listing Rule 9.9.3 (relating to powers to cancel, suspend or censure an issuer) with respect to Vector Limited.
Trustees of EntrustDuring the year ended 30 June 2021, Vector Limited made payments to A Bell and M Buczkowski, trustees of Entrust (Vector Limited’s majority shareholder) totalling $201,300 in respect of their roles as directors on the Vector Limited board.
Subsidiaries and associatesA list of each of the Company’s subsidiaries and associates is contained on pages 69 and 70. The Company has not gained or lost control of any entity during the year ended 30 June 2021.
Statutory Information

97
Creating a new energy future – a bold vision
DirectorsThe following directors of Vector Limited and current group companies held office as at 30 June 2021 or resigned (R) as a director during the year ended 30 June 2021. Directors marked (A) were appointed during the year.
PARENT DIRECTORS
Vector Limited A Bell, M Buczkowski, A Carter, J Mason, A Paterson (R), P Rebstock, B Turner
All of the above directors in office at 30 June 2021 are independent directors, except for A Bell and M Buczkowski who are trustees of Entrust (Vector Limited’s majority shareholder).
SUBSIDIARIES DIRECTORS
Advanced Metering Assets Limited J Hollingworth (A), S Mackenzie (A), J Mason (R), A Paterson (R), B Talacek (A)
Advanced Metering Services Limited J Hollingworth (A), S Mackenzie (A), J Mason (R), A Paterson (R), B Talacek (A)
Arc Innovations Limited J Hollingworth (A), S Mackenzie (A), J Mason (R), A Paterson (R), B Talacek (A)
Cristal Air International Limited J Hollingworth (A), S Mackenzie
E-Co Products Group Limited J Hollingworth (A), S Mackenzie
HRV Australia Pty Limited S Mackenzie, J Sheridan
HRV Clean Water Limited J Hollingworth (A), S Mackenzie
HRV Filters Limited J Hollingworth (A), S Mackenzie
Liquigas Limited A Andriopoulos, H Blackburn (R), S Bridge, A Gilbert (A), P Goodeve, N Hannan, E Krogh (R), R Middelbeek, G O’Brien (R), R Sharp, B Talacek, M Trigg
NGC Holdings Limited J Hollingworth (A), S Mackenzie (A), J Mason (R), A Paterson (R)
On Gas Limited J Hollingworth (A), S Mackenzie (A), J Mason (R), A Paterson (R), B Talacek (A)
PowerSmart NZ Limited J Hollingworth (A), S Mackenzie
Safe Filters Limited J Hollingworth (A), S Mackenzie
Safe Windows Limited J Hollingworth (A), S Mackenzie
SolPho Limited J Hollingworth (A), S Mackenzie
Vector Advanced Metering Assets (Australia) Limited
J Hollingworth (A), S Mackenzie (A), J Mason (R), A Paterson (R), B Talacek (A)
Vector Advanced Metering Services (Australia) Pty Limited
J Hollingworth (A), S Mackenzie, J Sheridan, B Talacek (A)
Vector Auckland Property Limited J Hollingworth (A), S Mackenzie (A), J Rodger (R)
Vector Communications Limited J Hollingworth (A), S Mackenzie (A), J Mason (R), A Paterson (R)
Vector Energy Solutions (Australia) Pty Limited
J Hollingworth (A), S Mackenzie, J Sheridan
Vector Energy Solutions Limited J Hollingworth (A), S Mackenzie
Vector ESPS Trustee Limited J Hollingworth (A), S Mackenzie
Vector Gas Trading Limited J Hollingworth (A), S Mackenzie (A), J Mason (R), A Paterson (R), B Talacek (A)
Vector Management Services Limited J Hollingworth (A), S Mackenzie
Vector Metering Data Services Limited J Hollingworth (A), S Mackenzie (A), J Mason (R), A Paterson (R)
Vector Northern Property Limited J Hollingworth (A), S Mackenzie
Vector Technology Services Limited J Hollingworth (A), S Mackenzie (A), Nikhil D R (A), J Rodger (R)
Ventilation Australia Pty Limited S Mackenzie, J Sheridan

VECTOR ANNUAL REPORT 2021 /
98
Statutory Information
Directors continued
ASSOCIATES DIRECTORS
Tree Scape Limited A Botha, E Chignell, J Hollingworth (A), K Smith, B Whiddett
Directors’ remuneration and value of other benefits received from Vector Limited and current group companies for the year ended 30 June 2021:
DIRECTORS OF VECTOR LIMITED
PAID BY PARENT
$
PAID BY SUBSIDIARIES
$
A Bell 100,650 –
M Buczkowski 100,650 –
A Carter 100,650 –
J Mason 176,138 –
A Paterson 50,325 –
P Rebstock 100,650 –
B Turner 100,650 –
729,713 –
DIRECTORS OF SUBSIDIARIES
PAID BY PARENT
$
PAID BY SUBSIDIARIES
$
A Andriopoulos – 5,000*
H Blackburn – 2,887*
S Bridge – 5,000
A Gilbert – 2,500
P Goodeve – 5,000
N Hannan – 5,000
R Middelbeek – 5,000*
G O’Brien – 2,500
R Sharp – 5,000*
B Talacek – 7,500*
M Trigg – 44,200
– 89,587
* Directors’ fees relating to any Vector Limited employee are paid to the company.
No special exertion benefits additional to payments above were paid to directors in the year ended 30 June 2021.

99
Creating a new energy future – a bold vision
Directors continued
Directors of Vector LimitedEntries in the interests register of Vector Limited during the year to 30 June 2021 that are not set out elsewhere in this annual report:
DIRECTOR ENTITY POSITION
A Bell Entrust Trustee
Communities and Residents Administration Limited
Director
New Zealand National Party Director
M Buczkowski Entrust Trustee
A Carter ANZ Bank New Zealand Limited Director
Avonhead Mall Limited Director and shareholder
Capital Education Limited Advisor
Capital Solutions Limited Advisor
Datacom Group Limited Chairman
Loughborough Investments Limited Director and shareholder
Maurice Carter Charitable Trust Trustee
My Food Bag Group Limited Chairman
T R Group Limited Chairman
J Mason Air New Zealand Limited Director
Alvarium Wealth (NZ) Limited Director
University of Auckland Trustee and Adjunct Professor of Management
Westpac New Zealand Limited Director
Zespri Group Limited Director
P Rebstock Accident Compensation Corporation Chair
Auckland District Health Board Chair (Audit, Finance and Risk Committee)
Kiwi Group Holdings Limited Chair
National Hauora Coalition Limited Chair
New Zealand Defence Force Board Chair
Ngāti Whātua Ōrākei Whai Maia Limited Chair
On Being Bold Limited Director and shareholder
Freightlink Limited Director
Sealink New Zealand Limited Director
Sealink Pine Harbour Limited Director
Sealink Travel Group New Zealand Limited Director
B Turner Fonterra Co-op Group Limited Director (Central Portfolio Management)
GlobalDairy Trade Holdings Limited Member of the Oversight Board
The Arapaho Springs Trust Trustee
The Arapaho Springs Investment Trust Trustee
The entities listed above against each director may transact with Vector Limited and its subsidiaries in the normal course of business. Auckland based directors (A Bell, M Buczkowski, A Carter, J Mason, P Rebstock and B Turner) are Vector Limited residential electricity customers.
Directors of subsidiariesThere are no entries in the interests register of subsidiaries up to 30 June 2021 that are not set out elsewhere in this annual report.

VECTOR ANNUAL REPORT 2021 /
100
Statutory Information
EmployeesThe number of current employees of the company and the group receiving remuneration and benefits above $100,000 in the year ended 30 June 2021 are set out in the table below:
CURRENT EMPLOYEES GROUP COMPANY
$100,001 – $110,000 69 53
$110,001 – $120,000 71 54
$120,001 – $130,000 49 43
$130,001 – $140,000 52 44
$140,001 – $150,000 48 32
$150,001 – $160,000 32 25
$160,001 – $170,000 24 16
$170,001 – $180,000 20 14
$180,001 – $190,000 19 15
$190,001 – $200,000 16 10
$200,001 – $210,000 14 9
$210,001 – $220,000 9 7
$220,001 – $230,000 11 11
$230,001 – $240,000 10 9
$240,001 – $250,000 5 4
$250,001 – $260,000 3 1
$260,001 – $270,000 4 4
$270,001 – $280,000 3 3
$280,001 – $290,000 2 2
$290,001 – $300,000 1 -
$300,001 – $310,000 5 4
$310,001 – $320,000 4 4
$320,001 – $330,000 1 1
$330,001 – $340,000 2 1
$340,001 – $350,000 4 3
$350,001 – $360,000 1 -
$360,001 – $370,000 2 2
$370,001 – $380,000 1 1
$380,001 – $390,000 1 1
$390,001 – $400,000 2 2
$400,001 – $410,000 2 2
$410,001 – $420,000 2 1
$440,001 – $450,000 1 1
$490,001 – $500,000 1 -
$510,001 – $520,000 2 2
$550,001 – $560,000 2 2
$570,001 – $580,000 1 1
$610,001 – $620,000 1 1
$780,001 – $790,000 1 1
$1,880,001 – $1,890,000 1 1
499 387

101
Creating a new energy future – a bold vision
Employees continued
The number of former employees of the company and the group receiving remuneration and benefits above $100,000 in the year ended 30 June 2021 are set out in the table below:
FORMER EMPLOYEES (INCLUDING ANY TERMINATION PAYMENTS) GROUP COMPANY
$100,001 – $110,000 2 4
$110,001 – $120,000 3 3
$120,001 – $130,000 3 3
$130,001 – $140,000 4 2
$140,001 – $150,000 4 4
$150,001 – $160,000 2 2
$180,001 – $190,000 1 1
$210,001 – $220,000 1 1
$220,001 – $230,000 1 -
$230,001 – $240,000 3 3
$$430,001 – $440,000 1 1
25 24
No employee of the group appointed as a director of a subsidiary or associate company receives or retains any remuneration or benefits as a director. The remuneration and benefits of such employees, received as employees, are included in the relevant bandings disclosed above, where the annual remuneration and benefits exceed $100,000.
Pension payments are at consistent rates for all employees accordingly to the legal requirements in the jurisdiction they are employed in.

VECTOR ANNUAL REPORT 2021 /
102
Statutory Information
Bondholder statistics
NZDX debt securities distribution as at 30 June 2021:
5.70% capital bonds
RANGENUMBER OF
BONDHOLDERSPERCENTAGE OF BONDHOLDERS
NUMBER OF SECURITIES HELD
PERCENTAGE OF SECURITIES HELD
5,000 – 9,999 612 17.09% 3,314,000 1.08%
10,000 – 49,999 2,251 62.86% 45,008,500 14.65%
50,000 – 99,999 448 12.51% 25,443,300 8.28%
100,000 – 499,999 235 6.56% 36,447,000 11.86%
500,000 – 999,999 9 0.25% 5,545,000 1.81%
1,000,000 plus 26 0.73% 191,447,200 62.32%
3,581 100.00% 307,205,000 100.00%
No current directors of the parent are holders (either beneficially or non-beneficially) of Vector Limited capital bonds as at 30 June 2021.
Twenty largest registered capital bond holders as at 30 June 2021:
BONDHOLDERNUMBER OF
BONDS HELDPERCENTAGE OF
BONDS HELD
Forsyth Barr Custodians Limited <1-CUSTODY> 31,688,000 10.31%
FNZ Custodians Limited 24,356,000 7.93%
Custodial Services Limited <A/C 3> 19,418,000 6.32%
Custodial Services Limited <A/C 4> 19,021,000 6.19%
Custodial Services Limited <A/C 2> 15,940,200 5.19%
JBWere (NZ) Nominees Limited <NZ RESIDENT A/C> 12,615,000 4.11%
Custodial Services Limited <A/C 1> 7,914,000 2.58%
Custodial Services Limited <A/C 18> 7,813,000 2.54%
Investment Custodial Services Limited <A/C C> 6,236,000 2.03%
Hobson Wealth Custodian Limited <RESIDENT CASH ACCOUNT> 6,015,000 1.96%
Masfen Securities Limited 5,980,000 1.95%
Forsyth Barr Custodians Limited <ACCOUNT 1 E> 4,586,000 1.49%
Citibank Nominees (New Zealand) Limited – NZCSD <CNOM90> 4,450,000 1.45%
Tappenden Holdings Limited 3,856,000 1.26%
NZPT Custodians (Grosvenor) Limited – NZCSD <NZPG40> 3,016,000 0.98%
Francis Horton Tuck + Catherine Ann Tuck <PUKETIHI A/C> 2,300,000 0.75%
Custodial Services Limited <A/C 16> 2,166,000 0.71%
Fletcher Building Educational Fund Limited 2,000,000 0.65%
National Nominees Limited – NZCSD <NNLZ90> 1,980,000 0.64%
FNZ Custodians Limited <DRP NZ A/C> 1,732,000 0.56%
183,082,200 59.60%
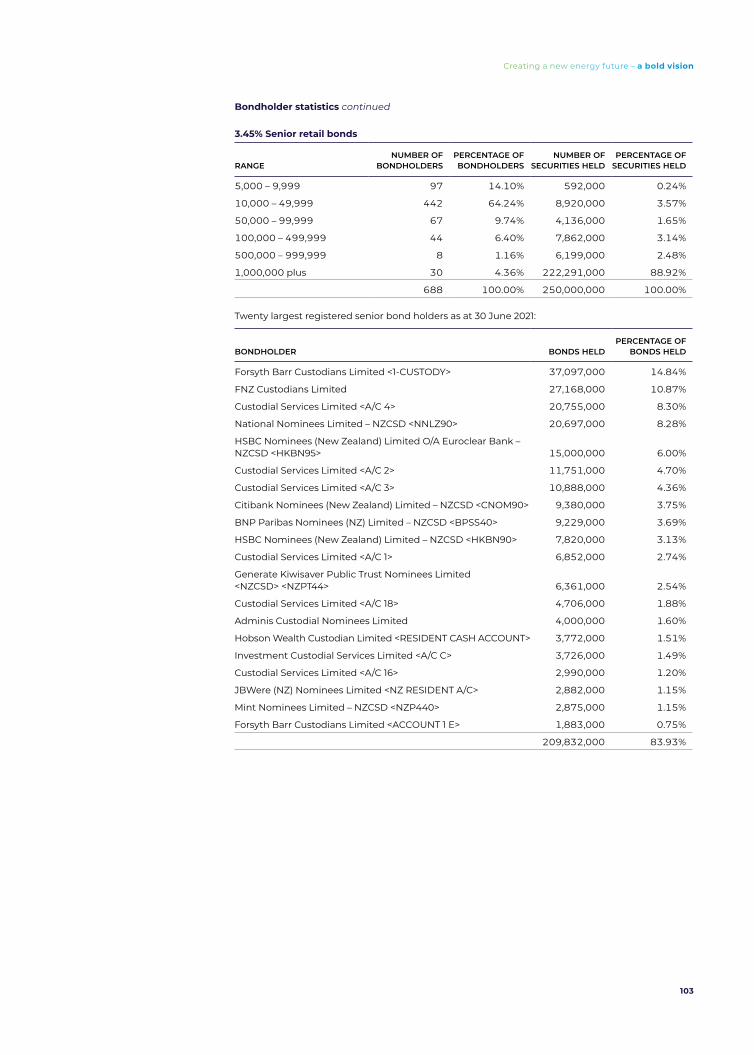
103
Creating a new energy future – a bold vision
Bondholder statistics continued
3.45% Senior retail bonds
RANGENUMBER OF
BONDHOLDERSPERCENTAGE OF BONDHOLDERS
NUMBER OF SECURITIES HELD
PERCENTAGE OF SECURITIES HELD
5,000 – 9,999 97 14.10% 592,000 0.24%
10,000 – 49,999 442 64.24% 8,920,000 3.57%
50,000 – 99,999 67 9.74% 4,136,000 1.65%
100,000 – 499,999 44 6.40% 7,862,000 3.14%
500,000 – 999,999 8 1.16% 6,199,000 2.48%
1,000,000 plus 30 4.36% 222,291,000 88.92%
688 100.00% 250,000,000 100.00%
Twenty largest registered senior bond holders as at 30 June 2021:
BONDHOLDER BONDS HELDPERCENTAGE OF
BONDS HELD
Forsyth Barr Custodians Limited <1-CUSTODY> 37,097,000 14.84%
FNZ Custodians Limited 27,168,000 10.87%
Custodial Services Limited <A/C 4> 20,755,000 8.30%
National Nominees Limited – NZCSD <NNLZ90> 20,697,000 8.28%
HSBC Nominees (New Zealand) Limited O/A Euroclear Bank – NZCSD <HKBN95> 15,000,000 6.00%
Custodial Services Limited <A/C 2> 11,751,000 4.70%
Custodial Services Limited <A/C 3> 10,888,000 4.36%
Citibank Nominees (New Zealand) Limited – NZCSD <CNOM90> 9,380,000 3.75%
BNP Paribas Nominees (NZ) Limited – NZCSD <BPSS40> 9,229,000 3.69%
HSBC Nominees (New Zealand) Limited – NZCSD <HKBN90> 7,820,000 3.13%
Custodial Services Limited <A/C 1> 6,852,000 2.74%
Generate Kiwisaver Public Trust Nominees Limited <NZCSD> <NZPT44> 6,361,000 2.54%
Custodial Services Limited <A/C 18> 4,706,000 1.88%
Adminis Custodial Nominees Limited 4,000,000 1.60%
Hobson Wealth Custodian Limited <RESIDENT CASH ACCOUNT> 3,772,000 1.51%
Investment Custodial Services Limited <A/C C> 3,726,000 1.49%
Custodial Services Limited <A/C 16> 2,990,000 1.20%
JBWere (NZ) Nominees Limited <NZ RESIDENT A/C> 2,882,000 1.15%
Mint Nominees Limited – NZCSD <NZP440> 2,875,000 1.15%
Forsyth Barr Custodians Limited <ACCOUNT 1 E> 1,883,000 0.75%
209,832,000 83.93%

VECTOR ANNUAL REPORT 2021 /
104
Statutory Information
Shareholder statistics
Twenty largest registered shareholders as at 30 June 2021:
SHAREHOLDERORDINARY
SHARES HELD
PERCENTAGE OF ORDINARY SHARES HELD
Entrust 751,000,000 75.10%
Custodial Services Limited <A/C 4> 16,000,295 1.60%
Citibank Nominees (New Zealand) Limited – NZCSD <CNOM90> 14,520,768 1.45%
Custodial Services Limited <A/C 3> 11,742,053 1.17%
Custodial Services Limited <A/C 2> 9,321,344 0.93%
Accident Compensation Corporation – NZCSD <ACCI40> 8,756,013 0.88%
Hobson Wealth Custodian Limited <RESIDENT CASH ACCOUNT> 7,552,008 0.76%
Generate Kiwisaver Public Trust Nominees Limited <NZCSD> <NZPT44> 6,855,070 0.69%
JBWere (NZ) Nominees Limited <NZ RESIDENT A/C> 5,916,203 0.59%
FNZ Custodians Limited 5,285,642 0.53%
Custodial Services Limited <A/C 18> 5,131,853 0.51%
HSBC Nominees (New Zealand) Limited A/C State Street – NZCSD <HKBN45> 4,709,967 0.47%
JPMorgan Chase Bank NA NZ Branch-Segregated Clients ACCT – NZCSD <CHAM24> 4,433,027 0.44%
New Zealand Depository Nominee Limited <A/C 1 CASH ACCOUNT> 4,295,300 0.43%
HSBC Nominees (New Zealand) Limited – NZCSD <HKBN90> 4,004,054 0.40%
Custodial Services Limited <A/C 1> 3,441,659 0.34%
National Nominees Limited – NZCSD <NNLZ90> 3,290,916 0.33%
ANZ Custodial Services New Zealand Limited – NZCSD <PBNK90> 2,649,441 0.27%
Forsyth Barr Custodians Limited <1-CUSTODY> 2,526,774 0.25%
Custodial Services Limited <A/C 16> 2,194,595 0.22%
873,626,982 87.36%
Substantial product holders as at 30 June 2021:
SHAREHOLDER
NUMBER OF RELEVANT INTEREST
VOTING PRODUCTS
HELD
PERCENTAGE OF VOTING PRODUCTS
HELD
Entrust 751,000,000 75.10%
Alastair Bell, Michael Buczkowski, William Cairns, Paul Hutchison and Karen Sherry are the registered holders of the shares held by Entrust..

105
Creating a new energy future – a bold vision
Shareholder statistics continued
As at 30 June 2021, voting products issued by Vector Limited totalled 1,000,000,000 ordinary shares.
Ordinary shares distribution as at 30 June 2021:
RANGENUMBER OF
SHAREHOLDERSPERCENTAGE OF SHAREHOLDERS
NUMBER OF SHARES HELD
PERCENTAGE OF SHARES HELD
1 – 499 6,192 21.04% 1,924,482 0.19%
500 – 999 3,108 10.56% 2,418,833 0.24%
1,000 – 4,999 14,933 50.75% 27,008,995 2.70%
5,000 – 9,999 2,578 8.76% 17,272,089 1.73%
10,000 – 49,999 2,363 8.03% 42,623,047 4.26%
50,000 – 99,999 147 0.50% 9,308,734 0.93%
100,000 plus 106 0.36% 899,443,820 89.95%
29,427 100.00% 1,000,000,000 100.00%
Analysis of shareholders as at 30 June 2021:
SHAREHOLDER TYPENUMBER OF
SHAREHOLDERSPERCENTAGE OF SHAREHOLDERS
NUMBER OF SHARES HELD
PERCENTAGE OF SHARES HELD
Entrust 1 0.00% 751,000,000 75.10%
Companies 917 3.12% 12,437,025 1.24%
Individual Holders 16,059 54.57% 52,727,630 5.27%
Joint 8,562 29.10% 40,180,498 4.02%
Nominee Companies 285 0.97% 133,855,350 13.39%
Other 3,603 12.24% 9,799,497 0.98%
29,427 100.00% 1,000,000,000 100.00%
The following current directors of the parent are holders (either beneficially or non-beneficially) of Vector Limited ordinary shares as at 30 June 2021:
DIRECTORNUMBER
OF SHARES
M Buczkowski 1,322
A Carter (as a shareholder of Loughborough Investments Limited) 20,000
J Mason (as a trustee of the Trumbull Trust) 33,500
Alastair Bell, Michael Buczkowski, William Cairns, Paul Hutchison and Karen Sherry are the registered holders of the 751,000,000 ordinary shares held by Entrust. Alastair Bell and Michael Buczkowski are directors of Vector Limited.
The following disclosures are made pursuant to section 148 of the Companies Act 1993, in relation to dealings during the year ended 30 June 2021 by directors of Vector Limited in the ordinary shares of Vector Limited:
There were no disposals of relevant interests.
Acquisitions of relevant interests – Vector Limited ordinary shares:
DIRECTOR
NATURE OF RELEVANT INTEREST
DATE OF ACQUISITION
CONSIDERATION PAID (PER
SHARE)
NUMBER OF SHARES
IN WHICH RELEVANT INTEREST
ACQUIRED
J Mason (as a Trustee of the Trumbull Trust)
Beneficial 9 September 2020
$4.51 15,000

VECTOR ANNUAL REPORT 2021 /
106
Financial Calendar
Financial Calendar
Financial calendar
2021
Final dividend paid 16 September
Annual meeting 29 September
2022
First quarter operating statistics October
Second quarter operating statistics January
Half year result and interim report February
Interim dividend* April
Third quarter operating statistics April
Fourth quarter operating statistics July
Full year result and annual report August
Final dividend* September
* Dividends are subject to Board determination.
Investor informationOrdinary shares in Vector Limited are listed and quoted on the New Zealand Stock Market (NZSX) under the company code VCT. Vector also has capital bonds and unsubordinated fixed rate bonds listed and quoted on the New Zealand Debt Market (NZDX). Current information about Vector’s trading performance for its shares and bonds can be obtained on the NZX website at www.nzx.com. Further information about Vector is available on our website www.vector.co.nz.
Directory
Registered office
Vector Limited101 Carlton Gore RoadNewmarketAuckland 1023New Zealand
Telephone 64-9-978 7788Facsimile 64-9-978 7799www.vector.co.nz
Postal address
PO Box 99882NewmarketAuckland 1149New Zealand
Investor enquiries
Telephone 64-9-978 7735Email: [email protected]
This annual report is dated 23 August 2021 and signed on behalf of the Board by:
Jonathan Mason Dame Paula RebstockChair Director

insightcreative.co.nz
V
EC
229
Creating a new energy future

VECTOR.CO.NZ