Creating better spaces - Paving | Block Paving | … Road Contractor LOR / BFK Specifier West Atkins...
47
Marshalls plc 2015 Results Review and Outlook Creating better spaces
Transcript of Creating better spaces - Paving | Block Paving | … Road Contractor LOR / BFK Specifier West Atkins...

Marshalls plc
2015 Results Review and Outlook
Creating better spaces

Marshalls plc
Agenda
Driving Growth
2015 Results Presentation
• Highlights
• Financial Performance
• Market Trends
• Driving Growth
– Commercial
– Domestic
– Smaller Businesses
• Acquisition Strategy
• Self Help Investment
• 2020 Strategy
• Outlook
• Summary
• Questions

Marshalls plc
Highlights
2015 2014 Increase
%
Revenue £386.2m £358.5m 8
EBITDA £51.8m £38.5m 35
Operating profit £37.5m £25.3m 48
Profit before tax £35.3m £22.4m 57
Basic EPS 14.32p 10.13p 41
Total dividends – ordinary and supplementary 9.00p 6.00p
Final dividend – recommended 4.75p 4.00p 19
Supplementary dividend – recommended 2.00p –
ROCE 19.0% 12.5% ↑650 basis
points
Net debt to EBITDA 0.2 times 0.8 times
1
Driving Growth
Marshalls plc
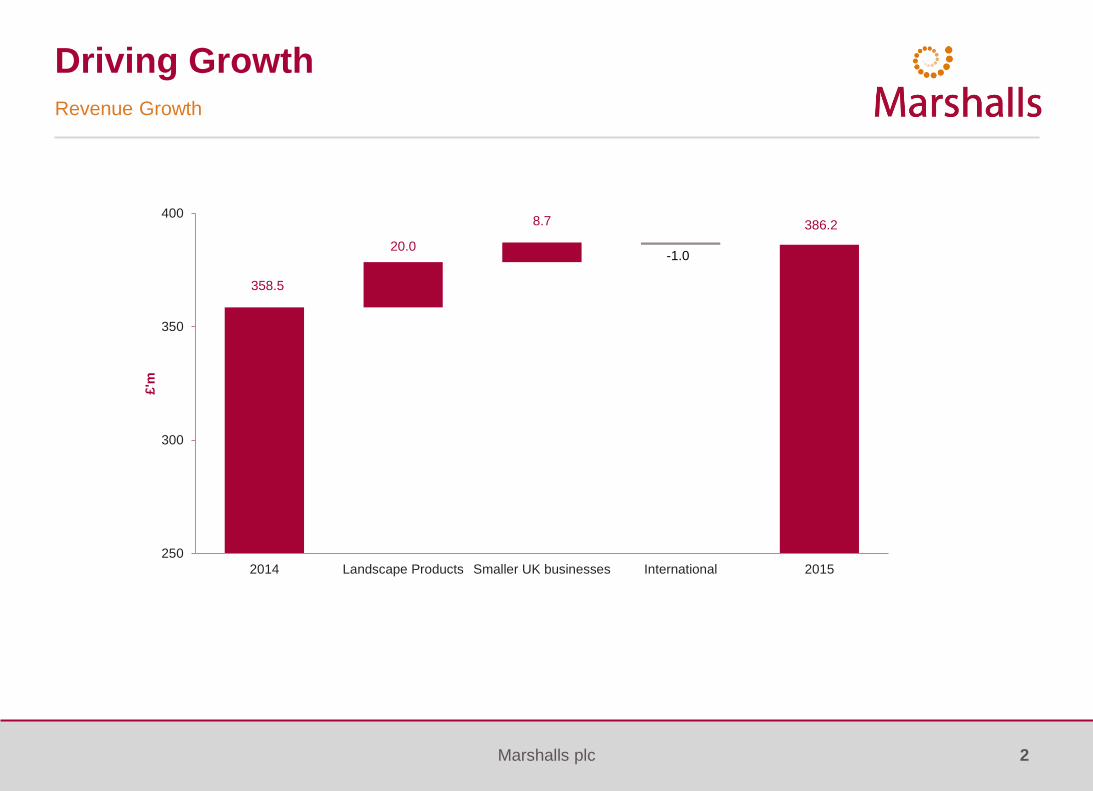
Revenue Growth
Driving Growth
358.5
20.0
8.7 386.2
250
300
350
400
2014 Landscape Products Smaller UK businesses International 2015
£'m
-1.0
2
Marshalls plc
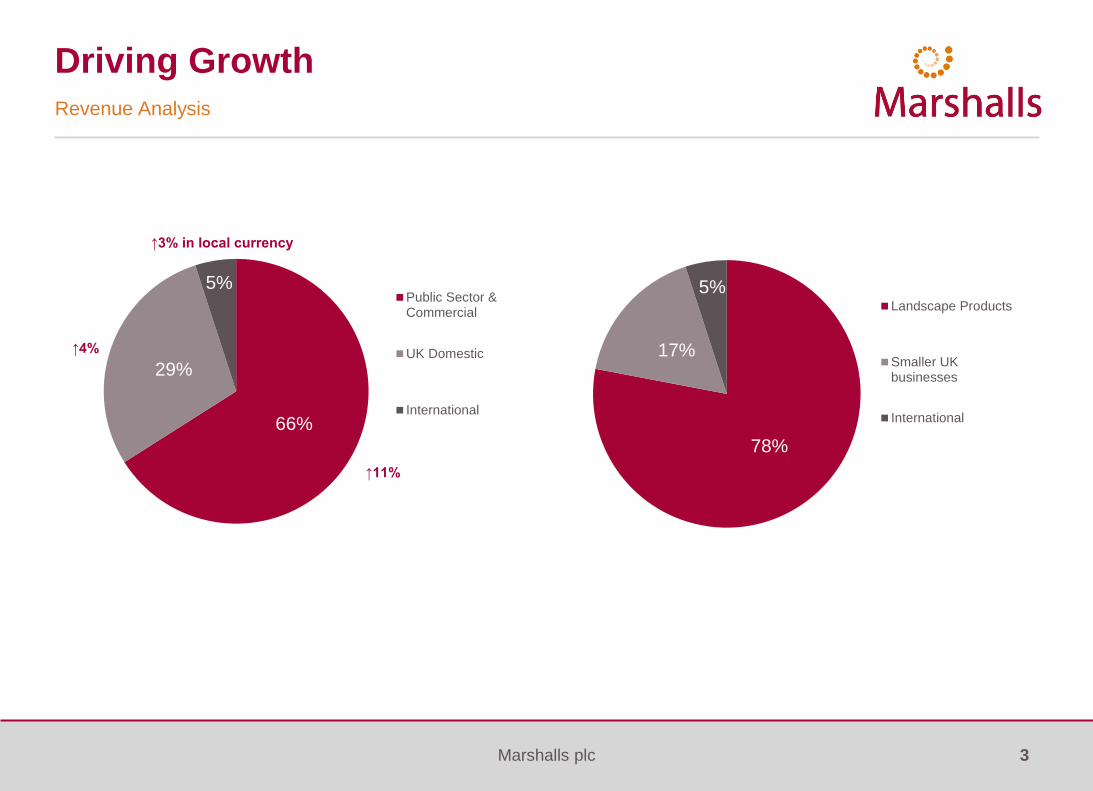
66%
29%
5%Public Sector &Commercial
UK Domestic
International
Revenue Analysis
78%
17%
5%Landscape Products
Smaller UKbusinesses
International
↑3% in local currency
↑4%
↑11%
↑11%
Driving Growth
3

Marshalls plc
Driving Growth
Profit for the Financial Period
2015
£m
2014
£m
Increase
%
EBITDA 51.8 38.5 35
Depreciation / amortisation (14.3) (13.2)
Operating profit 37.5 25.3 48
Financial income and expense (net) (2.2) (2.9)
Profit before tax 35.3 22.4 57
4

Marshalls plc
Margin Reconciliation
Revenue
£m
Operating profit
£m
Impact on margin
%
2014 – reported 358.5 25.3 7.1
Restructuring costs – Belgium – 2.0 0.5
2014 – underlying 358.5 27.3 7.6
Landscape Products 20.0 5.5 1.0
Smaller UK businesses 8.7 2.4 0.4
International (1.0) 2.3 0.7
2015 386.2 37.5 9.7
Driving Growth
5

Marshalls plc
Cash Flow from Operating Activities
2015
£m
2014
£m
Cash inflow arising from:
Operating profit 37.5 25.3
Depreciation and amortisation 14.3 13.2
EBITDA 51.8 38.5
Net financial expenses paid (1.8) (2.8)
Taxation paid (7.0) (4.0)
Pensions paid (4.3) (4.6)
Net gain on sale of property, plant and equipment (0.1) (0.4)
Receivables / payables 6.8 (2.8)
Inventory 1.7 3.1
Associates / restructuring costs 0.4 (0.2)
Equity settled share-based payments and other items 2.2 2.3
Net cash flow from operating activities 49.7 29.1
Driving Growth
6

Marshalls plc
Cash Flow
2015
£m
2014
£m
Net cash flow from operating activities 49.7 29.1
Capital expenditure (14.9) (12.0)
Net proceeds from sale of surplus assets 1.1 3.1
Dividends paid (12.3) (10.8)
Payments to acquire own shares (4.6) (4.3)
Movement in net debt 19.0 5.1
Net debt at 1 January (30.5) (35.6)
Net debt at 31 December (11.5) (30.5)
Gearing (%) 6.0% 16.8%
Driving Growth
7

Marshalls plc
Significant Borrowing Facilities
Facility
£m
Cumulative
Facility
£m
Expiry Date
Committed facilities:
Q3 2020 20 20
Q3 2019 20 40
Q3 2018 20 60
Q3 2017 20 80
On demand facilities:
Available all year 15 95
Seasonal (February to August inclusive) 20 115• Bank facilities actively managed
• Facilities and headroom reduced
• Reduction in finance charges
• Comfort around covenants
0
20
40
60
80
100
120
140
160
180
200
Dec 11 Jun-12 Dec-12 Jun-13 Dec-13 Jun-14 Dec-14 Jun-15 Dec-15
Bank Facility Headroom
Committed On demand Seasonal Net debt
Driving Growth
8

Marshalls plc
Bank Debt Capacity
• Strong free cash flow
• 2015 YE net debt – £11.5 million (2014: £30.5 million)
• Net debt: EBITDA – 0.2 times (2014: 0.8 times)
• Gearing – 6.0% (2014: 16.8%)
• Bank debt capacity of £115 million
• Significant capacity for organic investment and acquisition
Driving Growth
9
Marshalls plc
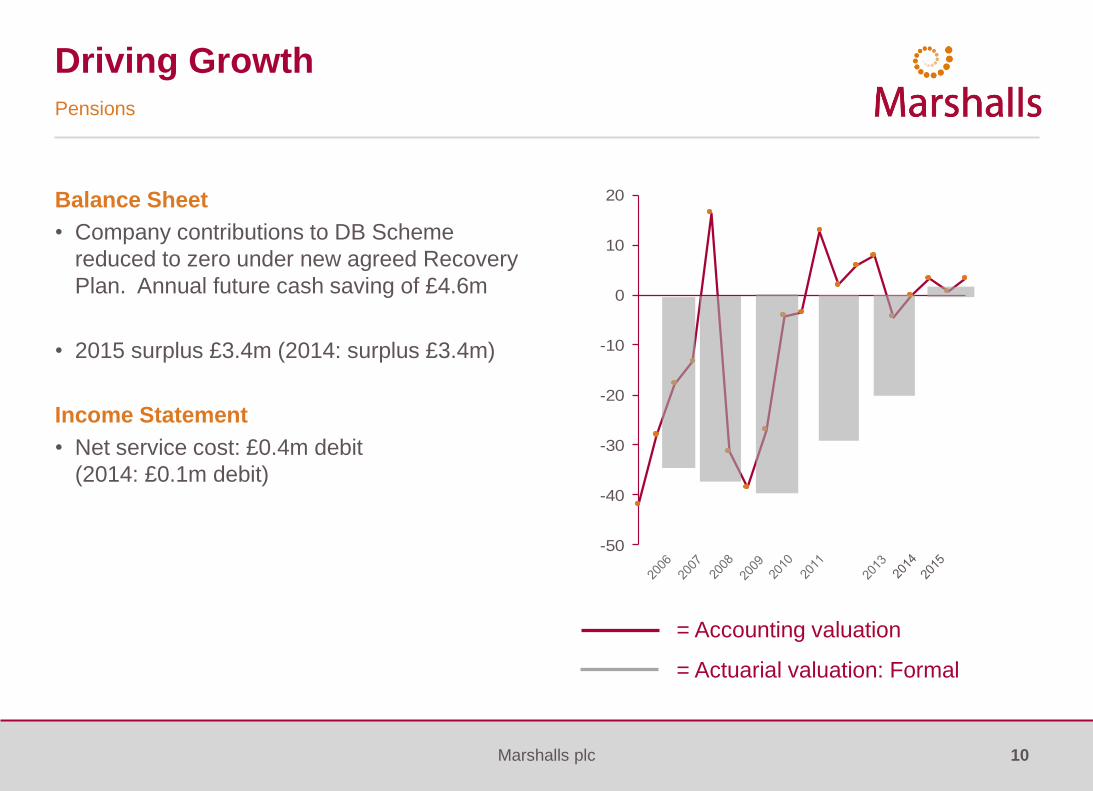
Balance Sheet
• Company contributions to DB Scheme
reduced to zero under new agreed Recovery
Plan. Annual future cash saving of £4.6m
• 2015 surplus £3.4m (2014: surplus £3.4m)
Income Statement
• Net service cost: £0.4m debit
(2014: £0.1m debit)
Pensions
-50
-40
-30
-20
-10
0
10
20
= Accounting valuation
= Actuarial valuation: Formal
Driving Growth
10

Marshalls plc
• Progressive ordinary dividend policy
(interim and final)
• 2015 dividends
– Interim and final 7.00p (17% ↑)
– Supplementary 2.00p
– Total 9.00p
• Supplementary dividend: discretionary and
non-recurring
• Dividend cover
– Interim and final: 2x cover
– Including supplementary: 1.6x cover
• Base dividend of 7.00p represents CAGR of
10% over 3 years
1.75 2.00 2.25
3.504.00
4.75
2.00
0.00
1.00
2.00
3.00
4.00
5.00
6.00
7.00
8.00
9.00
10.00
2013 2014 2015
Supplementary
Final
Interim
Dividends
Driving Growth
11

Marshalls plc
Market Trends
12
Marshalls plc
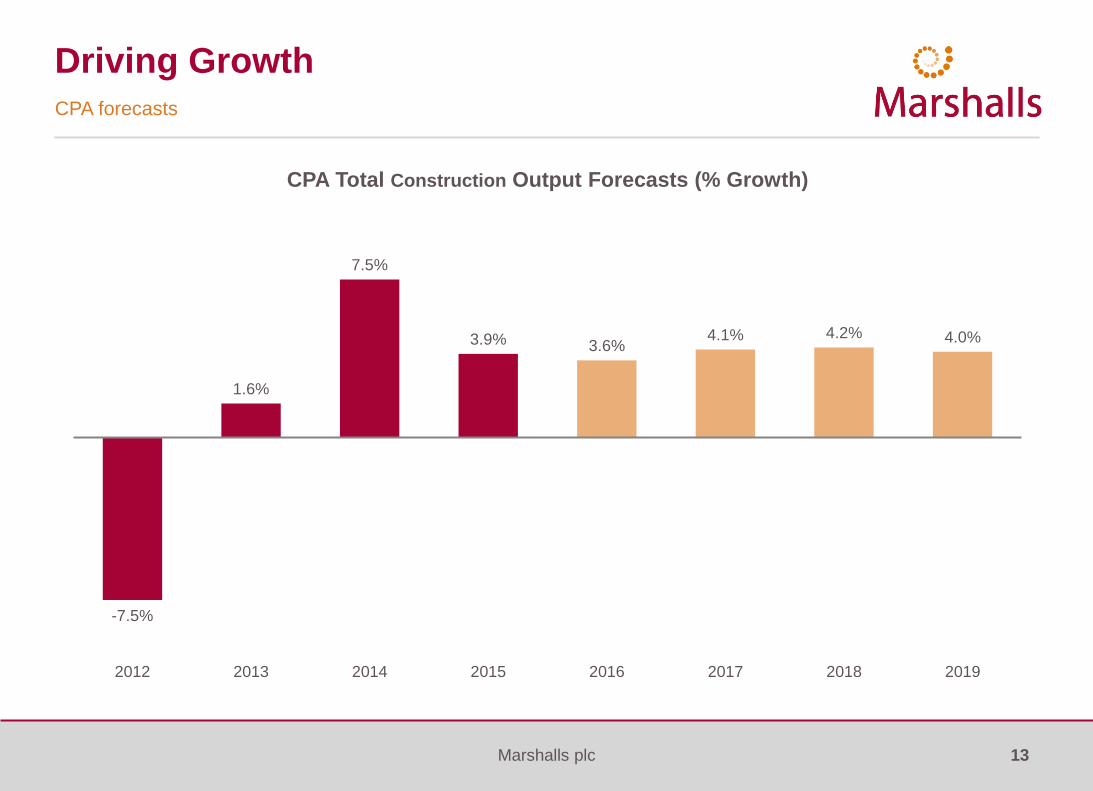
CPA forecasts
-7.5%
1.6%
7.5%
3.9% 3.6%4.1% 4.2% 4.0%
2012 2013 2014 2015 2016 2017 2018 2019
CPA Total Construction Output Forecasts (% Growth)
13
Driving Growth

Marshalls plc
Driving Growth – Commercial
14

Marshalls plc
ABI Contracts Awarded: Hard Landscaping
£150,000,000
£170,000,000
£190,000,000
£210,000,000
£230,000,000
£250,000,000
£270,000,000
£290,000,000
£310,000,000
£330,000,000
£350,000,000
Contract Awarded (12 Month Rolling Basis)Average of Hard Landscape Value (ABI with 12 Month Lag)
15
Driving Growth

Marshalls plc
Continuing Growth: Commercial Market Confidence
35
40
45
50
55
60
65
Markit PMI's
Construction Growth/Contraction Line
16
Driving Growth
Marshalls plc
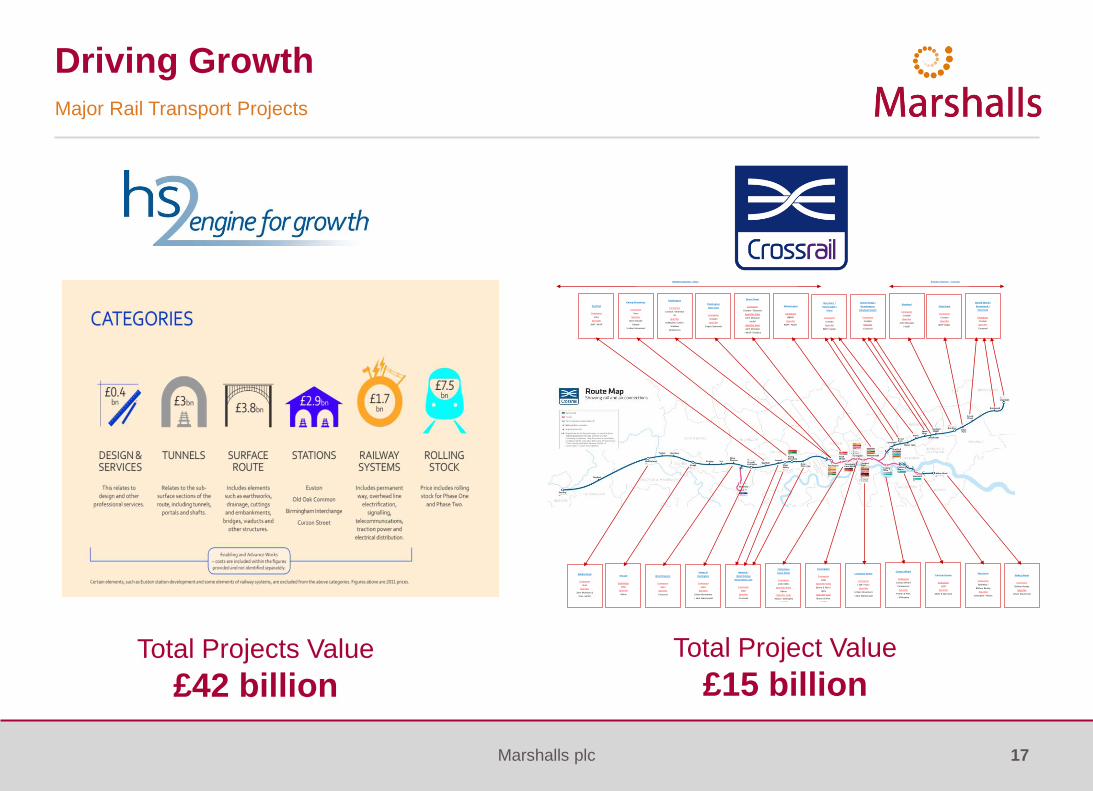
Driving Growth
Major Rail Transport Projects
Total Projects Value
£42 billion
Hayes &
Harlington
Contractor
Vinci
Specifier
Urban Movement
/ Mott MacDonald
Southall
Contractor
Vinci
Specifier
JMP / WSP
Hanwell /
West Ealing /
Acton Main Line
Contractor
Vinci
Specifier
Crossrail
Ealing Broadway
Contractor
Vinci
Specifier
Steer Davies
Gleave
/ Urban Movement
Paddington
Contractor
Costain / Skanska
JV
Specifier
Gillespies / URS /
Weston
Williamson
Bond Street
Contractor
Costain / Skanska
Specifier West
John McAslan
/ WSP
Specifier East
John McAslan
/ WSP / Publica
West Drayton
Contractor
Vinci
Specifier
Crossrail
Tottenham
Court Road
Contractor
LOR / BFK
Specifier West
Atkins
Specifier East
Atkins / Gillespies
/ AHMM
Farringdon
Contractor
LOR
Specifier West
Burns & Nice /
URS
Specifier East
Burns & Nice
/ URS
Liverpool Street
Contractor
LOR / Vinci
Specifier
Urban Movement
/ Mott MacDonald
Whitechapel
Contractor
BBMV
Specifier
BDP / Hyder
Canary Wharf
Contractor
Canary Wharf
Contractors
Specifier
Foster & Ptns
/ Gillespies
Custom House
Contractor
LOR
Specifier
Allies & Morrison
Woolwich
Contractor
Berkeley /
Balfour Beatty
Specifier
Gillespies / Atkins
Abbey Wood
Contractor
Balfour Beatty
Specifier
Urban Movement
Maryland /
Forest Gate /
Ilford
Contractor
Costain
Specifier
BDP / Hyder
Seven Kings /
Goodmayes /
Chadwell Heath
Contractor
Costain
Specifier
Crossrail
Romford
Contractor
Costain
Specifier
John McAslan
/ WSP
Gidia Park
Contractor
Costain
Specifier
BDP Hyder
Harold Wood /
Brentwood /
Shenfield
Contractor
Costain
Specifier
Crossrail
Slough
Contractor
Vinci
Specifier
Atkins
Maidenhead
Contractor
Vinci
Specifier
John McAslan &
Ptns / WSP
Paddington
New Yard
Contractor
Costain
Specifier
Capita Symonds
Western Section - Vinci
Contractor
Costain
Specifier
JMP / WSP
Eastern Section – Costain
Contractor
Costain
Specifier
JMP / WSP
Total Project Value
£15 billion
17

Marshalls plc
Driving Growth
Marshalls Rail Offer
Station Interface Station Concourse
Station Platform
18

Marshalls plc
Driving Growth
Water Management
19

Marshalls plc
Driving Growth
New Build Housing
UK Government land releasedSites now released for future housing
Potential for 103,000 homes
Gov depts:
• Ministry of Defence – enough land for 38,661 homes, released
ahead of schedule
• Homes and Communities Agency – enough land for 18,307 homes
• Department of Health and NHS – enough land for 13,039 homes
• Department for Environment, Food and Rural Affairs – enough land
for 11,675 homes
• London Legacy Development Corporation – enough land for
6,321 homes
• Department for Transport – enough land for 4,653 homes
• Public Corporations, such as Crown Estates – enough land for
4,113 homes
• Greater London Authority – enough land for 2,652 homes
• Ministry of Justice – enough land for 1,804 homes
• Other smaller departments – enough land for 1,967 homes
• On top of this, there are plans to release land with capacity for
150,000 homes between 2015 and 2020
20

Marshalls plc
Driving Growth - Domestic
21

Marshalls plc
Domestic Markets benefitting from Pension Release
• £3.53bn released from UK pensions in 2015
• 32% spent on Home Improvement
22
Driving Growth

Marshalls plc
Domestic Markets – Home Improvement Intentions
0
2
4
6
8
10
12
14
16
18
20
% o
f th
ose
Qu
es
tio
ned
by G
fk
Bathroom Drive Garden Kitchen
23
Driving Growth

Marshalls plc
Driving Growth
Installer Order Book
5.0
6.0
7.0
8.0
9.0
10.0
11.0
12.0
13.0
14.0
We
ek
s
24

Marshalls plc
Driving Growth
Increasing Installer Capacity
52%
Planning
to Expand
The number of installers on the
Marshalls Register is increasing
25

Marshalls plc
Driving Growth
New Products in the Domestic Range
26
Marshalls plc
Driving Growth - Smaller UK businesses
27

Marshalls plc
• Comprises Street Furniture, Cladding
and Mineral Products
• 2015 profit growth: £2.4m (170%)
• Target operational gearing of 30%
• Market share increasing – considerable
potential remains
• The smaller UK businesses are an
important growth driver to 2020
Driving Growth
Smaller UK businesses
-3
-2
-1
0
1
2
3
4
5
2013
2014
2015
-2.0
1.4
3.8
0
10
20
30
40
50
60
70
80
2013
2014
2015
48.7
59.1
67.8
28

Marshalls plc
Driving Growth
Focused Street Furniture Propositions
29

Marshalls plc
Driving Growth
Malta Airport
• Embracing our concept of “inner
strength-outer beauty”, including PAS
68 Igneo seating, RhinoBlok 72/40,
Litter Bins as well as bollards
30

Marshalls plc
Marshalls Cladding & Facades
Driving Growth
31

Marshalls plc
New Housebuilding : Marshalls Premier Mortars & Screeds
MaltbySalford
Newport
Falkirk
Coventry
Ilkeston
Gateshead
Bridgwater
Howley Park
Eaglescliffe
Wolverhampton
Ellesmere Port
M6M1
M4
M3M20
A74(M)
M40
M80
M11
M2
M9
M42
M61
M90
A1(M)
M27
M53
M25
M23
M50
M22
M9
A1(M)
M1
A1(M)
Marshalls Premier Mortar Sites
MPM Sites
MPM 25min DT Layer selection
32
Driving Growth

Marshalls plc
New Housebuilding : Natural Stone and Reconstituted Concrete Walling
33
Driving Growth
Marshalls plc
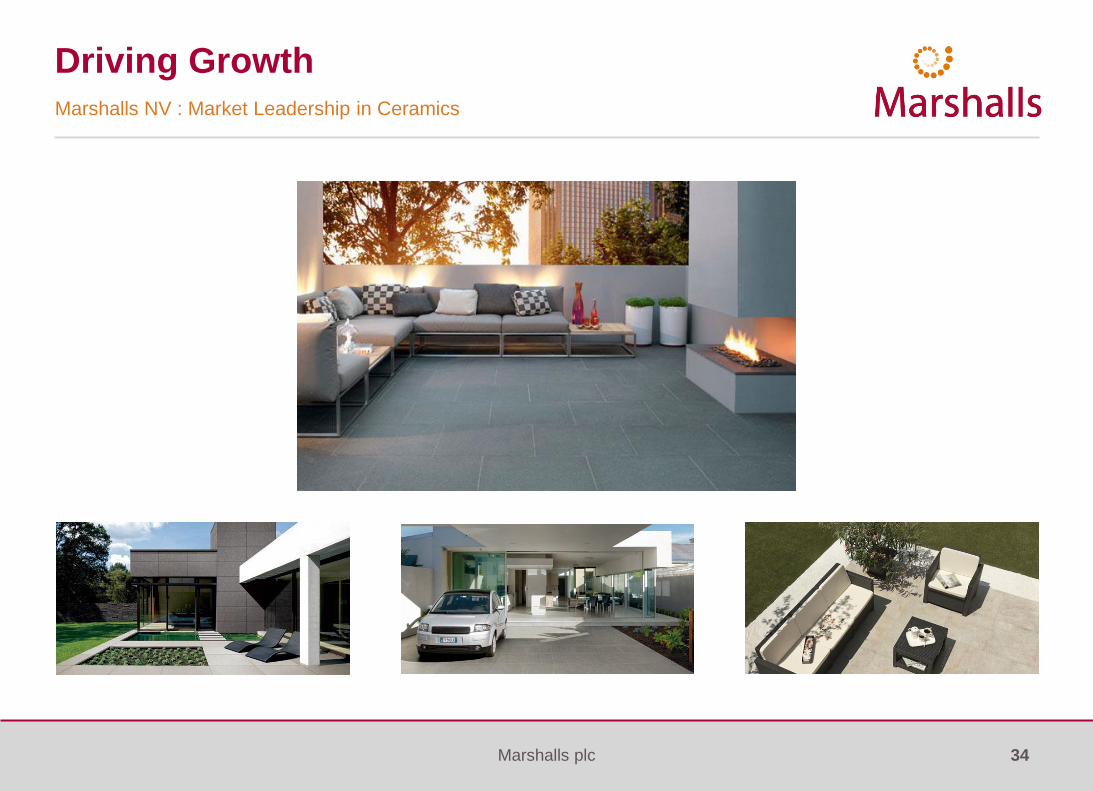
Marshalls NV : Market Leadership in Ceramics
34
Driving Growth

Marshalls plc
Acquisition Strategy
• Focused on Water Management, Street Furniture and Minerals markets
• Good progress made during the last year
– 12 companies analysed and longer term pipeline established
– 1 sales partnership agreed
– 4 discounted for value and/or product
– 5 seeds sown for future
– 2 ongoing discussions – actively under consideration
Targets are likely to be UK orientated, £10m - £30m turnover and profitable with
specific technical products or service advantages
35

Marshalls plc
Self Help Investment
• £15m of additional investment in next 3 years beyond normal capital
expenditure programme
• Significantly reduce processing costs for domestic natural stone
• Accelerate investment in block paving to reduce material input costs
• Improve efficiencies through more automated material handling
• Increase utilisation of block plants by increasing product offering
• Reduce cost base by £5m per annum
36

Marshalls plc
2020 Strategy
• Phase 1 return to pre-recession profitability – achieved
• A supportive market environment through to 2020
• Achieve price increases to cover cost increases
• Additional capital investment programme of £15m to deliver cost savings of £5m per year
• Achieve sales growth for the smaller UK businesses of at least 10% per annum
• New product development to accelerate annually
• Increased investment in digital strategy
• Acquisition strategy to enhance this organic growth
• Our 2020 Strategy will drive long term growth and shareholder returns
37

Marshalls plc
• The successes of 2015 give the Group a strong platform from which to build
• 2016 has started well – order intake up 6% versus strong comparators
Outlook
38

Marshalls plc
• Good revenue growth – up 8%
• Improving operating margins – up 260 basis points
• Strong PBT growth – up 57%
• Continued improvement in ROCE – up 650 basis points to 19.0%
• Strong cash flow performance
• Strong ordinary dividend growth + 19% plus a supplementary dividend of 2p
• Acquisition strategy actively being pursued
• 2020 Strategy underway
Summary
39

Marshalls plc
Appendices
40
Marshalls plc
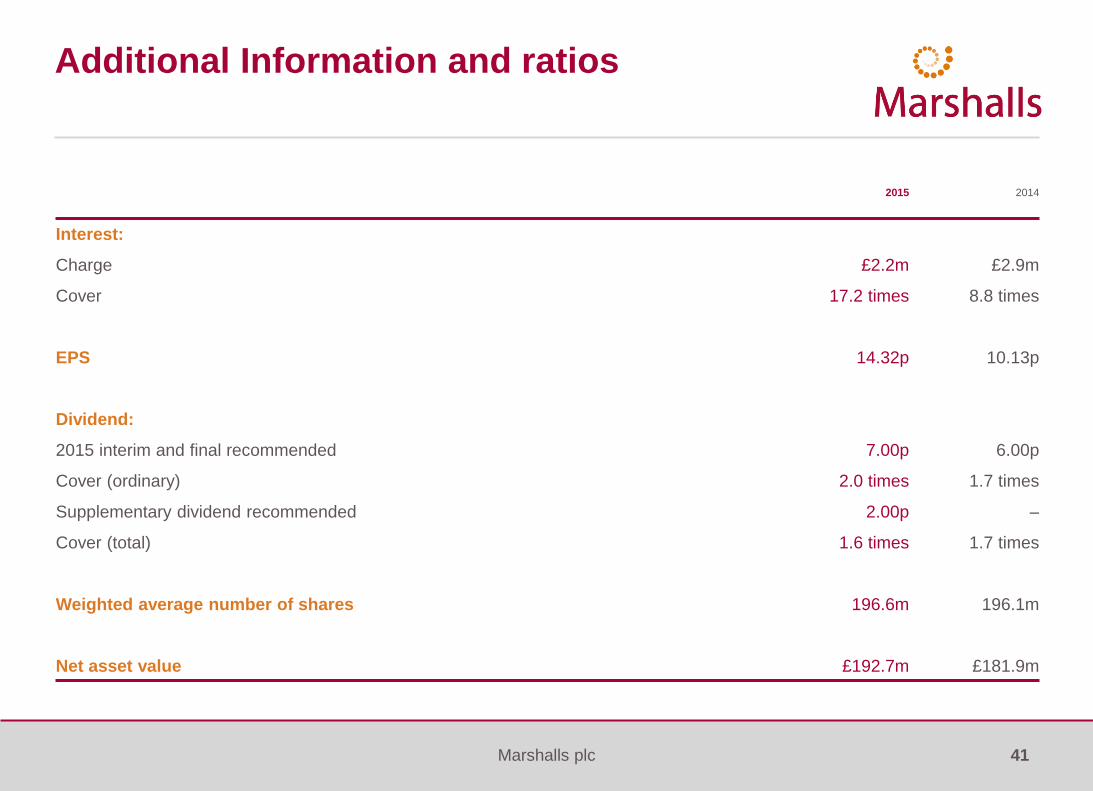
Additional Information and ratios
2015 2014
Interest:
Charge £2.2m £2.9m
Cover 17.2 times 8.8 times
EPS 14.32p 10.13p
Dividend:
2015 interim and final recommended 7.00p 6.00p
Cover (ordinary) 2.0 times 1.7 times
Supplementary dividend recommended 2.00p –
Cover (total) 1.6 times 1.7 times
Weighted average number of shares 196.6m 196.1m
Net asset value £192.7m £181.9m
41

Marshalls plc
Driving Growth
Construction Products Association
£m/% change
2014
Actual
2015
Estimate
2016
Forecast
2017
Forecast
2018
Forecast
2019
Forecast
Housing
27,591 28,555 29,420 30,602 31,119 31,646
25.5% 3.5% 3.0% 4.0% 1.7% 1.7%
Other New Work
51,160 55,418 58,402 61,951 66,420 70,988
1.5% 8.3% 5.4% 6.1% 7.2% 6.9%
Repair, Maintenance and Improvement
Private Housing 16,700 17,034 17,545 18,071 18,614 19,172
8.2% 2.0% 3.0% 3.0% 3.0% 3.0%
Total 47,935 47,636 48,536 49,461 50,412 51,303
5.4% (0.6)% 1.9% 1.9% 1.9% 1.8%
Total All Work 126,685 131,609 136,357 142,013 147,950 153,937
7.5% 3.9% 3.6% 4.1% 4.2% 4.0%
42
Marshalls plc
Driving Growth
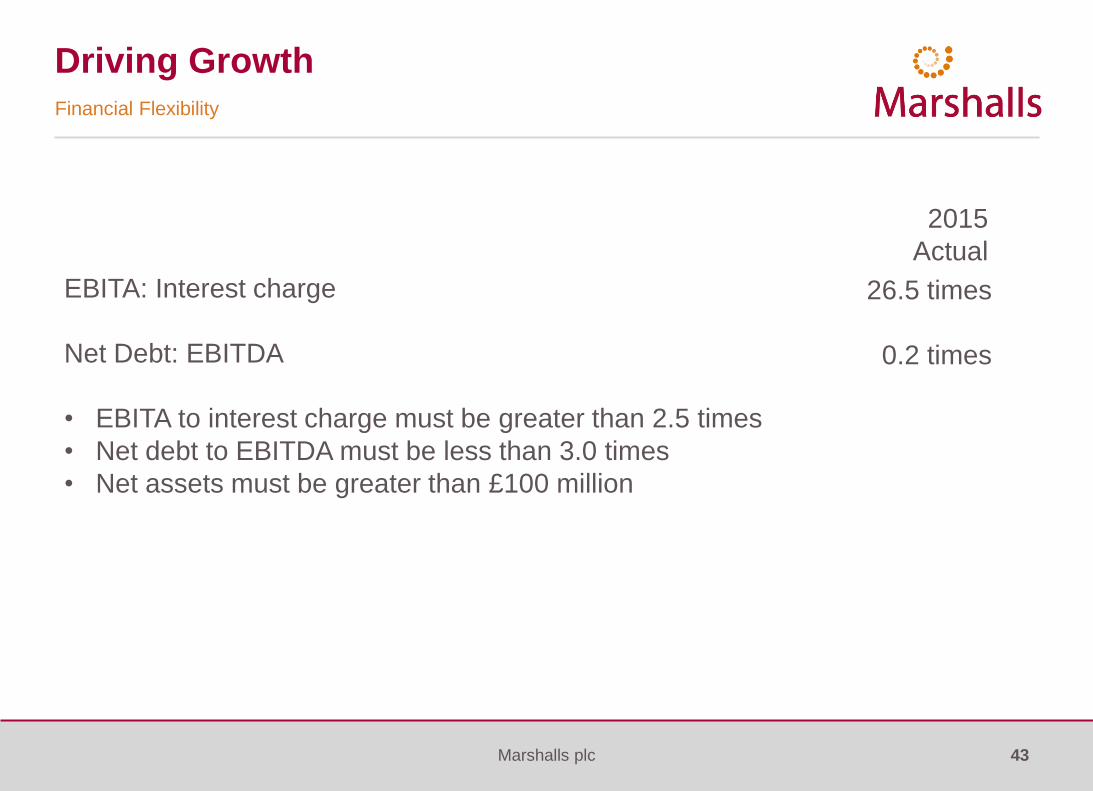
Financial Flexibility
EBITA: Interest charge
Net Debt: EBITDA
• EBITA to interest charge must be greater than 2.5 times
• Net debt to EBITDA must be less than 3.0 times
• Net assets must be greater than £100 million
2015
Actual
26.5 times
0.2 times
43

Marshalls plc
Driving Growth
Net Assets
£m
2014 Net Assets 181.9
Impact of movements in the year:
Profit for the financial year 28.1
Ordinary dividends (12.3)
Actuarial movement on pensions (after tax) (3.1)
Hedging reserve 0.8
Share-based payments (after tax) 2.3
Purchase of own shares (4.6)
Foreign currency translation differences (0.1)
Non-controlling interest (0.3)
10.8
2015 Net Assets 192.7
44

Marshalls plc
Disclaimer
• For the purposes of the following disclaimer, references to this “presentation” shall be deemed to include references to the presenters’ speeches,
the question and answer session and any other related verbal or written communications.
• This presentation, which is personal to the recipient and has been issued by Marshalls plc (“Marshalls”), comprises slides for a presentation in
relation to Marshalls preliminary results, and is solely for use at such presentation.
• This presentation and these slides are confidential and may not be reproduced, redistributed or passed on directly or indirectly to any other
person or published in whole or in part for any purpose.
• This presentation and associated discussion includes forward-looking statements. Information contained in this presentation relating to Marshalls
has been compiled from public sources. All statements other than statements of historical fact included in this announcement, including without
limitation those regarding the plans, objectives and expected performance of Marshalls, are forward-looking statements. Marshalls has based
these forward-looking statements on its current expectations and projections about future events, including numerous assumptions regarding its
present and future business strategies, operations, and the environment in which it will operate in the future.
• Forward-looking statements generally can be identified by the use of forward-looking terminology such as 'ambition', 'may', 'will', 'could', 'would',
'expect', 'intend', 'estimate', 'anticipate', 'believe', 'plan', 'seek' or 'continue', or negative forms or variations of similar terminology. Such forward-
looking statements involve known and unknown risks, uncertainties, assumptions and other factors related to Marshalls.
• By their nature, forward-looking statements involve risks, uncertainties and assumptions and many relate to factors which are beyond the control
of Marshalls, such as future market and economic conditions, external factors affecting operations and the behaviour of other market participants.
Actual results may differ materially from those expressed in forward-looking statements. Given these risks, uncertainties, and assumptions, you
are cautioned not to put undue reliance on any forward-looking statements. In addition, the inclusion of such forward-looking statements should
under no circumstances be regarded as a representation by Marshalls that Marshalls will achieve any results set out in such statements or that
the underlying assumptions used will in fact be the case.
• Other than as required by applicable law or the applicable rules of any exchange on which securities of Marshalls may be listed, Marshalls has
no intention or obligation to update or revise any forward-looking statements included in this presentation.
• This presentation is for information only and does not constitute or form part of any offer or invitation to sell, or any solicitation of any offer to
purchase, any shares in Marshalls or any other securities, nor shall it or any part of it nor the fact of its distribution form the basis of, or be relied
upon in connection with, any contract or investment decision related thereto. No investment advice is being given in this presentation.
45