Creating and Modeling Metabolic and Regulatory Networks Using Text Mining and Fuzzy Expert
34
1 Chapter 9 Creating Metabolic Network Models using Text Mining and Expert Knowledge J.A. Dickerson, D. Berleant, Z. Cox, W. Qi, D. Ashlock, E. Wurtele and A.W. Fulmer 9.1 Introduction RNA profiling analysis and new techniques such as proteomics are yielding vast amounts of data on gene expression and protein levels. This points to the need to develop new methodologies to identify and analyze complex biological networks. This chapter describes the development of a Java™-based tool that helps dynamically find and visualize metabolic networks. The tool consists of three parts. The first part is a text-mining tool that pulls out potential metabolic relationships from the PubMed database. These relationships are then reviewed by a domain expert and added to an existing network model. The result is visualized using an interactive graph display module. The basic metabolic or regulatory flow in the network is modeled using fuzzy cognitive maps. Causal connections are pulled out from sequence data using a genetic algorithm-based logical proposition generator that searches for temporal patterns in microarray data. Examples from the
Transcript of Creating and Modeling Metabolic and Regulatory Networks Using Text Mining and Fuzzy Expert

1
Chapter 9
Creating Metabolic Network Models using Text
Mining and Expert Knowledge
J.A. Dickerson, D. Berleant, Z. Cox, W. Qi, D. Ashlock, E. Wurtele and A.W. Fulmer
9.1 Introduction
RNA profiling analysis and new techniques such as proteomics are yielding vast amounts of data on gene expression and protein levels. This points to the need to develop new methodologies to identify and analyze complex biological networks. This chapter describes the development of a Java™-based tool that helps dynamically find and visualize metabolic networks. The tool consists of three parts. The first part is a text-mining tool that pulls out potential metabolic relationships from the PubMed database. These relationships are then reviewed by a domain expert and added to an existing network model. The result is visualized using an interactive graph display module. The basic metabolic or regulatory flow in the network is modeled using fuzzy cognitive maps. Causal connections are pulled out from sequence data using a genetic algorithm-based logical proposition generator that searches for temporal patterns in microarray data. Examples from the

2 Computational Biology and Genome Informatics
regulatory and metabolic network for the plant hormone gibberellin show how this tool operates.
The goal of this project is to develop a publicly available software suite called the Gene Expression Toolkit (GET). This toolkit will aid in the analysis and comparison of large microarray, proteomics and metabolomics data sets. It also aids in the synthesis of the new test results into the existing body of knowledge on metabolism. The user can select parameters for comparison such as species, experimental conditions, and developmental stage. The key tools in the Gene Expression Toolkit are:
• PathBinder: Automatic document processing system that mines
online literature and extracts candidate relationships from publication abstracts.
• ChipView: Explanatory models synthesized by clustering techniques together with a genetic algorithm-based data-mining tool.
• FCModeler: Predictive models summarize known metabolic relationships in fuzzy cognitive maps (FCMs).
Figure 1 shows the relationship between the different modules. The
PathBinder citations are available to the researcher and smoothly transferable for use in annotating displays in other parts of the package and as links in building models. ChipView searches for link hypotheses in microarray data. The FCModeler tool for gene regulatory and metabolic networks is intended to easily capture the intuitions of biologists and help test hypotheses along with providing a modeling framework for putting the results of large microarray studies in context.
9.2 Structure of Concepts and Links
The nodes in the metabolic network represent specific biochemicals such as proteins, RNA, and small molecules, or stimuli, such as light, heat, or nutrients. There are three basic types of directed links specified: conversion, regulatory, and catalytic. In a conversion link (black arrow, shown as a heavy dotted line), a node (usually representing a chemical) is converted into another node, and used up in the process. In a regulatory link (green and red arrows, shown as solid and dashed arrows respectively), the node activates or deactivates another node, and is not used up in the process. A catalytic

Dickerson, Berleant, Cox, Qi, Ashlock, Wurtele & Fulmer 3
LiteratureMedline/PubMed Pathway/
Regulation Network
Identification
ChipView
Microarray and
Proteomics Data
FCModeler
PathBinder
Expert Knowledge
LiteratureMedline/PubMed Pathway/
Regulation Network
Identification
ChipView
Microarray and
Proteomics Data
FCModeler
PathBinder
Expert Knowledge
Figure 1. The Gene Expression Toolkit consists of PathBinder, FCModeler, and ChipView. The inputs to the system are the literature databases such as PubMed; experimental results form RNA microarray experiments, proteomics, and the expert knowledge and experience of the biologists that study an organism. The result will be a predictive model of the metabolic pathways.
link (blue arrows, shown as a thick line) represents an enzyme that enables a chemical conversion and does not get used up in the process. Figure 2 shows a small part of a graph for the Arabidopsis metabolic and regulatory network. There is also an undirected link that defines a connection between two nodes and does not specify a direction of causality.
In the metabolic network database, the type of link is further delineated by the link mechanism and the certainty. Some of the current mechanisms are: direct, indirect, and ligand. Direct links assume a direct physical interaction. Indirect links assume that the upstream node activates the downstream node indirectly and allows for the existence of intermediate nodes in such a path. The ligand link is a “second messenger” mechanism in which a node produces or helps produce a ligand (small molecule that binds) and either “activates” or “inhibits” a target node. Often the nature of the link is unknown and it cannot be modeled in the current framework. The link certainty expresses a degree of confidence about the link. This will be used for hypothesis testing.
Other key features include concentrations of the molecules (nodes), strengths of the links, and subcellular compartmentation. These data can be added as they are identified experimentally. Currently the biologist user can

4 Computational Biology and Genome Informatics
Figure 2. This is a map of a simple metabolic model of gibberellin (active form is GA4). The sequence is started by translation of 3_beta_ hydroxylase_RNA into the 3_beta_ hydroxylase protein. Bold dashed lines are conversion links, bold lines are catalytic links, thin solid lines are positive regulatory links and dashed thin lines are negative regulatory links.
include or ignore a variety of parameters, such as subcellular compartmentation and link strength. Since the node and link data is entered into a relational database, individual biologists can easily sort, share, and post data on the web. Future versions will distinguish between regulation that results in changes in concentrations of the regulated molecule, and regulation that involves a reversible activation or deactivation.

Dickerson, Berleant, Cox, Qi, Ashlock, Wurtele & Fulmer 5
9.3 PathBinder: Document Processing Tool
PathBinder identifies information about the pathways that mediate biological processes from the scientific literature. This tool searches through documents in Medline for passages containing terms that indicate relevance to signal transduction or metabolic pathways of interest. Microarray data can be used to hypothesize causal relationships between genes. PathBinder then mines Medline for information about these putative pathways, extracting passages most likely to be relevant to a particular pathway and storing this desired information. The information is presented in a user-friendly format that supports efficiently investigating the pathways.
Related Work on Knowledge Extraction from Biochemistry Literature An increasing body of works addresses extraction of knowledge from
biochemical literature. Some works compare documents, such as MEDLINE abstracts, and extract information from the comparisons. For example, Shatkay et al. and Stapley assess the relatedness of genes based on the relatedness of texts in which they are mentioned [Shatkay, 2000; Stapley, 2000]. Shatkay et al. get documents containing a particular gene, compare the set of documents to the set relevant to other genes, and if two sets are similar then the two genes are deemed related. Stapley compares the literatures of two genes and assesses relatedness of genes based on the rate at which papers contain both of them. The system presented by Usuzaka et al. learns to retrieve relevant abstracts from MEDLINE based on examples of known relevant articles [Usuzaka, 1998].
Other works directly address the relationships among entities such as proteins, genes, drugs, and diseases. An initial requirement for such a system is identifying relevant nouns. This can be done by extracting names from free text based on their morphological properties. Sekimizu et al. [1998] parse text to identify noun phrases, rather than concentrating on the nouns themselves. The GENIA system and the PROPER system address the need to identify relevant terms automatically to enable automatic maintenance of lexicons of proteins and genes [Fukuda et al., 1998; Collier, 1999]. Proux et al. [1998] concentrate on gene names and symbols.
Once the lexicon problem has been addressed, text can be analyzed to extract relationships among entities discussed therein. Andrade and Valencia [1998] extract sentences that contain information about protein function.

6 Computational Biology and Genome Informatics
Rindflesch et al. [1999] concentrate specifically on binding relationships (among macromolecules). Rindflesch et al. [2000] emphasizes drug-gene-cell relationships bearing on cancer therapy. Thomas et al. [2000] use automatic protein name identification to support automatic extraction of interactions among proteins. Sekimizu et al. [1998] use automatically identified relevant noun phrases in conjunction with a hand-generated list of verbs to automatically identify subject-verb-object relationships stated in texts in MEDLINE. Craven and Kumlien [1999] extract relationships between proteins and drugs. They investigate two machine-learning techniques in which a hand-classified training set is given to the system, which uses this set to infer criteria for deciding if other passages describe the relevant relationships. One machine learning technique is based on modeling passages as unordered sets of words, and assumes word co-occurrence probabilities are independent of one another (the Naïve Bayes approach). Tanabe et al. [1999] extract relationships between genes and between genes and drugs. Their MEDMINER system supports human literature searches by retrieving and serving sentences from abstracts on MEDLINE over the Web, based on their keyword content. MEDMINER is tuned to finding relationship-relevant sentences in abstracts that contain a gene name and relationship keyword, pair of gene names and relationship keyword, or a gene and a drug name and relationship keyword. MEDMINER can also handle arbitrary Boolean queries, such as those containing two protein names. In such cases MEDMINER takes a query consisting of an OR’ed list of “primary” terms and an AND’ed list of “secondary” terms. A returned sentence must contain a “primary” term and a relationship word. Relationship words are from a relatively large lexicon of such terms predefined by the system.
A number of works address extracting relationships among proteins from biochemical texts. A solution enables both automatic construction of biochemical pathways, and assistance to investigators in identifying relevant information about proteins of interest to them.
Humphreys et al. [2000] specifically address enzyme reactions extracted from Biochimica et Biophysica Acta and FEMS Microbiology Letters. Such interactions are intended to support metabolic network construction. Rindflesch et al. [1999] apply non-trivial natural language processing (NLP) to extract assertions about binding relationships among proteins. Noun phrases are identified by a sophisticated combination of text processing and reference to existing name repositories.

Dickerson, Berleant, Cox, Qi, Ashlock, Wurtele & Fulmer 7
Other systems have been reported that extract many interactions among diverse proteins. Blaschke et al. [1999] extracts such interactions by first identifying phrases conforming to the template protein... verbclass ...protein, where verbclass is one of 14 sets of pathway relevant verbs (such as “bind”) and their inflections. Protein names and synonyms are provided as an input and sentences containing extracted phrases are returned. The BioNLP subsystem, a component of a larger system, extracts sentences containing pathway relevant verbs determined by the user and applies templates to them to identify path relevant relationships among proteins [Ng, 1999; Wong, 2001]. Protein names are determined automatically. The subsystem, CPL2Perl, thresholds the results so that it ignores interactions with a single relevant sentence. This is useful if the sentence analysis was mistaken. Such a thresholding strategy tends to increase precision at the expense of reducing recall. Thomas et al. [2000] distinguish between verbs that are relatively more and less reliable in indicating protein interactions. Their system automatically recognizes protein names and relies on the strategy of tuning an existing sophisticated general-purpose natural language processing system to the protein interaction domain. Ono et al. [2001] use part-of-speech (POS) tagging, key verbs, and template matching on phrases to extract protein-protein interactions. Their system has an information retrieval effectiveness measure of up to 0.89 [Ding et al., 2002].
PathBinder Operation
The PathBinder system, like previous works, extracts relevant passages about protein relationships from MEDLINE. The PathBinder work differs from these due to a combination of system design decisions. PathBinder avoids syntactic analysis of text in favor of word experts for pathway relevant verbs. Word experts are sets of rules for interpreting words [Berleant, 1995]. PathBinder also is oriented toward assisting humans in constructing pathways rather than fully automatic construction, thus avoiding some information retrieval precision limitations. We are also investigating the relative performances of several algorithms for identifying relevant sentences, including verb-free algorithms that rely instead on protein term co-occurrences. PathBinder relies on the sentence unit rather than abstracts, phrases, or other units because sentences rate highly on

8 Computational Biology and Genome Informatics
information retrieval effectiveness under reasonable conditions [Ding et al., 2002].
How PathBinder Works
Step 1: user input. Keyboard input of biomolecule names in pathways of interest by the user.
Step 2: synonym extraction. A user-editable synonym file is combined with a more advanced module that will automatically access the HUGO (http://www.gene.ucl.ac.uk.publicfiles/nomen/nomenclature.txt) and OMIM (www.ncbi.nlm.nih.gov/htbinpost/Omim/) nomenclature databases, and extract synonyms.
Step 3: document retrieval. PubMed is accessed and queried using terms input in Step 1. The output of this step is a list of URLs with high relevance probabilities.
Step 4: sentence extraction. Each URL is downloaded and scanned for pathway-relevant sentences that satisfy the query. These sentences constitute pathway-relevant information “nuggets.”
Repetition of steps 2 through 4, using different biomolecule names extracted from qualifying sentences. These new biomolecule names are candidates for inclusion in the pathways of interest.
Step 5: sentence index. Process the collection of qualifying sentences into a more user-friendly form, a multi-level index (Figure 3), with the number of levels dependent on the sentence extraction criteria. This index conforms to a pattern, displayed by a Web browser, and the sentences in it are clickable. When a sentence is clicked, the document from which it came appears in the Web browser.
Step 6: integration with the rest of the software and the microarray data sets. The index can be used to create a graphical representation in which verbs are represented by lines, interconnecting the biomolecule names and forming a web-like relationship diagram of the extracted information.
PathBinder is useful as both a standalone tool and an integrated subsystem of the complete system. The multilevel indexes transform naturally into inputs for the network modeling tools. The networks that PathBinder helps identify will form valuable input to the clustering, display, and analysis software modules.

Dickerson, Berleant, Cox, Qi, Ashlock, Wurtele & Fulmer 9
Protein A Protein B Associates/Associated/etc. Sentence 1 Sentence 2 . . . Binds/Binding/Bind/etc. Sentence M Sentence M+1 . . . Regulates/Regulating/etc. . . . Protein C Associates/Associated/etc. Sentence M+N . . . Binds/Binding/Bind/etc. . . . Protein B Protein D Associates/Associated/etc. Sentence M+N+P
Figure 3. The long and somewhat disorganized sentence set that PathBinder extracts is converted into a multilevel index which is more suited to a human user. “Protein A”, “Protein B”, etc. are placeholders for the actual name of a path-relevant protein, and “Sentence 1”, “Sentence 2”, etc. are placeholders that would be actual sentences in the PathBinder-generated index.
Example of a Sample PathBinder Query
The query is to find sentences containing (either gibberellin, gibberellins, or GA) AND (either SPY, SPY-4, SPY-5, or SPY-7). Three relevant results were found and incorporated into the metabolic and regulatory visualization. A single sentence example is show below.
Sentence: “The results of these experiments show that spy-7 and gar2-1 affect the GA dose-response relationship for a wide range of GA responses
10 Computational Biology and Genome Informatics
and suggest that all GA-regulated processes are controlled through a negatively acting GA-signaling pathway.”
Source Information: UI—99214450, Peng J, Richards DE, Moritz T, Cano-Delgado A, Harberd NP, Plant Physiol 1999 Apr; 119(4):1199-1208.
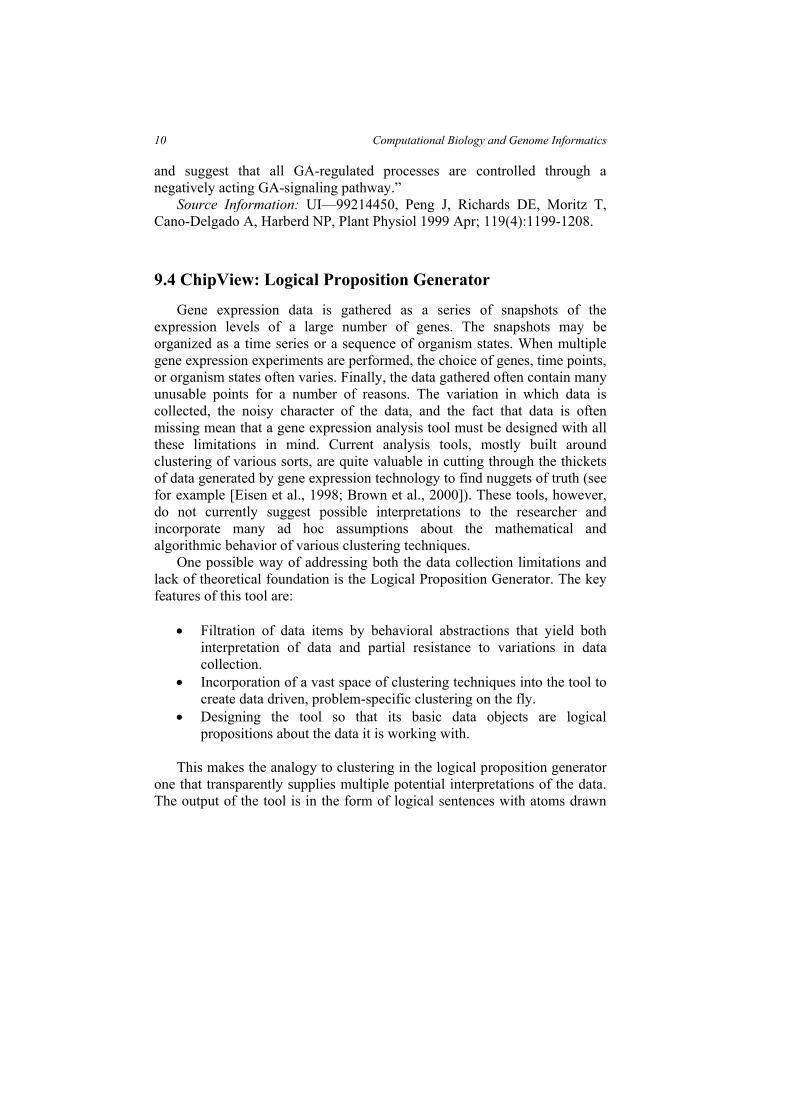
9.4 ChipView: Logical Proposition Generator
Gene expression data is gathered as a series of snapshots of the expression levels of a large number of genes. The snapshots may be organized as a time series or a sequence of organism states. When multiple gene expression experiments are performed, the choice of genes, time points, or organism states often varies. Finally, the data gathered often contain many unusable points for a number of reasons. The variation in which data is collected, the noisy character of the data, and the fact that data is often missing mean that a gene expression analysis tool must be designed with all these limitations in mind. Current analysis tools, mostly built around clustering of various sorts, are quite valuable in cutting through the thickets of data generated by gene expression technology to find nuggets of truth (see for example [Eisen et al., 1998; Brown et al., 2000]). These tools, however, do not currently suggest possible interpretations to the researcher and incorporate many ad hoc assumptions about the mathematical and algorithmic behavior of various clustering techniques.
One possible way of addressing both the data collection limitations and lack of theoretical foundation is the Logical Proposition Generator. The key features of this tool are:
• Filtration of data items by behavioral abstractions that yield both
interpretation of data and partial resistance to variations in data collection.
• Incorporation of a vast space of clustering techniques into the tool to create data driven, problem-specific clustering on the fly.
• Designing the tool so that its basic data objects are logical propositions about the data it is working with.
This makes the analogy to clustering in the logical proposition generator
one that transparently supplies multiple potential interpretations of the data. The output of the tool is in the form of logical sentences with atoms drawn

Dickerson, Berleant, Cox, Qi, Ashlock, Wurtele & Fulmer 11
from absolute and differential classifications of expression profiles and relative abstractions of pairs of gene expression profiles. The prototype tool was written for gene expression profiles that are time series. The goal is to extend the logical proposition generator to have logical primitives that are appropriate for non-time series data are one of the goals as well.
Operation of the Logical Proposition Generator Let us now specify the atoms and connective of the logical proposition
language that is the target of the tool’s search of the data for meaning. The tool permits the user to specify the expression level E that they believe specifies up or down regulation of a gene and the minimum change in expression level D that represents a significant change between adjacent time points. The tool recognizes classes of expression profiles given by the regulation state at each time point. Thus, “up, not down, not unchanged, down, down, not up, unchanged,” specifies one of the possible classes of a seven point time series. Likewise, if +/− means significant change up or down since the last time step “+++00 − −” would represent a class of profiles that first increased, then stayed level, and later decreased their regulation between time steps. These two types of classes of expression profiles form the single expression profile atoms of the language.
The tool also uses logical atoms that compare pairs of profiles. These compute representative facts about the profiles, such as “profile one has its maximum before profile two”, “the maximum change in regulation of the second profile exceeds that of the first”, or “upregulation in the first profile does not occur unless a change in regulation has occurred in the second”. The absolute and differential (single expression profile) atoms and the relative (two expression profile) atoms both return a “true” or “false” result. With these atoms available we then use traditional Boolean connectives AND, OR, NOT, XOR, etc. to build logical propositions.
Once we have the ability to make logical statements about gene expression profiles, the problem them becomes locating interesting and informative propositions. Statements that are always true, tautologies, are not interesting. Instead, we use a form of evolutionary computation, genetic programming [Koza, 1992; Kinnear, 1994; Koza, 1994; Angeline, 1996] to locate propositions that are true of subsets of the expression profiles. While this can be done blindly, with utility similar to clustering, it is also possible

12 Computational Biology and Genome Informatics
to force the expressions to be true when one of their arguments comes from a restricted class of genes of interest, e.g. a class we are trying to modify the expression of by some intervention. Thus, to find genes important to the upregulation of a class of genes X, we would search for propositions [ ]yxP , that are often true when x is in X, seldom true when x was not in X, for some substantial but not universal collection Y of values for y. These vague statements about “usually true” and “substantial” become mathematically precise when embedded into the evolutionary search tool as a fitness function. One target of the research is an understanding of which fitness function among those possible provide results useful to biological researchers.
The relation { } { } { }ybeforeupfirstxyx ∧∈∧∈ 55666662233333 defines a binary relation of expression profiles. x must not change significantly at first while y must change at first. Later, x must not go down while y must not go up OR the first significant upregulation of x must be before that of y. Evolving such expressions permits the computation of interesting hypotheses about relations between profiles including relationships that use edges in the graphical models.
The logical proposition generator, by working with abstractions of the data in the form of the logical atoms described above yields the advantage that it is resistant, though certainly not immune, to variations in exactly which data are collected. The absolute and differential expression classes represent primitive fragments, which Boolean operations fuse together into data partitions, i.e. clusters. This means that the clustering techniques required to make sense of gene expression data are incorporated transparently into the logical proposition generator. Finally, in addition to locating genes that are implicated in the regulation of genes of interest, something clustering tools can do to some degree, the logical character of the tool will sometimes simultaneously suggests the “what” or “why” of the relationship, easing the work of interpretation and providing a source of tentative links for the other tools. This tool is not intended to replace clustering tools but to complement them. One way to locate a target set of genes, for example, might be to choose a tight cluster containing a few genes of interest and use this as a group of interest for the logical proposition generator.

Dickerson, Berleant, Cox, Qi, Ashlock, Wurtele & Fulmer 13
Code Measurement Change
1 Upregulated
2 Didn't change significantly
3 Didn't downregulate
4 Downregulated
5 Changed significantly from the baseline
6 Didn't upregulate
7 Matches anything
Table 1. Codes for changes in the expression profiles.
Example of Logical Proposition Generator Operation The logical proposition generator operates on sets of expression profiles.
It characterizes desired sequences as a series of numbers, e.g. Y in L: 124 means that Y is in the set of profiles that are in the state “Upregulated, didn’t change, and downregulated”. Table 1 gives the codes used in this example. An example logical proposition is given below:
( (
( in : 757243126155) ( ( Pr ) )) ( ( ( ( )))
))
NANDNOR
Y LNAND Same o Y X FAND T NOT NOT NOR F T
This is a logical proposition that acts on two 12-time-point expression
profiles X and Y. It uses the logical operations NAND, NOR, NOT, and AND and the constants T and F. The logical proposition uses the binary predicate “SamePro” which is true if two profiles are significantly up-and-down

14 Computational Biology and Genome Informatics
regulated in the same pattern. It also uses the unary predicate “Y in L:525634163157” which tests to see if Y is in the class of profiles that displays a particular pattern of up and down regulation in its twelve time points according to the scheme in Table 1.
Logical propositions of this form have the potential to encode very complex classes of expression profiles in very short statements. The following logical proposition also uses OR and Say, which we use to encode the logical identity, as well as differential classes, e.g. “X in D:73512467452” which check for changes in regulation since the last time step rather than as compared to the baseline:
( ( ( in :73512467452)) ( ( ( ( in :71661716551) ( in :177621456644)) ( ( ( in :13376357161)))) ))
NOR Say X DSay OR OR X D X L
NAND T Say Y D
The Say operation does nothing but it leaves space in an expression that
makes it easier for the evolutionary training techniques we use to move around sub-expressions that form coherent logical units.
9.5 Fuzzy Cognitive Map Modeling Tool for Metabolic Networks
The FCModeler tool for gene regulatory and metabolic networks captures the known metabolic information and expert knowledge of biologists in a graphical form. The node and link data for the metabolic map is stored in a relational database. This tool uses fuzzy methods for modeling network nodes and links and interprets the results using fuzzy cognitive maps [Kosko, 1986a; Kosko, 1986b; Dickerson and Kosko, 1994]. This tool concentrates on dynamic graphical visualizations that can be changed and updated by the user. This allows for hypothesis testing and experimentation.
Dickerson, Berleant, Cox, Qi, Ashlock, Wurtele & Fulmer 15
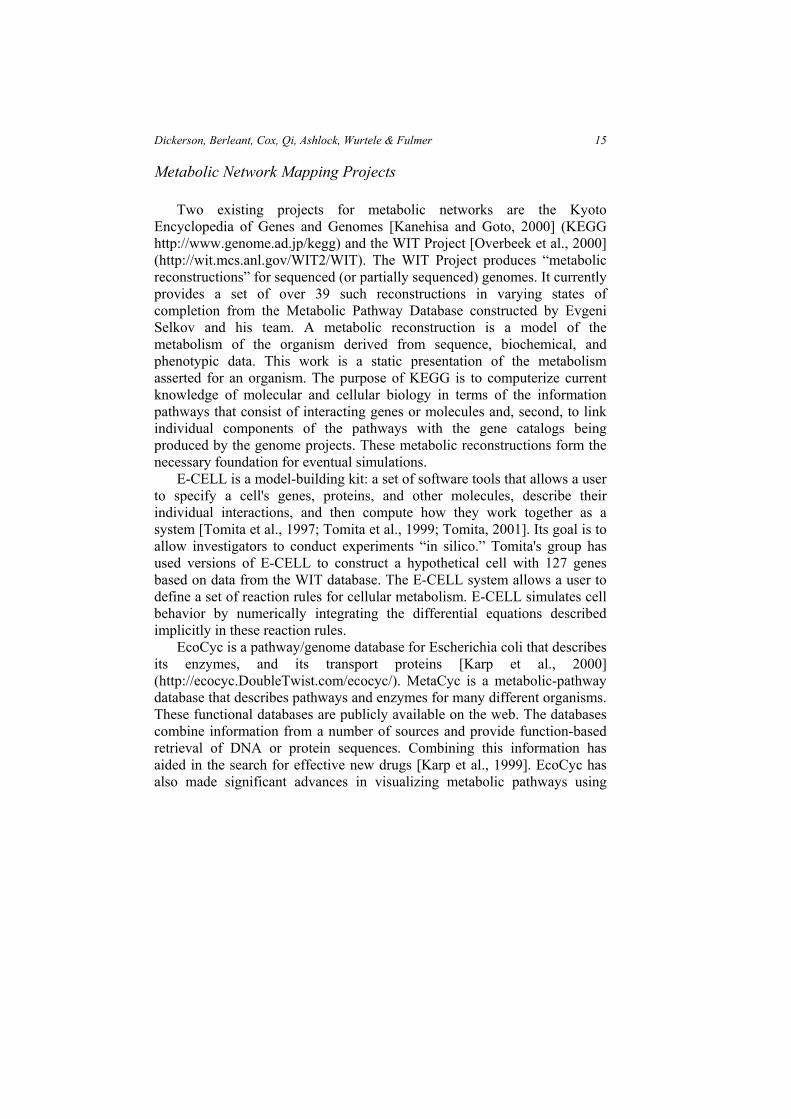
Metabolic Network Mapping Projects Two existing projects for metabolic networks are the Kyoto
Encyclopedia of Genes and Genomes [Kanehisa and Goto, 2000] (KEGG http://www.genome.ad.jp/kegg) and the WIT Project [Overbeek et al., 2000] (http://wit.mcs.anl.gov/WIT2/WIT). The WIT Project produces “metabolic reconstructions” for sequenced (or partially sequenced) genomes. It currently provides a set of over 39 such reconstructions in varying states of completion from the Metabolic Pathway Database constructed by Evgeni Selkov and his team. A metabolic reconstruction is a model of the metabolism of the organism derived from sequence, biochemical, and phenotypic data. This work is a static presentation of the metabolism asserted for an organism. The purpose of KEGG is to computerize current knowledge of molecular and cellular biology in terms of the information pathways that consist of interacting genes or molecules and, second, to link individual components of the pathways with the gene catalogs being produced by the genome projects. These metabolic reconstructions form the necessary foundation for eventual simulations.
E-CELL is a model-building kit: a set of software tools that allows a user to specify a cell's genes, proteins, and other molecules, describe their individual interactions, and then compute how they work together as a system [Tomita et al., 1997; Tomita et al., 1999; Tomita, 2001]. Its goal is to allow investigators to conduct experiments “in silico.” Tomita's group has used versions of E-CELL to construct a hypothetical cell with 127 genes based on data from the WIT database. The E-CELL system allows a user to define a set of reaction rules for cellular metabolism. E-CELL simulates cell behavior by numerically integrating the differential equations described implicitly in these reaction rules.
EcoCyc is a pathway/genome database for Escherichia coli that describes its enzymes, and its transport proteins [Karp et al., 2000] (http://ecocyc.DoubleTwist.com/ecocyc/). MetaCyc is a metabolic-pathway database that describes pathways and enzymes for many different organisms. These functional databases are publicly available on the web. The databases combine information from a number of sources and provide function-based retrieval of DNA or protein sequences. Combining this information has aided in the search for effective new drugs [Karp et al., 1999]. EcoCyc has also made significant advances in visualizing metabolic pathways using

16 Computational Biology and Genome Informatics
stored layouts and linking data from microarray tests to the pathway layout [Karp et al., 1999].
Visualizing Metabolic Networks The known and unknown biological information in the metabolic
network is visualized using a graph visualization tool. Figure 4 shows a screenshot of the FCModeler tool display window. The graph visualization is based on for visualizing and interacting with dynamic information spaces. FCModeler uses Diva, a Java-based software information visualization package (see http://www.gigascale.org/diva/) for its basic graph data structure, rendering, and interaction controls. In addition, it extends Diva to provide custom graphics-related features such as dynamic figures, graph layout, and panning and zooming. This allows for a greater variety of visualization objects on the display. The front end of the FCModeler tool is a Java TM interface that reads and displays data from a database of links and nodes. The graph layout program is dot, which is part of the Graphviz program developed at AT&T research labs (see http://www.research.att.com/ sw/tools/graphviz/).
The nodes and edges in the FCModeler graph have properties, which can be specified in an XML file or created at run-time by the user. There is a set of properties for nodes and also one for edges. In a bioinformatics application, a node property may be “type of node”. Then each node would have a specific value for this property, such as “DNA”, “RNA”, “protein”, “environmental factor”, etc. Similarly, an edge property could be “type of reaction” with the specific values “conversion” or “regulatory.” Figure 5 shows the visual property window from FCModeler for some of the nodes and edges of the Arabidopsis graph shown in Figure 4.
Interaction FCModeler currently supports several forms of user interaction with the
graph model and view. One basic form of interaction is selection. Node and edge figures can be selected individually by clicking on them with the mouse, or by dragging a selection rectangle around a group of them. The selected node and edge figures are then visually distinguished from the rest

Dickerson, Berleant, Cox, Qi, Ashlock, Wurtele & Fulmer 17
Figure 4. Screenshot of an FCModeler graph. The bold blue arrows represent catalyst links. The dashed arrows are conversion links. The proteins are shown as ellipses. The rectangles are small molecules. Nodes of interest can be highlighted by the user.
Figure 5. The attribute editor in FCModeler. The color, shape, and fill of the nodes can be changed according to the existing properties. The color, line thickness, and dash pattern can be changed for the edges.

18 Computational Biology and Genome Informatics
by some form of highlighting. Selection of node and edge figures can provide a starting point for other operations on the graph.
The user can reposition the nodes and edges on the screen by dragging them with the mouse. All of the selected figures will then be translated in the direction of the mouse movement. In addition, edge figures are rendered as Bezier curves [Angel, 2000] and dragging with the mouse relocates the edge figures’ individual control points.
FCModeler supports graphical modification the underlying metabolic map model. Node and edge figures can be added to and removed from the view. The user can also change the tail or head node of an edge by dragging the desired edge end to a new node figure.
Zooming and panning allow the user to examine different parts of the graph in varying levels of detail. The graph may just be too large to be viewed as a whole on the screen, or a layout algorithm could use more space than is viewable at once for its layout. The view port can also be programmatically set to arbitrary coordinates.
Graph Layout
Any Diva graph view can use an arbitrary graph layout algorithm to compute the positions of its node and edge figures. Diva comes with several layout algorithms, but opens its views to custom implementations. FCModeler uses the Dot graph layout engine, which is part of the Graphviz graph drawing software from AT&T labs (http://www.research.att.com/ sw/tools/graphviz/). Dot produces fairly nice layouts, and is easy to use. However, other more specialized layout algorithms may produce better layouts for the specific kinds of graphs visualized in FCModeler [Becker and Rojas, 2001]. Diva makes pluggable layout algorithms easy by separating the view logic from the layout logic.
Database and Object Properties
FCModeler allows nodes and edges in the graph model to have properties. The specific values of these properties determine the visual attributes of the corresponding node and edge figures in the view. These mappings from properties to visual attributes are encapsulated by a set of mapping rules, which can be specified in an XML file or created at run-time by the user.

Dickerson, Berleant, Cox, Qi, Ashlock, Wurtele & Fulmer 19
Figure 6. The property viewer displays information about the selected nodes and edges. The properties are defined in an XML graph file generated by the relational database.
The node and link information is stored in a relational database that
interacts with the graphical modeling program. The purpose of this database is to store information such as links and nodes data, search results, literature sources, and microarray data in a searchable database to support development of the Gene Expression Toolkit. This system will be used to model the structure of metabolic networks using data provided by users. It will also track the results from the tests. Figure 6 shows a property window that displays the database information about the highlighted nodes and links.
Animation The visual attributes of the node and edge figures can be changed over
time, producing an animation of the graph view. This animation consists of discrete time steps, each having a set of mapping rules. An animation controller in FCModeler applies the mapping rules to the node and edge figures for each time step in order, with a configurable delay between time steps. The node and edge figures are set back to a permanent state at the beginning of each time step, and then the new mapping rules are applied to all figures in the view. Thus, the mappings only last for a single time step, and then the figures revert back to their previous state. The user specifies the sets of mapping rules for each time step of the animation in an XML file. This file is similar to the attributes XML file, but with the addition of time step tags. Users can produce these animation files to show how the nodes interact with each other in the graph.

20 Computational Biology and Genome Informatics
Metabolic Network Modeling using Fuzzy Cognitive Maps The FCModeler tool models regulatory networks so that important
relationships and hypotheses can be mined from the data. Some types of models that have been studied for representing gene regulatory networks are Boolean networks [Liang et al., 1998; Akutsu et al., 1999], linear weighting networks [Weaver et al., 1999], differential equations [Tomita et al., 1999; Akutsu, 2000] and Petri nets [Matsuno, 2000]. Circuit simulations and differential equations such as those used in the E-cell project require detailed information that is not yet known about the regulatory mechanisms between genes. Another problem is the numerical instability inherent in solving large networks of differential equations. Boolean networks analyze binary state transition matrices to look for patterns in gene expression. Each part of the network is either on or off depending on whether a signal is above or below a pre-determined threshold. These network models lack feedback. Linear weighting networks have the advantage of simplicity since they use simple weight matrices to additively combine the contributions of different regulatory elements. However, the Boolean and weighting networks are feedforward systems that cannot model the feedback present in metabolic pathways. Petri nets can handle a wide variety of information, however their complexity does not scale up well to systems that have both continuous and discrete inputs [Alla and David, 1998; Reisig and Rozenberg, 1998].
Fuzzy cognitive maps (FCMs) have the potential to answer many of the concerns that arise from the existing models. Fuzzy logic allows a concept or gene expression to occur to a degree—it does not have to be either on or off [Kosko, 1986a]. FCMs have been successfully applied to systems that have uncertain and incomplete models that cannot be expressed compactly or conveniently in equations. Some examples are modeling human psychology [Hagiwara, 1992], and on-line fault diagnosis at power plants [Lee et al., 1996]. All of these problems have some common features. The first is the lack of quantitative information on how different variables interact. The second is that the direction of causality is at least partly known and can be articulated by a domain expert. The third is that they link concepts from different domains together using arrows of causality. These features are shared by the problem of modeling the signal transduction and gene regulatory networks.
We use a series of +/− links to model known signal transduction pathways and hypothesized pathways. A third link type suggests a

Dickerson, Berleant, Cox, Qi, Ashlock, Wurtele & Fulmer 21
relationship between concepts with no implied causality. These links will be constructed by mining the literature using PathBinder and from Gene Expression Toolkit Database that contains the expert knowledge of biologists. Given the metabolic network, FCModeler contains advanced tools that:
• Locate and visualize cycles and strongly connected components of
the graph. • Simulate intervention in the network (e.g. what happens when a node
is shut off) and search for critical paths and control points in the network.
• Capture information about how edges between graph nodes change when different regulatory factors are present.
Metabolic Network Modeling Fuzzy cognitive maps are fuzzy digraphs that model causal flow between
concepts or, in this case, genes, proteins, and transcription factors [Kosko, 1986a; Kosko, 1986b]. The concepts are linked by edges that show the degree to which the concepts depend on each other. FCMs can be binary state systems called simple FCMs with causality directions that are +1, a positive causal connection, -1, a negative connection, or zero, no causal connection. The fuzzy structure allows the gene or protein levels to be expressed in the continuous range [ ]0,1 . The input is the sum of the product of the fuzzy edge values. The system nonlinearly transforms the weighted input to each node using a threshold function or other nonlinear activation. FCMs are signed digraphs with feedback. Nodes stand for causal fuzzy sets where events occur to some degree. Edges stand for causal flow. The sign of an edge (+ or -) shows causal increase or decrease between nodes. The edges between nodes can also be time dependent functions that create a complex dynamical system. Neural learning laws and expert heuristics encode limit cycles and causal patterns. One learning method is differential Hebbian learning in which the edge matrix updates when a causal change occurs at the input [Dickerson and Kosko, 1994].
Each causal node Ci(t) is a nonlinear function that maps the output activation into a fuzzy membership degree in [ ]0,1 . Simple or trivalent

22 Computational Biology and Genome Informatics
FCMs have causal edge weights in the set {-1,0,1} and concept values in {0,1} or {-1,1}. Simple FCMs give a quick approximation to an expert’s causal knowledge. More detailed graphs can replace this link with a time-dependent and/or nonlinear function.
FCMs recall as the FCM dynamical system equilibrates. Simple FCM inference is matrix-vector multiplication followed by thresholding. State vectors Cn cycle through the FCM edge matrix E, that defines the edges eki where k is the upstream node and i is the downstream node. The system nonlinearly transforms the weighted input to each node Ci:
( ) ( ) ( )1i n ki n k nC t S e t C t+ = ∑
S(y) is a monotonic signal function bounded function such as the sigmoid
function:
( ) ( )1
1 j jj j c y T
S ye
− −=
+
In this case c=1000 and Tj= 0.5 for all nodes. This is equivalent to a step
function with a threshold at 0.5. The edges between nodes can also be time dependent functions that create a complex dynamical system.
Regulatory Links: The regulatory edges are modeled using a simple FCM model that assumes binary connecting edges: }1,1{−=kie for the single edge case. When there are multiple excitatory or inhibitory connections, the weights are divided by the number of input connections in the absence of other information. As more information becomes known about details of the regulation, for example how RNA level affects the translation of the corresponding protein, the function of the link models will be updated. The regulatory nodes will also have self-feedback since the nodes stay on until they have been inhibited.
Conversion Links: Conversion relationships are modeled in different ways depending on the goal of the simulation study. The first case corresponds to investigating causal relationships between nodes. The node is modeled in the same manner as a regulatory link in which the presence of one node causes presence at the next node. When information about the rate of change in a reaction is available, a simple difference equation can model the gradually rising and falling levels of the nodes. When stoichiometric

Dickerson, Berleant, Cox, Qi, Ashlock, Wurtele & Fulmer 23
information is available, the links can be modeled as a set of mass-balance equations. The step size depends on the reaction rate and the stoichiometric relationship between the nodes.
Catalyzed Links: Catalyzed reactions add a dummy node that acts upon a conversion link. This allows one link to modify another link. In the current model, the catalyzed link is simulated by weighting the inputs into the dummy node in such a way that both inputs much be present for the node to be active. Another method of modeling catalyzed links is an augmented matrix that operates on the edges between the nodes. The catalyst node acts as a switch that allows a reaction to occur in the proper substrates are available. Since all of the compounds must be present in these links for a reaction to occurs the pieces must be modeled as a logical AND operation. This operation is commonly modeled as a minimum function, however, it can also be modeled as a product of all the input values [Kosko, 1992].
Forcing functions: In biological systems such as cells, many of the metabolic network elements are always present. This is modeled as a node is active unless it is being inhibited. This is modeled as:
( ) ( ) ( )1 1i n ki n k nC t S e t C t+ = + ∑
9.6 Example of PathBinder-FCModeler Integration
This example shows how the pieces of the Gene Expression Toolkit can be used to create or update metabolic maps of a system using expert knowledge. The process starts with a map created by an expert or an existing metabolic pathway from a database such as KEGG or WIT [Kanehisa and Goto, 2000; Overbeek et al., 2000]. The next step is to perform a PathBinder literature search for new relationships between the nodes of the existing graph. These relationships can then be assessed and added into the metabolic map. FCModeler models the effects of the changes for biologist user. An expert in the area of gibberellin metabolism constructed the map shown in Figure 7. Next a PathBinder Query is performed as shown below.
Query: Find sentences containing (either gibberellin, gibberellins, or GA) AND (either SPY, SPY-4, SPY-5, or SPY-7).
Sentence: “Here we describe detailed studies of the effects of two of these suppressors, spy-7 and gar2-1, on several different GA-responsive

24 Computational Biology and Genome Informatics
Figure 7. Network of gibberellin metabolism in Arabidopsis. Heavy lines are catalyzed links, heavy dashed lines are conversion links, and thin lines are regulatory links. All proteins are shown in elliptical boxes.
Figure 8. The updated metabolic map based on the PathBinder query result. The new nodes are shaded in.

Dickerson, Berleant, Cox, Qi, Ashlock, Wurtele & Fulmer 25
growth processes (seed germination, vegetative growth, stem elongation, chlorophyll accumulation, and flowering) and on the in plant amounts of active and inactive GA species.” Source: UI—99214450 Peng J, Richards DE, Moritz T, Cano-Delgado A, Harberd NP, Plant Physiol 1999 Apr;119(4): 1199-1208. Figure 8 shows the new graph after the information provided by the new links is added into the graph.
9.7 Example of Network Modeling
The metabolism and signal transduction of the plant hormone gibberellin in Arabidopsis [Hedden and Phillips, 2000; Sun, 2000] was used to test this modeling scheme. Figure 7 shows the nodes used in this test. An expert researcher in the field created the link types and causality directions. The key element in this graph is the block labeled GA4. This compound regulates many other regulatory mechanisms in plants. GAI, GRS, SPY, and GA_MYB had forcing functions applied to them. Figures 9 and 10 show visualized networks at different time steps to analyze the interactions in the network. Figure 9 shows the operation of the catalyzing node, 3_beta_hydroxylase. When the node is active, GA4 is produced. These figures show how GA4 can regulate its own production through the transcription factor SHI. The result is a homeostatic control of GA4 levels. The oscillation of the GA levels directs the generation of biomolecules that, in the absence of other constraining factors, are implicated in the formation of new cellular proliferation centers, referred to as meristems. Many key features of this model, including timing, can be tested experimentally and relatively rapidly by globally monitoring temporal profiles of mRNA, protein, and metabolite.
9.8 Conclusions
The integration of a graph visualization tool with literature mining and directed searches in microarray data allows biologists to gather and combine information from the literature, their expert knowledge, and the public databases of mRNA results. Metabolic and regulatory networks can be modeled using fuzzy cognitive maps. Future plans include: simulating

26 Computational Biology and Genome Informatics
Figure 9. The catalyst, 3-beta-hydroxylase is present at this step. This allows GA9 to be converted into the active form of gibberellin, GA4. Active nodes are shaded. The nodes, SPY, GRS, and GAI are forced high in this simulation.
Figure 10. GA4 regulates its own production through the transcription factor SHI. SHI inhibits the 3-beta-hydroxylase-RNA, which eventually shuts down the production of GA4.

Dickerson, Berleant, Cox, Qi, Ashlock, Wurtele & Fulmer 27
intervention in the network (e.g. what happens when a node is shut off), searching for critical paths and control points in the network, and capturing information about how edges between graph nodes change when different regulatory factors are present.
Acknowledgements
This work is supported by grants from Proctor and Gamble Corporation, the NSF (MCB-9998292), and the Plant Sciences Institute at Iowa State University.
References Akutsu, T., Miyano, S. and Kuhara, S. (1999) “Identification of genetic networks
from a small number of gene expression patterns under the boolean network model.” Pacific Symposium on Biocomputing 4, 17-28.
Akutsu, T., Miyano, S. and Kuhara, S. (2000) “Algorithms for inferring qualitative
models of biological networks.” Pacific Symposium on Biocomputing 5, 290-301.
Alla, H. and David, R. (1998) “Continuous and hybrid petri nets.” Journal of
Circuits, Systems, and Computers 8, 159-188. Andrade, M.A. and Valencia, A. (1998) “Automatic extraction of keywords from
scientific text: Application to the knowledge domain of protein families.” Bioinformatics 14, 600-607.
Angel, E. (2000) Interactive Computer Graphics. Addison Wesley Longman,
Massachusetts. Angeline, P.J. (1996) Advances in Genetic Programming II. MIT Press, Cambridge,
Massachusetts. Becker, M. and Rojas, I. (2001) “A graph layout algorithm for drawing metabolic
pathways.” Bioinformatics 17, 461-467. Berleant, D. (1995) “Engineering word experts for word disambiguation.” Natural
Language Engineering 1, 339-362.

28 Computational Biology and Genome Informatics
Blaschke, C., Andrade, M., Ouzounis, C. and Valencia, A. (1999) “Automatic
extraction of biological information from scientific text: Protein-protein interactions.” International Conference on Intelligent Systems for Molecular Biology, Heidelberg.
Brown, M.P.S., Grundy, W.N., Lin, D., Cristianini, N., Sugnet, C.W., Furey, T.S.,
Ares, M. and Haussler, D. (2000) “Knowledge-based analysis of microarray gene expression data by using support vector machines.” Proceedings National Academy of Science 97, 262-267.
Collier, N.H., Park, S., Ogata, N., Tateishi, U.Y., Nobata, C., Ohta, T., Sekimizu, T.,
Imai, H., Ibushi, K. and Tsujuii, J. (1999) “The GENIA project: Corpus-based knowledge acquisition and information extraction from genome research papers.” European Association for Computational Linguistics (EACL) Conference.
Craven, M. and Kumlien, J. (1999) “Constructing biological knowledge bases by
extracting information from text sources.” AAAI Conference on Intelligent Systems in Molecular Biology, 77-86.
Dickerson, J.A. and Kosko, B. (1994) “Virtual worlds as fuzzy cognitive maps.”
Presence 3, 173-189. Ding, J., Berleant, D., Nettleton, D. and Wurtele, E. (2002) “Mining MEDLINE:
Abstracts, sentences, or phrases?” Pacific Symposium on Biocomputing, Kaua'i, Hawaii.
Eisen, M.B., Spellman, P.T., Brown, P.O. and Botstein, D. (1998) “Cluster analysis
and display of genome-wide expression patterns.” Proceedings National Academy of Science 95, 14863-14868.
Fukuda, K., Tsunoda, T., Tamura, A. and Takagi, T. (1998) “Toward information
extraction: Identifying protein names from biological papers.” Proceedings of the Pacific Symposium on Biocomputing, 707-718.
Hagiwara, M. (1992) “Extended fuzzy cognitive maps.” IEEE Int Conf Fuzzy Syst
FUZZ-IEEE, 795-801. Hedden, P. and Phillips, A.L. (2000) “Gibberellin metabolism: New insights
revealed by the genes.” Trends Plant Sci. 5, 523-530. Humphreys, K., Demetriou, G. and Gaizauskas, R. (2000) “Two applications of
information extraction to biological science journal articles: Enzyme

Dickerson, Berleant, Cox, Qi, Ashlock, Wurtele & Fulmer 29
interactions and protein structures.” Pacific Symposium on Biocomputing 5, 502-513.
Kanehisa, M. and Goto, S. (2000) “KEGG: Kyoto encyclopedia of genes and
genomes.” Nucleic Acids Research 28, 27-30. Karp, P.D., Krummenacker, M., Paley, S. and Wagg, J. (1999) “Integrated
pathway/genome databases and their role in drug discovery.” Trends in Biotechnology 17, 275-281.
Karp, P.D., Riley, M., Saier, M., Paulsen, I.T., Paley, S.M. and Pellegrini-Toole, A.
(2000) “The EcoCyc and MetaCyc databases.” Nucleic Acids Research 28, 56-59.
Kinnear, K.E. (1994) Advances in Genetic Programming. MIT Press, Cambridge,
Massachusetts. Kosko, B. (1986a) “Fuzzy cognitive maps.” International Journal of Man-Machine
Studies 24, 65-75. Kosko, B. (1986b) “Fuzzy knowledge combination.” International Journal of
Intelligent Systems 1, 293-320. Kosko, B. (1992) Neural Networks and Fuzzy Systems. Prentice Hall, Englewood
Cliffs, New Jersey. Koza, J.R. (1992) Genetic Programming: On the Programming of Computers by
Means of Natural Selection. MIT Press, Cambridge, Massachusetts. Koza, J.R. (1994) Genetic Programming II: Automatic Discovery of Reusable
Programs. MIT Press, Cambridge, Massachusetts. Lee, K., Kim, S. and Sakawa, M. (1996) “On-line fault diagnosis by using fuzzy
cognitive maps.” IEICE Transactions on Fundamentals of Electronics, Communications and Computer Sciences E79-A, 921-922.
Liang, S., Fuhrman, S. and Somogyi, R. (1998) “REVEAL, a general reverse
engineering algorithm for inference of genetic network architectures.” Pacific Symposium on Biocomputing 3, 18-29.
Matsuno, H., Doi, A., Nagasaki, M. and Miyano, S. (2000) “Hybrid petri net
representation of gene regulatory network.” Pacific Symposium on Biocomputing 5, 338-349.

30 Computational Biology and Genome Informatics
Ng, S.K. a. M.W. (1999) “Toward routine automatic pathway discovery from on-line scientific text abstracts.” Genome Informatics 10, 104-112.
Ono, T., Hishigaki, H., Tanigami, A. and Takagi, T. (2001) “Automated extraction
of information on protein-protein interaction from the biological literature.” Bioinformatics 17, 155-161.
Overbeek, R., Larsen, N., Pusch, G.D., D’Souza, M., Jr., E.S., Kyrpides, N.,
Fonstein, M., Maltsev, N. and Selkov, E. (2000) “WIT: Integrated system for high-throughput genome sequence analysis and metabolic reconstruction.” Nucl. Acids. Res. 28, 123-125.
Proux, D., Rechenmann, F., Julliard, L., Pillet, V. and Jacq, B. (1998) “Detecting
gene symbols and names in biological texts: A first step toward pertinent information.” Ninth Workshop on Genome Informatics, 72-80.
Reisig, W. and Rozenberg, G. (1998) Lectures on Petri Nets I: Basic Models.
Springer, Berlin. Rindflesch, T.C., Hunter, L. and Aronson, A.R. (1999) “Mining molecular binding
terminology from biological text.” AMIA '99 Annual Symposium pp. Rindflesch, T.C., Tanabe, L., Weinstein, J.N. and Hunter, L. (2000) “EDGAR:
Extraction of drugs, genes, and relations from the biomedical literature.” Pacific Symposium on Biocomputing, 514-525.
Sekimizu, T., Park, H.S. and Tsujii, T. (1998) Genome Informatics. Universal
Academy Press. Shatkay, H., Edwards, S., Wilbur, W.J. and Boguski, M. (2000) “Genes, themes and
microarrays.” Int. Conf. on Intelligent Systems in Molecular Biology pp. Stapley, B.J. a. G.B. (2000) “Biobibliometrics: Information retrieval and
visualization from co-occurrences of gene names in medline asbtracts.” Pacific Symposium on Biocomputing 5, 529-540.
Sun, T. (2000) “Gibberellin signal transduction.” Curr. Opin. Plant Biol. 3, 374-380. Tanabe, L., Scherf, U., Smith, L.H., Lee, J.K., Hunter, L. and Weinstein, J.N. (1999)
“MedMiner: An internet text-mining tool for biomedical information, with application to gene expression profiling.” BioTechniques 27, 1210-1217.

Dickerson, Berleant, Cox, Qi, Ashlock, Wurtele & Fulmer 31
Thomas, J., Milward, D., Ouzounis, C., Pulman, S. and Carrol, M. (2000) “Automatic extraction of protein interactions from scientific abstracts.” Pacific Symposium on Biocomputing 5, 538-549.
Tomita, M. (2001) “Whole-cell simulation: A grand challenge of the 21st century.”
Trends Biotechnol. 19, 205-210. Tomita, M., Hashimoto, K., Takahashi, K., Shimizu, T.S., Matsuzaki, Y., Miyoshi,
F., Saito, K., Tanida, S., Yugi, K., Venter, J. and Hutchison, C. (1997) “E-CELL: Software environment for whole cell simulation.” Genome Inform Ser Workshop Genome Inform, 147-155.
Tomita, M., Hashimoto, K., Takahashi, K., Shimizu, T.S., Matsuzaki, Y., Miyoshi,
F., Saito, K., Tanida, S., Yugi, K., Venter, J. C. and Hutchison, C. A. (1999) “E-CELL: Software environment for whole-cell simulation.” Bioinformatics 15, 72-84.
Usuzaka, S., Sim, K.L. and Tanaka, M. (1998) “A machine learning approach to
reducing the work of experts in article selection from database: A case study for regulatory relations of S. cerevisiae genes in MEDLINE.” Ninth Workshop on Genome Informatics, 91-101.
Weaver, D.C., Workman, C.T. and Stormo, G.D. (1999) “Modeling regulatory
networks with weight matrices.” Pacific Symposium on Biocomputing 4, 112-123.
Wong, L. (2001) “PIES, a protein interaction extraction system.” Pacific Symposium
on Biocomputing 6, 520-531.
Authors’ Addresses
J.A. Dickerson, Electrical and Computer Engineering Department, Iowa State University, Ames, Iowa, USA. D. Berleant, Electrical and Computer Engineering Department, Iowa State University, Ames, Iowa, USA. Z. Cox, Electrical and Computer Engineering Department, Iowa State University, Ames, Iowa, USA.

32 Computational Biology and Genome Informatics
W. Qi, Electrical and Computer Engineering Department, Iowa State University, Ames, Iowa, USA. D. Ashlock, Mathematics Department, Iowa State University, Ames, Iowa, USA. E. Wurtele, Botany Department, Iowa State University, Ames, Iowa, USA. A.W. Fulmer, Proctor & Gamble Corporation, Cincinnati, Ohio, USA.

33

34