Creating an Implementable Plan to Limit Global … · NASPAA Student Simulation Competition...
37
Creating an Implementable Plan to Limit Global Warming February 27, 2016 STUDENT MATERIALS
-
Upload
dinhkhuong -
Category
Documents
-
view
221 -
download
0
Transcript of Creating an Implementable Plan to Limit Global … · NASPAA Student Simulation Competition...

Creating an Implementable Plan to Limit Global Warming
February 27, 2016
STUDENT MATERIALS


NASPAA Student Simulation Competition
February 27, 2016
Creating an Implementable Plan to Limit Global Warming
8:00 am Registration Opens
8:30 am Welcome and Introductions
8:45 am Task 1 Overview Create a mental model of how you think your sector can address climate change
9:00 am Task 1 Begins
10:00 am Task 1 Ends
10:00 am Task 2 Overview
Use the simulator and negotiate with other sectors to create a solution to climate change
10:15 am Task 2 Begins
12:00 pm Lunch available; students continue working
1:30 pm Task 2 Ends
1:30 pm Task 3 Overview
Create an implementation plan based on your best solution
1:45 pm Task 3 Begins
4:00 pm Task 3 Ends
4:15 pm Task 4: Presentations Begins
5:15 pm Judges Determine Final Winner & Students Socialize
5:45 pm Winning Team Announced

NASPAA Student Simulation Competition
February 27, 2016
INDEX
Student Case Creating an Implementable Plan to Limit Global Warming
Appendix A Getting Started: Three Policy Experiments
Appendix B Using a Simulator to Learn Policy Lessons
Appendix C Identifying Winners
Appendix D Scoring Rubric
Appendix E G-20 Engagement Group Sector Overview
Worksheet 2.1 Model Inputs
Worksheet 2.2 Model Outputs
Worksheet 2.3 Key Lessons Learned
Worksheet 2.4 Competencies Necessary to Staff a Secretariat
Worksheet 3.1 SWOT Analysis
Worksheet 3.2 Stakeholder Support
Template A Final Presentation
Template B Confidential Implementation Briefing Memo
Template C Confidential Staffing Proposal

NASPAA Student Competition | February 27, 2016
Simulation Case | Page 1 of 6
2016 NASPAA Student Simulation Competition Creating an Implementable Plan to Limit Global Warming
Xiaoai’s Career-Launching Opportunity Xiaoai Ling is thrilled about her recent job offer that will allow her to work on a team committed to solving the problem of climate change. The offer comes from the Climate Change Engagement Group of the G-20, and it is a perfect fit to her background. Originally trained as an electrical engineer in mainland China, Xiaoai’s first work experiences were with a high tech start-up firm in Hong Kong. Her MPA, completed in the United States, gave her the tools and concepts to see how innovative policies can shape and lay the groundwork for creative industrial entrepreneurial activity. Her concentration in Environmental Policy gave her the background to understand the many complexities of global climate change as a topic. Her secondary concentration in International Strategy alerted her to the emerging movement in North American businesses oriented toward sustainable entrepreneurship, combining concern for the common good with an emphasis on corporate social responsibility. Her fluency in both English and Chinese coupled with her familiarity with East Asia and North America cultures were key factors in getting her the job. Her MPA has trained her to work at the seams between technical innovation and innovative policy design—all aimed to promote global public good.
The Paris Climate Talks and the G-20’s Climate Change Engagement Group In December 2015, nearly 200 world leaders gathered in Paris, France for the United Nations Climate Change Conference (COP21) and committed to taking action to solve one of the most pressing issues facing Earth today: global warming. In unprecedented agreement, all countries – big, small, rich, poor, developed, developing, island nations, and land-locked nations – found consensus in limiting harmful emissions to mitigate the worst effects of climate change to 1.5 degrees Celsius. While this agreement set the goals, countries and their industries and citizens will be called upon to change their actions, policies, and operating structure to meet the goals and prevent devastating consequences for life on Earth. Following acceptance of the COP21 plan, talks are underway by influence groups such as the Group of Twenty (G-20) to understand the agreement and begin implementation efforts. The G-20 is an international forum for governments and central bank governors from the 20 largest economies in the world. The G-20 countries are directly involved in about 85% of the world’s economic activity, 80% of world trade, and are home to over 65% of the world’s population. The G-20 is a forum through which global economic policy can be coordinated while balancing the interests of each individual member economy. The G-20’s has long been focused on economic growth and raising the overall standard of living, but its members increasingly recognize that they should proceed cautiously to ensure that the effects of climate change, exacerbated by economic growth, do not substantially alter life on Earth. The G-20 also must ensure that the present global economy is not overly disrupted by policies intended to address climate change. The G-20 holds a summit each year, at which various Engagement Groups discuss key issues that impact the global economy. Given the intersections among climate change, land use, energy, and production, the G-20 leaders decided that a key Engagement Group of the 2016 Summit would be climate change. Each Engagement Group is led by selected Sherpas of the G-20 leaders. The Sherpas are the Chiefs of Staff to the G-20 Heads of State and they meet regularly to consider possible options and agreements in advance of final negotiations by the G-20 leaders, completed at the annual summit. Sherpas are extremely influential and needs to consider all aspects of a potential plan, especially the implementation challenges, before making a recommendation to the G-20 leaders.

NASPAA Student Competition | February 27, 2016
Simulation Case | Page 2 of 6
The Climate Change Engagement Group will provide the Sherpas with information and recommendations for addressing climate change that attempt to balance future and present needs across seven industry sectors. Xiaoai has been invited to participate in the Climate Change Engagement Group as a representative of one of seven major sectors. The seven sectors represented in the Engagement Group each have the ability to contribute to the effort to reduce global temperatures and the ability to influence other sectors:
Carbon Pricing: establishes a target for the price to be paid per ton for the right to emit CO2
Population and Consumption: sets population and GDP growth rate per capita goals
Agriculture and Land Use: sets land use and other gas (methane, N2O, fluorinated gas) emission targets
Fossil Fuels: establishes taxes for carbon-based energy sources and sets targets for reducing methane leakage. This sector is opposed to carbon pricing
Sustainable Energy: establishes subsidies for non-carbon based energy sources and sets targets for technological advances. This sector benefits from carbon pricing policies
Energy Efficiency: commits to improvements in the efficiency of mobile (i.e. cars) and stationary (i.e. houses) capital that reduce emissions
Climate Hawks (Environmental Interest Groups): works diligently to enact a carbon price.
The Climate Change Simulator The G-20’s Sherpas have already hired a team of economists, climate change scientists, and energy policy experts to create a simulation model that captures much of the objectively known data in the climate change discussions, see Reference Data below. The core of the simulation model that the Climate Change Engagement Group will be using is a long-term (years 2015 to 2100) system dynamics1 simulation of global climate change that was developed by Climate Interactive.2 Climate Interactive has built and tested many models and one was used during the Copenhagen and Paris climate change talks. The model being used by your Engagement Group today keeps track of carbon and other greenhouse gas emission targets and projects the long term impact of all commitments in terms of global temperature rise, sea level rise, and other key climate variables. The simulation model also contains data capturing the dynamics of most sources (and sinks) for greenhouse gases divided up into the seven policy sectors discussed above. Climate Interactive recently extended this model to the Sherpas to allow them to explore how policies might help the world achieve the goals outlined in the Paris climate talks. The model’s graphical interface allows users to easily explore “what if” scenarios by adjusting a number of policy levers. Today, you have access to the simulator so you can test an unlimited number of scenarios and determine their impact on global temperature3. The COP21 agreements in Paris specified a commitment to limiting temperature rise to no more than 1.5°C. As you work through this exercise, you will learn that limiting temperature rise to no more than 1.5°C is indeed technically feasible, but political infeasibility generated by stakeholder resistance of many sorts will make this goal very hard to achieve in the simulator as well as in reality. For your policy package to be considered as the winner in this global competition, it must limit the temperature rise to below 2 degrees Celsius; you should still strive for the lowest rise in temperature possible.
Your Role in this Case Your role in this case study is to assume the identity of Xiaoai. You have been hired as a staff member of the Climate Change Engagement Group to represent the interests of one of the seven sectors in a series of meetings. Information on your assigned sector is below. Your primary goal today is to protect sector interests and represent sector priorities and concerns during negotiations. As one of only a few representatives of your
1 For a brief overview of systems dynamics: http://www.systemdynamics.org/what-is-s/
2 Climate Interactive is a not-for-profit organization who helps people see what works to address climate change and
related issues like energy, water, food, and disaster risk reduction https://www.climateinteractive.org. 3 This simulator was built by Climate Interactive and has been adapted to include a set of scoring equations.

NASPAA Student Competition | February 27, 2016
Simulation Case | Page 3 of 6
sector in your Engagement Group, you will be asked to commit your sector to compromises which mitigate climate change while minimizing disruption to your existing constituency. In support of this goal, you will also have the opportunity to lobby and negotiate with other sectors to influence their willingness to compromise. Your performance is scored in three ways – by model calculation, by the judges, and by your peers. First, each run of the model will provide a World Energy Score based off of the temperature rise, the political feasibility of your solution, the GDP of your solution, and the interests of your stakeholders. Stakeholders in your sector are resistant to change, and they will be most pleased with solutions that remain close to the current status quo. To help you keep stakeholder interests in focus, each run of the simulator that your sector makes will generate a Stakeholder Contentment score. This score (scaled between 0 and 10) predicts how satisfied your particular stakeholders will be with the policies being implemented in the simulator, based on how much they need to change current practices. This is not a perfect predictor, rather a general indicator of how the proposed policies meet the self-interests of a broad assembly of stakeholders (recognizing that not all of your stakeholders share the same values and objectives). A key part of your job is to craft policy positions that will mitigate possible adverse impacts on your key stakeholders. That is, if a policy package predicts a low stakeholder contentment score for your sector, you need to convince your Engagement Group to change the policies or find ways to implement the policies that mitigate your stakeholder dissatisfaction. This stakeholder score solely takes into account the degree of change required by stakeholders and their likely reaction to that. Not included in this model is the idea of multisolving. Multisolving is the search for solutions which have very positive secondary benefits. For example, if a city builds bicycle infrastructure, they are encouraging exercise, improving health, and reducing car pollution. Many issues that might make stakeholders dissatisfied will have large secondary benefits. You should consider multisolving in your final presentation and policy brief which you will create during Task Three. You should pay attention to, and consider, the stakeholder score and the overall World Energy Score, but no not place the entirety of your focus on it. The second performance indicator comes from a judge evaluation. The judges will be playing the role of the Sherpas and interacting with you all day. They will ask you questions to test your understanding of climate change and the solutions you are devising. They will assign you a score based on your performance in Tasks One through Three and then they will assign you a score based on your final presentation. The third performance indicator comes from peer evaluation. During Task Four, peers from other Engagement Groups will judge your presentation and assign you a score. Judges and peers will use Appendix D to rate the presentations. On February 27, the judges will identify one Engagement Group as the semi-finalist for each regional site; a global winner will be selected from these eight Engagement Groups. This winner will be announced on March 1.
Four Tasks Facing Your Sector on February 27, 2016:
In preparation for your presentation to the G-20 leaders, your work today is divided into four tasks. Each sector also has sector-specific instructions. Each of you, as individuals, may have your own ideas about this sector, and what needs to be done to accomplish the temperature goal, but you should challenge yourself to assume your assigned sector role for the day and to advocate for policies that reflect your sector’s priorities. A prize will be awarded for the team that best plays the role of their stakeholders. Task 1: Create a Preliminary Policy Position. Your first task is to identify a name for your Engagement Group and familiarize yourself with your sector description and the interests of your stakeholders. Then, you will design a package of recommendations that your sector believes will limit global warming to no more than 2°C. This proposal will be created without the help of the simulator – just use good policy reasoning and critical thinking skills. You should not discuss your decisions and proposals with other sectors; at the end of Task One, each sector’s decisions will be entered into the model and discussed.

NASPAA Student Competition | February 27, 2016
Simulation Case | Page 4 of 6
Task 2: Refine Your Policy Position Using the Simulator and Negotiation. Your second task is to explore and experiment with the simulator to identify a comprehensive policy package for your entire Engagement Group that limits global warming. It will begin with a structured learning exercise so you understand how the simulator works. Then, you will use the simulator on your own to test scenarios and understand their impact through the year 2100. Armed with scenarios from the model, you now must negotiate with the other sectors to collectively achieve climate goals. Your Engagement Group will come up with two proposals in this Task – identified later as 2b and 2c. During this task, the simulation will help you see unintended consequences and benefits of actions and should spur you to think creatively about building consensus and appeasing stakeholders. Throughout Task Two, your group should be using pre-prepared worksheets to document lessons learned from using the simulator, which will help you develop your final products in Task Three. Task 3: Think Through Policy Implementation and Adaption. Actually stopping global warming requires more than just conversations and commitments from each sector. It involves getting into the specifics of policy implementation and adaption – the real work of a public administrator. At this time, your Engagement Group should have an agreed upon policy package (from Task 2c), and you will now create an implementation plan. At this point, the hard work begins: moving to action. After completing Worksheets 3.1 and 3.2, your Engagement Group will split up into three different focus groups composed of representatives from each sector. These new groups will create three different final products to represent your proposal to the G-20 Leadership.
Group A: Final Presentation Product: Presentation of Plan’s Implementation Opportunities and Stakeholder-Based Support This PowerPoint presentation will be created in Task Three and delivered in Task Four, and it will outline key aspects of your G-20 Engagement Team’s Climate Change Policy Proposal. This is intended to be a public-facing statement. The tone of this product should be positive and upbeat, reflecting an attitude that reaching our climate goals is possible. This group is responsible for delivering the presentation on behalf of your engagement group in Task Four. Reference Template C for a suggested outline. Group B: Two-Page Confidential Implementation Briefing Memo Product: Confidential Analysis of Plan’s Implementation Barriers and Stakeholder-Based Resistance A key component of a solid implementation plan will be a clear analysis of where policy resistance is likely to occur and what might be done about it. Since these are likely to be sensitive issues, this product takes the form of a confidential policy memo to the G-20 Sherpa group. The memo identifies policy implementation challenges and areas where stakeholder support is lacking. Reference Template B for a suggested outline. Group C: Two-Page Confidential Staffing Proposal Product: Action Plan for Moving forward with G-20’s Proposed Policies on Global Climate Change The G-20 leaders seek advice and guidance on how to begin longer term development and implementation of their policies. The Sherpa group has already committed to hiring a long-term staff secretariat to work on this important policy issue. In this memo, your Engagement Group will provide guidance on how to manage and organize this effort including staffing suggestions based on skills and competencies. Reference Template C for a suggested outline.
Task 4: Present Your Policy Implementation Package to Peers and Judges. Representatives from Group A will give the presentation to judges and peers. The presentation should be no more than 10 minutes with an additional 5 minutes allowed for questions. Presentations will be evaluated by the judges and your peers using Appendix D. You will not evaluate your own group.

NASPAA Student Competition | February 27, 2016
Simulation Case | Page 5 of 6
Reference Data The graphs below show historical trends in global Carbon Dioxide (CO2) and other greenhouse gas emissions, as well as population and other economic measures. The graph below shows total CO2 emissions from 1860 – 2012, as a stacked graph, where each source of CO2 is layered on top of the others. Notice several features:
1. Substantial growth in CO2 emissions, accelerating after World War II 2. The growth in the share of emissions from burning coal, oil, and gas in the past several decades. 3. Progress in reducing emissions from deforestation in the past twenty years.
Source: Data from BP Statistical review, compiled by Manicore.
The graph above shows only emissions of CO2. The graph below shows emissions of other greenhouse gases (GHGs), including error bars, on the right, showing uncertainty. Emissions of the other GHGs are measured in billion tons of CO2 equivalents per year, or GtCO2e/year (Global Total CO2 equivalents per year). “FOLU” stands for “Forestry and Other Land Use.” After CO2, the most important GHGs today are methane (CH4) and nitrous oxide (N2O).
Source: IPCC AR5.
Relevant trends appear below. Some show historical data only; others also include projections to 2100.

NASPAA Student Competition | February 27, 2016
Simulation Case | Page 6 of 6
The graphs below show the Energy and CO2 intensity of the economy. Energy Intensity is a measure of the energy efficiency of the economy. This is calculated as units of energy used per unit of GDP (Gross Domestic Product). If the number is high, then it requires a lot of energy to produce GDP. If low, it requires less. In this graph, we see that Energy Intensity is falling and we are becoming more efficient. CO2 intensity is a similar measure relative to GDP.
The graph below shows the temperature change above preindustrial levels (pre-1750) that has occurred and is projected for the future. It is this trend that you are tasked to reverse. The table below shows relevant data for various countries.
Energy Intensity of the Economy
12
11
10
9
8
1990 1995 2000 2005 2010
Time (Year)
EJ/
Tri
llio
n$
Average total primary energy intensity of GDP : Ref
Source: UN, DESA, Pop. Division (2011) Source: A. Maddison (2008)
Sources: En-ROADS and US EIA (2012)
Annual GDP Growth Rate
(1950-2008): 2.16%/year
(2010)
Population GDP/ capita
Energy/ capita
(kg of oil equiv. per
capita)
CO2/ capita (metric
tons per capita)
U.S. 309m $48,358 7,162 17.6
Italy 60m $33,761 2,815 6.7
China 1.34b $4,433 1,881 6.2
India 1.21b $1,417 600 1.7
Brazil 195m $10,978 1,362 2.2
Zambia 13m $1,225 609 0.2
Source: World Bank
Source: En-ROADS, calibrated to SRES A1FI

NASPAA Student Competition | February 27, 2016
Appendix A: Getting Started| Page 1 of 2
Appendix A: Getting Started: Three Policy Experiments Use this Appendix to assist you in Task 2a and in filling out Worksheet 2.2. This worksheet will guide you to creating three simulation runs and challenges you to think deeper about how to interpret simulation results. Worksheet 2.1: Model Inputs This worksheet identifies all of the model levers and their minimum and maximum settings. The two shaded columns on the right indicate the two extreme possibilities of climate change: the world does nothing (Business as Usual), and all solutions are implemented immediately to minimize temperature change (Extreme Policies). The column just to the right of the shaded area provides a verbal synopsis of what the extreme setting for each policy lever means. While the Extreme Policies package is probably not realistic or politically feasible, the simulator is capable of showing you the consequences of this extreme policy package. Worksheet 2.1 Part 2 On this page, if desired, your team can note the inputs to one or more interesting policy runs that your sector team makes. You can also use the “Save” function within the simulator to track important runs. Then any time you want to retrieve that run, you can reload the run using the “Manage Runs” tab in the main simulator menu. If you record runs in both places, make sure your label them similarly. Worksheet 2.2: Outputs This worksheet provides space to record the model scores based on the levers you move; scores are visible when you click the NASPAA tab at the top of the simulator. The two shaded columns on the left are the scores that correspond to the shaded input columns in Worksheet 2.1. Only the scores for the Business as Usual run is identified, and it is rather low (indicating that doing nothing is not a very good policy for addressing global warming in the simulator) Policy Experiment #1: Replicate the Business as Usual Run The first run that you should make is a replication of the Business as Usual run. You could also label this run as “Current Situation” or “Base Run.” This run depicts the consequences of a “do nothing” policy package. It is a good prediction of what will happen if the world does nothing to address the climate change situation. Completing this first run is easy because no changes are made to the levers in the model. Press Run on the simulator and then click on the NASPAA tab to see the scores. The scores on the screen will match the scores in the shaded area of Worksheet 2.2 under the column “Business as Usual.” In this run, you should note that the overall World Energy Score is not very good. This is for several reasons:
The temperature change in degrees is 4.3 degrees Celsius—way above what today’s scientists think is an acceptable increase. Thus, the Temperature Score (on a 0-10 scale) is 0.
The Political Feasibility Score is very high on a 0-10 scale (because not changing is very feasible)
The GDP per Capita Score is also very high on the 0-10 scale because doing nothing does not interfere with normal efforts to sustain and increase the material standard of living.
The Stakeholder Contentment Score (also on a 0-10 scale) seems low at 5.8. When you look at individual sector stakeholder contentment scores, you see that this low stakeholder contentment is for two reasons. First, the Sustainable Energy Sector and the Climate Hawks are not content with a Business as Usual policy. Second, the polarization of stakeholder contentment scores (as measured by the score spread among the seven sectors) is relatively high and when this spread is too high, overall Stakeholder Contentment is even lower. You may wish to even out the stakeholder contentment scores.
After seeing these results, make sure you understand what happened and the corresponding scores. If not, you should ask the Simulation Leader (who is rotating through each classroom) for assistance. You can also reference Appendix C for more details on the scoring equations.

NASPAA Student Competition | February 27, 2016
Appendix A: Getting Started| Page 2 of 2
Policy Experiment #2: Extreme Policies Refer to the shaded column in Worksheet 2.1 that is labeled “Extreme Policies.” This column identifies all of the changes you could possible make to avert a global rise in temperature. While doing all these things may not be realistic, the simulator permits you to explore this set of extreme “what if” policies. To run this policy package, take the values in Worksheets 2.1’s Extreme Policy run column and enter them into the simulator. Now stop! Before you actually click Run, think about what is about to happen and discuss within your sector team what you expect will happen. Specifically write down your predictions to the following questions:
I. Will the World Energy Score go up or go down? By how much? Why do you think so?
II. What is your prediction for what will happen to each of the four major scoring components? Predict what you think will happen to each of these scores
Temperature Score
Feasibility Score
GDP per Capita Score
Stakeholder Contentment Score.
III. Pick the three Stakeholder Contentment Scores that you predict will change the most when the Extreme Policies package is implemented. Note why you think these are the stakeholders whose contentment score will change the most. Make sure to write down your predictions before your make the run.
NOW, CLICK RUN! OK, so how did you do?
IV. Where were your predictions most accurate? Where were your predictions farthest from what actually happened? Why? What did you learn from running the simulation?
A comment on Good Policy Analysis. You might have had difficulty determining what would happen and why it would happen in the Extreme Situation because you moved so many levers. Appendix B will help you build a good policy experiment and suggests that you should limit the number of lever you move on any given run.
Policy Exercise #3: Design Your Own Policy Run. Now it’s your turn, identify levers to adjust and move them. Before executing the run, identify what you think will happen, and then analyze your results versus your predictions. Appendix B can help you design a good run.
NASPAA Student Competition | February 27, 2016
Appendix B: Using a Simulator to Learn Policy Lessons| Page 1 of 2
Appendix B: Using a Simulator to Learn Policy Lessons
In Task Two, you will be completing many runs of the simulator to learn what policy packages will work best to
achieve the 2 degree goal. Outlined below are tips and pointers on how to design each policy run so that you
learn the most.
You should approach using the simulator as if you were designing a structured scientific experiment. Frist, you
should create hypotheses about what kind of policies might work and then use the simulator to test your
hypothesis. Always identify what you expect to happen and compare your expectations with what actually
happened in the simulator. You will probably learn the most when you think more and compute less. After each
run, you should strive to understand why you received the specific outcome. Use Worksheet 2.1 (Inputs) and
Worksheet 2.2 (Outputs) to keep track of the changes you make and what the outcomes are of those changes.
On Worksheets 2.3 and 2.4, you should document lessons learned and their implications for staffing.
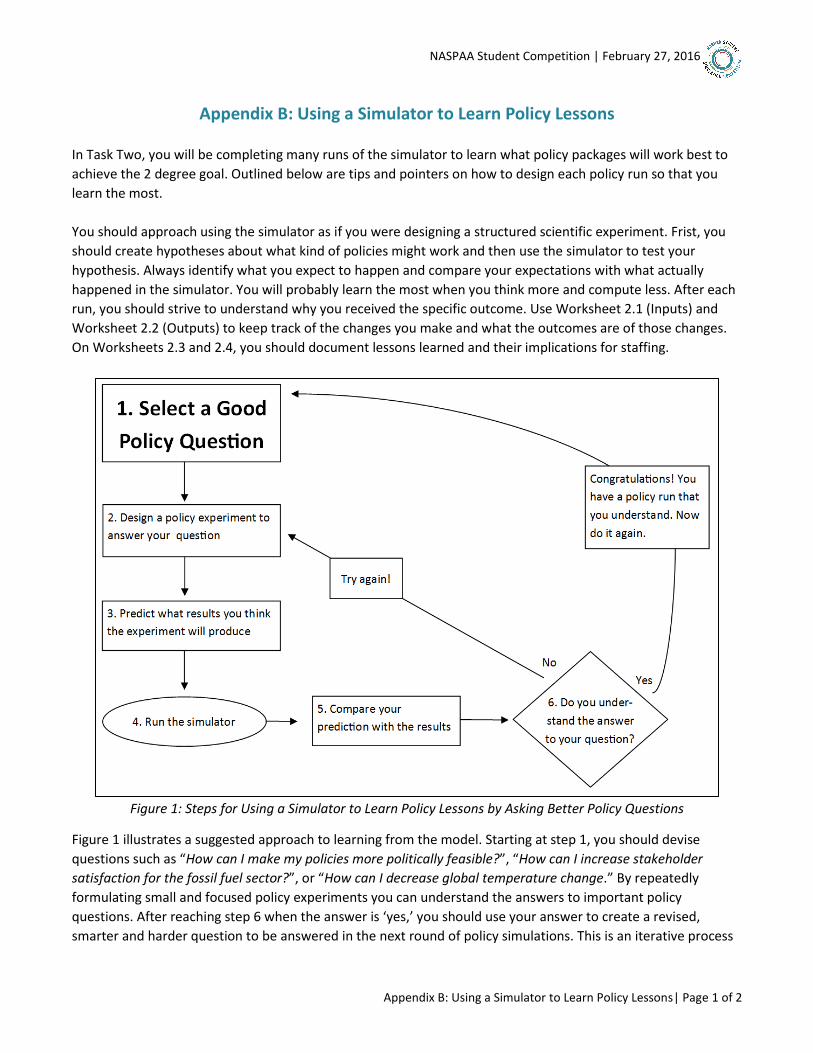
Figure 1: Steps for Using a Simulator to Learn Policy Lessons by Asking Better Policy Questions
Figure 1 illustrates a suggested approach to learning from the model. Starting at step 1, you should devise
questions such as “How can I make my policies more politically feasible?”, “How can I increase stakeholder
satisfaction for the fossil fuel sector?”, or “How can I decrease global temperature change.” By repeatedly
formulating small and focused policy experiments you can understand the answers to important policy
questions. After reaching step 6 when the answer is ‘yes,’ you should use your answer to create a revised,
smarter and harder question to be answered in the next round of policy simulations. This is an iterative process
NASPAA Student Competition | February 27, 2016
Appendix B: Using a Simulator to Learn Policy Lessons| Page 2 of 2
between identifying your predictions and understanding the simulation results. Below is further explanation of
all steps.
Step 1: Select a Good Policy Question
You should not run a simulation of a complex policy system unless you have a clear purpose or policy question
identified. For example, you might want to figure out how to increase political feasibility or how to decrease
global temperature.
Step 2: Design a Policy Experiment to Answer Your Question
A good policy experiment always involves sliding only one, or at most two, policy lever(s) as a way to test a
mental hypothesis. For example, if you were beginning with the Extreme Policy Package and your policy
question was “How can I make this policy more politically feasible,” then you should hypothesize one or two key
policies that you believe should have an impact on feasibility. If you started with the Current Situation run, you
might have a hypothesis about one particular policy that would have a big impact on global temperature change.
When completing Worksheet 2.1, you should identify what your hypothesis is that is driving the lever
movement.
Step 3: Use Your Mental Model to Predict the Policy Package Outcome
Before you use the simulator to run your next policy, discuss what you expect the results to be on the overall
system. During this process, document your key lessons learned on Worksheet 2.3.
Step 4: Simulate Your Proposed Policy Package
Move the selected lever(s) and click Run.
Step 5: Compare Your Predictions to the Simulation Results
Review the NASPAA tab to see your score and results and review key graphs such as the temperature change,
the carbon emissions, and the percentage of energy supply by source. Document any reactions that you had
when you reviewed the simulation results. Did you see anything surprising? You should look at all output
variables, especially the NASPAA tab with the score. Did your policy have any unintended consequences? How
about unintended benefits? Compare your policy run to the run you selected as the basis for your hypothesis.
Step 6: Do You Understand the Answer to the Policy Question that You Asked?
For example, if you were trying to understand political feasibility, does your proposed policy package give you
the results that you had thought it would? Carefully, evaluate whether or not your policy worked as you thought
it would. If it did work well, explain why you think it was successful. If you proposed policies did not have the
hypothesized effects, do you have a theory of why not? When you think that you have learned an important
policy lesson, write it on Worksheet 2.3.
Step 7: Repeat from either Step 1 or Step 2

NASPAA Student Competition | February 27, 2016
Appendix C: Identifying Winners | Page 1 of 2
Appendix C: Identifying Winners NASPAA’s Global Simulation Competition will result in eight semi-finalists and an overall Winning Engagement Group. Each site will also award three prizes to the sector that best played their role during the competition.
8 Regional Winners (Semi-Finalists) The eight regional winners will be determined to be those teams that have the highest combined score at the end of the day’s competition. The combined score is a weighted combination of:
1. The calculated World Energy Scorecard associated with the team’s best run for Task 2 (35%) 2. The average score from judges as assigned at the end of the day based on all tasks (45%) 3. The average score from the peer review of presentations at the end of the day (20%)
World Energy Scorecard—Machine Scoring (35%) The EN-Roads Climate Simulator will evaluate your team’s performance along four dimensions:
1. Global Temperature Rise (35%). An Engagement Group must keep the global temperature rise below 2°C; the lower the temperature rise, the higher the score.
2. Political Feasibility of Your Proposal (25%). Based on four aspects:
• Not proposing unrealistic decreases in world population growth
• Not proposing unrealistic decreases in the world’s overall economic growth (as measured by GDP/Capita),
• Not totally alienating a powerful carbon energy sector
• Presenting a solution with good ideas for implementation and funding The score measures the first three dimensions of feasibility and is computed as a function of stakeholder contentment. The main determinant of feasibility is an average of stakeholder contentment for population, GDP/Capita (as a proxy for economic group), and the carbon energy-supply stakeholders. However and importantly, if satisfaction for any one of these groups falls, a non-linear effect can suddenly reduce overall feasibility of your proposal. Judges will also use a rubric to evaluate feasibility.
3. GDP per capita (25%). GDP per capita is an important measure of economic growth and the world’s overall material standard of living. Other things being equal, a higher GDP per capita will receive a better score. This criterion reaches 10 when the value of simulated GDP per capita at the end of the simulation is about the same as in the base run. While GDP isn’t the only measure of growth and happiness, it is a good indicator and the most reasonable to compute in the model.
4. Overall Stakeholder Contentment (15%). The EN-Roads simulator has a built-in measure that indicates how content each stakeholder group is, based on the proposed policy actions. This is a self-interested measure of stakeholder contentment. In general, the measure starts out high because stakeholders like the status quo, and it drops lower as the model levers are moved to address the climate change challenge. The actual computation of overall stakeholder satisfaction begins by averaging the stakeholder satisfaction from all seven sectors and rescaling them to a 1-10 scale. In addition, this score is decreased as the variability between sector scores increases.
The World Energy Scorecard is calculated within the simulator and combines these four key performance areas using the specified weighting. The scorecard can be viewed for any run a Group makes, but the best score as submitted in Task 2c will be used to identify the Semi-Finalist at each regional host site. Judges’ Evaluation (45%) Groups will interact with judges throughout the day and judges will probe for how well each team meets the goals for climate change and economic growth while also meeting stakeholder needs. Three key sets of stakeholders drive overall feasibility: Population and Growth stakeholders, Economic Growth stakeholders, and Fossil Fuel stakeholders. Students are evaluated according to how well they can present a compelling view of

NASPAA Student Competition | February 27, 2016
Appendix C: Identifying Winners | Page 2 of 2
why and how their policy package is performing (as opposed to just presenting final scores for key variables). An excellent team performance meets or exceeds the climate change goals while maintaining robust economic growth and minimizing stakeholder dissatisfaction. Solutions that find win-win policies that improve stakeholder satisfaction, hold down costs, and meet multiple goals add to an excellent solution. Judges will also be paying special attention to implementation issues and how policies are being funded. The judging rubric is found in Appendix D. Peer Evaluation of Proposals (20%) During Task Four, each Engagement Group presents their best policy package to their peers and the judges in a presentation lasting no more than 10 minutes, and then fielding 5 minutes of questions. Students will be asked to judge each presentation that is not their own; the judging rubric is found in Appendix D. Students will not evaluate their own team.
Best Sector Performance Each site will award a prize to the sector in each Engagement Group that best played their role during the competition. This award is given to that sector team that has done the best job protecting the interests of their stakeholders during the day’s competition. A major criteria to be used in awarding this prize will be the ability of the chosen sector players to keep their sector contentment score from declining (or declining as little as possible) over the course of the day.
Winning Engagement Group for Best Performance The global winner and runner up will be selected by a panel of judges that will meet virtually on February 29.
This panel will review each of the 3 products created by the semi-finalist team: the PowerPoint presentation
(see Template A), the confidential briefing (see Template B), and a 2 page staffing proposal (see Template C).
NASPAA Student Competition | February 27, 2016
Appendix D: Scoring Rubric Page 1 of 1
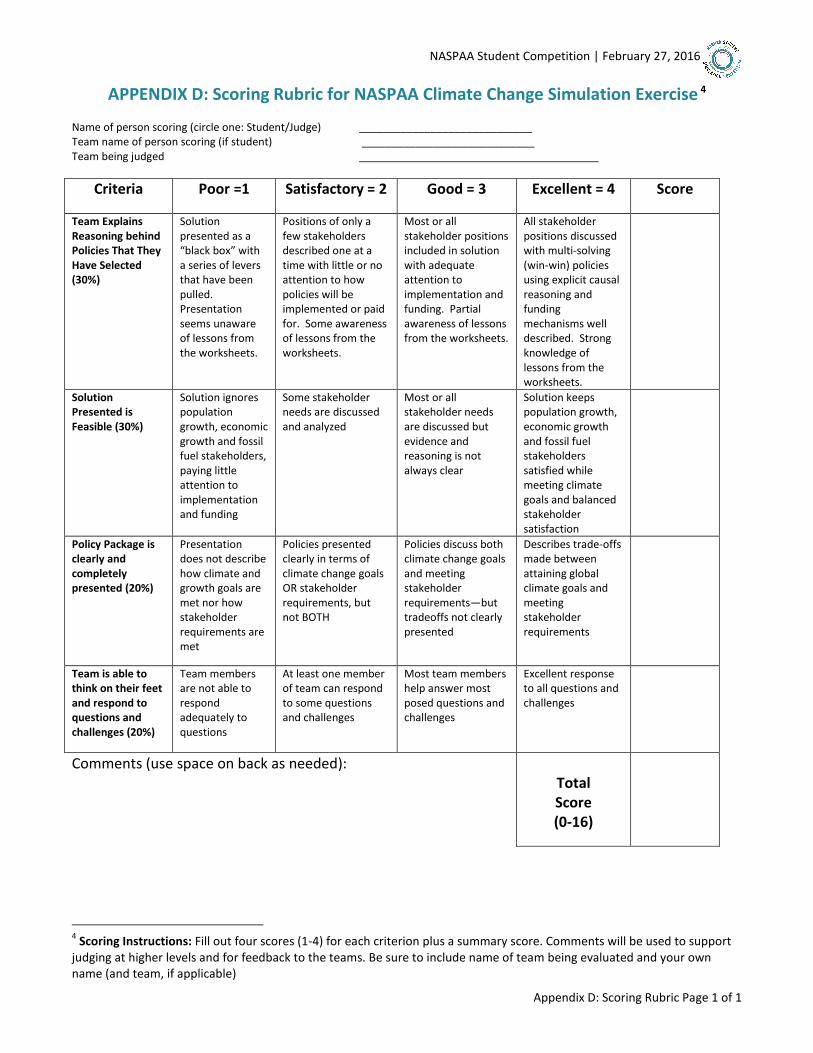
APPENDIX D: Scoring Rubric for NASPAA Climate Change Simulation Exercise 4 Name of person scoring (circle one: Student/Judge) _____________________________ Team name of person scoring (if student) _____________________________ Team being judged
Criteria Poor =1 Satisfactory = 2 Good = 3 Excellent = 4 Score
Team Explains Reasoning behind Policies That They Have Selected (30%)
Solution presented as a “black box” with a series of levers that have been pulled. Presentation seems unaware of lessons from the worksheets.
Positions of only a few stakeholders described one at a time with little or no attention to how policies will be implemented or paid for. Some awareness of lessons from the worksheets.
Most or all stakeholder positions included in solution with adequate attention to implementation and funding. Partial awareness of lessons from the worksheets.
All stakeholder positions discussed with multi-solving (win-win) policies using explicit causal reasoning and funding mechanisms well described. Strong knowledge of lessons from the worksheets.
Solution Presented is Feasible (30%)
Solution ignores population growth, economic growth and fossil fuel stakeholders, paying little attention to implementation and funding
Some stakeholder needs are discussed and analyzed
Most or all stakeholder needs are discussed but evidence and reasoning is not always clear
Solution keeps population growth, economic growth and fossil fuel stakeholders satisfied while meeting climate goals and balanced stakeholder satisfaction
Policy Package is clearly and completely presented (20%)
Presentation does not describe how climate and growth goals are met nor how stakeholder requirements are met
Policies presented clearly in terms of climate change goals OR stakeholder requirements, but not BOTH
Policies discuss both climate change goals and meeting stakeholder requirements—but tradeoffs not clearly presented
Describes trade-offs made between attaining global climate goals and meeting stakeholder requirements
Team is able to think on their feet and respond to questions and challenges (20%)
Team members are not able to respond adequately to questions
At least one member of team can respond to some questions and challenges
Most team members help answer most posed questions and challenges
Excellent response to all questions and challenges
Comments (use space on back as needed):
Total Score (0-16)
4 Scoring Instructions: Fill out four scores (1-4) for each criterion plus a summary score. Comments will be used to support
judging at higher levels and for feedback to the teams. Be sure to include name of team being evaluated and your own name (and team, if applicable)

NASPAA Student Competition | February 27, 2016
Appendix E: Sector Overviews Page 1 of 2
APPENDIX E: G-20 Engagement Group Sector Overview
Each G-20 Engagement Group consists of seven sectors, one of which you will represent. The following is a brief overview of the other sectors to prepare you to negotiate effectively.
CARBON PRICING This sector represents government officials from the world’s leading economies and makes decisions in two areas:
The global average carbon price ($/ton of CO2), if any,
How the revenue collected from that price will be split among various constituencies including the fossil fuel industry, the sustainable fuel industry, and the public at large through tax cuts.
Government officials and leading emitters are quite content to do nothing until forced to. Carbon pricing will cause a direct cost to the fossil fuel industry and will drive demand from their energy supply to renewables. This will reduce their revenues and could lead to them having to retire business units before they have fully exhausted their earning capacity. At the same time, government officials gain from powerful industry lobbying. To avoid upsetting major donors, they will avoid the need to raise carbon prices.
CLIMATE HAWKS
This sector does not make any decisions. Their goal is to promote the strongest possible agreement to limit greenhouse gas (GHG) emissions, starting immediately. Unlike other groups, they are not beholden to vested interests and are free to advocate for policies and actions that could move society to swiftly and effectively address climate change.
ENERGY EFFICIENCY This sector represents the combined public voice of the car and truck industries, airline industries, public transit authorities, industrial machinery and appliance manufacturers, energy efficiency incentive programs of electric utilities, residential/commercial builders, and the real estate industry. They make decisions related to:
Improvements in Energy Intensity
The annual rate of energy efficiency improvements for mobile (transportation) emission sources
The annual rate of energy efficiency improvements for stationary (buildings and utilities) emissions sources.
The energy efficiency sector is made up of automobile manufacturers and developers responsible for building and modifying existing stationary buildings. Initially, these stakeholders are very content with the status quo. They feel that they are already making good progress on their annual increases in energy efficiency requirements. If your policy packages require them to become more efficient than this status quo, they will be less content because of these policy mandates.
FOSSIL FUEL This sector includes representatives of the fossil fuel producers—coal, oil, and natural gas. The fossil fuel industry includes publicly traded oil and gas companies (e.g., ExxonMobil, BP, Shell), national oil and gas companies (e.g., Petrobras, Saudi Aramco), coal companies, electric utilities heavily dependent on fossil fuels, and firms that supply equipment to these industries (e.g., Halliburton, Schlumberger; the fossil-supplying divisions of firms like Siemens and GE). This sector makes decisions in three areas:
Decide taxes (labeled price in the model) for oil, coal, and gas energy supply
Determine breakthrough cost improvements from R&D for oil, coal, and gas energy supply
Implement policies to reduce methane leakage from natural gas production and distribution Attempts to intervene with policy actions can create two kinds of powerful reactions among your stakeholders and within the scoring logic of the simulator. First, instituting taxes on fossil fuels will be heavily resisted by powerful industry interest groups. It can also create a public outcry as the cost of gasoline and heating houses and businesses rises.

NASPAA Student Competition | February 27, 2016
Appendix E: Sector Overviews Page 2 of 2
LAND AND AGRICULTURE This sector represents leaders for the land use, forestry, and agriculture sectors, your constituency includes large agricultural producers and landowners, government ministries of forests and agriculture, agriculture oriented and land conservation think tanks, and agriculture and forestry related industry and manufacturing. Your sector makes decisions in two areas:
Global forestry, agriculture, and other land use
Emissions in greenhouse gases other than CO2, including Methane, N2O, and the F-gases These stakeholders are initially quite content with the status quo, but as your policy packages push them to further reduce land use, forestry, or other green house gases, they will become less content.
POPULATION AND CONSUMPTION
This sector represents the combined public voice of government ministries, the United Nations, NGOs across nations and the political spectrum (such as, Zero Population Growth, and the Club for Growth), religious organizations, social change movements and business organizations such as Chambers of Commerce. They make decisions that effect the following areas:
Population
Economic Development, measured specifically in terms of growth in Annual Gross Domestic Product (GDP) per capita
These stakeholders are very powerful, difficult to keep satisfied, and interested in quite different things. Attempts to intervene with policy actions to change population growth can create two kinds of powerful reactions among their stakeholders First, global changes to population growth, especially efforts to decrease population growth, typically involve global changes in lifestyle. A second and related point is that some very powerful stakeholders, especially religious organizations, may be deeply tied to the status quo.
SUSTAINABLE ENERGY This sector includes representatives of producers of low-carbon and renewable energy—nuclear, hydro, biofuels, wind, solar, geothermal, etc. Renewable energy leaders include established wind, solar, hydro and nuclear companies (e.g., FirstSolar, Areva), renewable energy start-ups (including firms in solar, wind, smart grid, and storage) and the low-carbon or renewable energy divisions of oil and gas companies, electric utilities, and firms that supply these industries such as Siemens and GE. This sector makes decisions in two areas:
Taxes and/or subsidies for renewable, biomass., and nuclear energy sources
Breakthrough cost improvements from R&D for renewable, biomass. nuclear energy, and radical new technology for sustainable energy sources
Attempts to intervene with policy actions will usually require federal spending that is not currently in the budget. The pressure to raise taxes or cut spending in order to support this spending will cause an uproar.

NASPAA Student Competition | February 27, 2016
Worksheet 2.1 Page 1 of 4
WORKSHEET 2.1: MODEL INPUTS
Identified below are all of the levers in the model organized by which stakeholder group controls them. Use this worksheet to help you understand who controls which levers. The "Business as Usual" (BAU) column replicates the current actual situation in 2016. The "Extreme Policies" column replicates the situation that would keep global temperature the lowest if every solution were to be implemented tomorrow; it could also be called Full Throttle. Reference this worksheet if you are uncertain which direction a lever moves in or to determine the minimum/maximum settings. When printed, this worksheet is in 4 pages; please arrange accordingly.
STAKEHOLDER GROUP
LEVER GROUP
LEVER UNITS MIN MAX Business as Usual (BAU)
Extreme Policies
CLIMATE HAWKS GLOBAL
POPULATION & CONSUMPTION
GLOBAL Population Scenario Scenario 1, 2, or 3 1 3 3 1
GDP per Capita Growth Rate % growth 0 4 2 0.00
AGRICULTURE & LAND USE
GLOBAL Land Use & Forestry % reduction 0 0.99 0 0.99
Other Gases % reduction 0 0.99 0 0.99
FOSS
IL F
UEL
SU
PP
LY
CO
AL
Tax/Subsidy $/GJ -10 10 0 -10.00
Start Year Year 2015 2100 2015
Stop Year Year 2013 2100 2015
Breakthrough improvement fractional reduction 0 0.99 0 0.00
Breakthrough Year Year 2020 2100 2020
Accelerated retirement %/yr 0 10% 0 0.10
OIL
Tax/Subsidy $/GJ -10 10 0 -10.00
Start Year Year 2015 2100 2015
Stop Year Year 2013 2100 2100
Breakthrough improvement fractional reduction 0 0.99 0 0.00
Breakthrough Year Year 2020 2100 2020
GA
S
Tax/Subsidy $/GJ -10 10 0 -10.00
Start Year Year 2015 2100 2015
Stop Year Year 2013 2100 2100
Breakthrough improvement fractional reduction 0 0.99 0 0.00
Breakthrough Year Year 2020 2100 2020
Methane Leakage Reduction % 0 6 3 0.00

NASPAA Student Competition | February 27, 2016
Worksheet 2.1 Page 2 of 4
SUST
AIN
AB
LE E
NER
GY
REN
EWA
BLE
S Tax/Subsidy $/GJ -10 10 0 10.00
Start Year Year 2015 2100 2015
Stop Year Year 2013 2100 2100
Breakthrough improvement fractional reduction 0 0.99 0 0.99
Breakthrough Year Year 2020 2100 2020
BIO
MA
SS Tax/Subsidy $/GJ -10 10 0 10.00
Start Year Year 2015 2100 2015
Stop Year Year 2013 2100 2100
Breakthrough improvement fractional reduction 0 0.99 0 0.99
Breakthrough Year Year N
UC
LEA
R Tax/Subsidy $/GJ -10 10 0 10.00
Start Year Year 2015 2100 2015
Stop Year Year 2013 2100 2100
Breakthrough improvement fractional reduction 0 0.99 0 0.99
Breakthrough Year Year 2020 2100 2020 2020
NEW
TE
CH
Tax/Subsidy $/GJ -10 10 0 10.00
Start Year Year 2015 2100 2015
Stop Year Year 2013 2100 2100
Breakthrough improvement fractional reduction 0 0.99 0 0.99
Breakthrough Year Year 2020 2100 2020 2020
ENERGY EFFICIENCY
GLOBAL Energy Efficiency: Stationary improvement % -1 7 1.2 7.00
Energy Efficiency: Mobile improvement % -1 7 0.5 7.00
CARBON PRICING
GLOBAL Carbon Emissions Price $/ton 0 200 0 200
Start Year Year 2015 2100 2015
Allocation of Collected Carbon
Taxes
GLOBAL
Fraction to Fossil Fuel Industry fraction 0 1.0
Fraction to Sustainable Energy fraction 0 1.0
Fraction to Public fraction 0 1.0
NASPAA Student Competition | February 27, 2016
Worksheet 2.1 Page 3 of 4
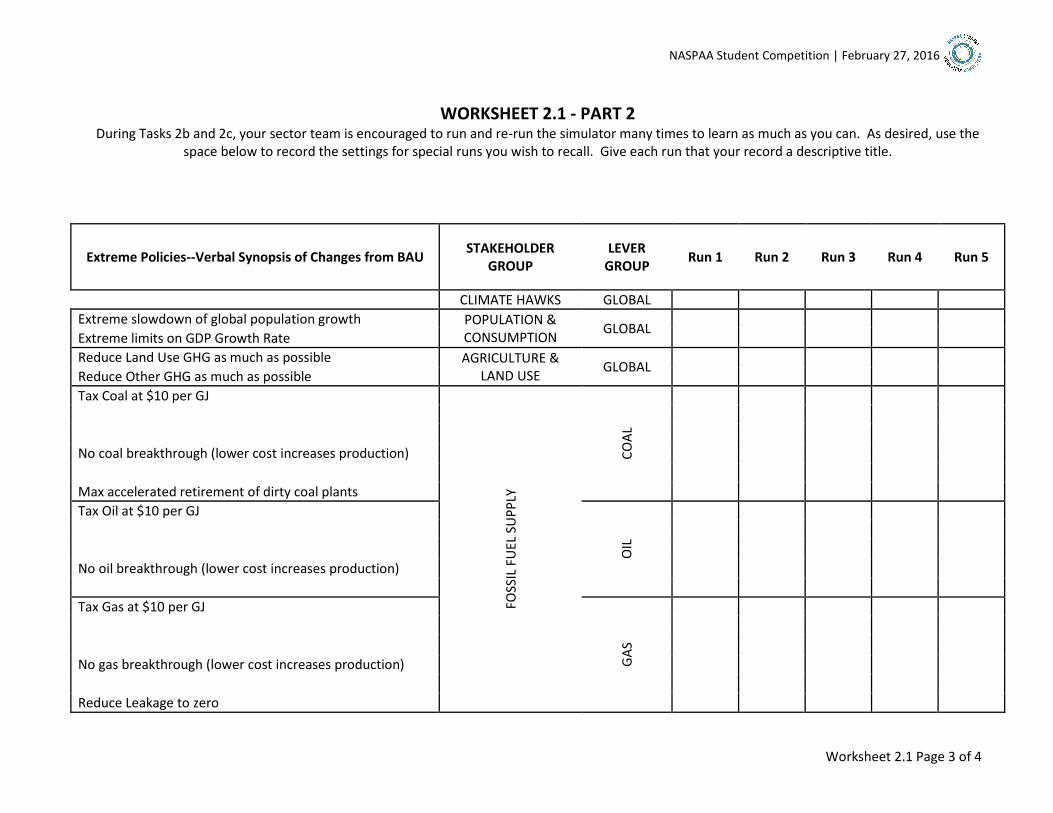
WORKSHEET 2.1 - PART 2 During Tasks 2b and 2c, your sector team is encouraged to run and re-run the simulator many times to learn as much as you can. As desired, use the
space below to record the settings for special runs you wish to recall. Give each run that your record a descriptive title.
Extreme Policies--Verbal Synopsis of Changes from BAU STAKEHOLDER
GROUP LEVER
GROUP Run 1 Run 2 Run 3 Run 4 Run 5
CLIMATE HAWKS GLOBAL
Extreme slowdown of global population growth POPULATION & CONSUMPTION
GLOBAL
Extreme limits on GDP Growth Rate
Reduce Land Use GHG as much as possible AGRICULTURE & LAND USE
GLOBAL
Reduce Other GHG as much as possible
Tax Coal at $10 per GJ
FOSS
IL F
UEL
SU
PP
LY
CO
AL
No coal breakthrough (lower cost increases production)
Max accelerated retirement of dirty coal plants
Tax Oil at $10 per GJ
OIL
No oil breakthrough (lower cost increases production)
Tax Gas at $10 per GJ
GA
S
No gas breakthrough (lower cost increases production)
Reduce Leakage to zero

NASPAA Student Competition | February 27, 2016
Worksheet 2.1 Page 4 of 4
Renewables are subsidized at $10 per GJ
SUST
AIN
AB
LE E
NER
GY
REN
EWA
BLE
S
Max cost reduction Increases production
Subsidize Biomass at $10 per GJ
BIO
MA
SS
Max cost reduction Increases production
Subsidize Nuclear at $10 per GJ
NU
CLE
AR
Max cost reduction Increases production
Subsidize New Tech at $10 per GJ
NEW
TE
CH
Max cost reduction Increases production
7% annual efficiency improvement is Max possible ENERGY EFFICIENCY
GLOBAL
7% annual efficiency improvement is Max possible
Carbon Price set to Maximum--$200 / ton CARBON PRICING
GLOBAL
Allocation of Collected Carbon
Taxes
GLOBAL

NASPAA Student Competition | February 27, 2016
Worksheet 2.2 Page 1 of 1
WORKSHEET 2.2: MODEL OUTPUTS
Identified below is space to track the results of your runs. In Task 2a, you should fill in the score from the Current Situation run and the Extreme Situation run. During Tasks 2b and 2c, use the columns to the right to track the runs that you would like to record.
Complete in Task 2a
Complete in Tasks 2b and 2c; fill in as many or as few as you want
Business as Usual
Extreme Policies
Run 1 Run 2 Run 3 Run 4 Run 5
Overall Numerical Score
World Energy Score (0 - 10) 5.84
World Energy Score Components
Temperature Change in Degrees C 4.3
Temperature Score (0 - 10) 0
Feasibility Score (0 - 10) 9.8
GDP per Capita Score (0 - 10) 10
Stakeholder Contentment (0 - 10) 5.8
Stakeholder Contentment Score (0 -10)
Carbon Price Sector Score 10
Population and Consumption Sector 10
Agriculture and Land Use Sector 10
Fossil Fuel Sector 9.5
Energy Efficiency Sector 9.9
Sustainable Energy Sector 1.9
Climate Hawks Sector 0.7

NASPAA Student Competition | February 27, 2016
Worksheet 2.3 Page 1 of 1
WORKSHEET 2.3: KEY LESSONS LEARNED
Sector Name:_________________________
Below, record insights and key lessons learned from the En-Roads Simulator. This worksheet is like a lab
notebook used by physical scientist to keep track of results in experiments. Data collected on this worksheet will
be used during Task Three primarily to create Product 1: PowerPoint Summary of your best policy proposal. You
should document as many lessons as you identify, use additional pages as necessary.
Observation #1: What run of the simulator?
What did you observe in the output that was striking?
What are the lessons/ hypothesis that you want to recall from this run?
Observation #2: What run of the simulator?
What did you observe in the output that was striking?
What are the lessons/ hypothesis that you want to recall from this run?
Observation #3: What run of the simulator?
What did you observe in the output that was striking?
What are the lessons/ hypothesis that you want to recall from this run?
Observation #4: What run of the simulator?
What did you observe in the output that was striking?
What are the lessons/ hypothesis that you want to recall from this run?
Observation #5: What run of the simulator?
What did you observe in the output that was striking?
What are the lessons/ hypothesis that you want to recall from this run?
(Continue on back of worksheet as needed)

NASPAA Student Competition | February 27, 2016
Worksheet 2.4: Competencies Necessary to Staff a Secretariat Page 1 of 1
WORKSHEET 2.4: COMPETENCIES NECESSARY TO STAFF A SECRETARIAT
On worksheet 2.3 and here in 2.4, you should record the major lessons learned from using the simulator. Additionally, here you should document what these lessons mean for staffing this initiative long-term, and what skills are necessary for employees to be successful in accomplishing your policy proposal. Listed on the right are NASPAA’s universal competency domains; you should fill in the space underneath them with skills specific to the climate change initiative; you can also add 1 or 2 additional competencies that you feel are vital to this initiative’s success. Examples are italicized below. When you’ve completed these detailed competencies, it will provide you with a blueprint for writing a job description, done in Task Three (Product C). If your team does not have a third person, you should still complete this worksheet and share it with the people creating Product C.
Key Implementation Issues and
Lessons Learned
Secretariat employees should be able to:
1.
2.
3.
4.
5.
Etc.
1. Lead and manage in public governance
Facilitate quarterly meetings of Sherpa Group
2. Participate in and contribute to the policy process
Write country-specific energy policy legislation
3. Analyze, synthesize, think critically, solve problems and make
decisions
Implement an action plan to gain the support from the
Carbon sector
4. Articulate and apply a public service perspective
Define benefits and costs to key stakeholder groups
5. Communicate and interact productively with a diverse and
changing workforce and citizenry
Create a Sherpa advisory group comprised of representatives
from countries most impacted by climate change
6.

NASPAA Student Competition | February 27, 2016
Worksheet 2.4: Competencies Necessary to Staff a Secretariat Page 1 of 1
WORKSHEET 3.1: SWOT ASSESSMENT Using the best run you created in Task 2c, complete a SWOT analysis on this policy proposal. Identify what makes it strong or weak, and then what opportunities it provides and what threatens its implementation. This worksheet will inform final products A and B, which are created in Task 3b. The Strengths and Opportunities sections should be used for Product A; the Weaknesses and Threats sections should be used for Product B.
STRENGHTS WEAKNESSES
OPPORTUNITIES THREATS

NASPAA Student Competition | February 27, 2016
Worksheet 3.2 Page 1 of 1
WORKSHEET 3.2: STAKEHOLDER SUPPORT Using the best run you created in Task 2c, identify where on the matrix each stakeholder belongs. First decide if the stakeholder provides support for the plan or opposition. Then decide how strong or weak their feelings are. Try to refrain from placing stakeholders on the border lines – each stakeholder should clearly identify into one of the following grids. This worksheet will inform final products A and B, which are created in Task 3b. The Strong Support and Weak Support sections should be used for Product A; the Strong Opposition and Weak Opposition sections should be used for Product B. Oppose Support
Strong Opposition to the Plan
Strong Support for the Plan
Stro
ng
Weak (minimal) Opposition to Plan
Weak Support for the Plan
We
ak

NASPAA Student Competition | February 27, 2016
Template A Page 1 of 2
Template A: Final Presentation
This product should be a 10 minute PowerPoint Presentation which will be delivered in Task Four. Following the presentation, you should be prepared to answer judge and peer questions. The purpose of this presentation is to lay out a public vision for the G-20 should move forward on Climate Change. The tone of this memo should be positive and encouraging, and it will highlight stakeholder support. Assume that the press and other outward audiences will see this presentation.
To inform the writing of this memo, you should use sections of worksheets 3.1 and 3.2, specifically the Strengths and Opportunities of the SWOT analysis and the descriptions of the stakeholders who support the plan. You may wish to assign a group member(s) to liaise with the product group A and C because the strongest set of products will be consistent with each other.
If you are selected as the Semi-Finalist winner at your regional site, this videotaped presentation will be shared with a panel of super judges to determine the overall global winner. Products A, B, and C, will be evaluated by the super judges and weighted evenly.
Please include other sections as you see relevant; this template is not meant to be a complete list of everything you should include. It’s here to get you started, but please make the memo reflective to the most important parts of your proposal.

NASPAA Student Competition | February 27, 2016
Template A Page 1 of 2
Template A: Sample Slides

NASPAA Student Competition | February 27, 2016
Template B Page 1 of 2
Template B: Confidential Implementation Briefing Memo
This product should be a 2 page policy memo based off of your best run in Task 2c. You may include additional
charts or appendices as supplemental material. The purpose of the memo is to lay out for the G-20 what your
engagement group sees as major implementation hurdles, including a stakeholder-based analysis of what might
be done to facilitate implementation. The tone of this memo should be frank and to-the-point. Assume that the
press and outward facing audiences will not have access to this confidential analysis. The people reading the
memo are the G-20’s Sherpa Group members, a team of high level staff professionals who report directly to the
Leadership of the G-20.
To inform the writing of this memo, you should use sections of worksheets 3.1 and 3.2, specifically the
Weaknesses and Threats of the SWOT analysis and the descriptions of the stakeholders who oppose the plan.
You may wish to assign a group member(s) to liaise with the product group A and C because the strongest set of
products will be consistent with each other.
If you are selected as the Semi-Finalist winner at your regional site, this memo will be shared with a panel of
super judges to determine the overall global winner. Products A, B, and C, will be evaluated by the super judges
and weighted evenly. The super judges will be looking for you to cover the following in your memo:
Complete analysis of stakeholder concerns
Identification of external policy resistance
Full description of plan weaknesses and compromises
Strength of overall plan to push past hurdles and implement plan
Please include other sections as you see relevant; this template is not meant to be a complete list of everything
you should include. It’s here to get you started, but please make the memo reflective to the most important
parts of your proposal.

NASPAA Student Competition | February 27, 2016
Template B Page 1 of 2
CONFIDENTIAL IMPLEMENTATION BRIEFING MEMO
To: G-20 Sherpa Group
From: <Name of your Engagement Group>
<Identify all group members and the sectors they represent>
Subject: Confidential analysis of implementation barriers and stakeholder-based resistance to proposed
policy plan
Date: February 27, 2016
Executive Summary: Summarize your implementation plan
Analysis of Stakeholders That Can Oppose our Policy Initiatives: Identify the stakeholders who oppose the plan
and outline their major concerns
Policy Resistance Arising from Economic and Other Systemic Forces: Separate from the stakeholder groups
identified in this exercise; identify other challenges – human, resources, structural or otherwise – to
implementation
Weaknesses to Proposed Policy Initiatives: You know your policy best; identify here what would make it
stronger. Think about and explain any compromises you had to make to get the overall proposal passed.
What the G-20 Secretariat Can Do about Implementation Barriers and Stakeholder-Based Resistance: Think
creatively about the overall strategy to gain support for your policy and identify a multi-faceted plan to advance
the initiative.

NASPAA Student Competition | February 27, 2016
Template C Page 1 of 2
Template C: Confidential Staffing Proposal
This product should be a 2 page policy memo based off of your best run in Task 2c. You may include additional
charts or appendices as supplemental material. The purpose of the memo is to identify your proposal set up a
Secretariat of 5 people within the G-20 charged with overseeing implementation of Climate Change Policies.
This memo should pay special attention to organization of the secretariat and making sure that the right skills
and competencies are being put in place. Assume that the press and outward facing audiences will not have
access to this proposal. The people reading the memo are the G-20’s Sherpa Group members, a team of high
level staff professionals who report directly to the Leadership of the G-20.
To inform the writing of this document, you should reference Worksheets 2.3 (Key Lessons Learned) and 2.4
(Action Plan). Worksheet 2.4 details the 5 Core NASPAA Competencies, and you should use these when creating
the overall management structure:
to lead and manage in public governance;
to participate in and contribute to the policy process;
to analyze, synthesize, think critically, solve problems and make decisions;
to articulate and apply a public service perspective;
to communicate and interact productively with a diverse and changing workforce and citizenry.
You may wish to assign a group member(s) to liaise with the product group A and C because the strongest set of
products will be consistent with each other.
If you are selected as the Semi-Finalist winner at your regional site, this memo will be shared with a panel of
super judges to determine the overall global winner. Products A, B, and C, will be evaluated by the super judges
and weighted evenly. The super judges will be looking for you to cover the following in your memo:
Ability to identify appropriate staffing model based on organization needs
Clearly link the NASPAA Core Competencies to the position descriptions
Organizational chart that uses resources appropriately and is reflective of the structure of a small
organization
Please include other sections as you see relevant; this template is not meant to be a complete list of everything
you should include. It’s here to get you started, but please make the memo reflective to the most important
parts of your proposal.

NASPAA Student Competition | February 27, 2016
Template C Page 1 of 2
CONFIDENTIAL STAFFING PROPOSAL
To: G-20 Sherpa Group
From: <Name of your Engagement Group>
<Identify all group members and the sectors they represent>
Subject: Confidential analysis of implementation barriers and stakeholder-based resistance to proposed
policy plan
Date: February 27, 2016
Executive Summary: Summarize your proposal here
Summary of Key Implementation Issues and Lessons Learned from the Workshop Experience: Identify the key
implementation challenges of the proposal and what types of people are necessary to overcome the challenges.
Job Titles and Necessary Competencies to staff the Secretariat: Identify and define the job positions, then
develop the key competencies that shape each position. Consider where the NASPAA core competencies fit into
each one and if there are other competencies you need in the employees.
Suggested Appendix: Organizational Chart for the Secretariat: Include a visual representation of the suggested
organizational chart for the Secretariat.

NASPAA Student Competition | February 27, 2016
Rating Rubric: Use in Task 4 to Evaluate your peers
STUDENT Scoring Rubric for NASPAA Climate Change Simulation Exercise 5
Your Name and Group Name _______________________________________
Team being judged
Criteria Poor =1 Satisfactory = 2 Good = 3 Excellent = 4 Score
Team Explains Reasoning behind Policies That They Have Selected (30%)
Solution presented as a “black box” with a series of levers that have been pulled. Presentation seems unaware of lessons from the worksheets.
Positions of only a few stakeholders described one at a time with little or no attention to how policies will be implemented or paid for. Some awareness of lessons from the worksheets.
Most or all stakeholder positions included in solution with adequate attention to implementation and funding. Partial awareness of lessons from the worksheets.
All stakeholder positions discussed with multi-solving (win-win) policies using explicit causal reasoning and funding mechanisms well described. Strong knowledge of lessons from the worksheets.
Solution Presented is Feasible (30%)
Solution ignores population growth, economic growth and fossil fuel stakeholders, paying little attention to implementation and funding
Some stakeholder needs are discussed and analyzed
Most or all stakeholder needs are discussed but evidence and reasoning is not always clear
Solution keeps population growth, economic growth and fossil fuel stakeholders satisfied while meeting climate goals and balanced stakeholder satisfaction
Policy Package is clearly and completely presented (20%)
Presentation does not describe how climate and growth goals are met nor how stakeholder requirements are met
Policies presented clearly in terms of climate change goals OR stakeholder requirements, but not BOTH
Policies discuss both climate change goals and meeting stakeholder requirements—but tradeoffs not clearly presented
Describes trade-offs made between attaining global climate goals and meeting stakeholder requirements
Team is able to think on their feet and respond to questions and challenges (20%)
Team members are not able to respond adequately to questions
At least one member of team can respond to some questions and challenges
Most team members help answer most posed questions and challenges
Excellent response to all questions and challenges
Comments (use space on back as needed):
Total Score (0-16)
5 Scoring Instructions: Fill out four scores (1-4) for each criterion plus a summary score. Comments will be used to support
judging at higher levels and for feedback to the teams. Be sure to include name of team being evaluated and your own name (and team, if applicable)

NASPAA Student Competition | February 27, 2016
NASPAA Student Competition | February 27, 2016
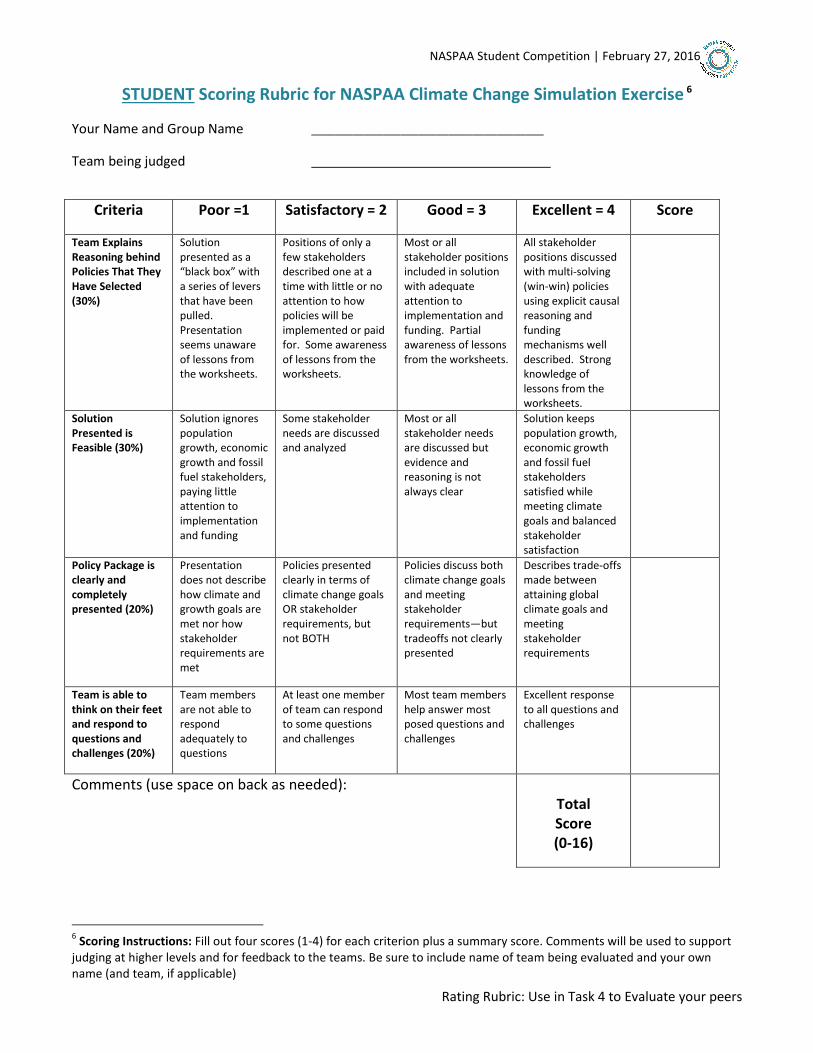
Rating Rubric: Use in Task 4 to Evaluate your peers
STUDENT Scoring Rubric for NASPAA Climate Change Simulation Exercise 6
Your Name and Group Name _______________________________________
Team being judged
Criteria Poor =1 Satisfactory = 2 Good = 3 Excellent = 4 Score
Team Explains Reasoning behind Policies That They Have Selected (30%)
Solution presented as a “black box” with a series of levers that have been pulled. Presentation seems unaware of lessons from the worksheets.
Positions of only a few stakeholders described one at a time with little or no attention to how policies will be implemented or paid for. Some awareness of lessons from the worksheets.
Most or all stakeholder positions included in solution with adequate attention to implementation and funding. Partial awareness of lessons from the worksheets.
All stakeholder positions discussed with multi-solving (win-win) policies using explicit causal reasoning and funding mechanisms well described. Strong knowledge of lessons from the worksheets.
Solution Presented is Feasible (30%)
Solution ignores population growth, economic growth and fossil fuel stakeholders, paying little attention to implementation and funding
Some stakeholder needs are discussed and analyzed
Most or all stakeholder needs are discussed but evidence and reasoning is not always clear
Solution keeps population growth, economic growth and fossil fuel stakeholders satisfied while meeting climate goals and balanced stakeholder satisfaction
Policy Package is clearly and completely presented (20%)
Presentation does not describe how climate and growth goals are met nor how stakeholder requirements are met
Policies presented clearly in terms of climate change goals OR stakeholder requirements, but not BOTH
Policies discuss both climate change goals and meeting stakeholder requirements—but tradeoffs not clearly presented
Describes trade-offs made between attaining global climate goals and meeting stakeholder requirements
Team is able to think on their feet and respond to questions and challenges (20%)
Team members are not able to respond adequately to questions
At least one member of team can respond to some questions and challenges
Most team members help answer most posed questions and challenges
Excellent response to all questions and challenges
Comments (use space on back as needed):
Total Score (0-16)
6 Scoring Instructions: Fill out four scores (1-4) for each criterion plus a summary score. Comments will be used to support
judging at higher levels and for feedback to the teams. Be sure to include name of team being evaluated and your own name (and team, if applicable)