CREATING AN ECONOMIC DIVERSIFICATION TRUST FUND
41
CREATING AN ECONOMIC DIVERSIFICATION TRUST FUND TURNING NONRENEWABLE NATURAL RESOURCES INTO SUSTAINABLE WEALTH FOR WEST VIRGINIA Economic Development JANUARY 2012
Transcript of CREATING AN ECONOMIC DIVERSIFICATION TRUST FUND
CREATING AN ECONOMIC DIVERSIFICATION TRUST FUND
TURNING NONRENEWABLE NATURAL RESOURCES INTO SUSTAINABLE WEALTH
FOR WEST VIRGINIA
Economic Development JANUARY 2012
Acknowledgments
This report was supported by generous grants from the W.K. Kellogg Foundation,
the Claude Worthington Benedum Foundation, and the Mary Reynolds Babcock Foundation.
About the Authors
Ted Boettner is the Executive Director of the West Virginia Center on Budget and Policy.
Jill Kriesky is the Senior Project Coordinator at the Center for Healthy Environments and Communities, Graduate School of Public Health, University of Pittsburgh.
Rory McIlmoil is the Project Manager of the Energy Program at Downstream Strategies.
Elizabeth Paulhus is a Policy Analyst with the West Virginia Center on Budget and Policy.
The authors wish to thank Michael Wood from the Pennsylvania Budget and Policy Center and Jon Shure from the Center on Budget and Policy Priorities for feedback on the content of this report. The authors would also like to thank the following people for their technical assistance: Julie D’Alesandro (Utah Division of Finance), Roger Lloyd (Montana Legislative Fiscal Division), Laura Achee (Alaska Permanent Fund Corporation), and Leila Burrows (New Mexico Legislative Finance Committee). All content, errors, and omissions are the sole responsibility of the authors.
Layout and design by Elizabeth Paulhus.
West Virginia Center on Budget & Policy 1
Table of Contents3
44568
99
10111111121212
1414141516161718
19
2026
31
35
Introduction
Section One
Section Two
Section Three
Conclusion
Appendix A Appendix B
Appendix C
Endnotes
West Virginia’s Economic Challenges Lack of Economic Diversity Underdeveloped Workforce Limited Fiscal Capacity Deteriorating Infrastructure
Permanent Severance Tax Trust Funds in Other States Justification for Permanent Severance Tax Trust Funds Structure of Permanent Funds Use of Permanent Fund Earnings Transfer of Income to General Fund Local Development Projects Administered by the State Assistance to Counties Impacted by Extractive Industries Dividend Program Inflation-proofing and Fund Growth An Economic Diversification Trust Fund Justification Structure Use of the Fund in West Virginia Early Childhood Development Education Infrastructure Workforce Training
A Snapshot of States’ Permanent FundsMethodologies for Projecting Coal and Natural Gas Production and PricesComparative Analysis of Alternative Funding Sources
2 Creating an Economic Diversification Trust Fund
List of Figures and Tables4566
1415
713
Figure 1. Figure 2.Figure 3.Figure 4.
Figure 5.Figure 6.
Table 1.Table 2.
West Virginia Is One of the Least Economically Diverse States in the NationWest Virginia Has the Nation’s Lowest Labor Force Participation RateWest Virginia’s Labor Force Participation Rate at Same Level as in 1990sWest Virginia’s Labor Force Has the Nation’s Lowest Level of Post-Secondary EducationIf a Permanent Coal Severance Tax Trust Fund Had Been Created in 1980Estimated Total Revenues Generated from the Permanent Fund
Measurements of Revenue Capacity and Expenditure NeedA Comparison of States with Permanent Severance Tax Trust Funds
West Virginia Center on Budget & Policy 3
For more than a century, West Virginia’s tremendous natural resource wealth has been extracted. The state has been a center of coal mining in the United States, producing approximately 13.4 billion tons of coal between 1880 and 2009. In recent times, technological advances have made it possible for companies to access the expansive Marcellus Shale gas reservoir, which lies under much of West Virginia.
Due to the nonrenewable nature of these resources, the industries and revenue attached to them only last as long as the resources remain. Furthermore, this wealth of natural resources historically has not brought long-term prosperity to the state.
Introduction
In his autobiography, the late Senator Robert C. Byrd wrote:
[West Virginia] is a state whose rich resources have been largely owned and exploited by outside interests. Absentee owners, while living outside the state, wrested from the West Virginia earth the wealth that made them rich — rich from the toil and sweat and blood and tears of the people in the hill country who worked out their lives, all too often, for a pittance.1
If West Virginia wants future generations to benefit from the extraction of its natural resources, it must set aside a portion of the severance tax revenue from all natural resources to invest in important public structures that will build a stronger, more vibrant future for the state.
To accomplish this task, West Virginia could follow the lead of six other energy states by creating a permanent severance tax trust fund (hereafter referred to as a permanent fund) that converts non-renewable natural resources into a source of sustainable wealth that serves the state today and in the future through targeted investing. Even after the state’s natural resources are depleted, West Virginia could use income from the fund to diversify the economy, make much-needed investments in infrastructure and human capital, lower future tax burdens, and deal with costs associated with past and future mineral extraction.
This report examines the creation of a permanent fund in West Virginia — the Economic Diversification Trust Fund, which would be funded by a one percent additional severance tax on natural gas and coal extraction. The report proposes a structure for how the permanent fund would operate, the projected size of the fund in the future, and how it could benefit the citizens of West Virginia.
Section One discusses some of the major economic challenges faced by West Virginia, and how these obstacles to economic development can be addressed with strategic investments from the creation of a permanent fund. These challenges include a weak labor market and underdeveloped workforce, a lack of economic diversity, deteriorating infrastructure, and limited fiscal capacity.
Section Two provides an overview of how permanent funds operate in other states, with particular attention to their structure. The section explores how each state supports, invests, and uses the money contained in its permanent fund.
Section Three looks at justifications for the creation of a permanent fund in West Virginia and outlines a possible structure, including a funding source. The section also offers several potential uses toward which the permanent fund’s interest income could go, with an attempt to address many of the economic problems outlined in Section One.
4 Creating an Economic Diversification Trust Fund
Section OneWest Virginia’s Economic ChallengesWest Virginia’s economy is one of the weakest and least diversified in the nation, with the second lowest output and personal income per capita, and an employment mix that lacks diversity. The state’s labor market is very weak, and has the nation’s lowest number of educated workers and workers participating in the labor force. West Virginia ranks at the bottom on many economic welfare indicators, including poverty, median income, health outcomes, and overall well-being. The state’s infrastructure is also deteriorating, with more than $8 billion in unmet needs. Without a large-scale investment in the workforce and infrastructure, West Virginia could remain uncompetitive.
This section of the report explores several factors contributing to the state’s weak economic and social performance that could be improved with the creation of a permanent fund.
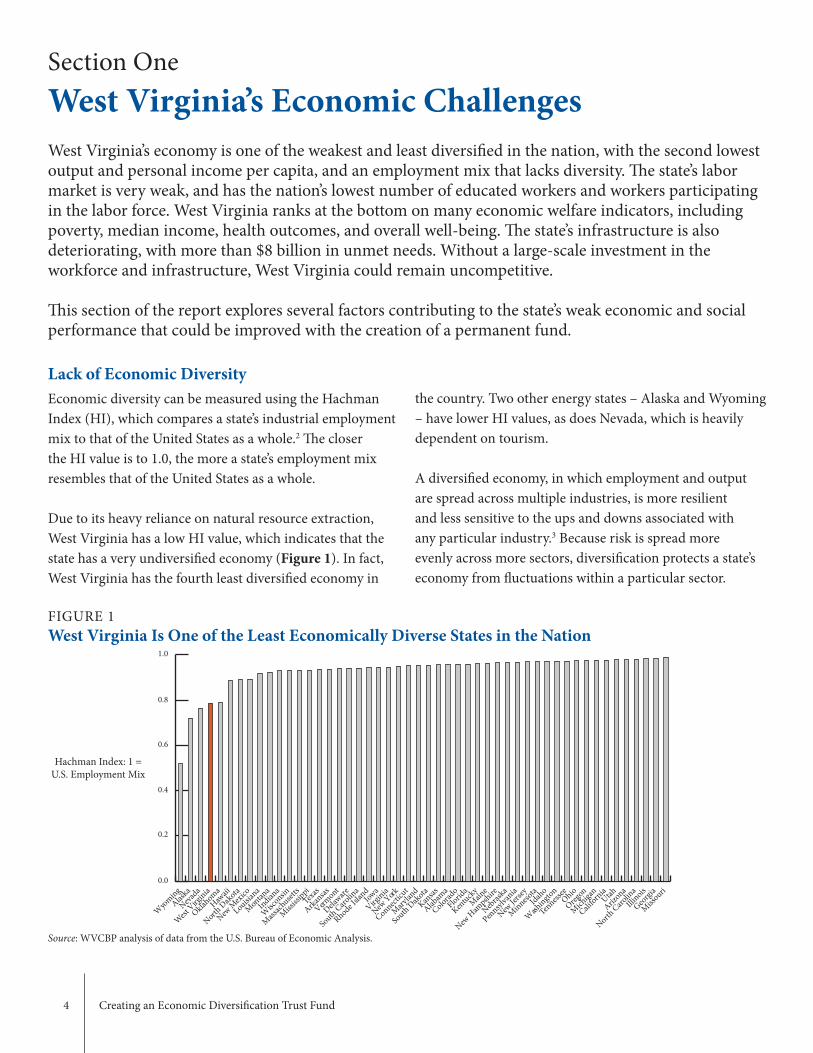
Lack of Economic DiversityEconomic diversity can be measured using the Hachman Index (HI), which compares a state’s industrial employment mix to that of the United States as a whole.2 The closer the HI value is to 1.0, the more a state’s employment mix resembles that of the United States as a whole.
Due to its heavy reliance on natural resource extraction, West Virginia has a low HI value, which indicates that the state has a very undiversified economy (Figure 1). In fact, West Virginia has the fourth least diversified economy in
FIGURE 1West Virginia Is One of the Least Economically Diverse States in the Nation
Source: WVCBP analysis of data from the U.S. Bureau of Economic Analysis.
Hachman Index: 1 = U.S. Employment Mix
the country. Two other energy states – Alaska and Wyoming – have lower HI values, as does Nevada, which is heavily dependent on tourism.
A diversified economy, in which employment and output are spread across multiple industries, is more resilient and less sensitive to the ups and downs associated with any particular industry.3 Because risk is spread more evenly across more sectors, diversification protects a state’s economy from fluctuations within a particular sector.
0.0
0.2
0.4
0.6
0.8
1.0
Missouri
Georgi
a
Illinois
North Caro
lina
Arizona
Utah
California
Michiga
n
Oregon
Ohio
Tenness
ee
Wash
ington
Idaho
Minnesota
New Je
rsey
Pennsyl
vania
Nebraska
New H
ampshire
Maine
Kentucky
Florida
Colorado
Alabam
a
Kansas
South D
akota
Marylan
d
Connecticu
t
New
York
Virginia
Iowa
Rhode Isla
nd
South Caro
lina
Delaware
Vermont
Arkansas
Texas
Mississ
ippi
Massach
usetts
Wisc
onsin
Indiana
Montan
a
Louisiana
New M
exico
North D
akota
Hawaii
Oklahoma
West V
irginia
Nevada
Alaska
Wyoming
West Virginia Center on Budget & Policy 5
Coal, natural gas, oil, and other nonrenewable natural resources historically have been volatile industries, subject to price and output swings of the global market. Overreliance on them is risky for economic stability. Moody’s Investors Service has cited the “above average concentration in the coal industry” as a weakness for West Virginia.4
Diversification, therefore, is very important for states like West Virginia that are dependent upon nonrenewable natural resources. In the short-run, the extraction of coal or natural gas creates jobs and economic growth. However, the good return from a resource can cause a state not to develop other industries, which leaves the economy more vulnerable when downturns occur.
Another reason why the state lacks a diverse economy is its inability to transition from the old economy of industrialization to the “new economy” of innovation. The New Economy Index, which annually measures the extent to which state economies are knowledge-based, globalized, entrepreneurial, IT-driven and innovation-based, ranked West Virginia second to last in 2010.5 According to the report, “Mississippi and West Virginia have lagged most in making the transition to the New Economy.”6
A number of West Virginia-based organizations such as Vision Shared, Imagine WV, Tech Connect, and Discover the Real West Virginia Foundation, along with the Legislature, are working to attract new sustainable industries to the state. However, a comprehensive vision of economic diversity remains elusive, as do the public policy and resources needed to support it.
Underdeveloped WorkforceA second challenge facing West Virginia is the state’s persistently weak and underdeveloped labor market. Over the last 30 years, the state has ranked at or near the very bottom in workforce participation and educational attainment.
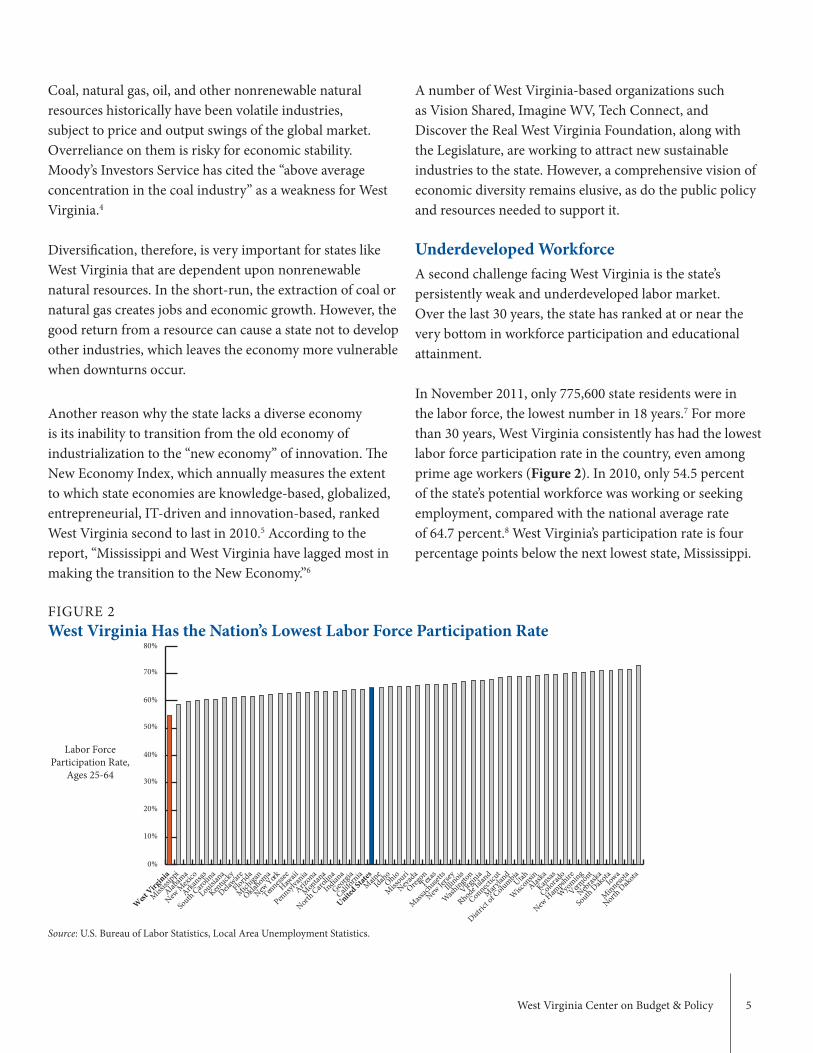
In November 2011, only 775,600 state residents were in the labor force, the lowest number in 18 years.7 For more than 30 years, West Virginia consistently has had the lowest labor force participation rate in the country, even among prime age workers (Figure 2). In 2010, only 54.5 percent of the state’s potential workforce was working or seeking employment, compared with the national average rate of 64.7 percent.8 West Virginia’s participation rate is four percentage points below the next lowest state, Mississippi.
FIGURE 2West Virginia Has the Nation’s Lowest Labor Force Participation Rate
Source: U.S. Bureau of Labor Statistics, Local Area Unemployment Statistics.
Labor Force Participation Rate,
Ages 25-64
0%
10%
20%
30%
40%
50%
60%
70%
80%
North D
akota
Minnesota
Iowa
South D
akota
Nebraska
Vermont
Wyoming
New
Hampshire
Colorado
Kansas
Alaska
Wisc
onsinUtah
Distric
t of C
olumbia
Marylan
d
Connecticu
t
Rhode Isla
nd
Virginia
Washingto
nIlli
nois
New Je
rsey
Massach
usetts
Texas
Oregon
Nevada
Missouri
OhioIdah
oMain
e
United Stat
es
California
Georgi
a
Indiana
North Caro
lina
Montan
a
Arizona
Pennsyl
vania
Hawaii
Tennessee
New York
Oklahoma
Michiga
n
Florida
Delaware
Kentucky
Louisiana
South Caro
lina
Arkansas
New M
exico
Alabam
a
Mississ
ippi
West
Virginia
6 Creating an Economic Diversification Trust Fund
The participation rate among adult females and adult males was also the lowest in the nation, while the state had the second lowest rate for younger workers (ages 16 to 24). If West Virginia’s labor force participation rate were equal to the national average, there would be an additional 148,000 people in the workforce.9
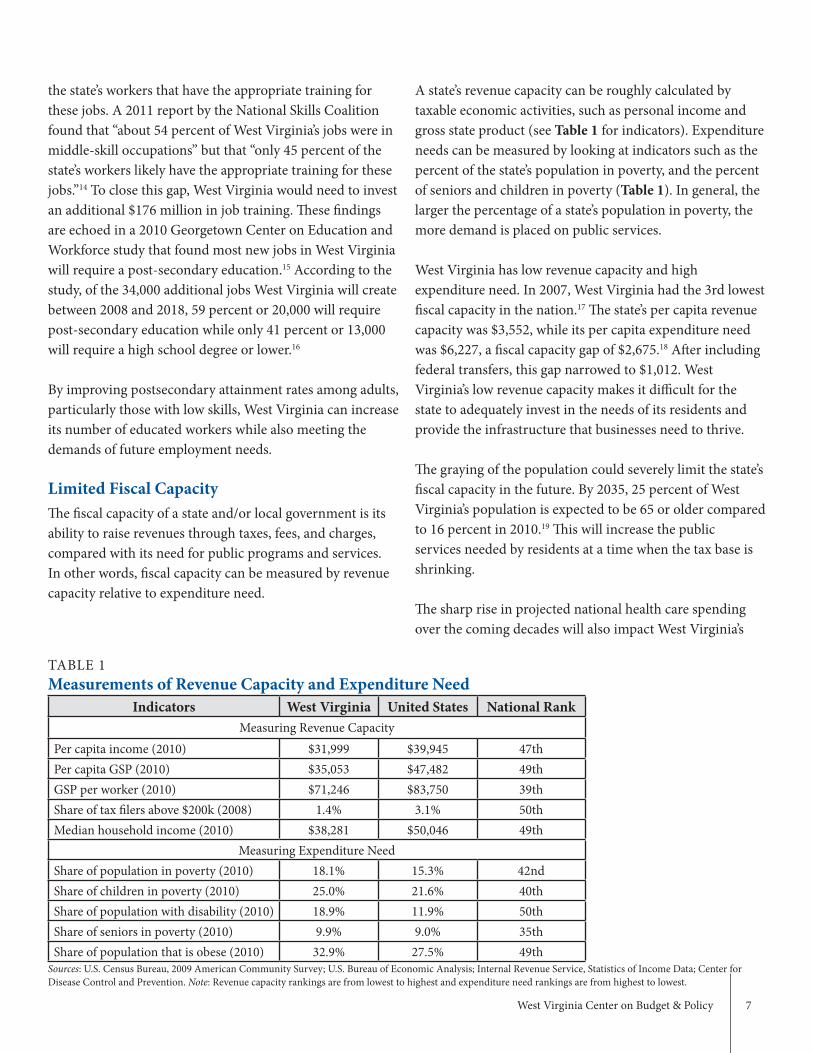
In 2010, West Virginia’s labor force participation rate was at a 21-year low, and it could decline even more in the future as baby boomers retire (Figure 3). According to population projections from West Virginia University, West Virginia’s working age population (20-64) will shrink by 104,000 from 2010 to 2035.10 This could lower the state’s labor force participation rate from 54 percent in 2010 to 49 percent by 2035.11
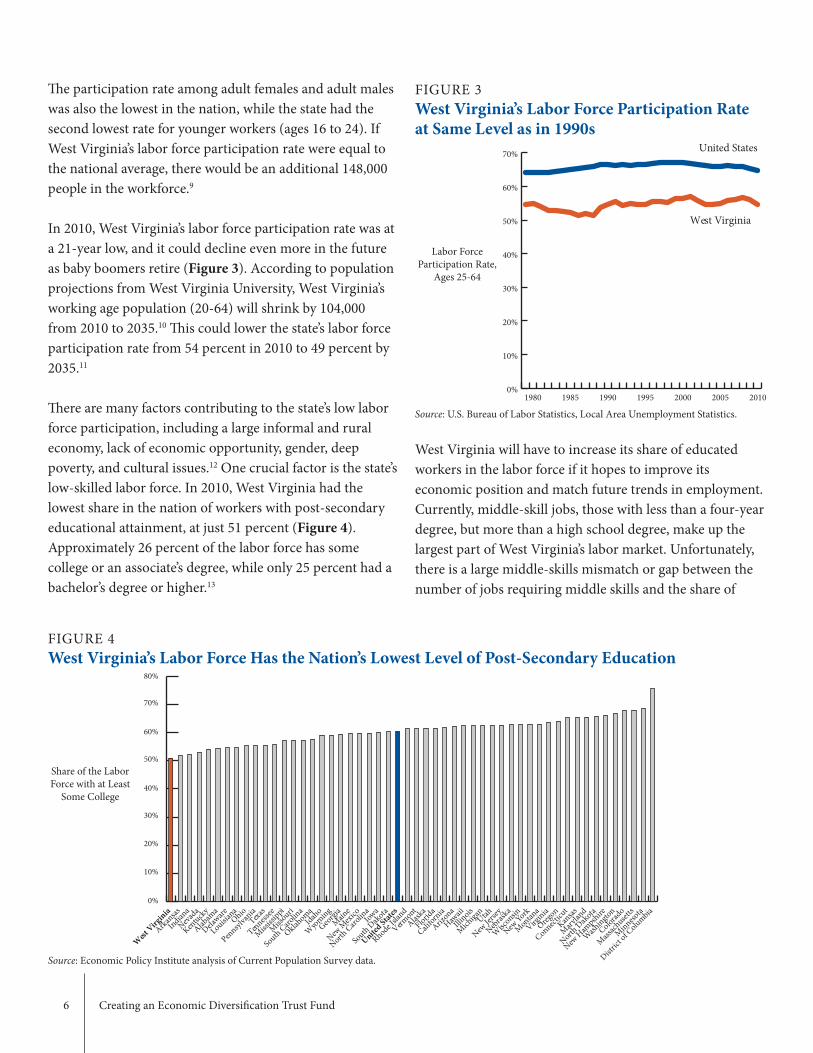
There are many factors contributing to the state’s low labor force participation, including a large informal and rural economy, lack of economic opportunity, gender, deep poverty, and cultural issues.12 One crucial factor is the state’s low-skilled labor force. In 2010, West Virginia had the lowest share in the nation of workers with post-secondary educational attainment, at just 51 percent (Figure 4). Approximately 26 percent of the labor force has some college or an associate’s degree, while only 25 percent had a bachelor’s degree or higher.13
West Virginia will have to increase its share of educated workers in the labor force if it hopes to improve its economic position and match future trends in employment. Currently, middle-skill jobs, those with less than a four-year degree, but more than a high school degree, make up the largest part of West Virginia’s labor market. Unfortunately, there is a large middle-skills mismatch or gap between the number of jobs requiring middle skills and the share of
FIGURE 4West Virginia’s Labor Force Has the Nation’s Lowest Level of Post-Secondary Education
Source: Economic Policy Institute analysis of Current Population Survey data.
0%
10%
20%
30%
40%
50%
60%
70%
80%
Distric
t of C
olumbia
Minnesota
Massach
usetts
Colorado
Washingto
n
New H
ampshire
North D
akota
Marylan
dKan
sas
Connecticu
t
Oregon
Virginia
Montan
a
New York
Wisc
onsin
Nebraska
New Je
rsey
Utah
Michiga
nIlli
nois
Hawaii
Arizona
California
Florida
Alaska
Vermont
Rhode Isla
nd
United Stat
es
South D
akota
Iowa
North Caro
lina
New M
exico
Maine
Georgi
a
Wyoming
Idaho
Oklahoma
South Caro
lina
Missouri
Mississ
ippi
Tennessee
Texas
Pennsyl
vania
Ohio
Louisiana
Delaware
Alabam
a
Kentucky
Nevada
Indiana
Arkansas
West
Virginia
Share of the Labor Force with at Least
Some College
FIGURE 3West Virginia’s Labor Force Participation Rate at Same Level as in 1990s
Source: U.S. Bureau of Labor Statistics, Local Area Unemployment Statistics.
0%
10%
20%
30%
40%
50%
60%
70%
West Virginia
United States
2010200520001995199019851980
Labor Force Participation Rate,
Ages 25-64
West Virginia Center on Budget & Policy 7
the state’s workers that have the appropriate training for these jobs. A 2011 report by the National Skills Coalition found that “about 54 percent of West Virginia’s jobs were in middle-skill occupations” but that “only 45 percent of the state’s workers likely have the appropriate training for these jobs.”14 To close this gap, West Virginia would need to invest an additional $176 million in job training. These findings are echoed in a 2010 Georgetown Center on Education and Workforce study that found most new jobs in West Virginia will require a post-secondary education.15 According to the study, of the 34,000 additional jobs West Virginia will create between 2008 and 2018, 59 percent or 20,000 will require post-secondary education while only 41 percent or 13,000 will require a high school degree or lower.16
By improving postsecondary attainment rates among adults, particularly those with low skills, West Virginia can increase its number of educated workers while also meeting the demands of future employment needs.
Limited Fiscal CapacityThe fiscal capacity of a state and/or local government is its ability to raise revenues through taxes, fees, and charges, compared with its need for public programs and services. In other words, fiscal capacity can be measured by revenue capacity relative to expenditure need.
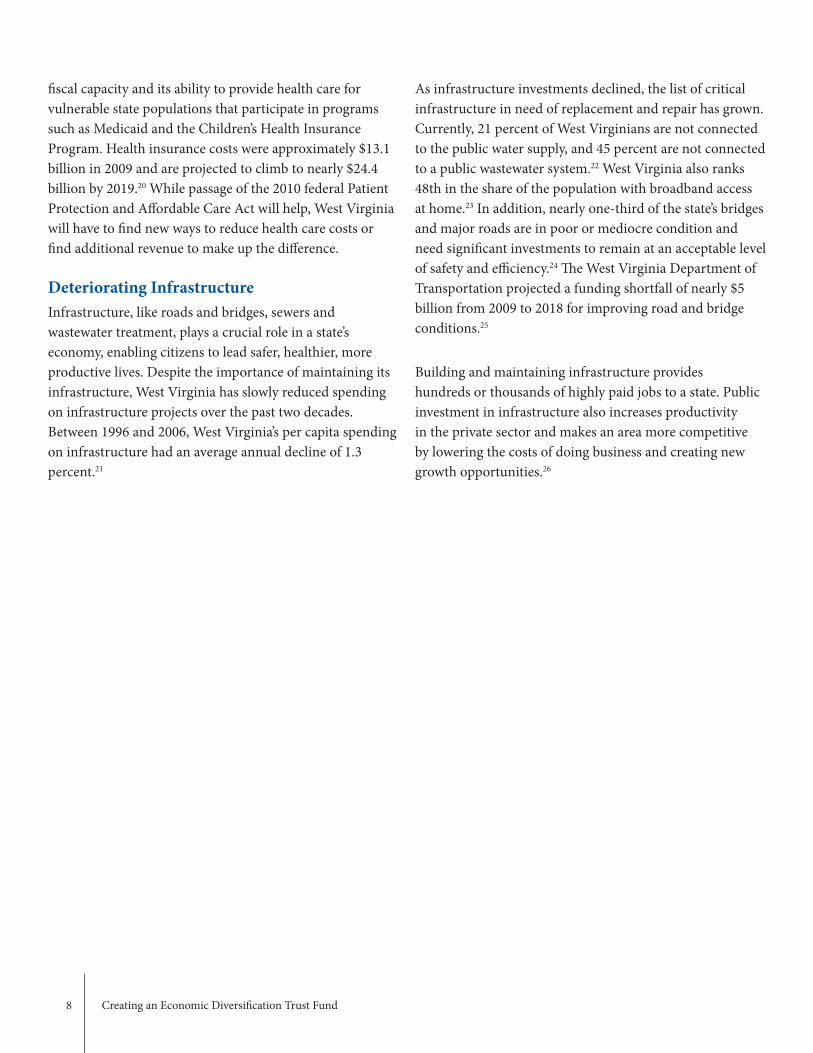
TABLE 1Measurements of Revenue Capacity and Expenditure Need
Indicators West Virginia United States National RankMeasuring Revenue Capacity
Per capita income (2010) $31,999 $39,945 47thPer capita GSP (2010) $35,053 $47,482 49thGSP per worker (2010) $71,246 $83,750 39thShare of tax filers above $200k (2008) 1.4% 3.1% 50thMedian household income (2010) $38,281 $50,046 49th
Measuring Expenditure NeedShare of population in poverty (2010) 18.1% 15.3% 42ndShare of children in poverty (2010) 25.0% 21.6% 40thShare of population with disability (2010) 18.9% 11.9% 50thShare of seniors in poverty (2010) 9.9% 9.0% 35thShare of population that is obese (2010) 32.9% 27.5% 49th
Sources: U.S. Census Bureau, 2009 American Community Survey; U.S. Bureau of Economic Analysis; Internal Revenue Service, Statistics of Income Data; Center for Disease Control and Prevention. Note: Revenue capacity rankings are from lowest to highest and expenditure need rankings are from highest to lowest.
A state’s revenue capacity can be roughly calculated by taxable economic activities, such as personal income and gross state product (see Table 1 for indicators). Expenditure needs can be measured by looking at indicators such as the percent of the state’s population in poverty, and the percent of seniors and children in poverty (Table 1). In general, the larger the percentage of a state’s population in poverty, the more demand is placed on public services.
West Virginia has low revenue capacity and high expenditure need. In 2007, West Virginia had the 3rd lowest fiscal capacity in the nation.17 The state’s per capita revenue capacity was $3,552, while its per capita expenditure need was $6,227, a fiscal capacity gap of $2,675.18 After including federal transfers, this gap narrowed to $1,012. West Virginia’s low revenue capacity makes it difficult for the state to adequately invest in the needs of its residents and provide the infrastructure that businesses need to thrive.
The graying of the population could severely limit the state’s fiscal capacity in the future. By 2035, 25 percent of West Virginia’s population is expected to be 65 or older compared to 16 percent in 2010.19 This will increase the public services needed by residents at a time when the tax base is shrinking.
The sharp rise in projected national health care spending over the coming decades will also impact West Virginia’s
8 Creating an Economic Diversification Trust Fund
fiscal capacity and its ability to provide health care for vulnerable state populations that participate in programs such as Medicaid and the Children’s Health Insurance Program. Health insurance costs were approximately $13.1 billion in 2009 and are projected to climb to nearly $24.4 billion by 2019.20 While passage of the 2010 federal Patient Protection and Affordable Care Act will help, West Virginia will have to find new ways to reduce health care costs or find additional revenue to make up the difference.
Deteriorating InfrastructureInfrastructure, like roads and bridges, sewers and wastewater treatment, plays a crucial role in a state’s economy, enabling citizens to lead safer, healthier, more productive lives. Despite the importance of maintaining its infrastructure, West Virginia has slowly reduced spending on infrastructure projects over the past two decades. Between 1996 and 2006, West Virginia’s per capita spending on infrastructure had an average annual decline of 1.3 percent.21
As infrastructure investments declined, the list of critical infrastructure in need of replacement and repair has grown. Currently, 21 percent of West Virginians are not connected to the public water supply, and 45 percent are not connected to a public wastewater system.22 West Virginia also ranks 48th in the share of the population with broadband access at home.23 In addition, nearly one-third of the state’s bridges and major roads are in poor or mediocre condition and need significant investments to remain at an acceptable level of safety and efficiency.24 The West Virginia Department of Transportation projected a funding shortfall of nearly $5 billion from 2009 to 2018 for improving road and bridge conditions.25
Building and maintaining infrastructure provides hundreds or thousands of highly paid jobs to a state. Public investment in infrastructure also increases productivity in the private sector and makes an area more competitive by lowering the costs of doing business and creating new growth opportunities.26
West Virginia Center on Budget & Policy 9
Section TwoPermanent Severance Tax Trust Funds in Other StatesWhen natural resources like coal, oil, and natural gas are extracted, many states place a severance tax on them. This tax brings in important revenue to states rich in natural resources like West Virginia. States typically consider establishing a permanent severance tax fund, because they realize that they must eventually find other sources of revenue to replace the severance tax revenue once the nonrenewable natural resources have been depleted. By capturing a portion of the earnings accruing to the mining companies and investing in income-earning assets, states are turning their nonrenewable resources into a continuous source of funding for state programs. Since the early 1970s, six states – Alaska, Montana, Wyoming, New Mexico, North Dakota, and Utah – have created permanent severance tax trust funds (see Appendix A for comparison of states).
Justification for Permanent Severance Tax Trust Funds Over the past few decades, several western states experienced large increases in natural resources tax revenues generated by oil and gas resources, generating public discussion on how to manage such significant amounts of money. Alaska is a good case in point.
In 1969, the discovery and extraction of oil from Prudhoe Bay netted Alaska $900 million in payments from lease bonuses – nearly nine times the size of the state’s budget in that year. Alaska invested much of this revenue in roads, water systems, schools, and other infrastructure needs of the relatively young state. However, the costs of infrastructure development and maintenance needs were well beyond the capacity of even that vast windfall, leaving many to conclude that the legislature had wasted the wealth created by oil drilling. When the state faced the possibility of another major infusion of cash in the mid-1970s – this time from the construction of the trans-Alaska oil pipeline – policymakers sought ways to develop more permanent benefits from the natural resources.27
The answer was the creation of the Alaska Permanent Fund (APF). The fund’s principal would be built from lease, royalty and tax payments, and income from the fund would go to the state’s general fund where it would be used to pay dividends to state residents. The APF’s proponents presented three arguments, which convinced voters to
support the fund’s creation. They said that a permanent fund:
• converts nonrenewable resource wealth into a renewable source of wealth for future generations,
• can be a major revenue source for a state,• and removes a significant portion of the revenues
generated from nonrenewable resources from the legislative spending stream.
These fundamental justifications are echoed and expanded upon by some or all of the states that also have created permanent funds.
A permanent fund converts nonrenewable resource wealth into a renewable source of wealth for future generations.Analyses of nearly all existing state permanent severance tax funds recognize this as a key reason for their establishment. These funds can “financially bolster the state’s economy through strategic spending and continue to grow at a sustainable rate at least equal to the rate of inflation.”28
The success of existing funds in providing resources for future development and growing a principal available to continue supporting future programming varies depending on the year the funds were created and the abundance of natural resources available in each state. The balance of older state permanent funds falls in the billions, while newer permanent funds only have millions (see Table 2 at end of section).
10 Creating an Economic Diversification Trust Fund
A permanent fund can be a major revenue source for a state.All permanent funds except Alaska’s annually direct some or all of their earnings into the state’s general fund. These significant contributions from the permanent fund enable a state to avoid imposing additional taxes and fees on its citizens. For example, it was estimated that in New Mexico, the fund’s earnings saved each household $822 it otherwise would have paid in taxes.29 In Wyoming, which levies no personal income taxes, payments from its permanent fund represented 12.7 percent of general fund revenues in 2009. The year before, payments added up to 24 percent of the general fund.30
A permanent fund also plays a role in boosting a state’s bond rating. This in turn lowers the cost of borrowing for major expenditures. Again, Alaska provides the best example. With its heavy reliance on nonrenewable, volatile, oil-production sectors for revenues, lenders would typically consider the state relatively high risk. But in November 2010, Moody’s Investors Service raised Alaska’s general obligation bond rating to Aaa from Aa1 and assigned the new rating to the state’s planned $200 million of general obligation bonds. Moody’s praised Alaska for its “amassing of very large, available financial reserves” that could be used to offset revenue shortfalls, including the $540 million in the state’s Permanent Fund Earnings Reserve.31
States with significant dependence on smaller, less lucrative, energy industries also have secured more favorable bond ratings due in part to their permanent funds. In December 2010, Moody’s assigned an Aa2 rating to the North Dakota Building Authority bonds issued to finance construction of a new Veteran’s Home Facility. Among the reasons for the higher rating was the potential cushion provided by the Permanent Oil Trust Fund’s anticipated $620 million balance by the end of the current biennium.32
A permanent fund removes a significant portion of the revenues generated from nonrenewable resources from the legislative spending stream.Due to the volatility of the energy market, the severance tax revenues collected by states also fluctuate widely. In good times, collections are high, and legislatures are prone to put them to use on new and expanded programs. But states must scramble to cover costs or reduce programs when revenues fall with a decline in output and employment in the extractive industries. Advocates of permanent funds highlight the role that these funds can play in setting aside some of today’s revenue to cover tomorrow’s expenses.
In 2008, when Utah was voting on a constitutional amendment that allowed “other monies” – mainly revenue collected from the state’s oil and gas severance taxes – to be deposited into the Permanent State Trust Fund, the Utah Taxpayers Association spoke out in favor of this action. It argued, “Severance tax revenues are extremely volatile, and depositing these revenues into a trust fund makes more sense than appropriating these revenues for annual ongoing government expenditures.”33
In North Dakota, one of the legislative sponsors of the Legacy Fund emphasized what might have happened if the state had set aside severance tax revenue in the past rather than spending it right away. He said, “Had the Fund been created during the last oil boom, the Fund could have accumulated a balance of $2.9 billion based on the state’s oil production and historic rates of return. Under this assumption, the state would have interest earnings of $241 million for the 2011-2013 biennium.”34
Structure of Permanent FundsStates establish permanent funds by directing a portion of severance taxes and/or lease and bonus payments collected on the extraction of non-renewable natural resources into the fund. These funds are “permanent” because they are either constitutionally protected or require the approval of three-quarters of the legislature to withdraw money from the fund’s principal. Depending on the state, the principal is invested according to legislative dictates or selections made by the investing body (e.g. in stocks, bonds, bank loans and
West Virginia Center on Budget & Policy 11
private equity, direct business investments, real estate). A specified portion of the investment income is then made available for various public needs. More information about the structure of each state’s permanent fund is available in Table 2.
Each of the six states that currently operate permanent funds has slightly different terms governing its fund. First, states direct severance taxes and other payments from a range of different natural resources into their permanent funds. New Mexico directs severance taxes collected on all nonrenewable resources mined in the state into its Severance Tax Permanent Fund. Montana uses only severance taxes collected on coal, while Alaska deposits only revenues from oil into its fund.
Second, the way states allocate revenue to their permanent funds differs. Some states annually direct a percentage of tax and royalty collections to their funds. North Dakota distributes 30 percent of oil and gas tax collections into its new Legacy Fund, while Alaska distributes at least 25 percent of mineral-related revenues into the Alaska Permanent Fund. Montana and New Mexico first allocate severance tax revenues to bond purchases and interest payments, and then transfer a portion of the remainder to their permanent funds. Wyoming uses a third method for directing income into its funds. Wyoming applies a severance tax of 2.5 percent on the market value of all minerals.
Third, states have distinct processes through which the funds are invested. In Alaska, an independent quasi-government agency, the Alaska Permanent Fund Corporation (APFC), manages the fund’s investments and has decision-making authority about the types of investments used. The legislature only requires that the “prudent investor rule” serve as the APFC’s guideline.35 In other states, the department of revenue or the state treasurer, sometimes with guidance from investment firms, makes these investment decisions. Montana, for example, is encouraged to invest at least 25 percent of its permanent fund into the state’s economy.
Fourth, the amount of investment earnings earmarked for expenditures or reinvestment in the permanent fund varies.
Each year, Alaska and Wyoming spend five percent of the average five-year market value of their funds. New Mexico withdraws 4.7 percent of the five-year average market value of its fund. Other states allocate all annual earnings to expenditure proposes. North Dakota is the exception with its plan to leave its recently established Legacy Fund untouched until 2017.
Use of Permanent Fund EarningsHow states choose to use the earnings from their permanent funds varies and is determined by a combination of perceived needs, successful grassroots advocacy, and political power (see Table 2 for more detail). Still, some uses are common to several states with slight variations. These typical uses are described below, although this list and examples should not be viewed as exhaustive.
Transfer of Income to General Fund Since one of the central justifications for the creation of a permanent fund is to support governmental operations, it is not surprising that several states transfer their funds’ investment earnings directly to their general funds. Wyoming and North Dakota deposit all fund earnings in their general funds. Although New Mexico allocates half of its fund earnings to education, the remainder flows to the general fund for capital outlay projects and general operating revenue. Montana periodically transfers investment income from its permanent fund to the general fund.
Local Development Projects Administered by the State States also frequently use fund earnings for targeted infrastructure, economic development, and education programs.
A. InfrastructureThrough its Treasure State Endowment Fund and Regional Water System Fund, Montana administers grants for major sewer, water, and bridge projects. In North Dakota, some of the Coal Development Trust Fund is designated for school districts and can be used for school construction. New Mexico also sells bonds for capital projects based on the assets in its permanent fund.
12 Creating an Economic Diversification Trust Fund
B. Economic DevelopmentWith an eye toward diversifying their economies to sectors beyond nonrenewable resources, several states have used permanent fund earnings to implement economic development programs emphasizing job creation. Montana’s Big Sky Economic Development Fund finances the Economic Development Jobs Creation and Planning Grants program “designed to aid in the development of good paying jobs for Montana residents and promote long-term stable economic growth in Montana.”36
New Mexico has started to experiment with using a portion of its Severance Tax Permanent Fund (STPF) principal for investments that benefit state-based businesses. In the early 2000s, the state passed legislation allowing for up to six percent of the fund to be invested in New Mexico film industry projects that meet specifications for job creation for state residents.37 In the same time period, the legislature permitted STPF investments in New Mexico-based businesses with the secondary goal of improving the investment and business climate in the state. As of 2007, up to nine percent of the fund can be put to that use. In addition, up to $200 million of the fund can be applied to real estate-related bank loans for in-state businesses.
Assistance to Counties Impacted by Extractive Industries Many states that levy severance taxes already dedicate a portion of those revenues to the cities and counties where natural resource extraction occurs. This may explain why only two states chose to target additional revenue from their permanent funds toward extraction-impacted counties. In North Dakota, part of the Coal Development Trust Fund goes to coal-impacted counties, cities, and school
districts.38 In Montana, the Big Sky Economic Development Fund makes larger grants to counties designated as “high poverty.”39 Three of the four counties with major coal mining operations are “high poverty” counties.40
Dividend ProgramPerhaps the best-known use of trust fund income is Alaska’s Permanent Fund Dividend program. Each year, half of the average realized earnings on the Permanent Fund from the last five years go to the dividend program.41 A dividend check is then made available to every qualifying Alaskan citizen. Since its inception in 1982, the dividend has ranged in size from $331 in 1984 to $2,069 in 2008.42 From its inception through 2009, the program has paid out $17.5 billion. This has created statewide support for the permanent fund and provided a significant share of family resources, especially in low-income rural communities.43
Inflation-proofing and Fund Growth States also use a portion of their permanent funds to ensure that the funds will continue to benefit the state in the future. In Alaska, the annual increase in the Consumer Price Index (CPI) is multiplied by the fund’s principal to determine how much of the year’s earnings roll back into the permanent fund. In addition, the legislature has appropriated $7.04 billion over the years to grow the fund’s principal.44 Wyoming also added to its Permanent Mineral Trust Fund’s principal through legislative appropriations totaling more than $411 million between 2001 and 2009.45
West Virginia Center on Budget & Policy 13
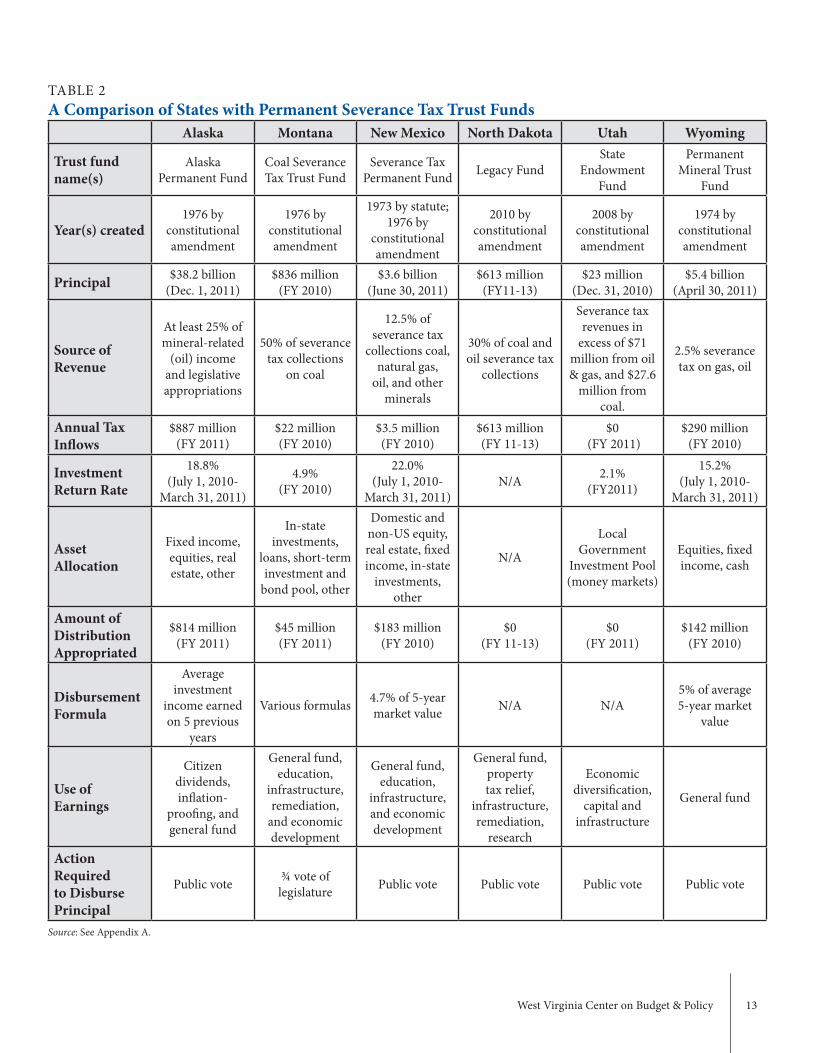
TABLE 2A Comparison of States with Permanent Severance Tax Trust Funds
Alaska Montana New Mexico North Dakota Utah Wyoming
Trust fund name(s)
Alaska Permanent Fund
Coal Severance Tax Trust Fund
Severance Tax Permanent Fund Legacy Fund
State Endowment
Fund
Permanent Mineral Trust
Fund
Year(s) created1976 by
constitutional amendment
1976 by constitutional amendment
1973 by statute; 1976 by
constitutional amendment
2010 by constitutional amendment
2008 by constitutional amendment
1974 by constitutional amendment
Principal $38.2 billion(Dec. 1, 2011)
$836 million(FY 2010)
$3.6 billion (June 30, 2011)
$613 million(FY11-13)
$23 million(Dec. 31, 2010)
$5.4 billion(April 30, 2011)
Source of Revenue
At least 25% of mineral-related
(oil) income and legislative appropriations
50% of severance tax collections
on coal
12.5% of severance tax
collections coal, natural gas,
oil, and other minerals
30% of coal and oil severance tax
collections
Severance tax revenues in
excess of $71 million from oil & gas, and $27.6
million from coal.
2.5% severance tax on gas, oil
Annual Tax Inflows
$887 million(FY 2011)
$22 million(FY 2010)
$3.5 million(FY 2010)
$613 million(FY 11-13)
$0 (FY 2011)
$290 million(FY 2010)
Investment Return Rate
18.8%(July 1, 2010-
March 31, 2011)
4.9%(FY 2010)
22.0%(July 1, 2010-
March 31, 2011)N/A 2.1%
(FY2011)
15.2%(July 1, 2010-
March 31, 2011)
Asset Allocation
Fixed income, equities, real estate, other
In-state investments,
loans, short-term investment and
bond pool, other
Domestic and non-US equity, real estate, fixed income, in-state
investments, other
N/A
Local Government
Investment Pool (money markets)
Equities, fixed income, cash
Amount of Distribution Appropriated
$814 million(FY 2011)
$45 million(FY 2011)
$183 million(FY 2010)
$0(FY 11-13)
$0(FY 2011)
$142 million(FY 2010)
Disbursement Formula
Average investment
income earned on 5 previous
years
Various formulas 4.7% of 5-year market value N/A N/A
5% of average 5-year market
value
Use of Earnings
Citizen dividends, inflation-
proofing, and general fund
General fund, education,
infrastructure, remediation,
and economic development
General fund, education,
infrastructure, and economic development
General fund, property tax relief,
infrastructure, remediation,
research
Economic diversification,
capital and infrastructure
General fund
Action Required to Disburse Principal
Public vote ¾ vote of legislature Public vote Public vote Public vote Public vote
Source: See Appendix A.
14 Creating an Economic Diversification Trust Fund
Section ThreeAn Economic Diversification Trust FundJustification Considering the significant challenges facing the state (see Section One), West Virginia could benefit tremendously from the creation of a permanent severance tax trust fund — an Economic Diversification Trust Fund. Without a permanent fund in place to take some of today’s mineral wealth and set it aside for tomorrow’s use, West Virginia is in danger of significant revenue holes when its nonrenewable natural resources eventually are depleted. Without a permanent fund, this would likely mean increased taxes and fees on the state’s residents in order to maintain public services.
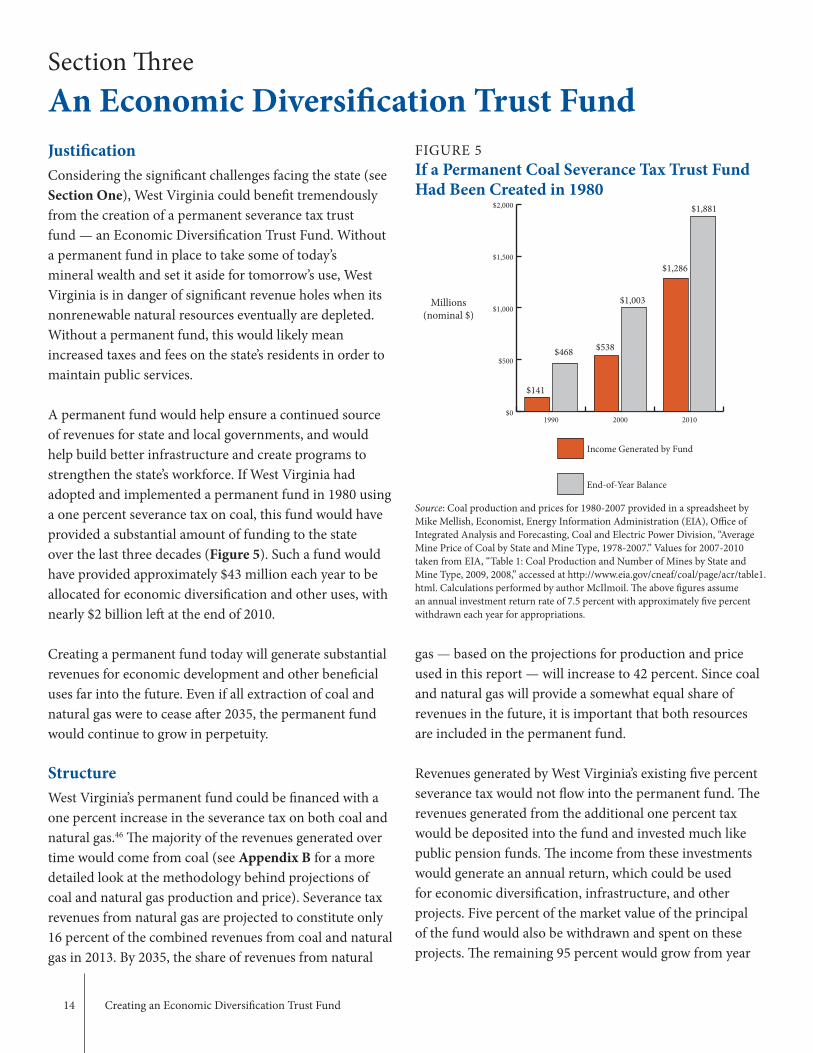
A permanent fund would help ensure a continued source of revenues for state and local governments, and would help build better infrastructure and create programs to strengthen the state’s workforce. If West Virginia had adopted and implemented a permanent fund in 1980 using a one percent severance tax on coal, this fund would have provided a substantial amount of funding to the state over the last three decades (Figure 5). Such a fund would have provided approximately $43 million each year to be allocated for economic diversification and other uses, with nearly $2 billion left at the end of 2010.
Creating a permanent fund today will generate substantial revenues for economic development and other beneficial uses far into the future. Even if all extraction of coal and natural gas were to cease after 2035, the permanent fund would continue to grow in perpetuity.
Structure West Virginia’s permanent fund could be financed with a one percent increase in the severance tax on both coal and natural gas.46 The majority of the revenues generated over time would come from coal (see Appendix B for a more detailed look at the methodology behind projections of coal and natural gas production and price). Severance tax revenues from natural gas are projected to constitute only 16 percent of the combined revenues from coal and natural gas in 2013. By 2035, the share of revenues from natural
gas — based on the projections for production and price used in this report — will increase to 42 percent. Since coal and natural gas will provide a somewhat equal share of revenues in the future, it is important that both resources are included in the permanent fund.
Revenues generated by West Virginia’s existing five percent severance tax would not flow into the permanent fund. The revenues generated from the additional one percent tax would be deposited into the fund and invested much like public pension funds. The income from these investments would generate an annual return, which could be used for economic diversification, infrastructure, and other projects. Five percent of the market value of the principal of the fund would also be withdrawn and spent on these projects. The remaining 95 percent would grow from year
FIGURE 5If a Permanent Coal Severance Tax Trust Fund Had Been Created in 1980
Source: Coal production and prices for 1980-2007 provided in a spreadsheet by Mike Mellish, Economist, Energy Information Administration (EIA), Office of Integrated Analysis and Forecasting, Coal and Electric Power Division, “Average Mine Price of Coal by State and Mine Type, 1978-2007.” Values for 2007-2010 taken from EIA, “Table 1: Coal Production and Number of Mines by State and Mine Type, 2009, 2008,” accessed at http://www.eia.gov/cneaf/coal/page/acr/table1.html. Calculations performed by author McIlmoil. The above figures assume an annual investment return rate of 7.5 percent with approximately five percent withdrawn each year for appropriations.
Millions (nominal $)
$0
$500
$1,000
$1,500
$2,000
End-of-Year Balance
Income Generated by Fund
201020001990
$141
$468 $538
$1,003
$1,286
$1,881
West Virginia Center on Budget & Policy 15
to year as a result of earning interest and receiving annual injections from the additional severance tax. Investment of the principal should follow “prudent investor” guidelines in order to maximize the earnings available for programmatic use or reinvestment into the fund.
The method by which income is withdrawn from the fund is critical. A percent of market value withdrawal schedule is typically used by endowment funds meant to operate in perpetuity. This method also provides a more consistent amount available for distribution over time than does the formula used by Alaska or the withdrawal of all fund earnings practiced in Utah and North Dakota.47
One of the greater benefits of the permanent fund is that the principal and the annual investments will continue to grow even in the absence of new infusions of revenue, as long as the annual rate of return is greater than the five percent withdrawn each year. In other words, as long as the average rate of return continued to exceed five percent, the permanent fund would grow in perpetuity even if all extraction of coal and natural gas ceased.
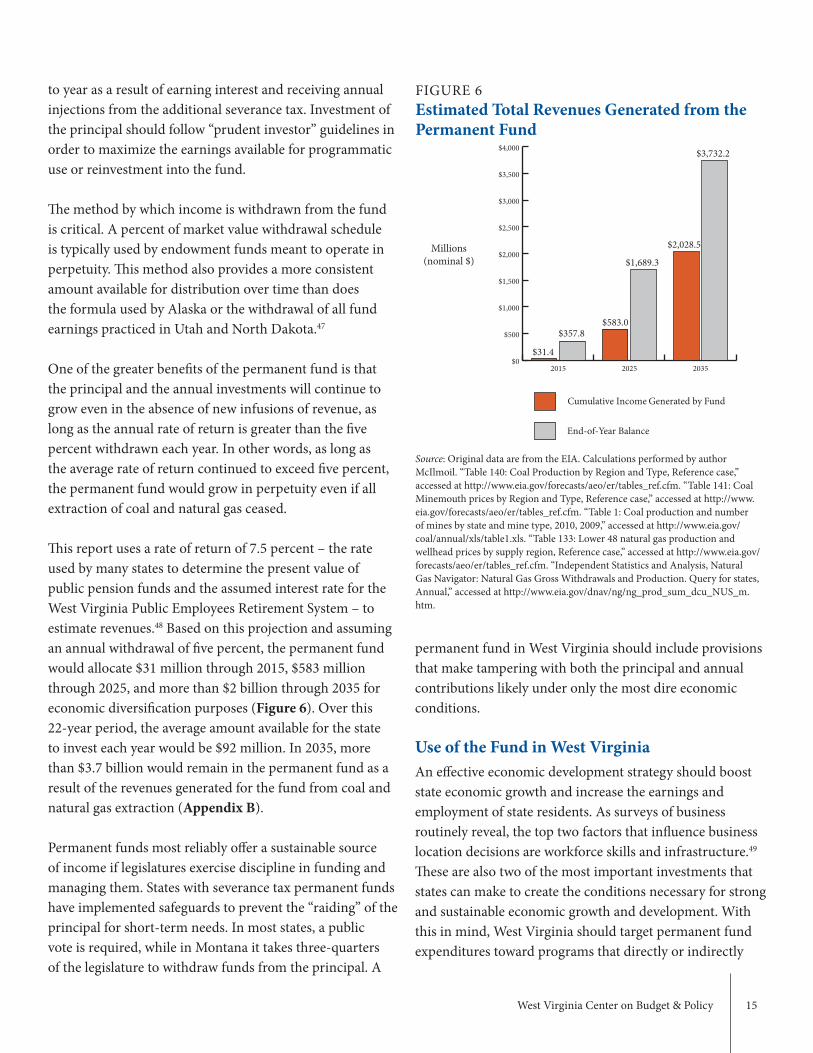
This report uses a rate of return of 7.5 percent – the rate used by many states to determine the present value of public pension funds and the assumed interest rate for the West Virginia Public Employees Retirement System – to estimate revenues.48 Based on this projection and assuming an annual withdrawal of five percent, the permanent fund would allocate $31 million through 2015, $583 million through 2025, and more than $2 billion through 2035 for economic diversification purposes (Figure 6). Over this 22-year period, the average amount available for the state to invest each year would be $92 million. In 2035, more than $3.7 billion would remain in the permanent fund as a result of the revenues generated for the fund from coal and natural gas extraction (Appendix B).
Permanent funds most reliably offer a sustainable source of income if legislatures exercise discipline in funding and managing them. States with severance tax permanent funds have implemented safeguards to prevent the “raiding” of the principal for short-term needs. In most states, a public vote is required, while in Montana it takes three-quarters of the legislature to withdraw funds from the principal. A
FIGURE 6Estimated Total Revenues Generated from the Permanent Fund
Source: Original data are from the EIA. Calculations performed by author McIlmoil. “Table 140: Coal Production by Region and Type, Reference case,” accessed at http://www.eia.gov/forecasts/aeo/er/tables_ref.cfm. “Table 141: Coal Minemouth prices by Region and Type, Reference case,” accessed at http://www.eia.gov/forecasts/aeo/er/tables_ref.cfm. “Table 1: Coal production and number of mines by state and mine type, 2010, 2009,” accessed at http://www.eia.gov/coal/annual/xls/table1.xls. “Table 133: Lower 48 natural gas production and wellhead prices by supply region, Reference case,” accessed at http://www.eia.gov/forecasts/aeo/er/tables_ref.cfm. “Independent Statistics and Analysis, Natural Gas Navigator: Natural Gas Gross Withdrawals and Production. Query for states, Annual,” accessed at http://www.eia.gov/dnav/ng/ng_prod_sum_dcu_NUS_m.htm.
Millions (nominal $)
permanent fund in West Virginia should include provisions that make tampering with both the principal and annual contributions likely under only the most dire economic conditions.
Use of the Fund in West VirginiaAn effective economic development strategy should boost state economic growth and increase the earnings and employment of state residents. As surveys of business routinely reveal, the top two factors that influence business location decisions are workforce skills and infrastructure.49 These are also two of the most important investments that states can make to create the conditions necessary for strong and sustainable economic growth and development. With this in mind, West Virginia should target permanent fund expenditures toward programs that directly or indirectly
$0
$500
$1,000
$1,500
$2,000
$2,500
$3,000
$3,500
$4,000
End-of-Year Balance
Cumulative Income Generated by Fund
203520252015
$31.4
$357.8$583.0
$1,689.3
$2,028.5
$3,732.2
16 Creating an Economic Diversification Trust Fund
increase West Virginia’s capacity to attract industry and generate jobs that will provide a sustainable tax base and a broadly shared prosperity. The state should also make infrastructure investments that provide a foundation for sustainable economic growth.
Although the final decision of how the permanent fund will be used rests with the legislature, the interest income from the fund could be used to create long-term economic growth and development that boosts employment and earnings. The following suggestions are by no means exhaustive, but represent policy options that have a strong track record of being cost-efficient and effective and build on existing state structures.
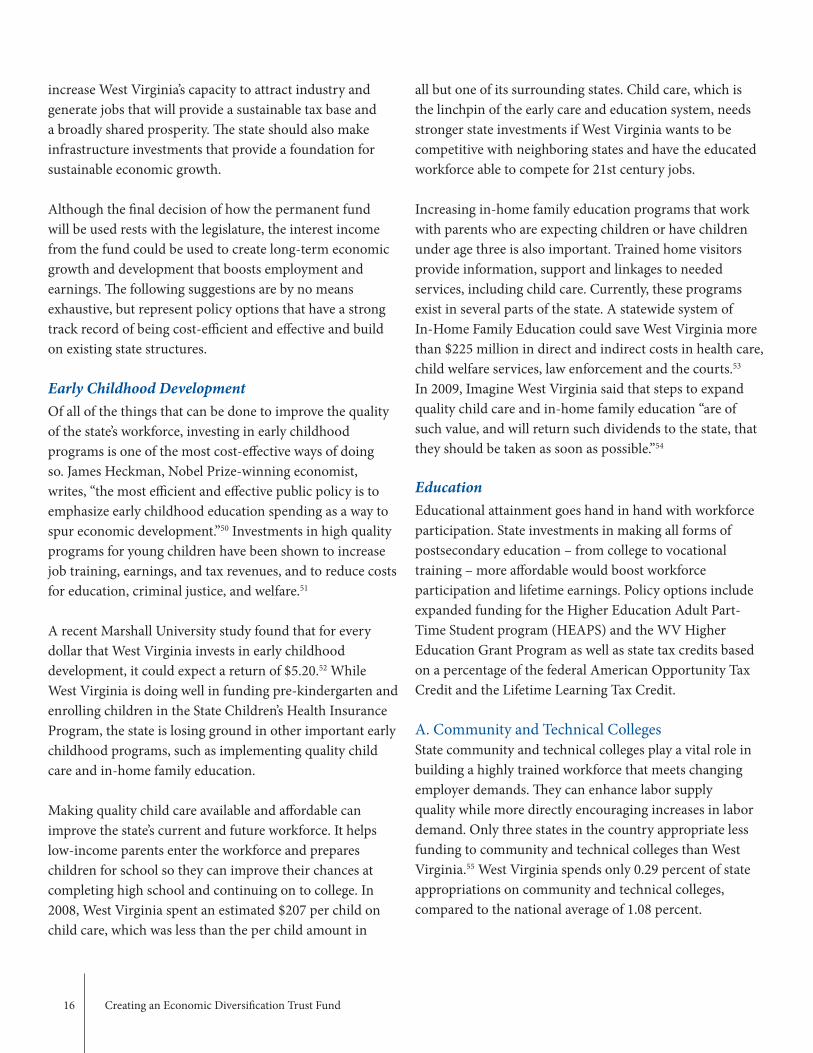
Early Childhood DevelopmentOf all of the things that can be done to improve the quality of the state’s workforce, investing in early childhood programs is one of the most cost-effective ways of doing so. James Heckman, Nobel Prize-winning economist, writes, “the most efficient and effective public policy is to emphasize early childhood education spending as a way to spur economic development.”50 Investments in high quality programs for young children have been shown to increase job training, earnings, and tax revenues, and to reduce costs for education, criminal justice, and welfare.51
A recent Marshall University study found that for every dollar that West Virginia invests in early childhood development, it could expect a return of $5.20.52 While West Virginia is doing well in funding pre-kindergarten and enrolling children in the State Children’s Health Insurance Program, the state is losing ground in other important early childhood programs, such as implementing quality child care and in-home family education.
Making quality child care available and affordable can improve the state’s current and future workforce. It helps low-income parents enter the workforce and prepares children for school so they can improve their chances at completing high school and continuing on to college. In 2008, West Virginia spent an estimated $207 per child on child care, which was less than the per child amount in
all but one of its surrounding states. Child care, which is the linchpin of the early care and education system, needs stronger state investments if West Virginia wants to be competitive with neighboring states and have the educated workforce able to compete for 21st century jobs.
Increasing in-home family education programs that work with parents who are expecting children or have children under age three is also important. Trained home visitors provide information, support and linkages to needed services, including child care. Currently, these programs exist in several parts of the state. A statewide system of In-Home Family Education could save West Virginia more than $225 million in direct and indirect costs in health care, child welfare services, law enforcement and the courts.53 In 2009, Imagine West Virginia said that steps to expand quality child care and in-home family education “are of such value, and will return such dividends to the state, that they should be taken as soon as possible.”54
EducationEducational attainment goes hand in hand with workforce participation. State investments in making all forms of postsecondary education – from college to vocational training – more affordable would boost workforce participation and lifetime earnings. Policy options include expanded funding for the Higher Education Adult Part-Time Student program (HEAPS) and the WV Higher Education Grant Program as well as state tax credits based on a percentage of the federal American Opportunity Tax Credit and the Lifetime Learning Tax Credit.
A. Community and Technical CollegesState community and technical colleges play a vital role in building a highly trained workforce that meets changing employer demands. They can enhance labor supply quality while more directly encouraging increases in labor demand. Only three states in the country appropriate less funding to community and technical colleges than West Virginia.55 West Virginia spends only 0.29 percent of state appropriations on community and technical colleges, compared to the national average of 1.08 percent.

West Virginia Center on Budget & Policy 17
West Virginia could allocate some of its permanent fund’s annual earnings to community and technical colleges. This could be through direct grants, or by expanding programs like the PROMISE scholarship to include adults and non-traditional students. Currently, only two percent of PROMISE scholarship money goes to community colleges to attract students, and those funds are limited to only high school seniors. By expanding the scope of the scholarship to include non-traditional students, West Virginia could help many of its residents return to school.
B. Higher EducationAccording to the National Science Foundation, West Virginia spent less on research and development as a share of its state gross domestic product (GDP) than all but 11 states.56 In 2007, West Virginia spent about 1.1 percent of its state GDP on research and development, while the national average was 2.6 percent. To increase its investment in research and development, West Virginia created a $50 million Research Trust Fund in 2008, also known as “Bucks for Brains.” The program leverages private and public investments to hire faculty at Marshall University and West Virginia University to conduct research in tech-based fields, like biotechnology, energy, and material science.
While this is an important step toward increasing West Virginia’s commitment to creating knowledge-based jobs, the state continues to rank at the bottom in adjustments to the “new economy.” West Virginia could make larger investments in groups like Tech Connect that are enhancing research and development. Or it could create something similar to the Ohio Third Frontier initiative, which was founded in 2010 to provide funding for open innovation, entrepreneurial support, value-chain development and the expansion of a skilled talent pool that can support technology-based economic growth.
West Virginia should also consider doing more to make college more affordable and accessible for its residents. In fiscal year 2010 West Virginia appropriated an estimated $4,899 per enrolled college student (full-time equivalent) compared to the national average of $6,451.57 By investing
more state funds in higher education, West Virginia will make college more affordable to many of the state’s low-income residents.
C. Transition AssistanceAs coal production and employment decline in West Virginia, especially in the southern coalfields, displaced coal miners and the communities in which they live will need opportunities to transition into different fields and industries. One model that might work well in West Virginia is the No Worker Left Behind program from Michigan. This program provides up to two years’ worth of tuition for education or training, which helps accelerate worker transitions. Transition assistance could also include targeted economic development grants to create jobs and business opportunities in communities severally impacted by the loss of coal mining employment.
InfrastructureInfrastructure investments increase the income and competitiveness of regions by lowering the costs of doing business and creating new opportunities for investment and growth. Costs are reduced when people and goods are transported more quickly and efficiently, and opportunities are created when investments create access to or revitalize regions. Numerous studies in economics have documented the tendency for public investments in infrastructure to increase productivity in the private sector.
Despite the importance of infrastructure investments to the economy, West Virginia has allowed its infrastructure to deteriorate. The updating and repair of West Virginia’s infrastructure represents an important economic development opportunity. These investments are needed for safety reasons, and also provide an opportunity to create jobs and make West Virginia more competitive. One way the state could invest more funds in infrastructure is through the West Virginia Infrastructure and Jobs Development Council, which was created to be the state’s funding clearinghouse for water and wastewater projects.
18 Creating an Economic Diversification Trust Fund
Workforce TrainingCustomized, state-funded job training is a vital piece in providing the resources needed to spur economic development and to make the state an attractive place to do business. Customized programs encourage job growth or retention by providing individual businesses with free or low-cost job training that is tailored to the individual business’s personnel needs. Recent studies have shown that customized job training incentives are 10 to 16 times more effective in jobs created per dollar of investment than tax incentives.58
The Governor’s Guaranteed Workforce Training Program, West Virginia’s primary workforce customized job-training program, has awarded more than $57 million to employers and has trained nearly 232,000 workers. In return, West Virginia employers have contributed more than $247 million to the program. Despite this success, the program received less state funding in FY 2012 than it did when the program was created 19 years ago. Increasing investments in this program could provide needed training and retraining for current and new employees. This program could help prepare workers to reenter the labor force and locate available jobs.
West Virginia Center on Budget & Policy 19
West Virginia would benefit greatly from the creation of a permanent severance tax trust fund. An Economic Diversification Fund would help the state meet many of today’s economic challenges, while ensuring that future generations benefit from the mineral wealth of their state. In the past, West Virginia did not gain broadly shared prosperity for its residents, despite the tremendous wealth of natural resources in the state. As the Marcellus Shale gas play begins to boom in West Virginia, the state should take action today to ensure that it truly benefits from the extraction of its valuable natural resources. Without a permanent fund, the economic benefit from the natural resource extraction will decline along with the natural resources themselves.
Conclusion
20 Creating an Economic Diversification Trust Fund
Appendix AA Snapshot of States’ Permanent Funds
Alaska
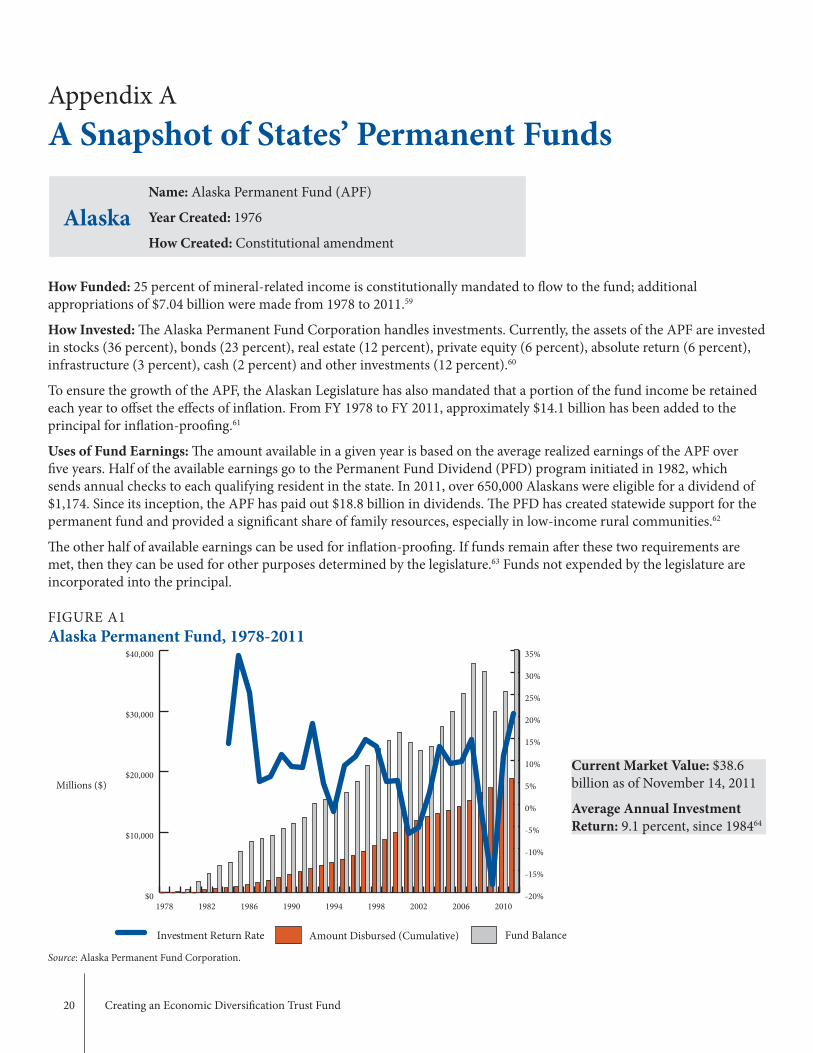
How Funded: 25 percent of mineral-related income is constitutionally mandated to flow to the fund; additional appropriations of $7.04 billion were made from 1978 to 2011.59
How Invested: The Alaska Permanent Fund Corporation handles investments. Currently, the assets of the APF are invested in stocks (36 percent), bonds (23 percent), real estate (12 percent), private equity (6 percent), absolute return (6 percent), infrastructure (3 percent), cash (2 percent) and other investments (12 percent).60
To ensure the growth of the APF, the Alaskan Legislature has also mandated that a portion of the fund income be retained each year to offset the effects of inflation. From FY 1978 to FY 2011, approximately $14.1 billion has been added to the principal for inflation-proofing.61
Uses of Fund Earnings: The amount available in a given year is based on the average realized earnings of the APF over five years. Half of the available earnings go to the Permanent Fund Dividend (PFD) program initiated in 1982, which sends annual checks to each qualifying resident in the state. In 2011, over 650,000 Alaskans were eligible for a dividend of $1,174. Since its inception, the APF has paid out $18.8 billion in dividends. The PFD has created statewide support for the permanent fund and provided a significant share of family resources, especially in low-income rural communities.62
The other half of available earnings can be used for inflation-proofing. If funds remain after these two requirements are met, then they can be used for other purposes determined by the legislature.63 Funds not expended by the legislature are incorporated into the principal.
Name: Alaska Permanent Fund (APF)
Year Created: 1976
How Created: Constitutional amendment
FIGURE A1Alaska Permanent Fund, 1978-2011
Source: Alaska Permanent Fund Corporation.
Current Market Value: $38.6 billion as of November 14, 2011
Average Annual Investment Return: 9.1 percent, since 198464
Millions ($)
$0
$10,000
$20,000
$30,000
$40,000
-20%
-15%
-10%
-5%
0%
5%
10%
15%
20%
25%
30%
35%
Investment Return Rate Fund BalanceAmount Disbursed (Cumulative)
201020062002199819941990198619821978
West Virginia Center on Budget & Policy 21
Montana
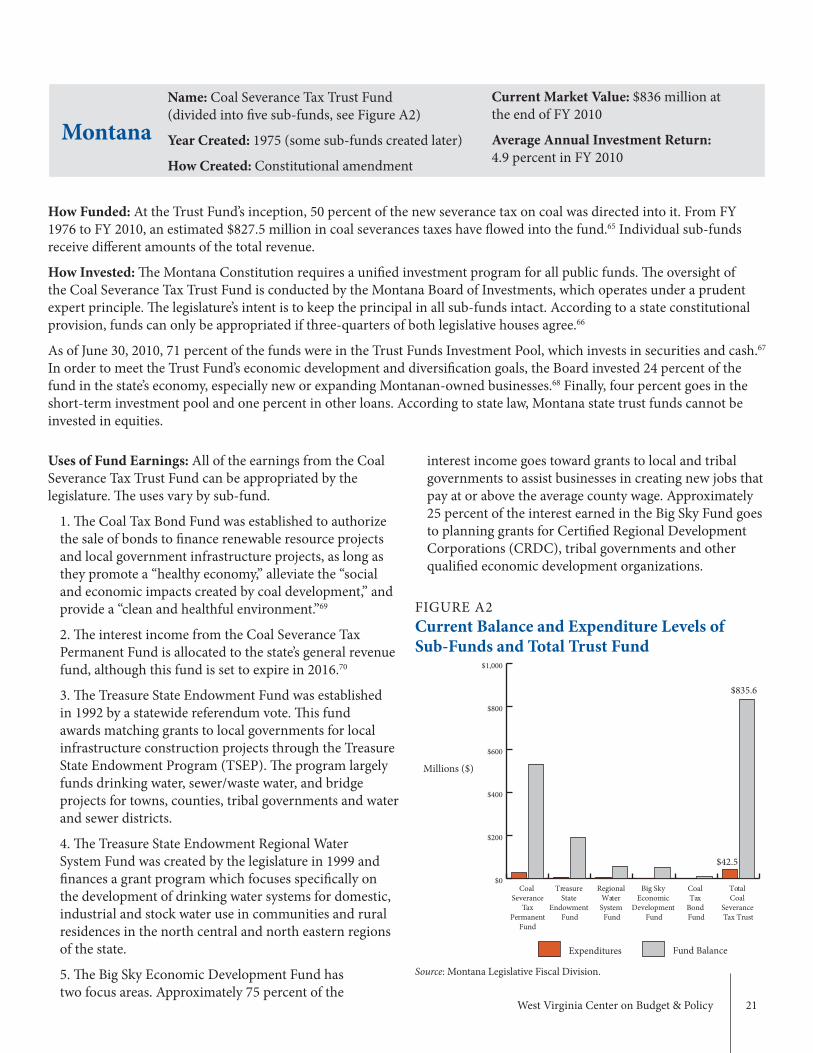
How Funded: At the Trust Fund’s inception, 50 percent of the new severance tax on coal was directed into it. From FY 1976 to FY 2010, an estimated $827.5 million in coal severances taxes have flowed into the fund.65 Individual sub-funds receive different amounts of the total revenue.
How Invested: The Montana Constitution requires a unified investment program for all public funds. The oversight of the Coal Severance Tax Trust Fund is conducted by the Montana Board of Investments, which operates under a prudent expert principle. The legislature’s intent is to keep the principal in all sub-funds intact. According to a state constitutional provision, funds can only be appropriated if three-quarters of both legislative houses agree.66
As of June 30, 2010, 71 percent of the funds were in the Trust Funds Investment Pool, which invests in securities and cash.67 In order to meet the Trust Fund’s economic development and diversification goals, the Board invested 24 percent of the fund in the state’s economy, especially new or expanding Montanan-owned businesses.68 Finally, four percent goes in the short-term investment pool and one percent in other loans. According to state law, Montana state trust funds cannot be invested in equities.
Name: Coal Severance Tax Trust Fund (divided into five sub-funds, see Figure A2)
Year Created: 1975 (some sub-funds created later)
How Created: Constitutional amendment
Current Market Value: $836 million at the end of FY 2010
Average Annual Investment Return: 4.9 percent in FY 2010
Uses of Fund Earnings: All of the earnings from the Coal Severance Tax Trust Fund can be appropriated by the legislature. The uses vary by sub-fund.
1. The Coal Tax Bond Fund was established to authorize the sale of bonds to finance renewable resource projects and local government infrastructure projects, as long as they promote a “healthy economy,” alleviate the “social and economic impacts created by coal development,” and provide a “clean and healthful environment.”69
2. The interest income from the Coal Severance Tax Permanent Fund is allocated to the state’s general revenue fund, although this fund is set to expire in 2016.70
3. The Treasure State Endowment Fund was established in 1992 by a statewide referendum vote. This fund awards matching grants to local governments for local infrastructure construction projects through the Treasure State Endowment Program (TSEP). The program largely funds drinking water, sewer/waste water, and bridge projects for towns, counties, tribal governments and water and sewer districts.
4. The Treasure State Endowment Regional Water System Fund was created by the legislature in 1999 and finances a grant program which focuses specifically on the development of drinking water systems for domestic, industrial and stock water use in communities and rural residences in the north central and north eastern regions of the state.
5. The Big Sky Economic Development Fund has two focus areas. Approximately 75 percent of the
interest income goes toward grants to local and tribal governments to assist businesses in creating new jobs that pay at or above the average county wage. Approximately 25 percent of the interest earned in the Big Sky Fund goes to planning grants for Certified Regional Development Corporations (CRDC), tribal governments and other qualified economic development organizations.
FIGURE A2Current Balance and Expenditure Levels of Sub-Funds and Total Trust Fund
Source: Montana Legislative Fiscal Division.
Millions ($)
$0
$200
$400
$600
$800
$1,000
Fund BalanceExpenditures
Total Coal
Severance Tax Trust
Coal Tax
Bond Fund
Big Sky Economic
Development Fund
Regional Water System
Fund
Treasure State
Endowment Fund
Coal Severance
Tax Permanent
Fund
$835.6
$42.5
22 Creating an Economic Diversification Trust Fund
NewMexico
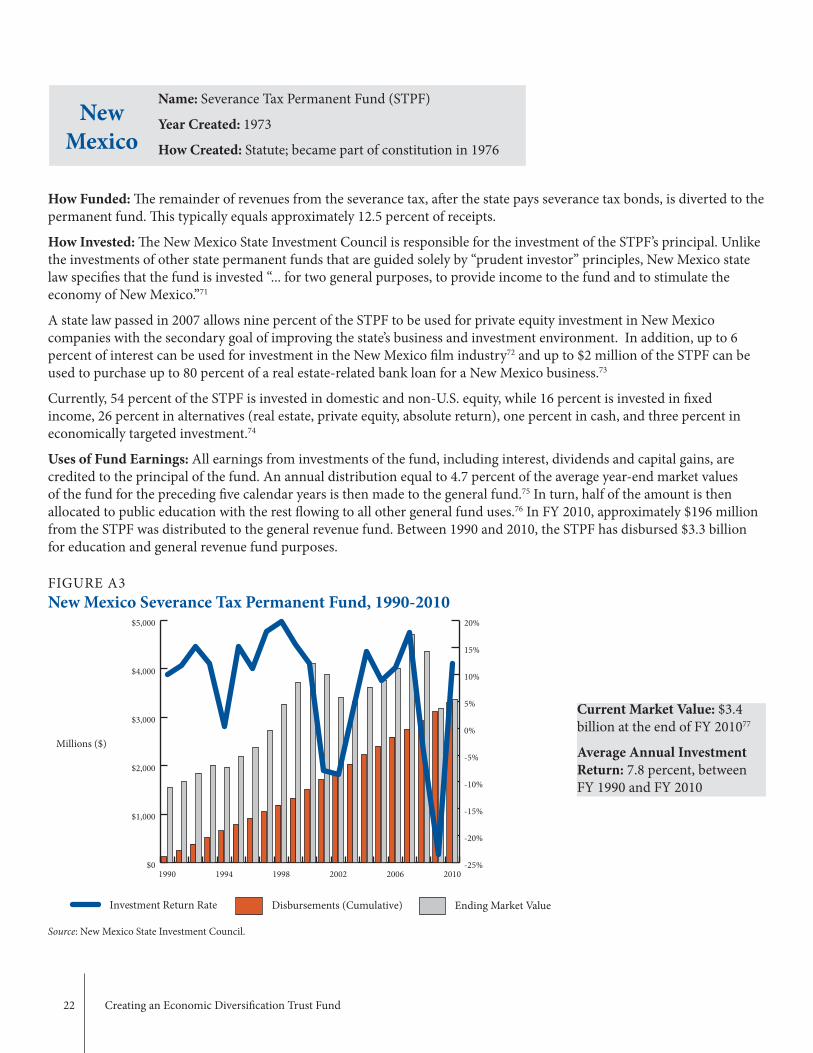
How Funded: The remainder of revenues from the severance tax, after the state pays severance tax bonds, is diverted to the permanent fund. This typically equals approximately 12.5 percent of receipts.
How Invested: The New Mexico State Investment Council is responsible for the investment of the STPF’s principal. Unlike the investments of other state permanent funds that are guided solely by “prudent investor” principles, New Mexico state law specifies that the fund is invested “... for two general purposes, to provide income to the fund and to stimulate the economy of New Mexico.”71
A state law passed in 2007 allows nine percent of the STPF to be used for private equity investment in New Mexico companies with the secondary goal of improving the state’s business and investment environment. In addition, up to 6 percent of interest can be used for investment in the New Mexico film industry72 and up to $2 million of the STPF can be used to purchase up to 80 percent of a real estate-related bank loan for a New Mexico business.73
Currently, 54 percent of the STPF is invested in domestic and non-U.S. equity, while 16 percent is invested in fixed income, 26 percent in alternatives (real estate, private equity, absolute return), one percent in cash, and three percent in economically targeted investment.74
Uses of Fund Earnings: All earnings from investments of the fund, including interest, dividends and capital gains, are credited to the principal of the fund. An annual distribution equal to 4.7 percent of the average year-end market values of the fund for the preceding five calendar years is then made to the general fund.75 In turn, half of the amount is then allocated to public education with the rest flowing to all other general fund uses.76 In FY 2010, approximately $196 million from the STPF was distributed to the general revenue fund. Between 1990 and 2010, the STPF has disbursed $3.3 billion for education and general revenue fund purposes.
Name: Severance Tax Permanent Fund (STPF)
Year Created: 1973
How Created: Statute; became part of constitution in 1976
FIGURE A3New Mexico Severance Tax Permanent Fund, 1990-2010
Source: New Mexico State Investment Council.
Current Market Value: $3.4 billion at the end of FY 201077
Average Annual Investment Return: 7.8 percent, between FY 1990 and FY 2010
Millions ($)
$0
$1,000
$2,000
$3,000
$4,000
$5,000
-25%
-20%
-15%
-10%
-5%
0%
5%
10%
15%
20%
Investment Return Rate Ending Market ValueDisbursements (Cumulative)
201020062002199819941990
West Virginia Center on Budget & Policy 23
NorthDakota
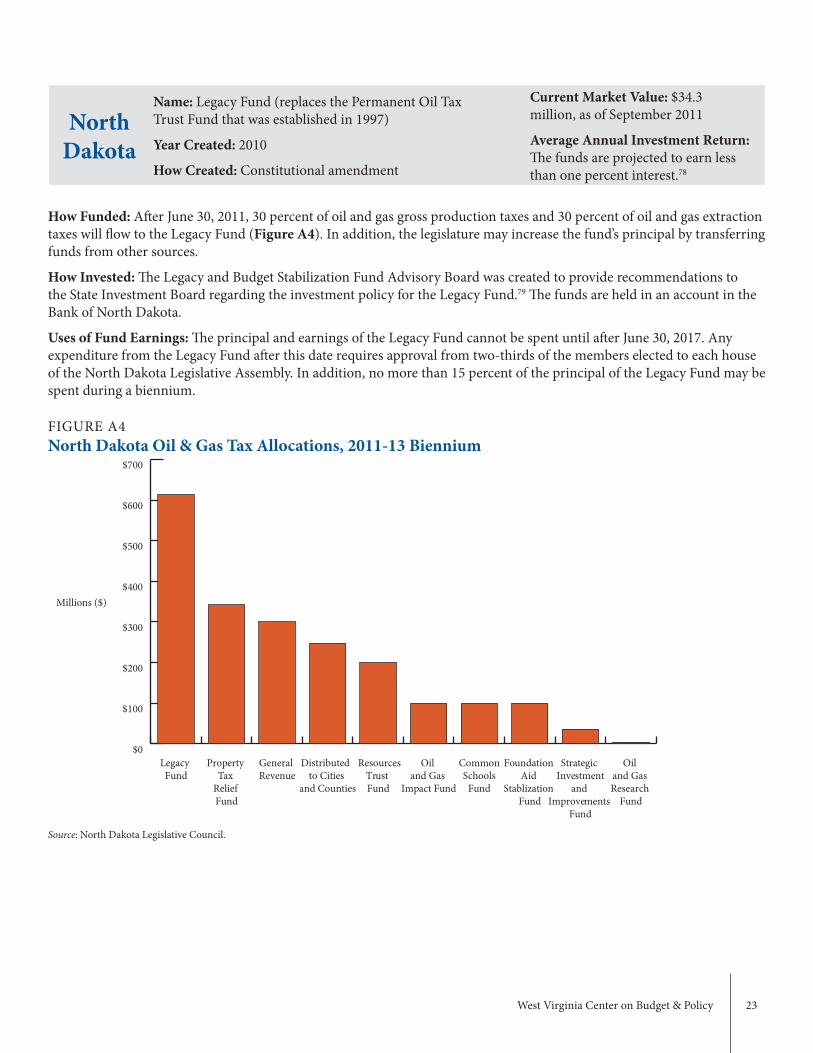
How Funded: After June 30, 2011, 30 percent of oil and gas gross production taxes and 30 percent of oil and gas extraction taxes will flow to the Legacy Fund (Figure A4). In addition, the legislature may increase the fund’s principal by transferring funds from other sources.
How Invested: The Legacy and Budget Stabilization Fund Advisory Board was created to provide recommendations to the State Investment Board regarding the investment policy for the Legacy Fund.79 The funds are held in an account in the Bank of North Dakota.
Uses of Fund Earnings: The principal and earnings of the Legacy Fund cannot be spent until after June 30, 2017. Any expenditure from the Legacy Fund after this date requires approval from two-thirds of the members elected to each house of the North Dakota Legislative Assembly. In addition, no more than 15 percent of the principal of the Legacy Fund may be spent during a biennium.
Name: Legacy Fund (replaces the Permanent Oil Tax Trust Fund that was established in 1997)
Year Created: 2010
How Created: Constitutional amendment
FIGURE A4North Dakota Oil & Gas Tax Allocations, 2011-13 Biennium
Source: North Dakota Legislative Council.
Current Market Value: $34.3 million, as of September 2011
Average Annual Investment Return: The funds are projected to earn less than one percent interest.78
$0
$100
$200
$300
$400
$500
$600
$700
Oil and Gas Research
Fund
Strategic Investment
and Improvements
Fund
Foundation Aid
Stablization Fund
Common Schools
Fund
Oil and Gas
Impact Fund
Resources Trust Fund
Distributed to Cities
and Counties
General Revenue
Property Tax
Relief Fund
Legacy Fund
Millions ($)
24 Creating an Economic Diversification Trust Fund
Utah
How Funded: If severance taxes go above a certain level, this revenue flows into the Endowment Fund.80 Rather than dedicate a specific percentage of these taxes to the fund, the state legislature has specified that revenues in excess of $77 million from oil and gas tax and revenues in excess of $27.6 million from coal mining flow into the Endowment Fund. In FY 2009, $23 million from oil and gas tax revenue was deposited into the fund. Since that time, no other severance tax revenues have been deposited into it.81 The growth of this fund is heavily dependent on oil and gas experiencing “boom times,” which will put tax revenue collections over the stated limit. As Lee Peacock, President of the Utah Petroleum Association, noted, “the threshold is set high enough that only in the very best of years will money spill into the Trust Fund.”82
How Invested: By state law, the principal of the permanent fund is invested in short-term cash investments, bonds, and securities.83
Uses of Fund Earnings: As with other states’ funds, the principal of Utah’s Endowment Fund is protected against use. Three-quarters of the state legislature and the governor must agree to spend money from the fund.
The interest from the fund is transferred to the general fund, then directly appropriated to the Infrastructure and Economic Diversification Development Account. By law, at least 25 percent of the monies collected in this account must go to areas where the severance tax revenues were collected. As of November 2011, no disbursements have been made from this fund.84
Name: State Endowment Fund
Year Created: 2009 (began receiving revenue from severance taxes)
How Created: Constitutional amendment
Current Market Value: $23 million (December 31, 2010)
Average Annual Investment Return: 2.1 percent (2011)
West Virginia Center on Budget & Policy 25
Wyoming
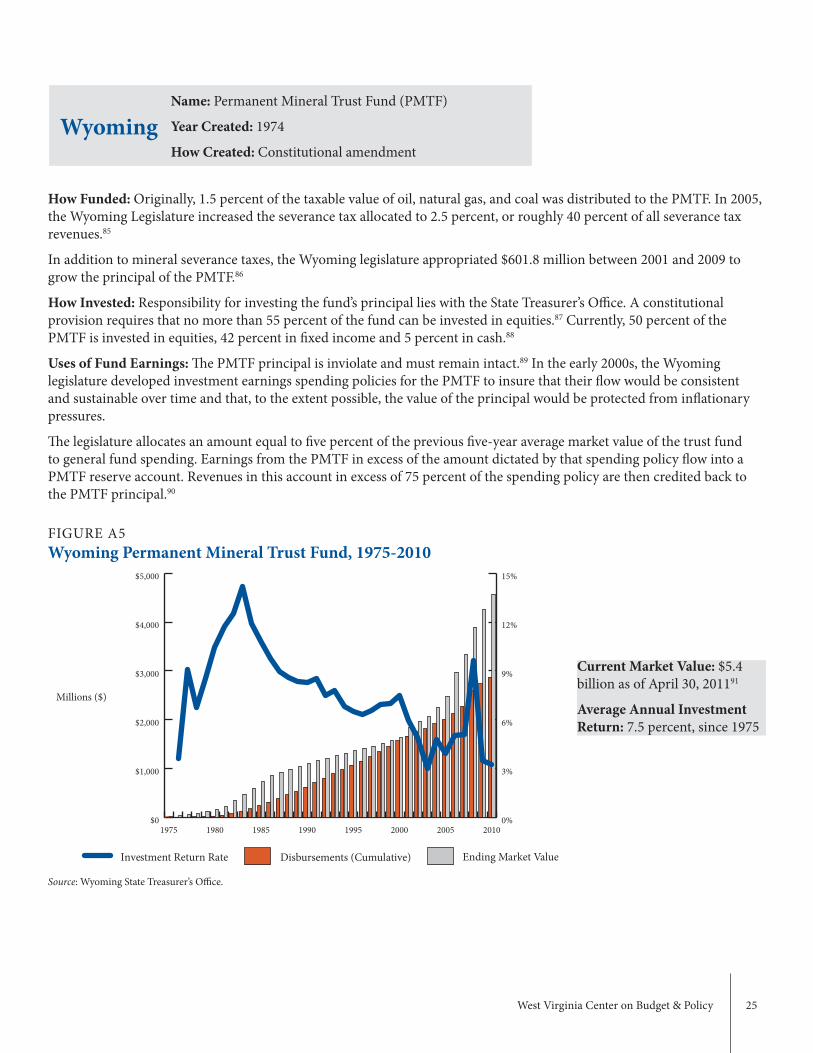
How Funded: Originally, 1.5 percent of the taxable value of oil, natural gas, and coal was distributed to the PMTF. In 2005, the Wyoming Legislature increased the severance tax allocated to 2.5 percent, or roughly 40 percent of all severance tax revenues.85
In addition to mineral severance taxes, the Wyoming legislature appropriated $601.8 million between 2001 and 2009 to grow the principal of the PMTF.86
How Invested: Responsibility for investing the fund’s principal lies with the State Treasurer’s Office. A constitutional provision requires that no more than 55 percent of the fund can be invested in equities.87 Currently, 50 percent of the PMTF is invested in equities, 42 percent in fixed income and 5 percent in cash.88
Uses of Fund Earnings: The PMTF principal is inviolate and must remain intact.89 In the early 2000s, the Wyoming legislature developed investment earnings spending policies for the PMTF to insure that their flow would be consistent and sustainable over time and that, to the extent possible, the value of the principal would be protected from inflationary pressures.
The legislature allocates an amount equal to five percent of the previous five-year average market value of the trust fund to general fund spending. Earnings from the PMTF in excess of the amount dictated by that spending policy flow into a PMTF reserve account. Revenues in this account in excess of 75 percent of the spending policy are then credited back to the PMTF principal.90
Name: Permanent Mineral Trust Fund (PMTF)
Year Created: 1974
How Created: Constitutional amendment
FIGURE A5Wyoming Permanent Mineral Trust Fund, 1975-2010
Source: Wyoming State Treasurer’s Office.
Current Market Value: $5.4 billion as of April 30, 201191
Average Annual Investment Return: 7.5 percent, since 1975
Millions ($)
$0
$1,000
$2,000
$3,000
$4,000
$5,000
0%
3%
6%
9%
12%
15%
20102005200019951990198519801975
Investment Return Rate Disbursements (Cumulative) Ending Market Value
26 Creating an Economic Diversification Trust Fund
Appendix BMethodologies for Projecting Coal and Natural Gas Production and PricesProjections of coal and natural gas production and prices in West Virginia from 2013 through 2035 serve as the basis for projecting future revenues and investments resulting from the proposed permanent fund. From projected production and price values, estimates of future gross production value are calculated for both coal and natural gas. Future permanent fund revenues are estimated using projected gross production value as a starting point.
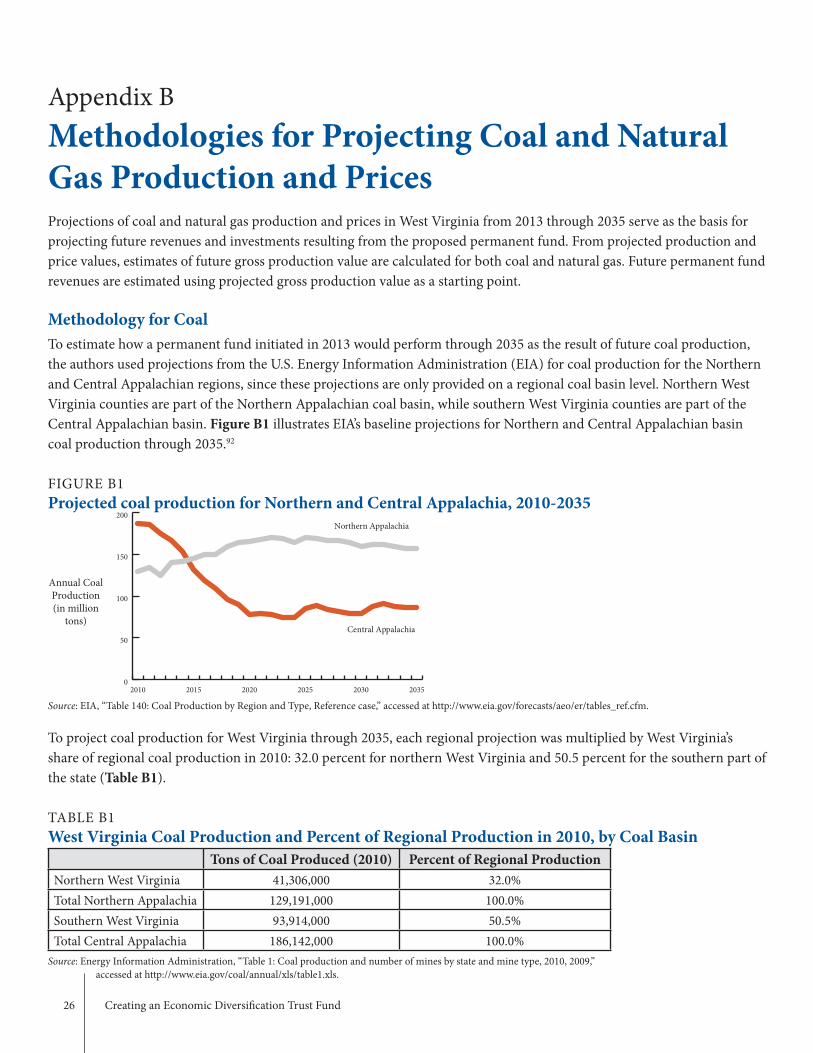
Methodology for CoalTo estimate how a permanent fund initiated in 2013 would perform through 2035 as the result of future coal production, the authors used projections from the U.S. Energy Information Administration (EIA) for coal production for the Northern and Central Appalachian regions, since these projections are only provided on a regional coal basin level. Northern West Virginia counties are part of the Northern Appalachian coal basin, while southern West Virginia counties are part of the Central Appalachian basin. Figure B1 illustrates EIA’s baseline projections for Northern and Central Appalachian basin coal production through 2035.92
FIGURE B1Projected coal production for Northern and Central Appalachia, 2010-2035
Source: EIA, “Table 140: Coal Production by Region and Type, Reference case,” accessed at http://www.eia.gov/forecasts/aeo/er/tables_ref.cfm.
To project coal production for West Virginia through 2035, each regional projection was multiplied by West Virginia’s share of regional coal production in 2010: 32.0 percent for northern West Virginia and 50.5 percent for the southern part of the state (Table B1).
TABLE B1West Virginia Coal Production and Percent of Regional Production in 2010, by Coal Basin
Tons of Coal Produced (2010) Percent of Regional ProductionNorthern West Virginia 41,306,000 32.0%Total Northern Appalachia 129,191,000 100.0%Southern West Virginia 93,914,000 50.5%Total Central Appalachia 186,142,000 100.0%
Source: Energy Information Administration, “Table 1: Coal production and number of mines by state and mine type, 2010, 2009,” accessed at http://www.eia.gov/coal/annual/xls/table1.xls.
Annual Coal Production (in million
tons)
0
50
100
150
200
Central Appalachia
Northern Appalachia
203520302025202020152010
West Virginia Center on Budget & Policy 27
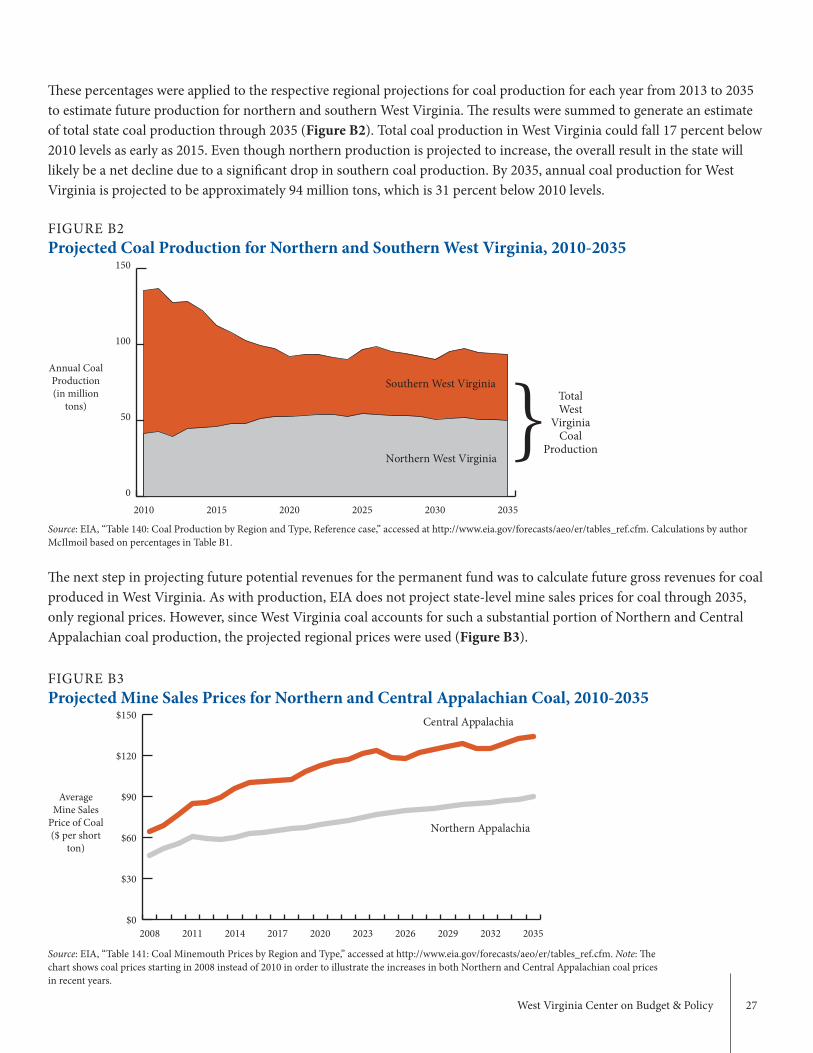
These percentages were applied to the respective regional projections for coal production for each year from 2013 to 2035 to estimate future production for northern and southern West Virginia. The results were summed to generate an estimate of total state coal production through 2035 (Figure B2). Total coal production in West Virginia could fall 17 percent below 2010 levels as early as 2015. Even though northern production is projected to increase, the overall result in the state will likely be a net decline due to a significant drop in southern coal production. By 2035, annual coal production for West Virginia is projected to be approximately 94 million tons, which is 31 percent below 2010 levels.
The next step in projecting future potential revenues for the permanent fund was to calculate future gross revenues for coal produced in West Virginia. As with production, EIA does not project state-level mine sales prices for coal through 2035, only regional prices. However, since West Virginia coal accounts for such a substantial portion of Northern and Central Appalachian coal production, the projected regional prices were used (Figure B3).
FIGURE B2Projected Coal Production for Northern and Southern West Virginia, 2010-2035
Source: EIA, “Table 140: Coal Production by Region and Type, Reference case,” accessed at http://www.eia.gov/forecasts/aeo/er/tables_ref.cfm. Calculations by author McIlmoil based on percentages in Table B1.
FIGURE B3Projected Mine Sales Prices for Northern and Central Appalachian Coal, 2010-2035
Source: EIA, “Table 141: Coal Minemouth Prices by Region and Type,” accessed at http://www.eia.gov/forecasts/aeo/er/tables_ref.cfm. Note: The chart shows coal prices starting in 2008 instead of 2010 in order to illustrate the increases in both Northern and Central Appalachian coal prices in recent years.
Annual Coal Production (in million
tons)
Average Mine Sales
Price of Coal ($ per short
ton)
} Total West
Virginia Coal
Production
0
50
100
150
203520302025202020152010
Southern West Virginia
Northern West Virginia
$0
$30
$60
$90
$120
$150 Central Appalachia
Northern Appalachia
2035203220292026202320202017201420112008
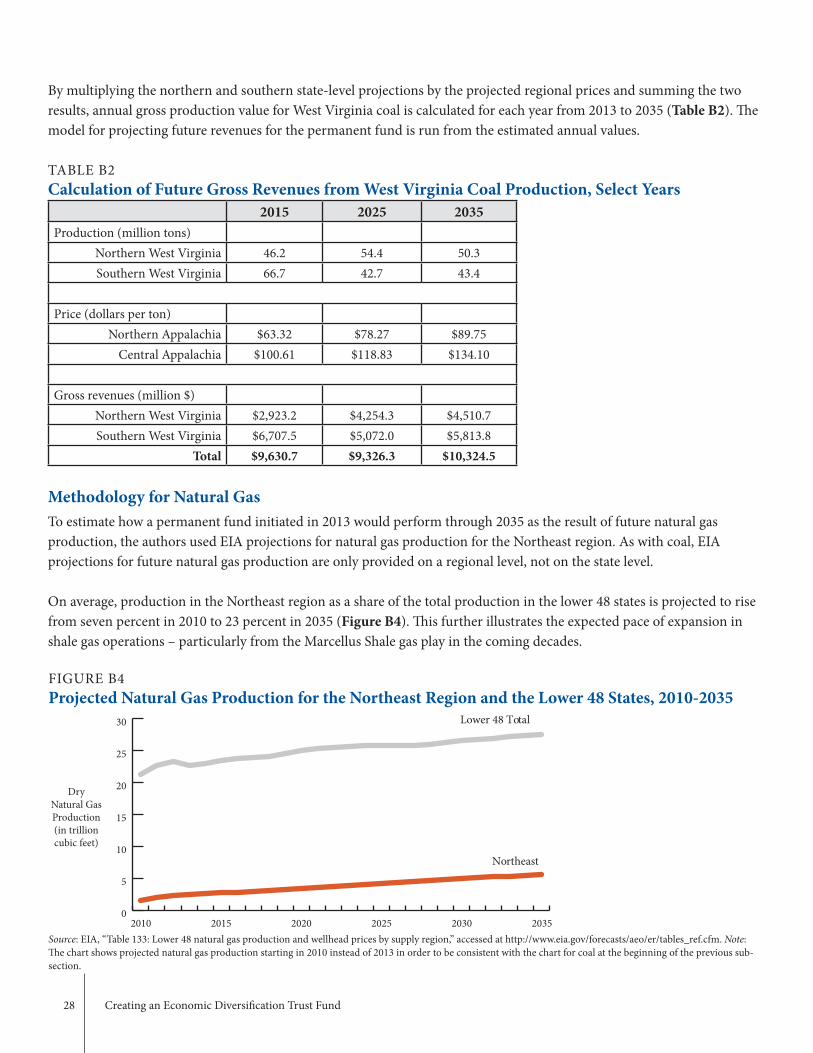
28 Creating an Economic Diversification Trust Fund
By multiplying the northern and southern state-level projections by the projected regional prices and summing the two results, annual gross production value for West Virginia coal is calculated for each year from 2013 to 2035 (Table B2). The model for projecting future revenues for the permanent fund is run from the estimated annual values.
TABLE B2Calculation of Future Gross Revenues from West Virginia Coal Production, Select Years
2015 2025 2035Production (million tons)
Northern West Virginia 46.2 54.4 50.3Southern West Virginia 66.7 42.7 43.4
Price (dollars per ton)Northern Appalachia $63.32 $78.27 $89.75
Central Appalachia $100.61 $118.83 $134.10
Gross revenues (million $)Northern West Virginia $2,923.2 $4,254.3 $4,510.7Southern West Virginia $6,707.5 $5,072.0 $5,813.8
Total $9,630.7 $9,326.3 $10,324.5
Methodology for Natural GasTo estimate how a permanent fund initiated in 2013 would perform through 2035 as the result of future natural gas production, the authors used EIA projections for natural gas production for the Northeast region. As with coal, EIA projections for future natural gas production are only provided on a regional level, not on the state level.
On average, production in the Northeast region as a share of the total production in the lower 48 states is projected to rise from seven percent in 2010 to 23 percent in 2035 (Figure B4). This further illustrates the expected pace of expansion in shale gas operations – particularly from the Marcellus Shale gas play in the coming decades.
FIGURE B4Projected Natural Gas Production for the Northeast Region and the Lower 48 States, 2010-2035
Source: EIA, “Table 133: Lower 48 natural gas production and wellhead prices by supply region,” accessed at http://www.eia.gov/forecasts/aeo/er/tables_ref.cfm. Note: The chart shows projected natural gas production starting in 2010 instead of 2013 in order to be consistent with the chart for coal at the beginning of the previous sub-section.
Dry Natural Gas Production (in trillion cubic feet)
0
5
10
15
20
25
30
Northeast
Lower 48 Total
203520302025202020152010
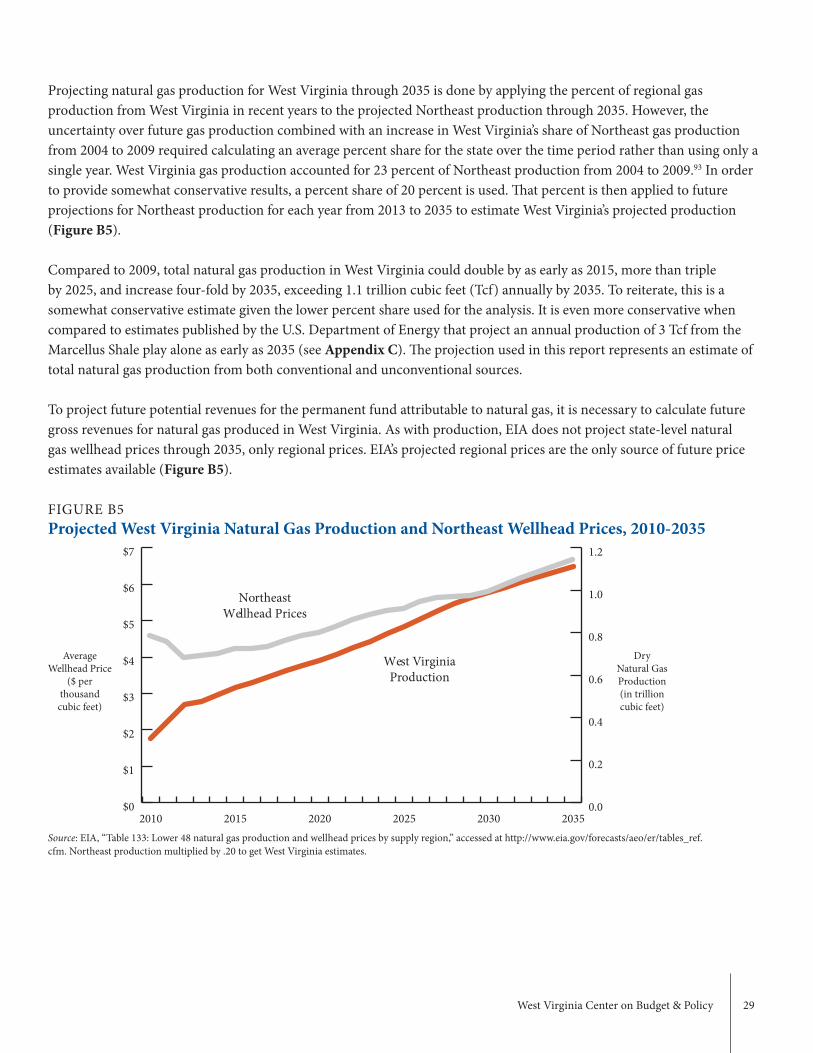
West Virginia Center on Budget & Policy 29
Projecting natural gas production for West Virginia through 2035 is done by applying the percent of regional gas production from West Virginia in recent years to the projected Northeast production through 2035. However, the uncertainty over future gas production combined with an increase in West Virginia’s share of Northeast gas production from 2004 to 2009 required calculating an average percent share for the state over the time period rather than using only a single year. West Virginia gas production accounted for 23 percent of Northeast production from 2004 to 2009.93 In order to provide somewhat conservative results, a percent share of 20 percent is used. That percent is then applied to future projections for Northeast production for each year from 2013 to 2035 to estimate West Virginia’s projected production (Figure B5).
Compared to 2009, total natural gas production in West Virginia could double by as early as 2015, more than triple by 2025, and increase four-fold by 2035, exceeding 1.1 trillion cubic feet (Tcf) annually by 2035. To reiterate, this is a somewhat conservative estimate given the lower percent share used for the analysis. It is even more conservative when compared to estimates published by the U.S. Department of Energy that project an annual production of 3 Tcf from the Marcellus Shale play alone as early as 2035 (see Appendix C). The projection used in this report represents an estimate of total natural gas production from both conventional and unconventional sources.
To project future potential revenues for the permanent fund attributable to natural gas, it is necessary to calculate future gross revenues for natural gas produced in West Virginia. As with production, EIA does not project state-level natural gas wellhead prices through 2035, only regional prices. EIA’s projected regional prices are the only source of future price estimates available (Figure B5).
FIGURE B5Projected West Virginia Natural Gas Production and Northeast Wellhead Prices, 2010-2035
Source: EIA, “Table 133: Lower 48 natural gas production and wellhead prices by supply region,” accessed at http://www.eia.gov/forecasts/aeo/er/tables_ref.cfm. Northeast production multiplied by .20 to get West Virginia estimates.
Dry Natural Gas Production (in trillion cubic feet)
Average Wellhead Price
($ per thousand cubic feet)
0.0
0.2
0.4
0.6
0.8
1.0
1.2
West VirginiaProduction
203520302025202020152010$0
$1
$2
$3
$4
$5
$6
$7
Northeast Wellhead Prices
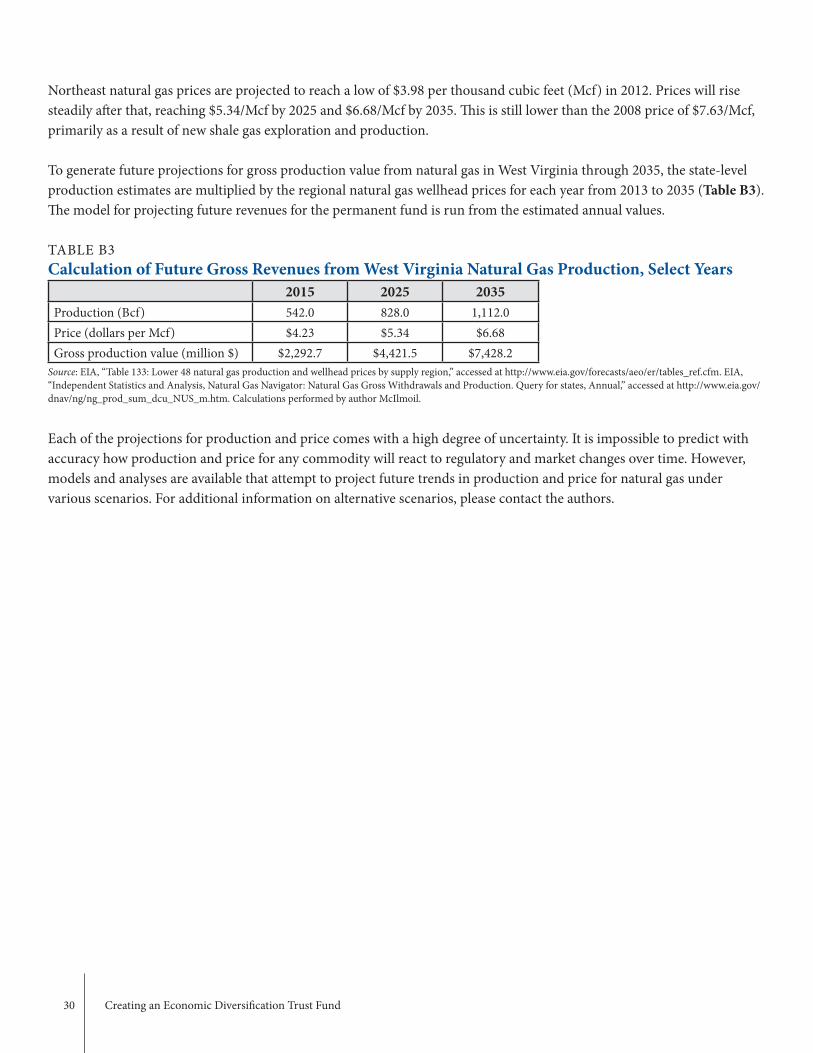
30 Creating an Economic Diversification Trust Fund
Northeast natural gas prices are projected to reach a low of $3.98 per thousand cubic feet (Mcf) in 2012. Prices will rise steadily after that, reaching $5.34/Mcf by 2025 and $6.68/Mcf by 2035. This is still lower than the 2008 price of $7.63/Mcf, primarily as a result of new shale gas exploration and production.
To generate future projections for gross production value from natural gas in West Virginia through 2035, the state-level production estimates are multiplied by the regional natural gas wellhead prices for each year from 2013 to 2035 (Table B3). The model for projecting future revenues for the permanent fund is run from the estimated annual values.
TABLE B3Calculation of Future Gross Revenues from West Virginia Natural Gas Production, Select Years
2015 2025 2035Production (Bcf) 542.0 828.0 1,112.0Price (dollars per Mcf) $4.23 $5.34 $6.68Gross production value (million $) $2,292.7 $4,421.5 $7,428.2
Source: EIA, “Table 133: Lower 48 natural gas production and wellhead prices by supply region,” accessed at http://www.eia.gov/forecasts/aeo/er/tables_ref.cfm. EIA, “Independent Statistics and Analysis, Natural Gas Navigator: Natural Gas Gross Withdrawals and Production. Query for states, Annual,” accessed at http://www.eia.gov/dnav/ng/ng_prod_sum_dcu_NUS_m.htm. Calculations performed by author McIlmoil.
Each of the projections for production and price comes with a high degree of uncertainty. It is impossible to predict with accuracy how production and price for any commodity will react to regulatory and market changes over time. However, models and analyses are available that attempt to project future trends in production and price for natural gas under various scenarios. For additional information on alternative scenarios, please contact the authors.
West Virginia Center on Budget & Policy 31
Appendix CComparative Analysis of Alternative Funding SourcesSummary of AlternativesOther financing options and permanent fund structures were examined by the authors, but were not proposed in this report. These options are discussed here with attention paid to the reasons for not selecting them.
Workers’ Compensation TaxOne option is to maintain the 56 cent-per-ton tax currently collected under the Workers’ Compensation Tax on coal and natural gas, and transfer those revenues to the West Virginia Economic Diversification Trust Fund. The Workers’ Compensation Tax is set to expire after 2014, when the unfunded liability of the “Old Fund” – to which the tax is dedicated – is projected to be paid or provided for in its entirety.94 As a result, the revenues would be available for other purposes such as a permanent fund.
The Workers’ Compensation Tax as a financing option for the permanent fund was rejected as the proposed financing vehicle in this report because it would not generate as much revenue as a one percent increase in the severance tax. However, transferring the existing revenues from the Workers’ Compensation Tax on coal and natural gas to the permanent fund would amount to a projected average severance tax rate of 0.68 percent through 2035, beginning at 0.78 percent in 2013 and falling to 0.60 percent in 2035. This is significantly less than the one percent increase in the severance tax proposed in this report; nonetheless, since it would still generate a substantial amount of revenue for the permanent fund and would effectively be a declining tax, it may serve as a viable alternative to financing a permanent fund with a one percent increase in the severance tax.
West Virginia Future FundAnother financing option was put forward by Senator Jeff Kessler during the 2010 Legislative Session during discussions about a proposed West Virginia Future Fund. The Future Fund would be financed using 25 percent of future severance tax revenues from Marcellus Shale natural gas production, in addition to the interest earned on those revenues once deposited into the Fund. This option was not chosen for this report, because it only used natural gas extraction from Marcellus Shale wells and excluded conventional gas and coal production.
Revenues Generated from the Different OptionsA comparative analysis of the revenues that could be generated from a permanent fund financed by these two alternate financing options is provided in this section. To analyze Senator Kessler’s Future Fund, it was necessary to generate a projection for future natural gas production from Marcellus Shale wells. To do so, values for total West Virginia natural gas production through 2035 under the reference case were used as a starting point. The next step was to estimate future conventional (non-shale) gas production, which was performed by assuming an annual growth rate of two percent, reflecting the average annual growth in conventional natural gas production in West Virginia from 2004 to 2009. Unconventional coalbed methane gas production is assumed to be 30 Bcf per year. Future Marcellus Shale production was calculated by subtracting projections for conventional gas production from the projections for total gas production. An annual percentage was then calculated reflecting the portion of total gas production coming from Marcellus Shale wells (Figure C1).
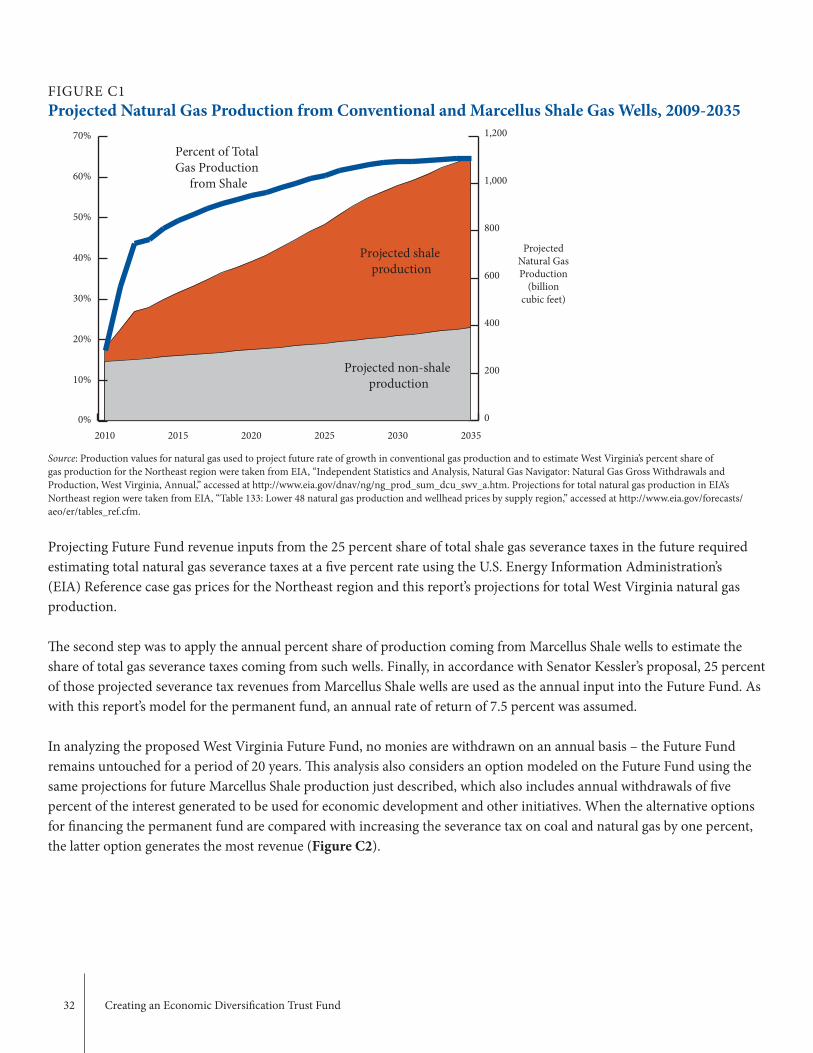
32 Creating an Economic Diversification Trust Fund
FIGURE C1Projected Natural Gas Production from Conventional and Marcellus Shale Gas Wells, 2009-2035
Source: Production values for natural gas used to project future rate of growth in conventional gas production and to estimate West Virginia’s percent share of gas production for the Northeast region were taken from EIA, “Independent Statistics and Analysis, Natural Gas Navigator: Natural Gas Gross Withdrawals and Production, West Virginia, Annual,” accessed at http://www.eia.gov/dnav/ng/ng_prod_sum_dcu_swv_a.htm. Projections for total natural gas production in EIA’s Northeast region were taken from EIA, “Table 133: Lower 48 natural gas production and wellhead prices by supply region,” accessed at http://www.eia.gov/forecasts/aeo/er/tables_ref.cfm.
Projecting Future Fund revenue inputs from the 25 percent share of total shale gas severance taxes in the future required estimating total natural gas severance taxes at a five percent rate using the U.S. Energy Information Administration’s (EIA) Reference case gas prices for the Northeast region and this report’s projections for total West Virginia natural gas production.
The second step was to apply the annual percent share of production coming from Marcellus Shale wells to estimate the share of total gas severance taxes coming from such wells. Finally, in accordance with Senator Kessler’s proposal, 25 percent of those projected severance tax revenues from Marcellus Shale wells are used as the annual input into the Future Fund. As with this report’s model for the permanent fund, an annual rate of return of 7.5 percent was assumed.
In analyzing the proposed West Virginia Future Fund, no monies are withdrawn on an annual basis – the Future Fund remains untouched for a period of 20 years. This analysis also considers an option modeled on the Future Fund using the same projections for future Marcellus Shale production just described, which also includes annual withdrawals of five percent of the interest generated to be used for economic development and other initiatives. When the alternative options for financing the permanent fund are compared with increasing the severance tax on coal and natural gas by one percent, the latter option generates the most revenue (Figure C2).
Projected Natural Gas Production
(billion cubic feet)
0
200
400
600
800
1,000
1,200
203520302025202020152010
Projected shale production
Projected non-shale production
0%
10%
20%
30%
40%
50%
60%
70%Percent of Total Gas Production
from Shale

West Virginia Center on Budget & Policy 33
The Workers’ Compensation Tax generates nearly equivalent revenue as the one percent severance tax increase, although the gap widens as more time elapses. The limited nature of the West Virginia Future Fund results in the lowest amount of revenues generated for economic development spending. Since the proposal precludes withdrawing funds for 20 years, this option would provide no funds for economic development. Even if the proposal allowed for five percent of the annual interest generated from the Future Fund to be withdrawn, the cumulative funding generated would be only $485 million over the 22-year period modeled.
The decision to use the one percent increase in the severance tax becomes clearer when one examines the remaining principal for each option for select years (Figure C3).
Even though more funds are being withdrawn each year under the one percent financing option, the permanent fund would still maintain a greater principal under this option than the alternatives, amounting to $3.7 billion in 2035. The Workers’ Compensation Tax option comes in a close second once again.
FIGURE C2Comparison of Cumulative Funding Available under Various Financing Options, Select Years
Source: Calculations by author McIlmoil.
FIGURE C3Comparison of the Remaining Principal under Various Financing Options, Select Years
Source: Calculations by author McIlmoil.
Revenue Generated
for Investments
in State (millions $)
Remaining End-of-Year Principal in
Fund (millions $)
$0
$500
$1,000
$1,500
$2,000
$2,500
West Virginia Future Fund, 5% Withdrawal
West Virginia Future Fund
Worker's Compensation Tax
1% Severance Tax Increase
203520252015
$31 $24 $3
$583
$437
$85
$2,028
$1,460
$385
$0
$500
$1,000
$1,500
$2,000
$2,500
$3,000
$3,500
$4,000
West Virginia Future Fund, 5% Withdrawal
West Virginia Future Fund
Worker's Compensation Tax
1% Severance Tax Increase
203520252015
$358
$37
$1,689
$1,241
$289
$3,732
$2,576
$273$40
$400
$1,482
$854
34 Creating an Economic Diversification Trust Fund
ConclusionsOverall, increasing the severance tax on coal and natural gas by one percent and using the revenues to finance a West Virginia Economic Diversification Fund as modeled in this report generates more revenues for economic development and results in a greater remaining principal over time than any of the other options examined. In total, the one percent severance tax option would generate $5.8 billion in total revenues through 2035 if invested in a permanent fund. However, given that the Workers’ Compensation Tax is already being levied on coal and natural gas, extending the life of the tax and transferring these revenues into the permanent fund would provide a viable alternative.
The model of the West Virginia Future Fund results in the lowest amount of revenues and is not recommended, because it is only financed using revenues from Marcellus Shale natural gas production rather than total production from both natural gas and coal. However, if the state legislature passes Senator Kessler’s legislation creating a West Virginia Future Fund, it is recommended that the structure and operation of the Fund be revised so as to include annual withdrawals of five percent of the generated interest to be used for funding economic development and other initiatives.
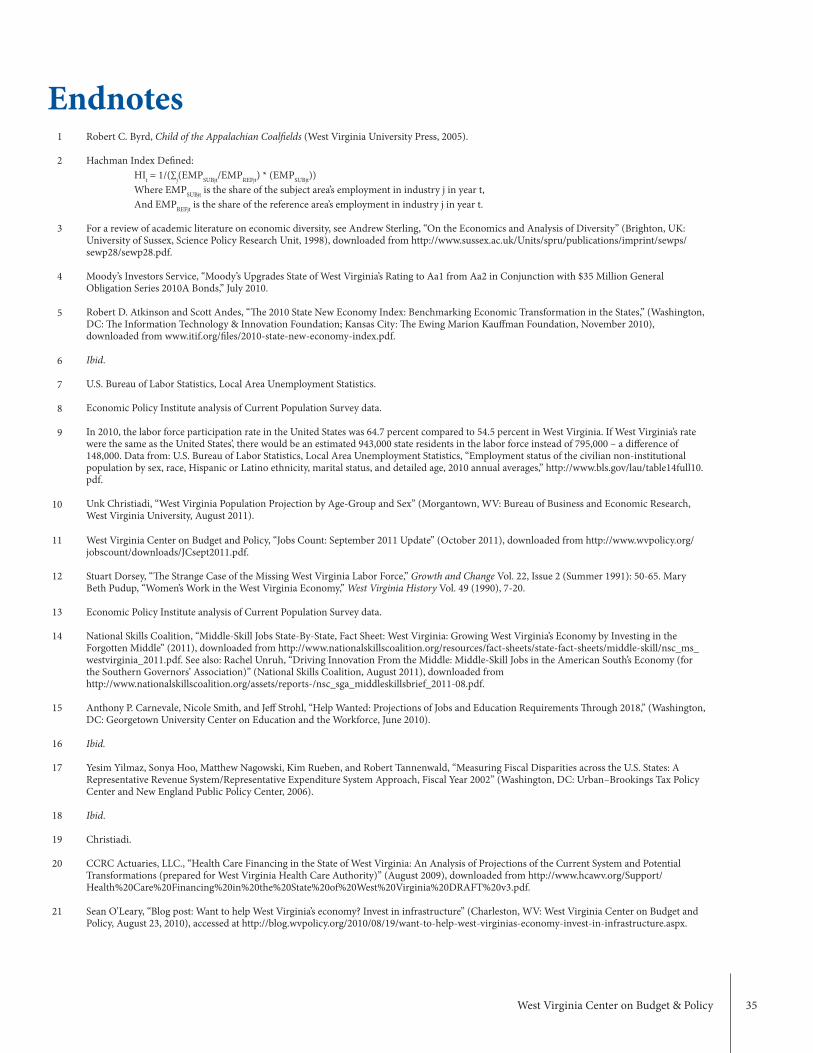
West Virginia Center on Budget & Policy 35
1
2
3
4
5
6
7
8
9
10
11
12
13
14
15
16
17
18
19
20
21
Robert C. Byrd, Child of the Appalachian Coalfields (West Virginia University Press, 2005).
Hachman Index Defined: HIt = 1/(∑j(EMPSUBjt/EMPREFjt) * (EMPSUBjt)) Where EMPSUBjt is the share of the subject area’s employment in industry j in year t, And EMPREFjt is the share of the reference area’s employment in industry j in year t.
For a review of academic literature on economic diversity, see Andrew Sterling, “On the Economics and Analysis of Diversity” (Brighton, UK: University of Sussex, Science Policy Research Unit, 1998), downloaded from http://www.sussex.ac.uk/Units/spru/publications/imprint/sewps/sewp28/sewp28.pdf.
Moody’s Investors Service, “Moody’s Upgrades State of West Virginia’s Rating to Aa1 from Aa2 in Conjunction with $35 Million General Obligation Series 2010A Bonds,” July 2010.
Robert D. Atkinson and Scott Andes, “The 2010 State New Economy Index: Benchmarking Economic Transformation in the States,” (Washington, DC: The Information Technology & Innovation Foundation; Kansas City: The Ewing Marion Kauffman Foundation, November 2010), downloaded from www.itif.org/files/2010-state-new-economy-index.pdf.
Ibid.
U.S. Bureau of Labor Statistics, Local Area Unemployment Statistics.
Economic Policy Institute analysis of Current Population Survey data.
In 2010, the labor force participation rate in the United States was 64.7 percent compared to 54.5 percent in West Virginia. If West Virginia’s rate were the same as the United States’, there would be an estimated 943,000 state residents in the labor force instead of 795,000 – a difference of 148,000. Data from: U.S. Bureau of Labor Statistics, Local Area Unemployment Statistics, “Employment status of the civilian non-institutional population by sex, race, Hispanic or Latino ethnicity, marital status, and detailed age, 2010 annual averages,” http://www.bls.gov/lau/table14full10.pdf.
Unk Christiadi, “West Virginia Population Projection by Age-Group and Sex” (Morgantown, WV: Bureau of Business and Economic Research, West Virginia University, August 2011).
West Virginia Center on Budget and Policy, “Jobs Count: September 2011 Update” (October 2011), downloaded from http://www.wvpolicy.org/jobscount/downloads/JCsept2011.pdf.
Stuart Dorsey, “The Strange Case of the Missing West Virginia Labor Force,” Growth and Change Vol. 22, Issue 2 (Summer 1991): 50-65. Mary Beth Pudup, “Women’s Work in the West Virginia Economy,” West Virginia History Vol. 49 (1990), 7-20.
Economic Policy Institute analysis of Current Population Survey data.
National Skills Coalition, “Middle-Skill Jobs State-By-State, Fact Sheet: West Virginia: Growing West Virginia’s Economy by Investing in the Forgotten Middle” (2011), downloaded from http://www.nationalskillscoalition.org/resources/fact-sheets/state-fact-sheets/middle-skill/nsc_ms_westvirginia_2011.pdf. See also: Rachel Unruh, “Driving Innovation From the Middle: Middle-Skill Jobs in the American South’s Economy (for the Southern Governors’ Association)” (National Skills Coalition, August 2011), downloaded fromhttp://www.nationalskillscoalition.org/assets/reports-/nsc_sga_middleskillsbrief_2011-08.pdf.
Anthony P. Carnevale, Nicole Smith, and Jeff Strohl, “Help Wanted: Projections of Jobs and Education Requirements Through 2018,” (Washington, DC: Georgetown University Center on Education and the Workforce, June 2010).
Ibid.
Yesim Yilmaz, Sonya Hoo, Matthew Nagowski, Kim Rueben, and Robert Tannenwald, “Measuring Fiscal Disparities across the U.S. States: A Representative Revenue System/Representative Expenditure System Approach, Fiscal Year 2002” (Washington, DC: Urban–Brookings Tax Policy Center and New England Public Policy Center, 2006).
Ibid.
Christiadi.
CCRC Actuaries, LLC., “Health Care Financing in the State of West Virginia: An Analysis of Projections of the Current System and Potential Transformations (prepared for West Virginia Health Care Authority)” (August 2009), downloaded from http://www.hcawv.org/Support/Health%20Care%20Financing%20in%20the%20State%20of%20West%20Virginia%20DRAFT%20v3.pdf.
Sean O’Leary, “Blog post: Want to help West Virginia’s economy? Invest in infrastructure” (Charleston, WV: West Virginia Center on Budget and Policy, August 23, 2010), accessed at http://blog.wvpolicy.org/2010/08/19/want-to-help-west-virginias-economy-invest-in-infrastructure.aspx.
Endnotes
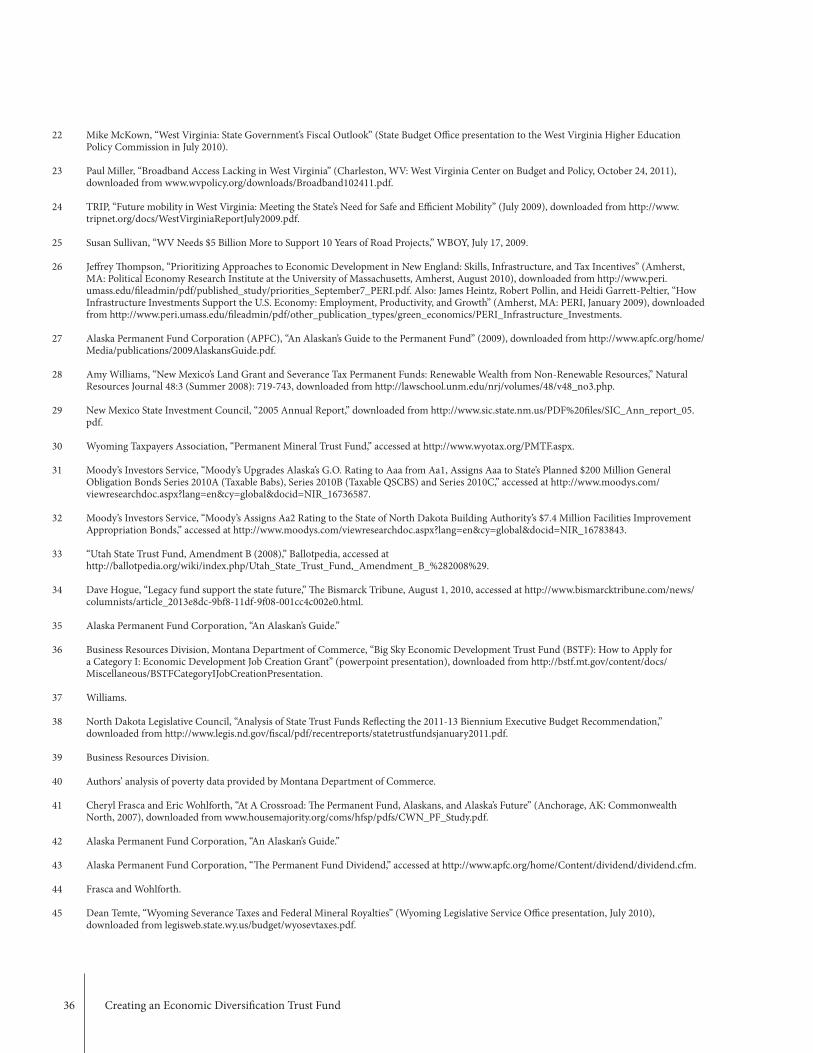
36 Creating an Economic Diversification Trust Fund
22
23
24
25
26
27
28
29
30
31
32
33
34
35
36
37
38
39
40
41
42
43
44
45
Mike McKown, “West Virginia: State Government’s Fiscal Outlook” (State Budget Office presentation to the West Virginia Higher Education Policy Commission in July 2010).
Paul Miller, “Broadband Access Lacking in West Virginia” (Charleston, WV: West Virginia Center on Budget and Policy, October 24, 2011), downloaded from www.wvpolicy.org/downloads/Broadband102411.pdf.
TRIP, “Future mobility in West Virginia: Meeting the State’s Need for Safe and Efficient Mobility” (July 2009), downloaded from http://www.tripnet.org/docs/WestVirginiaReportJuly2009.pdf.
Susan Sullivan, “WV Needs $5 Billion More to Support 10 Years of Road Projects,” WBOY, July 17, 2009.
Jeffrey Thompson, “Prioritizing Approaches to Economic Development in New England: Skills, Infrastructure, and Tax Incentives” (Amherst, MA: Political Economy Research Institute at the University of Massachusetts, Amherst, August 2010), downloaded from http://www.peri.umass.edu/fileadmin/pdf/published_study/priorities_September7_PERI.pdf. Also: James Heintz, Robert Pollin, and Heidi Garrett-Peltier, “How Infrastructure Investments Support the U.S. Economy: Employment, Productivity, and Growth” (Amherst, MA: PERI, January 2009), downloaded from http://www.peri.umass.edu/fileadmin/pdf/other_publication_types/green_economics/PERI_Infrastructure_Investments.
Alaska Permanent Fund Corporation (APFC), “An Alaskan’s Guide to the Permanent Fund” (2009), downloaded from http://www.apfc.org/home/Media/publications/2009AlaskansGuide.pdf.
Amy Williams, “New Mexico’s Land Grant and Severance Tax Permanent Funds: Renewable Wealth from Non-Renewable Resources,” Natural Resources Journal 48:3 (Summer 2008): 719-743, downloaded from http://lawschool.unm.edu/nrj/volumes/48/v48_no3.php.
New Mexico State Investment Council, “2005 Annual Report,” downloaded from http://www.sic.state.nm.us/PDF%20files/SIC_Ann_report_05.pdf.
Wyoming Taxpayers Association, “Permanent Mineral Trust Fund,” accessed at http://www.wyotax.org/PMTF.aspx.
Moody’s Investors Service, “Moody’s Upgrades Alaska’s G.O. Rating to Aaa from Aa1, Assigns Aaa to State’s Planned $200 Million General Obligation Bonds Series 2010A (Taxable Babs), Series 2010B (Taxable QSCBS) and Series 2010C,” accessed at http://www.moodys.com/viewresearchdoc.aspx?lang=en&cy=global&docid=NIR_16736587.
Moody’s Investors Service, “Moody’s Assigns Aa2 Rating to the State of North Dakota Building Authority’s $7.4 Million Facilities Improvement Appropriation Bonds,” accessed at http://www.moodys.com/viewresearchdoc.aspx?lang=en&cy=global&docid=NIR_16783843.
“Utah State Trust Fund, Amendment B (2008),” Ballotpedia, accessed athttp://ballotpedia.org/wiki/index.php/Utah_State_Trust_Fund,_Amendment_B_%282008%29.
Dave Hogue, “Legacy fund support the state future,” The Bismarck Tribune, August 1, 2010, accessed at http://www.bismarcktribune.com/news/columnists/article_2013e8dc-9bf8-11df-9f08-001cc4c002e0.html.
Alaska Permanent Fund Corporation, “An Alaskan’s Guide.”
Business Resources Division, Montana Department of Commerce, “Big Sky Economic Development Trust Fund (BSTF): How to Apply for a Category I: Economic Development Job Creation Grant” (powerpoint presentation), downloaded from http://bstf.mt.gov/content/docs/Miscellaneous/BSTFCategoryIJobCreationPresentation.
Williams.
North Dakota Legislative Council, “Analysis of State Trust Funds Reflecting the 2011-13 Biennium Executive Budget Recommendation,” downloaded from http://www.legis.nd.gov/fiscal/pdf/recentreports/statetrustfundsjanuary2011.pdf.
Business Resources Division.
Authors’ analysis of poverty data provided by Montana Department of Commerce.
Cheryl Frasca and Eric Wohlforth, “At A Crossroad: The Permanent Fund, Alaskans, and Alaska’s Future” (Anchorage, AK: Commonwealth North, 2007), downloaded from www.housemajority.org/coms/hfsp/pdfs/CWN_PF_Study.pdf.
Alaska Permanent Fund Corporation, “An Alaskan’s Guide.”
Alaska Permanent Fund Corporation, “The Permanent Fund Dividend,” accessed at http://www.apfc.org/home/Content/dividend/dividend.cfm.
Frasca and Wohlforth.
Dean Temte, “Wyoming Severance Taxes and Federal Mineral Royalties” (Wyoming Legislative Service Office presentation, July 2010), downloaded from legisweb.state.wy.us/budget/wyosevtaxes.pdf.
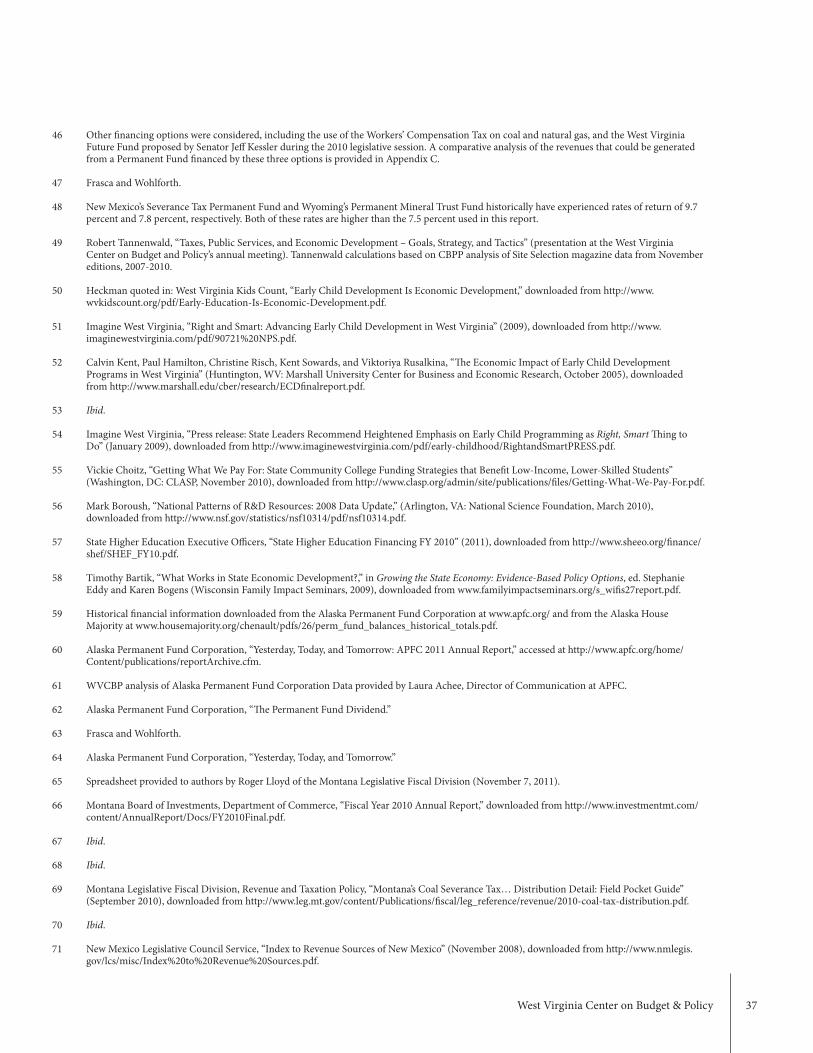
West Virginia Center on Budget & Policy 37
46
47
48
49
50
51
52
53
54
55
56
57
58
59
60
61
62
63
64
65
66
67
68
69
70
71
Other financing options were considered, including the use of the Workers’ Compensation Tax on coal and natural gas, and the West Virginia Future Fund proposed by Senator Jeff Kessler during the 2010 legislative session. A comparative analysis of the revenues that could be generated from a Permanent Fund financed by these three options is provided in Appendix C.
Frasca and Wohlforth.
New Mexico’s Severance Tax Permanent Fund and Wyoming’s Permanent Mineral Trust Fund historically have experienced rates of return of 9.7 percent and 7.8 percent, respectively. Both of these rates are higher than the 7.5 percent used in this report.
Robert Tannenwald, “Taxes, Public Services, and Economic Development – Goals, Strategy, and Tactics” (presentation at the West Virginia Center on Budget and Policy’s annual meeting). Tannenwald calculations based on CBPP analysis of Site Selection magazine data from November editions, 2007-2010.
Heckman quoted in: West Virginia Kids Count, “Early Child Development Is Economic Development,” downloaded from http://www.wvkidscount.org/pdf/Early-Education-Is-Economic-Development.pdf.
Imagine West Virginia, “Right and Smart: Advancing Early Child Development in West Virginia” (2009), downloaded from http://www.imaginewestvirginia.com/pdf/90721%20NPS.pdf.
Calvin Kent, Paul Hamilton, Christine Risch, Kent Sowards, and Viktoriya Rusalkina, “The Economic Impact of Early Child Development Programs in West Virginia” (Huntington, WV: Marshall University Center for Business and Economic Research, October 2005), downloaded from http://www.marshall.edu/cber/research/ECDfinalreport.pdf.
Ibid.
Imagine West Virginia, “Press release: State Leaders Recommend Heightened Emphasis on Early Child Programming as Right, Smart Thing to Do” (January 2009), downloaded from http://www.imaginewestvirginia.com/pdf/early-childhood/RightandSmartPRESS.pdf.
Vickie Choitz, “Getting What We Pay For: State Community College Funding Strategies that Benefit Low-Income, Lower-Skilled Students” (Washington, DC: CLASP, November 2010), downloaded from http://www.clasp.org/admin/site/publications/files/Getting-What-We-Pay-For.pdf.
Mark Boroush, “National Patterns of R&D Resources: 2008 Data Update,” (Arlington, VA: National Science Foundation, March 2010), downloaded from http://www.nsf.gov/statistics/nsf10314/pdf/nsf10314.pdf.
State Higher Education Executive Officers, “State Higher Education Financing FY 2010” (2011), downloaded from http://www.sheeo.org/finance/shef/SHEF_FY10.pdf.
Timothy Bartik, “What Works in State Economic Development?,” in Growing the State Economy: Evidence-Based Policy Options, ed. Stephanie Eddy and Karen Bogens (Wisconsin Family Impact Seminars, 2009), downloaded from www.familyimpactseminars.org/s_wifis27report.pdf.
Historical financial information downloaded from the Alaska Permanent Fund Corporation at www.apfc.org/ and from the Alaska House Majority at www.housemajority.org/chenault/pdfs/26/perm_fund_balances_historical_totals.pdf.
Alaska Permanent Fund Corporation, “Yesterday, Today, and Tomorrow: APFC 2011 Annual Report,” accessed at http://www.apfc.org/home/Content/publications/reportArchive.cfm.
WVCBP analysis of Alaska Permanent Fund Corporation Data provided by Laura Achee, Director of Communication at APFC.
Alaska Permanent Fund Corporation, “The Permanent Fund Dividend.”
Frasca and Wohlforth.
Alaska Permanent Fund Corporation, “Yesterday, Today, and Tomorrow.”
Spreadsheet provided to authors by Roger Lloyd of the Montana Legislative Fiscal Division (November 7, 2011).
Montana Board of Investments, Department of Commerce, “Fiscal Year 2010 Annual Report,” downloaded from http://www.investmentmt.com/content/AnnualReport/Docs/FY2010Final.pdf.
Ibid.
Ibid.
Montana Legislative Fiscal Division, Revenue and Taxation Policy, “Montana’s Coal Severance Tax… Distribution Detail: Field Pocket Guide” (September 2010), downloaded from http://www.leg.mt.gov/content/Publications/fiscal/leg_reference/revenue/2010-coal-tax-distribution.pdf.
Ibid.
New Mexico Legislative Council Service, “Index to Revenue Sources of New Mexico” (November 2008), downloaded from http://www.nmlegis.gov/lcs/misc/Index%20to%20Revenue%20Sources.pdf.
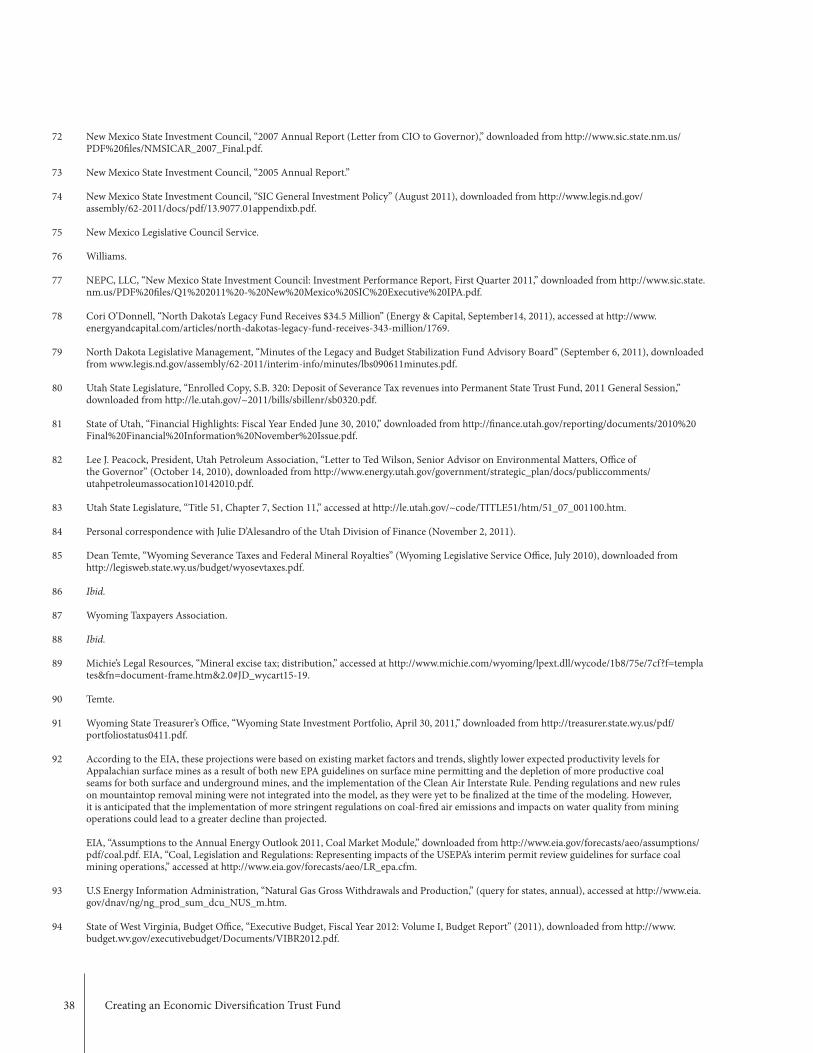
38 Creating an Economic Diversification Trust Fund
72
73
74
75
76
77
78
79
80
81
82
83
84
85
86
87
88
89
90
91
92
93
94
New Mexico State Investment Council, “2007 Annual Report (Letter from CIO to Governor),” downloaded from http://www.sic.state.nm.us/PDF%20files/NMSICAR_2007_Final.pdf.
New Mexico State Investment Council, “2005 Annual Report.”
New Mexico State Investment Council, “SIC General Investment Policy” (August 2011), downloaded from http://www.legis.nd.gov/assembly/62-2011/docs/pdf/13.9077.01appendixb.pdf.
New Mexico Legislative Council Service.
Williams.
NEPC, LLC, “New Mexico State Investment Council: Investment Performance Report, First Quarter 2011,” downloaded from http://www.sic.state.nm.us/PDF%20files/Q1%202011%20-%20New%20Mexico%20SIC%20Executive%20IPA.pdf.
Cori O’Donnell, “North Dakota’s Legacy Fund Receives $34.5 Million” (Energy & Capital, September14, 2011), accessed at http://www.energyandcapital.com/articles/north-dakotas-legacy-fund-receives-343-million/1769.
North Dakota Legislative Management, “Minutes of the Legacy and Budget Stabilization Fund Advisory Board” (September 6, 2011), downloaded from www.legis.nd.gov/assembly/62-2011/interim-info/minutes/lbs090611minutes.pdf.
Utah State Legislature, “Enrolled Copy, S.B. 320: Deposit of Severance Tax revenues into Permanent State Trust Fund, 2011 General Session,” downloaded from http://le.utah.gov/~2011/bills/sbillenr/sb0320.pdf.
State of Utah, “Financial Highlights: Fiscal Year Ended June 30, 2010,” downloaded from http://finance.utah.gov/reporting/documents/2010%20Final%20Financial%20Information%20November%20Issue.pdf.
Lee J. Peacock, President, Utah Petroleum Association, “Letter to Ted Wilson, Senior Advisor on Environmental Matters, Office of the Governor” (October 14, 2010), downloaded from http://www.energy.utah.gov/government/strategic_plan/docs/publiccomments/utahpetroleumassocation10142010.pdf.
Utah State Legislature, “Title 51, Chapter 7, Section 11,” accessed at http://le.utah.gov/~code/TITLE51/htm/51_07_001100.htm.
Personal correspondence with Julie D’Alesandro of the Utah Division of Finance (November 2, 2011).
Dean Temte, “Wyoming Severance Taxes and Federal Mineral Royalties” (Wyoming Legislative Service Office, July 2010), downloaded from http://legisweb.state.wy.us/budget/wyosevtaxes.pdf.
Ibid.
Wyoming Taxpayers Association.
Ibid.
Michie’s Legal Resources, “Mineral excise tax; distribution,” accessed at http://www.michie.com/wyoming/lpext.dll/wycode/1b8/75e/7cf?f=templates&fn=document-frame.htm&2.0#JD_wycart15-19.
Temte.
Wyoming State Treasurer’s Office, “Wyoming State Investment Portfolio, April 30, 2011,” downloaded from http://treasurer.state.wy.us/pdf/portfoliostatus0411.pdf.
According to the EIA, these projections were based on existing market factors and trends, slightly lower expected productivity levels for Appalachian surface mines as a result of both new EPA guidelines on surface mine permitting and the depletion of more productive coal seams for both surface and underground mines, and the implementation of the Clean Air Interstate Rule. Pending regulations and new rules on mountaintop removal mining were not integrated into the model, as they were yet to be finalized at the time of the modeling. However, it is anticipated that the implementation of more stringent regulations on coal-fired air emissions and impacts on water quality from mining operations could lead to a greater decline than projected.
EIA, “Assumptions to the Annual Energy Outlook 2011, Coal Market Module,” downloaded from http://www.eia.gov/forecasts/aeo/assumptions/pdf/coal.pdf. EIA, “Coal, Legislation and Regulations: Representing impacts of the USEPA’s interim permit review guidelines for surface coal mining operations,” accessed at http://www.eia.gov/forecasts/aeo/LR_epa.cfm.
U.S Energy Information Administration, “Natural Gas Gross Withdrawals and Production,” (query for states, annual), accessed at http://www.eia.gov/dnav/ng/ng_prod_sum_dcu_NUS_m.htm.
State of West Virginia, Budget Office, “Executive Budget, Fiscal Year 2012: Volume I, Budget Report” (2011), downloaded from http://www.budget.wv.gov/executivebudget/Documents/VIBR2012.pdf.
Working Toward a Shared Prosperity
The West Virginia Center on Budget and Policy is a policy research organization that is nonpartisan, nonprofit, and statewide. It focuses on how policy decisions affect all West Virginians, including low- and moderate-income families, other vulnerable populations, and the important community programs that serve them.
723 Kanawha Blvd, Suite 300Charleston, WV 25301
Tel: 304.720.8682Fax: 304.720.9696www.wvpolicy.org