Creating a Performance Culture
24
Creating a Performance Culture to End Homelessness (Rapid Re-housing Data Analytics Project) 1 Jamie Taylor, Ph.D. Mark Johnston The Cloudburst Group
Transcript of Creating a Performance Culture
Creating a
Performance Culture
to End Homelessness (Rapid Re-housing Data Analytics Project)
1
Jamie Taylor, Ph.D. Mark Johnston The Cloudburst Group
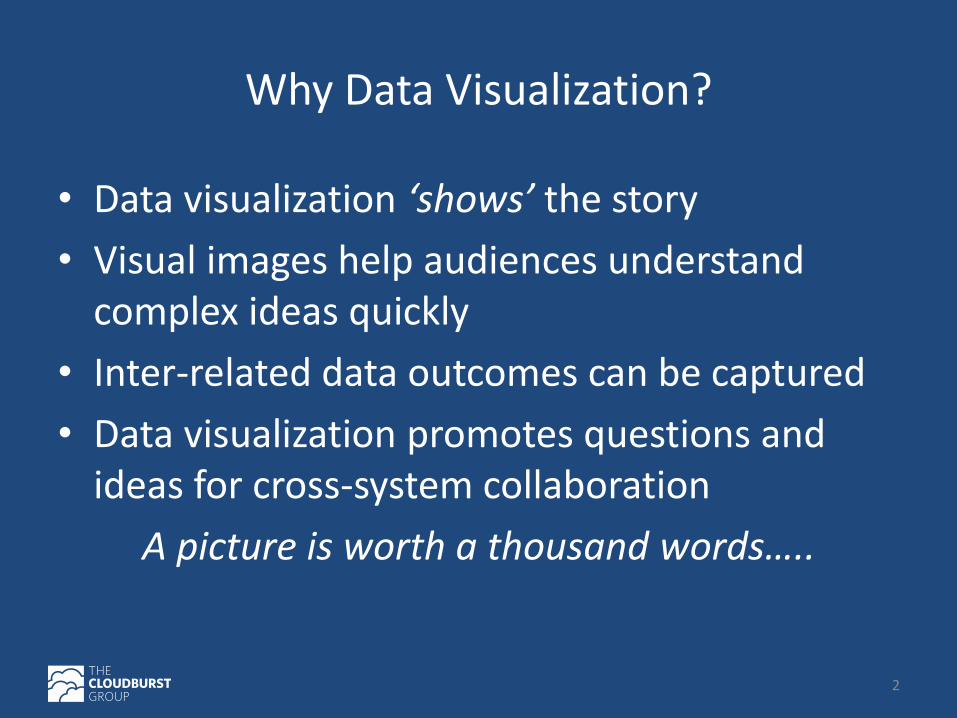
Why Data Visualization?
• Data visualization ‘shows’ the story
• Visual images help audiences understand complex ideas quickly
• Inter-related data outcomes can be captured
• Data visualization promotes questions and ideas for cross-system collaboration
A picture is worth a thousand words…..
2
3
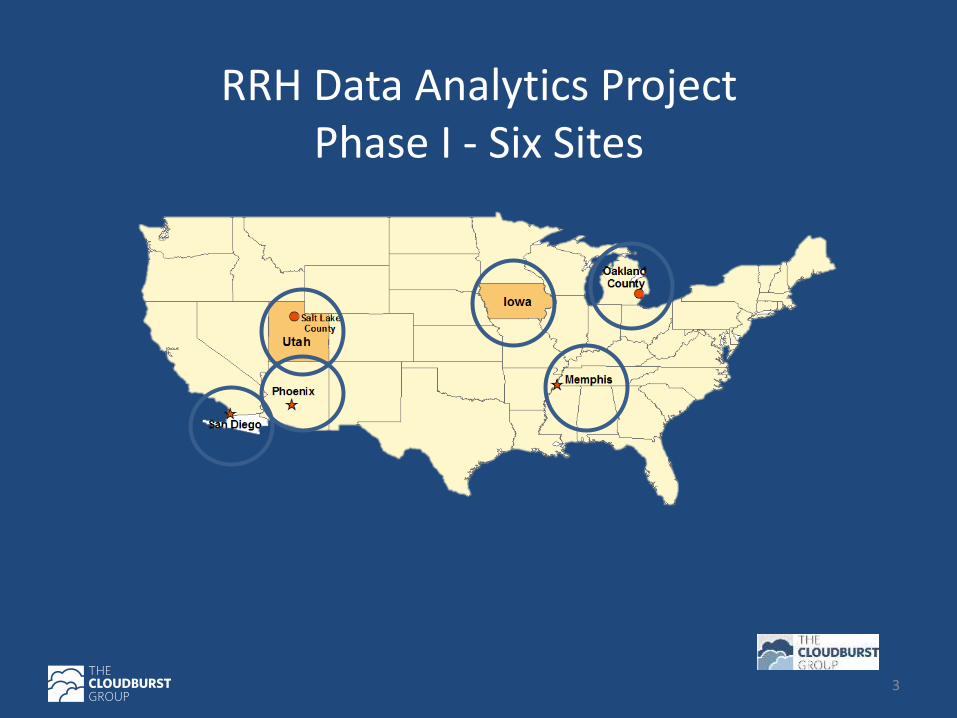
RRH Data Analytics Project Phase I - Six Sites
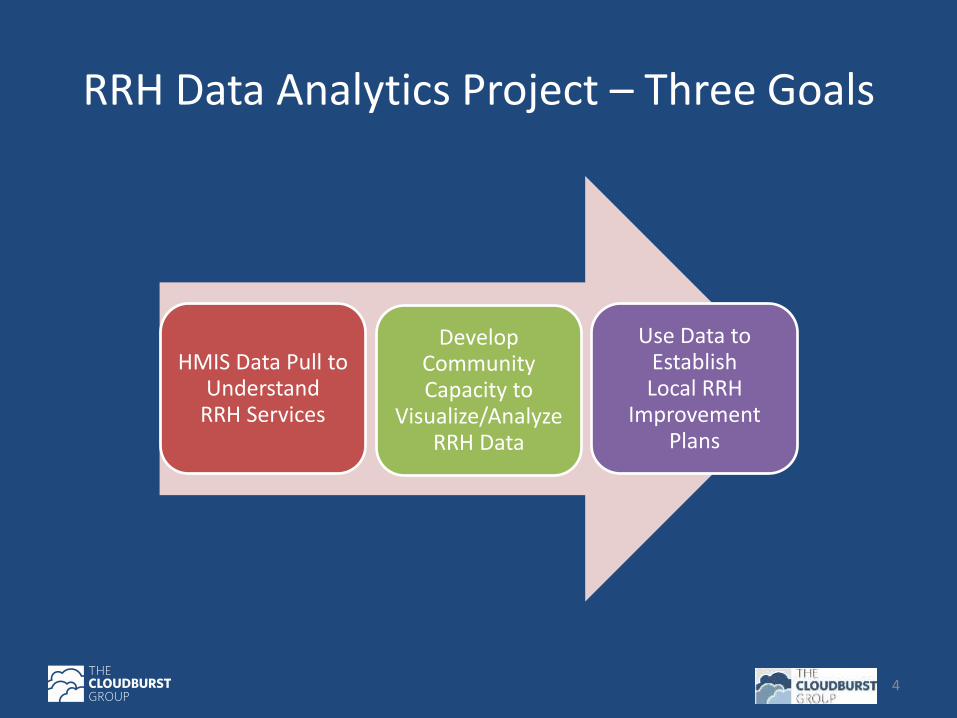
RRH Data Analytics Project – Three Goals
4
HMIS Data Pull to Understand
RRH Services
Develop Community Capacity to
Visualize/Analyze RRH Data
Use Data to Establish Local RRH
Improvement Plans
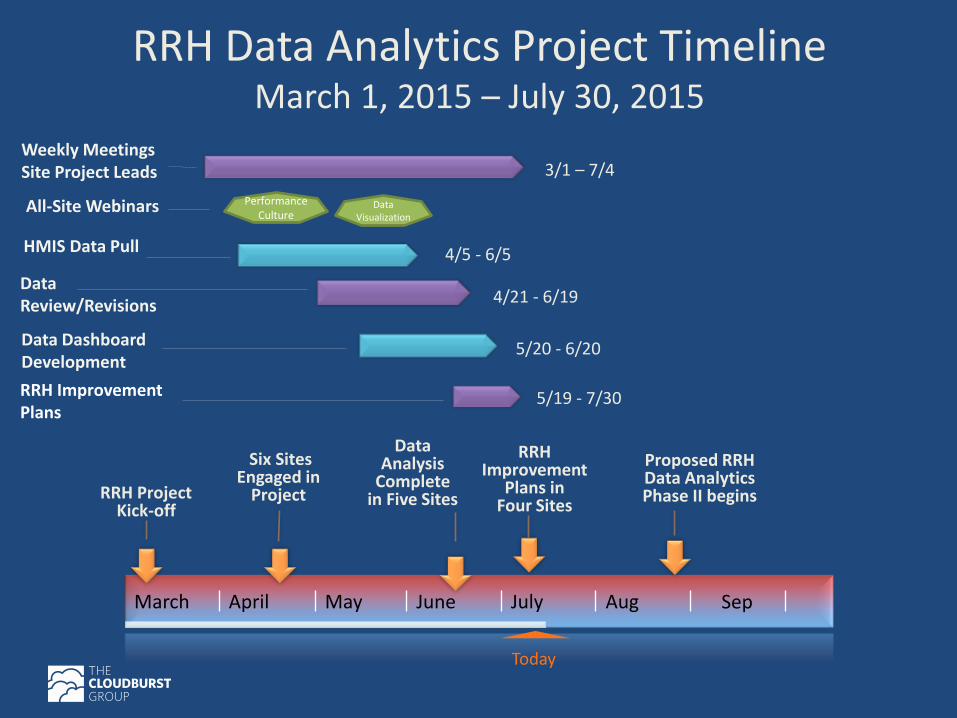
RRH Data Analytics Project Timeline March 1, 2015 – July 30, 2015
March April May June July Aug
Today
Proposed RRH Data Analytics Phase II begins
Data Analysis
Complete in Five Sites
Six Sites Engaged in
Project RRH Project Kick-off
RRH Improvement Plans
5/19 - 7/30
Data Dashboard Development
5/20 - 6/20
Data Review/Revisions 4/21 - 6/19
HMIS Data Pull 4/5 - 6/5
Weekly Meetings Site Project Leads 3/1 – 7/4
RRH Improvement
Plans in Four Sites
Sep
All-Site Webinars Performance Culture
Data Visualization
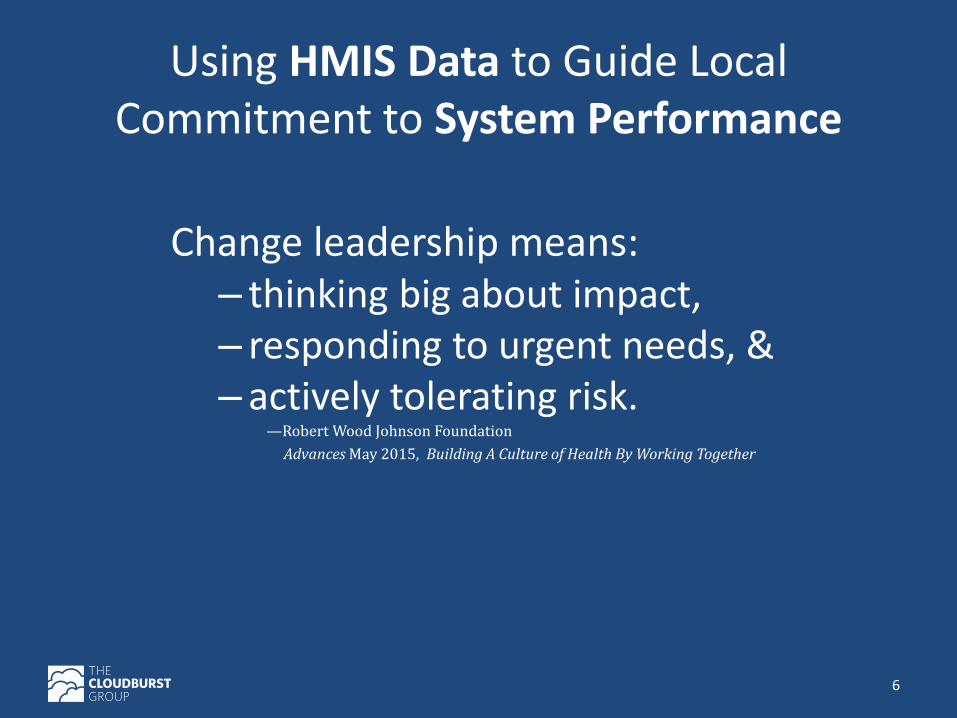
Using HMIS Data to Guide Local Commitment to System Performance
Change leadership means: – thinking big about impact, – responding to urgent needs, & – actively tolerating risk. —Robert Wood Johnson Foundation
Advances May 2015, Building A Culture of Health By Working Together
6
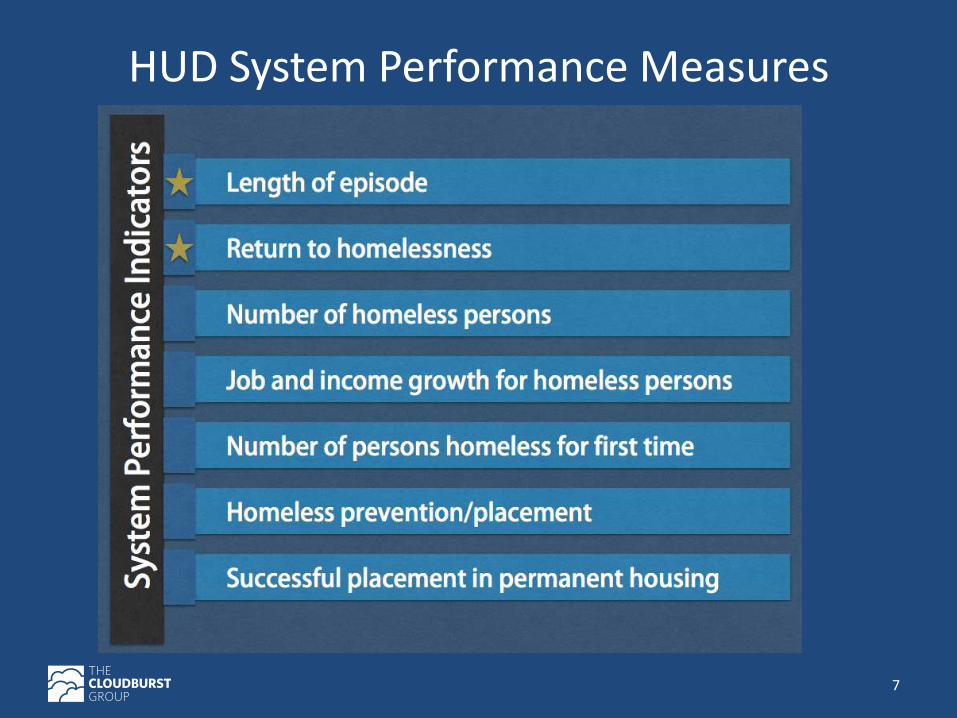
HUD System Performance Measures
7
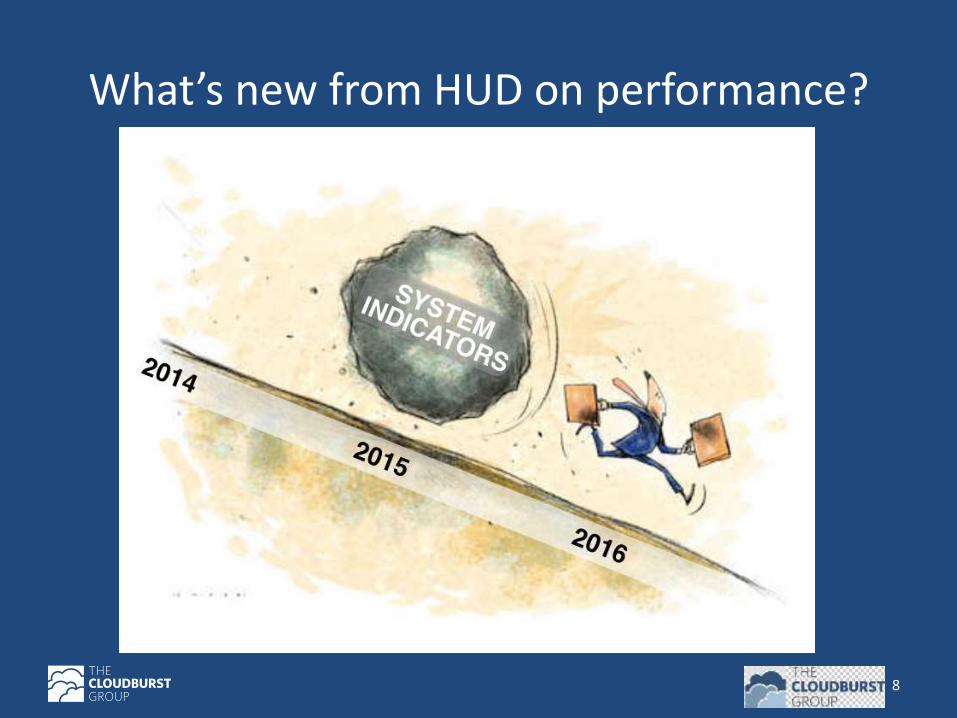
What’s new from HUD on performance?
8
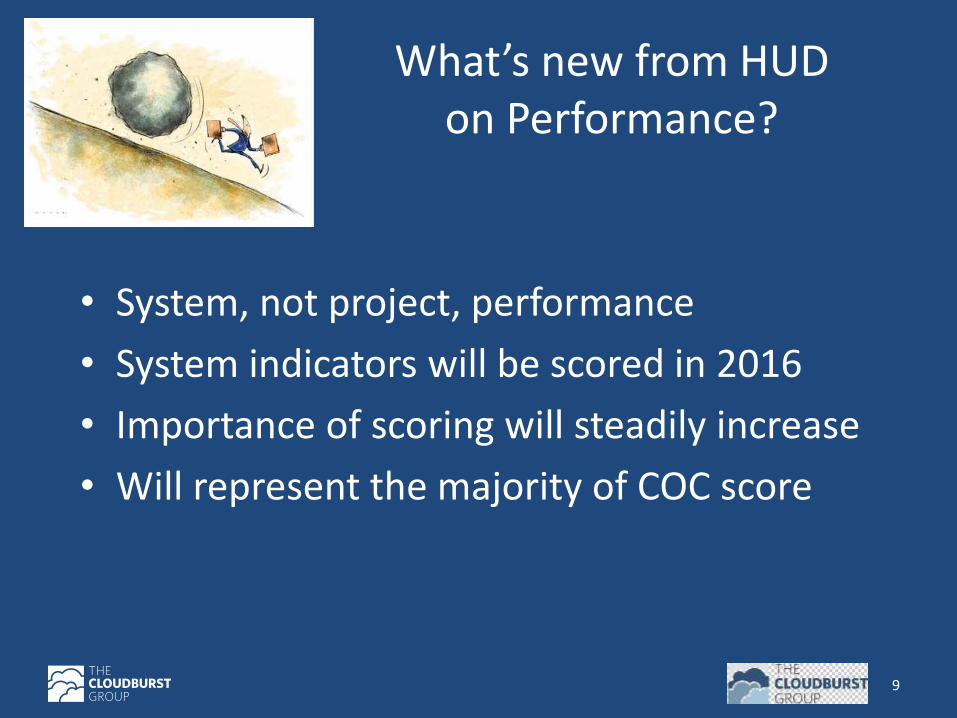
What’s new from HUD on Performance?
• System, not project, performance
• System indicators will be scored in 2016
• Importance of scoring will steadily increase
• Will represent the majority of COC score
9

RRH Data Analytics Project – Theory of Change takes a System Lens Focus
10
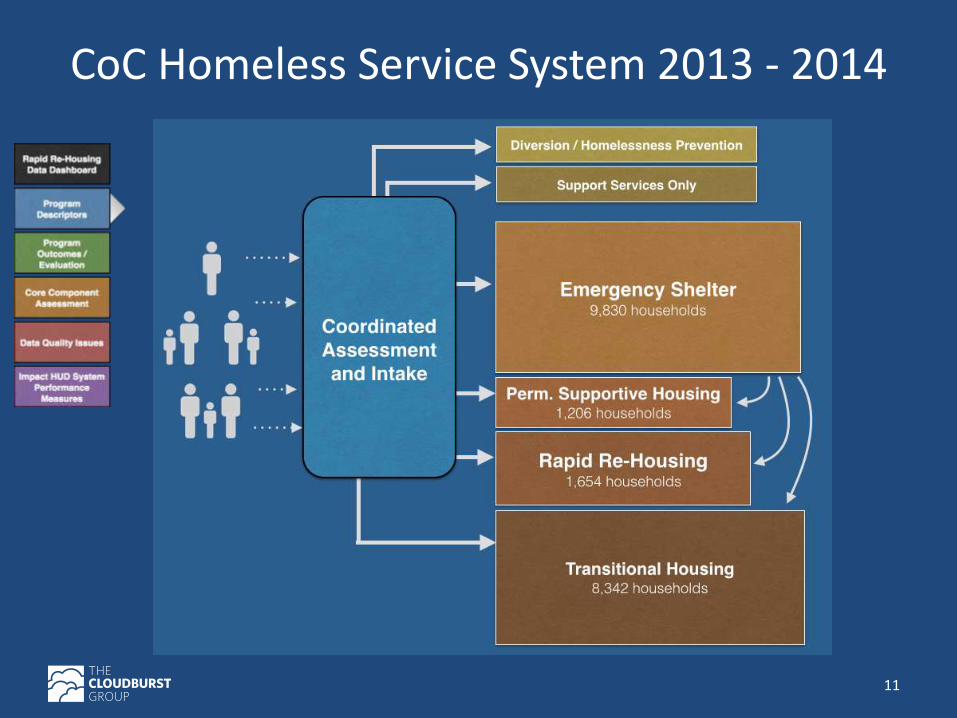
CoC Homeless Service System 2013 - 2014
11
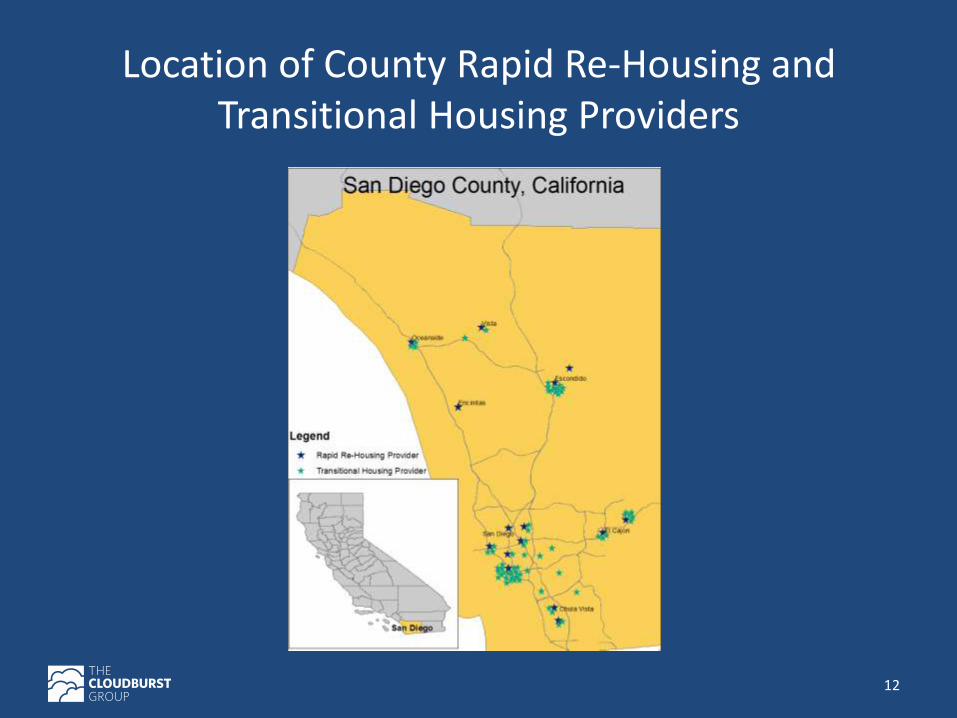
Location of County Rapid Re-Housing and Transitional Housing Providers
12
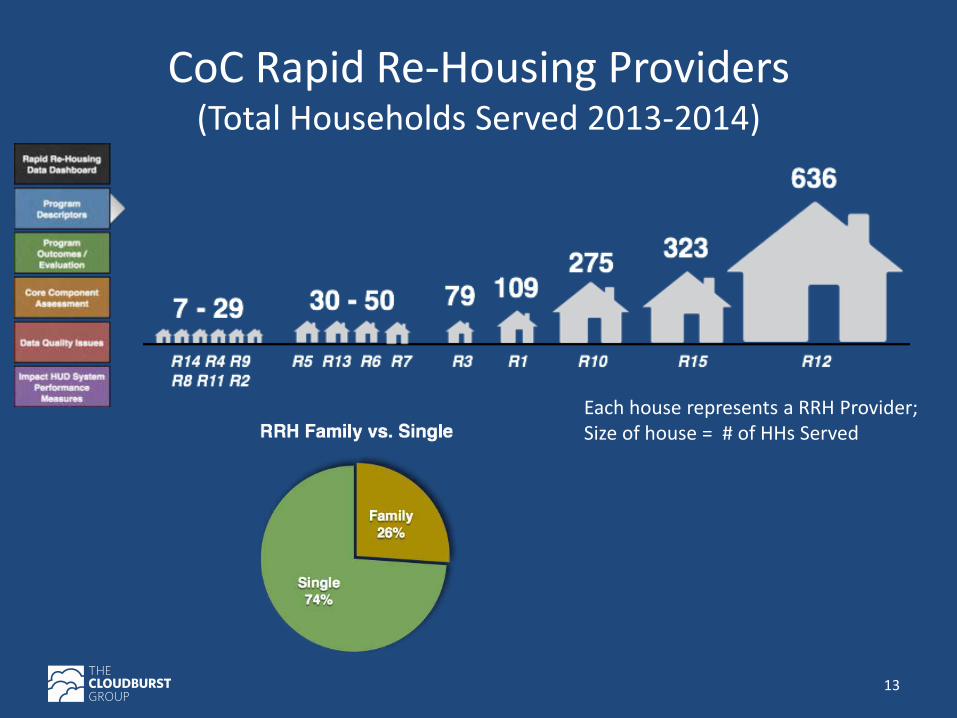
CoC Rapid Re-Housing Providers (Total Households Served 2013-2014)
13
Each house represents a RRH Provider; Size of house = # of HHs Served
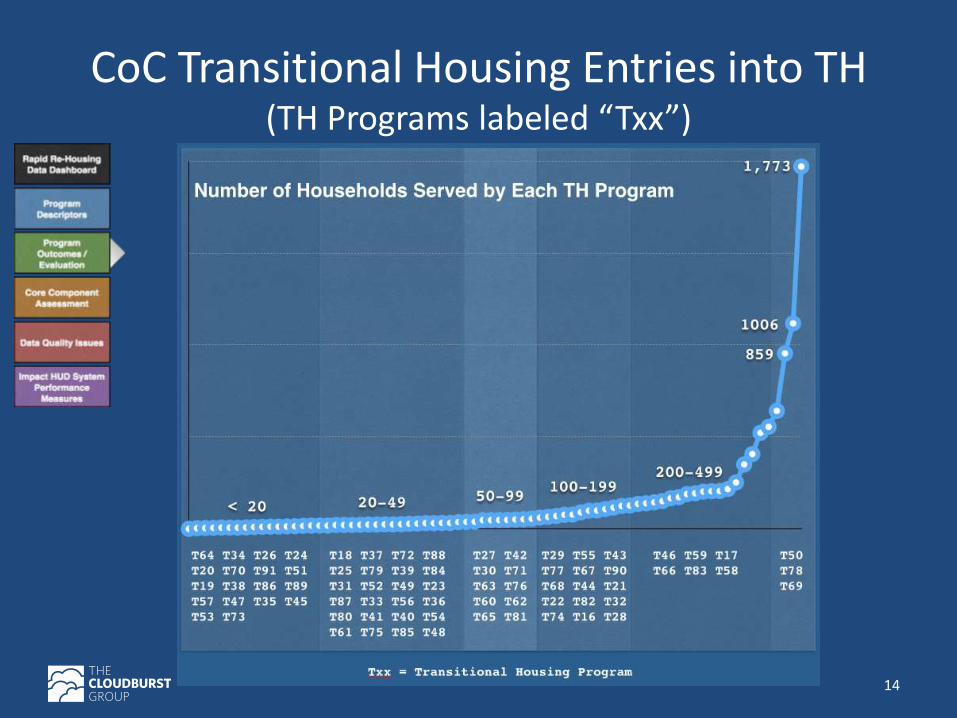
CoC Transitional Housing Entries into TH (TH Programs labeled “Txx”)
14
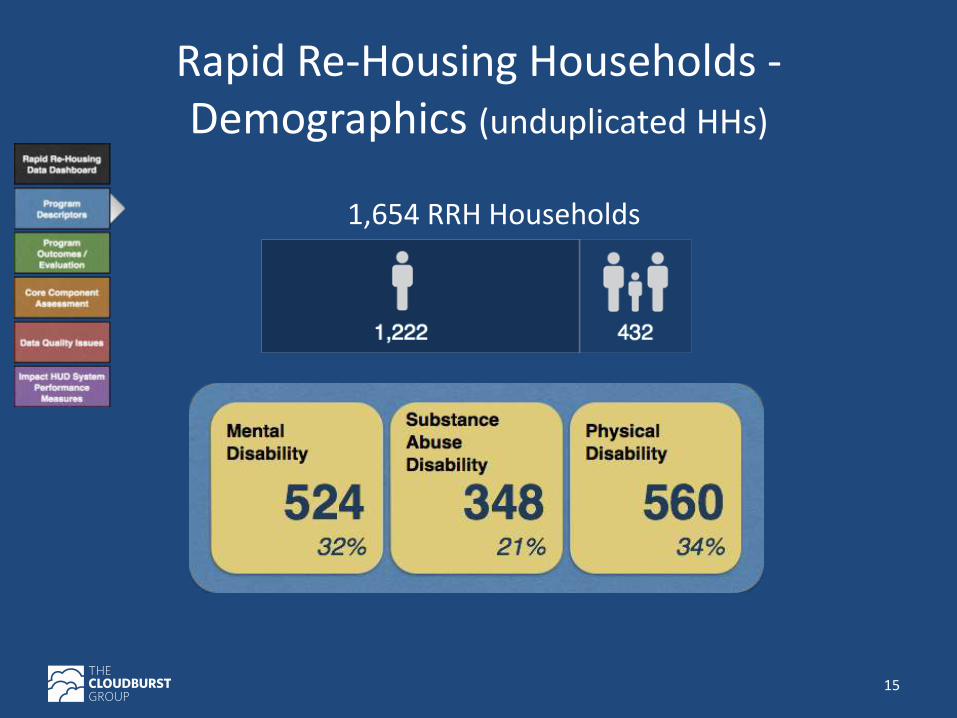
Rapid Re-Housing Households - Demographics (unduplicated HHs)
15
1,654 RRH Households
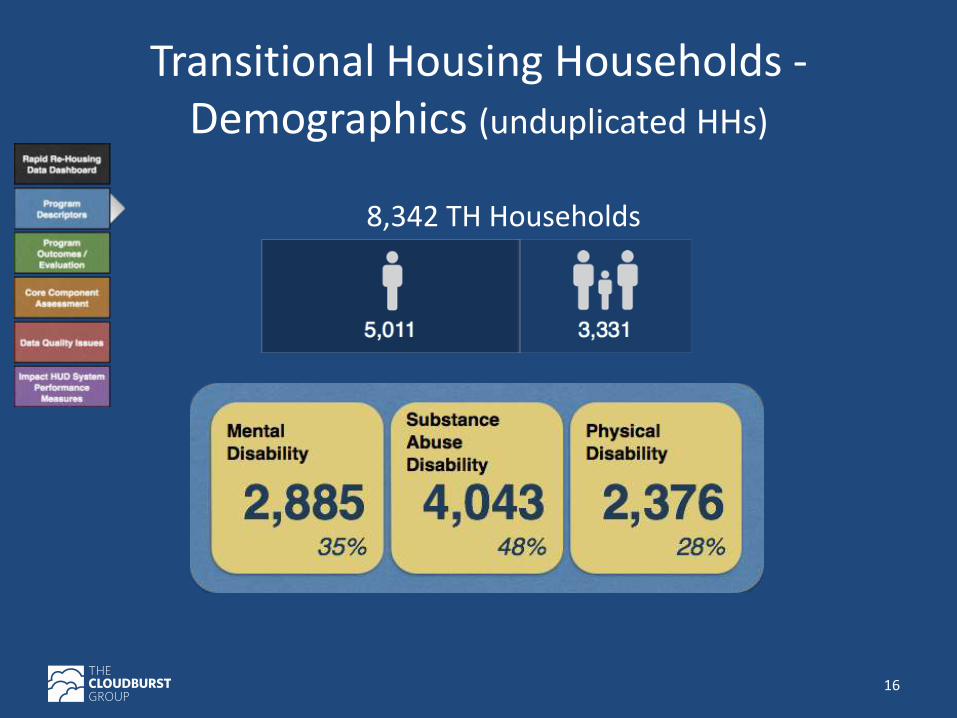
Transitional Housing Households - Demographics (unduplicated HHs)
16
8,342 TH Households

Questions: What RRH quarterly enrollment targets can be set by RRH Provider System?
Rapid Re-Housing & Transitional Housing HHs Quarterly Enrollments 2013 - 2014
17
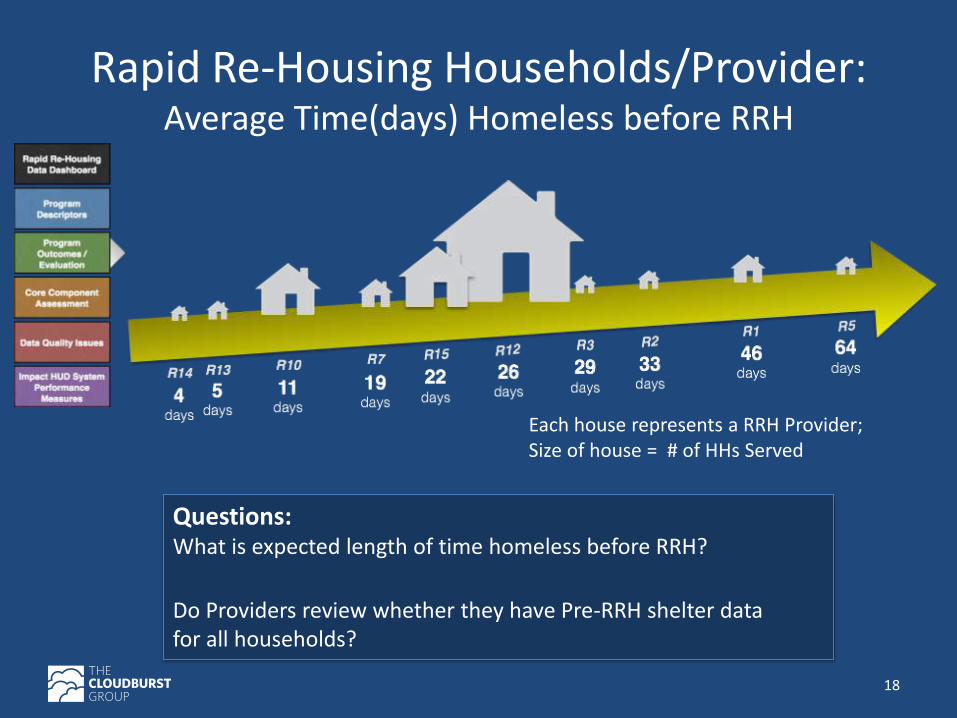
Rapid Re-Housing Households/Provider: Average Time(days) Homeless before RRH
18
Each house represents a RRH Provider; Size of house = # of HHs Served
Questions: What is expected length of time homeless before RRH?
Do Providers review whether they have Pre-RRH shelter data for all households?
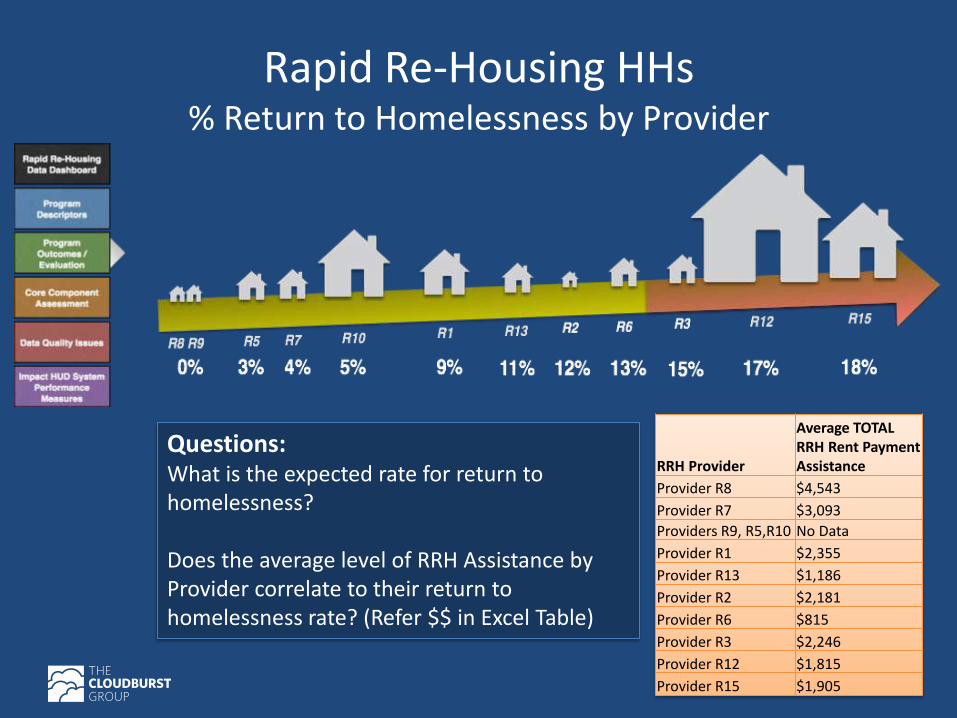
Questions: What is the expected rate for return to homelessness? Does the average level of RRH Assistance by Provider correlate to their return to homelessness rate? (Refer $$ in Excel Table)
Rapid Re-Housing HHs % Return to Homelessness by Provider
19
RRH Provider
Average TOTAL RRH Rent Payment Assistance
Provider R8 $4,543
Provider R7 $3,093
Providers R9, R5,R10 No Data
Provider R1 $2,355
Provider R13 $1,186
Provider R2 $2,181
Provider R6 $815
Provider R3 $2,246
Provider R12 $1,815
Provider R15 $1,905
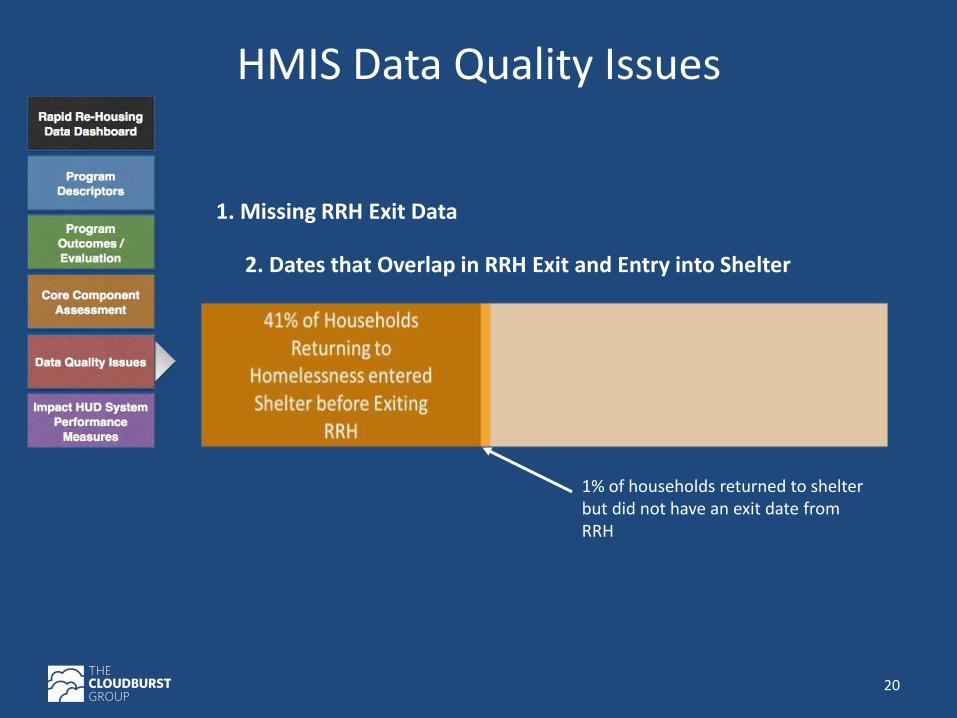
HMIS Data Quality Issues
20
1. Missing RRH Exit Data
1% of households returned to shelter but did not have an exit date from RRH
2. Dates that Overlap in RRH Exit and Entry into Shelter

Driver Diagram – RRH Improvement Plan Targeted RRH Strategies
Expand RRH subsidies to 1000 households/year
by 12/2015
Educate and recruit RRH providers -
Increase RRH providers 25% by 12/15
Increase RRH funding sources beyond ESG $$
by 12/15
Educate community and stakeholders on
RRH success by 10/15
21
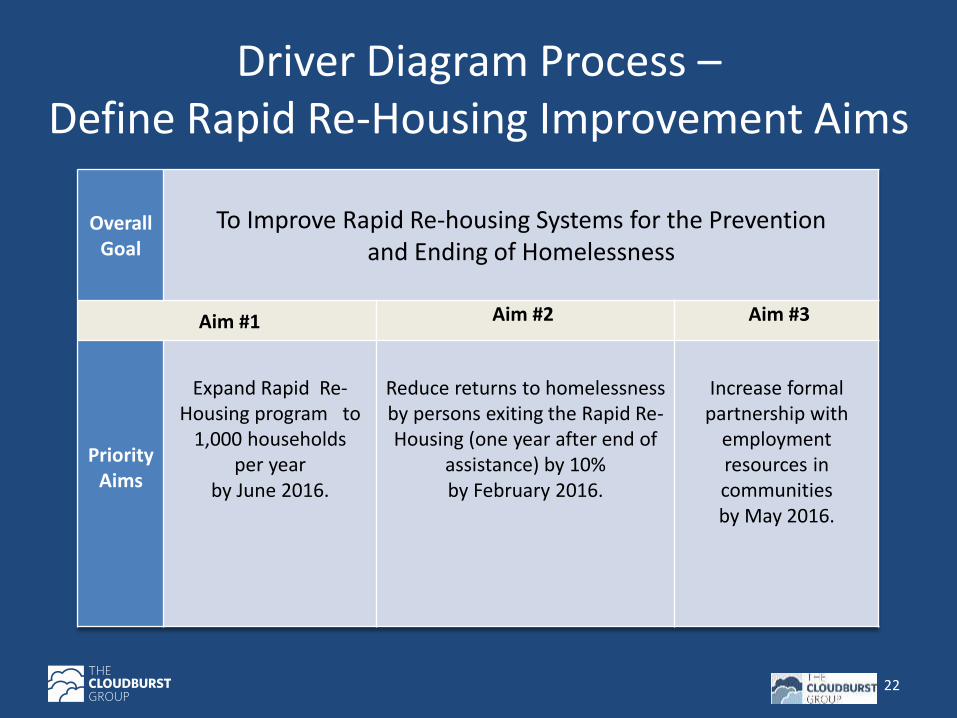
Driver Diagram Process – Define Rapid Re-Housing Improvement Aims
Overall Goal
To Improve Rapid Re-housing Systems for the Prevention and Ending of Homelessness
Aim #1 Aim #2 Aim #3
Priority Aims
Expand Rapid Re-Housing program to
1,000 households per year
by June 2016.
Reduce returns to homelessness by persons exiting the Rapid Re-Housing (one year after end of
assistance) by 10% by February 2016.
Increase formal partnership with
employment resources in communities by May 2016.
22
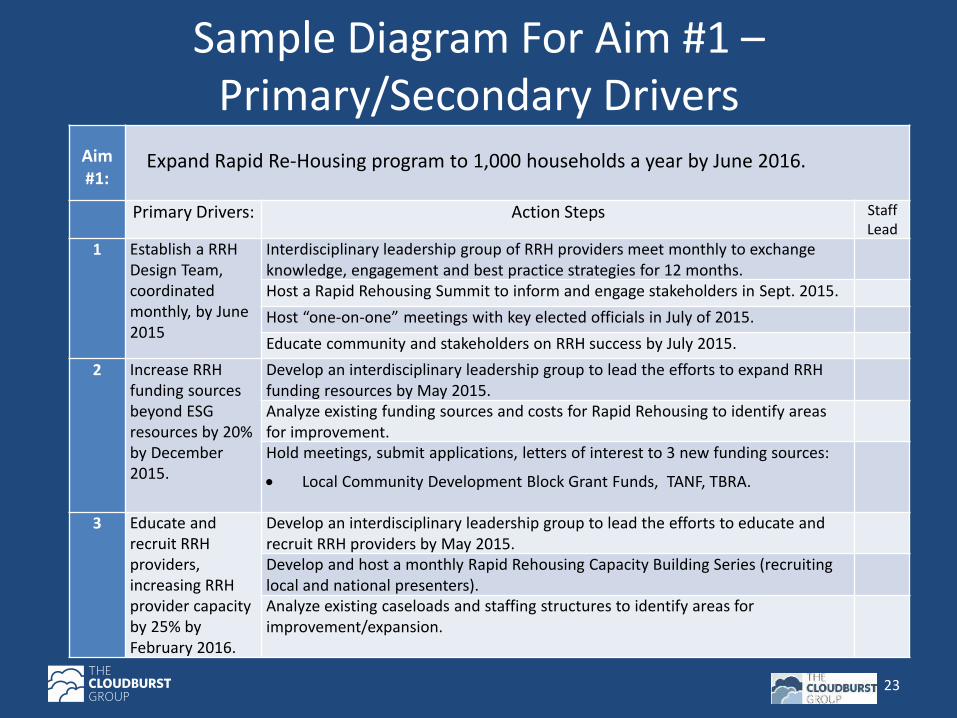
Sample Diagram For Aim #1 – Primary/Secondary Drivers
23
Aim #1:
Expand Rapid Re-Housing program to 1,000 households a year by June 2016.
Primary Drivers: Action Steps Staff
Lead
1 Establish a RRH Design Team, coordinated monthly, by June 2015
Interdisciplinary leadership group of RRH providers meet monthly to exchange knowledge, engagement and best practice strategies for 12 months.
Host a Rapid Rehousing Summit to inform and engage stakeholders in Sept. 2015.
Host “one-on-one” meetings with key elected officials in July of 2015.
Educate community and stakeholders on RRH success by July 2015.
2 Increase RRH funding sources beyond ESG resources by 20% by December 2015.
Develop an interdisciplinary leadership group to lead the efforts to expand RRH funding resources by May 2015.
Analyze existing funding sources and costs for Rapid Rehousing to identify areas for improvement.
Hold meetings, submit applications, letters of interest to 3 new funding sources:
Local Community Development Block Grant Funds, TANF, TBRA.
3 Educate and recruit RRH providers, increasing RRH provider capacity by 25% by February 2016.
Develop an interdisciplinary leadership group to lead the efforts to educate and recruit RRH providers by May 2015.
Develop and host a monthly Rapid Rehousing Capacity Building Series (recruiting local and national presenters).
Analyze existing caseloads and staffing structures to identify areas for improvement/expansion.
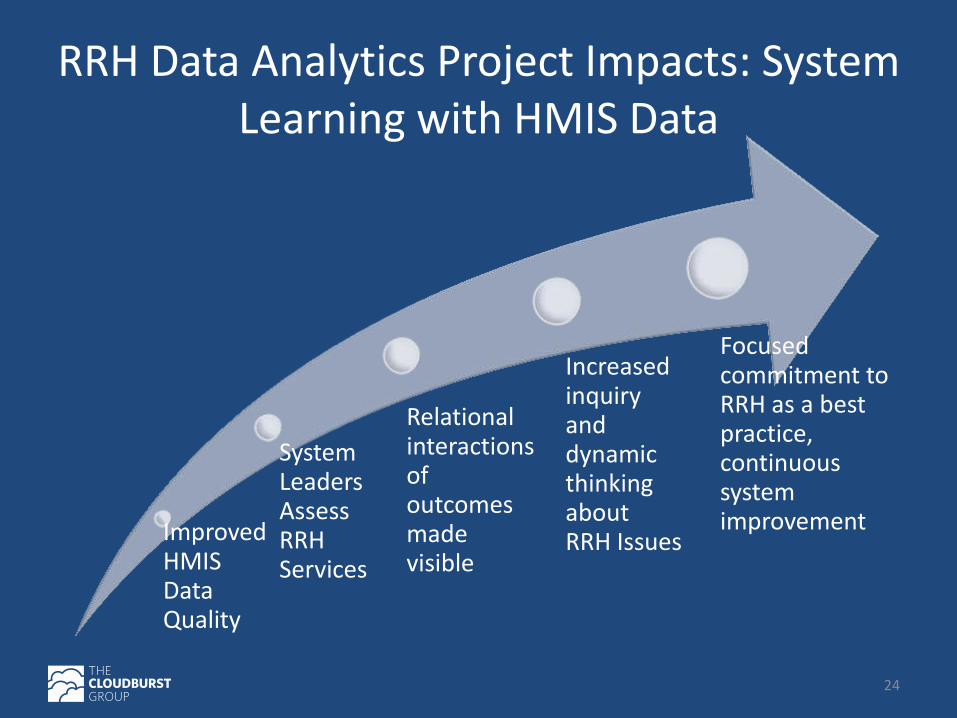
RRH Data Analytics Project Impacts: System Learning with HMIS Data
Improved HMIS Data Quality
System Leaders Assess RRH Services
Relational interactions of outcomes made visible
Increased inquiry and dynamic thinking about RRH Issues
Focused commitment to RRH as a best practice, continuous system improvement
24