Creating a lean culture libro completo
226
-
Upload
diana-reyes -
Category
Engineering
-
view
226 -
download
4
Transcript of Creating a lean culture libro completo
Creating aLean Culture
New York
David Mann
Tools to Sustain Lean Conversions
Front_matter.qxd 1/10/06 11:50 AM Page i

Copyright © 2005 by Productivity Press, a division of The KrausOrganization Limited
All rights reserved. No part of this book may be reproduced orutilized in any form or by any means, electronic or mechanical,including photocopying, recording, or by any information stor-age and retrieval system, without permission in writing from thepublisher.
Most Productivity Press books are available at quantity dis-counts when purchased in bulk. For more information contactour Customer Service Department (888-319-5852). Address allother inquiries to:
Productivity Press444 Park Avenue South, 7th floorNew York, NY 10016United States of AmericaTelephone 212-686-5900Fax: 212-686-5411E-mail: [email protected]
ProductivityPress.com
Library of Congress Cataloging-in-Publication Data
Mann, David W. (David William), 1947-Creating a lean culture : tools to sustain lean conversions /
David W. Mann.p. cm.
Includes bibliographical references and index.ISBN 978-1-56327-322-3 (alk. paper)
1. Organizational effectiveness. 2. Industrial efficiency. 3.Organizational change. 4. Corporate culture. I. Title.
HD58.9.M365 2005658.4'01—dc22
2005005985
11 10 09 08 07 10 9 8 7 6
Front_matter.qxd 3/26/07 11:52 AM Page ii

Table of Contents
Introduction . . . . . . . . . . . . . . . . . . . . . . . . . . . . . . . . . . . . . . . . . . . . . . . . .vAcknowledgments . . . . . . . . . . . . . . . . . . . . . . . . . . . . . . . . . . . . . . . . . . . .ix
Part 1: What Is the Lean Management System?Principal Elements of Lean Management . . . . . . . . . . . . . . . . . . .1
Chapter 1: The Missing Link in Lean: The Management System . . . . . . . .3Chapter 2: The Lean Management System’s Principal Elements . . . . . . . .19Chapter 3: Standard Work for Leaders . . . . . . . . . . . . . . . . . . . . . . . . . . . .25Chapter 4: Visual Controls . . . . . . . . . . . . . . . . . . . . . . . . . . . . . . . . . . . .39Chapter 5: Daily Accountability Process . . . . . . . . . . . . . . . . . . . . . . . . . .69
Part 2: Learning Lean Management and Production: Supporting Elements of Lean Management . . . . . . . . . . . . . . . . .89
Chapter 6: Learning Lean Management: The Sensei and Gemba Walks . .91Chapter 7: Leading a Lean Operation . . . . . . . . . . . . . . . . . . . . . . . . . . .101Chapter 8: Solving Problems and Improving Processes—Rapidly . . . . . .119Chapter 9: People—Predictable Interruption; Source of Ideas . . . . . . . . .137Chapter 10: Sustain What You Implement . . . . . . . . . . . . . . . . . . . . . . .157
Appendix . . . . . . . . . . . . . . . . . . . . . . . . . . . . . . . . . . . . . . . . . . . . . . . .173Glossary . . . . . . . . . . . . . . . . . . . . . . . . . . . . . . . . . . . . . . . . . . . . . . . . . .191References . . . . . . . . . . . . . . . . . . . . . . . . . . . . . . . . . . . . . . . . . . . . . . . .203Index . . . . . . . . . . . . . . . . . . . . . . . . . . . . . . . . . . . . . . . . . . . . . . . . . . . .205About the Author . . . . . . . . . . . . . . . . . . . . . . . . . . . . . . . . . . . . . . . . . .213
iii
TABLE OF CONTENTS

Dedication
To my wife Jan and our daughters Kate and Elizabeth. Without your love, support, patience, and encouragement
I could not have written this book.
Introduction
Creating a Lean Culture addresses a gap in the literature on lean production andthe Toyota Production System (TPS). This book introduces a lean system formanagement, first in concept and then in concrete detail. Lean management is acrucial ingredient for successful lean conversions. Yet, the standard books on leaneither don’t cover it or only hint at implementing new ways to manage in a leanenvironment. Creating a Lean Culture provides the rationale and then a practicalguide to implementing the missing link you’ll need to sustain your lean imple-mentation—a lean management system.
Lean production, based on the much admired Toyota Production System,has proved to be an unbeatable way to organize production operations. The keyconcepts of lean are easily grasped, and relative to most technical engineeringprojects, lean designs are easily implemented. Yet the majority of attempts toimplement lean production end in disappointing outcomes, and declarationslike: “Lean won’t work here,” or “with our people,” or “in our industry,” or “withour product/process,” and so on.
Why, when it seems so simple, are successful lean implementations so diffi-cult to achieve? The answer is in an overlooked but crucial aspect of lean. Itrequires an almost completely different approach in day-to-day and hour-to-hourmanagement, compared to anything with which leaders in conventional batch-and-queue environments are familiar or comfortable.
I’m a social scientist, an organizational psychologist. By conventional meas-ure, I’ve been in the “wrong” place for someone with my training and back-ground for the past 15 years. It has turned out to be the right place though, to beimmersed in manufacturing operations and directly involved in supporting morethan 30 brownfield lean conversion projects, large and small. Through much trialand error in these experiences, I’ve come to recognize a common, but typicallyoverlooked, element in batch-to-lean conversions. This element is a lean manage-ment system. Not only is it necessary to sustain new lean conversions, it accountsfor the differences between failed and successful implementations.
The book lays out the components of lean management, how they worktogether, and how to implement the process. Creating a Lean Culture maps acourse for leaders implementing lean management to guide them through thecultural minefields in batch-to-lean conversions.
v
INTRODUCTION

How This Book Is OrganizedThe book is organized into two sections. Part I answers the question: What is thelean management system? This section details the principal elements of lean man-agement and includes chapters 1 through 5, as summarized in the chart below:
Principal Elements of Lean Management
Part II consists of chapters 6 through 10 and covers how you learn lean produc-tion, and especially, how you learn lean management. The approaches to each arenearly identical. Eight attributes are described for leading a lean conversion proj-ect and the important role played by these attributes in slightly—but impor-tantly—different form when leading an ongoing lean production area. Part II alsocovers some supporting elements in the lean management system, including theaspects of lean management that focus on people-related issues. The followingchart lists these and coordinates them to specific chapters. Finally, Part II focuseson what to do to sustain the lean management and lean production systems youhave worked so hard (or will work so hard) to implement. In addition to guid-ance for leaders, this includes an audit of the lean management system that canbe readily adapted for use in your workplace.
Throughout the book are dozens of highlighted case studies, to show youhow lean management and lean production work—or should work. And the bookis chock full of sample visual ideas, to jump start your brainstorming for whatmight work best in your own organization.
vi
CREATING A LEAN CULTURE
Element Key Characteristics ChapterDetails
Leader standard work
Daily checklists for line production leaders—team leaders,supervisors, and value stream managers—that state explicitexpectations for what it means to focus on the process.
3
Visual controls Tracking charts and other visual tools that reflect actual per-formance compared with expected performance of virtuallyany process in a lean operation—production and nonproduc-tion alike.
4
Daily accountabilityprocess
Brief, structured, tiered meetings focused on performance with visual action assignments and follow-up to close gapsbetween actual results vs. expected performance.
5
Discipline Leaders themselves consistently following and following up onothers’ adherence to the processes that define the first threeelements.
3-5

Supporting Elements in the Lean Management System
vii
INTRODUCTION
SupportingElement Key Characteristics Chapter
Details
The leadershiptasks in anongoing leanoperation
Subtle, but important, differences between leading lean con-version projects and leading ongoing lean operations.
6
Learning leanmanagement
Work with a sensei; use the production area as the classroomthrough gemba walks.
7
Root causeanalysis
Standard, basic tools to focus on eliminating the causes ofproblems rather than settling for workarounds that leavecauses undisturbed.
8
Progressivediscipline in a lean environment
Applying discipline for performance as well as for conduct as a source of support for expected performance in a leanenvironment.
8
Rapidresponse system
Procedures and technology for summoning quick help fromsupport groups and management is important in finely bal-anced lean operations. New relationships between supportgroups and production areas are an often-overlooked criticalfactor for successful “911” systems.
8
Improvementprocess
How are improvement activities managed when they exceedthe scope of the daily task assignment boards?
8
Appropriateautomation
IT networks can be powerful tools in support of lean produc-tion and lean management. Much of the power in IT for leanconsists of knowing when not to apply it.
8
Labor planning
A suite of four visual tools for planning the next day’s workassignments, rotation plan, and unplanned absences.
9
HR policies Changes to pay plans, expectations for rotation, applying dis-cipline for problem performers, break schedules, communica-tion processes, grades pay and classifications, and other“people” issues that help or hinder a lean operation.
9
Assessing thestatus of leanmanagement
A five-level assessment on eight dimensions of lean manage-ment to highlight areas needing attention to bring lean man-agement practices up to a self-sustaining level.
10,Appendix
Who Can Learn From This Book? This book is for you if you are a leader at any level in an organization undergo-ing a lean transformation. You could be an hourly leader of a production team, asupervisor of a department and team leaders, a value stream manager with super-visors and support group staff working in your value stream, or you could be anexecutive—a plant or site or manufacturing general manager; an operations, divi-sion, or corporate executive.
This book is also for you if you or your organization is contemplating a leantransformation. You might not yet know much about lean production. There areseveral clearly written and readily available books and articles you can turn to foran introduction. See the references section at the end of this book, and if you’reunfamiliar with the terminology, scan the glossary too.
You might be an engineer or other technical professional concerned aboutthose pesky humans who are likely to trip up your well-designed system. You willfind constructive ways of dealing with these issues here, too. Or, you might be asupport group manager with questions about the demands lean production willmake on you and your group.
This book is also for you if you are wondering what the heck happened tothe last project you worked on, the lean project that seemed to hold such prom-ise, but just did not turn out as you hoped it would.
Perhaps least likely, you might be a social scientist interested in how manu-facturing organizations undergo change and the conditions that either support orimpede it.
Whoever you are, welcome and let’s go!
viii
CREATING A LEAN CULTURE
Acknowledgments
I owe much to many people with, for, and from whom I have worked andlearned—bosses, clients, colleagues, sensei. I will try to acknowledge them here,and apologize to any I miss. Any shortcomings in this book are fully and exclu-sively my own responsibility.
The Association for Manufacturing Excellence (AME) gave me access to awider professional audience than I could otherwise have had, and provided vehi-cles for reaching the larger manufacturing community.
Steelcase, Inc. gave me the opportunity to experiment with and developmany of the ideas and approaches to lean management contained in these pages.At Steelcase, I had the good fortune to work for several executives who supportedthe idea that there had to be more to lean production than the application ofHenry Ford’s and Toyota’s industrial engineering techniques. Among them wereAdolph Bessler, Rob Burch, and especially Mark Baker. I am grateful to all ofthem.
Mark Baker, Mark Berghoef, John Duba, and Scott McDuffee read earlydrafts of the manuscript and provided helpful critique and suggestions. I appre-ciate their willingness to take on this task and their thoughtful comments.
I have had some terrific clients to work with while developing (actually, co-developing) and testing the concepts and tools of lean management. Amongthem are Shanda Bedoian, Mark Berghoef, Dave Greene, Dave McLenithan,John Mancuso, Kevin Meagher, Didier Rabino, and Jane Velthouse.
I learned a lot about lean thinking from sensei Tom Luyster and MarekPiatkowski and am thankful they shared their knowledge and perspectives with me.
My colleagues on our lean journey have been important in helping developand refine much of what is in this book. Scott McDuffee, Pat Nally, Bob O’Neill,and Dave Rottiers all contributed to what has emerged as lean management. JohnDuba and Ken Knister have been constant sounding boards and valued collabo-rators over the years.
Maura May of Productivity Press took a chance on the basis of a presentationat the AME conference in 2003 and provided welcome and needed encourage-ment throughout the writing process. Ruth Mills edited the manuscript andmade refinements that make the book more accessible to readers.
Finally, I want to acknowledge and thank my first and primary editor, myspouse Jan, who taught me that everybody needs an editor, but probably does notrecognize that few ever get one as gifted as she.
ix
ACKNOWLEDGMENTS

Part 1What Is theLean Management System?
Principal Elements of Lean Management


1The Missing Link in Lean:The Management System
Most prescriptions for lean production are missing a critical ingredient: a leanmanagement system to sustain it. Lean management practices are like many otheraspects of lean: easy to grasp, but difficult to execute consistently. This book spellsout the distinction between an organization’s culture and its management system;provides a framework to see the differences between lean and batch cultures; anddetails the practices, tools, and thinking for establishing lean management. A leanmanagement system sustains and extends the gains from implementing lean pro-duction. Lean cultures grow from robust lean management systems, and thischapter shows how.
Developing a Lean Culture
What is culture? Is it real? Should it be among the targets in your lean implemen-tation? As a working definition, consider culture in a work organization to be thesum of peoples’ habits related to how they get their work done. You will see sev-eral examples in the next few pages. Given that, culture must be “real,” right?Well, yes and no.
In scientific language, culture is a hypothetical construct. That is, culture is alabel or idea—a concept we make up to organize and get a handle on what wehave seen or experienced. It has been said that something is real if it has observ-able effects. Culture certainly fits the bill there. People talk about their company’sculture all the time as a reason why they can or cannot do something. Keynote
3
speakers refer to an organization’s culture as enabling or inhibiting change orresistance. Annual reports proudly refer to company culture as an invaluableasset, and so on.
Should a company target its culture in its efforts to transform its productionprocesses and all the positions—high and low—associated with it? It is temptingto answer: Yes! But, that would be a mistake.
Culture is no more likely a target than the air we breathe. It is not somethingto target for change. Culture is an idea arising from experience. That is, our ideaof the culture of a place or organization is a result of what we experience there.In this way, a company’s culture is a result of its management system. The prem-ise of this book is that culture is critical, and to change it, you have to changeyour management system.
So, focus on your management system, on targets you can see, such as lead-ers’ behavior, specific expectations, tools, and routine practices. Lean productionsystems make this easier, because they emphasize explicitly defined processes anduse visual controls.
Don’t Wait—Start Now!
Do not wait for the “real work,” the physical changes of a lean implementationto be done before turning your attention to implementing the management sys-tem. Your lean implementation depends on it to survive! Think of it this way: insuccessful brownfield mass-to-lean conversions, no more than 20 percent of theeffort involves the typical “what you see is what you get” physical changes. Youinstall new layouts to establish flow, begin pull signaling, develop ways to pace pro-duction, and so on. An advanced version of an initial implementation would alsoinclude features such as visual methods to track production, start-up meetings,and standardized work posted at workstations. But all that only gets you to the 20percent level at most, and the likelihood of disappointment with the stayingpower of the changes you have implemented and disappointment in results thenew system produces. You might come to the conclusion that lean productiondoes not really fit with your business model, culture, or industry, or some similarexplanation.
Well, of course a lean implementation that’s only 20 percent complete is notgoing to be so hot. You have done only the easiest fifth of the process! Theremaining 80 percent of the required time and effort is made up of tasks that areless obvious and much more demanding. After the design/implementation proj-ect team finishes and moves on, a very different, more subtle sort of rearrange-
4
CREATING A LEAN CULTURE
ment remains to be done. As a leader, many things change for you: the informa-tion you need to rely on, your deeply ingrained work habits, your day-to-day andhour-to-hour routines, and the way you think about managing work and produc-tivity. All of these and more have to be transformed for your lean implementa-tion to be a long-term success.
You have probably heard over and over that lean is a journey. It is true, butthe journey truly begins in earnest after the production floor has beenrearranged. Most of the journey is internal, a mental calibration and adjustmentto a lean world. On this journey you learn to impose on yourself the same kindof disciplined adherence to process you now expect of operators in following theirstandardized work. As you continue on the journey you learn to focus with nearobsessive intensity on the processes in your system. You learn to trust that resultswill take care of themselves when you take care of the process.
Without this internal work, the most typical outcome of lean implementa-tions is to reinforce old habits and ways of thinking. As with any new system,when the lean process is turned on, a variety of problems suddenly appear.Without a lean management system in place to support the new physical arrange-ments, people are left to rely on their old tricks for fooling the system, usingfamiliar workarounds to get themselves out of trouble. This is as true for leadersas it is for operators. It is a path that leads swiftly away from a successful lean con-version. Worse, once you have realized your mistake, it is an uphill battle to con-vince people that you are serious this time and will stick with the change. Mostoften, the result is merely a different layout. The promising lean system becomesone more sad entry in the roster of failed change projects.
Why is it that so many attempts to convert to lean, end in retreat and disap-pointment? It is a paradox: So many lean implementations fail because lean is tooeasy! That is, it is too easy to implement the physical trappings of lean produc-tion while failing completely to notice the need for a parallel implementation oflean management. It is too easy just to keep on managing the way we always have.Instead, for the new physical production process to be a success, managers mustchange from the habitual focus on results to quite a different and less obviousfocus on process and all it entails (see case study on p. 6).
Lean Management Focuses on ProcessThe lean management system consists of the discipline, daily practices, and toolsyou need to establish and maintain a persistent, intensive focus on process. It isthe process focus that sustains and extends lean implementations. Little by little,almost unnoticeably, lean culture grows from these practices as they becomehabitual. A lean culture emerges as leaders replace the mindset learned in ourcareers in batch-and-queue manufacturing.
5
THE MISSING LINK IN LEAN: THE MANAGEMENT SYSTEM

Let us step back for a moment to provide some context for the conversion tolean production and the differences in management system between batch andlean. Lean manufacturing is an idea whose time has come. Manufacturers theworld over have recognized the advantages in lead time, productivity, quality, andcost enjoyed by lean competitors in industry after industry. One of the attractivefeatures of lean is that it is so easy to understand. Customer focus, value streamorganization, standardized work, flow, pull, and continuous improvement are
6
CREATING A LEAN CULTURE
Case Study: Successful Implementation of LeanManagement
The testimony of a former leader of a plant’s lean team underscoresthis point. He had been involved from the outset of a lean transforma-tion initiative in one of the “mother ship” plants located within sight ofhis organization’s corporate headquarters. He provided the technicallean vision for transforming a classic batch-and-queue productionprocess with 13 schedule points into a flow and pull value stream withonly a single schedule point. The design was elegant and effective,though not without controversy. It was a radical departure not only inthe way production flowed, but also in the way it was scheduled andin expectations for leaders’ and operators’ performance. He ended uptaking a job to lead operations in one of the company’s divisionslocated in a distant part of the country.
He was recruited there to bring the lean focus he had learned in hisprevious assignment, and he did so with the full support of his divisionexecutive. In a relatively short time, roughly 24 months after arrivingon the scene and working with the staff he inherited, his team hadpulled off three waves of changes in the factory:
• First, they picked up, moved, and rearranged everyproduct line’s production operations.
• Second, they conducted kaizens on all of the re-arranged operations to increase their level of leanness.
• Third, they transformed the scheduling process fromone based on inventory transactions and multipleMRP schedule points to a manual, visually controlled

readily grasped. Second, lean is typically not capital intensive. In fact, lean adher-ents prefer simple, single-purpose equipment with minimal automation. Leanscheduling systems are equally simple and inexpensive, rarely requiring much, ifanything, in the way of incremental IT investment. Here, too, leansters typicallysay less is more. Finally, lean layouts and material flows are relatively straightfor-ward to design and implement, whether through redesign of entire value streamsor more narrowly focused kaizen events.
7
THE MISSING LINK IN LEAN: THE MANAGEMENT SYSTEM
heijunka process for all but the hand-crafted 15 per-cent of the plant’s output.
These were major changes in physical arrangements and technicalsystems. In the previous batch-and-queue system, the time from releas-ing a manufacturing order to the floor completing a product took 20working days. In the new flow and pull system, this total throughputtime has been reduced to 2 days. In addition to the changes in man-ufacturing, it took equally significant changes throughout the support-ing processes—HR and finance, database and production control,and others to make this happen.
Clearly, this operations leader knew lean philosophy, how to imple-ment it, how to teach it, and how to lead it. Yet he is emphatic that,as important as all the physical and technical changes have been, theoperation did not experience much measurable benefit until the imple-mentation turned to the management system. He described it this way:
“The new layouts really enabled the management system. It wasn’tuntil we began focusing on it (the management system) that webegan to see big increases in productivity. That came from pay-ing attention to the process, implementing hour-by-hour productiontracking, defining standard work for team leaders and supervi-sors, and following up on accountability for action on flow inter-rupters and improvements. We’ve seen a 36 percent increase inannual sales dollars per full-time equivalent employee, once wehad the management system in operation. Much of that is attrib-utable to lean management.”
Note that this increase in productivity came during a steep industry downturnin which this division saw a 35 percent decline in sales.
Parallel Implementations of Lean Productionand Lean Management
So, lean production confers many advantages. It is easily grasped, requires mini-mal capital for equipment and IT support, and is relatively straightforward toimplement. Yet, as I have just suggested, the experience of many—indeed,most—companies that have attempted to convert to lean production has beenfailure and retreat. It seems so easy, yet success is so difficult! What is it about leanthat makes successful implementation so rare as to be newsworthy? Something,some crucial ingredient, must be missing from the standard list of steps in leanconversions. The missing link is this: a parallel lean conversion effort that con-verts management systems from mass production to lean.
The physical changes in a lean conversion are easy to see: equipment getsmoved, inventory is reduced and redeployed, and notable changes occur in mate-rial supply, production scheduling, and standardized methods. The change inmanagement systems is not so obvious. An orienting question about the leanmanagement system might be: change from what, to what?
Changing From Conventional Mass ProductionThink about management in a conventional batch-and-queue production opera-tion. First and foremost, the focus is on results, on hitting the numbers:
• Did we meet the schedule for this day or this week?
• How many defective units were caught by quality inspections?
• Did we hit our targets for material cost and production labor?
Managers in conventional systems track key indicators like these throughmonitoring and analyzing reports that summarize the previous period’s (day,week, or month) data.
Managers attend many meetings to review production status and trouble-shoot problems. These meetings typically revolve around computer-generatedreports that line managers and support group specialists pore over in conferencerooms. Disagreements are common about which departments' reports to believe.In fact, it is not unusual to spend substantial time in meetings like these arguingabout whose report is accurate! (“Your report says the material got here; myreport says I never received it.”) Sometimes you actually have to go to the pro-duction floor to look for or count what the computer says is supposed to bethere—an extreme measure in an IT world.
The focus is usually retrospective, looking at what happened last reporting
8
CREATING A LEAN CULTURE

period, determining who or what messed up, and deciding how to recover. Withmore sophisticated IT systems, these data are accessible more or less in real time.Looking at a computer monitor, managers can see a numerical or even graphicrepresentation of what the IT system presents as the precise state of their produc-tion process. This seems like an improvement, and often can be—if the data areaccurate (not just precise), and you can sift through all the available data to iden-tify the critical numbers to watch, and you know which are the critical questionsto ask of the database.
Getting Rid of the “Do Whatever It Takes!” ApproachWhen problems arise that threaten schedule completion in batch-and-queue sys-tems, the common practice is “do whatever it takes” to meet the schedule.Expedite internal parts, pressure suppliers, airfreight late materials, put on morepeople, pressure the inspectors, reorder missing parts with a fudge factor to makesure you get the few good ones you need, authorize overtime. Just meet the sched-ule! Tomorrow or next week, it is a new day with a new schedule and new chal-lenges. Things that went wrong yesterday are typically dropped in the press tomeet today’s demands. After all, today’s schedule must be met!
In fact, most manufacturing managers have learned how to be successful inthis kind of system. They know the workarounds and tricks to ensure success inan uncertain environment where the bottom might fall out in one of several areason any given day. The tricks of the trade include “secret” stashes of extra mate-rial, people, and even equipment to be called on in time of need.1 Never mindthat all this is costly in the long run. In the short run, results are what matter andthe numbers do not lie—you either met the schedule or you did not.
Lean Processes Need Lean Management
In lean systems the results certainly matter, but the approach to achieving themdiffers sharply from conventional management methods. The difference in a leanmanagement system is the addition of a focus on process, as well as a focus onresults. The premise is this: Start by designing a process to produce specificresults. If you have done a good job of designing the process and you maintainit, you will get the specified results. In concept, this is simply a matter of main-taining production at takt time. If you do, you meet demand. As you makeimprovements in the process, you should expect improved results.
9
THE MISSING LINK IN LEAN: THE MANAGEMENT SYSTEM
1. Veteran production supervisors are extremely versatile, able to do the work of engineering, maintenance,quality, production control, sourcing, and local trucking where necessary to meet the schedule.
A critical point is to think about the lean management system as an integralelement of the lean process. Here is why. If the process were a perfect system, itwould always run as designed and always produce consistent results. A real-worldsystem requires periodic maintenance and occasional intervention and repair tocontinue producing results. The more complex the system, especially the moreautomated it is, the more maintenance and repair it requires. It may not seem likethis should be true, but it is. A more reliable and flexible solution usually is torely less on automation and more on people and simpler equipment.
Relying on people brings its own set of issues. People require all sorts of“maintenance” and attention. Left to their own devices, people are prone to intro-duce all kinds of mischief—variation in the system that can take things far afieldfrom the original design. If anything, lean production is more vulnerable to theseeffects than mass production, because of the tight interdependence and relianceon precise execution in lean designs. That is why discipline is such an importantfactor in lean processes. Without a high degree of discipline in a lean process,chaos ensues in short order. That is where the lean management system comes in.
Focusing on the Process Produces ResultsPutting it plainly, if you want a process to produce the results for which it wasdesigned, you have to pay attention to it. One of the first rules of process focusin lean production is to regularly see the process operating with your own eyes.The closer your position is to the production floor (value stream manager, depart-ment supervisor, team leader as opposed to plant manager, manufacturing direc-tor, or VP), the more time you should spend watching the process, verifying exe-cution consistent with design, and intervening when you observe nonstandard orabnormal conditions. Production team leaders should spend virtually all of theirtime either training operators in the process, monitoring the process, or improv-ing it. Taking time to monitor the production process applies all the way up thechain of command, though with decreasing frequency and duration. That is whylean manufacturing executives meet with their plant managers on the productionfloor, to spot-verify that processes are defined, visually documented and con-trolled, and are being followed. It also allows executives to verify that plant man-agers know what is going on with their lean processes. Meeting in offices to dis-cuss reports becomes a secondary activity in management reviews.
Another way of thinking about this, and another paradox in lean manage-ment, is that lean managers are so focused on results that they cannot afford totake their eyes off the process they rely on to produce their results. Looking atwhat happened yesterday is way too late to do anything about yesterday’s results.On the other hand, looking at what happened last hour, last pitch, or even bet-ter, last takt cycle, gives the chance to recover from an abnormal or nonstandard
10
CREATING A LEAN CULTURE

condition. But, that is only true if trained eyes (like a team leader’s) are there tosee the abnormality; the pertinent processes are well defined, clearly documented,and operating in a stable environment; and resources are available to respond inreal real time. That is, someone must be available right there, to respond right now!
Further, this means focusing on the process as it operates from beginning toend, not only at the completed component or finished goods end. That is whylean designs require so many team leaders to maintain the process, to spot prob-lems in upstream intermediate or subprocess areas, and to respond right away toprevent or minimize missing takt at the outlet end of the process. An integral partof the lean management system is having the appropriate number of team lead-ers on the floor to focus on the process. It requires a leap of faith not to scrimpon this crucial part of the system; having enough leaders available to monitor theprocess, react to problems, and work toward root cause solutions is an investmentthat pays off in business results. But at first, and from a conventional perspective,team leaders just look like more overhead.
Measuring the Process Against Expected Outcomes Unlike managing in a results-focused system, process focus implies frequentmeasurement against expected intermediate outcomes. As necessary, interven-tions can be started before the end results are affected. A corollary of frequentmeasurement at multiple intermediate steps in a lean process is that data are read-ily available to aid quick diagnosis of problems, spur immediate remedial action,and eventually eliminate root causes of problems. This is one aspect of continu-ous improvement. Rather than waiting for problems to develop, you are con-stantly monitoring for early signs of developing troubles, and you are primed totake quick action to eliminate the causes of problems. Contrast this with the con-ventional mass production culture in which most supervisors expect variousunpredictable problems and have earned their spurs by being able to work aroundthem to get out the day’s schedule.
A new management system is called for in lean conversions, because leanprocesses are much more tightly interdependent than conventional systems. Leanprocesses are designed not to rely on the extras stashed away in conventional sys-tems to bail things out in a pinch. Even so, things go wrong in lean systems justas they do in mass systems. By design, a lean process has little unaccounted-forslack in the system to fall back on. Because of that, lean processes require far moreattention to disciplined cycle-by-cycle operation to ensure the process stays in a sta-ble state. Otherwise, the process will fail to hit its goals and fail to deliver the busi-ness results so important in any kind of production system. Paradoxically then, inmany ways, simpler lean systems require more maintenance than conventionalsystems. That is why they require a specific management system to sustain them.
11
THE MISSING LINK IN LEAN: THE MANAGEMENT SYSTEM

How Can You Recognize Culture?
Remember that we can define culture in a work organization as the sum of itsindividuals’ work habits. A related way to think of culture is that it is the knowl-edge an adult needs of how things are done to stay out of trouble as a member ofa group. One of the interesting things about culture is that for group members,culture is invisible. It is the things that are given, or “the way we do things aroundhere.” It is typical not to question this kind of thing, or even to realize there arealternatives to it. Yet, it is easily possible to “see” work culture in a productionenvironment by asking basic questions about common practices, such as these:
1. What are inventory practices around here?
2. How often does management look at the status of production?
3. Who is involved in process-improvement activities in this area?
Asking these questions would reveal some of the distinctions between the culturesin conventional and lean production environments.
The examples in Table 1.1 give a partial picture of the pervasiveness andeveryday manifestation of culture in mass and lean production, as well as howthey differ from each other. It is made up of myriad habits and practices thatmake it possible for all of us to go through the work day without having con-stantly to think about who, what, where, when, how, and so on.
Culture allows us to operate more or less on autopilot during the workday.By the same token, a distinct culture also makes it easy to identify counterculturalbehaviors, practices, or events. In most groups, these tend not to take root with-out many other things changing.
Overcoming Cultural Inertia One implication of culture as a collection of habits and practices is that it hasincredible inertia and momentum going for it. Cultural inertia is like a body inmotion tending to stay in motion in the same direction unless acted on by an external force. Conventional mass production systems include a culture. So dolean production systems. When you change the physical arrangements frombatch to lean, however, the culture does not make a similar change unless specific action is taken to replace one management system with another. That’s the paral-lel lean implementation noted earlier, implementing the lean management system.
Conventional habits and practices live on, even if the layout, material, and information flows have changed. In one example, operators whose area switched from MRP schedules to pull signals were quite inventive in figuring out
12
CREATING A LEAN CULTURE

how to get access to a copy of the MRP schedule, which they then followedregardless of the pull signals. In this case, the fabrication operators regularly over-produced according to the discarded schedule they retrieved every day from atrashcan near the dispatch office. It was not until they were found out, and theschedule paperwork began to be regularly shredded, that they had to follow thepull signals. Another common occurrence is for operators in newly convertedflow lines transformed from batch build to go right on building. When the linefills up, it is typical to see the overproduction stacked on the floor, overstackedon conveyors, overflowing containers, etc.
13
THE MISSING LINK IN LEAN: THE MANAGEMENT SYSTEM
CulturalAttribute Mass Production Culture Lean Production Culture
Inventorypractices
• Managed by computer system
• Ordered by forecast
• Stored in warehouse areas orautomated storage andretrieval facilities
• Held in bulk containers
• Moved by lift truck
• Many hours' worth or more perdelivery
• Delivered by the skid or tub byforklift to vicinity of use
• Managed visually
• Ordered to replenish actual use
• Stored in FIFO racks or gridsaddressed by part number
• Held in point-of-use containers
• Container quantity and number ofcontainers specified per address
• Precise quantities (often less than anhour’s worth) delivered to point of use
• Deliveries by hand cart or tugger
Productionstatus
• Checked at end of shift, begin-ning of next shift, or end of week
• Checked by supervisor, higherlevel managers
• Checked by team leaders severaltimes an hour
• Checked by supervisors four or moretimes a shift
• Checked by value stream managersonce or twice during the shift
• Updated for all involved in asequence of brief daily reviews ofthe previous day's performance
Processimprove-ment
• Made by technical projectteams
• Changes must be specifically“chartered”
• No changes between “official”projects
• Can and routinely are initiated byanybody, including operators
• Regular, structured vehicles encour-age everyone from the floor on up tosuggest improvements and perhapsget involved in implementation
• Improvement goes on more or lessall the time, continuously
Table 1.1. Visible attributes of different cultures in mass and lean production

New Settings With Old Habits Won’t WorkIt is typical to see supervisors and team leaders in a newly rearranged area rushingoff here and there to chase parts or jump onto the line to run production. In somecases, it is nearly impossible to convince supervisors or team leaders to make thehourly entries on production tracking charts because they are “too busy” to get tothis task. Then, once the tracking charts are actually filled out, it is not unusualto see them simply pile up on (or under) a supervisor’s desk with no attention atall to the interruptions documented on the charts. If the schedule has been met,there is no interest in what is on that “paperwork.” And if the schedule hasn’tbeen met, there is “real work” to be done; no time to waste with these recordsof interruption! That will not get the schedule out today, and in the old—and ingrained—culture, that is all that counts.
In conventional mass production, it is seen as important to be busy doingsomething directly physically linked to production. Waiting for a productioninstruction card to arrive before starting to produce simply seems wrong.Standing and waiting for the next piece to come down a progressive build line isdefinitely countercultural in the mass production world. In such an environment,these interruptions in the rhythm of production are not considered to be valuablediagnostic information, signaling an abnormal condition in the production sys-tem; that is for sure! Relying on the reduced inventory of parts called for in a pullsystem seems sure to lead to stock-outs down the line. There is no perceived valuein recording data that documents the operation of the process. Action is whatcounts, and if it is based on gut feel and experience, it must be right, because“…that’s the way we get things done around here!”
These are only a few habits of thought, interpretation, and action that peo-ple absorb as part of the culture in a mass production environment. They are atclear variance with the kinds of habits and daily practices necessary for the pre-cise and disciplined execution lean systems need in order to meet their promisefor productivity, quality, and ongoing improvement. Table 1.2 compares a few ofthe ways in which mass and lean cultures differ. Many mass production culturalpractices are strikingly tied to longstanding ways of relating to others at work. Incontrast, many lean practices are related to disciplined adherence to defined processes.
How to Change Your Culture
We usually refer to changing habits with the word “break,” as in “That’s a hardhabit to break.” Similarly, many talk about “kicking” habits. In each case, thesewords imply that changing habits is a one-time thing, a discontinuous step-
14
CREATING A LEAN CULTURE

change from one state to another, which once accomplished is an event that isover and done with, and no going back.
Many habits that come to mind are personal and physical in nature: smoking,nail biting, various forms of fidgeting—jingling pocket change, fiddling with anID badge, a pen, or glasses, etc. At some level, each habit provides a form of com-fort. We tend not to think of our work habits in these terms because many of themare part of the particular culture at work, and that is effectively invisible.Nevertheless, these habits arise because they bring a form of comfort, too. In a con-version to lean production, some of these habits will be a hindrance, and some willbe a help.
Consider these examples of management habits in conventional mass pro-duction operations—some of them are things you want to stop doing under leanmanagement:
15
THE MISSING LINK IN LEAN: THE MANAGEMENT SYSTEM
Mass Production: Personally Focused Work Practices
Lean Production: Process Focused Work Practices
Independent Interdependent, closely linked
Self-paced work and breaks Process-paced work, time as a discipline
“Leave me alone” “I work as part of a team”
“I get my own parts and supplies” In- and out-cycle work are separated andstandardized
“We do whatever it takes to get the job done;I know whom I can rely on at crunch time”
There’s a defined process for pretty mucheverything; follow the process
“I define my own methods” Methods are standardized
Results are the focus, do whatever it takes Process focus is the path to consistent results
“Improvement is someone else’s job; it’s notmy responsibility”
Improvement is the job of everyone
“Maintenance takes care of the equipmentwhen it breaks; it’s not my responsibility”
Taking care of the equipment to minimizeunplanned downtime is routine
Managed by the pay or bonus system Managed by performance to expectations
Table 1.2. Differences in habits and practices between batch and lean cultures

• Keep a quantity of extra material stashed away at all times; you mightneed it.
• Take time to listen to what people want to tell you.
• Always maintain a minimum 10 percent surplus labor and plenty of WIP; something could go wrong.
• Speak to everybody in the department every day.
• Jump onto the line or expedite parts when things slow down, orthrow in more people; meet the schedule!
• Always reorder more than the actual need when handling shortages, just to be sure you get enough.
• Use an informal gauge of queue size; always keep the line full in casesomething goes flooey.
• Approach people who are standing idle and ask them to get back towork.
You can think of many more once you start to see work habits and practicesas something you do without thinking about it. There is nothing wrong withhabits as such. We need them to make the workday more efficient. What isimportant to remember is this: work-related habits are just as difficult to change aspersonal habits!
Extinguishing Versus Breaking HabitsIt is helpful to think in terms of the technical language from behavioral scienceused in connection with changing habits. The term is not “break.” Instead, psy-chologists use the term “extinguish” when talking about changing habits.Extinguish implies a process, something that occurs gradually over time ratherthan an event producing a suddenly changed state. Because of that, extinguishalso implies a change that can be reversed under certain conditions. Think ofSmokey the Bear’s rules: Douse a campfire with water, stir the coals and turnthem over, then douse again. If you do not follow these rules you run the risk thatthe fire can rekindle itself from the live embers you failed to extinguish.
So it is with habits. They linger, waiting for the right conditions to assert them-selves again. We have seen this kind of thing just days following implementation ofnew lean layouts. Here are some actual examples of old habits reasserting them-selves in areas newly converted to lean layouts—again, examples you want to avoid:
• Build up some inventory;
• Allow longer or extra breaks;
16
CREATING A LEAN CULTURE

• Send people off a balanced line to chase parts or do rework;
• Work around the problem today and let tomorrow take care ofitself;
• Leave improvement to “the experts” rather than wasting time onemployee suggestions;
• Do not bother with the tracking charts—we never actually do any-thing about recurring problems anyway.
Make sure you don’t slip back into these old habits!To sum it up, you do not need a different management system for lean
because it is so complex compared to what you have done before. You need itbecause lean is so different from what you have done before. Many of the habitsin your organization, as well as your own, are likely to be incompatible with aneffectively functioning lean production environment. You have a conventionalmass production management system and culture. You need a lean managementsystem and culture. The next chapter shows how to go about making that change.
Summary: Technical and Management Sides Need Each Other
Because lean production is a system, it does not matter where implementationstarts. Eventually you will get to all of the elements. But, sequence does matterwhen implementing lean technical elements and the management system. Wehave learned that technical change must precede cultural change. Technicalchanges create the need for changed management practices. More than that, leanmanagement does not stand on its own. Without the physical changes in flow andpull and the takt-based predictability they permit, production will continue tooperate in an environment of daily crisis. How would you track flow interrupterswhen there is no takt-balanced standardized work, no flow? How would youassess material replenishment performance without standard lot sizes or resupplytimes?
So, start with the physical changes to the production process, but do notimplement them by themselves. Just as changes to the management system donot stand well by themselves, neither do technical changes. Every technicalchange requires support from changes in the management system—the supportof new management practices—to maintain integrity over time. If that is not alaw of nature, it is darn close to it! Each time you implement an element of the
17
THE MISSING LINK IN LEAN: THE MANAGEMENT SYSTEM

lean production system, implement the elements of the management system rightalong with it. The elements of the management system give you the tools to helpyou sustain the newly converted lean process. Those elements and the conditionsfor successfully establishing lean management are what this book is about.
18
CREATING A LEAN CULTURE

2The Lean Management System’sPrincipal Elements
The lean management system, like the lean production system, consists of only afew principal elements. Lean management is a system in which the elements areinterdependent (as in the lean production system). That means all of the elementshave to be present for the system to work. A third similarity with lean productionis that none of the elements is complex or complicated. And finally, lean manage-ment and lean production themselves are interdependent; one does not stand forlong without the other.
So, what are the principal elements of the lean management system?Chapters 3, 4, and 5 go into detail on the principal elements in lean manage-
ment. The point to emphasize in this chapter is the way the elements combine toform a system. An automotive analogy provides a helpful illustration (see Figure2.1). Think of three principal elements as representing major parts of a car: theengine, transmission, and controls. The fourth element is the fuel.
The Principal Elements of Lean Management
In lean management, leader standard work (element #1) comes first. It is theengine. Leader standard work is the first line of defense for the focus on processin lean management. When the leader follows his or her standard work effec-tively, the rest of the lean management system has a good chance of operatingeffectively, powered by the engine of leader standard work.
19

The transmission in lean management is its visual controls (element #2).The visuals translate performance of every process into expected versus actual,throughout the production and management systems. These data are recordedregularly and frequently, often many times a day. They are displayed in highlyvisual, widely accessible, readily reviewed formats. In these ways, the visuals con-vert the driving force of leader standard work into traction. Visuals give leadersthe ability to quickly spot and move to action where actual performance has notmet what was expected.
Figure 2.1. Making lean management go
The controls in lean management, the steering wheel and gas pedal, comewith the daily accountability process (element #3). Through daily accountabilitythe leader can steer, setting direction for improvement activity in the area: Whichof the gaps between expected and actual captured by the visual controls shouldwe work on? Daily accountability also allows the leader to control the pace; howmuch gas to give for improvement; how quickly should we expect improvementto be completed; how many resources should we assign to this task?
At first blush, none of this sounds like a big deal to accomplish. Assemblinga daily checklist for leaders certainly is not difficult. Whipping up a bunch ofvisual tracking charts is also a simple matter. Lots of people can produce thosein Excel in no time at all. The basics for daily accountability merely involvescheduling the appropriate daily recurring 15-minute meetings: one for theteam leaders to get together with their supervisor and the other for the super-visors and support group representatives to get together with the value streammanager. In fact, you could consider most of these tasks as fairly straightfor-ward administrative details. Why should this merit discussion, much less awhole book?
The answer, of course, is in the fourth element of lean management. Thinkof discipline, leaders’ discipline especially, as the fuel that powers the engine thatmakes the entire system go. Establishing leader standard work, visual controls,and a daily accountability session will not amount to anything without the disci-pline to execute these elements as designed and intended.
20
CREATING A LEAN CULTURE
Engine:Leader standard work
Gas Pedal and Steering Wheel:Daily accountability process
Fuel:DisciplineTransmission:
Visual controls

This is particularly true as you are starting out on your lean journey.Remember, establishing new habits requires extinguishing the competing oldones. That takes constant positive reinforcement of the new and negative rein-forcement of the old, a course that experience shows is easier to avoid than tofollow.
Lean Elements Need to Work TogetherYou will find there is little “coasting” in lean management. If you stop followingthrough on any of the three principal elements because things seem stable and incontrol, it is certain that you will soon face unstable and out-of-control processesthat require you to reinstitute the very elements you thought you could do with-out. Remember the law of entropy, in which organized systems tend to movetoward states of increasing disorganization? Lean production and lean manage-ment are not physics, but this law of nature nevertheless seems to apply. Ease offon focus or discipline and your lean systems will quickly deteriorate along withtheir hoped-for results.
Returning for a moment to the automotive analogy for the lean managementsystem, imagine you were fortunate enough to win a new car in a fund-raisingraffle. Consider your shock when on going to pick it up you find an engine in acrate, a transmission sitting on a bench, a speedometer and steering wheel inboxes, and a can of gasoline. If the parts are not assembled and working together,they will not take you where you want to go (see case study on p. 22).e
Execution Is Key to Lean Management Making checklists is easy. Developing and posting operator standard work isstraightforward. Filling out production-tracking charts is not a demanding rou-tine. In the absence of leaders’ disciplined adherence to their standard process, allof this was of no value in preventing a known defect from being produced andshipped. Not only do the elements of the lean management system have to be inplace, each has to be scrupulously observed for the system as a whole to work.This case also illustrates, in a small way, the dependence between results fromlean production and an effectively functioning lean management system. Leanmanagement acts as the eyes and ears of diligence. Lean management monitorswhether the lean production system is being faithfully executed and sounds thealarm when execution deviates from design.
On a more positive note, as you get better and better at executing the ele-ments of lean management, your job as a line production leader will become eas-ier and easier, increasingly free of the “fire alarms” you used to chase all day longmost days. In fact, one value stream leader spontaneously remarked to me that
21
THE LEAN MANAGEMENT SYSTEM’S PRINCIPAL ELEMENTS

his area had become so stable and predictable that he now looked forward touncovering flow interrupters and other abnormalities.
Those things gave him something “fun to focus on,” he said, with the oppor-tunity to lead a kaizen to attack the source of the problem, make his work moreinteresting, and make his area run that much better. His daily routine includesscrutinizing the daily production-tracking data for ways to make improvementsin the process. He has reduced the interval of observation for production track-ing by a third (to 20 minutes) to be able to catch smaller interruptions. In alonger interval, these interruptions might not cause a miss, and thus would gounnoticed. His team leaders are Pareto-charting reasons for misses in two differ-ent areas, looking for the most frequent problems in order to attack them, and soon. This is an example of what lean management can look like and the ways itcan sustain and extend the gains in lean production.
Case Study: How Lean Management Fails Whenthe Elements Don’t Work Together
For the lean management system to operate effectively, its elementsmust work together. In one case, leader standard work had been inplace for team leaders and supervisors for nearly a year. The area inquestion produced several lines of upholstered chairs, most of whichhad been in production for many years. The chairs were made toorder. Demand for them had declined to the degree that they wereonly produced sporadically. On the occasion in question, a day’sworth of production was called for on one of these aging lines. Anexperienced assembly operator from elsewhere in the seating depart-ment was assigned to build the day’s order. He was not experiencedwith the specific line but the supervisor had reason to be confident.She had an experienced chair builder, standardized work for the buildprocess, and a team leader in the area.
As it turned out, the operator did little more than nod to the standard-ized work and then began building the chairs approximately accord-ing to the standard sequence. By failing to follow standardized work,he missed a critical step in the standard sequence of work elementsthat involved spraying glue onto the foam substrate to which uphol-stery fabric was then applied. This caused a known flaw once theproduct was in use in the field, a flaw the standardized work had
22
CREATING A LEAN CULTURE

So, gas up the Lean Management Express and take it for a spin. You will findthe road in front of you gets smoother and takes you to places you could previ-ously only dream about.
Summary: Four Principal Elements of LeanManagement
The lean management system consists of four principal elements:
1. Leader standard work,
2. Visual controls,
been revised specifically to prevent.
The team leader’s standard work called for verifying the operator’sadherence to the production standardized work. The supervisor’s stan-dard work called for spot-checking the team leader’s adherence to hisstandard work. Both were carrying their standard work documentswith them that day, but neither exercised the degree of discipline tolook beyond the surface. (Instead, the situation was probably assessedas, “The operator is in the workstation building the chairs and theylook OK from here. The production-tracking chart is being filled outand the pace is good.”) What was required was to actually observethe operator following the standardized process, element by element,in sequence. Those sequenced elements called for using a template tomask off glue overspray from the troublesome areas.
Once the customer complaint was registered, it was clear beyond adoubt that the cause was failure to follow standardized work—on thepart of the operator, team leader, and supervisor. Two layers ofdefense for the integrity of the process had failed because of “coast-ing” through the discipline of standard work. The checklists were inplace and the boxes had checks in them, but the disciplined in-depthobservation implied in leader standard work was missing. Engines asa rule do not function without fuel; leader standard work without dis-cipline is no exception to this rule.
23
THE LEAN MANAGEMENT SYSTEM’S PRINCIPAL ELEMENTS
3. Daily accountability process, and
4. Leadership discipline.
Even considering its additional supporting elements, lean management is nota complex system. In this respect, it is similar to the lean production system; ahandful of principles define both approaches. The principal elements are illus-trated in depth in chapters 3, 4, and 5. Supporting elements are the subject ofchapters 6 through 9, with a lean management assessment instrument includedin chapter 10 and the appendix.
Another similarity between lean production and lean management is thehigh level of interdependence among the elements in each one. Not only mustthe elements be put in place, they need careful, daily attention. Left untended,the management system quickly deteriorates and loses its effectiveness, just aswith the production system. But, when lean management becomes “the way wedo things around here,” the benefits are considerable. Lean management that iswell and consistently implemented helps bring the foundation of stability to leanproduction conversions, a foundation on which ongoing improvements can bebuilt. Establishing and building on this foundation are the subjects for theremainder of the book.
24
CREATING A LEAN CULTURE

3Standard Work for Leaders
Standard work for leaders, the engine of lean management, is the highest lever-age tool in the lean management system. As mentioned in chapter 2, leader stan-dard work is the first principal element of lean management; this chapterdescribes it in detail.
Leader standard work provides a structure and routine that helps leaders shiftfrom a sole focus on results to a dual focus on process plus results. This changein focus is crucial to the success of a lean operation. Moreover, it is perhaps themost difficult thing to accomplish in a leader’s personal conversion from batchand queue to lean thinking. Leader standard work aids this conversion by trans-lating the focus on process, an abstract concept, into concrete expectations forthe leader’s own specific job performance. Just as standard work elements in aproduction workstation provide a clear and unambiguous statement of expecta-tions, the same is true of standard work for leaders. (The main difference is thatvirtually all of an operator’s time at work is defined by standardized work. Forteam leaders, the proportion is still about 80 percent. The proportion drops toabout half for supervisors and about a quarter for value stream leaders.)
Leader Standard Work Is Process-Dependent
Leader standard work also provides a foundation for continuity in lean manage-ment in a unit. Each time a new team leader or supervisor starts work in a leanarea, things should continue to operate much as they have, assuming the process
25
has been in a satisfactory and stable state. In batch operations, in contrast, oneoften sees a “new sheriff in town” mentality accompanying change from onesupervisor to the next. That is, in these circumstances the management systemdepends on the person. With leader standard work, the lean management systemis process-dependent, not person-dependent. Instead, key aspects of the manage-ment system are captured and presented in leader standard work as a well-definedprocess in which core tasks and routines are explicitly called out.
There are several benefits to this approach. One benefit is continuity of basicpractices across changes in incumbents, which minimizes variability that mightdestabilize the production process. But perhaps more important is a second ben-efit, especially for organizations involved in a transformation from batch andqueue to disciplined lean operation.
This second benefit is that leader standard work quickly allows an organiza-tion to raise the game of the existing leadership staff, or highlight those unable tomake the transition. Leader standard work does this by presenting a clearly statedrecipe—the standards for expected behaviors for leaders in a newly lean environ-ment. This is superior to the alternative of waiting and hoping for So-and-So to“come around,” or to “get it.” Leader standard work is first focused on “doing it,”rather than “getting it.” It allows a much speedier separation of those who arewilling and able from those who are not. Experience in lean conversions suggestsbetween 10 and 20 percent of leaders are unable or unwilling to make the tran-sition. Glossing over certain leaders’ failure to understand or support the lean ini-tiative carries a high risk of seriously slowing or degrading the effectiveness of alean conversion. Leader standard work makes these cases clearer, sooner. A leaninitiative is like any other program in raising questions about management’s com-mitment to back up its words with actions. Management can act to address thesequestions more quickly based on the clearly documented expectations in leaderstandard work.
As the transition proceeds, leader standard work captures the cumulative to-date essence of an organization’s best practices in lean management. This providesa solid starting point for those in leadership positions. As such, standard work forleaders provides a leg up for leaders to improve their performance, building onthe preserved experience of others. In this way, leader standard work is a specificmeans through which average leaders can consistently turn in above-average per-formance. If you think of the lean management system as a kit of parts, leaderstandard work provides the instructions for how they fit together. It reducesambiguity and sets the conditions under which an individual leader’s success ismore likely.
26
CREATING A LEAN CULTURE

Leader Standard Work as Interlocking Layers
Leader standard work is layered with a degree of redundancy built in, linking thelayers. Think of a job responsibility for team leaders, such as filling out the pro-duction-tracking form every 20 minutes and noting reasons for misses when theteam misses the goal for a pitch. Here’s how the layers work for this task:
• The team leaders’ standard work specifies this task.
• The supervisor’s standard work calls for spot-checking the pitch-tracking chart four times a day, initialing it each time. Further, thesupervisor’s standard work calls for leading a brief daily meeting ofhis or her team leaders to review the previous day’s pitch charts tounderstand any misses in performance and ensure action has beeninitiated as appropriate. These are constant reinforcements for theteam leaders to focus on their processes.
• The value stream manager’s standard work calls for initialing everypitch chart in the value stream once a day, and leading the top tierof the daily accountability process every day. A key feature of thesemeetings is a review of yesterday’s production-tracking charts. Thevalue stream manager scrutinizes the reasons for misses on thecharts. The supervisor knows to be prepared to explain what hap-pened.
• When appropriate (typically where the supervisor needs moreresources or more encouragement to resolve the problem), the valuestream manager assigns follow up action items to the supervisor orsupport group representatives and posts the assignments on a visualdaily task accountability board for review the next day.
• All of this is prompted by the specific requirements in leaders’ stan-dard work from value stream manager to team leader.
Could any of these three levels of leaders find ambiguity in the requirementto maintain and monitor production-tracking charts, paying careful attention toreasons for missed pitches, and initiating appropriate corrective action? It isunlikely, because these steps appear as routine daily items in their standard work(see Table 3.1). With this kind of readily audited daily direction, establishingfocus on process is simply a step-by-step routine. It makes lean accessible andactionable to even the most inexperienced leader, to the most unreconstructedbatch thinker.
27
STANDARD WORK FOR LEADERS

Leader Standard Work Shows What to Do—and What Not to DoThe case study on p. 30 shows how standard work can help a leader see what needs tobe done. Standard work for leaders also works in the converse; that is, it can also showwhat should not be done. Another case illustrates this point (see case study on p. 31).
28
CREATING A LEAN CULTURE
Frequency Team Leaders(TL)
Supervisors(Supe)
Value StreamMgrs (VSM)
PlantManager
(PM), Execs(When in plant)
Once daily, typically repeatedeach day (or each occa-sion for plantmanagers andexecutives)
Check call-ins
Adjust laborplan
Shift changecoordination
Daily admin tasks
Daily admintasks
Review perform-ance trendcharts
Lead team start-up (tier 1) meet-ing (5-10 min)
Attend a TL startup meeting
Night shiftgemba walk
Spot check, sign-off pitch charts,other visual controls.
Floor check pro-duction start-up
Floor check pro-duction start up
Lead valuestream task/improvement(tier 3) meeting(10-20 min)
Lead weeklyplant perform-ance/improve-ment reviewmeeting (PM)
Supe-TLs (tier 2)meeting (5-15min)
Lead (tier 2)meeting w/ TLs
• Misses, issues,improvements
• Daily taskboard dueand new items
Daily gembawalk w/ onesupe
Spot reviewprocess andproduct improve-ment work
Gemba walk w/supervisor
Attend weeklyrecurring plant-level meetings
Formal audit ofone area
Verify leaders’standard work
Supe-TLs meetaccountability,improvement (5-15 min)
Gemba walk w/TLs one on one
Attend weeklyrecurring plant-level meetings
Verify TL, supeon floor or whynot?
Daily (weekly)continuousimprovementmeeting w/ team
Spot-checkbuzzer-to-buzzerwork
Spot-checkbuzzer-to-buzzerwork
Next day planning
• Labor plan
• Prep for teamstart-up meeting
Spot-check, sign-off each pitchchart
Review status ofall other visuals
Gemba walkeach VSM, staffmanager weekly(PM)
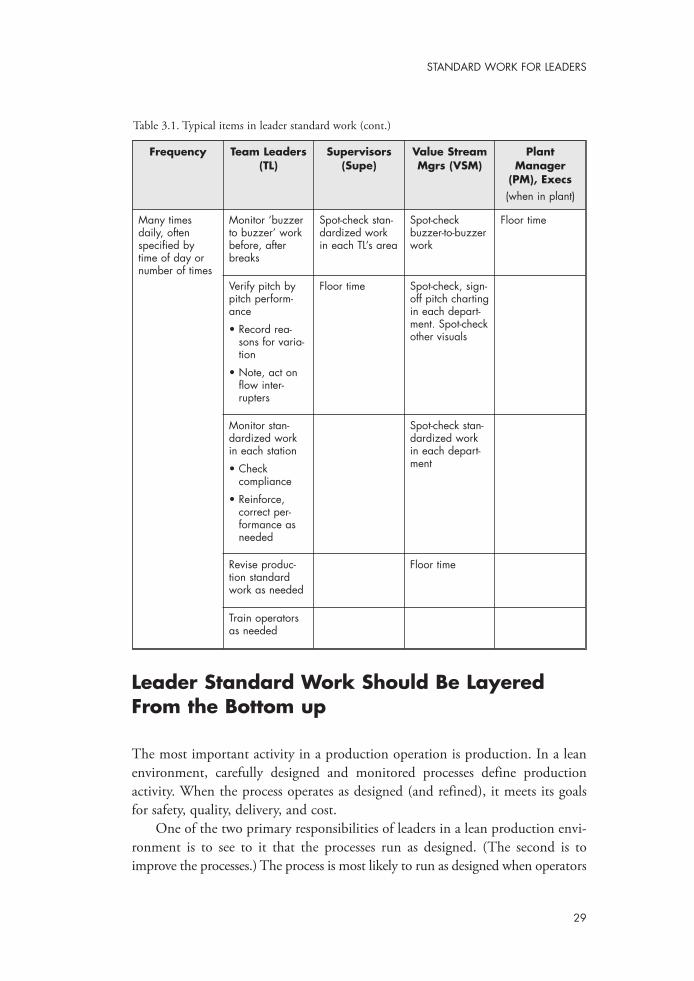
Table 3.1. Typical items in leader standard work
Leader Standard Work Should Be LayeredFrom the Bottom up
The most important activity in a production operation is production. In a leanenvironment, carefully designed and monitored processes define productionactivity. When the process operates as designed (and refined), it meets its goalsfor safety, quality, delivery, and cost.
One of the two primary responsibilities of leaders in a lean production envi-ronment is to see to it that the processes run as designed. (The second is toimprove the processes.) The process is most likely to run as designed when operators
29
STANDARD WORK FOR LEADERS
Frequency Team Leaders(TL)
Supervisors(Supe)
Value StreamMgrs (VSM)
PlantManager
(PM), Execs(when in plant)
Many timesdaily, often specified by time of day ornumber of times
Monitor ‘buzzerto buzzer’ workbefore, afterbreaks
Spot-check stan-dardized workin each TL’s area
Spot-checkbuzzer-to-buzzerwork
Floor time
Verify pitch bypitch perform-ance
• Record rea-sons for varia-tion
• Note, act onflow inter-rupters
Floor time Spot-check, sign-off pitch chartingin each depart-ment. Spot-checkother visuals
Monitor stan-dardized workin each station
• Check compliance
• Reinforce, correct per-formance asneeded
Spot-check stan-dardized workin each depart-ment
Revise produc-tion standardwork as needed
Floor time
Train operatorsas needed
Table 3.1. Typical items in leader standard work (cont.)

Case Study: Leader Standard Work’s Role in Creating & Maintaining Stability
An illustration comes from the case of a supervisor’s return from vaca-tion. He had been using standard work to structure his workday rou-tine for several months before leaving for a few days off. His area, asubassembly and final assembly operation with about 35 people, wasrunning smoothly when he left. Not so upon his return. He returned tofind purchased part shortages, shortages of some parts made in-house, and other in-house parts out of specification and unfit for use.The area was behind schedule, and the team leaders had been spend-ing all of their time trying to expedite the various missing parts.
The supervisor immediately jumped into the fray, joining the teamleaders in expediting, calling suppliers, and going to his in-house sup-pliers to attempt solutions to the out-of-spec problems. The assemblerscontinued to build whatever they could, robbing parts from one orderto complete another, offloading partially built units wherever there wasspace on the floor, and generally keeping as busy as they could doingwhatever work presented itself no matter when it was due out.
After two days of exhausting, but largely fruitless efforts, his arearemained behind schedule and in a state of jumbled confusion. At thatpoint, his value stream manager who had been observing the situationsuggested to the supervisor that he might try returning to his standard-ized work. The supervisor listened and beginning the next morningtook his boss’s advice. Instead of running here and there, he and histeam leaders stayed with their process. As shortages interrupted pro-duction, they directed their crew to other tasks while documentingwhat had caused the stoppage. They transmitted this information tothe appropriate support groups, in this case engineering and materi-als management as well as the value stream leader. These situationswere also topics at the value stream’s daily accountability meeting.Within a day, the missing parts began to be delivered and the prob-lem with out-of-tolerance components was resolved. The assemblersconcentrated on completing the oldest orders first and were on theirway to working up to the current day’s schedule. A sense of calmreturned to the area.
By the time I saw the supervisor, on Thursday afternoon of the week
30
CREATING A LEAN CULTURE
he returned from vacation, he swore he would never deviate againfrom his standardized work. At the same time, he acknowledged thepowerful pull of past practices (supervisor as firefighter) though wasalso struck by the comparison in effectiveness of the old and newapproaches. He has been a faithful adherent of standard work, bothfor himself and his team leaders ever since.
31
STANDARD WORK FOR LEADERS
Case Study: Standard Work Requires Sticking to the Plan
A new team leader had been the job only a few weeks and had noprecedents to follow. Her area, which covered two assembly lines thatwere building two different sizes of the same family of products hadnot had team leaders before. She was the first.
The area had been well and carefully designed by a bright, techni-cally oriented value stream leader and his staff. Standard work wasposted for all the area’s production-related operations, in-cycle andout-cycle as well. Even so, there were repeated interruptions, usuallybecause in-house or purchased parts were not available when needed,or because the computer algorithm used to schedule the finishingprocesses was unable to produce an even flow of units into assembly.
I had encouraged the value stream manager to establish standardwork for his new team leader and later suggested some edits to a draftshe had produced. A few weeks later, I saw her in her production areaand asked how it was going with her standard work. She pulled thepage of standard work out her back pocket and held it up in front ofher like a school crossing guard with a stop sign. “It’s great,” sheexclaimed, going on to say it was useful in reminding her what sheneeded to do. But better than that, she added, it was a terrific way toexplain to the many people making requests of her why she could notdo what they asked. “I have to stick to my standardized work,” shesaid she told them. Since then, more team leaders have been addedto her value stream, each with well-defined standard work. Now,every operator in the value stream has someone whose standard workincludes responding to his or her questions and requests.

doing the actual production and related jobs are following their standardizedwork. If they are, things should run predictably.
For these reasons, standard work for leaders is built, or layered, from thebottom up:
• Develop team leaders’ standard work around maintaining produc-tion at takt time (or the equivalent takt-derived pace) and ensuringthat standard work is being followed in the production process.
• Build supervisors’ standard work around monitoring and supportingteam leaders in carrying out the responsibilities in their standardizedwork.
• Similarly, build value stream managers’ standardized work to monitorand support supervisors for following the responsibilities in theirstandard work.
• The same holds true for executives. Build their standard checklistsfor time on the production floor to verify the chain of standardwork is being upheld and the production process is being supportedfor stability and improvement.
This network of support for the integrity of the production process is repre-sented in Figure 3.1: The network serves as a bridge to keep lean production andmanagement moving. In addition, each of these layers is discussed in more detailin the next section of this chapter
The interlocking and somewhat overlapping set of leaders’ standard work isdirectly comparable to the quality checks built into successive workstations on alean assembly line. On the line, the standard work elements for each station typ-
32
CREATING A LEAN CULTURE
Lean Production &Lean Mgt. Express
Std. Work: Supervisor Std. Work: ExecutivesStd. Work: V.S. LeaderStd. Work: Team leader
Gorge of instability,despair, dashed hopes
Figure 3.1. Leader standard work and the integrity of lean process
ically include checks on the quality of some aspect of the work performed in theprevious station. These redundant quality checks are a strength in a lean process.They often contribute to eliminating the need for a separate inspection positionin which no value added work is performed. And so it is with leader standardwork. Each successive level of leader standard work includes checks for the tasksthat culminate in supporting the integrity of the most important work in theoperation—the standard execution of the production process.
What Does Leader Standard Work Cover?Most of an operator’s day—over 95 percent of his or her time—is accounted forby standardized work. In a lean environment where work is paced by takt time,most production and related work is timed and balanced. Leaders’ work is rarelytimed this closely. Even so, it is important to pay attention to the total work con-tent called for in leaders’ standard work to be sure they can perform it effectivelyand thoroughly. In positions at increasing distance from production, leaders’standard work usually becomes less structured. And as organizational levelincreases, less time is specified in standard work with more time for discretionarytasks. In the same way, as organizational level increases, fewer elements need tobe performed in a specific sequence or at specific times of day.
Leaders’ standard work includes coverage of visual controls and executing thedaily accountability process. That is the source of its high leverage. Follow leaderstandard work and you maintain the principal elements of the lean managementsystem. Maintain the lean management system, and you maintain the health ofyour lean production system and enjoy its results.
Leader standard work includes some tasks that are specifically sequenced tohappen at indicated times. Others occur once a day, once a week, or as the needarises. Some tasks repeat several times every day. Again, the closer to the produc-tion process, the more structured the standard work. Because leader standardwork is derived from the standard work that defines the production process, leaders’standard work will vary depending on the nature of each leader’s area. For exam-ple, the specifics of what a leader in a fabrication area focuses on and tracks willdiffer from the specifics in an assembly area.
Team leaders. These are the first line of defense for the integrity of the lean pro-duction process. They should be on the floor in their area paying attention totheir processes virtually all of their time. As such, their standard work typicallyaccounts for most of their time—80 percent plus of their day. Team leader stan-dard work includes many items sequenced to the start and end of production,and many items periodically repeated to monitor and maintain the productionprocess. Their standard work also includes discretionary time to respond to
33
STANDARD WORK FOR LEADERS

abnormalities, work on daily improvement tasks, and perform periodic tasks suchas training operators. To accommodate this variability in their work, their time isspecifically not filled to 100 percent.
Supervisors. Supervisors’ standard work accounts for about half of their time.Most of the items in supervisors’ standard work repeat daily or weekly. Theyinvolve:
• getting the shift started and staffed appropriately;
• reviewing yesterday’s production-tracking documents to understandand take any further required actions to follow up misses or otherissues; and
• reviewing team leaders’ task assignments due that day and makingnew assignments.
Periodic tasks during the day call for the supervisor to work with the teamleaders as well as to monitor and verify execution of the team leaders’ standardwork.
Value stream managers. Value stream managers’ standard work accounts forapproximately a quarter of their time (not including regularly scheduled off-the-floor meetings). Theirs includes leading a brief structured daily accountabilitymeeting as part of the daily accountability process, just as for team leaders andsupervisors. The value stream manager’s standard work includes weekly gembawalks with each supervisor for teaching and inspecting the “homework,” just assupervisors’ standard work includes gemba walking their team leaders. The bal-ance of the value stream manager’s shop floor standard work calls for verifyingexecution of supervisors’ standard work tasks. In this way, the value stream man-ager maintains his or her link in the chain of support for the integrity of the pro-duction process.
Form and Format for Leader Standard Work
Leaders’ standard work differs markedly from operator standard work in oneimportant respect. Leader standard work documents should be working docu-ments. Leaders should have their standard work with them virtually all the time,whether on a clipboard, printed on a card, in a daily planner, or in a PDA. Theleader should note completion of the indicated tasks on the standard work form.When they are unable to complete a task in sequence, on time, or at all, they
34
CREATING A LEAN CULTURE
should specifically note it and record why. This is exactly equivalent, and asimportant, as noting reasons for misses on production-tracking charts. Their notesshould also reflect when misses occurred in their areas and what action they took.
Leaders should use the standard work document to record daily notes, obser-vations, requests for follow-up, and the like. If a leader uses a PDA to hold theirstandard work, s/he should print out the record of the day’s events at the end ofthe day. Leaders’ standard work documents also serve as a communication vehi-cle with the leader’s supervisor (thus the PDA printout). The leader turns in eachday’s document to his or her supervisor who quickly reviews it to pick up anyactions requested by the subordinate and note the nature of the subordinate’sresponse to abnormalities in their areas. Often, “turning in” standard work meansfiling it in a visual display. This signals completion of standard work for that dayand makes the documents readily available in a single location for the supervisorto scan quickly.
As part of the weekly gemba walk, the supervisor pulls the subordinate’s pre-vious week’s standard work for a brief review, looking with the subordinate forpatterns in misses (time of day, specific task, etc.) that might reveal a systematicsource of interruption, something either or both might attack depending on whatit is. Gemba walking is, first and ongoing, a teaching and learning model; themain teaching method to learn lean.1 The learning model implicit in gembawalking is a master-apprentice model. In this model, the master shows theapprentice how, gives the apprentice the opportunity to practice, observes theresult and gives feedback, often critique mixed with encouragement.
For example, if meetings off the floor cause missed items in the subordinate’sstandard work, the superior might have to intervene with those calling the meet-ings. If the interruption is to attend to defective equipment, the subordinatemight get a task assignment to determine the cause of the downtime and initiateor recommend action to prevent it.
Periodically during this review of the previous week’s standard work docu-ments, supervisor and subordinate should consider whether the content of stan-dard work should be updated to reflect changes in the production process or onlessons learned in the preceding period. As with operator standard work, do notthink of leader standard work as static. As things change in the process and asindividuals learn and develop, integrate those changes in standard work. Standardwork is not like the virtually unvarying, set-it-and-forget-it atomic clock at theU.S. Naval Observatory. Standard work for operators and leaders alike is merelythe best we know how to do things for now.
35
STANDARD WORK FOR LEADERS
1. However, some would argue that participation in kaizen events is an alternative method for learning leanproduction. In either case, the learning process takes a long time, months at least.

The Role of Training for Lean Implementation
It is not unusual in presentations about lean implementation initiatives to hearhow important a lean training program has been, what was covered, how long itlasted, and how many people went through it. It is also not unusual to hear inthe same kinds of presentations how much time and effort was spent in leantraining and what a waste it turned out to be; that back on the job nobody knewhow the training translated into what they were supposed to do. Or, as is toooften the case, superiors had not been included in the training program and sowere still asking their subordinates for the same old things.
Without a doubt, there are conditions under which lean training can be quiteeffective as an ingredient in a lean conversion. It can help to drive change,develop buy-in, and move the conversion in the hoped for direction. Often inthese cases, one of the expressed objectives is to help drive a change in culture. Ithink this misses the point about what drives cultural change, namely expecta-tions for different behavior and a process for supporting it.
If I had to choose between lean training for a new recruit to lead a lean areaor providing him or her with a copy of clearly written standard work, I wouldchoose standard work every time. Especially starting out, lean is more about whatyou do than about what you know, and the latter (knowing) grows from the for-mer (doing). Training is not something bad or to be avoided; on the contrary.Developing familiarity with the principles of lean through classes or readingassignments is valuable. But, as far as preparing anyone to step into a lean areaand keep it operating and improving, training by itself is an inadequate, aswell as expensive and time-consuming substitute for specific expectations andprocesses for following up on them.
Training pays off far more when delivered in gemba walks through the mas-ter-apprentice learning model. Training delivered in this fashion means the les-sons can be individually tailored to the student’s level. The teaching can be illus-trated with specific situations in the student’s area of responsibility; reinforcedthrough assignments for hands-on application implemented over the course of aweek; and followed up in the next week’s gemba walk by inspection and critique.The lessons are further reinforced by the “what-to-do-when” practices called outin leader standard work to maintain and improve lean production and lean man-agement.
36
CREATING A LEAN CULTURE

Summary: Leader Standard Work Is Element #1 of Lean Management
Leader standard work provides the greatest leverage in the lean management sys-tem because it captures the expectations for executing the principal elements oflean management. In the best of circumstances, leader standard work eliminatesguesswork for floor managers and team leaders. It is typical for standard work tostabilize the leader’s day. Standard work not only specifies what the leader shoulddo. It also, by implication, identifies what the leader should not be doing. Focuson you own work and call on others to focus on theirs. The alternative is to climbback onto the fire truck. It may be a gratifying and comfortable place to be, butit drives lean backwards. Many leaders in production operations are orientedtoward doing: getting things done, crossing things off a to-do list. Leader stan-dard work fits well with this orientation. For those with a more creative bent,standard work allows them to get the routine things taken care of with less men-tal energy, leaving them free to focus on making changes and improvement.
Lean management does not come about only from having its pieces in place.The lean management system works for you when you work for it. That meanscoming to think differently about what might appear to be many small things,but which add up to a big thing. The big thing is discipline on your part as aleader to follow your standard work faithfully and in depth. That will entail scru-tinizing the entries on visual controls, focusing on gaps revealed there betweenexpected versus actual, and holding people accountable to complete dailyimprovement task assignments to address and close these gaps. All of this followsfrom your standard work as a leader. Fueled by your disciplined adherence to it,leader standard work becomes a powerful engine for the lean management system.
37
STANDARD WORK FOR LEADERS


4Visual Controls
The status of virtually every process should be visible in lean management. If takttime is the heart of lean production, visual controls and the processes surround-ing them represent the nervous system in lean management. Chapter 2 intro-duced visual controls as the second principal element in lean management; thischapter offers examples of visual controls for a variety of processes. Table 4.1 listsall the visual controls that are included in this chapter and throughout the book.In addition, several photographs show what several actual in-use examples ofthese visual controls look like.
The intent is not to present an exhaustive survey of visual controls; instead,the purpose is to illustrate that the variety and type of visuals are as broad as thevariety of production processes. The form of the visuals is limited only by yourimagination, guided solely by the purpose of making easy and widely accessiblethe comparison of actual versus expected performance. That is the reason thisbook doesn’t include a CD of visual control forms. The best forms are those youdevelop and revise yourself to show the information you need to quickly see thestatus of your processes.
Finally, the chapter concludes with a description of the benefits of usingsimple visual controls over more sophisticated IT technology.
39

Table 4.1. List of illustrated visual controls
40
CREATING A LEAN CULTURE
Figure Title
4.1 Production pitch tracking chart
4.2 Monthly pitch log
4.3 Job by job tracking chart
4.4 Priority board color coding
4.5 Priority board hourly status chart
4.6 Completion heijunka
4.7 Late load log
4.8 Detail illustration of tracking board for “re”-processes
4.8a Photo of reorder board
4.9 Example of visual control board for noncyclical processes
4.9a Photo of a visual control board for 5S tasks
5.1 Daily accountability board
5.1a Photo of a daily task accountability board
5.1b Photo of a daily “run the business” board
8.1 A-3 project plan form
8.1a Photo of an A-3 project plan board
9.1 Attendance matrix
9.2 Labor and rotation plan
9.2a Photo of a labor planning board
9.3 Sample skills matrix entries
9.4 Suggestion system idea board
9.4a Photo of an idea board
Visual Controls Focus on Process and ActualPerformance
The purpose for visual controls in lean management is to focus on the processand make it easy to compare expected versus actual performance. Lean is animprovement system. These comparisons highlight when the process is not per-forming as expected and thus where improvement might be needed.
Comparing expected versus actual performance is a central theme in leanmanagement’s emphasis on process focus. In some lean conversions with anexclusively technical focus, visual controls such as performance-tracking charts areoften little more than wallpaper. Indeed, great attention may have been devotedto developing a cosmetically consistent look for forms and displays, missing the
Case Study: Using Visual Controls to ImprovePerformance
In one company, visual display boards for cells were put up to satisfythe dictate of the division general manager. The general managerinsisted that the information on the boards be kept up to date. Whenhe was in the plant, which was a half-day drive from the majority ofhis responsibilities, he inspected the boards carefully to make surethey were current.
At first, the boards were current only during his visits and allowed tolapse as soon as the GM left the plant. The division’s lean sensei, see-ing this during one of his trips to the plant, asked a value stream man-ager to try actually using the boards for a few weeks to test the propo-sition that he might find them useful. During a subsequent gembawalk with the sensei, the value stream manager exclaimed thatby simply noting misses and making the visual assignments (part ofthe daily accountability process) to respond to them, things had actu-ally improved. Several problems of longstanding were eliminated.Performance and results had stabilized. Visual controls are important,not because they satisfy executives’ demands for visual displays, butbecause they bring focus to the process and, in doing so, driveimprovements.
41
VISUAL CONTROLS

point that lean management is not about the forms or the appearance of thevisual tools. It is important that leaders understand why they track performanceand that they commit to action in response to performance data and followthrough, so that action assignments turn into improvements. It may take a whilebefore this sinks in with leaders, though sometimes it happens quickly.
A Variety of Tools to Visually Monitor Processes
Performance tracking charts, such as hour-by-hour production-tracking charts,are among the most commonly seen visual process monitoring tools in lean pro-duction areas. When visual monitoring tools are implemented as part of a processthat includes mechanisms to sustain them such as leader standard work, the
Case Study: Problems Arise When You HaveCharts but Don’t Use Them
In a lean conversion project early in a company’s lean journey, I foundhour-by-hour charts tossed onto a bottom shelf of a supervisor’s deskon the production floor. The charts were literally covered with dust. Noreasons for misses were noted on them (though plenty of missesappeared); no action had resulted from them. Not coincidentally, thisparticular lean conversion project stalled and did not get restarteduntil the product line was transferred to a different plant.
Despite early disappointments, other transformation projects werebegun. As implementation and understanding of lean managementhave taken hold, the same charts are posted and current, highlightedcolor codes readily distinguish hours where goals are met from thosethat missed, well-documented reasons for misses are reflected inposted “top 3” weekly lists of interrupters and actions to eliminate theircauses. The production-tracking charts are now scrutinized daily bythe area supervisor and later by the value stream manager. Periods ofmissed production are treated as a big deal rather than with a shrug.Support groups and line leaders are mobilized to respond to them.Overall, there is a much-heightened sense of accountability for actionto understand the causes for misses and to resolve them.
42
CREATING A LEAN CULTURE

tracking tools have a good chance of being used effectively. Visual monitoringtools are part of a new way of managing an operation. Most production leadersare pragmatic people. If a tool works for them, they are likely to use it. But with-out a process that defines how the tools are used and sustains their use, the toolsare likely to fall by the wayside.
Hour-by-Hour Production Tracking ChartsThese basic tracking tools measure expected versus actual output hour by hour(or more frequently) during the day (see Figure 4.1). These charts are appropri-ate in areas with the expectation for a steady, takt-paced rate of output, such asassembly or subassembly areas in which flow production has been implemented.
Figure 4.1. Production pitch-tracking chart
The chart shows the expected production in number of units each hour.Entries record the actual number produced and the nature and reasons for inter-ruptions in the process. Even before a rate can be calculated, for example, in newproduct production areas, interruptions in flow can be documented every hour
43
VISUAL CONTROLS
Pitch
7–7:30
7:30–8
8–8:30
8:30–9
9–9:30
9:30–10
10:30–11
11:30–12
12–12:30
12:30–1
1–1:30
1:30–2
2–2:30
2:30–3
3–3:30
3:30–4
Totals
Reason for Misses
10 min. startup mtg. Meeting long 2 minutes–safety issue
TL helped at station 5 for 6 cycles to catch up before break
10 min. break
Container short three P/N 46230721–notified PIC
30 min. lunch
10 min. break
10 min. cleanup washup TL helped sta 5, 3 cycle–want on-time finish
Overtime: Minutes, why?
Pretty good shift–external failure and recovered–minimal OT
GoalPitch /
Cumulative
20/20
30/50
30/80
30/110
20/130
30/160
30/190
/190
30/220
30/250
30/280
20/300
30/330
30/360
20/380
380/380
ActualPitch /
Cumulative
18/18
30/48
30/78
32/80
20/130
30/160
27/187
/187
30/217
30/247
30/277
20/297
30/327
30/357
21/378
2/380
VariationPitch /
Cumulative
-2/-2
0/-2
0/-2
+2/0
0/0
0/0
-3/-3
0/-3
0/-3
0/-3
0/-3
0/-3
0/-3
+1/-2
+2/0
0/0
Production Tracking ChartDate: 4/27/04Takt: 60 sec.
Area: B211 AssemblyTL: Tina T.
Note: Color codes used to indicate at, below, or above goal. In this black and white example, white backgroundrepresents green for on goal, black represents red for below goal, and gray represents blue for above goal.
2 min., made up for part shortage @ 10:30 pitch
4_Visual_Controls.qxd 3/31/05 3:15 PM Page 43

(or other interval). This is important for establishing process discipline and thehabit of documenting abnormalities in the process, as well as addressing the inter-rupters. Reasons for misses are the most important entries on the form, regard-
Case Study: Taking Improvement to a New, More Focused Level
On a gemba walk with a value stream manager, I noted from theirproduction-tracking charts that two of the cells in her area reliably metand often exceeded their hourly goals. In talking with her about pos-sible opportunities to improve in these cells, we discussed shorteningthe interval of observation from an hour at a time to half an hour at atime. This seemed especially appropriate in this instance.
Both cells produced a daily-varying, made-to-order mix of models witha variety of work elements and cycle time. Units with less work contentcould be produced faster than average; those with more content tooklonger than the average time. If a series of lower-work-content units fol-lowed an interruption, time made up on them could cover interruptionsthat occurred earlier in the sequence. (The sequence was physicallyset in advance, so there was no opportunity to “game the system” tomake results look better.)
The value stream manager decided to take that step. Her thinking wasthat by reducing the interval by half—in effect, looking more closelyat the processes—problems would show up as interruptions that in alonger interval of observation were hidden by the cells having enoughtime to catch up and still meet their hourly goals.
With the smaller interval of observation, more missed pitches didshow up. Interestingly, many were the result of database inaccuracies.That is, the database showed cycle times for the different units thatwere accurate for some models, too low for some, and too high forothers. This meant the capacity for these two cells was randomly mis-stated depending on the units for any given day’s production. This wasreflected in the weekly trend chart for pitch attainment. Before thechange in observation period, the percentage of pitch attainment wasregularly in the high 80 percents to mid 90 percents. After the change
44
CREATING A LEAN CULTURE

less of the maturity of the process.As the process stabilizes, the interval of observation should shrink from an
hour to a shorter interval, perhaps a half or quarter hour, or an interval defined
45
VISUAL CONTROLS
in interval, these percentages dropped by some 20 points.
The value stream manager with the supervisor carefully looked at thedaily tracking charts for the week after the measurement change. Thesupervisor pointed out the problem in the database and backed it upwith documentation, identifying units that clearly ran faster or slowershowing virtually the same work content allowance in the database.The value stream manager then looked again at the tracking charts.She asked why the reasons-for-misses column was blank, both forpitches where the cells had beaten or missed their goals as an artifactof the database problems. Rather than living with an inaccurate data-base that misstated the actual capacity of the two cells, the valuestream manager wanted to see the model numbers for units with inac-curate run times recorded in the reasons-for-misses column. That wouldallow her to assign the value stream engineers the task of correctingthe database model by model, a little at a time, rather than in a sin-gle overwhelming batch request.
The supervisor was unhappy that her performance numbers had arbi-trarily deteriorated, even though previously they had been arbitrarilyinflated. But, the value stream manager had more confidence aboutbeing able to drive further improvement in these cells. Now that sheknew the capacity of these two cells more accurately, she and thesupervisor had an improved basis on which to compare expected ver-sus actual performance. Because the value stream manager under-stood why she was having process performance data visually tracked,she saw the need to increase the level of resolution of the observationsto provide a clearer picture of the true operation of the processes. Thisstep led to a more accurate picture of variability in the cell and set thestage for changing from a time-based pitch to a load-by-load methodof tracking. This method is more appropriate for the variable workcontent jobs in these cells and has proved helpful in identifying inter-ruptions and imbalances in them.

by a pitch.1 The interval can be as brief as 5 minutes or even less, depending onthe process, its maturity, and the way output is packed and shipped. The reasonfor reducing the interval of observation is to provide a closer, more finely grainedpicture of flow interrupters. When a process is newly established, it is not unusualto experience breakdowns upstream of the process (e.g., equipment failures nolonger covered up by inventory, supplier problems, scheduling snafus) not tomention problems internal to the process that cause failures. As these gross inter-ruptions are resolved, the observation interval should progressively shrink tomore precisely capture the next levels of interruption and so define the next focalpoints for improvement. In other words, to catch smaller gremlins, use a net withfiner mesh! The case study on pages 44-45 illustrates this point.
How Visual Controls Enforce DisciplineThis case illustrates the connection between the leader’s discipline and the effec-tive use of visual controls. Visuals are an important enabler for disciplined focuson and adherence to lean processes. This focus on process is absolutely essentialfor establishing and maintaining a lean management system. And, carefullydesigned lean processes require this kind of disciplined attention and support. Wehave ample evidence they do not sustain or improve themselves. That is the rea-son for lean management’s emphasis on leadership discipline and follow-up, soyou do not leave lean processes on their own to fend for themselves.
Visual controls amount only to wallpaper without the discipline to insist theyare taken seriously and used as a basis for action. Without disciplined follow-upby leaders, visuals are destined to take their dust-covered places behind equip-ment and under staircases along with the other boards and banners of past failedprograms. It certainly is not a pretty picture, but it is just as certainly a commonone in North American factories where leaders did not have the discipline to staywith programs they launched.
This case showed one way to use pitch tracking charts. The same example—instances where cells could frequently beat their pitch goals—would show upmore clearly when pitch attainment information was displayed for more than asingle day. It is often useful and a good practice to record the summary data in aformat that makes it possible to see trends. Are Fridays more productive thanMondays, for example? Or, does productivity dip after break times? The same dis-play also allows operators in the area to see how they are doing over a period oftime: Are we getting better? It is a simple matter to produce such a chart.
46
CREATING A LEAN CULTURE
1. Pitch originally was a standard pack-out quantity such as a case of 24 units. In this definition, pitch is amultiple of takt, here 24 times takt. With takt at 30 seconds, a pitch should be completed every 12 minutes.For production with no fixed pack-out quantity, such as desks, pitch can be set as a fixed interval of timesuch as an hour or fractions of an hour. In either case, pitch is used to establish pace at an interval longer—more easily observed and tracked—than individual takt cycles.
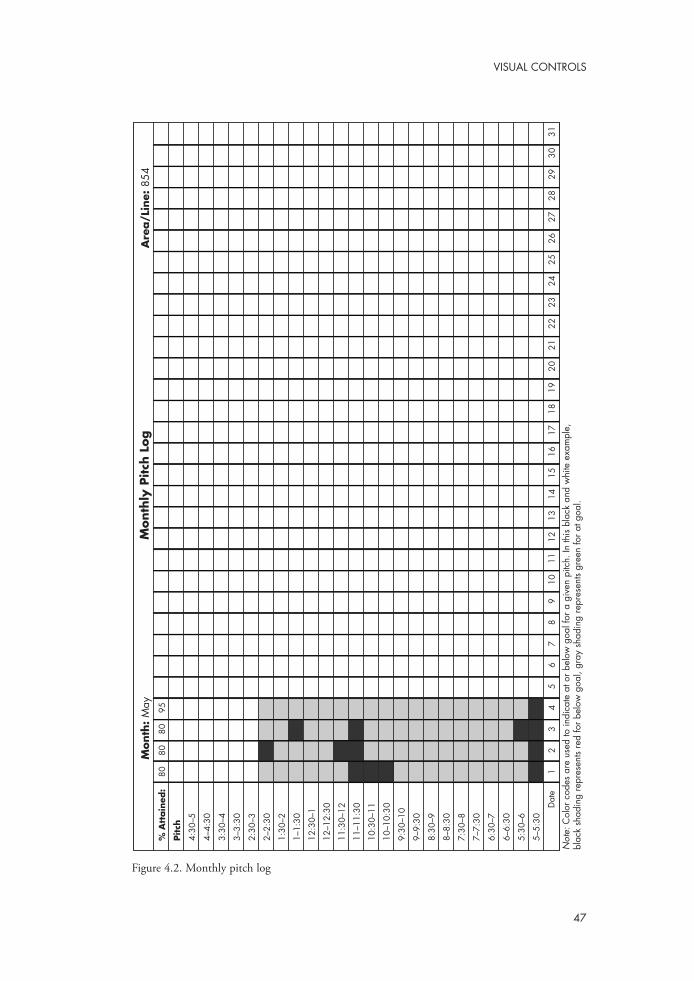
47
VISUAL CONTROLS
% A
ttain
ed:
Pitch
4:30
–5
4–4:
30
3:30
–4
3–3:
30
2:30
–3
2–2:
30
1:30
–2
1–1:
30
12:3
0–1
12–1
2:30
11:3
0–12
11–1
1:30
10:3
0–11
10–1
0:30
9:30
–10
9–9:
30
8:30
–9
8–8:
30
7:30
–8
7–7:
30
6:30
–7
6–6:
30
5:30
–6
5–5:
30
D
ate
21
43
8080
9580
65
87
109
1211
1413
1615
1817
2019
2221
2423
2625
2827
3029
31
Month
: M
ayA
rea/L
ine:
854
Month
ly P
itch
Log
Not
e:C
olor
code
s ar
e us
ed to
indi
cate
at o
rbel
owgo
alfo
r a g
iven
pitc
h.In
this
blac
k an
dw
hite
exa
mpl
e,bl
ack
shad
ing
repr
esen
tsre
dfo
rbel
owgo
al,g
ray
shad
ing
repr
esen
tsgr
een
for a
t goa
l.
Figure 4.2. Monthly pitch log
4_Visual_Controls.qxd 3/31/05 3:15 PM Page 47
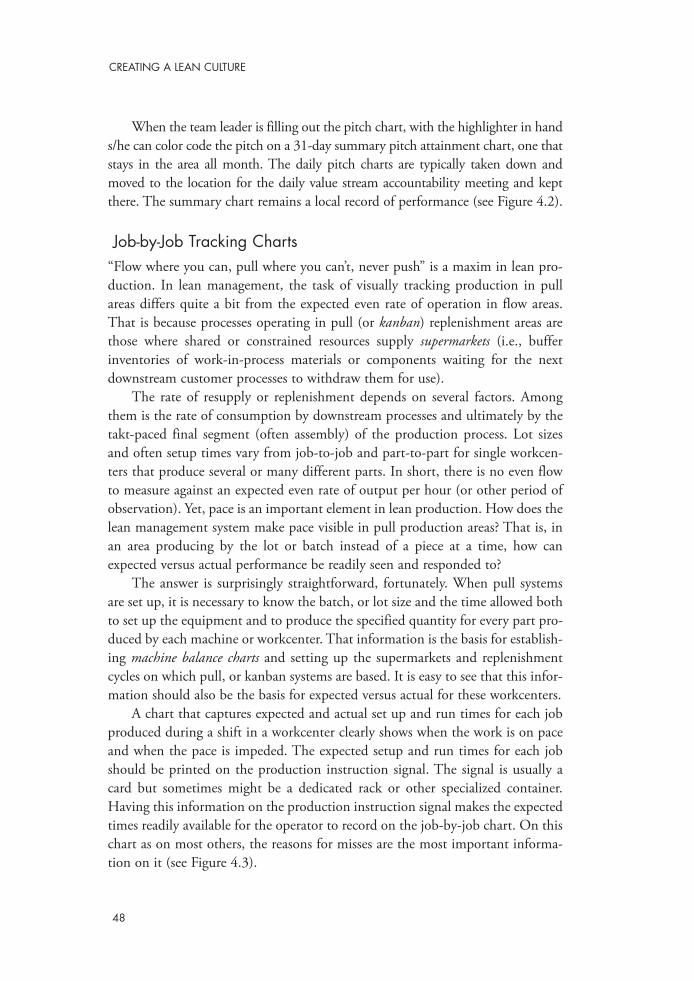
When the team leader is filling out the pitch chart, with the highlighter in hands/he can color code the pitch on a 31-day summary pitch attainment chart, one thatstays in the area all month. The daily pitch charts are typically taken down andmoved to the location for the daily value stream accountability meeting and keptthere. The summary chart remains a local record of performance (see Figure 4.2).
Job-by-Job Tracking Charts“Flow where you can, pull where you can’t, never push” is a maxim in lean pro-duction. In lean management, the task of visually tracking production in pullareas differs quite a bit from the expected even rate of operation in flow areas.That is because processes operating in pull (or kanban) replenishment areas arethose where shared or constrained resources supply supermarkets (i.e., bufferinventories of work-in-process materials or components waiting for the nextdownstream customer processes to withdraw them for use).
The rate of resupply or replenishment depends on several factors. Amongthem is the rate of consumption by downstream processes and ultimately by thetakt-paced final segment (often assembly) of the production process. Lot sizesand often setup times vary from job-to-job and part-to-part for single workcen-ters that produce several or many different parts. In short, there is no even flowto measure against an expected even rate of output per hour (or other period ofobservation). Yet, pace is an important element in lean production. How does thelean management system make pace visible in pull production areas? That is, inan area producing by the lot or batch instead of a piece at a time, how canexpected versus actual performance be readily seen and responded to?
The answer is surprisingly straightforward, fortunately. When pull systemsare set up, it is necessary to know the batch, or lot size and the time allowed bothto set up the equipment and to produce the specified quantity for every part pro-duced by each machine or workcenter. That information is the basis for establish-ing machine balance charts and setting up the supermarkets and replenishmentcycles on which pull, or kanban systems are based. It is easy to see that this infor-mation should also be the basis for expected versus actual for these workcenters.
A chart that captures expected and actual set up and run times for each jobproduced during a shift in a workcenter clearly shows when the work is on paceand when the pace is impeded. The expected setup and run times for each jobshould be printed on the production instruction signal. The signal is usually acard but sometimes might be a dedicated rack or other specialized container.Having this information on the production instruction signal makes the expectedtimes readily available for the operator to record on the job-by-job chart. On thischart as on most others, the reasons for misses are the most important informa-tion on it (see Figure 4.3).
48
CREATING A LEAN CULTURE
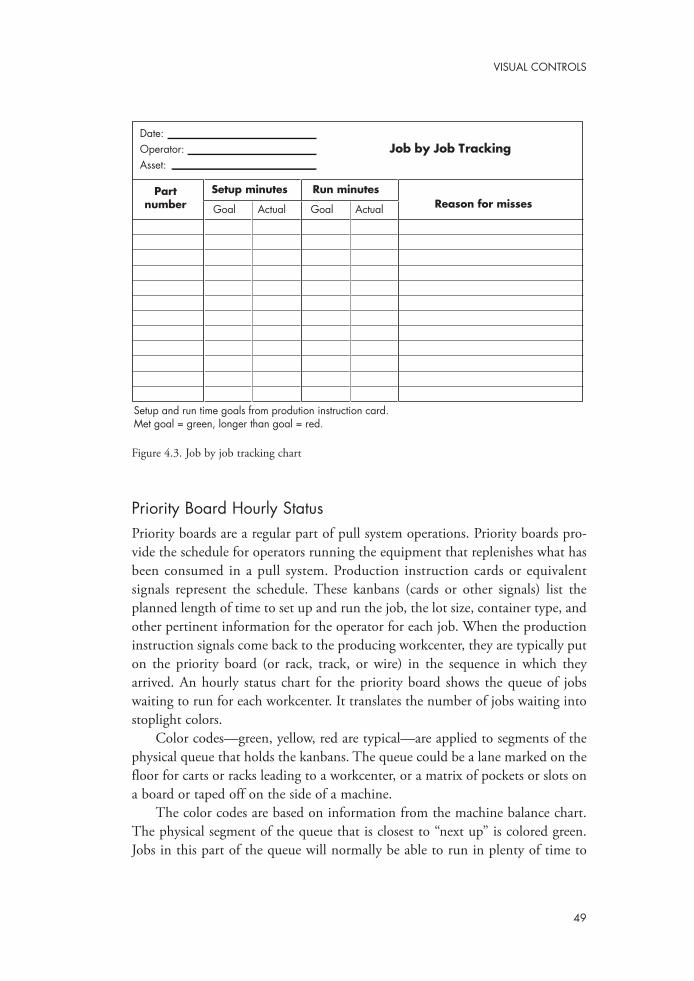
Figure 4.3. Job by job tracking chart
Priority Board Hourly StatusPriority boards are a regular part of pull system operations. Priority boards pro-vide the schedule for operators running the equipment that replenishes what hasbeen consumed in a pull system. Production instruction cards or equivalentsignals represent the schedule. These kanbans (cards or other signals) list theplanned length of time to set up and run the job, the lot size, container type, andother pertinent information for the operator for each job. When the productioninstruction signals come back to the producing workcenter, they are typically puton the priority board (or rack, track, or wire) in the sequence in which theyarrived. An hourly status chart for the priority board shows the queue of jobswaiting to run for each workcenter. It translates the number of jobs waiting intostoplight colors.
Color codes—green, yellow, red are typical—are applied to segments of thephysical queue that holds the kanbans. The queue could be a lane marked on thefloor for carts or racks leading to a workcenter, or a matrix of pockets or slots ona board or taped off on the side of a machine.
The color codes are based on information from the machine balance chart.The physical segment of the queue that is closest to “next up” is colored green.Jobs in this part of the queue will normally be able to run in plenty of time to
49
VISUAL CONTROLS
Job by Job TrackingDate:Operator:Asset:
Partnumber Reason for missesGoal Actual Goal Actual
Setup minutes Run minutes
Setup and run time goals from prodution instruction card.Met goal = green, longer than goal = red.

resupply the supermarket. It may not even be necessary to run the equipment justyet when the queue is in the green. The yellow part of the queue signifies a heav-ier load where the jobs can be replenished in time with normal work hours, pro-viding nothing goes wrong. Otherwise, jobs will be late or it will take overtimeto avoid stockouts. The red part of the queue means a heavy load as a percent ofmachine capacity that will require overtime and/or the last jobs will be late, unlessaction is taken to prevent it (see Figure 4.4).
The tracking chart’s entry for the hour is the color code for the last job in thequeue, the one with the longest wait before its turn to run comes up. The chartprovides a snapshot of priority board load conditions each hour.
Case Study: Make Sure Your Employees Knowthe Charts Are Not Micromanaging Them
Consider the case of machine operators who produced job-by-job indefined lot quantities to replenish parts kept on display in a supermar-ket. They complained to their team leader and supervisor about beingmicromanaged when these charts were introduced. They felt the com-pany was saying they could no longer be trusted to put in an honestday’s work. The supervisor responded by telling them the charts were,in effect, a way for the operators to assign jobs to him! He went on toexplain that his job was to resolve problems that interfered with theoperators’ ability to run smoothly all day. The charts would tell thestory of where the supervisor needed to step in and get the problemssolved. In short, he said, this was micromanagement of the productionprocess, not of the people in it.
The operators began to use the tracking charts to document longstand-ing problems that repeatedly caused them downtime and frustration.This may well have been to test the supervisor’s word that he wouldrespond to issues the operators documented on the charts. The super-visor was true to his word. He and the area team leader respondedby focusing on these problems and getting them fixed. The outcomewas progressive elimination of many recurring frustrating situationsthat interfered with operators being able get into a rhythm and feelthey had had a productive day at work.
The problems surfaced by the operators were plain to see to even
50
CREATING A LEAN CULTURE
It is easy to tell at a glance how the area is running compared to how it shouldbe (see Figure 4.5).
When this method of displaying the status of the queue waiting at a bank ofequipment was first implemented, the value stream manager was delighted.“Finally,” he said, “I can tell where we are in this area without having to find thesupervisor and ask him how we were doing. Now, all I need is to walk by theboard and I can tell at a glance whether I can move on to the next thing orwhether I need to start asking questions. It’s great!” Such is the pleasure visualcontrols can bring by simplifying the tasks of running the business day to day!
51
VISUAL CONTROLS
moderately trained eyes, but they had simply never gotten attention inthe previous batch environment, because the area had been bufferedby large stocks of inventory. Now that it was running to a precisesupermarket pull system, with carefully calculated on-hand quantitiesand replenishment times, the interrupters needed to be resolved.
Many of the issues emerged with the departure of the few experiencedhands, taking with them the undocumented “tribal knowledge” of howthe area ran. The result was at times near chaos, featuring things likemixing storage for active and obsolete tooling, without identification,on the same racks or even jumbled together in cabinet drawers. Therewere no step-by-step work instructions for complex operations, result-ing in much trial and error for the new operators trying to set up andrun the jobs. Raw materials were delivered in a way that requiredtime-consuming handling to get them to the point of use. Gauges onthe equipment needed alignment. Stockouts and defective, out-of-specparts were common, given these sources of instability in the process.None of these were particularly complicated problems.
With the tracking charts as the vehicle, the operators were able toshine a light on these situations. The supervisor and team leader gotthem taken care of permanently, winning respect for themselves andfor the tracking process as well. Stockouts and defects from this areaare now rare occurrences, operators rotate through the area withouta hitch, and productivity in the area has never been as good. This isa good illustration of where micromanagement of the process can pro-duce outstanding results for all involved.

Figure 4.4. Priority board color coding
Completion HeijunkaWhen jobs of varying lot sizes and expected run times go through a single work-center, job-by-job tracking is the tool to use for visually representing expectedversus actual pace and identifying anything that interferes with expected opera-tion. When jobs of varying work content are produced in a cell or line, the situ-ation is a little different.
The completion heijunka identifies when the last piece of a job or load is dueto be completed. It is maintained at the end of the line or cell as a pigeonhole boxor any similar array of slots or pockets with the openings labeled with clock times.When the load is introduced to the process, the expected duration of processing(from the job’s total work content) gets converted to the expected due-out timefor the last piece. That information gets sent to the end of the line. There, thekanban (or shop paperwork) for each load is put in the slot corresponding to itsexpected time of completion. When the load is complete, its card is pulled fromthe heijunka opening. A heijunka status-tracking chart lists each load and recordsits completion status; green for on time, red for late. The reasons for misses areentered on the heijunka tracking chart for loads that finish late, just as they wouldon any other production-tracking chart (see Figures 4.6 and 4.7).
52
CREATING A LEAN CULTURE
Next up 2 3 4 5
10 9 8 76
Ordermaterial
here
11 12 13 14 15
20 19 18 17 16
Note: Color codes used to indicate load status. In this black and whiteexample, white background represents green for capacity OK, gray background represents yellow for capacity warning, and black back-ground represents red for capacity action required.

Figure 4.5. Priority board hourly color status chart
53
VISUAL CONTROLS
Hour
5 am
6 am
7 am
8 am
9 am
10 a
m
11 a
m
noon
1 pm
2 pm
3 pm
4 pm
5 pm
6 pm
7 pm
8 pm
9 pm
10 p
m
11 p
m
mid
nigh
t
1 am
2 am
3 am
4 am
Dat
e2
14
36
58
710
912
1114
1316
1518
1720
1922
2124
2326
2528
2730
2931
Ass
et:
Mon
th:
Pri
ori
ty B
oard
Hourl
y C
olo
r St
atu
s
Col
or =
Col
or c
ode
for p
riorit
y bo
ard
row
of t
he la
st pr
oduc
tion
instr
uctio
n ca
rd in
line
.
4_Visual_Controls.qxd 3/31/05 3:15 PM Page 53

54
CREATING A LEAN CULTURE
Expected Completion Times
00 15 30 45 00 15 30 45 00 15 30 45 00 15
7 am 8 am 9 am Continue 1row/shift
7:37:03 am
Competion Heijunka: A Partial Example
Late Load/Job Log
Time dueDate Time done Reason for overdue
Figure 4.7. Late load log
Figure 4.6. Completion heijunka
4_Visual_Controls.qxd 3/31/05 3:15 PM Page 54
When time sequencing is needed to level volume and/or mix, a release-pac-ing heijunka box can be used at the beginning of the line, with expected times forstarting each job defining the time slots. A job tag or kanban for each job isloaded into the slot corresponding to the load start and end times. In both cases,in addition to the heijunka tracking charts, glancing at the heijunka box and theclock tells whether you are currently meeting the expected pace.
Between-Process TrackingWere subassemblies available when they were expected? Did the units come outof a separately housed process when they were due? Did parts arrive on time fromthe “re” processes—refinish, rework, repair, or reorder? Are suppliers deliveringon time? In each of these cases, how many instances are there of overdue perform-ance over a period of time and what are the causes? These are the usual questionsyou would ask from the perspective of lean management, of course. What isunusual is that with visual controls, practically anybody can tell performance andperformance history at a glance.
Start with an array of slots or pockets on a board labeled with clock times and/ordays of the week or month depending on expected turnaround time. Place a tag orthe actual order paperwork in the opening that corresponds to when the item is dueout. If the paperwork or tag appears in a “late” spot, or if the overdue item’s tagremains on the array for Tuesday at 11am and it’s now Tuesday at 4pm, it is late.
Presto! With a glance at the board the status of performance (and reasonsrecorded on the accompanying log sheet) are immediately clear to all. No inter-pretation is required, nobody needs to make barcode scans (or maintain the bar-code system) or log onto the network and look up status or a specific order, noreports need to be run, consulted, or reconciled. Late is late, on time is on time.The reasons are there to be seen, subjected to analysis and action right awaywhere needed, and for root cause solution later. Note that the tracking charts foron-time performance percentages and reasons for misses are not unique to hei-junka applications; they apply equally well in tracking performance betweenprocesses.
55
VISUAL CONTROLS

56
CREATING A LEAN CULTURE
Case Study: A Tale of Two Networks—IgnoringInformation Versus Visually Displaying
Consider these contrasting cases. In the first, units were assembled and thensent into a finishing department by conveyer through an opening in the walland then out again for final assembly and pack, and then to shipping.Nominal turnaround time for finishing was 4 hours. As units entered the finish-ing room, they were scanned in. When they were released, they werescanned out. Their length of stay in the finish room was routinely reported ona report from the IT system.
I was talking with the fabrication manager one day when we were interruptedby an urgent reorder request. It seems a unit had been in the finish room forover a week, apparently undergoing repeated attempts to rework the finish.Finally, with the ship schedule looming, finish called fabrication with thereorder. Production for that unit had to start all over again from raw materi-als, and be expedited through the entire process. The fabrication manager,between groans, was able to tell me exactly to the minute when the unit hadfirst gone through the wall into the finishing room.
In the second case, an assembly supervisor was complaining to me about thelack of response to his department’s request for refinished parts when the orig-inal finish was defective. The reorder requests were logged into a sophisti-cated software application that controlled and tracked the finishing process.The software transmitted the request to the area where parts were loaded ontothe conveyor to the finish room. There, replacement parts were to be pickedand put on the line or the originals reworked and then sent through the processagain to be refinished. The finishing process was located, as with the first exam-ple, on the other side of a wall and fed by a loop of overhead conveyor.
Despite the sophisticated software network, orders frequently got lost some-how, usually because of human data entry error at the ordering or load sta-tions. The outcome was that incomplete units languished in the assemblyarea’s repair bay. Worse, they sometimes were forgotten in the press of otherwork, until their ship dates had passed. All involved had repeatedly beenadmonished to be careful when keying information into the system, but mis-takes kept happening.
Converting a Problematic Computer System to aSimple Visual System
The supervisor never knew when to expect his reorders. Whenever he thoughtabout it and was nearby, he would find the unload/reorder person and ask

57
VISUAL CONTROLS
him or her “How are we doing on refinish?” The operator would dutifullyquery the database. Sometimes the information was accurate, and sometimesit was not. After listening to the supervisor about this specific frustration, Iasked him to think about how a visual control might help. He told me healready had a slick computer system, but it did not seem to be doing him muchgood. We walked around the area for a few minutes and noticed paperworktaped to racks holding kits of parts in the so-called “bone yard,” the areawhere kits missing pieces were parked to wait for arrival of reordered parts,so they could be moved into the assembly process. The finish line softwareprinted the paperwork for each reorder. The operators taped it to the appro-priate kit rack so they would know where to put the reordered parts when theycame down the line.
In a few minutes, the supervisor figured out that he could print duplicates ofthe reorder paperwork, write on it the date and time of the reorder, and placeit on a board with a row for each day of the week. He implemented thisprocess the following day using adhesive-backed clear plastic pockets2
mounted on a board at the reorder station. At our next gemba walk, he wasgrinning from ear to ear as he showed me the visual reorder tracking board.At a glance he could tell what parts his area was waiting for, when they hadbeen reordered, and whether they were overdue. He no longer had to bughis unload/reorder person for status of his reordered shortages or worryabout losing track of units awaiting parts in the repair bay.
Soon after that he bought a two-way radio so the person working theunload/reorder station could check with the load station on parts that wereclose to overdue. The original board had a row of pockets for each day ofthe week. If parts got delivered by the next day, that was a big improve-ment. In its current version, the board’s array of pockets reflects anexpected four-hour turnaround. The label on the pocket for reorders placedbetween 7:00 and 7:59, for example, shows its orders should be deliveredby 12:00. If the reorder paperwork is in the pocket after 12:00, it is easyto tell it is late! (See Figure 4.8 and 4.8a.)
2. Two sources for a variety of plastic pockets are Storesmart.com and Associatedbag.com
Refinish Reorder Board
In 5:00–5:59
Due by 11
In 6:00–6:59
Due by 12
In 7:00–7:59
Due by 1
In 8:00–8:59
Due by 2
In 9:00–9:59
Due by 3
In 10:00–10:59
Due by 4
In 11:00–11:59
Due by 5
Monday
etc.
Figure 4.8. Detail illustration of tracking board for “re”-processes

58
CREATING A LEAN CULTURE
This kind of tracking and the feedback it prompted throughout the process iswhat resulted in the dramatic improvement in turnaround time. The improve-ments were not difficult to make; they simply had not previously been identi-fied and documented.
As to the computer networks involved in these two examples, I do not intendto make them out to be the bad guys. In the first case, we had not learned touse the information in the network. The mere presence of precise informationin a database that could generate reports seemed to be all anyone was inter-ested in. The multiple reports enabled managers in different (interdependent)departments to argue with and point fingers at each other when things werenot going well. In the second case, we learned to get the information out ofthe network and visually display it in a way that made it far more useful forcomparing expected versus actual and focusing on the process. Those stepsultimately drove significant improvement in the reorder process.
This kind of visible tracking of performance between two processes applies asreadily to processes within the same building or in the same company as itdoes to expected delivery times from suppliers. In many cases, the ability todistribute information across a computer network is valuable. But remember,just because information is held in databases does not mean it cannot also besimultaneously visually displayed and managed. That is always a desirableoption from the point of view of the lean management system.
On this refinish andreorder tracking boardorders are expected to bereturned complete in 4hours. This photo is from10/27. For the day10/26, an order was putin the system between 11and 12 pm. A duplicatecopy of the order wasprinted and put on theboard in the slot indicatingit is due back complete by4 pm that day, but theboard shows it is late. Tworeorders are on the boardfor 10/27. Reorder per-formance is visible with aglance at the clock and atthe board.
Figure 4.8a. Photo of a refinish-reorder tracking board

59
VISUAL CONTROLS
Non-Cyclical Process TrackingProduction is the most important process in a production operation. But with-out attention to its supporting processes, production will be uneven, unpre-dictable, and unreliable. In a lean operating environment, production is expectedto operate at an even, predictable pace, running directly or indirectly at takt time.That means many things are predictable:
• Material arrives at the point of use in a predictable manner when itis needed.
• Quantities in containers and number of containers in supermarketsare as defined.
• Routines for handling kanban cards or other signals are accuratelyfollowed.
• Equipment is available to run when expected, operates predictablywithout unplanned down time, and produces components to speci-fication without defects.
• The tools, equipment, and supplies needed at any workstation areeasily verified as being in their designated places unobstructed byclutter or debris.
These are examples of some of the processes that must operate effectively forproduction to run in a stable state. In lean management, each process should havea primary visual control, such as a visible signal that daily maintenance and clean-ing tasks or longer-interval preventive and predictive maintenance procedureswere performed. In addition, each of these processes should also have a second-ary check, or verification that what was to be done was actually performed.Secondary checks are often items in team leaders’ or supervisors’ standard workor items reviewed in regular weekly audits of, for example, pull system wellness,5S, TPM, or safety to name a few.
These important chores are unglamorous, to be sure. Nevertheless, they aresimilar in importance to the saying: “An army marches on its stomach.” No mat-ter how well trained the troops are, they must be well fed over time to performwell. The same is true by analogy in lean production. No matter how welldesigned the production and replenishment systems are, if they are allowed todeteriorate (a certainty if they are not looked after and maintained) the produc-tion system will run only by fits and starts.
This looking-after and maintenance are important aspects of the lean man-agement system. Here, too, expected performance versus actual execution shouldbe reflected in visual controls that act as the basis for assessment, assignments forimprovement, and accountability for follow-through. As elsewhere, visual con-

trols should be in place even if a database holds and automatically dispensesschedules. Yes, the maintenance department does have a computerized job assign-ment and tracking system. But, how does anyone other than the maintenancedispatcher know that the work is being assigned as agreed and completed ontime?
In one rather sad case, a maintenance department facing budget pressuredecided to reduce its staff and then stretch the intervals between scheduled pre-ventive maintenance. Because the maintenance tasks and schedules, kept in thecomputerized maintenance management system, were accessible only to themaintenance department, nobody was the wiser until unplanned down timeshowed alarming increases and the plant manager began asking questions.
By contrast, consider the difference when the planned maintenance scheduleis kept at the equipment with an easily visible sign-off spot for each date andwork to be performed, plus “go-see” verification written into the team leader’sstandard work. Compliance with the maintenance schedule can be readily veri-fied. Proposed changes in the schedule would prompt discussion between thosewho depend on the equipment and those charged with keeping it reliable (seeFigures 4.9 and 4.9a).
FF1 Support Area 5S Task Board (partial)
Monday Tuesday Wednesday
Complete
Complete
Task
Task
Task
Torsion toolsto shadow
board
Teammember,
area
Tom
Torsionassembly
1. Task cards’ “task” side color coded to match the day, e.g., Tuesday.
2. “Complete” side always green (black in this black and white figure) for at-a-glance monitoring (e.g. Monday).
3. Plastic card slots are color coded and labelled to identify task and specific day’s card color (e.g. Wednesday).
4. Cards are handwritten and highlighted index cards in adhesive-backed clear plastic.
Figure 4.9. Example of visual control board for noncyclical tasks
60
CREATING A LEAN CULTURE
4_Visual_Controls.qxd 3/31/05 3:15 PM Page 60
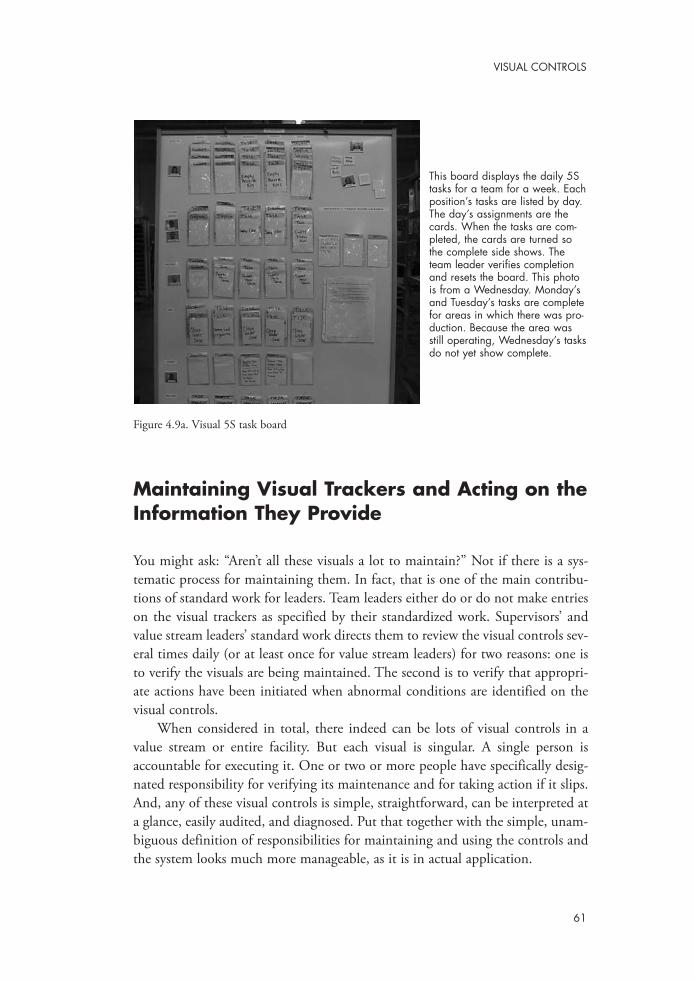
61
VISUAL CONTROLS
Maintaining Visual Trackers and Acting on theInformation They Provide
You might ask: “Aren’t all these visuals a lot to maintain?” Not if there is a sys-tematic process for maintaining them. In fact, that is one of the main contribu-tions of standard work for leaders. Team leaders either do or do not make entrieson the visual trackers as specified by their standardized work. Supervisors’ andvalue stream leaders’ standard work directs them to review the visual controls sev-eral times daily (or at least once for value stream leaders) for two reasons: one isto verify the visuals are being maintained. The second is to verify that appropri-ate actions have been initiated when abnormal conditions are identified on thevisual controls.
When considered in total, there indeed can be lots of visual controls in avalue stream or entire facility. But each visual is singular. A single person isaccountable for executing it. One or two or more people have specifically desig-nated responsibility for verifying its maintenance and for taking action if it slips.And, any of these visual controls is simple, straightforward, can be interpreted ata glance, easily audited, and diagnosed. Put that together with the simple, unam-biguous definition of responsibilities for maintaining and using the controls andthe system looks much more manageable, as it is in actual application.
This board displays the daily 5Stasks for a team for a week. Eachposition’s tasks are listed by day.The day’s assignments are thecards. When the tasks are com-pleted, the cards are turned sothe complete side shows. Theteam leader verifies completionand resets the board. This photois from a Wednesday. Monday’sand Tuesday’s tasks are completefor areas in which there was pro-duction. Because the area wasstill operating, Wednesday’s tasksdo not yet show complete.
Figure 4.9a. Visual 5S task board

62
CREATING A LEAN CULTURE
Benefits of Using Simple Visual Controls Insteadof More Sophisticated Information Technology
From an IT perspective, visual controls might seem like an embarrassing returnto the information Stone Age. Visuals are usually not very snappy lookingbecause they are maintained by hand. People are actually counting things (howmany pieces do we expect in this load; how many are actually in it?) and writingthem down. Have these people not heard of computers and bar code scanners?3
It is true that many leansters are almost reflexively anti-computer, perhapstoo much so. Why? Are we simply hopeless Luddites who never learned to typeor navigate in Access?
Table 4.2 lists comparisons that help explain the advantages of visual dis-plays, and even some advantages of IT solutions. Overall, the lean managementsystem favors hand-completed visual controls because of its bias toward pitch-by-pitch focus on process and the importance of everyone involved in a process hav-ing timely information about how that process is performing. When informationis available to only a select few, whether managers or specialists, only those fewcan take responsibility. Indeed, only those few have the information base forthinking about why the process performed as it did, what the causes of that per-formance might have been, and what might be done to eliminate the causes ofinterruptions or to improve performance from its current level. The followingsections describe these advantages in more detail.
Timeliness of Visual ControlsConsider the first two attributes in Table 4.2. Timely information about processis important for two reasons. First, if the information on the visual tracking isfilled in, it at least means someone is in touch enough with the process to recordits performance. And the information is widely accessible, particularly to thoseworking in the process. Often (and preferably) thanks to color-coding, the infor-mation is interpretable at a glance from a distance of 10 feet or more. (Chapter5 includes a case study where the operators at the far end of an assembly processhad to bring binoculars to work so they could see the production tracking chartand know if they were on or behind pace!)
With information captured by an automated process, the information will betimely as long as the automation is working and data entry has occurred on time.But the information is often not readily available to the people working in the
3. On the other hand, some IT professionals will react positively when taken to a visually controlled produc-tion floor and shown how the visuals actually work. Some will come away impressed with the effectiveness oftools that are so simple, flexible, and inexpensive to create and maintain.
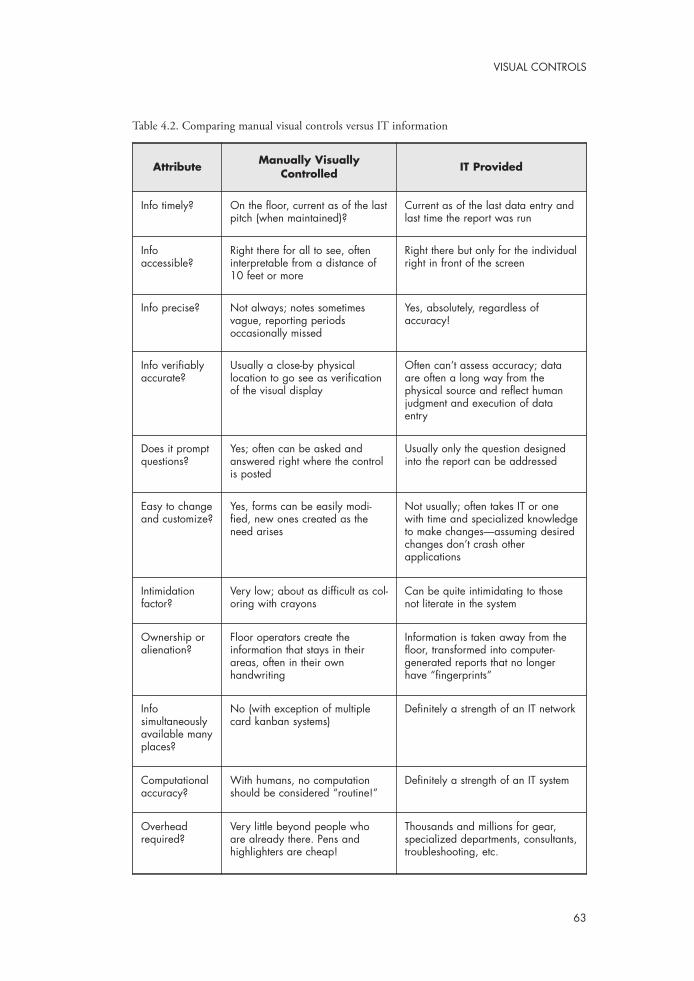
63
VISUAL CONTROLS
Attribute Manually VisuallyControlled IT Provided
Info timely? On the floor, current as of the lastpitch (when maintained)?
Current as of the last data entry andlast time the report was run
Info accessible?
Right there for all to see, ofteninterpretable from a distance of10 feet or more
Right there but only for the individualright in front of the screen
Info precise? Not always; notes sometimesvague, reporting periods occasionally missed
Yes, absolutely, regardless of accuracy!
Info verifiablyaccurate?
Usually a close-by physical location to go see as verificationof the visual display
Often can’t assess accuracy; dataare often a long way from the physical source and reflect humanjudgment and execution of dataentry
Does it promptquestions?
Yes; often can be asked andanswered right where the controlis posted
Usually only the question designedinto the report can be addressed
Easy to changeand customize?
Yes, forms can be easily modi-fied, new ones created as theneed arises
Not usually; often takes IT or onewith time and specialized knowledgeto make changes—assuming desiredchanges don’t crash other applications
Intimidationfactor?
Very low; about as difficult as col-oring with crayons
Can be quite intimidating to thosenot literate in the system
Ownership oralienation?
Floor operators create the information that stays in theirareas, often in their own handwriting
Information is taken away from thefloor, transformed into computer-generated reports that no longerhave “fingerprints”
Info simultaneouslyavailable manyplaces?
No (with exception of multiplecard kanban systems)
Definitely a strength of an IT network
Computationalaccuracy?
With humans, no computationshould be considered “routine!”
Definitely a strength of an IT system
Overheadrequired?
Very little beyond people whoare already there. Pens and highlighters are cheap!
Thousands and millions for gear,specialized departments, consultants,troubleshooting, etc.
Table 4.2. Comparing manual visual controls versus IT information

64
CREATING A LEAN CULTURE
process because computer and network access is required to view it. Few mayhave login privileges or the licenses required by SAP and other software sup-pliers. Or, the computer may be located where only the person operating thesystem can read it. Further, if the information requires manual data entry,such as scanning production paperwork, it may be current only a few timesper shift. Finally, the ability to read the all-important reasons-for-missesentries requires one to be right in front of the screen.
Accuracy Versus Precision of Visual Information Computerized information is highly precise, often notoriously so. Resultsmay be reported out to several decimal places, but based on inaccurate entriesor relatively old data. Especially where reason codes are the basis for record-ing reasons for misses, they may convey a false sense of precision. Indeed,they may convey a view of conditions from the perspective only of the per-son who developed the codes. Coding schemes often lose their bearing oncurrent operations as conditions change. Or, they are checked off quicklywith little consideration for their specific applicability.
When hand-entered reasons for misses are reviewed, it is easy to assessthe quality of information presented. Is the reason a well-crafted problemstatement, such as “light paint on upper inner surface of drawer handles onseries XXX models”? Or is it too vague to interpret, much less to use as a basisfor action, such as “handles” or “paint?” Or, is a reason for interruption miss-ing altogether? This is an instance where a second-level process check canoccur, in this case of the quality of the entries on the visual controls. Thiskind of opportunity is rarely available in automated data collection systems,or on systems that rely on reason codes.
Proximity of Visual ControlsAnother advantage of visuals completed by hand is that they usually are (andshould be) close to the process whose performance they reflect. That meansit is easy to go look at and verify that what is shown on the visual correspondsto physical reality in the production process itself. This ease of verification isanother example of assessing quality of the information in the visual control.
Sometimes it is possible to make the same verification with IT systems,but often the relative scarcity of computers in the production area makes itless convenient to perform a go-see verification or quality check. Worse, thecomputerized system encourages managing the production process from acomputer screen in an office somewhere removed from the actual productionarea. Interestingly, this problem can also occur in supervisor’s offices even

65
VISUAL CONTROLS
when these are little more than a stand-up desk and a computer. When you arefocused on a screen, you are not focused on the process. Either violates the leanmanagement system’s three-part prescription for focusing on process: “Go to theplace, look at the process, talk with the people.”
Flexibility of Visual ControlsIT systems provide powerful analytical tools, without doubt. However, often theanalyses (that is, the questions addressed by the automated systems) are those pro-grammed into the reports that are accessible on the system. Typically, only thequestions addressed in the report can be answered by it. In contrast, questionsprompted by entries on a visual control chart can often be addressed, at least ini-tially right where the control is posted. When that is not the case, for examplewhen a new defect has surfaced, a new control can be easily drawn up to trackand address it.
For example, when a piece of equipment starts malfunctioning, it is easy todraw up a simple downtime log to record instances, durations, and observablecauses or symptoms that can be tallied up or Pareto-charted. Or, when a processstarts to produce rejects, it is a simple matter to start tallying them. Pareto-chart-ing the defects and then taking action on the findings come next, with no pro-gramming or transcription of data required. By contrast, someone with special-ized knowledge is usually required to reprogram an analysis in an automated sys-tem. It might mean getting support from IT, often not a quick proposition, orgetting help from a technical professional in the area who is already working ona full plate of assignments.
Visual Controls and the “Fingerprint Factor”Perhaps it should not be so, but often people in a production operation look pastposted computer-generated reports, even graphic ones, of leading performanceproblems. That is especially true when the data are reported in table format.Managers often do not realize that it takes a trained eye to read and interpretinformation presented in these ways, and production operators often have nothad that kind of training. It is a very different story when the operators them-selves have been involved in recording the data, or working through it in start-upmeetings led by their team leader.
Hand-created data, especially when you know whose hands created it,including the real possibility that the hand was or could have been yours, have amuch lower intimidation value than the crisp, precise-looking management doc-ument someone has posted on your team’s information board. This fingerprintfactor is important. It helps draw people to the information and conclusions from

records they have had a recognizable part in creating. The same is not the casewith impersonal, computer-generated materials, even those with the slickestgraphics.
The Power of NetworksThere are two aspects of information reporting where IT solutions win hands-down. IT networks are excellent tools for broadcasting information to dispersedlocations. A network can readily broadcast the sequence of units starting into thefinal assembly process, so that subassembly operations can produce to the discreteunit in exactly the needed sequence. A version of this is at work every time a cus-tomer places an order at Taco Bell. No finished inventory needs to be held;instead, every order is custom-produced in the proper sequence.
This is a particular application of the golf-ball method of signaling developedin Japanese factories. The difference is that instead of color-coded golf balls arriv-ing at a subassembly station to signal the model or type of unit starting into finalassembly, an electronic signal arrives on a screen or prints as a label at the begin-ning of the subassembly process—just like an order for a bean burrito with nocheese. These are flexible and powerful applications, as long as the server does notgo down!
Case Study: Using Computers to Calculate theNumber of Required Parts
Another application where IT shines is where mathematical computa-tion is required. Computers are far more reliable at simple math thanhumans. Here is a case of a creative, early use of network broadcastsubassembly signals similar to those discussed just above. In this case,the need was to signal the number of drawers that would be neededin final assembly of storage cabinets. The cabinets varied in size fromtwo to five drawers and came in three widths. An early solution wasto hold the drawer bodies, all of which were a standard interior color,in a supermarket on the assembly floor. The drawback to having all thesizes on display was the amount of floor space they consumed and thelarge number needed to guard against stock outs. It amounted to a lotof inventory and a lot of floor space.
The broadcast solution was to send the drawer producing area theinformation on the number and sizes of drawers for cabinets just enter-
66
CREATING A LEAN CULTURE

67
VISUAL CONTROLS
There are applications of kanban systems where the same information (whatpart, how many, which container, etc.) can be broadcast for display at multiplelocations, for example, at the ordering and producing locations. But where kan-ban cards might have to travel a distance (surprisingly short—50 feet—for thisrisk to surface) there is a real danger of kanbans being lost. In these cases, broad-cast transmissions of the kanban information, displaying the kanban at the send-ing (or ordering) end, and printing a copy of the kanban at the supplying (orreceiving) end is the better solution, preserving the advantages of visual manage-ment.
Intangible Benefits of Visual Controls It is probably beyond dispute that asking people to take a few minutes per shiftto record performance data requires far less overhead than the cost of hardware,software, and support resources needed to automate data collection to trackprocess performance. Beyond the financial implications is the “soft” benefit noaccounting system can calculate. These are the benefits from increasing the levelof involvement of operators in observing, analyzing, and improving the processesin which they work every day.
Overall, visual controls not only heighten focus on process and accountability
ing the color application process prior to assembly. Operators wouldcall up the proper screens on the computer and do the math to deter-mine the number of fixed lot quantities of drawers in each size thatwere called for. They would then put a kanban for a lot quantity of thatsize drawer on the priority board. In the course of the multiplicationand division required, the numbers did not always come out right.Sometimes too few drawer bodies of a given size were prepared,sometimes too many.
The solution quickly became apparent: have the computer do the mathand then broadcast the number of fixed lot quantity orders to thedrawer prep area, signaling the operators to put the right kanbans onthe priority board. It was immediately clear that having the computercompute and broadcast was far superior to having the operators callup screens and do the calculations. The result overall was a significantreduction in inventory and floor space and much improved availabilityof the right parts at the right time.

68
CREATING A LEAN CULTURE
for that focus, they also provide the foundation for a far greater level of employeeinvolvement than could any other reporting system. For lean production to trulybe a process improvement system, that kind of involvement is essential.
Summary: Visual Controls and the Data forLean Management
Visual controls are powerful contributors to lean management. Visuals reflect thehuman scale of production activity and process focus. They connect people totheir processes, and at the same time reflect adherence to the process—or its lack. Indoing so, visuals represent an important, simplifying addition to lean management.
Visual controls help transform the abstract concept of discipline in lean man-agement into directly observable, concrete practices. Actual versus expectedmoves from the realm of an idea to easily interpreted visual tracking tools. Visualcontrols are the basis for comparing actual versus expected performance in leanmanagement. They do not make the comparison, but they make the comparisonpossible. Visuals are a principal vehicle for focusing on process, and for verifyingthis important aspect of lean management. The variety and application of visualcontrols are limited only by your imagination. Which visuals to use and where to usethem are determined by the needs, both stable and emerging ones, in your processes.
The actual appearance of visual controls is relatively unimportant beyondbasics of legibility and ease of interpretation. I have seen both plain and fancyones work equally well or poorly. What is important about visual controls to you,the leader at any level, is that you understand the reason for having them. Byinsisting through your standard work that the visuals are maintained and current,visuals constantly reinforce the focus on process. This focus makes it easier to seethe contrast between expected and actual process performance. By doing this,visuals allow you to identify opportunities to press for improvement.
At first glance, visual controls may look like an afterthought or mere windowdressing to the serious business of lean technical design. In fact, visuals providethe basis for much of the “management”—process focus, discipline, and account-ability—in the lean management system. Neither aspect of lean, technical designor management system stands well without the other; visual controls contribute sub-stantially to the robustness of lean management and through it, lean production.
Finally, visual controls in lean do not always mean the absence of IT tools,but the immediate, accessible, flexible, inexpensive, and responsive nature ofvisual controls makes these simpler solutions the preferred ones for most applica-tions in lean operations.

5Daily Accountability Process
A daily accountability process is the third principal element of the lean manage-ment system. It provides the steering wheel, that is, the task assignments made bythe meeting leader for what improvements will be worked on. It also provides thethrottle, or the due date and resources for the improvement task. This chaptershows how to implement daily accountability through daily meetings and visualcontrols, with case studies to guide the way.
At first glance, this component of lean management seems designed simplyto ensure follow-up on task assignments made in response to yesterday’s problemsor opportunities for improvement. A more significant (though less obvious) pur-pose of daily accountability is to reinforce the lean management system’s focus onprocess and through it, to identify and implement opportunities for improve-ment.
How Batch Production Differs From Lean
In a batch world, the object is to meet the schedule. Leaders are expected to fash-ion workarounds to get past problems that threaten schedule completion. Thereis little follow-up because the task is the same the next day: Do whatever it takesto meet the schedule. In a lean world, the focus is on maintaining and improv-ing the process. Follow-up in lean management calls for understanding the causesof yesterday’s problem and then eliminating them.
In a batch system, you ask: “Did you meet the schedule?” That is pretty
69
much the sum total of your daily accountability. In a lean system, you ask: “Whatcaused the problem that interrupted the process, and who will do what to resolveit?” Where batch systems have structured processes to deal with daily shortages,for example, lean management’s structured process deals with daily accountabil-ity for making process improvements that eliminate the causes of shortages.
Lean management is all about focusing on the process: stabilize it, standard-ize it, and improve it by exposing problems, eliminating them, and repeating thecycle over and over. Visual controls are a key in making it easier to see quickly thestatus of your processes and the problems that interfere with them. The design ofstandard work for leaders, slightly overlapping and redundant, is intended toensure the visuals are maintained in the first place, and acted on after that.
So in addition to including regular checks on the status of visual controls,leader standard work also includes a process to follow up on the stories told bythe visual controls. This is the daily accountability process. In it, leaders assess themeaning in the visuals, assign appropriate responses, and hold people account-able for completing their assigned tasks. This follow-up process occurs largely inthe structure of daily three-tier meetings. In this way, the three principal elementsof lean management combine to form the essence of the lean management sys-tem. Leader standard work, visual controls, and the daily accountability process,plus the discipline by leaders to maintain the integrity of these three form theheart of what makes lean management go.
Three Tiers of Daily Meetings
The daily accountability process takes place as an interlocking set of three brief,structured, daily meetings, one of which is the familiar, but often misunderstood,team start-up meeting. Each of these meetings is an explicit example of lean man-agement’s focus on comparison of expected and actual.
As the name suggests, there are three tiers of meetings:
1. The first tier (first, because it typically happens at the start of theshift) is the production team leader meeting briefly with the teammembers.
2. The second is the supervisor meeting with his or her team leadersand any dedicated support group representatives.
3. The third-tier meeting is the value stream manager or equivalentmeeting with his or her supervisors and support group representa-tives or staff members.
70
CREATING A LEAN CULTURE

4. A fourth tier is possible where the plant manager meets with his orher production and support staff members.
Each of the meetings shares these characteristics:
• Brevity—rarely if ever longer than 15 minutes
• Posture—standing up
• Location—on or immediately adjacent and not physically separatedfrom the production floor
• Agenda and content—defined by a visual display board
The second- and third- (and fourth- where applicable) tier meetings have adual focus. The first is on “run-the-business” activities. The second is on activityintended to improve the business. These meetings are among the main occasionswhere the increased accountability that comes with visual controls can be seen.Accountability and disciplined adherence to process are central to a daily enact-ment, primarily at the second- and third-tier meetings, of a three-part process:
• Assessment based on data captured on visual controls,
• Assignment for corrective action and/or improvement, and
• Accountability for having completed the previous day’s assignments.
Far from the daily bureaucratic burden of typical recurring staff meetings,these second- and third-tier daily stand-up sessions are highly structured with thefocus on building accountability and taking action to resolve problems and driveimprovement. The first-tier team leaders’ meetings are, among other things,the primary vehicle for supporting and extending bottom-up participation inimprovement suggestion systems. In the case of all three (or four) tiers of meet-ing, information and accountability for performance are clearly, graphically, andvisually displayed.
The daily three-tier meeting structure itself is something of a visual control.The meetings take place on the production floor standing up at the informationboard for the appropriate tier. The board is the location, agenda, and content forthe daily meetings. The agendas and roles are standardized. The meetings arebrief, not exceeding 15 minutes for the third tier. The team leader, supervisor, orvalue stream manager leads their respective meeting.
The first agenda item is always the day’s labor plan. At the first-tier meeting,this item is addressed as a visual display of the starting positions and other assign-ments for the day. Did all team members who were expected show up and checkin at the team meeting? If not, who goes where to get production started? Atthe department meeting, if unplanned absences are interfering with the start of
71
DAILY ACCOUNTABILITY PROCESS

production in one of the production teams, how can we shift people among areasquickly to bring production up to the day’s planned rate? Similarly at the valuestream, has any department been unable to balance labor with the day’s plannedwork? And if so, what redeployment can be made at the value stream level to getthings running as planned? Beyond that, the agenda and scope expand going upthe tiers, as described next.
Tier One: Team Leader and Production CrewThe focus at the production team’s meetings is mostly on today’s assignments andany items of special note that day. The daily rotation and labor plans for the area(described in chapter 9) are on display at this meeting, so people can check theirassignments before work begins. The team leader updates yesterday’s perform-ance, covers any items of note from the previous day, and reviews today’s plansand any issues. The team board may display summary project plans (objectives,current and planned future state, indicators of success, timeline, members) for
Case Study: Displaying Actual Finished Goods inUnits or by Dollar Value
In a cabinet assembly area, there were two parts to the main assem-bly line. The cabinet cases were built up at the head of the line andthen moved in FIFO sequence into a queue between case build-up anddrawer assembly, insertion, and final assembly. (In a later refinementof this layout, the drawers are assembled and inserted as the casesare built up, all in the same line.) The whole process was designed torun at a takt time of 36 seconds, producing a completed cabinet every36 seconds. A production-tracking chart was used to keep track of theline’s pace every half hour. The team leader took the number of fin-ished units from the counter at the end of the line, wrote that numberin the “actual” column for the time period in question, then picked upa highlighter and color coded that period’s actual:
• Green signified having met the takt pace.
• Yellow meant missing it by five percent or less.
• Red meant the line had missed the takt pace by morethan five percent.
(In the refined design, only red and green are used.)
72
CREATING A LEAN CULTURE

DAILY ACCOUNTABILITY PROCESS
significant externally supported activities going on in the area. And, on desig-nated days of the week, specific topics might receive special focus. These couldinclude, for example, safety, quality, 5S audit results, status of ideas suggested byteam members for improving processes in the area, or other topics.
Especially for this meeting, the principle of “pull” communication is impor-tant to observe.1 That is, it is easily possible to provide far more information thanteam members are interested in or prepared to act on at any given level of systemmaturity. These meetings are not intended to become one-way “communication”conduits for the organization. They are intended to be a place where team mem-bers feel free to raise questions and concerns and where team leaders and others
1. The idea of pull communication is in comparison to what might be called “push” communication. In leanterms, when a supplying area produces regardless of the needs the consuming areas it feeds, it is said to be“pushing” inventory into the system. When the supplying area produces in response to signals to replenishwhat has been consumed by the customer process, it is producing to a “pull” signal. So, pull communicationis an approach in which many of the topics and message content is determined by the expressed needs, or“pull signals” from the audience. For a further discussion, see David W. Mann, “Communication duringchange,” Target 19(1): 30-33, 2002.
73
The drawer assemblers were separated from the head of the line byabout 50 feet. The production-tracking chart was beyond the head ofthe line, far enough away that the drawer crew could not see it. Oneday the value stream manager noticed a pair of binoculars in thedrawer assembly area and asked about it. One of the operators toldhim they were unable to see the color code on the pitch chart becauseit was too far away, so an operator brought in the binos to be able totell how the line was performing.
In a similar case, team members in a shipping department used to paylittle attention to the posted information about the dollar value of aday’s shipments. When the team leader switched to writing the aver-age dollar value shipped per team member and a goal, the operatorsimmediately began to pay attention, becoming interested in trackingtheir performance at several points during the day.
Few of us would participate in a competitive game without keepingscore. Most people who come to work every day have at least a latentinterest in knowing how they or their team performed. That interest isa pathway to what motivates them. It is worthwhile to reflect thoseinterests with items on the team’s tier one board.
74
CREATING A LEAN CULTURE
respond or do the investigation necessary to provide a response. Yes, some corpo-rate news is passed along as well, but team members have an active role in put-ting topics on the information sharing part of the agenda.
Where there are not yet well-defined or well-understood reasons for main-taining team information boards, it is common to see the boards, even elaboratelydesigned ones, festooned with printed copies of emails, often weeks or monthsold, and hung with Excel output; spreadsheets, charts, and graphs. That is usu-ally a sign of confusion over the purpose of the board. By contrast, employees willmake it clear when they are interested in information that reflects their perform-ance. The binoculars case illustrates that as well as any I have seen.
Tier Two: Supervisor and Team LeadersThis meeting, led by the supervisor, focuses on two topics: running the businessand improving the business. Information on the departmental team board typi-cally includes status of key processes and equipment as well as week- or month-to-date summary performance data on safety, quality, delivery, and cost. Teamleaders bring their production-tracking charts from the previous day and postthem on the designated spot on the information board. The board is also likelyto display the previous week’s top three problems, their magnitudes, and actionsunderway to resolve them.
The initial items on the meeting agenda are similar to those from the teamleaders’ meetings: noteworthy items from yesterday and upcoming issues for todayas well as updating the trend charts on the board. The focus then shifts to the pro-duction-tracking charts. It is important for the supervisor and his or her team lead-ers to understand each missed pitch reflected on the tracking charts. These will bethe subject of further discussion at the third tier, or value stream meeting where theproduction-tracking charts will be scrutinized again. The supervisor knows tobe prepared to describe what happened; what actions, if any, are underway inresponse; and whether s/he needs support from anyone at the third tier meeting.
The second topic, improving the business, involves a visual task assignmentboard. This is a matrix of rows, one for each meeting participant’s name; anddates, usually a week or two labeled day by day. The supervisor makes assign-ments to the team leaders and any support group reps in response to needs iden-tified from the production-tracking charts and from the other improve-the-busi-ness tools that are regular features on the meeting agenda. The supervisor writesthese assignments on small cards or Post-It® notes and places them on the boardon the due date for the person assigned. The supervisor’s weekly gemba walkswith the team leaders can result in assignments, as can less formal observations inthe area, ratings on regular audits (such as 5S, supermarket status, safety), andactions assigned to the supervisor at the third-tier meeting or on gemba walks

75
DAILY ACCOUNTABILITY PROCESS
with the value stream leader.
The red dot, green dot convention. At each day’s meeting the supervisor reviewsthe tasks due that day. S/he works down the column for today’s date, asking foreach assignment in today’s column if the task is complete. If it is, the supervisorputs a green self-adhesive (“sticky”) dot on the Post-It® note. If it is incomplete,the supervisor pursues the reason enough to get a clear understanding, asks whenthe expected completion date will be, negotiates about that if necessary, and putsa red sticky dot on the Post-It® note. S/he leaves the assignment on its originaldue date. The first assignments to be reviewed in this part of the meeting arealways those that are overdue (see the dots on Figure 5.1).The original due dates for assignments are never changed, nor are the assignmentPost-Its® ever moved from the original due date. And, the red dot/green dot con-vention is absolute and arbitrary. Complete is complete; overdue is overdue.Period. When tasks are completed, the meeting leader puts a green dot next tothe red one. Lots of red dots accumulating on daily task assignment boards inviteimportant questions. Are we over-estimating our capacity to get assignmentsdone? Should the meeting leader consider adding more capacity, better focusingexisting capacity, or recalibrating his or her estimates of what is entailed in a day’simprovement task? Are tasks being kept from completion by impediments exter-nal to the area? If so, should the meeting leader or a designated other investigate?External issues sometimes need to be brought to the next higher tier for investi-gation, support, or resolution.
Think of the red dots on task assignment boards the same way you think ofreasons for misses on a production-tracking chart. Their purpose is neither shamenor blame; rather they highlight a gap between actual and expected. In the rela-tively rare case, red dots will accumulate because someone is either incapable orunwilling to get his or her assignments completed. That becomes a matter for aperformance discussion with the individual involved. Most of the time, some-thing unexpected has happened or the planned cooperation of an external groupor person has not come through. If the dots form a pattern over a week or more,the meeting leader will definitely want to investigate.
Stating that red dots do not represent an individual failure is easier to saythan to hear. Even assigning visible, public accountability for completion dates isenough to make many uncomfortable at first. That is why it is important toemphasize the arbitrary nature of the green/red rule. Things do happen that areoutside any individual’s control; that is the most frequent cause of red dots.
Day-to-day project management. To be effective in the daily improvement segment of the three-tier meetings, the meeting leaders (supervisors and valuestream leaders) need at least rudimentary project management skills (a topic

76
CREATING A LEAN CULTURE
Mar
k (V
SM)
Jane
(Sup
ervi
sor)
Pabl
o (S
uper
viso
r
Chr
is (S
uper
viso
r)
Robe
rt (S
uper
viso
r)
Shau
n (S
uper
viso
r)
Shar
on (E
ngin
eerin
g)
Shie
la (E
ngin
eerin
g)
Sylv
ia (P
IC)
Joe
(Mai
nten
ance
)
Will
ie (Q
ualit
y)
Jam
es (L
ean
Lead
er)
43
65
710
1211
1413
1817
2019
2124
2625
2827
31
Daily
Task
Acc
ounta
bili
ty B
oard
: Fa
ctory
1
Not
e: C
olor
cod
es a
re u
sed
to in
dica
te ta
sks
com
plet
ed o
n tim
e or
not
. In
this
bla
ck a
nd w
hite
exa
mpl
e, b
lack
sta
nds
for r
ed,w
hite
for g
reen
.
Date
Mem
ber
Today
Res
olve
APE
Xre
usable
tote
issu
e
Plan
tore
solv
efi
xtu
reis
sue
statio
n 4
Clos
eou
tk
aiz
en#37 o
f4/2
Post
PFE
Pat
pch
ssu
per
-m
ark
et
Figure 5.1. Daily accountability board
5_Daily_Acct_Process.qxd 1/10/06 11:53 AM Page 76

77
DAILY ACCOUNTABILITY PROCESS
touched on in chapter 7). That is, the leaders must quickly perceive the series ofstep-by-step actions to attack a flow interrupter or develop an improvement. Thisskill, the ability to see an implicit work-breakdown structure, is necessary to makeappropriate one-step-at-a-time task assignments that cumulatively respond to theinterruption or opportunity. Follow-up on these task assignments is straightfor-ward with the visual daily task board on which the assignments are posted.
Boards like this one showyesterday’s pitch attain-ment and other visualcontrols for performanceappropriate to theprocess. They also dis-play yesterday’s entry ontrend charts for safety,quality, delivery, and per-formance. Any of thecharts can promptprocess improvementassignments. These caninclude assignments onthe daily task board,orresult in a problem-solvingor project assignment.
Figure 5.1b. Photo of a daily “run the business” board for a focus factory
Figure 5.1a. Photo of a daily accountability task board
This photo is from Oct.27, the date marked bythe dark index line. Theassignments from earlierin October have beenremoved. The board’smagnetic date numberswill be reset for Nov.when the month turns.Green/red coding isdone here with markers.The dots are visible onincomplete assignmentstransferred from Oct. toNov. The color codingmarkers are held on theboard by magnetic tape.The names of the valuestream manager, supervi-sors, and support groupreps. appears the left.

78
CREATING A LEAN CULTURE
Tier Three: Value Stream Leader With Supervisors and Support GroupsThis is the daily value stream meeting at the value stream board. At this meeting,daily performance data are added to trend charts covering the typical dimensions—safety, quality, delivery, and cost—along with any others important to the area.
The value stream manager briefly reviews the day’s staffing situation and thentouches on yesterday’s performance measures. Items of note are covered regardingpast performance or upcoming items. Next, the value stream leader turns to yes-terday’s performance tracking charts. S/he scrutinizes them for completeness,misses, and the reasons why. Based on the data, s/he makes and posts assignmentsfor action. The last part of the value stream meeting is a review of overdue items
Case Study: Red Dots Indicate Incomplete Work—But They Don’t Show the Reason
Consider these cases illustrating the rule of arbitrary green/red assign-ment. The lean leader in a plant had an assignment on the task boardto deliver a lean-related training session to a group in the plant at 2pm on a Monday. At 1 pm that day, a fire broke out in the dust col-lection system for an aluminum grind-and-polish operation. Much ofthe building filled with white smoke. The plant and offices were evac-uated for several hours, thoroughly disrupting the day’s planned activ-ities. Needless to say, the lean leader was unable to deliver his train-ing session. What was the result at the next day’s task review meet-ing? He got a red dot!
In another case in the same facility, the operations VP began using avariation on the task assignment board to post and track projectsassigned to his staff members. The assignment matrix was ruled off byweeks rather than days, reflecting the meeting’s weekly schedule aswell as the scope and scale of the projects. The tasks on the Post-Its®
were the projects’ agreed-to weekly milestones.
The staff members liked the system because they could readily tellwhat all the projects were, and whether and when a project wouldhave an impact on someone else’s area. These were longer-term proj-ects that usually extended over 60 to 90 days or more. Recognizingthat, project owners were allowed to move milestone tasks from week
79
DAILY ACCOUNTABILITY PROCESS
still pending and assignments due today. This proceeds in the same way for thevalue stream as for the department, except all the value stream’s support grouprepresentatives are regular attendees at the meeting and are potential recipients ofassignments.
In an example of process trumping structure, the value stream leader acts asthough the support group representatives report to the value stream. In someplaces, they do; in others, they do not. The leader makes assignments directly tothe support group members and holds them directly responsible for getting theirassignments completed on time. If issues arise in these relationships, the valuestream leader takes them up with his or her peers on the plant staff and the plantmanager. As organizations become better educated and aligned about lean as anoperating philosophy, the priority of functional projects rarely overrides immediate
to week for milestone dates more than a month from a given week’smeeting. Milestone dates within 4 weeks of the meeting day werefrozen so actual versus expected could be seen.
The staff member in a recently created position, responsible for sourc-ing materials and purchased parts, had several projects involving sup-pliers. These responsibilities had gone untended prior to filling the newposition. Many of the sourcing staffer’s project milestones collectedred dots week after week as he pursued negotiations with the supplybase on quality, cost, consolidation, lot size, and delivery frequency.
After using the new visual weekly project tracking system for severalmonths, the VP and staff came to the conclusion they had underesti-mated the time it would take to conclude these projects. They agreedto “refresh” the board using the information gained from the actualversus expected red dots to reset expectations for how long this kindof work was likely to take. The sourcing person had been doing excel-lent work, the likes of which the company had never undertakenbefore. The operations staff as a whole was going down the learningcurve together in this area. There was never a hint of blame, shame,or recrimination arising from the red dots; instead, all involved treatedit for what it was, a valuable learning experience. Coincidentally, thisexperience of the senior operations staff was a powerful example forcalming the anxieties of their subordinates, who were about to begingetting daily task assignments and green/red follow-up coding.
intervention on matters that threaten the expected flow of production or hold upmeasurable process improvements in daily operations.
Daily Accountability Exposes and Solves Problems QuicklyIn the case involving drawers and locks example, the lean production processexposed problems that used to be covered up by rework occurring at essentiallyuntimed workbenches. The lean management system provided the tools and set-ting to get the problem resolved in a quick and accountable fashion.
Further Note on Task Assignments and Follow-upThe supervisor at the department board and the value stream leader at the valuestream board are free to make assignments from sources other than reasons formisses on the production-tracking charts (as noted earlier in this chapter).Gemba walks with individual leaders, results of routine audits, and the leader’sobservations of the area can all result in task assignments. But assignments are notnecessarily a one-way street. Subordinates or support members can bring requestsfor help or support to the meetings. In effect, they ask the supervisor or valuestream leader to assign tasks to himself or herself where those tasks are best car-ried out by one in a position of more authority or with access to more or differ-ent resources.
Case Study: Support Groups Can Help SolveLong-standing Problems
An outstanding example of support groups responding to the needs ofthe value stream occurred in a case in which a product line wasadded to a recently formed mixed-model progressive-build flow line.(This was the same cabinet assembly line where the operators in thedrawer area brought in binoculars.) The product line in question hadbeen fabricated and assembled in a different plant since its introduc-tion a dozen years earlier. In its original plant, individual operatorsworking by themselves assembled units at workbenches, building thecabinet complete from start to finish. Now, the units were being builton a balanced, takt-paced assembly line. When more than one or twoof a particular model of these units came down the line, things stalledbadly. The production-tracking chart showed missed pitches for theentire run of these products.
80
CREATING A LEAN CULTURE

81
DAILY ACCOUNTABILITY PROCESS
In the third-tier meeting when the value stream manager focuses on yester-day’s visuals and asks for explanation, s/he sends a powerful message about focus-ing on the process. When s/he makes task assignments to respond to misses oropportunities to improve, s/he sends a powerful message about the importance ofcycle-by-cycle performance and improvement. And, when red-dotted items areasked about in the meeting, it sends a powerful message about taking action,NOW. What happens, or fails to happen in these meetings has widespread effectson what people in a value stream come to think of as important. Two contrast-ing cases illustrate this point.
It’s Not About the Boards!
It is not unusual to hear people say they want the visual elements in the lean man-agement system to have a consistent look, “…so when people move from area toarea or plant to plant, everything looks the same.” In fact, the appearance ofinformation boards and other examples of visual controls is far less importantthan how they are used. What’s important is leaders’ commitment to establishingstandards and expectations; using tools to identify expected versus actual; and fol-lowing through on what they find.
The cause of the flow interruptions was well known to those who hadpreviously worked with the product. A particular style of drawer didnot fit correctly and the cabinet’s lock mechanism was balky. Each ofthese problems required extra work to make the units fit and functionproperly. When the units were bench-built, these models just took alittle more time. The individual builders knew how to make the repairs.On a line paced at a 36 second takt time, these deviations causedmissed takt cycles every time these problematic units came downthe line.
At the value stream meeting the day after this problem emerged, thevalue stream leader assigned engineering and quality to deliver forthe next day a plan to resolve the problems. They did so and wereassigned to carry it out. Within two weeks, both problems of a dozenyears’ standing were permanently solved; the units now run smoothlydown the line at takt time regardless of drawer style and whether ornot locks are called for.
Every application of the principles that drive visual controls is an inven-tion—for example:
• forms or charts,
• a units-produced counter,
• bicycle flags identifying minimum and maximum levels in a queue,
• audible alarms,
• beads strung on a wire, as in billiards scorekeeping, to representaccumulating demand in a subassembly or feeder area, or
• tags on an inclined track or in pigeonholes.
Two Case Studies: Ignoring Team InformationBoards Versus Using Them to Improve
In the first case, team information boards had been established foreach team leader’s area as part of an important new product’s show-case lean production area. The boards were neat and uniform, andlots of emphasis was given to keeping the entries on them current; thearea had lots of visitors from VIPs and customer groups. So, the teamleaders all learned the importance of maintaining their boards and dida good job of keeping the entries current, including the entries on theirproduction-tracking charts.
As with many new product introductions, the design for the productionprocess had looked good on paper. Once it was installed and oper-ating, it became apparent that several aspects of the process shouldbe changed. Project teams were formed to make the changes, and thearea’s performance improved. In fact, virtually all of the changesmade in the area for its first 18 months of operation came from proj-ect teams working on fairly substantial changes to the layout.
Near the end of this time, I happened to ask a team leader what hethought of the information board he so dutifully maintained. Hesnorted and said derisively that the board was a joke. He had beenrecording reasons for misses for nearly 2 years, he said, and not a sin-gle thing had happened as a result. He still faced the same problemsday in and day out regardless of how often he wrote up problemsin the reasons for misses section of his production-tracking charts.
82
CREATING A LEAN CULTURE

Insisting that every visual control should look like every other one misses thepoint. Yes, processes need to be systematic and standardized and the visuals needto fit these criteria as well. However, what is most important about visual con-trols is that leaders are committed to using them effectively. Where local processcharacteristics dictate varying from a visual standard, so be it.
Early on in the use of team information boards, one plant manager saw aboard he liked (it had been carefully measured and put together, labels and datenumbers had been engraved at a sign shop, and the whole thing was impressiveto see). He ordered copies for each of the value streams in his plant and decreedthat all value stream leaders begin using them immediately. (It is worth noting
83
DAILY ACCOUNTABILITY PROCESS
“I’m going to quit filling the darn thing out,” he said. And he did.Nobody said a word to him about it until a new value stream man-ager and supervisor were named for the area. Until that time, the mainfocus had been “hitting the number” for schedule completion and cost.Although this plant has performed satisfactorily, there is a sense that itcould be doing better than it has.
In a contrasting case, I was touring an assembly area in a plant thathad undergone and continued to undergo changes designed to makeits layout and processes leaner and leaner. The plant lean team hadintroduced production-tracking charts and the daily accountabilityprocess recently, as part of a lean management implementation. Istopped and asked an operator (who had no idea who I was) if shehad a production-tracking chart. She said she did and showed it tome. It was filled out, noting where production had missed its hourlygoal and a reason why.
I asked her what she thought of the chart. Her face lit up as she pro-ceeded to tell me what a good thing it was. “We’ve written downthings that have frustrated us forever,” she said, “and they’ve beentaken care of, just like that! It’s a lot better around here now with theseforms,” she said. When I looked at the department’s informationboard, I could see the list of top three flow interrupters and actionsunderway to resolve them. Clearly this was an area that paid atten-tion to the health and improvement of its processes. This plant hasbeen outperforming its goals at the same time it has been absorbingsubstantial change.

that his background included significant responsibilities in national-brand,multi-plant, continuous process operations. In his prior experiences, everythingwas standardized across sites.)
As it turned out, the design of the board’s daily task accountability matrixwas a winner, duplicated elsewhere. The rest of the board was very much a firstdraft, though cosmetically pleasing. Most of it has been revised. The copies thatwere ordered were soon festooned with paper charts, some of which were there atthe direction of the plant manager after he realized the design he ordered did notreflect the data on which he wanted his value stream managers to focus.
Standardization is generally a good thing; standardizing before having hadenough experience to work the bugs out of a design is not. If you are able to viewas experiments the different approaches to even the same visual controls, you pre-serve an appropriate sense of learning by experience. In addition, allowing localexperimentation gives leaders who have never before worked with visual controlsthe experience of having to think through what they want to measure and track,and why. That is valuable indeed.
As the experiments proceed, enough of a consensus will emerge about whichdesign elements have proved the most useful to incorporate into a standard alongwith expectations for how the visuals should be used. That is the time to stan-dardize. Keep in mind, however, that standards reflect only the current best prac-tice. As further experience and insights accumulate, expect, indeed, encourage thestandards to change as a reflection of improvements.
The “Vacation Paradox” and Capacity forImprovement
Lean production is fundamentally an improvement system, but getting it to workthat way can be difficult. Suppose you have a limited number of engineers andother specialists available for assigning to projects. You may wonder how all thesecontinuous improvements will come about. As it turns out, the answer is in thelatent capacity for improvement, developed in the daily task assignments in thesecond and third tier of the three-tier meeting structure.
Supervisors who came up through a batch-and-queue system will usually tellyou they have no time during the day to do anything but fight fires and expedite.As the lean conversion stabilizes, and especially as supervisors begin to followtheir own standardized work, they find themselves spending less and less timefighting fires. And, their standardized work not only makes it clear what they aresupposed to do, by implication it makes it clear what they are not supposed to
84
CREATING A LEAN CULTURE

85
DAILY ACCOUNTABILITY PROCESS
do. That is, they are not supposed to be running here and there doing the jobs ofquality, material supply, and engineering. Instead, they are supposed to use thosecell phones and two-way radios to notify their support groups when things gowrong outside their production area.
Overall, this has the effect of freeing chunks of time in their daily routine.Standard work only accounts for about half of a supervisor’s time, and even teamleaders have about 20 percent of their time available and unassigned in their stan-dard work. The intent is to put at least some of this time to use on activities toimprove the business. The source of these activities comes from the daily taskassignments made at the daily three-tier meetings. All of this provides the vehiclefor transforming the 100 percent run-the-business focus to a shared one thatincludes regular work on process improvement.
These small, one-step-at-a-time daily assignments give production leadersthe experience of doing more during the day than just running the day-to-daybusiness. Many production leaders have had little or no experience with projectmanagement. The daily task assignments represent project management workbreakdown structures on a small scale. These assignments show how small stepscan lead to significant outcomes when disciplined accountability for execution ispart of the picture.
Besides that, leaders learn that these steps can easily fit into a daily schedule,especially when an area is operating in a stable state. Further, these cumulativeimprovements frequently do not require teams of technical specialists. I have a namefor this phenomenon of suddenly having the time to do more, to work on improve-ment steps in addition to run-the-business activities. I call it the vacation paradox.
It works like this: When I am about to go on vacation, especially if it is a fish-ing trip, which means leaving my family behind, I want to be sure there are noloose ends at home—or at work—during the few days or week I am gone. So, Iscan my world for things that need to be tied up before I leave. The last thing Iwant is to return home and face an unhappy family because I forgot to look aftera detail that ended up inconveniencing them! The same is true at work. I want toreturn to no more than the usual accumulation of email and voice messages. I cer-tainly do not want to return to find I left a smoldering situation or untendedassignment that burst into a full-fledged problem while I was out on holiday.
In short, during these prevacation times I get lots more done at home and atwork than I usually do. I do not transform into a maniacal dervish of activity, butI do use my time more efficiently. That is the vacation paradox: there is a lot moretime to get small things done when they are clearly identified and scoped andthere is a reason to get to them. Avoiding unhappiness in my family or boss is onereason to get to them before vacation. Another is having tasks done and codedwith green dots rather than red.
86
CREATING A LEAN CULTURE
Imagine the impact of the team leaders and supervisors in a value streamdevoting as little as 15 to 30 minutes every day to improvement tasks! The capac-ity to do this work has been present all along. The unstable, firefighting nature ofleaders’ roles in a conventional production environment demanded all of theirtime and energy for meeting the daily production schedule. In an increasinglylean environment, as production stabilizes, it is possible to tap this latent capac-ity, though it takes time before the extra work ceases to seem like an impositionin an already busy day. When that happens, it is possible to say that an organiza-tion has developed the habit of daily improvement.
The power of this process can be surprising. Leaders and operators from theDeep South to Canada and anywhere in between have all commented on theeffectiveness of the daily improvement assignments keyed to recurring causes ofinterruption. Problems that had seemed as much a part of the workday as com-ing through the door in the morning had been worked into oblivion step by stepand were gone. Operators, as in the job-by-job area noted in chapter 4, werehappy to have a vehicle for getting their problems solved. And leaders were ini-tially amazed at the results the visual, accountable, daily focus on correction andimprovement produced, as in the drawer fit and lock function case study in thischapter.
Summary: Daily Accountability ImprovesProcesses
Daily accountability is a vehicle for ensuring that focus on process leads to actionto improve it. The structure of the daily accountability process is straightforward,a series of three brief meetings to review what happened yesterday and assignactions for improvement. These are paced, stand-up meetings on the productionfloor that emphasize quickly resolving or investigating to the next level interrup-tions in the defined production process. The purpose of these meetings is notcommunication of information someone somewhere in the organization thoughtothers ought to hear.
Daily accountability is the vehicle for interpreting the observations recordedon the visual controls, converting them into assignments for action, and follow-ing up to see to it that assignments are completed. As with the other principal ele-ments of lean management, daily accountability relies on disciplined adherenceto its processes on the part of those who lead the three-tier meetings. When thisdiscipline is present, leaders follow their standard work. Leading the three-tiermeetings effectively is an important part of leaders’ standard work, which is to
make it clear that maintaining visual controls is vital, expected, will be closelyreviewed, and leads to action.
The daily accountability process also provides a vehicle for introducing andmodeling the basics of project management for those leaders who came upthrough the ranks and may not have had exposure to these tools. And, the processdefinitely reinforces the connection of support groups with the manufacturingprocess by involving them in daily accountability assignments to resolve manu-facturing’s issues, and quickly. This is true whether or not support group mem-bers have a formal reporting relationship to the value stream.
By reinforcing process focus and driving improvement, daily accountabilityactually creates increased capacity for improvement via the vacation paradox.Finally, the green dot/red dot convention brings visual accountability forexpected versus actual into concrete reality for a value stream’s leaders and staffmembers. The effect is a powerful reinforcement of this theme running throughlean management.
87
DAILY ACCOUNTABILITY PROCESS


Part 2Learning Lean Managementand Production:
Supporting Elements of Lean Management

6Learning Lean Management:The Sensei and Gemba Walks
The principal elements of the lean management system do not seem to be com-plex or difficult to understand. Yet, they represent the shoals on which so manylean initiatives have run aground. Why?
Part of the answer involves discipline, certainly. But, part of that answerinvolves the process needed to learn how to do lean management and how to bea lean manager. This chapter focuses on one aspect of your own personal leantransformation: learning lean management. (Chapter 7 covers another aspect:leading a lean operation.) This chapter describes becoming apprenticed to a sensei(or lean teacher) and a principal method by which a sensei teaches: the gemba walk.
Your Sensei and “True North” ProvideDirection
Lean is tricky, because it is so much more difficult than it seems. Reading aboutlean, attending workshops on lean, or participating in simulations are no substi-tute for hands that have experienced implementing lean—and firm hands at that!An effective sensei will be insistent and at times critical to the point of being atleast mildly abrasive.
Most of us need a sensei to help us understand how to translate basic leanconcepts into actual functioning applications. More than that, your sensei shouldalso instill in his or her students the discipline needed to effectively sustain a leanconversion and have it improve consistently.
91

92
CREATING A LEAN CULTURE
Toyota refers to “true north” as its ultimate direction for perfection in lean.It relies on its internal sensei to keep the company on that path, just like earlytravelers relied on the North Star, Polaris, to keep them headed in the right direc-tion as they traversed unfamiliar territory. In a lean implementation, the senseiplays the role of Polaris. Working with a sensei is not like conventional training.Instead, it more closely resembles an internship or apprenticeship. In these mod-els of teaching and learning, the student learns over time, through experiencefrom applying concepts to actual live situations and carefully observing the con-sequences under the tutelage of the sensei.
The classic sensei is Socratic in approach, teaching by stretching the student’sthinking and perceptions through questions that stimulate the student to con-sider entirely new possibilities. Students might consider questions such as these:
• How can you tell what is normal in this area?
• What would you learn if you measured in smaller intervals of time?
• What is the team leader supposed to be doing in this situation?
• Why should you expect the team leader to know that?
• How could these expectations be made more clear?
• How do you know that the designated person carried out these posted procedures?
• How could someone know who was responsible for this task?
• How could you know these things with more certainty?
Some of the sensei’s teaching is likely to be typical classroom instruction,especially early on when introducing the basic concepts of lean or of a particulartechnique or approach. To be effective, these sessions should be immediatelytranslated to observation and application on the production floor, a destinationto which the sensei will often appear impatient to return. Once the conventionaltraining is over, sensei and student begin or resume gemba walking to reinforcewhat has been presented and to extend the lesson through extending the princi-ples to situations encountered where people are doing actual work.
Think of your sensei as a personal trainer, one who sets expectations for youand then teaches, coaches, and prods you to be able to meet them. Can you learnlean production and lean management by yourself through study, application,and self-critique? Certainly you can. Perhaps more pertinent, however, is howlong you have and how persuasive you can be with your peers and superiors asyou work your way through the learning curve, stumbling occasionally as anyonewould with brand new ideas—in most cases, not long enough. This is a placewhere calling on outside expertise is well worth it, subject to all the caveats of

93
LEARNING LEAN MANAGEMENT: THE SENSEI AND GEMBA WALKS
working with external consultants.In one important way, the sensei should be like any good consultant, recog-
nizing the division of responsibility between client and professional advisor. Thatis, the sensei or consultant is responsible for teaching, giving advice, stimulatingnew thinking, and identifying new directions. The client always is responsible fordecision making, that is, for whether and how to apply the advice of the teacher.In this relationship, the only decision the sensei makes is whether to continueworking with the student, based on how the student follows through on commit-ments.
Gemba Walking
Gemba is roughly translated from the Japanese as the real place. In this sense, realrefers to where the action is happening. To illustrate, Japanese television reporterscovering the devastating 1995 earthquake in Kobe, Japan introduced themselveson camera standing before a site in the quake zone as “reporting live from gembain Kobe.” If your focus were on improving customer service in a call center,gemba would be the call center floor and workstations. For manufacturing,gemba is the production floor. The idea of gemba is simple: go to the place, lookat the process, talk with the people.
Gemba walks typically take place on a regularly scheduled basis, usually atone-week intervals. This is enough time to allow the student to digest the lessonand complete assignments the sensei gives, but short enough to maintain a senseof pace. In some cases, the assignment will be to develop an explanation for whysomething appears as it does and what an alternative might be. As the teachingand learning progress, the gemba walks shift to the sensei suggesting assignmentsfor the student, and then following up on the next walk. In this way, gemba walksbecome another instance of accountability for bringing actual (what the studenthas been able to accomplish) in line with expected (the assignment from the sensei).
In these cases, gemba walks become a method for setting and following upon expectations. As the student begins to correctly interpret what the senseipoints out, the sensei will make assignments to take action based on what the stu-dent has seen. Next, the sensei will expect the student to initiate similar actionwhen encountering the same or similar circumstances in other areas.
94
CREATING A LEAN CULTURE
Gemba Walking Teaches How to See in New WaysGemba walking, to be effective, begins at the top and works its way down theorganization as those in higher positions learn enough to teach others. People inhierarchical organizations (which are, after all, most of us) respond to therequests, suggestions, and directives of their superiors. As the superior learns toask for and teach how to apply the principles of lean management, the subordi-nate is likely to listen carefully, learn the new expectations, and learn how to comply.
Gemba walking is a practice with a definite tie to the expected versus actualtheme in the lean management system. This explains the lean sensei’s insistenceon starting his or her regimen of gemba walks with either the CEO or the senioroperations executive. When the person in the position of ultimate authority in anorganization can teach lean principles, expects to see them applied, and is able toevaluate progress on sight, the chances for sustaining a lean initiative are muchbetter than when the initiative starts somewhere in the middle.
The object of gemba walking is to teach the student to see through differenteyes what s/he may have been looking at for an entire career. The alternative isfor the student simply to follow the directions of the teacher to “do this” and “dothat.” Some, but usually not much, learning happens this way, and when the sen-sei departs s/he leaves no lasting transfer of knowledge.
The desired outcome is that the student him or herself is learning to seewhere the principles of lean management can be applied. The importance of thisis that, in most cases, each application of the principles is an invention derived to
Case Study: Learning to See Problems, Not Just Correcting Them
In one case, I was working with a supervisor on basic 5S discipline ina welding department. Except for the weld tips themselves, nothing inthe place had been cleaned since it opened many years earlier. Youcan imagine its condition: grime and dirt seeming to grow from everysurface—horizontal and vertical, top and bottom. After a few weeksof pointing out several particularly dirty areas and talking about thebenefits of discipline and order, it became clear that the supervisorwas only cleaning up the specific spots we had looked at. I admon-ished him to “learn to see the dirt yourself!” He did, took initiative toget the entire area cleaned up, and needed no more coaching on thistopic.

fit the unique characteristics of the situation at hand. Few lean applications areliterally answers to be found in a book—even this one! As lean managementnovices become more skilled through gemba walks with their sensei, they gradu-ally develop their own expertise as gemba walkers, teachers, and auditors of leanmanagement. It then becomes their turn to gemba walk with their subordinates;teaching and helping them develop their own mastery of lean production andlean management.
Learning through gemba walking requires patience and tolerance for frustra-tion. It is not fast. One of the main ways of learning is from experience as youwork to make the corrections and refinements you find necessary (often promptedby your sensei) as you try new things. There is no good alternative to gemba walksas the method to learn lean management. That is because lean management is amindset, and mindsets necessarily change and develop over time through per-sonal experience. If that is the bad news, the good news is gemba walks are effec-tive as a learning model, helping you gradually to establish a new, lean way of see-ing and thinking. Six months of weekly gemba walks is on the low end of theperiod necessary to develop a lean approach to managing.
Focusing on process is essential for success in a lean operation. That focusmust include the technical elements of lean and the elements of the lean manage-ment system. The components of these two aspects of lean—technical produc-tion and management systems—are often intertwined with each other. Thatmeans effective lean leaders need to be well versed in both sides of lean.
Table 6.1 shows some aspects of lean management that a gemba walk mightfocus on. Each item is discussed in detail in chapters 3 through 9. The point hereis that a gemba walk can focus on far more than the technical aspects of lean pro-duction. When you know what to look for, evidence for the presence or absenceof a robust lean management system is everywhere on the production floor.Gemba walking, traditionally focused on the technical side of lean (is inventorybeing pushed or pulled; is standard work balanced to takt?), is indispensable inlearning lean management and especially in maintaining it.
As leaders become proficient in the first several levels of lean, gemba walksare still useful for asking leaders to reflect on what they have done and learned,and for challenging them to go further. This is particularly applicable in situa-tions where leaders have led progress to a plateau and either do not know how topush further improvement or have become satisfied with the current state. Here,gemba walks are likely to encounter the bedrock of the batch production mind-set. This is the view that for a production manager: “If it ain’t broke, don’t fix it.”This runs counter to the lean principle in which perfection is the goal, and therelated tenet that everyone in a lean system has two responsibilities: to run thebusiness and to improve the business.
95
LEARNING LEAN MANAGEMENT: THE SENSEI AND GEMBA WALKS

96
CREATING A LEAN CULTURE
What you should see What people should know
Process Focus
• Tracking charts show current actual vs.expected status for all processes, in-cycleand out-of-cycle.
• Production-tracking charts initialed bysupervisors at least twice daily.
• Reasons for misses noted on trackingcharts.
• How are you doing at hitting your produc-tion goals?
• How can you tell if out-of-cycle and dailyor weekly tasks are getting done as theyshould?
• (Leaders) Is there a regular schedule forgemba walks in this area? What is it?What happens on a typical gemba walk?
Process Improvement
• Top 3 to 5 reasons for misses documentedand visible at cell/line, department, andvalue stream information boards.
• Summary project plans (A-3s) for improve-ment posted and current at departmentand value stream information boards.
• Employee suggestion system shows recentsuggestions, current action on suggestions,and implemented suggestions with trendchart of numbers submitted and imple-mented.
• A visual daily task assignment and ac-countability process is in use and current.
• What are the three biggest problems inthis area?
• How do you know these are the biggestproblems?
• Is any work being done on these prob-lems? How can you tell?
• Is there a regular method for operators tomake suggestions for process improve-ments? What is it?
• How can you tell your suggestions are listened to?
• (For leaders) What improvement activity isgoing on in this department.
• (Leaders) How do daily task assignmentswork here? Is there regular follow-up onassignments?
Leader Availability
• Team leaders on the floor in their processarea virtually all the time and available tooperators.
• Supervisors on the floor in their process area.
• Response system to summon supervisors,team leader, others when needed.
• (Leaders) How many hours/day on aver-age do you spend on the floor?
• How do you contact your team leaderwhen you need him or her right away?
• How quickly is help available when theprocess is interrupted by a problem theteam leader cannot fix?
Labor Planning (at team boards)
• Rotation path and starting assignments dis-played.
• Expected attendance chart up to date, dis-played.
• Qualification matrix up to date, displayed(including qualified out-of-zone operators).
• How can you tell who’s supposed to behere on any given day? How can you tellwhen you have call-ins?
• (Leaders) What do you do when there arecall-ins?
• How do you know how many people youneed for a given rate of production?
• Do you rotate jobs here? How do youknow where you’ll be working at the startof any given day?
• How can you tell who’s qualified to dowhich jobs in the area?
Table 6.1. Looking for lean management
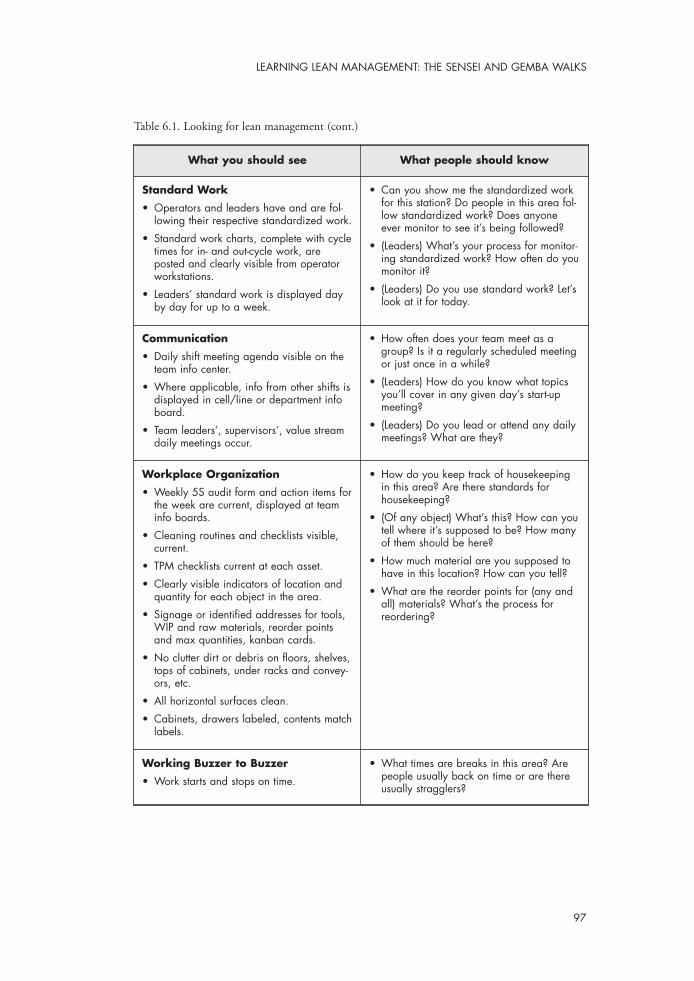
97
LEARNING LEAN MANAGEMENT: THE SENSEI AND GEMBA WALKS
What you should see What people should know
Standard Work
• Operators and leaders have and are fol-lowing their respective standardized work.
• Standard work charts, complete with cycletimes for in- and out-cycle work, areposted and clearly visible from operatorworkstations.
• Leaders’ standard work is displayed dayby day for up to a week.
• Can you show me the standardized workfor this station? Do people in this area fol-low standardized work? Does anyoneever monitor to see it’s being followed?
• (Leaders) What’s your process for monitor-ing standardized work? How often do youmonitor it?
• (Leaders) Do you use standard work? Let’slook at it for today.
Communication
• Daily shift meeting agenda visible on theteam info center.
• Where applicable, info from other shifts isdisplayed in cell/line or department infoboard.
• Team leaders’, supervisors’, value streamdaily meetings occur.
• How often does your team meet as agroup? Is it a regularly scheduled meetingor just once in a while?
• (Leaders) How do you know what topicsyou’ll cover in any given day’s start-upmeeting?
• (Leaders) Do you lead or attend any dailymeetings? What are they?
Workplace Organization
• Weekly 5S audit form and action items forthe week are current, displayed at teaminfo boards.
• Cleaning routines and checklists visible,current.
• TPM checklists current at each asset.
• Clearly visible indicators of location andquantity for each object in the area.
• Signage or identified addresses for tools,WIP and raw materials, reorder pointsand max quantities, kanban cards.
• No clutter dirt or debris on floors, shelves,tops of cabinets, under racks and convey-ors, etc.
• All horizontal surfaces clean.
• Cabinets, drawers labeled, contents matchlabels.
• How do you keep track of housekeepingin this area? Are there standards forhousekeeping?
• (Of any object) What’s this? How can youtell where it’s supposed to be? How manyof them should be here?
• How much material are you supposed tohave in this location? How can you tell?
• What are the reorder points for (any andall) materials? What’s the process forreordering?
Working Buzzer to Buzzer
• Work starts and stops on time.
• What times are breaks in this area? Arepeople usually back on time or are thereusually stragglers?
Table 6.1. Looking for lean management (cont.)

Summary: Learning Lean Management byBeing a Sensei’s Apprentice
This chapter concentrated on two aspects of developing and maintaining focuson process. The first involves learning the principles of lean yourself by steppinginto the role of student, engaging a lean sensei to teach you the principles andguide you through initial applications. This will happen principally through yourgemba walks with the sensei. Before you can teach others, you must develop an
Case Study: How Gemba Walks Can RevealOpportunities for Improvement
Illustrating this aspect of gemba is a case where a value stream man-ager had brought his area from chaos to stability and excellent per-formance. The area missed its daily production targets and pitchrhythm only when materials failed to arrive on time from outside sup-pliers. The leader was restless; he believed the area could improve fur-ther, but did not know what to do. We went on a gemba walk, look-ing for opportunity.
From the day the plant opened, parts were unloaded from the paintline into kit racks that held components for 10 units. The units could beup to 6 feet long and 4 feet wide, so the racks had to be big enoughto hold the components safely. They were big, about 8 feet long by 4feet high, heavy, and not easily maneuvered. Formerly, they werestaged at two-person assembly benches where each unit was builtcomplete from start to finish by the two-person team. Now, they fed anL-shaped assembly line. The painted parts held in the kit racks werehung on the paint line in groups of 4 units.
I asked the leader if the balance on his assembly process wouldimprove if it were arranged in the classic U shape. “I can’t do that; theracks wouldn’t fit inside a U,” he said, and then quickly realized theimplications of cutting down the racks for tightening the footprint ofhis assembly line, bringing better balance to it, and improving itsperformance.
98
CREATING A LEAN CULTURE

initial level of mastery of lean concepts and learn to see where and how to applythem.
Second, you become the teacher through gemba walks with those who reportto you, often as you continue to learn from your sensei. Your gemba walking willbe most effective if you are in a position of authority in your organization. In thisrespect, lean is no different than many other things. For any initiative to be suc-cessful and lasting, lean included, it must be understood and supported on theorganization’s own terms. This invariably means lean must flow down throughthe organization’s hierarchy.
Sometimes, a lean advocate somewhere in operations can drive implementa-tion far enough to produce success that gets the attention and then support fromthe top. Leading from the middle is always a risky proposition. If the boss statesagreement with the lean direction you are pursuing, but consistently directs youto act contrary to the principles, well, you know the rest. Lean will not prosperin your setting and will likely join the list of things “…we tried once, but it didn’twork here.” When executive leadership endorses and embraces undertaking a leanjourney, you have a better chance for success.
An early test of commitment from the top will be the executive’s willingnessto enter the role of apprentice to learn from the sensei. Consider the CEO orhead of operations who has learned more about lean than plant managers and isable to gemba walk them in their territory. When the executive points out oppor-tunities, teaches the principles, and makes assignments to act on them, it providesan enormous boost to the organization’s motivation to begin learning and apply-ing lean principles.
So, at its most effective, gemba walking cascades down through the organi-zation, teaching lean principles and establishing expectations for acting on them.
Lean management is, as much as anything, a way of thinking. A paradox isthat this way of thinking arises from new ways of acting, giving credence to thesaying: “You can act your way into a new way of thinking faster than you canthink your way into a new way of acting.” Learning, teaching, documenting, andfollowing up on specific expectations for focus on process are the first steps inimplementing lean management and developing a lean mindset.
99
LEARNING LEAN MANAGEMENT: THE SENSEI AND GEMBA WALKS

7Leading a Lean Operation
Leadership is a topic that applies more broadly than lean management, to be sure.It is regularly discussed whenever the subject is organizational change. A leanconversion initiative is properly and usefully thought of as this kind of change, aswell as a change in the technical ins and outs of production systems. That is becausegood engineering does not by itself make for effective change, not by a long shot.Without effective leadership, most large-scale changes in systems do not go welland do not perform up to advertised expectations.
This is emphatically true for lean conversions because, as I have suggested, alean conversion requires profound changes in thinking and deeply establishedhabits. Without determined leaders and effective leadership, no conversion proj-ect is likely to live up to what was hoped for it. For that reason, this chaptertouches on eight dimensions of leadership that are needed both for leading aneffective lean conversion project, and in subtly but importantly different ways, forleading an ongoing lean operation.
Eight Leadership Behaviors to Learn
Successful leaders are those who behave in particular ways. In other words, suc-cess is based on what you do, not on who you are. That is fortunate, because formost of us, it is too late to be born a leader! Behavior can be learned andunlearned. Included here are how you respond to interruptions in production,the way you arrive at conclusions, and what you ask people to pay attention to.
101

Table 7.1 lists and briefly describes these eight dimensions of leadership that wehave found important in making lean conversion projects and ongoing lean oper-ations successful.1
Leading a lean conversion project differs in significant aspects from leadingan ongoing lean operation, one that has already been converted or that started asa greenfield. The differences between them are discussed in turn, contrastingwhat is needed to successfully lead a conversion project with what is needed tosuccessfully lead an ongoing lean operation.
102
CREATING A LEAN CULTURE
1. For a more detailed discussion of leadership attributes in implementation projects, see David W. Mann,“Leading a Lean Conversion: Lessons from Experience at Steelcase,” Target, 17(3): 14-23, 2001.
Attribute For Project Implementation For Ongoing Operations
Passion forlean
1. Passionate about the potentialfor lean to make the enterprisemore successful and work morefulfilling for all involved.
1. Same as Project Implementation,plus:
2. Willing to make personalchanges in one’s own work,including using standardizedwork for his/her own position.
Disciplinedadherence toprocess—accountability
1. Sets expectations, regularly usesa process to track and follow-upon actual accomplishment ofassigned tasks.
1. Same as Project Implementation,plus:
2. Exhibits intense commitment tofocus on explicitly definingprocesses and disciplined adher-ence to them.
Project managementorientation
1. Prior experience in successfullyimplemented projects.
2. Uses a defined process to trackperformance and completion oftask assignments.
3. Identifies corrective action wherenecessary and follows up on it.
1. Able to identify needed changesbased on daily process data andassign small-bite daily tasks lead-ing to successful implementationof the changes.
2. Uses explicitly defined visualprocesses to track and follow upassignments and take appropri-ate corrective action.
Lean thinking 1. Understands lean concepts.
2. Has had experience applyinglean concepts.
3. Talks about and promotes a leanfuture state.
4. Finds ways to apply and illus-trate lean concepts in daily proj-ect work processes.
1. Serious about ongoing improve-ment based on a goal of perfec-tion.
2. Sees with “kaizen eyes.”
3. Holds and coaches a root-causeorientation to corrective action.
4. Has learned process improve-ment/problem solving methods;able to personally lead leanprocess improvement.
Table 7.1. Dimensions of lean leadership

103
LEADING A LEAN OPERATION
Attribute For Project Implementation For Ongoing Operations
Ownership 1. Thinks and talks about the areaas his/hers to lead, set directionfor, change, and improve.
1. Same as Project Implementation,plus:
2. Eager to empower others in thearea through structured ways toelicit and implement their ideas.
3. Acknowledges and celebratesimprovements made by others atall levels.
Tensionbetweenapplied andtechnical
1. Understands the need to sweatthe details, as well as to getthings done.
2. Willing to listen to technicalexperts and consider theiradvice in planning for theimplementation.
1. Understands and respects thedetails behind elements of lean,such as flow, pull, standardizedwork, etc.
2. Actively supports steps toupgrade performance andexpose previously hiddenimpediments.
3. Takes a “what can we do today”orientation to making changehappen steadily, step-by-step.
Balancedcommitment toproduction andmanagementsystems
1. History of effective give and takewith people and ideas.
2. Evidence of process focusbeyond a “hit the numbers”approach to management.
3. Eager for greater participationby production people as well asothers.
1. Personally treats process focus ascrucial to the area’s success; isable to see waste and opportu-nity even in leaner processes.
2. Insists on compliance withrequirements for visually trackingprocess performance and execu-tion.
3. Insists on analysis and appropri-ate, timely action on impedi-ments to normal operation ofprocesses.
Effective relations withsupport groups
1. History of getting things donewith support from operationssupport groups such as engineer-ing, quality, production control,safety, finance, HR.
1. Understands roles, responsibili-ties, and expertise of supportgroups.
2. Incorporates support groupsappropriately in plans forimprovement and responses toproblems.
3. Makes expectations explicit forsupport group performance insupport of production processes.
Table 7.1. Dimensions of lean leadership (cont.)

Attribute #1: Passion for Lean
It is probably true that passion is something more than mere behavior that yousimply can do. It can manifest in many ways, however, in which charisma or forceof personality is not required. Think of the people some might call “geeks.” A geekmight be one seriously committed to a pursuit; who talks about it often in termsof possibilities that can make the future look better than the present; draws con-nections about their subject and the external circumstances facing him or her orthe group. That is someone, you could say, who has a passion, whether for long-distance running, religion, politics, or even lean production. Right?
In passion for lean, an important facet involves comparing lean with thealternative. For example, Toyota in 2004 is reported as being seriously concernedabout what it describes as a looming challenge from China. It uses that as moti-vation to improve further and further; this in a company whose market capital-ization exceeds that of all its North American competitors combined. Fifty yearsago, Toyota was motivated by the threat they perceived from American manufac-turers taking over their domestic market.
It is easier to be passionate and to enlist others when you have a case forchange based on real external factors that are affecting or likely to affect yourenterprise. There is something about a fight for survival or for your place in themarket that is more likely to arouse passion than merely a drive for moreincreased value for the shareholders, bigger bonuses for the executives.
Enthusiasm; intensity about a subject; willingness to engage others on theirterms with respect to the threats and possibilities; deep knowledge about the sub-ject; examples from one’s own experience—all of these are marks of passion.These are attributes that can be studied, learned, and acquired over time. Theygrow from believing that there must be a better way for your organization to sur-vive and prosper in a competitive world. That is what my own personal experi-ence has been with lean. I bet it has been your experience with lean or otherthings that have brought you to this point. That is why I contend that lean lead-ers can be made. I doubt anybody, even Taiichi Ohno was born “lean.” Ohno hadto start his journey by studying Henry Ford!
Willingness to Make Personal ChangeThe best leaders of lean operations I have known are also the ones who have rec-ognized that the methods they insist on others using are also ones they themselvesadopt. A principle difference between just leading projects, compared with lead-ing lean operations is that leaders of ongoing operations have more, and moremeaningful opportunities to take the step of personally adapting themselves to a
104
CREATING A LEAN CULTURE
leaner mode of operating. I have known advocates of lean who have labeled, taped-off spots on their
desks for stapler, phone, and coffee cup. Or, some who label their inbox tray“WIP” and put a Post-It® on a page near the end of their current pad of paper tosignal the reorder point. But perhaps the clearest and most persuasive example ofthis involves standardized work for leaders (see chapter 3). Part of this is simplyleading by example. Operators will often complain about having to follow stan-dardized work when it is first introduced. When a team leader, supervisor, valuestream manager, or plant manager can pull out his or her standardized work forthat day and compare notes, it makes a powerful statement. “I use this so I don’tforget to cover each of the departmental boards each day, just like standard workin a workstation can prevent assemblers from missing a step that might send aflawed product to one of our customers.” That is a lot more persuasive than astatement that in effect says, “Because I have the authority, I’m telling you to fol-low standardized work.” Beyond that, of course, is that a value stream managerwho follows his or her standardized work will be far less likely to miss coveringeach of the departmental boards every day! The same principle—standardized,explicit expectations that help actual performance meet what was expected—is atwork in both cases. The passionately committed leader recognizes that and makesthe personal change to adopt new, leaner ways.
Attribute #2: Disciplined Adherence toProcess—Accountability
Setting clear expectations and using a regular process to track completion is cru-cial for those leading projects to design and implement lean production.Establishing accountability to task assignments and schedules is one of the basicsin effective project management. The analogous skill in managing an ongoinglean operation also involves establishing accountability, but in a much moredynamic, live production environment. Planning and defining tasks is stillimportant, but must happen more quickly. These steps are guided by an overrid-ing principle: integrity of processes. A project team has a finite, definable task andat least some time for investigation and analysis. In an ongoing lean operation,the lean leader’s focus on his or her processes is what drives much of the account-ability.
This process focus is a daily vigilance that begins with what can appear tobe an obsession to explicitly define every last process in the leader’s area ofresponsibility. These process definitions typically start with an applicable form
105
LEADING A LEAN OPERATION

of standardized work, for a production line, for example. Hourly or more fre-quently tracking and recording production versus goal tells whether the standardis being met, and if not, what appeared to interfere. That is a process as well. Sois a third process, by which follow up on reasons for missed takt or pitch cyclesis regularly assigned in the daily accountability process three-tier meetings. Andso is the process to check for completion of assignments on their due dates. Thatis four levels of definition for a single process. And this does not consider leaderstandard work as a fifth process to guarantee each of the four steps just listed! SeeFigure 7.1 for a graphic depiction of this example of a set of reinforcing processes.
Figure 7.1. Example of multiple layers reinforcing focus on process
In lean management, virtually all processes have initial definitions and doc-umentation. In addition, for each there are secondary processes to verify the ini-
106
CREATING A LEAN CULTURE
Productionprocess
Production
Misses documented
Follow-up assignedwhen needed
Accountability forcompleting assignments
Accountability forcompleting assignments
Misses assessed
Actual vs. goal shown
Standard Work
Leader standard work:monitor tracking,
documentation
Leader standard work:monitor tracking,documentation
Leader standard work:monitor tracking, documentation
Leader standard work:monitor tracking, documentation
7_Leading_Lean_Op.qxd 3/31/05 3:23 PM Page 106

tial process was executed, and often further follow up or verification processes.The periodic gemba walk of the plant manager by the operations VP is an exam-ple of the secondary verification process. The standard work of the leaders fromvalue stream manager down through team leader and the related proceduresextend the verification. The idea is to guarantee, as far as is humanly possible, theintegrity of the production process, not simply to set it up and hope it all worksas planned.
In many ways, adherence to processes is like the discipline of redundant qual-ity checks in successive workstations in an assembly line. Standardized work inmost stations begins with checking a critical aspect of the work elements per-formed in the previous station. It is the leader’s role to establish this climate ofdiscipline in definition and follow-up in which the norm is accountability forfaithfully executing the processes.
Attribute #3: Project Management Orientation
The necessity for effective project management skills when leading an implemen-tation project hardly needs much comment. Regularly using a well-definedprocess for following up for accountability on task assignments is important in aproject environment as well as in ongoing operations. The ability to think interms of work breakdown structures is another project management practice thattranslates into a daily operating environment. A work breakdown structure isnothing more than the step-by-step sequence of subtasks that, when assigned andcompleted in sequence, result in completion of a single larger task. Work break-down analysis is just another way of talking about detailed step-by-step planning.
What is different in an ongoing operation is that the analysis and planningoften happens in a stand-up meeting on the floor as the leader is scrutinizing yes-terday’s performance-tracking charts and other measures of process effectivenessor interruption. The leader, as s/he examines the reasons for missed takt or pitchcycles needs to be able to perform analysis quickly, which might be as simple asusing the five whys (a basic method of cause analysis; see the glossary for a moredetailed definition). Next, s/he must be able to identify the initial steps to take,to further understand the cause, put a countermeasure in place, or initiate correc-tive action. Then, the leader needs to make an assignment generally of not morethan a day’s duration for a staff member or support group representative to takethe appropriate action.
This is very much like performing a work breakdown analysis except that ithappens quickly, almost but not quite on the fly, and often with people who have
107
LEADING A LEAN OPERATION
not been exposed to this kind of thinking because they have not been involved inmanaging projects. That is especially likely to be the case with floor supervisorsand team leaders who have come up through the ranks. Over time, a leader usingthis process to address everyday interruptions, anomalies, and problems in theproduction environment can teach this step-by-step planful approach to his orher direct reports. For example, if a value stream manager assigned a departmentsupervisor the task of updating standardized work and rebalancing a flow cellwhen both the tasks and the process were new to the supervisor, the odds of suc-cess would be low. Consider this alternative:
• First, the value stream manager introduces the task, then s/he breaksit into constituent parts, such as updating standard work and updat-ing the operator balance chart one position at a time.
• The value stream manager makes the tasks into daily assignmentsand reviews each one daily as part of the third-tier accountabilitymeeting.
• Next, the leader does the same with the tasks needed to rebalancethe cell.
• By the time the work is done, the supervisor has valuable hands-onexperience with a basic tool in designing flow processes and haslearned, or at least been exposed to a work breakdown structure toget a complex piece of work done a manageable step at a time.
These project management tools represent valuable skills for an organizationto impart to those in junior leadership positions. Value stream managers whohave more formal experience in leading and managing projects are in a much bet-ter position to do this kind of teaching by example than those who have not.
Managing daily task assignments using visual controls is discussed in detailin the daily accountability three-tier meeting structure and process in chapter 5.To summarize that process here, the meeting leader writes the task assignment ona Post-It® note. The leader places the note on a names-by-dates matrix in thesquare that corresponds to the due date for the assigned individual to report ontask completion. The names, depending on the level of the meeting, are those ofsupervisors and support group representatives (tier three), or of team leaders (tiertwo). Assignments are made, depending on the level of the meeting, by the valuestream manager or by the department supervisor. Completed tasks are colorcoded green, overdue tasks are coded red.
The matrix is part of a value stream or department information center, avisual display and stand-up meeting place located on the floor in the productionarea. This visual assignment and tracking method highlights accountability forcompleting daily assignments.
108
CREATING A LEAN CULTURE

Attribute #4: Lean Thinking
Lean thinking in an implementation project is like being a practical dreamer. Aproject leader needs to balance what we might do in an ideal future state com-pared to what we can actually accomplish given the scope, schedule, and budgetfor the project. Lean thinking in an ongoing operation takes a different tackbased on an understanding that lean is fundamentally an improvement system.In this respect, lean thinking in the leader of an ongoing lean operation is derivedfrom the goal of attaining perfection in the operating system. This is somethingof a curse, a sort of “Princess and the Pea” situation where, in the leader’s eyes,things are never good enough and improvement is always needed. The leaderneeds to see where improvement can be made even if s/he cannot say exactly whatthe improvement should be. That, after all, usually requires the involvement ofthose with the deepest knowledge of the process in question, those who work inor with it every day. Nevertheless, if the leader has “kaizen eyes,” always seeingsomething that might be improved, the rest of his or her organization willdevelop the same habits of perception if only to keep a step ahead of the boss! (seecase study on p. 110).
Lean Thinking Looks for the Sources of ProblemsA lean thinker welcomes (if not joyfully) the appearance of interruptions,
anomalies, and problems in his or her processes as opportunities to understandand eliminate sources of variation and disruption. This root cause orientation tocorrective action is a powerful engine in driving continuous, lasting improve-ment. After all, continuous improvement focused on the same set of recurringproblems is not exactly what lean thinking is all about! Instead, a lean thinker’sversion of corrective action is aimed at uprooting the sources of problems so theynever appear again. A lean leader’s capabilities should include being able to leadprocess improvement and problem solving activities as an example to the organ-ization and as a teacher and coach for these important tools and ways of thinking.
Attribute #5: Ownership
Ownership as an attribute of a lean leader actually has more to do with enablingand celebrating the contributions of others to progress in the area. That is, a lean“owner” definitely is responsible for setting and reinforcing direction in the area,just as the leader of a lean conversion does. The lean leader of an ongoing operation
109
LEADING A LEAN OPERATION
sets direction at a high level. S/he then creates conditions and specific structuresand processes, through which, those in the area can participate in making changesthat bring the area closer to the overall vision and direction. In this regard, own-ership is broadly analogous to presiding over a democratic process. The principlesof lean in this case, will be scrupulously observed. The specifics of which changesare made will depend in considerable part on the ideas that come from the staffand from the floor. In other words, the “owner” does not dictate what changeswill be made, rather s/he acts to teach and challenge others to develop their ownsuggestions for how best to move in the established direction.
The case examples on pages 112-113 are the kinds of simple but creativethings you can expect when the owner of an area sets the conditions for thosewho work in it to feel free to make changes for the better.
Attribute #6: Tension Between Applied andTechnical Details
A value stream leader from a traditional production background might betempted to leave the technical details to the “experts,” the engineers or local leanresources. That is, a traditional leader might not take the time to learn and under-stand machine balance charts and the implications for shrinking machine
110
CREATING A LEAN CULTURE
Case Study: Taking Lean to the Next Level
A case illustrating this involves the value stream leader described inthe section on job-by-job tracking in chapter 4. His fabrication areahad come to run smoothly, in part because of the use of job-by-jobtracking. Through its use by the operators in the area, the most fre-quently occurring sources of interruption had been eliminated. Thesupervisor was not satisfied, and assigned the fabrication team leaderthe task of Pareto-charting the sources of interruption that remained afterthe initial clean up had taken place. This was painstaking work, butthere were clearly a few things that had moved into the position of mosttroublesome and the leader was determined to find and eliminatethem.

changeover times to reduce inventory quantities in a supermarket. Failure toappreciate the tension between the applied and technical poles in a situation likethis can lead to commands simply to “Cut inventory by 25 percent.” In a systemon the lean journey, this is a sure-fire recipe for widespread stockouts, one I haveseen throw a system into weeks of chaos.
These are technical details that lean leaders need to respect and be familiarwith. It is true that there is a certain “just do it” mentality in the lean drive tolearn from action. It is also true that process integrity and performance can becompromised unnecessarily by a leader’s failure to understand how lean princi-ples translate into well defined capacities, replenishment times, and the like. It istrue; lean is not rocket science. It is also true that you cannot cheat physics: cut-ting inventory without reducing changeovers can easily result in stockouts; tak-ing people out of a line carefully balanced to takt time and asking the rest to“work faster” will likely result in falling short of the day’s production require-ments or incurring unplanned overtime, not to mention causing resentment andpoisoning the reputation of lean.
It is one thing when because of specific conditions a leader deliberatelydecides to take these kinds of actions with full realization of the likely conse-quences. It is an entirely different thing when the outcomes surprise a leader whohas not learned how lean works from the inside out.
At the same time, lean leaders are most certainly in the business of takingrisks. That is the essence of the drive for improvement. Lean improvements usu-ally involve reducing some form of non-value-adding activity or resource deploy-ment: reducing times for setup and changeover; reducing floor space, inventory, orqueue; rebalancing a line to run at takt instead of a fraction of takt; moving peo-ple out of a process, linking previously separate processes, or other measures.When they do these things, the leaders deliberately stress the lean system andexpose its weaknesses. Armed with this information, they can set out to shore upthe weak areas and stabilize the system at a new, higher level of performance. Aleader cannot know what will go awry when these cushions are reduced orremoved. For that reason, only one of these actions should be taken at a time, inpart to isolate the cause of any resulting disruption, and in part to mitigate therisk to the system’s ability to deliver for its customers.
Finally, lean leaders look at every day as an opportunity to move toward bet-ter performance. A simple but powerful manifestation of this is the question:“What can we do today?” when considering one or another approach to solvinga problem or making an improvement. Analysis and understanding the mechan-ics of lean are important to be sure, but the lean leader sets the tone for action,even if for small steps. In this mode of leadership, it is often better to act ratherthan taking another day of analysis and inaction. Weigh the realistic risks (as
111
LEADING A LEAN OPERATION

opposed to doomsday fears) of course, but think of the step as an experiment, anactual rather than theoretical analysis, testing the proposition being considered.Lean is in many ways an everyday version of experiential learning, sometimesconfirming what you anticipated, sometimes surprising you, and sometimesdoing both simultaneously. Experience is really the only way to learn what leanreally is; your actions provide the classroom in which the lessons are given.
112
CREATING A LEAN CULTURE
Case Studies: Taking Control of Improvements
There will be plenty of instances where the leader-owner will have toassert the right to interpret what it means to be consistent with the prin-ciples. For example, one value stream sent separate schedules to workcenters that happened to be lined up in the order of the productionprocess. The value stream manager called this a pull system. Helabeled as a supermarket the areas where the WIP and overstockaccumulated between work centers. He referred to the expediters whosorted and picked through the stock as waterspiders.
This is a clear instance of where a lean owner (in this case, the plantmanager), prompted by his lean sensei, asserted his owner’s prerog-ative. He helped the value stream leader better understand the appli-cation of lean principles and the difference between a push system (nomatter how sophisticated the scheduling algorithm) and a Type Bsequenced pull kanban system.
By contrast, you want to see examples where people have taken theteaching and general direction of the owner—for example: “Flowwhere you can, pull where you can’t, and never push!” and createsomething entirely new that solves a problem or improves a process ina way nobody, certainly not the lean owner, had thought of. Whenthe owner has established the right conditions, there will be many ofthese instances.
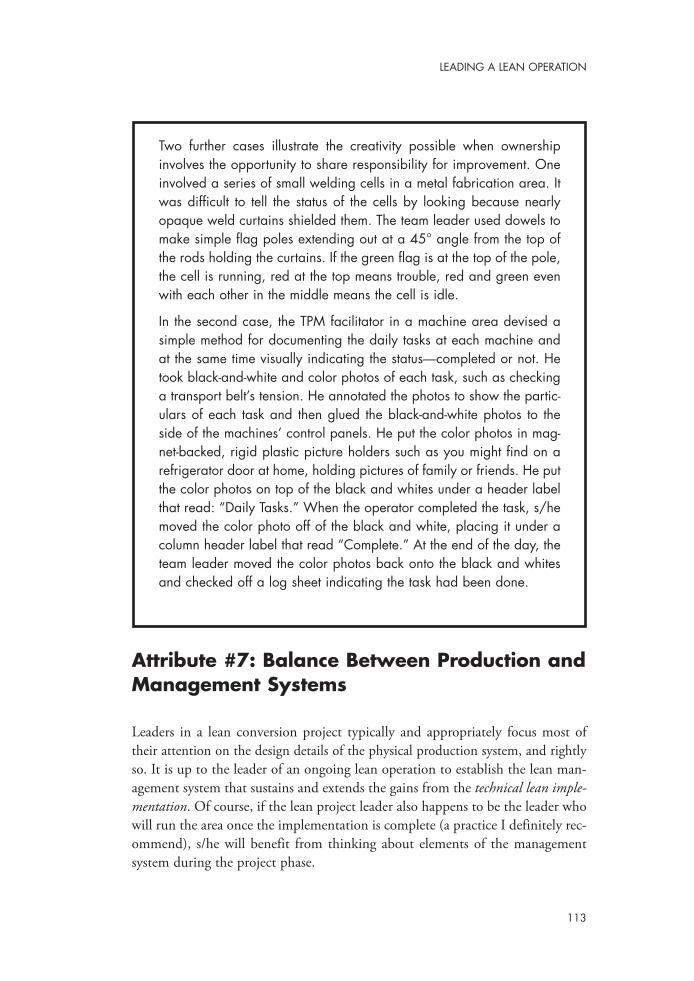
Attribute #7: Balance Between Production andManagement Systems
Leaders in a lean conversion project typically and appropriately focus most oftheir attention on the design details of the physical production system, and rightlyso. It is up to the leader of an ongoing lean operation to establish the lean man-agement system that sustains and extends the gains from the technical lean imple-mentation. Of course, if the lean project leader also happens to be the leader whowill run the area once the implementation is complete (a practice I definitely rec-ommend), s/he will benefit from thinking about elements of the managementsystem during the project phase.
113
LEADING A LEAN OPERATION
Two further cases illustrate the creativity possible when ownershipinvolves the opportunity to share responsibility for improvement. Oneinvolved a series of small welding cells in a metal fabrication area. Itwas difficult to tell the status of the cells by looking because nearlyopaque weld curtains shielded them. The team leader used dowels tomake simple flag poles extending out at a 45° angle from the top ofthe rods holding the curtains. If the green flag is at the top of the pole,the cell is running, red at the top means trouble, red and green evenwith each other in the middle means the cell is idle.
In the second case, the TPM facilitator in a machine area devised asimple method for documenting the daily tasks at each machine andat the same time visually indicating the status—completed or not. Hetook black-and-white and color photos of each task, such as checkinga transport belt’s tension. He annotated the photos to show the partic-ulars of each task and then glued the black-and-white photos to theside of the machines’ control panels. He put the color photos in mag-net-backed, rigid plastic picture holders such as you might find on arefrigerator door at home, holding pictures of family or friends. He putthe color photos on top of the black and whites under a header labelthat read: “Daily Tasks.” When the operator completed the task, s/hemoved the color photo off of the black and white, placing it under acolumn header label that read “Complete.” At the end of the day, theteam leader moved the color photos back onto the black and whitesand checked off a log sheet indicating the task had been done.

In too many cases, the technical details continue to rivet the focus of theleader even after implementation of the technical design. This is a frequent causeof failure of the implementation to deliver on its promises, a cause far more com-mon than technical miscalculation. The leader must not consider the job “done”when implementation of the technical design is complete. Instead, an effectivelean operations leader continues to look for and invariably see waste and thusopportunity in even the newly implemented processes. When the leader engagesin constructive critique of his or her own work and focuses on opportunities forimprovement, s/he sets a tone for the orientation to continuous improvement totake root and spread.
As important, the lean operations leader brings an intense focus on process,specifically treating process focus as a crucial element in the lean area’s success.This focus includes personally following up on requirements for maintainingvisual process controls for performance and execution:
• Are hour-by-hour or pitch-tracking charts being completed in atimely manner or in batch mode at the end of the day?
• Can team leaders and supervisors speak knowledgeably about theflow interrupters or other process disruptions recorded on thecharts?
• Are the reasons for misses clear and specific enough to act as a basisfor moving to the next steps?
• Are controls in place for noncyclical processes such as weekly 5Saudits, operator-based maintenance tasks, periodic scheduled main-tenance activities?
• Are controls in place between processes, particularly the “re” processes:rework, reorder, refinish?
The visual controls and focus on process and reasons for abnormal operationwill yield a trove of data on how a lean area is working and the instances when itfails. Maintaining the visuals and tracking tools is work for many people. Whenthey see their work taken seriously, used as the basis for analysis and problemsolving, and when problems get fixed and interruptions are eliminated, it makesall the effort of the new routine worthwhile. So, the data must be analyzed, ide-ally involving to whatever degree feasible the people who generated and recordedthe data. The analysis needs to entail using the smallest tool for the job (manyproblems do not require a designed experiment, for example, where a carefullyconducted Five Whys? will do). Most important, the analysis needs to result inaction. Indeed, the maxim from Kurt Lewin: “No action without data; no datawithout action!” applies here.
114
CREATING A LEAN CULTURE
This is a lot for a lean leader to keep up with. When the leader recognizesthat his or her job is to act as the guarantor of the integrity of the processes in hisor her area, it becomes clear that this is the new work for a lean leader. There isno delegating the task of personally establishing the importance of process focusin a newly established lean operation. Over a period of years this kind of followup can become less frequent, but it never goes away.
Attribute #8: Effective Relations With SupportGroups
A lean operation is a finely balanced system. All of its component parts mustoperate effectively for the whole to succeed. Manufacturing is an important partin the equation, but not the only part. For example, here are some other consid-erations:
• What does it matter if manufacturing has reduced the time it takesto change over from making one model to the next if the equipmentinvolved breaks down on a random, frequent basis?
• What benefit is there from a well-balanced, smoothly flowing assem-bly operation if the purchased parts are constantly out of stock?
• How significant will be the impact on morale from a well-run sug-gestion system if the safety of those in the area is not given the high-est priority?
• What will be the benefit of a system for frequent rotation amongworkstations if HR policies have not been changed to reflect thisrequirement?
• What is the point in establishing visual pull systems if accountingstill insists on recording transactions every time inventory is moved?
Clearly, support groups—production control, engineering, maintenance,human resources, quality, safety, accounting—need to be part of the picture in awell-functioning lean operation. The lean leader needs to think of them asresources, not as convenient repositories of blame for the system’s shortcomings.They need to be incorporated into the daily life of the area, involved in problemsolving and improvement plans and activities. A diversity of perspectives andresources is needed for a finely-tuned lean system to run smoothly and to recoverfrom interruptions. Support groups can bring much of both to a lean opera-tion.
115
LEADING A LEAN OPERATION

Not only should these contributions by support groups be welcomed by thelean manufacturing leader, s/he should be able to expect them. After all, it is a fairquestion to ask, what better way for support groups to deploy their resources thanin support of the lean production process? For this reason, most support groupsare expected at the daily value stream meetings, and expected to carry out tasksassigned to them by the lean leader in response to problems reflected in the per-formance-tracking charts or opportunities for improvement.
Manufacturing and the support groups in a lean operation need each othertoo much and too intensely to be able to afford the finger pointing and isolation-ism that were possible in a batch-and-queue world. Typically, it behooves manu-facturing to take the first steps, inviting the support groups into the lean circle.It is not unusual for manufacturing to be asked to follow up with training in leantools and techniques for the support groups, since it is also not unusual for man-ufacturing to have started off on the lean journey alone.
Summary: Consistent Leadership Is the CrucialIngredient in Lean Operations
Changing from batch production to lean is difficult because the two are so dif-ferent. Lean management calls for responses that are opposite those that havebeen learned and reinforced over a career in batch and queue operations. Nochange is easy, but swapping one habit for its contradictory opposite is particu-larly challenging. Because of that, leadership and leaders’ persistence and consis-tency over time is essential for successfully transforming from batch to lean.
George Koenigsaeker, among others, has noted that leadership is always inshort supply, which may account for the disappointing track record of attemptedlean conversions. A slightly different slant on Koenigsaeker’s idea is from RensisLikert, who noted, “Nothing changes until leader behavior changes.”2 That is thepoint of this chapter; what leaders learn to do is the crucial ingredient in a suc-cessful lean conversion.
Specifically, a leader’s behavior is more important than his or her personality—being inspiring, charismatic, or emotionally impactful. I have seen forceful,charismatic, inspiring leaders utterly fail to understand what was needed to sus-tain lean conversion efforts. I have seen leaders with a good conceptual under-standing of the need for lean management utterly fail to execute the basics, suchas teaching subordinates and holding them accountable for applying what they
116
CREATING A LEAN CULTURE
2. Rensis Likert, a researcher and theorist in organizational behavior, leadership, and management styles.Rensis Likert, New Patterns of Management. New York: McGraw-Hill, 1961.

had learned. The leaders of successful lean transformations, in my experience,were relentless in teaching and expecting to see live, on-the-floor examples of leanmanagement in large and small examples everywhere. You would call themdogged in their persistence; you would call few of them charismatic. Significantly,none of them knew anything about lean when they started; first and continuing,they were students.
Success in a lean conversion ends up depending on those who lead the organ-ization. They must teach, inspect for, reinforce, and hold all accountable for man-agement practices consistent with the principles of lean. As leaders improve theirlean management skills, their newly lean operations stabilize and begin paying offin better and better performance.
Nobody is born knowing these principles and how to implement them.Everyone has to learn them through practice, trial and error, and coaching. Youcan learn them, too. That is one of the main points of this book. With exposureto a few straightforward principles and some examples of how they can beapplied, you can learn to lead and implement lean management and by doing sosee your lean conversion live up to its potential.
117
LEADING A LEAN OPERATION


8Solving Problems andImproving Processes—Rapidly
The lean management system consists of more than its four principal elements.A root cause orientation to problem solving, a rapid response system, and a pro-gressive approach to process improvement are among the elements that round outthe system. (Chapter 9 covers people-related elements.) This chapter covers eachof these topics.
A Root Cause Orientation to Problem Solving
Any manufacturing process will experience problems that interrupt or threatenproduction. That is as true of lean systems as of any other. A key distinctionbetween lean and batch-and-queue systems lies in how they deal with theseinevitable problems.
The typical response in batch and queue is to work around the problem,often in creative, sometimes unconventional ways. The focus, of course, is ondoing what it takes to meet the schedule. In a lean environment, the typicalresponse is to ask why the problem occurred and what caused it.
This reveals one of the least obvious aspects of the lean production and man-agement systems: Lean is an improvement system. Implementing a lean produc-tion system does not solve problems. Instead, lean exposes problems, so you cansee them, eliminate their causes, and improve.
You have probably heard the metaphor about implementing lean: you are“lowering the water to expose the rocks.” That is, as you implement lean production,
119

you reduce the extra resources—both formal and informal—that were in place toprotect the batch-and-queue system from long-unaddressed problems. These“just-in-case” resources are the “water” that lean implementations “lower.” Theidea in lean is to systematically expose the problems that have always been pres-ent, but covered over, hidden by the extra resources, like the water behind a damcovers what used to be dry land. Once exposed, the problems can be analyzed forcause, and then eliminated.
As you lower the water, the problems show themselves. Some are listedbelow:
• Setups take hours and hours. Batch solution: Keep extra inventory onhand to cover the changeover time.
• A workcenter produces defects seemingly at random a quarter of thetime. Batch solution: Keep extra inventory on hand to draw on incase we hit a run of bad parts.
• A piece of equipment goes down like a yo-yo, but does not comeback nearly that fast. Batch solution: Keep other equipment onhand that in a pinch can be set up to produce the needed parts,even if the process is not quite the same.
• A supplier just cannot seem to deliver the full order, at least not ontime. Batch solution: Again, cover this unreliability with extrainventory to draw on, just in case.
• Well, that’s just George or Jane: S/he’s like that some days. Batchsolution: Just work some OT or add someone else to the line to takeup the slack.
Lean exposes these problems, some of which you knew you had, but hadgiven up ever resolving. As a perverse kind of bonus, lean also exposes problemsyou had no idea were lurking, waiting for the chance to bite you. Yes, that reallyis the sound of opportunity knocking; it just sounds like you gritting your teeth!
Workarounds Are Anti-ImprovementOnce problems present themselves in the form of flow interrupters in a variety ofdisguises (process quality, equipment reliability, supplier performance, supportgroup responsiveness, operator skill deficits, leadership commitment, and on andon), you have two choices.
The first is tried and true: Go back to the stashed extras you were supposedto have gotten rid of with the lean implementation, but had not quite gottenaround to. Pull them into the process. Do a workaround and meet the schedule.The schedule is the object, right? Tomorrow maybe things will work out better.
120
CREATING A LEAN CULTURE
The second alternative is to do what you must to patch up the process. Afterall, you have customer commitments to meet. But as you do, take careful note ofwhat seems to have gone wrong. Document it in the management system toolsyou are beginning to use. Come back to the problem as soon as you can, andbegin asking simple questions such as: Why? What was the cause of this interrup-tion? Drill down to the root cause. Identify the top three interrupters for the weekor month. Begin to work on either preventing recurrences or setting alarms toalert you that an episode of a known problem is about to happen. Keep workingdown the list of known interrupters as you discover and eliminate root causes.
A New Way of ThinkingThis sounds simple, but it takes a new way of thinking from the perspective ofmost who grew up in a batch environment. Consider this contrast: In batch-and-queue systems, leaders are expected to quickly work around problems to meet theschedule. When the workaround is successfully in place, the problem is consid-ered solved; tomorrow is another day. By comparison, lean leaders are expectedto perform cause analysis and put a root cause solution into effect (see the casestudy on pp. 122-123).
Should Perfection Be A Goal?This example is not a dramatic one, but it illustrates an important point noted inchapter 7: Lean thinking involves being serious about pursuing improvementwith the goal of eventually reaching perfection in process and execution. Beforethe change in this illustration, one of the team leaders was usually available tocome off his or her job to perform the rework, even though that meant skippingother duties (that potentially could have included monitoring standardized workin the upholstery process). The problems were virtually never severe enough tocause a miss in daily schedule completion. In the previous batch-and-queue envi-ronment, one that still existed in other parts of the plant, working some overtimeto achieve daily schedule completion was routine and perfectly acceptable.
Several things made the difference in turning the lean corner in the uphol-stery operation, which by the way, went on to many more incremental improve-ments that taken together have transformed the appearance, performance, andproductivity of the area. One factor was faithfully maintained documentation atfinal assembly. When attention shifted from schedule completion to process qual-ity and yield, the initial data were available right away for Pareto analysis to revealupholstery as the leading source of interruption.
A second, and the most important, was a gradual change in mindset ofleadership in the area, prompted by ongoing coaching by the plant’s resident lean
121
SOLVING PROBLEMS AND IMPROVING PROCESSES—RAPIDLY

sensei. As thinking shifted from schedule completion to process quality and yield,the leaders began to ask why they had continuing upholstery rejects. They tooka systematic approach to discovering the causes of the problems, and to eliminat-ing them so the problems did not recur. Once they focused on improvement,rather than living with a longstanding but manageable problem, they were able
Case Study: New Leaders Uncover the Cause of Old Problems
A case illustrating this difference in thinking comes from an area build-ing a hot new product. The product included upholstered componentsthat were sub-assembled in a process for sewing and upholstery linkedto the final assembly line and supplying it in sequence one unit at atime. The assembly-line team leader was scrupulous about maintainingdocumentation of flow interrupters that caused his takt-paced line tomiss its goals for hourly performance, even though his records hardlyever sparked action.
A common flow interruption at final assembly was wrinkled upholstery.When that occurred, the unit had to be shunted to the repair area, dis-assembled, the upholstered subassembly returned to the feederprocess, taken apart and reworked, and the unit reassembled. Thisprocess caused considerable delay; the result was missed output goalsat final assembly. Initially when these problems occurred, they weresimply reworked, often by the team leader in either final assembly orthe upholstery area. The workarounds caused some overtime, butbecause it was not tracked separately from the regularly scheduledovertime used to meet strong customer demand, it was not examined.
A retirement and two reassignments brought new leaders to the area.They paid more attention to their resident lean sensei than had theirpredecessors. The previous leaders had seemed more interested inmaintaining their numbers for cost and schedule completion than inbringing the area to a new level of lean operation.
As the new leaders in the area progressed in their lean thinking, theystarted to analyze the hourly tracking charts from final assembly and
122
CREATING A LEAN CULTURE
to make a permanent fix, a permanent process improvement. The supervisor inthis area has come to see perfection as a goal, though he does not talk about it inthese terms. Rather, he talks about the need to make further improvement. A clueto the larger goal of perfection, however distant and even indefinable, is that hesees no end to the possible improvements.
the log sheets from the final assembly “hospital,” or repair area. Thenew value stream manager and her two supervisors found upholsteryto be the single leading cause, both for units going into the repair areaand for the final assembly line missing its hourly goals. Further inves-tigation (including a more specific definition of what was meant by“bad upholstery”) identified wrinkles and puckers as the most frequentcauses for rejects.
The upholstery supervisor followed up. He found standardized work inthe upholstery area called out the correct process, but without much inthe way of specific detail. He also found that the upholstery processwas rarely monitored for anything other than volume of output.
Further investigation showed that the main causes of rejected, wrin-kled upholstery were either not enough fasteners used to attach thefabric to the substrate, uneven spacing of the fasteners, incorrectsequence of fastener application, or all three. And, wrinkling variedbetween two types of upholstery fabric, requiring different numberand spacing of fasteners for the two different classes of material.
The supervisor and team leader in the upholstery area, having reachedan understanding of the leading causes of rejected subassemblies,built a life-sized display of the correct number and spacing of fasten-ers for the two different materials, retrained the operators, and moni-tored performance against the newly clarified standard. The wrinkledupholstery problems virtually disappeared from final assembly.
In the meantime, a downturn in orders had occurred so that overtimewas no longer routine. Now, extra hours were directly traceable toproduction problems. With the change in the upholstery process, thedecline in need for unplanned overtime could be observed as a resultof this improvement.
123
SOLVING PROBLEMS AND IMPROVING PROCESSES—RAPIDLY
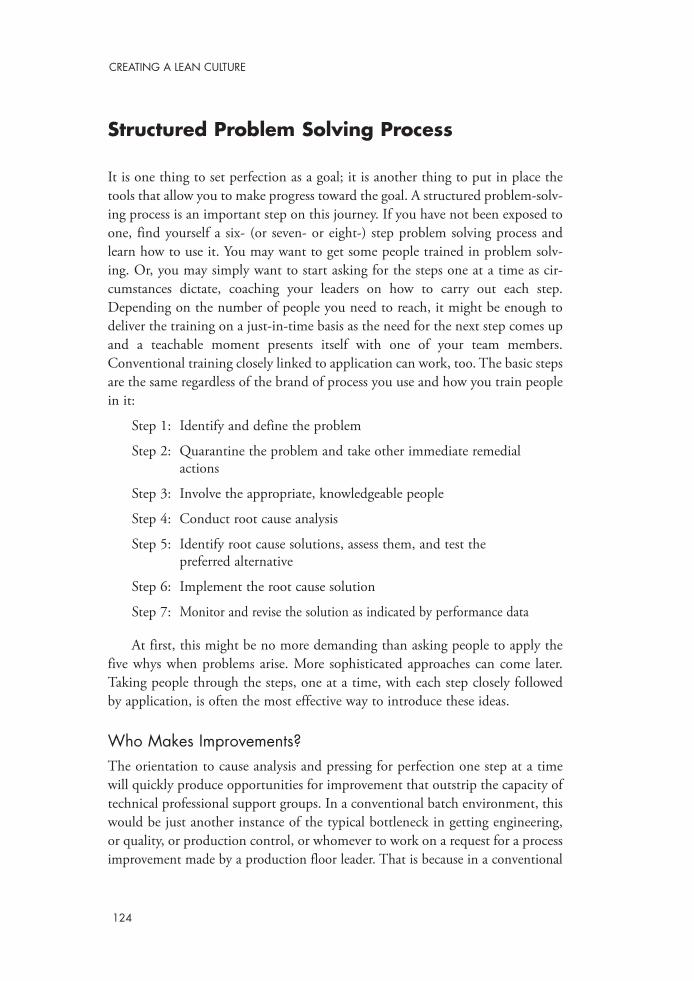
Structured Problem Solving Process
It is one thing to set perfection as a goal; it is another thing to put in place thetools that allow you to make progress toward the goal. A structured problem-solv-ing process is an important step on this journey. If you have not been exposed toone, find yourself a six- (or seven- or eight-) step problem solving process andlearn how to use it. You may want to get some people trained in problem solv-ing. Or, you may simply want to start asking for the steps one at a time as cir-cumstances dictate, coaching your leaders on how to carry out each step.Depending on the number of people you need to reach, it might be enough todeliver the training on a just-in-time basis as the need for the next step comes upand a teachable moment presents itself with one of your team members.Conventional training closely linked to application can work, too. The basic stepsare the same regardless of the brand of process you use and how you train peoplein it:
Step 1: Identify and define the problem
Step 2: Quarantine the problem and take other immediate remedial actions
Step 3: Involve the appropriate, knowledgeable people
Step 4: Conduct root cause analysis
Step 5: Identify root cause solutions, assess them, and test the preferred alternative
Step 6: Implement the root cause solution
Step 7: Monitor and revise the solution as indicated by performance data
At first, this might be no more demanding than asking people to apply thefive whys when problems arise. More sophisticated approaches can come later.Taking people through the steps, one at a time, with each step closely followedby application, is often the most effective way to introduce these ideas.
Who Makes Improvements?The orientation to cause analysis and pressing for perfection one step at a timewill quickly produce opportunities for improvement that outstrip the capacity oftechnical professional support groups. In a conventional batch environment, thiswould be just another instance of the typical bottleneck in getting engineering,or quality, or production control, or whomever to work on a request for a processimprovement made by a production floor leader. That is because in a conventional
124
CREATING A LEAN CULTURE

batch production operation, improvements are “left to the experts.”In this conventional scenario, a technical project team moves into and then
out of a production area, leaving in their wake what they intend to be permanentfixes. Sometimes these “fixes” only work on paper, in which case they are quicklyundone. However, sometimes project teams’ fixes work quite well. But, becauseit works, it gets no further attention. The process remains static, often for manyyears, without further improvement. No further changes are made. That may bebecause the leader’s mindset (“It ain’t broke!”) blinds him or her to further oppor-tunities. Or, leaders may not know how to lead improvement efforts themselveswith mostly their own resources. The likely waiting time for a response by a tech-nical project team is often so long that it is not worth initiating the request.
Short-, Medium-, and Longer-Term ImprovementsIn a lean environment, the expectation is that everyone has two responsibilities.The first is to run the business on a day-to-day basis. The second is to improvethe business, or contribute to improving it continuously. We have already seenone example of this dual responsibility in the daily accountability process and itstask assignment board. Improvement efforts in lean management usually fall intoone of three categories (with movement between categories as experience dictates)determined by scope, scale, and duration of the improvement task. Table 8.1 liststhese categories.
(Note that while these categories do not explicitly include acting on employeesuggestions for improvement, any such suggestion can be easily fitted into oneof these three. Chapter 9 covers employee improvement suggestion systems indetail.)
125
SOLVING PROBLEMS AND IMPROVING PROCESSES—RAPIDLY
Duration of task Typical focus How managed
1 to 5 days Fix an immediate problem,implement a simple improve-ment, simple cause analysis
Daily task assignment board;follow up at three-tier meetings
6 to 30 days Problem solving process for morecomplex cause analysis, solutionor recommendation
Via one-page (A-3) visual projectplan reviewed at weekly projectreview session
30 to 90 days Longer-term or more complexproblems or opportunities
Via one-page (A-3) visual projectplan reviewed at weekly projectreview session
Table 8.1. Options for improvement activities
Simple problems or straightforward improvements can be assigned and man-aged in the daily accountability process three-tier meetings. For example, a teamleader might be assigned to make a shadow board for tools currently kept indrawers and often missing when needed. With the shadow board in place, theteam leader might be assigned to update team leader standard work to verify toolshave been returned to their indicated places at the end of each shift.
Recommending Future ImprovementsAnother outcome of an initial investigation from a daily task assignment is to rec-ommend a project for the list of future kaizen improvement events in an area. Forexample, investigation of the cause of an intermittent backup on an assembly lineidentified interruptions in a packing operation caused by poorly organized partsand materials that often resulted in the operator having to leave the workstationto search out the proper materials. In this situation, two kaizens in successionhave attacked organization, material resupply, and parts presentation in the packarea. The kaizens were one week in duration, held about six weeks apart. The sec-ond event refined the work of the first based on the intervening experience.
Managing Improvement ActivitiesYou may, at first, find it confusing to determine the relationship among short-medium-, and longer-term improvements. The best advice is to start and sortthings out as you go. Experience says you will figure out a method that makessense for you and those who are involved in it. Do not hesitate to consider thesearrangements as experiments on the way to establishing a stable process. Here area few guidelines to use in sorting out your process:
• Manage each improvement with a single person
• Manage improvements visually in only one location
• Manage each improvement with only one schedule
• Hold review sessions at least once a week
• Avoid projects that extend more than 90 days; form serial sub-projects as needed
• Avoid making lists (black holes) of projects; manage the queuevisually
• Group activities of like-duration with like management (e.g. dailyboard, weekly A3s)
126
CREATING A LEAN CULTURE
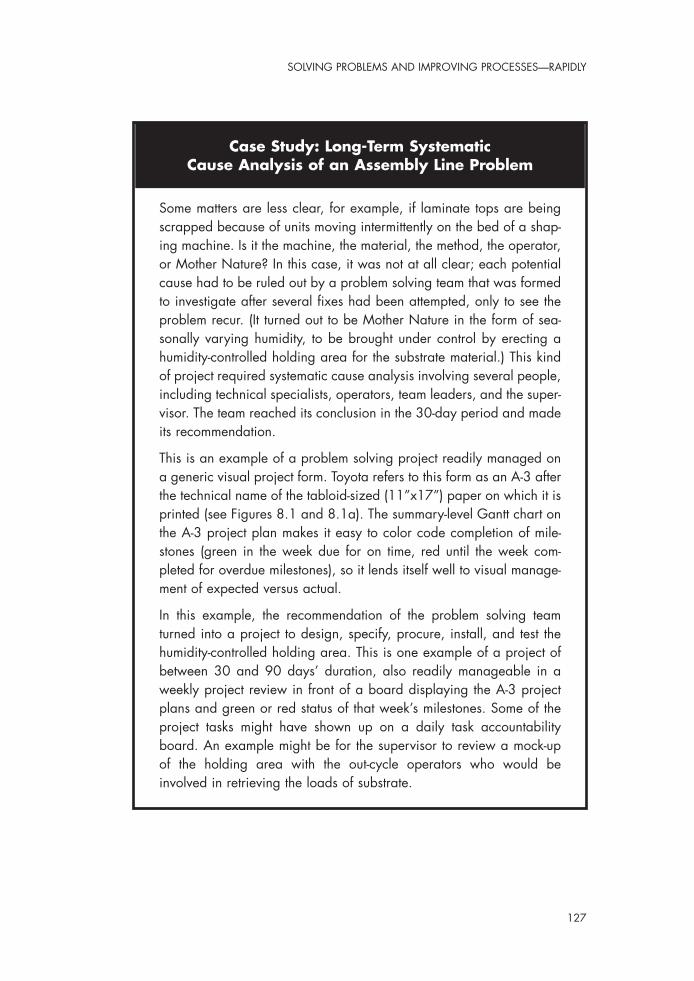
127
SOLVING PROBLEMS AND IMPROVING PROCESSES—RAPIDLY
Case Study: Long-Term Systematic Cause Analysis of an Assembly Line Problem
Some matters are less clear, for example, if laminate tops are beingscrapped because of units moving intermittently on the bed of a shap-ing machine. Is it the machine, the material, the method, the operator,or Mother Nature? In this case, it was not at all clear; each potentialcause had to be ruled out by a problem solving team that was formedto investigate after several fixes had been attempted, only to see theproblem recur. (It turned out to be Mother Nature in the form of sea-sonally varying humidity, to be brought under control by erecting ahumidity-controlled holding area for the substrate material.) This kindof project required systematic cause analysis involving several people,including technical specialists, operators, team leaders, and the super-visor. The team reached its conclusion in the 30-day period and madeits recommendation.
This is an example of a problem solving project readily managed ona generic visual project form. Toyota refers to this form as an A-3 afterthe technical name of the tabloid-sized (11”x17”) paper on which it isprinted (see Figures 8.1 and 8.1a). The summary-level Gantt chart onthe A-3 project plan makes it easy to color code completion of mile-stones (green in the week due for on time, red until the week com-pleted for overdue milestones), so it lends itself well to visual manage-ment of expected versus actual.
In this example, the recommendation of the problem solving teamturned into a project to design, specify, procure, install, and test thehumidity-controlled holding area. This is one example of a project ofbetween 30 and 90 days’ duration, also readily manageable in aweekly project review in front of a board displaying the A-3 projectplans and green or red status of that week’s milestones. Some of theproject tasks might have shown up on a daily task accountabilityboard. An example might be for the supervisor to review a mock-upof the holding area with the out-cycle operators who would beinvolved in retrieving the loads of substrate.

128
CREATING A LEAN CULTURE
1 2 3 4 5 6 7 8 9 10 11 12 13 14 15
Wee
k of
Resp
onsi
ble
Impl
emen
tatio
n Pl
an
Cur
rent
Sta
te
Futu
re S
tate
Back
grou
nd
Obj
ectiv
e or
Pro
blem
Sta
tem
ent
1 2 3 4
Futu
re S
tate
Cur
rent
Sta
teM
easu
re
Perfo
rman
ce M
easu
res
Due
dat
e ke
y:
Gra
y =
orig
inal
due
dat
e
Gre
en =
task
com
plet
e (in
wee
k co
mpl
eted
)
Red
= ta
sk o
verd
ue (e
ach
wee
k ov
erdu
e)
Proj
ect P
lan:
Star
t dat
e:
Figure 8.1. A-3 project plan form
8_Solving_Problems.qxd 1/10/06 11:53 AM Page 128
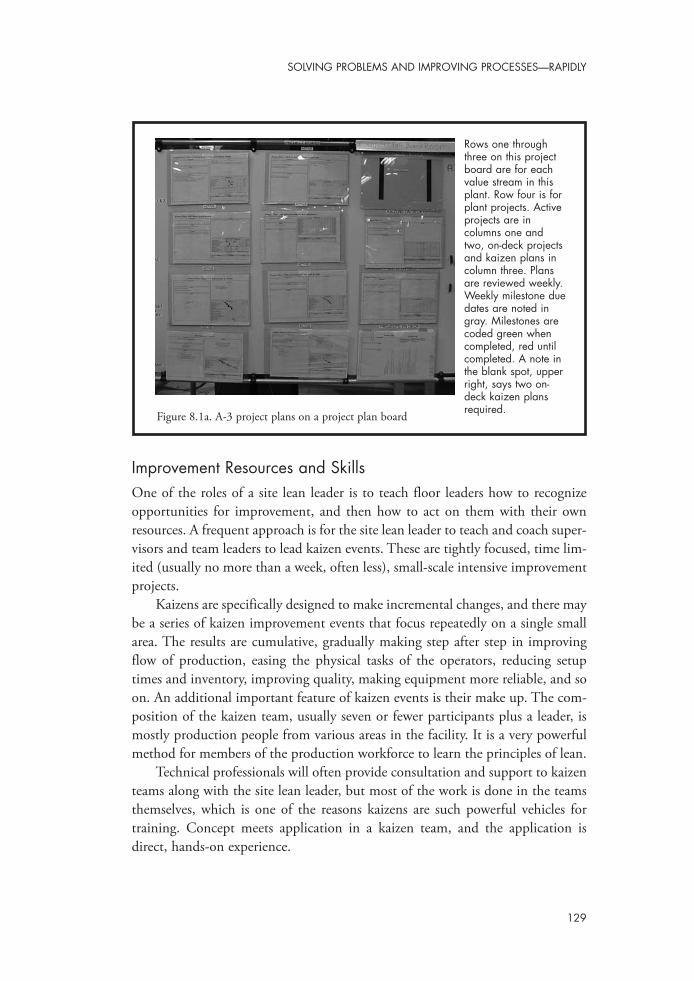
Improvement Resources and SkillsOne of the roles of a site lean leader is to teach floor leaders how to recognizeopportunities for improvement, and then how to act on them with their ownresources. A frequent approach is for the site lean leader to teach and coach super-visors and team leaders to lead kaizen events. These are tightly focused, time lim-ited (usually no more than a week, often less), small-scale intensive improvementprojects.
Kaizens are specifically designed to make incremental changes, and there maybe a series of kaizen improvement events that focus repeatedly on a single smallarea. The results are cumulative, gradually making step after step in improvingflow of production, easing the physical tasks of the operators, reducing setuptimes and inventory, improving quality, making equipment more reliable, and soon. An additional important feature of kaizen events is their make up. The com-position of the kaizen team, usually seven or fewer participants plus a leader, ismostly production people from various areas in the facility. It is a very powerfulmethod for members of the production workforce to learn the principles of lean.
Technical professionals will often provide consultation and support to kaizenteams along with the site lean leader, but most of the work is done in the teamsthemselves, which is one of the reasons kaizens are such powerful vehicles fortraining. Concept meets application in a kaizen team, and the application isdirect, hands-on experience.
129
SOLVING PROBLEMS AND IMPROVING PROCESSES—RAPIDLY
Figure 8.1a. A-3 project plans on a project plan board
Rows one throughthree on this projectboard are for eachvalue stream in thisplant. Row four is forplant projects. Activeprojects are incolumns one andtwo, on-deck projectsand kaizen plans incolumn three. Plansare reviewed weekly.Weekly milestone duedates are noted ingray. Milestones arecoded green whencompleted, red untilcompleted. A note inthe blank spot, upperright, says two on-deck kaizen plansrequired.
A Rapid Response System
You have team leaders on the floor paying close attention to the way the processis operating. The new lean approach is great when it works, but quickly comes toa halt when things go wrong. Ouch! When that happens you need a response—fast. There are several ways to summon help quickly. The range includes simple
Case Study: Working Without a Response System (#1)
The first case occurred, not coincidentally, in the plant where thesupervisor “stored” the production-tracking forms on the floor underhis desk. The lean conversion involved switching from a build-com-plete process at a number of stand-alone two-person workbenches toa single progressive build assembly line. In the bench-build process, anumber of subassemblies were produced in batches upstream fromassembly, picked into kits based on a schedule, and pushed up to thebenches. The progressive build line incorporated a number of thesesubassembly areas in an integrated takt-paced flow productionprocess. Signals went out to subassembly production from the singleschedule point in the flow process.
It was extremely rare for production to stop in the bench-build sce-nario. There was always the option of working ahead based on theschedule. And, if one bench experienced problems, it was likely theothers could keep on producing while the problem load was pushedaside and the next one brought in. In the flow process, when there wasan interruption, 13 people stood around waiting for the problem to beidentified and fixed. Two temperamental pieces of automated equip-ment were built into the flow process. They failed repeatedly. Worse,the failures were intermittent.
To the credit of the project team designing the new flow process, theyrecognized the need to establish a quick response process and toldthe support groups they would need their support in a different andmore timely way than in the past. Maintenance, engineering, andmaterials management agreed, and for the first several weeks whenthe “911” calls went out, the response was timely. A host of flow inter-
130
CREATING A LEAN CULTURE

call lists (be sure a phone is close at hand), specially designated pagers (often redin color) carried by designated support group reps who are “on call,” escalation sys-tems based on number of missed cycles, automated escalation systems, and so on.
Do not be lulled by these arrangements; a rapid response system is not aboutthe cool technology you use to summon assistance.
The necessity of changing the connection between support groups and pro-duction areas is an often-overlooked aspect of lean production. For lean to be sus-
131
SOLVING PROBLEMS AND IMPROVING PROCESSES—RAPIDLY
ruptions quickly emerged as the new process began operation. Therewere frequent material shortages outright, and material supply errorsresulting in mix-ups in the sequence of parts to the various stations onthe progressive assembly line. There were problems with alignment ofparts in assembly that used to be muscled through at the benches.Now, these problems caused repeated disruptions in flow at the 36-second takt time. And, the automated equipment also failed intermit-tently, causing further interruptions.
It was a pretty typical startup for a lean conversion. The system wasdoing what it was supposed to do, exposing flow interruptions.Unfortunately, there was no accountability process in place. Theincreasingly frustrated value stream manager reported the mainte-nance, fit-up, and equipment problems in daily plant staff meetings,the way it had always been done. The response was to put the prob-lems on a list of functional projects, also the way it had always beendone. The response system also quickly regressed to operating theway it always had.
The plant manager at the time had left the lean conversion to his proj-ect team. The new layout looked good from the aisle and when every-thing was right, it ran beautifully. But as soon as the project team, withits support group specialists, disbanded a few weeks after the start ofproduction, there were no extra resources on hand to resolve prob-lems that repeatedly surfaced. The plant manager expected nothingdifferent in the way his support groups responded. And he had noinclination to change the reporting relationships of the support groups.The management system had not changed in the rest of the plant, andthe converted area continued to struggle until the product line wasmoved out of the plant.
tained without yielding to the temptation to go back to buffers of time, labor,and material, quick response is needed when interruptions arise, as they definitelywill. What comes to the surface is simply this: The most important activity in aproduction facility is production. The tasks and projects that engineering, pro-gramming, skilled trades, quality, supply chain, and scheduling work on are notunimportant. They are just not as important as what happens on the productionfloor when one of these specialists is needed to, as the name indicates, supportmanufacturing.
This is often a new idea. In the previous batch-and-queue operating environ-ment, there were buffers of hours or even days between operations. When oneelement of the process experienced problems, it was naturally isolated from theothers by the inventory waiting between each process—the “queue” in batch andqueue. In this world, it was important to respond to problems on the floor, butrarely was there a sense of urgency to the response. Support groups had goals andprojects that they focused on. The phone calls (or emails) could usually wait, and
Case Study: Working Without a Response System (#2)
The second case involved the same plant as the first, and two of thepeople who had served on the project team for the first project. Oneof them had been the co-leader responsible for the lean technicaldesign alongside the person who had become the value stream man-ager. In the new project, this former co-leader wore both hats: projectteam leader and value stream manager. Two other factors came intoplay. Instead of converting an existing batch-built process to a leanone, this project involved a high profile new product. And there wasa different plant manager. The organization structure and reportingrelationships of the support groups remained exactly the same asbefore.
This time, the value stream manager implemented a complete leanmanagement system along with the physical implementation. Becauseit was a new product, the plant manager’s boss was more engaged inthe project, and so was the plant manager. The company had had sev-eral years of experience in lean conversions since the first case. Morepeople had been exposed to the tight interdependency within a leanproduction process, as well as between the production area and its
132
CREATING A LEAN CULTURE

usually did. But no more. Some would immediately conclude that a different organization structure is
required, that is, a value stream organization in which support group membersreport directly to the value stream manager. Depending on the disposition ofhigher-level leaders, this can become a political struggle that absorbs time andenergy and does not always yield the hoped-for outcome. An alternative is to focuson the production process and the accountability process that helps to sustain it.
It is typically easier to gain commitment for measured, timely response to acall for support than it is to get the organization chart changed. The former is likeapple pie and motherhood; who could argue with agreeing to a rule-governedquick response to a stoppage in production? On the other hand, a proposal tochange reporting relationships can easily be perceived, and often rightly so, as anassault on a fellow manager’s power base. You have enough things in your newlyconverted lean process to worry about already without picking that kind of fight.The cases on this and the previous pages, describe two scenarios: one where the
133
SOLVING PROBLEMS AND IMPROVING PROCESSES—RAPIDLY
support groups. The plant manager agreed to be part of the responsesystem, the last one on the call list when production was stopped.According to the response system, he was to be called when produc-tion was interrupted for half an hour.
An element in the response system was a log sheet kept right by theline-side telephone from which the “911” calls were placed. The logrecorded actual versus expected response times in the escalating net-work of calls, and reasons for misses when they experienced delayedresponses to calls for help. These “reasons for misses” were reviewedno later than the next day.
There were few misses on the occasions when “911” calls went out.The supervisor virtually always responded within the expected threeminutes. The plant manager always responded when his number wascalled, even if the response had to be by phone. He expected a timely,in-person response from the support group members assigned on agiven day to wear the response system red pager.
This time, the response system worked. Leaders were aligned and themanagement system was in place to record, review, and act whenactual did not meet expected throughout the process. No change instructure was needed, but for the system to work as it did the manyother changes noted above were required.

CREATING A LEAN CULTURE
plant manager and support groups were not enrolled in a response system inadvance, and one where they were.
Support Groups Must Keep Pace With ProductionThese examples illustrate the often unanticipated implications for the organiza-tion that follow from the newly lean production area. For lean management towork effectively, the support groups have to be prepared to respond at a pacedetermined by the takt pace of production—at a minimum, that means supportgroups realigning priorities and leadership expecting accountability for the newpriorities. Organization structure is not much of an issue when site managersunderstand the implications of lean and are willing to hold their staffs account-able for supporting a new, lean direction.
Organizations need functional groups to maintain ready technical expertiseand skills. Nothing in lean management suggests disbanding the central func-tional organizations. In the longer run, it does make sense to dedicate supportgroup staffers to lean value streams on a long-term rotational basis. As the processchanges that radiate out from lean conversions become clear, the switch to dedi-cated value stream organizations should be a less emotional issue than at the outset.
Summary: Finding the Root Cause ofProblems Is Key
Lean is an improvement system in which several apparently contradictory ele-ments are joined. First, the system is designed to expose problems, occasionallybringing production to a complete halt until the problem is resolved. Second, theorientation to root cause problem solving seems to suggest dramatic, large-scaleprojects to eliminate problems. Yet a primary method for eliminating causes ofproblems is to make repeated incremental improvements, clarifying problems andrecommending solutions that can often be implemented in a week by a kaizenteam. One of the keys to effective process improvement is developing a clearunderstanding of the cause of the problem, using the tools and logic of system-atic problem solving processes.
Separating improvement activities into short-, medium-, and longer-term isa way to give appropriate emphasis and attention to each kind of improvement.
Not all problems can be resolved right away. Some require emergency orshort-term countermeasures that allow production to continue while the cause ofthe problem is diagnosed. Because lean production systems are so tightly interde-
134 134

pendent, when a problem occurs in production, a quick response is essential. Forthese reasons, a response system is an important part of any lean system. Themost challenging aspect of putting such a system in place is realigning the prior-ities and perhaps the measures of support groups. Otherwise, the response systemexists in name and hardware only.
135
SOLVING PROBLEMS AND IMPROVING PROCESSES—RAPIDLY

9People—PredictableInterruption; Source of Ideas
People and their ideas for improvement are close to the heart of lean production.They can also seem to be close enough to the neck to cause a pain there. Perhapsthat is because of lean leaders’ experience when they go to start production onlyto find one or more people have “called in” as unplanned absences. With produc-tion finely balanced to the rhythm of takt time, missing a person or two is a bigdeal. Without just the right number of people, flow does not flow, pull can dete-riorate into stockouts, and the takt beat is uneven and sporadic.
People issues may not seem to lend themselves to the process-focused com-parison of actual and expected. In actual application, the lean managementapproach works well with matters of attendance, rotation and staffing, perform-ance issues, and employee involvement in process improvement suggestion sys-tems. This chapter shows how. HR policy issues also come into play when talk-ing about people issues in a lean conversion. Matters such as job grades and clas-sifications, pay systems, start and break times, job rotation, and layoff policies arelikely to need attention in support of a lean environment.
Whom Do I Expect Today? The AttendanceMatrix
The first people-related issue is the most frequent one to arise: Who is here forwork today?
We know people will be absent, we just do not know who and when. Typical
137
arrangements for handling absenteeism include carrying extra people—as manyas 8 to 10 percent seasonally—to call on when people unexpectedly call in to saythey will not be at work today. So, there are extra people in the plant. Just tryfinding them when you come up short! Often it is a time-consuming scramblethat ends in frustration for all involved. I cannot get the person I need or havebeen promised; the person I do get did not want to come and is not trained inthe work I need to have done. There is a striking lack of process in many places,just like this scenario. The first question a lean sensei will ask is: What is theprocess here? In the case of attendance, there is none. Is an absence process pos-sible?
Many attendance tracking processes are limited to the number not expectedat work. That is, we use calendars for the coming year to write in those workerswe expected to be off on vacation, in large part, so we do not grant too muchvacation in any single week to handle seasonally expected demand. So, the vaca-tion log tells me who will not be available.
A different approach is to use an attendance matrix (all the people on theteam, by every day of the month, a page per month for the year) filled in to tellme those whom I can expect to be at work tomorrow. Entries in the matrix identify:
• Those with planned vacation for the day (usually coded yellow forthat person’s row for the days of planned vacation);
• Those loaned out to another area or otherwise assigned (for exam-ple, to a project) and thus, unavailable for work for a period of time(coded blue);
• Those on medical or other leave (coded green).
I should be able to count on everybody else showing up, ready to go. Whenpeople call in, they get coded red for the day. If they are late, they are coded halfred (see Figure 9.1).
Do people dislike being coded red? Sure they do! Do we count on everyonewe have planned on to show up in order to have a productive day? Sure we do!Should people be accountable for their presence when the team plans on it? Youbet! Toyota is said to hold startup meetings at the beginning of the shift in largepart to tell who has reported for work so plans can be adjusted as needed. At theirassembly plant in Kentucky, employees with perfect attendance for the year areeligible to participate in a raffle where cars are the grand prizes. Showing up isimportant in a lean workplace! Think of the savings associated with not havingto deal with as much absenteeism as you do today. Of course, unforeseen thingswill happen to cause even reliable people to have an unplanned absence on occa-sion. Still, showing up when planned is important in a lean environment—foreveryone.
138
CREATING A LEAN CULTURE

139
PEOPLE—PREDICTABLE INTERRUPTION; SOURCE OF IDEAS
Nam
e
Chr
is
Geo
rge
Gia
com
o
Hak
im
Jole
ne
Juan
Kim Kit
Mar
cus
Moo
n
Phan
Rosa
Shau
n
Will
ie
21
43
65
87
109
1211
1413
1615
1817
2019
2221
2423
2625
2827
3029
31
21
43
65
87
109
1211
1413
1615
1817
2019
2221
2423
2625
2827
3029
31
Are
a:M
onth
:A
tten
dance
Matr
ix
Not
e: A
bsen
ce s
tatu
s is
sho
wn
by c
olor
cod
es. I
n th
is b
lack
and
whi
te e
xam
ple,
gra
y sh
ades
repr
esen
t the
col
ors.
One
col
or s
chem
e de
fines
yel
low
for v
acat
ion,
red
for u
npla
nned
abs
ence
(cal
l-in)
or l
ate,
gre
en fo
r med
ical
, and
blu
e fo
r pro
ject
or l
oane
d ou
t.
Vaca
tion
Cal
l-in
Late
Med
ical
Proj
ect/
loan
Figure 9.1. Attendance matrix
9_People_Predictable.qxd 3/31/05 3:41 PM Page 139

Who Starts Where Today? The Labor andRotation Plan
Job rotation through a home rotation pattern is a common feature in the leanworkplace. Rotation helps prevent ergonomic injury from repetitive motion. Itresults in a cross-trained workforce with the flexibility to move to any of severaljobs as needed. And, it means that many people are looking at each job, makinga more fertile field for producing suggestions to improve the job for ease, safety,quality, or efficiency.
Rotation also requires more work for the team leader, who has to establishquickly who starts where at the beginning of work. Relying on memory is oneway. But can the team leader reliably recall who started where yesterday, or whereeveryone ended? Probably s/he cannot. What about asking people where theystarted or finished the day, or the same questions, but for people who are offtoday? That does not seem like a good plan either. An alternative is a simple setof visual controls that go along with the expected attendance matrix and a qual-ification matrix. Taken together, these form a suite of tools for labor planning.
Completing the Labor Planning SuiteA labor and rotation plan is a map that identifies the workstations and assign-ments in a work area—production workstations, team leaders, waterspiders, etc.In most cases, an abstract schematic that identifies only the workstations or thenames of other assignments works best. A label (magnetic is helpful here) for eachteam member’s name goes on the map at the location where that person starts. Arotation schedule (clockwise, zigzag, or a matrix of names and workstations)completes the picture. The attendance matrix shows who is expected to be avail-able for the next shift. It only takes a few minutes at the end of the day to set upthe next day’s labor plan, moving the nametags from where they were yesterday.This way, people can quickly find their starting assignment at the shift start upmeeting (see Figures 9.2 and 9.2a).
Who Is Qualified for Which Jobs? Training records usually reside in a file cabinet somewhere, either in a supervisor’sdrawer (not great) or in the training department (worse). When someone calls inas an unplanned absence and production is set to begin, you need to know rightnow who you can call on to fill in, even if only briefly to get production going. Aqualification matrix (see Figure 9.3) tells you who is qualified at what level forwhich jobs. It includes information for all the people on your team as well as
140
CREATING A LEAN CULTURE

141
PEOPLE—PREDICTABLE INTERRUPTION; SOURCE OF IDEAS
Labor and Rotation Plan: Sled Assembly
Team Leader:Support
Team Leader:Assembly
Chris
George
Giacomo
Helen
Jolene
Juan
Kim
Marcus
Moon
Phan
Rosa
Shaun
Willie
Waterspider
Takeoff 1
Takeoff 2
Strap sub-assembly
Cam sub-assembly
Back towaterspider
Ass’ystation 1
Ass’ystation 2
Ass’ystation 3
Ass’ystation 4
Ass’ystation 5
Ass’ystation 6
Back toass’y stn. 1
Medical
Vacation Project/Loaned
Note this labor plan-ning board includesstaffing requirementsfor the three takt timesfor which this assemblyarea has balancedstandard work.Capacities for differenttakt times and hoursare noted on the plan.An area on the boardto the left of this photoidentifies operatorswho are loaned out,on projects, on vaca-tion, or unplannedabsences.
Figure 9.2a. Example of a labor planning board
Figure 9.2. Labor and rotation plan
9_People_Predictable.qxd 1/10/06 11:52 AM Page 141
some from outside it. For example, if others have been interested enough in yourarea to become qualified in it, or have moved on from your area to another, theywould appear on the matrix with the level of qualification they had achieved.
With this information, you are not simply asking for a warm body to fill in,hoping they can learn the work, keep up, produce good quality, and avoid injury.Instead, you can go to your three-tier meeting, at which labor balance is high onthe agenda, and make a specific request for Giacomo and Eva, who you know arequalified to fill the openings you suddenly find yourself facing.
These four tools—the expected attendance matrix, labor plan, rotation map,and qualification matrix—make up the labor-planning suite. They provide, at aglance, information about availability, daily starting position, and qualification.Like other visual controls, the labor-planning suite raises the level of accountabil-ity, especially the case for attendance with the attendance matrix. The suite alsomakes patterns visible that may not have been seen as clearly, such as positionswhere too few people are qualified, the extent of cross-trained people from otherdepartments, or patterns of attendance that had gone unseen.
142
CREATING A LEAN CULTURE
Area:
Qualification Matrix
1 2
4 3
1 2
4 3
1 2
4 3
1 2
4 3
1 2
4 3
1 2
4 3
Chris
George
Asse
mbl
y 1
Asse
mbl
y 2
Asse
mbl
y 3
Name
Position
1 = Being trained2 = Can do the work with assistance3= Qualified; can do the work without assistance4= Qualified as a trainer
Figure 9.3. Sample skills matrix entries
9_People_Predictable.qxd 3/31/05 3:41 PM Page 142

How Can I Encourage Participation? The Idea System
Setting up conventional employee suggestion programs is quite straightforward.Making them work is another story. Traditional suggestion systems require con-siderable overhead: engineers costing-out proposed improvements; managers sift-ing, sorting, and culling; administrative people recording and routing informa-tion; and often several months later, the employee being thanked for a suggestionthat “…we just can’t commit resources to at this time.” Not very motivating!
When lean is truly an improvement system, it produces a steady stream ofemployee-generated suggestions for improvement. The question is how to get thestream started and then, how to keep the ideas flowing? Before an improvementidea system can work, the organization has to want it to work and has to believeemployees actually have ideas to contribute and a desire to do so.
And, as I suggested in chapter 5, the organization must have developed thecapability for tapping leaders’ latent potential for making bite-sized as well aslarger improvements while they also attend to their daily run-the-business tasks.The vacation paradox plays an important role in sustaining process improvementsuggestion systems, in the following way.
In a takt-paced lean production environment, virtually no time is available ina routine production day for operators to work on improvement activities outsideof structured improvement events such as kaizens or problem-solving teams.Most of their day is consumed by their standardized work; break time is about allthat is left. So, operators are going to have no time to work on implementingimprovements they have suggested. And, the benefit from suggestion systemsdoes not come from the suggestions, it comes from implemented improvements.The question becomes: Where do the resources come from to work on imple-menting employees’ suggestions for improvement as an improvement suggestionsystem is getting underway, and once it is established?
Who Will Work on Suggested Improvements?The answer is found in the long-term effect of the vacation paradox. Supervisorsand team leaders learn through experience with daily task assignments that theyreally do have time most days to work on improvement, especially in a stabiliz-ing lean environment. This previously unavailable capacity becomes part of thenew “way we do things around here.” As it does, this makes it possible for teamleaders, supervisors, and support group representatives to allocate the time forworking on improvement ideas, including those that come from operatorsthrough the improvement suggestion system. That is the key that unlocks the
143
PEOPLE—PREDICTABLE INTERRUPTION; SOURCE OF IDEAS
gate to sustainable participation in the suggestion process. Consider the two casestudies that follow.
Case Study: What Happens When Ideas AreNeglected
First is the composite portrait that is typical of well-intended lean imple-mentation projects. When suggestion programs are introduced, especiallyin the course of a lean transformation process, many operators will sub-mit ideas. Partly this is a function of the attention the area is getting fromthe project team working on the lean implementation. The team will oftensolicit operators’ input on design and feedback on its initial operation.Suddenly, lots of ideas are flowing, because ideas are being listened toand acted on—by the extra resources in the area from the project team.
Then the team begins to pull out and eventually disbands and moves on.They indeed have been able to act on many of the ideas from the area’soperators who, as a result, typically continue to submit them. The ideasnot directly related to the project are often left on a to-do list. And, newideas continue to come in as people gain experience with the newprocess. The poor supervisor is left with a pile of suggestions to go alongwith an entirely new production system to debug and learn how to run.Figuring out the newly redesigned area is where the supervisor puts his orher attention, generally leaving the pile of ideas untouched. The pace ofwork on ideas slows dramatically and typically stops altogether. At thesame time the stream of ideas is drying up and stopping.
This is usually a frustrating mystery to the leaders in the area, who oftengenuinely want the help and support of operators to make the area suc-cessful. The leaders have seen the quality of the suggestions and the liftpeople experience from seeing them implemented. And now, nothing! Butmuch else is pressing, and soon the leaders’ attention has understandablyshifted to things about which they know how to do something.
Applying the vacation paradox to implementing suggestions
The second illustration involves a case of waiting for the vacation para-dox to take hold, and then applying it to an improvement suggestionprocess. This was an example of dramatic change and improvement fromthe first blush of a lean transformation in an assembly area. Managementwas rightly pleased with the change, but the value stream manager knew
144
CREATING A LEAN CULTURE
much remained to be accomplished. She began using a version of thethree tier meeting process plus regular routine audits and gemba walks togenerate task assignments to the supervisor, team leader, and supportgroup representatives who worked with the area.
Just as you would like to see, the area did not rest on the accomplishmentsof the project team. Instead, it kept improving, driven by the ongoingprocess of assessments from the production-tracking data, conversioninto short-term assignments, and follow-up for daily accountability. Thisprocess went on for several months, becoming a routine. The value streammanager then initiated a suggestion system for process improvements.One of its features was that it was a visual system, described below.Second, and most important, was that it involved the supervisor and teamleader sorting the suggestions and taking responsibility for getting themimplemented in a few days or at most a week, in just the same way theyhad become used to taking responsibility for acting on daily improvementtask assignments.
The value stream manager recognized that implementing some of the sug-gestions was beyond the scope of the team leader or even the supervisor.So, she separated the “idea board” into two segments. The upper half dis-played the ideas and status of submissions from the team members thatwere being worked on or were in queue for the supervisor or team leader.The lower half of the display held team members’ suggestions that thevalue stream’s support groups were working on. The value stream man-ager held a portion of the stream’s support group capacity in reserve forassignment to work on employees’ worthy suggestions that were beyondthe scope of local line management to complete. She held a weekly meet-ing with her value stream support group representatives, the area super-visor, and the team leaders to evaluate the week’s ideas. At this meeting,they agreed on ideas to be assigned to support group members. Thoseidea cards were then moved to the to-do column in the lower half of theboard with the assigned person’s name noted on the card.
The result was a continuing steady flow of suggestions from operators rein-forced by a steady stream of suggestions, often modest, for makingimprovements in the process, which continued to improve. Not all theimprovement was attributable to employee suggestions. Nevertheless, theteam has remained open to change, in large part , because they have theregular experience of being listened to when they make suggestions forchange.
145
PEOPLE—PREDICTABLE INTERRUPTION; SOURCE OF IDEAS

A Visual Improvement Suggestion Process
As with much else in a lean operation, there is power in making the improve-ment idea process visual. The usual reasons apply: when actual versus expectedis visible and followed up, accountability for commitments and performanceincreases. Posting suggestions for all to see can encourage more suggestions aswell as stimulate ideas that build on each other. A visually controlled suggestionprocess can convert the concept of “listening” to something you can see. This isa powerful attribute, especially in context of lean conversion projects where thetarget is changing long-entrenched ways of doing things. Failure to listen toemployees’ ideas is often among those old ways. Coming from that kind of his-tory, one might think operators actually have been “checking their brains at thedoor,” and either do not have any ideas worth listening to, or are uninterestedin improvement.
In my experience, nothing could be farther from the truth. For one thing, theopportunity to be heard is powerfully motivating for people. That is true evenwhen the only outcome is having been listened to. Further, in most cases opera-tors have not stopped having ideas. They have only given up on the futility ofmaking suggestions. Indeed, in the project scenario above, when project teamsask for suggestions and feedback, they are typically inundated with ideas. Theproblem becomes the organization’s inability to respond to them. At that point,ideas stop coming, and quickly.
Making Listening VisibleSo, how can a visual control make listening visible and accountable and give oper-ators a sense of ownership and pride in improvement?
Use a format that encourages brief, readily displayed ideas. That is, requiresuggestions in writing on cards or Post-Its®. This way, they are brief, easily dis-played, and quickly moved. (For those who cannot write in English, dictating theidea to one who writes it down is perfectly acceptable.)
Keep your spreadsheet application in its holster; do not make lists of ideas!Remember the fingerprint factor. Keep and manage the ideas in the original form—the idea card. People have more sense of ownership when suggestions retaintheir fingerprints, their own handwriting and signature. Computer-generatedlists are a form of alienation, especially for those who do not work in this mediumevery day. If it is in the computer, the idea has become “yours.” If it is in myhandwriting, it stays “mine.”
Create a visual representation of the way ideas move through the improve-ment process:
146
CREATING A LEAN CULTURE
• First, ideas are submitted.
• Second, they are screened and either advanced to a queue or rejected.
• Third, they become actively worked on.
• Fourth, implementation is complete.
Such a process can look like Figures 9.4 and 9.4a. In them, you can see col-umn headings for Ideas, To Do, Doing, and Done. As the cards move across theboard and the tally of implemented suggestions climbs, it is difficult for holdoutcurmudgeons to maintain that, “Management never listens to us.” Take them tothe board, show the movement of cards, and point out the number imple-mented—each still in the handwriting of the person who made the suggestion—and suggest this way of being heard is open to them as well.
The process is uncomplicated:
Step 1: Employees write idea cards (or Post-Its®) and post them in the Ideas column.
Step 2: Once a week or more often, the supervisor and team leaderreview newly submitted ideas to advance them to the To Docolumn or reject them. They note the reason for rejection onthe back of the card, and talk with the author about the reasonfor rejection. In practice, few ideas are rejected. Reasons forrejection are typically scope (things for other departments todo), relevance to the business, or conflict with lean principles.
Step 3: At least once a week, the value stream manager, supervisor,team leader, and value stream support-group representativesreview the new submissions. They identify ideas that arebeyond the resources or ability of the supervisor and teamleader. Those ideas get moved to the support group segment ofthe board (below the dividing line in Figure 9.4) and assignedto a specific individual.
Step 4: The supervisor and team leader move ideas from the To Do tothe Doing column and assign them for implementation, notingthe assignment on the card. The assignments are usually to thesupervisor or team leader. The number of active suggestions isbased on the capacity to get them done within a week. As workprogresses or is completed, brief notes on the back of the carddocument plans and actions.
Step 5: As an idea is implemented, move the card to the Done columnand update the tally of implemented ideas.
147
PEOPLE—PREDICTABLE INTERRUPTION; SOURCE OF IDEAS

148
CREATING A LEAN CULTURE
Idea Board: West Finishing Shop
Ideas To Do Doing Done
(Front)
(Back)
Figure 9.4. Suggestion system idea board
9_People_Predictable.qxd 3/31/05 3:41 PM Page 148

Step 6: The team leader covers status of the suggestion process once aweek in a daily tier one start up meeting, congratulating thosewhose ideas are Done, or implemented, and reviewing ideasthat have moved to the Doing column.
Step 7: Some organizations use team rewards for reaching designatedlevels of implemented suggestions, such as pizza upon reachingone implemented suggestion per team member (or the equiva-lent number). Others find the motivational impact of peoplebeing able to influence their environment and being recognizedfor it is enough to keep the process healthy.
The improvement suggestion system is explicitly connected to the three-tiermeeting process. The same expected versus actual accountability review applies toemployee suggestions as with any other improvement assignment. Ideas assignedto team leaders show up on the department-level (tier two) task assignmentboard. Those assigned to support group representatives show up on the valuestream-level task assignment board.
149
PEOPLE—PREDICTABLE INTERRUPTION; SOURCE OF IDEAS
Some of the ideas from this board,in a powder paint shop: Separatecontrols for lines 3 and 4 washerand oven for start up and shutdown; replace worn rubber grom-mets at spray gun openings; addcaps to dark hoses on line 4 tokeep paint out when not in use;hang refinish parts at back of linespaced so we have time to adjustfrom part to part. Overflow com-pleted “idea” Post-Its® are saved ina clear plastic pocket below thisidea board. The number of imple-mented ideas could be displayedat the top of the board, somethingmissing from this example.
Figure 9.4a. Improvement suggestion idea board
9_People_Predictable.qxd 1/10/06 11:52 AM Page 149
What if Production People Don’t Buy Into Lean?
Problems with buy-in are almost always problems with leadership. These ofteninclude at least some of the following: a poorly articulated or weak case forchange; not bothering to respect people’s legitimate questions; failure to set clearexpectations at all levels; weak or inconsistent follow-up on newly announcedaccountabilities and processes.
Even when none of these problems is present, some people on the produc-tion floor are just ornery. They bring a variety of personal, and personality, prob-lems to work that lead them to refuse to accept the team leader’s authority. Thatis especially a problem when you have just established team leader positions. Afew people are likely to test the system in ways that can be difficult or impossiblefor a supervisor to observe or document.
Providing team leaders with a measure of formal authority is an effective wayto respond to these initial challenges, as well as those that arise from time to time.This stops short of including team leaders in the process of administering formaldiscipline. That should be left to supervision. Instead, it involves authorizingteam leaders to make documented observations of problem behaviors that thesupervisor can act on as a basis for disciplinary action.
That is not the same as the team leader administering formal discipline, andthe documented observations do not always lead, and do not require, the super-visor to take disciplinary action. Further, each instance that results in a teamleader’s documented observation should be part of a conversation between theteam leader and the employee in question. The authority comes from the factthat the team leader’s notes are a sufficient basis, by themselves, for supervisorsto take such disciplinary action as they see fit, without needing to have observedthe behavior themselves. The effect on the responsiveness to team leaders’requests and suggestions is positive and dramatic.
Several conditions must be present for this process to be effective:
• First, supervisors and team leaders need to understand what consti-tutes enough to trigger documenting a problem.
• Second, the supervisor must follow up on the team leader’s action, ifonly with a conversation with the employee acknowledging the inci-dent. Otherwise, employees will have no more reason to pay atten-tion to the team leader’s requests than before.
• Third, the process has to be simple and easy to use.
One example of this is supplying team leaders with a pocket-sized pad ofpreprinted notes. The notes list categories for behavior that needs improvement
150
CREATING A LEAN CULTURE
9_People_Predictable.qxd 1/10/06 11:52 AM Page 150
on the front side. On the back, to acknowledge and reinforce helpful behavior,the categories list positive contributions (see Table 9.1). When the team leaderobserves behavior worth noting, s/he talks with the employee, shows him or herthe note, then signs it and gives it to the supervisor. The supervisor respondswithin a shift, either talking with the team leader to better calibrate standardsand/or talking with the employee.
Of course, it is important to be sure in advance that team leaders have theinterpersonal skills to handle these kinds of interactions potentially involvingconflict. And, it is important for supervisors and team leaders to reach a mutualunderstanding as to what kind of behavior warrants what kind of response, andtimeliness of follow-up.
Responding to Low Performers
As work becomes balanced and flow depends on everyone in the system meetingexpected outcomes, low performers show up like they are under spotlights. Theselow performance situations can be troubling for leaders to deal with, but keep inmind that everyone in the shop is watching what you do. Does everyone have tokeep up or are we willing to sacrifice performance for one or two? There is a directfive-point checklist to review in determining what to focus on when working to
151
PEOPLE—PREDICTABLE INTERRUPTION; SOURCE OF IDEAS
Thanks for Please work to improve
Volunteering Starting/stopping work on time
A positive attitude Keeping up with standardized work
Offering a suggestion Handling kanbans properly
Preventing a problem Meeting requirements for quality
Extra effort Following 5S standards/procedures
Other: Other:
Team Leader comments Team Leader comments
Table 9.1. Typical items on team leader notes

turn around problems in individual performance.
• Are the tools and equipment the person is using calibrated andworking properly?
• Are parts and materials they are using within specifications?
• Has the person been trained?
• Have expectations for performance been made clear?
• Has there been regular feedback on performance?
If you rule out these benign explanations for a person’s inability to do thework in a newly lean area, your options begin to get limited. As you go throughthese considerations, it can be helpful to keep a distinction in mind. There arethose who “can’t” do the work, perhaps unable to keep up in a takt-paced setting.Then there are those who “won’t” do the work, for many reasons. Your organiza-tion may have a place for people who “can’t” meet expectations in productionenvironments. Whether or not such a haven is available, you almost certainlyhave a progressive discipline system. You may be used to using discipline only incases of objectionable conduct, especially in a production workforce. More likelyyou use the discipline system for performance problems among the salaried work-force. You will need to seriously consider using your progressive discipline systemfor performance in the factory as well.
In these instances, the use of progressive formal discipline is an unambiguoussign to the employee that the performance problem is a real one that might even-tually cost them their employment. When the alternative becomes unavoidable,some from the “won’t” group suddenly become able to do the work everyone elsedoes. In other cases, formal discipline is an increasingly clear signal for the per-son to find another position to move to where they can meet expectations, if sucha position exists.
This is not a happy situation to encounter, but it is an implication of mov-ing to a tightly defined, closely linked production process. If these cases are notmanaged, many in the operation will find the commitment to lean productionopen to question. It will be that much more difficult to develop disciplinedadherence to standards if the standards do not apply universally.
152
CREATING A LEAN CULTURE

Human Resources Policy Issues in LeanManagement
Lean management will almost inevitably involve changes to your organization’shuman resource policies. Any change is best accompanied by a restatement of thebusiness case for the change to lean production and an explicit connectionbetween the case for change and the specific change at hand. Table 9.2 summa-rizes some of the policy areas that may be involved, their connection to lean pro-duction, and some potential obstacles to overcome in making the change.
The changes in policies may be dramatic and far-reaching, such as changinghourly pay systems from piecework to a flat rate. They may involve changing thepolicy that governs job elimination related to process improvement activity andsubsequent exposure to layoff. They may involve the kinds of changes in author-ity and application of the discipline system outlined above. Some changes aremore mundane, like changing break or start times, though any and all of thesechanges are capable of sparking emotional reactions. Having a firm grasp of whyyou are making the change and anticipating the questions and reactions you arelikely to face are important preparation for working through these potentiallycontentious issues.1 Keep in mind that the best reaction often has nothing to dowith stating the logic behind the change. Giving people the opportunity to maketheir displeasure heard is often the most effective thing you can do, especiallysince you area unlikely to be able to satisfy the desire to turn back the clock tothe way things were before.
Your HR group is more likely to respond to your requests for support if theyknow something about the rationale for converting to lean production. HR islikely to be interested in how lean is changing the shop floor, people’s jobs andaccess to information, and their opportunities to participate in changes that affectthem. Involve HR as much as you can, as early as you can—changing policies cantake quite a bit of time in many organizations.
Take HR executives to the floor and show them what the new ways look likein comparison to the old. Share with them the case for change. Introduce themto the statistics on ergonomic benefits from the new job designs and from rota-tion. Show them the visual proof of your methods for involving employees, forlistening and responding to their suggestions. Enroll them on your team; they’llcome to help out eventually if not right away.
153
PEOPLE—PREDICTABLE INTERRUPTION; SOURCE OF IDEAS
1. See David W. Mann, “Why supervisors resist change and what you can do about it,” Journal of Quality andParticipation 23 (May/June, 2000), 20-23 for a description of a method for preparing leaders for these kindsof encounters.
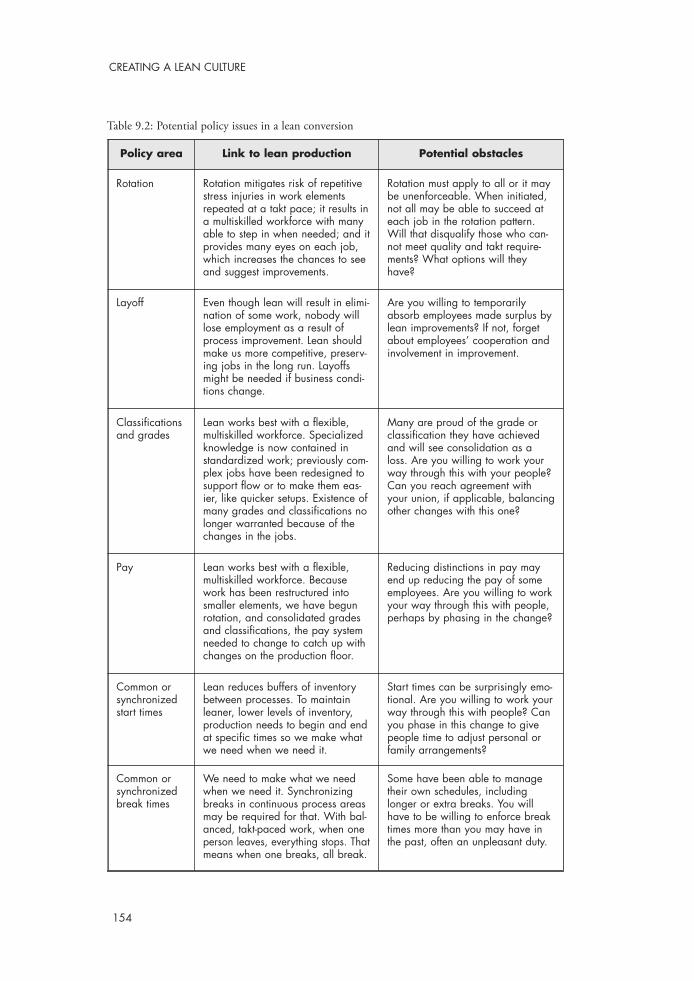
154
CREATING A LEAN CULTURE
Table 9.2: Potential policy issues in a lean conversion
Policy area Link to lean production Potential obstacles
Rotation Rotation mitigates risk of repetitivestress injuries in work elementsrepeated at a takt pace; it results ina multiskilled workforce with manyable to step in when needed; and itprovides many eyes on each job,which increases the chances to seeand suggest improvements.
Rotation must apply to all or it maybe unenforceable. When initiated,not all may be able to succeed ateach job in the rotation pattern.Will that disqualify those who can-not meet quality and takt require-ments? What options will theyhave?
Layoff Even though lean will result in elimi-nation of some work, nobody willlose employment as a result ofprocess improvement. Lean shouldmake us more competitive, preserv-ing jobs in the long run. Layoffsmight be needed if business condi-tions change.
Are you willing to temporarilyabsorb employees made surplus bylean improvements? If not, forgetabout employees’ cooperation andinvolvement in improvement.
Classificationsand grades
Lean works best with a flexible,multiskilled workforce. Specializedknowledge is now contained instandardized work; previously com-plex jobs have been redesigned tosupport flow or to make them eas-ier, like quicker setups. Existence ofmany grades and classifications nolonger warranted because of thechanges in the jobs.
Many are proud of the grade orclassification they have achievedand will see consolidation as aloss. Are you willing to work yourway through this with your people?Can you reach agreement withyour union, if applicable, balancingother changes with this one?
Pay Lean works best with a flexible,multiskilled workforce. Becausework has been restructured intosmaller elements, we have begunrotation, and consolidated gradesand classifications, the pay systemneeded to change to catch up withchanges on the production floor.
Reducing distinctions in pay mayend up reducing the pay of someemployees. Are you willing to workyour way through this with people,perhaps by phasing in the change?
Common orsynchronizedstart times
Lean reduces buffers of inventorybetween processes. To maintainleaner, lower levels of inventory,production needs to begin and endat specific times so we make whatwe need when we need it.
Start times can be surprisingly emo-tional. Are you willing to work yourway through this with people? Canyou phase in this change to givepeople time to adjust personal orfamily arrangements?
Common orsynchronizedbreak times
We need to make what we needwhen we need it. Synchronizingbreaks in continuous process areasmay be required for that. With bal-anced, takt-paced work, when oneperson leaves, everything stops. Thatmeans when one breaks, all break.
Some have been able to managetheir own schedules, includinglonger or extra breaks. You willhave to be willing to enforce breaktimes more than you may have inthe past, often an unpleasant duty.

Summary: Resolving People Issues to SupportLean Production and Lean Management
Predictability in the daily availability of people and a structured approach forresponding to unplanned absences would be desirable in any production environ-ment. It is especially important in a lean production environment paced by takttime. Lean management provides a suite of labor planning tools that makes atten-dance more visual, thus raising the level of public accountability for coming towork. Lean management’s labor planning tools bring stability at least to theprocess of responding to unplanned absences.
An effective employee improvement suggestion system can be deceptivelydemanding if those in leadership positions are not prepared to respond to whatis, in effect, new work being delegated to them in the form of improvement sug-gestions. The vacation paradox builds new capacity for acting on suggestions.Until that capacity is in place, it is best to hold off implementing an idea system.Actual versus expected and visual control applies in managing the suggestion sys-tem just as it does in most of lean management. Employees appreciate being ableto see the progress of their ideas, and leaders benefit from the increased trust inlean that comes from the visual evidence of having listened to and acted on ideasfrom the shop floor.
A lean implementation can raise questions about a number of HR policies.Lean requires much more precision in execution than a batch-and-queue system,so issues that interfere with disciplined adherence to lean processes must beaddressed quickly. Equipping team leaders to make authoritative observations ofproblem behaviors is one step. Preparing to apply progressive discipline to “can’t”and “won’t” performers is another. Beyond that, a series of policy changes may becalled for, ranging from pay and consolidation of grades and classifications torequired performance in job rotation, alterations in layoff policy, and changes inbreak and start times.
It is a good idea to involve the HR organization early and thoroughly in lean.With a context in which to view the requested changes to support lean produc-tion and lean management, HR is much more likely to understand and work toaccommodate your requests.
155
PEOPLE—PREDICTABLE INTERRUPTION; SOURCE OF IDEAS

10Sustain What You Implement
The purpose of lean management is to sustain a lean production system. Withouta lean management system, lean production implementations often falter, some-times fail, and virtually never deliver up to their long-run promises. So, what sus-tains the lean management system?
In a word, it’s you. As a leader in your lean production environment, you are the force that can
motivate and sustain lean management in your unit. That applies no matter whatyour position, whether you are responsible for a team or department, a valuestream or plant, a business unit, or the organization as a whole.
Expectations for processes and the ability to compare actual versus expectedare the threads that connects the elements in lean management. The person at thetop of the unit, however defined, is in the position to set expectations and, mostimportantly, to follow up on them. Defining expectations and holding peopleaccountable to them is the key to a successful lean implementation. The higherin the organization this extends, the better the chances for success.
Making accountability easier to see and execute is the objective that under-lies lean management’s ways of thinking, its tools and approaches. But, do notconfuse tools and techniques with the indispensable ingredient: you as the chiefaccountability officer. Without you, no tools, no processes, no books can makeyour lean implementation a healthy, growing, improving proposition. This chap-ter shows how leaders must sustain the lean management system.
157

You Already Have a Management System!
Why is accountability such a big deal, such an important factor in sustaining leansystems? The reason is written in your organization’s history: You already have amanagement system. Actually, you as an individual might be developing a newone, but most everyone working in a newly converted lean operation still has theold one pretty firmly in place. Because of this, even with all the discipline andaccountability you can muster, you should expect to see backsliding in just aboutevery aspect of lean you implement. Do not expect to like it, but be prepared for it.
Why does this happen if you have carefully implemented lean managementalong with lean production? Recall Smokey the Bear and the difference betweenbreaking and extinguishing habits. You should not expect the new ways to stickjust because people have adhered to them for a day or week. The old ways willreassert themselves in people who are very good, even yourself! Remember, noth-ing worth doing stays done forever without diligence, discipline, and hard work.The case on pages 162-163 illustrates these points. This cautionary tale onlyserves to illustrate that nothing worth doing stays done by itself. As much as leanmanagement is about anything, it is about this.
What Should You Do?
Stick to what you have just implemented. You have installed the engine, drivetrain, and controls of the lean management system. Do not leave it in the garage,waiting for things to get difficult before learning how to “drive” your new man-agement system. Proficiency in lean management is like many other things; youget better with practice. It shows when you have to perform under pressure.
Consider the steps you have taken: You have defined expectations for per-formance and implemented tools to compare expected versus actual execution.These expectations are defined in day-to-day, operational terms in leader stan-dard work. An important element in this standard work is to regularly reinforcevisual controls. The visuals reflect adherence or variation from processes andexpectations. Then, the daily three-tier meetings and the cycle of assessment,assignment, and accountability will lead to countermeasures while causes of vari-ation are found and eliminated.
158
CREATING A LEAN CULTURE

Rely on Leader Standard WorkThe steps you need to take should be documented in your own standardizedwork. Follow it as you would follow a recipe for success. Require and reinforceothers to follow their standard work as well. Reinforcement comes by brieflyreviewing each subordinate’s completed standard work document every day.Respond in a timely and appropriate way to requests they have noted on theirstandard work forms. Respond as well to the other things you see on the forms.Is there a pattern of missing a particular element or elements? Does what youobserve in the production area square with what you see in notes made on thestandard work documents? When you treat your subordinates’ completed dailystandard work forms as living documents that prompt action, you powerfullyreinforce standard work as “the way we do things around here—now.” This isespecially true when problems beset your area.
Keep in mind the team leader who said her standard work allowed her toturn down requests to do others’ jobs that would have distracted her from herduties. Also recall the supervisor who was able to steer his way out of chaos byreturning to his standard work. With it, he regained control with much less time,effort, and frustration than in the few days following his vacation. Leader stan-dard work is the lean management tool of highest leverage. Look to it first.
Maintain the Visual ControlsWhere you have implemented visual controls, follow up to be sure they are beingmaintained. Verifying that visuals are current and the information on them isaccurate and clear should be one of the key items on your standard work.
When problems arise in areas without visuals, quickly develop a trackingprocess and analysis appropriate to the problem. That is, when a reason formissed pitch is vague to the point where you have to ask the person who wroteit: “What does this mean?” you have the opportunity to discuss the characteris-tics of well-written problem statements. Remember the axiom: no action withoutdata (even if action and data are concurrent), no data without action! When rea-sons for misses are absent from the tracking forms or not clear enough to formthe basis for taking the next step, treat these occurrences as teachable moments.You will have to explain several times how the data from visuals lead to assess-ment, assignment, and accountability for putting countermeasures in place andeliminating root causes. As people begin to see longstanding problems resolved,based on what appeared on their visual controls, most eventually will make theconnection.
Without the information from well-executed visual controls, you will be driv-ing your lean management system in the dark without either map or headlights.
159
SUSTAIN WHAT YOU IMPLEMENT
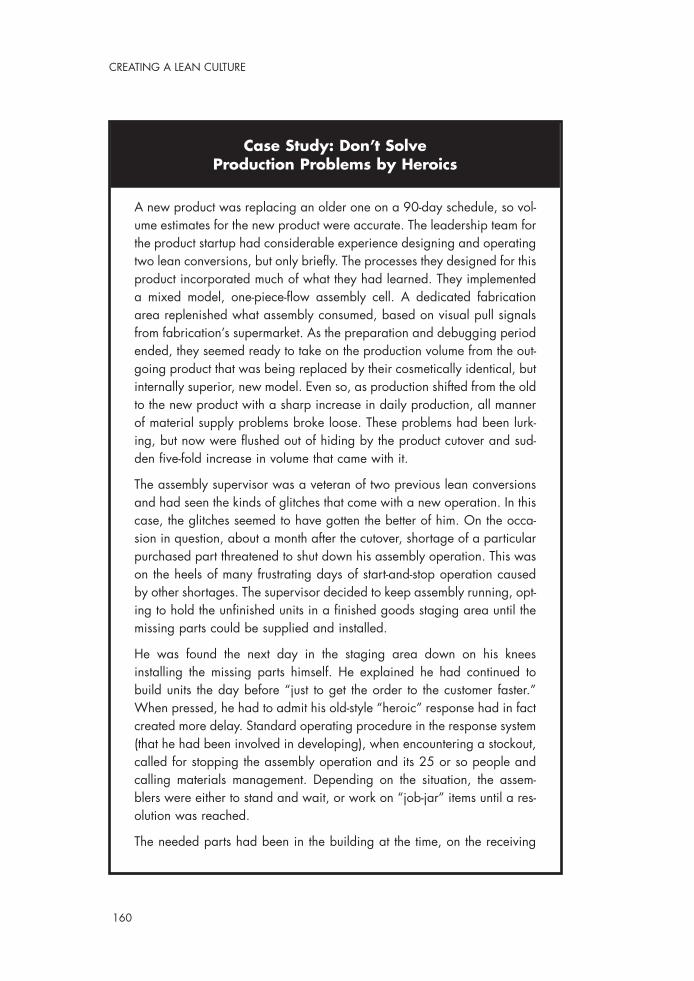
Case Study: Don’t SolveProduction Problems by Heroics
A new product was replacing an older one on a 90-day schedule, so vol-ume estimates for the new product were accurate. The leadership team forthe product startup had considerable experience designing and operatingtwo lean conversions, but only briefly. The processes they designed for thisproduct incorporated much of what they had learned. They implementeda mixed model, one-piece-flow assembly cell. A dedicated fabricationarea replenished what assembly consumed, based on visual pull signalsfrom fabrication’s supermarket. As the preparation and debugging periodended, they seemed ready to take on the production volume from the out-going product that was being replaced by their cosmetically identical, butinternally superior, new model. Even so, as production shifted from the oldto the new product with a sharp increase in daily production, all mannerof material supply problems broke loose. These problems had been lurk-ing, but now were flushed out of hiding by the product cutover and sud-den five-fold increase in volume that came with it.
The assembly supervisor was a veteran of two previous lean conversionsand had seen the kinds of glitches that come with a new operation. In thiscase, the glitches seemed to have gotten the better of him. On the occa-sion in question, about a month after the cutover, shortage of a particularpurchased part threatened to shut down his assembly operation. This wason the heels of many frustrating days of start-and-stop operation causedby other shortages. The supervisor decided to keep assembly running, opt-ing to hold the unfinished units in a finished goods staging area until themissing parts could be supplied and installed.
He was found the next day in the staging area down on his kneesinstalling the missing parts himself. He explained he had continued tobuild units the day before “just to get the order to the customer faster.”When pressed, he had to admit his old-style “heroic” response had in factcreated more delay. Standard operating procedure in the response system(that he had been involved in developing), when encountering a stockout,called for stopping the assembly operation and its 25 or so people andcalling materials management. Depending on the situation, the assem-blers were either to stand and wait, or work on “job-jar” items until a res-olution was reached.
The needed parts had been in the building at the time, on the receiving
160
CREATING A LEAN CULTURE
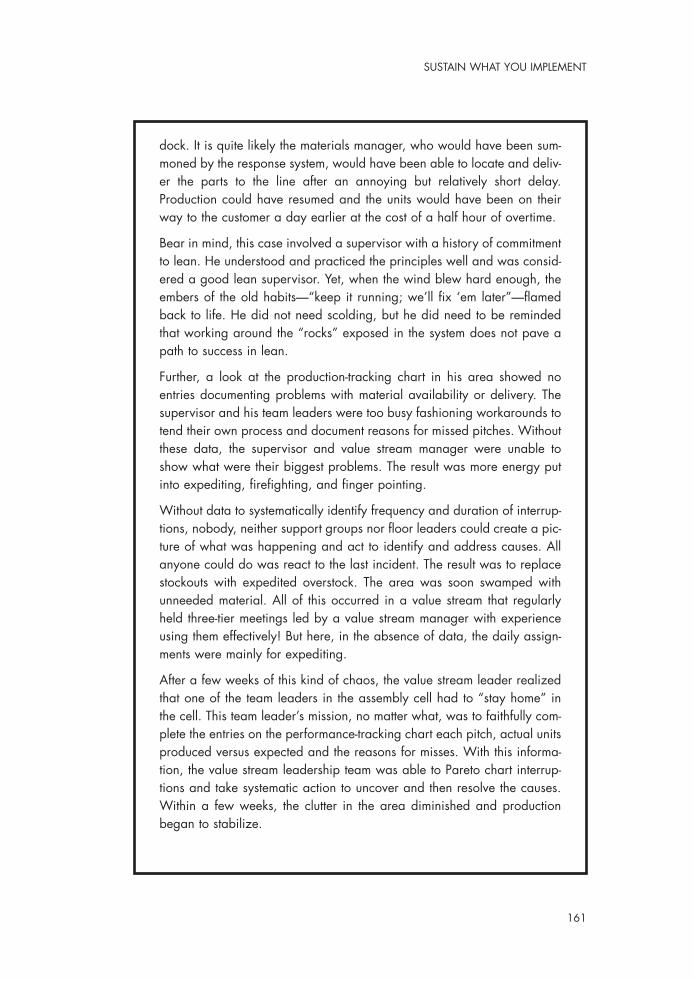
161
SUSTAIN WHAT YOU IMPLEMENT
dock. It is quite likely the materials manager, who would have been sum-moned by the response system, would have been able to locate and deliv-er the parts to the line after an annoying but relatively short delay.Production could have resumed and the units would have been on theirway to the customer a day earlier at the cost of a half hour of overtime.
Bear in mind, this case involved a supervisor with a history of commitmentto lean. He understood and practiced the principles well and was consid-ered a good lean supervisor. Yet, when the wind blew hard enough, theembers of the old habits—“keep it running; we’ll fix ‘em later”—flamedback to life. He did not need scolding, but he did need to be remindedthat working around the “rocks” exposed in the system does not pave apath to success in lean.
Further, a look at the production-tracking chart in his area showed noentries documenting problems with material availability or delivery. Thesupervisor and his team leaders were too busy fashioning workarounds totend their own process and document reasons for missed pitches. Withoutthese data, the supervisor and value stream manager were unable toshow what were their biggest problems. The result was more energy putinto expediting, firefighting, and finger pointing.
Without data to systematically identify frequency and duration of interrup-tions, nobody, neither support groups nor floor leaders could create a pic-ture of what was happening and act to identify and address causes. Allanyone could do was react to the last incident. The result was to replacestockouts with expedited overstock. The area was soon swamped withunneeded material. All of this occurred in a value stream that regularlyheld three-tier meetings led by a value stream manager with experienceusing them effectively! But here, in the absence of data, the daily assign-ments were mainly for expediting.
After a few weeks of this kind of chaos, the value stream leader realizedthat one of the team leaders in the assembly cell had to “stay home” inthe cell. This team leader’s mission, no matter what, was to faithfully com-plete the entries on the performance-tracking chart each pitch, actual unitsproduced versus expected and the reasons for misses. With this informa-tion, the value stream leadership team was able to Pareto chart interrup-tions and take systematic action to uncover and then resolve the causes.Within a few weeks, the clutter in the area diminished and productionbegan to stabilize.

You can get somewhere that way, but you will have the occasional crash and whenyou arrive, you will have no idea how to get there again.
Visuals give you the information you need to choose the direction to applyyour resources for root cause improvement. With visuals, you can dig out ofproblems; without them, you are likely simply to keep on digging the same holesover and over again.
Conduct Gemba Walks RegularlyIf you have had the benefit of gemba walks with a sensei, remember that othersmay not have had the same opportunities to learn and apply; had their effortsreviewed and critiqued; and had the chance to apply again. The mantle of senseinow is on your shoulders, even if you continue to work with your own sensei, andeven if you do not consider yourself an expert.
The learning model for lean management especially, just as for lean produc-tion, is the master-apprentice relationship. When you gemba walk others, youaccomplish several things. You give others the opportunity for tailored, one-on-one learning. You demonstrate the importance of going to the place, looking atthe process, talking with the people as a key in assessing process performance.And, in a structured, scheduled way you reserve time to observe people andprocesses; draw inferences about steps you need to take; and refresh your ground-level view of how the process is operating to bring to your tier of the dailyaccountability process.
When you are in the production area, be alert for even small incidents thatsignify old thinking or habits. As a teacher, use what you see on the productionfloor to refresh and enliven basic lean principles; it makes it easier for people tomake their own connections between lean concepts and what it means to applythem.
You should expect to teach many lessons repeatedly, even with your best peo-ple. Recall the supervisor kneeling in the shipping area completing the assemblywork he had shortchanged the day before. Have patience with people, but onlyso much. Try using the rule of three before considering next steps with individu-als who seem slow either in understanding your lessons or in taking them toheart. That is, give people three chances (which might be on successive weeks’gemba walks on a given point, for example) before beginning to discuss per-formance.
As you give feedback, be most firm with those in the positions of mostauthority. When you convert to lean, everyone’s knowledge of what it means andhow it works starts at zero. Just because some are in positions of greater respon-sibility does not mean they automatically know more about lean production andlean management than their subordinates. Indeed, unless they have invested their
162
CREATING A LEAN CULTURE

own time in hands-on implementation activity, they may know less about leanmanagement than those below them.
This is not about who is “on board” with the new program, nor about exec-utives being quick studies. This is about learning to think differently by havingbeen involved in acting differently. The leaders in your organization representyour greatest leverage. If anything, you should be most demanding of their speedin progressing on the lean learning curve, which will mean requiring them to goto gemba and, once there, to become directly involved.
Finally, prepare yourself to be reminded on occasion by others of your ownneed to more faithfully follow the principles.
Keep Yourself HonestI often hire a guide the first time I go fishing in a new area. I find it helpful tobenefit from one with knowledge and experience when in new territory. Expert,experienced consultation is an essential ingredient in the mix as you pursue yourlean conversion. Usually, you will find your sensei in the ranks of outside con-sultants.
Using a consultant in lean is like fishing in another way, too. Folk wisdomholds that if you give me a fish I can feed myself for a day. But, if you teach meto fish I can feed myself for a lifetime. In other words, sustaining lean productionand, especially, sustaining lean management, largely has to be a do-it-yourselfproposition. Yes, you can call in your sensei periodically to assess your status, butin most cases you will find that s/he is telling you things you already know, buthave somehow overlooked, allowed to slide, or missed in some way. Is there analternative to paying for a periodic scolding by your sensei (who in any case soonwill likely make the suggestions to cease these visits)?
Even if you relied heavily on a consultant to design your lean production sys-tem—a practice I do not recommend—it is a practical impossibility to rely on aconsultant to sustain your new system. The same holds true regarding lean imple-mentation project teams. You may have needed a team for some of the more tech-nical and analytic aspects of technical design and implementation, but you can-not rely on them to run your area for you.
Consultants, internal or external, can talk with your leaders about expectedversus actual outcomes until they are blue in the face, all to no avail. Unless theboss makes it clear by his or her behavior that something new is expected, subor-dinates will continue to conduct business pretty much as usual. The nature of dis-cipline in organizations is that it is always a domestic product, never an import!(See Table 10.1.)
163
SUSTAIN WHAT YOU IMPLEMENT
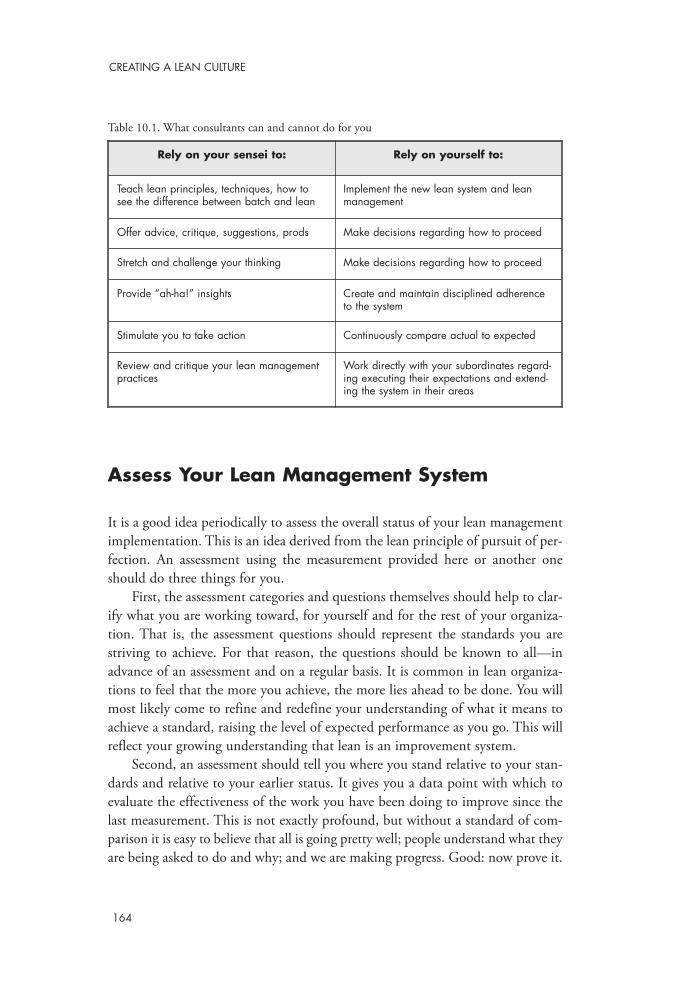
Table 10.1. What consultants can and cannot do for you
Assess Your Lean Management System
It is a good idea periodically to assess the overall status of your lean managementimplementation. This is an idea derived from the lean principle of pursuit of per-fection. An assessment using the measurement provided here or another oneshould do three things for you.
First, the assessment categories and questions themselves should help to clar-ify what you are working toward, for yourself and for the rest of your organiza-tion. That is, the assessment questions should represent the standards you arestriving to achieve. For that reason, the questions should be known to all—inadvance of an assessment and on a regular basis. It is common in lean organiza-tions to feel that the more you achieve, the more lies ahead to be done. You willmost likely come to refine and redefine your understanding of what it means toachieve a standard, raising the level of expected performance as you go. This willreflect your growing understanding that lean is an improvement system.
Second, an assessment should tell you where you stand relative to your stan-dards and relative to your earlier status. It gives you a data point with which toevaluate the effectiveness of the work you have been doing to improve since thelast measurement. This is not exactly profound, but without a standard of com-parison it is easy to believe that all is going pretty well; people understand what theyare being asked to do and why; and we are making progress. Good: now prove it.
164
CREATING A LEAN CULTURE
Rely on your sensei to: Rely on yourself to:
Teach lean principles, techniques, how tosee the difference between batch and lean
Implement the new lean system and leanmanagement
Offer advice, critique, suggestions, prods Make decisions regarding how to proceed
Stretch and challenge your thinking Make decisions regarding how to proceed
Provide “ah-ha!” insights Create and maintain disciplined adherenceto the system
Stimulate you to take action Continuously compare actual to expected
Review and critique your lean managementpractices
Work directly with your subordinates regard-ing executing their expectations and extend-ing the system in their areas

Third, the results of an assessment will help you identify where you need tofocus efforts to improve. It may also lead you to conclude that you or your organ-ization need another dose of targeted help from the outside, perhaps from peersin a noncompeting industry, from a professional association, or from a teacher.Either way, the results should help clarify a next set of goals for shoring up a cat-egory where results have not been up to par with others, or for choosing one ora few areas to focus on for improvement in the next assessment.
Details of the Lean Management System Assessment The lean management assessment examines eight categories of process and behav-ior. The assessment scores define five levels of system status. This section lists thecategories and levels in the assessment.
Categories in the lean management system assessment:
1. Leader standard work
2. Visual controls for production
3. Visual controls for production support
4. Daily accountability process
5. Process definition
6. Disciplined adherence to process
7. Root cause problem solving
8. Process improvement
Levels in scoring the lean management assessment:
Level 1: Pre-implementation
Level 2: Beginning implementation
Level 3: First recognizable state
Level 4: System stabilizing
Level 5: Sustainable system
Conducting an AssessmentThe lean management assessment should be conducted on the floor by lookingand asking. Make direct observations (e.g., “Are the visuals current? Are the rea-sons for misses clear enough for taking the next step?”). Talk with people (e.g.,“Do you have a regular way to make suggestions for improvement? Please tell me
165
SUSTAIN WHAT YOU IMPLEMENT

about it. In your opinion, how well does it work? Have you ever made a sugges-tion? How about the people you work with?”)
Prepare a format that lists the criteria by level for each category to guide andrecord observations. That way, documentation supporting a rating is right therewith the criteria. Table 10.2 provides an example of such a format. Appendix Ais a complete lean management assessment.
Table 10.2. Example of an assessment observation and rating form
When Should You Assess?Do it now. It does not matter how far along you are in your lean journey. If youare just starting, an assessment will help you share expectations with others. And,it will give you a baseline to judge how far you will have come.
Of course, you have activities going on right now that will show improvedresults if you hold off on the next assessment so you can see the progress. Thatshould always be true! Instead, establish a schedule and stay with it. Measuringyourself every quarter is enough of an interval to expect to see progress—a longenough period of time in which to achieve improvement. It may also be a shortenough interval to make it seem rushed, at least initially. An assessment is not atakt-paced activity, but assessments on a regular schedule embody the ideas oftime and pace that are so important in lean.
A related point is to keep the assessment process simple and free of bureau-cracy. If you will be conducting an assessment every 90 days, then that is all themore reason you will want the process to be straightforward, rather than a bur-densome time-eater. And, you will want the results in a timely fashion so you canget started on the next set of improvements. After all, your next assessment iscoming up in 90 days!
166
CREATING A LEAN CULTURE
Category 1: Leader Standard Work
Level 2: Beginning Implementation
Less Yes Exceeds Exists for few isolated positions
Less Yes Exceeds Carried and filled out/followed irregularly
Less Yes Exceeds Original version, no revisions
Less Yes Exceeds Largely seen as a check the box exercise
Notes: Team leaders in assembly have it (revised once). Mary carries it, checks off items, writesnotes. Gary has it, does not carry or make notes. Supervisors do not have it yet, but showed medrafts.

Who Should Assess?You have several options. All of them should reflect the “open book” nature of theassessment tool and process. That is, if the assessment categories and questionsdescribe your standards for lean management, would you not want them to bewidely understood and practiced? One way to do that is just like the method youmight use to calibrate with a subordinate on other assessments, such as a weekly5S audit.
In the case of a 5S audit, you begin by reviewing the audit items with thesubordinate (or group of subordinates). Then, each takes an audit form and con-ducts the audit jointly. Compare ratings for each observation. Discuss pointswhere you see things differently to come to a common understanding of what aparticular item means and how it should be scored. The following week, conductthe audits separately and then compare results. Discuss points of difference, gotogether to look at the specific area where your ratings differed, and come toagreement on how to score the item in question. Continue a second or third weekuntil you are reasonably well calibrated. In this way, you have imparted your ver-sion of expected and how it compares with the commonly observed actuals.
You can use the same approach with the lean management assessment. Workyour way down through your organization, starting with the people who reportto you directly. As practice, before you go “live,” assess an area jointly with yourdirect reports or with your supervisor, comparing notes as you go. Then assessanother area individually. Compare findings. Consider starting with a singleassessment category applied across an individual’s or staff ’s area of responsibilityto get a good sample of observations to compare. When you are calibrated on thatcategory, go to the next. This can easily be part of your regularly scheduled gembawalks.
As you complete the calibration process with this first level of your organiza-tion, ask them to continue the process with those who report directly to them.You might want to add an item to your standard work to spot check calibrationas the process spreads more widely, just as your standardized work calls for spot-checking execution of other items in your subordinates’ standard work.
You will have to consider the size of your organization as you commence aregular program of assessment. Each unit down to the team leaders should assesstheir status every 90 days. Maintain a profile (such as a bar chart or “radar” chart—see Figure 10.1) of category scores on display where you post your improve-ment plans for the period.
Wherever practical, a unit’s assessment score profile should be based on theassessment by the leader of the next level in the organization—the unit leader’sboss. At a certain scale, this will become impractical on a 90-day schedule. Inthose cases, consider a mixed model of assessors. Higher-level managers (plant
167
SUSTAIN WHAT YOU IMPLEMENT

managers, operations directors, VPs) should participate in complete assessmentsof subunits on a regular schedule to maintain a common understanding of stan-dards of assessment top to bottom throughout the organization. Regular assess-ments for large subunits, such as large value streams, can be conducted by a teamwith rotating membership drawn from the leaders of other units, along with acore made up of members of the organization’s lean team. These conditions willmake it more important that assessment questions are reflected in the regular“inspection” items in the gemba walk protocols for leaders whose scope of respon-sibilities is large.
Interpreting the AssessmentIt is more meaningful to look at assessment scores as a profile of the eight cate-gory scores rather than as a single average value. That is because low performanceon one dimension can have effects that spread through the others and eventuallyseriously compromise the way the lean management system performs. An averagecould easily conceal this finding. And, averages provide no guidance on where toconcentrate improvement efforts. Figure 10.1, a radar screen profile format is anexample of a directly interpretable profile format. Where it is meaningful to com-pare one unit with another or a single unit’s performance over time, the total ofcategory scores (with a possible range of 5 to 40) and a “consistency index” of thepoint spread between the lowest and highest category scores serves as the bestmeasure for overall comparisons. Again, an unaddressed low score in one categorywill eventually be reflected in low scores in others as well. Here, the consistencyindex will draw attention to gaps in performance.
Keep Asking These Questions!
Lean starts with physical changes. Until the “facts on the ground,” or on the pro-duction floor are different, there is not much to be gained from implementinglean management. But, as you begin making physical changes, do not implementthem by themselves. Just as changes in the management system do not stand wellby themselves, neither do technical changes. Every technical change requires sup-port by the management system to maintain its integrity over time. If that is nota law of nature, it is darn close to it! Every time an element of lean production isimplemented, also implement the elements of the management system needed tosustain it: expected versus actual visually controlled and added to the appropriateleader standard work.
168
CREATING A LEAN CULTURE

Figure 10.1. Score profile rader chart for lean management assessment
As a check, each time a technical or physical element of lean is put in place,including each time a change is made for improvement, ask these questions:
1. What lean management practices must accompany this element orchange to sustain it as it was intended or to test its effectiveness?
2. How will these lean management practices be sustained?
3. How will you verify and monitor normal operation of the technicalprocess?
A sensei trained in the Toyota approach to lean production asks three ques-tions about just about everything:
1. What is the process?
2. How can you tell it is working?
3. What are you doing to improve it (if it is working)?
The additional questions I am suggesting may be implicit in these Toyota
169
SUSTAIN WHAT YOU IMPLEMENT
Processimprovement
Rootcause
problemsolving
Disciplined adherenceto process
Visuals—production
Visuals—support
Daily accountabilityprocess
Process definition
Leader standard work
12
34
5 Levels
10_Sustain_What.qxd 3/31/05 3:34 PM Page 169

questions. No matter, ask them explicitly! Table 10.3 illustrates how some ofthese questions can be put into effect.
Table 10.3. Some answers to lean management’s questions
A Lean Culture Is a Beautiful ThingPerhaps the best way to tell you are in an operation with a lean culture is to makea return visit to it. You should not have to be away long, only a few weeks. Whenyou return, you should see things have changed. The changes do not have to bebig; in fact, they can be pretty small in scale. Nevertheless, you should be able tohear people talk about the changes with a mixture of satisfaction and critique—like the do-it-yourselfer who talks with pride, yet points out the flaws in the beau-tiful piece of work s/he has just accomplished with his or her own hands. Youshould expect to hear something like this: “It is different than it was before. Hereis how and why those differences are improvements. This is what remains to bedone and what we are working on right now. Come back in a week and we willreally have something to show you!”
170
CREATING A LEAN CULTURE
Element of LeanProduction System
Element of LeanManagement System
Pull system supermarket Supermarket daily/weekly audit process;current findings and trend posted
Visual controls for ‘to be ordered,’ ‘orderedand due,’ and ‘overdue’ deliveries
Kanban replenishment system Comparison of actual replenishment cycletime versus standard set up plus run time foreach order; reasons for misses noted
Flow line balanced to takt time Hourly or more frequent production/pitchtracking versus goal and reasons for missedtakts noted
Daily value stream performance and task fol-low-up accountability meeting
Team leaders Team leader standard work, supervisor andvalue stream manager standard work
Waterspider line-side supply Timed standardized route; comparison ofactual route cycle time versus standard timefor each cycle; reasons for misses noted;routes regularly audited
Lean implementation activity of any kind Daily and or weekly gemba walks with alean teacher making and following up onassignments for improvement

The vision for the future can bud in the present when people become usedto thinking about making things even better than they are today. In this way espe-cially, a lean culture is a beautiful thing!
Summary: Maintaining Lean Management
Nothing sustains itself, certainly not lean production or lean management. So,act to sustain what you have done by following the processes you have imple-mented:
1. Use your standard work to establish or stick with a routine for mon-itoring your processes and the standard work of others. Remember,standard gives you the most leverage in lean management.
2. Check the status of visual controls as part of your routine. Insist thatthose responsible keep them current with accurate and completeentries where reasons are called for. Teach people, over again wherenecessary, why visual controls are important, where they fit in leanmanagement, and how they drive action for improvement.
3. Follow up on what you expect in your daily three-tier accountabilitymeetings. Assign tasks to stabilize, diagnose, and improve your area.Follow up on assignments and use visual accountability tools, forexample, assignments posted on due dates and coded green for com-plete, red for overdue. Do not shrink from green/red color-coding.
4. Schedule and stick with regular gemba walks with each subordinate.Stick faithfully to the schedule. Get a feel through asking questionswhat s/he knows well and what areas need strengthening. Givehomework tasks to develop understanding and follow up assign-ments the next week. Take notes on your gemba walks; expect yourstudents to do likewise. Remember the first purpose of gemba walk-ing it to teach.
5. Everywhere, ask, “What is the process here?” How could someonetell? Is it working? How is it sustained?” Where necessary, note taskassignments and gemba walk topics based on the quality of answers.
6. Establish an assessment schedule and a plan to phase it in. Share thedetailed assessment categories widely. Post results where they can beseen. Expect to see evidence of improvement activities, such as A-3s,daily task assignments, and other process improvement work toaddress low-performing categories.
171
SUSTAIN WHAT YOU IMPLEMENT

7. Realize you will never be done and take steps to avoid burnout foryourself and others. Organize a regular process for sharing internalbest practices so you and your team can recognize the successes youhave achieved, even as you gird for work on further improvement.
If you have not started, choose one item from this summary list and beginwith it. Practice it, add another, practice both, add a third. With every step, youwill find yourself further along your own lean journey.
Finally, remember what sustains the lean management system, and ultimate-ly, the lean culture that grows from it. It is you and the example you set by yourdisciplined adherence to the system you have put in place.
172
CREATING A LEAN CULTURE
AppendixLean Management Assessment
173
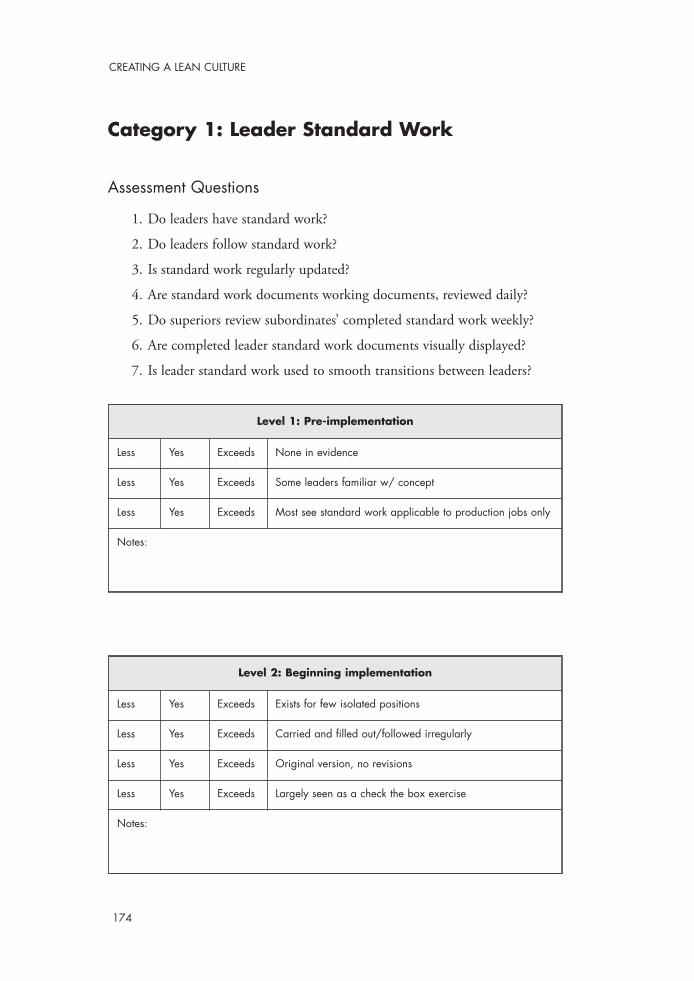
Category 1: Leader Standard Work
Assessment Questions
1. Do leaders have standard work?
2. Do leaders follow standard work?
3. Is standard work regularly updated?
4. Are standard work documents working documents, reviewed daily?
5. Do superiors review subordinates’ completed standard work weekly?
6. Are completed leader standard work documents visually displayed?
7. Is leader standard work used to smooth transitions between leaders?
174
CREATING A LEAN CULTURE
Level 2: Beginning implementation
Less Yes Exceeds Exists for few isolated positions
Less Yes Exceeds Carried and filled out/followed irregularly
Less Yes Exceeds Original version, no revisions
Less Yes Exceeds Largely seen as a check the box exercise
Notes:
Level 1: Pre-implementation
Less Yes Exceeds None in evidence
Less Yes Exceeds Some leaders familiar w/ concept
Less Yes Exceeds Most see standard work applicable to production jobs only
Notes:

175
APPENDIX—LEAN MANAGEMENT ASSESSMENT
Level 3: First recognizable state
Less Yes Exceeds In place for all—team leaders through value stream managers
Less Yes Exceeds Most leaders carry standard work with them
Less Yes Exceeds Most leaders follow their standard work
Less Yes Exceeds Revised once
Less Yes Exceeds Most leaders understand benefits of leader standard work
Notes:
Level 4: System stabilizing
Less Yes Exceeds All leaders carry and follow standard work
Less Yes Exceeds Standard work documents used as daily working record
Less Yes Exceeds Regular daily review by superiors of subordinates’ standardwork documents
Less Yes Exceeds Most leaders can identify how standard work benefits them
Less Yes Exceeds Standard work regularly reviewed and revised
Notes:
Level 5: Sustainable system
Less Yes Exceeds Daily and weekly review by next level
Less Yes Exceeds Completed documents visually displayed by day of weekfor each leader
Less Yes Exceeds Transitions between leaders eased by hand-off of leaderstandard work
Notes:

Category 2: Visual Controls—Production
Assessment Questions
1. Are visual controls in evidence for production processes?
2. Are the visuals current?
3. Are visuals in use in flow areas? In pull areas?
4. Are reasons for misses clear enough to take next steps?
5. Are visuals regularly reviewed and used to drive improvement?
6. Are improvements stimulated by visuals limited to crises or are theremany improvements?
7. Are visuals revised and changed as conditions change?
8. Are visuals in regular use for out-cycle tasks like waterspider routes?
9. Are visuals regularly signed off/initialed by leaders in the area?
10. Is there evidence of problems listed on visuals also listed as improvementaction items?
176
CREATING A LEAN CULTURE
Level 1: Pre-implementation
Less Yes Exceeds None in evidence
Notes:
Level 2: Beginning implementation
Less Yes Exceeds Production-tracking chart posted in flow areas only
Less Yes Exceeds Filled in irregularly w/ focus on numbers only
Less Yes Exceeds Reasons for misses either absent or too vague for action
Less Yes Exceeds No or irregular daily review and response
Notes:

177
APPENDIX—LEAN MANAGEMENT ASSESSMENT
Level 3: First recognizable state
Less Yes Exceeds Production-tracking charts in flow areas filled out regularly
Less Yes Exceeds Reasons for misses sometimes specific and actionable onhit-or-miss basis
Less Yes Exceeds Visuals reviewed daily, occasionally driving specific actionon an identified major issue
Notes:
Level 4: System stabilizing
Less Yes Exceeds Tracking charts in use at pacemaker, in flow, and in pull areas
Less Yes Exceeds Reasons for misses generally clear, actionable
Less Yes Exceeds Visuals reviewed daily, regularly lead to specific actions onsmall, as well as large, flow interrupters
Less Yes Exceeds Visuals added, discontinued as needs change
Notes:
Level 5: Sustainable system
Less Yes Exceeds Visuals in regular use for out-cycle tasks throughout
Less Yes Exceeds Production charts routinely initialed several times daily bydepartment and value stream leaders
Less Yes Exceeds Visuals regularly analyzed to identify top three interrupters/problems
Less Yes Exceeds Problems identified on visuals lead to root cause problem solving
Notes:

Category 3: Visual Controls—ProductionSupport (5S, operator maintenance, preventive maintenance, etc.)
Assessment Questions
1. Are visual controls in evidence for nonproduction processes?
2. Are the visuals current?
3. Do leaders see how actual versus expected performance can be visuallycontrolled in nonproduction tasks?
4. Is review of nonproduction visuals included in leader standard work?
5. Are visuals regularly reviewed and used to drive improvement?
6. Are improvements stimulated by visuals limited to crises or are theremany improvements, small as well as large?
7. Are visuals used to display and monitor preventive maintenance scheduleand performance?
8. Do nonproduction visuals stimulate follow-up action, either to maintainthem or to drive improvement?
178
CREATING A LEAN CULTURE
Level 1: Pre-implementation
Less Yes Exceeds None in evidence
Less Yes Exceeds Monitoring, reports if any are on IT system, in a rarely re-ferred to book, or in local informal undocumented systems
Notes:
Level 2: Beginning implementation
Less Yes Exceeds Some leaders understand possibility for visual expected vs.actual for nonproduction processes
Less Yes Exceeds Initial visuals posted for some processes, but review is irregular
Notes:

179
APPENDIX—LEAN MANAGEMENT ASSESSMENT
Level 3: First recognizable state
Less Yes Exceeds Many visuals in evidence
Less Yes Exceeds Visuals reviewed regularly as defined in leaderstandard work
Less Yes Exceeds Review occasionally drives action on a major issue
Notes:
Level 4: System stabilizing
Less Yes Exceeds Charts and tracking processes in place for all recurringactivities
Less Yes Exceeds Reviews regularly lead to actions on small as well as largeissues
Less Yes Exceeds Visuals display and monitor preventive maintenance schedule and performance
Notes:
Level 5: Sustainable system
Less Yes Exceeds One-day follow-up on lapses in maintaining visuals
Less Yes Exceeds Tracking data regularly analyzed for trends to spot problems
Less Yes Exceeds Identified problems followed up for root cause solutions
Notes:

Category 4: Daily Accountability Process
Assessment Questions
1. Do regular meetings focus on status of processes as well as on results?How often?
2. Do start-up meetings have clear purpose and agenda beyond today’s production requirements/issues?
3. Do regular meetings result in task assignments to improve processes?
4. How are improvement assignments managed: visually or by spreadsheet?
5. Do visual control charts result in task assignments to address interrup-tions?
6. What proportion of leaders is familiar with project management tech-niques? Use them regularly?
7. How well integrated are support groups with value stream improvementactivities?
180
CREATING A LEAN CULTURE
Level 1: Pre-implementation
Less Yes Exceeds Daily plant and value stream meetings focus only on tradi-tional production/shortage issues
Notes:
Level 2: Beginning implementation
Less Yes Exceeds Team start-up meetings held sporadically at floor, depart-ment, value stream levels
Less Yes Exceeds Team meetings lack clear purpose
Less Yes Exceeds Meeting agendas mostly focus on day’s production, hours
Notes:

181
APPENDIX—LEAN MANAGEMENT ASSESSMENT
Level 3: First recognizable state
Less Yes Exceeds Three tiers of meetings regularly held, but little use of taskassignments or follow-up at tier 2, 3
Less Yes Exceeds Task assignments often undated, moved from original due date
Less Yes Exceeds Task assignments in response to major disruptions only
Less Yes Exceeds Green/red convention not used—started and dropped
Less Yes Exceeds Project breakdown approach introduced in task assignments
Notes:
Level 4: System stabilizing
Less Yes Exceeds Meeting agendas regularly followed, attendance is faithful
Less Yes Exceeds Review of prior day’s visuals results in assignments on small,large items
Less Yes Exceeds Task assignments made from many sources, not just trackers
Less Yes Exceeds Green/red coding a regular practice; task notes stay on original due dates
Less Yes Exceeds Many completed tasks reflected in improved performance
Notes:
Level 5: Sustainable system
Less Yes Exceeds Accountability is routine; boards used effectively for longand short assignments
Less Yes Exceeds Supervisors grasp, use basic project management skills
Less Yes Exceeds Support groups integrated into value stream improvementactivities
Notes:

Category 5: Process Definition
Assessment Questions
1. Are there documented definitions for all production and nonproductionprocesses?
2. Does the documentation match actual practice?
3. Where are process definitions kept?
4. Is standard work available for production tasks? For how many takts? Isit posted?
5. Is standard work available, posted, for areas that operate at takt time?
6. Are operator balance charts available, posted for flow areas? For each takttime?
7. Are definitions available, posted for tasks in the management process(i.e., who fills in charts?)?
8. Is documentation revised as processes change?
182
CREATING A LEAN CULTURE
Level 1: Pre-implementation
Less Yes Exceeds Process documentation in books, usually out of date
Notes:
Level 2: Beginning implementation
Less Yes Exceeds Discussion underway to replace obsolete definitions withlean visuals for process controls, process tracking, workinstructions
Notes:

183
APPENDIX—LEAN MANAGEMENT ASSESSMENT
Level 3: First recognizable state
Less Yes Exceeds Assembly processes defined by standard work charts
Less Yes Exceeds Standard work for only one level of takt time
Less Yes Exceeds Most other processes still undocumented or in pre-implementation state.
Notes:
Level 4: System stabilizing
Less Yes Exceeds Multiple takt areas have operator balance charts, standard work for each takt
Less Yes Exceeds Definitions in place for production and managementprocesses (e.g., who completes the visual controls and when)
Less Yes Exceeds Process definitions are kept at point of use
Notes:
Level 5: Sustainable system
Less Yes Exceeds Expected performance for all processes defined and documented
Less Yes Exceeds Process documentation revised as processes change
Less Yes Exceeds Documented processes match actual processes
Notes:
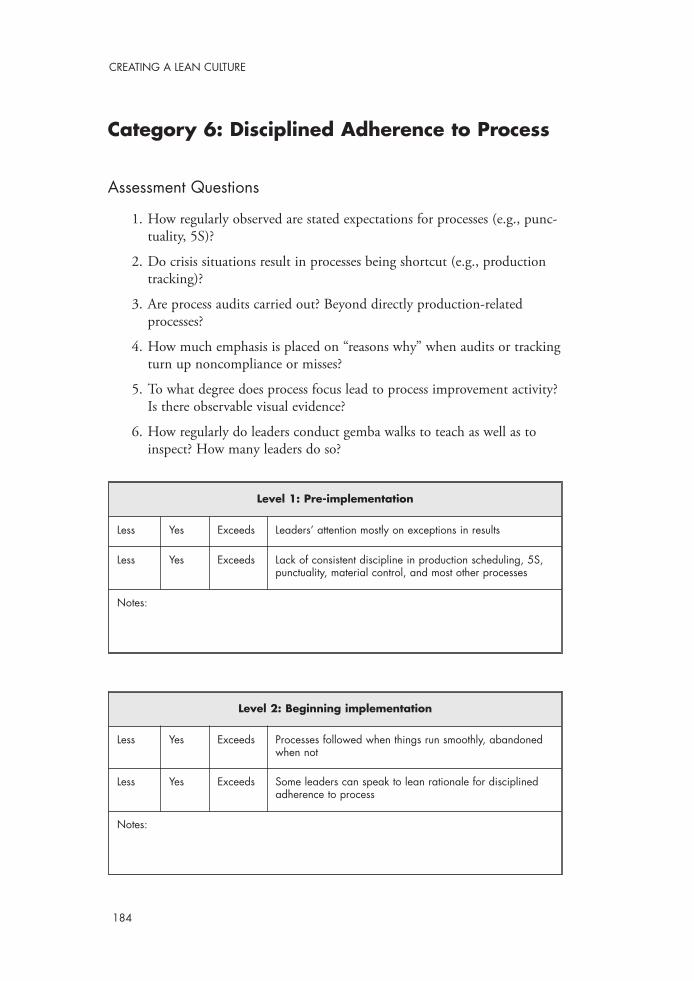
Category 6: Disciplined Adherence to Process
Assessment Questions
1. How regularly observed are stated expectations for processes (e.g., punc-tuality, 5S)?
2. Do crisis situations result in processes being shortcut (e.g., productiontracking)?
3. Are process audits carried out? Beyond directly production-relatedprocesses?
4. How much emphasis is placed on “reasons why” when audits or trackingturn up noncompliance or misses?
5. To what degree does process focus lead to process improvement activity?Is there observable visual evidence?
6. How regularly do leaders conduct gemba walks to teach as well as toinspect? How many leaders do so?
184
CREATING A LEAN CULTURE
Level 1: Pre-implementation
Less Yes Exceeds Leaders’ attention mostly on exceptions in results
Less Yes Exceeds Lack of consistent discipline in production scheduling, 5S,punctuality, material control, and most other processes
Notes:
Level 2: Beginning implementation
Less Yes Exceeds Processes followed when things run smoothly, abandonedwhen not
Less Yes Exceeds Some leaders can speak to lean rationale for disciplinedadherence to process
Notes:

185
APPENDIX—LEAN MANAGEMENT ASSESSMENT
Level 3: First recognizable state
Less Yes Exceeds Leaders focus on obvious processes, i.e., standardizedwork, pitch attainment
Less Yes Exceeds Beginning focus on other processes, i.e., TPM, 5S, pull systems-supermarkets, punctuality, labor planning, not yetsystematic
Less Yes Exceeds Main focus is recording what happened, less on why andprevention
Notes:
Level 5: Sustainable system
Less Yes Exceeds Frequent reviews of a production and related processes
Less Yes Exceeds Routine audits maintain processes (i.e., 5S, pull systems,TPM, labor planning)
Less Yes Exceeds Many leaders capable of being gemba walk teachers;gemba walks regularly held with feedback and assignments
Less Yes Exceeds Process ‘misses’ beyond production tracking produce taskassignments for improvement
Less Yes Exceeds Paretos of top three misses across many processes driveimprovements
Notes:
Level 4: System stabilizing
Less Yes Exceeds Process focus includes non-cyclical areas, i.e., standardwork in production control, waterspider reasons for over-due cycles, visuals for scheduled maintenance as well asoperator maintenance
Less Yes Exceeds Routine audits on health of pull systems, changeover timeactual vs. expected, other processes
Less Yes Exceeds Leaders begin to use data from process tracking to identifyand act on improvement opportunities
Notes:

Category 7: Root Cause Problem Solving
Assessment Questions
1. How frequently are workarounds used rather than investigating andresolving underlying causes of problems?
2. To what degree do leaders rely on data and analysis to attack a problemvs. gut feel, intuition, or impression?
3. To what degree do leaders anticipate that changes will expose previouslyunseen problems, but proceed anyway?
4. How frequently do leaders ask why something happened vs. just askingwhat will we do to get back on track?
5. How frequently are leaders involved in leading problem solving efforts?
6. How well understood and widely used are problem solving tools, i.e., 5-whys, fishbone analysis, attribute charting, etc.
7. How frequently do leaders tighten up their measurements in order touncover the next level of process interruption or problem?
186
CREATING A LEAN CULTURE
Level 1: Pre-implementation
Less Yes Exceeds Problem solving focused on workarounds, not on findingthe cause of the problem
Less Yes Exceeds Where cause analysis problem solving is used, it is in formal technical project teams
Notes:
Level 2: Beginning implementation
Less Yes Exceeds Leaders have begun using visuals to collect problem databut little emphasis on pursuing cause analysis
Less Yes Exceeds Most common response to problems is still to work aroundand cover the cause with buffers of inventory, labor, hours,etc.
Notes:
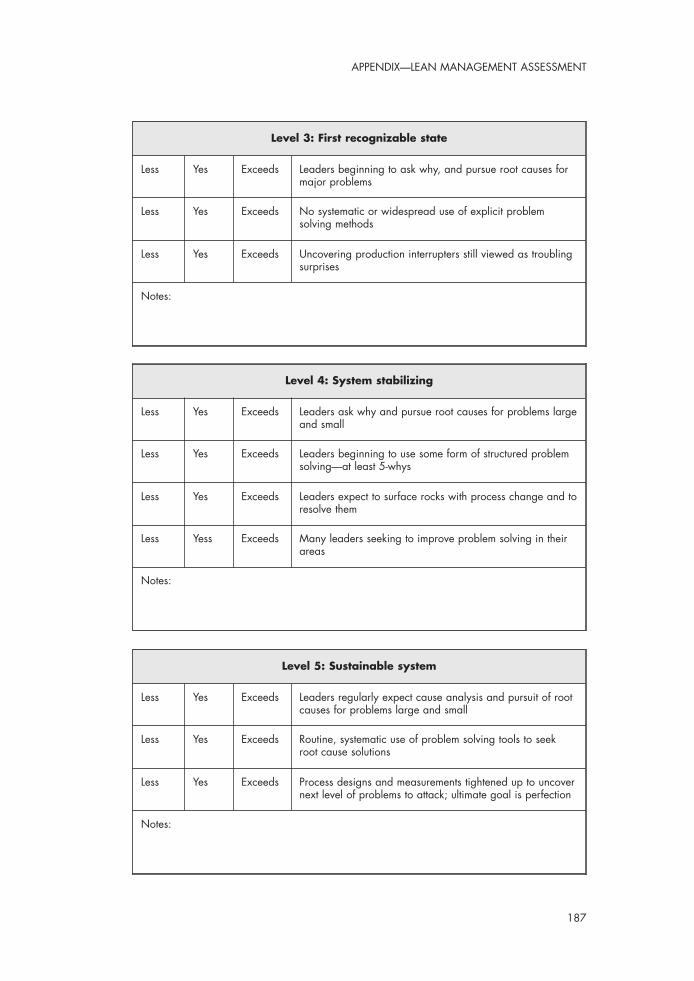
187
APPENDIX—LEAN MANAGEMENT ASSESSMENT
Level 3: First recognizable state
Less Yes Exceeds Leaders beginning to ask why, and pursue root causes formajor problems
Less Yes Exceeds No systematic or widespread use of explicit problem solving methods
Less Yes Exceeds Uncovering production interrupters still viewed as troublingsurprises
Notes:
Level 5: Sustainable system
Less Yes Exceeds Leaders regularly expect cause analysis and pursuit of rootcauses for problems large and small
Less Yes Exceeds Routine, systematic use of problem solving tools to seekroot cause solutions
Less Yes Exceeds Process designs and measurements tightened up to uncovernext level of problems to attack; ultimate goal is perfection
Notes:
Level 4: System stabilizing
Less Yes Exceeds Leaders ask why and pursue root causes for problems largeand small
Less Yes Exceeds Leaders beginning to use some form of structured problemsolving—at least 5-whys
Less Yes Exceeds Leaders expect to surface rocks with process change and toresolve them
Less Yess Exceeds Many leaders seeking to improve problem solving in theirareas
Notes:
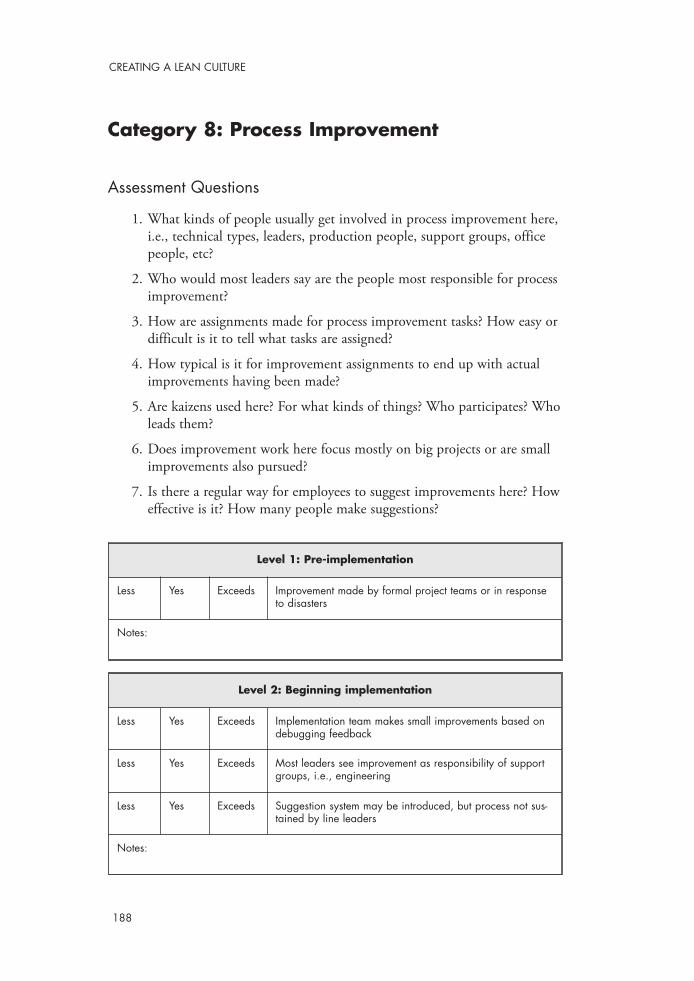
Category 8: Process Improvement
Assessment Questions
1. What kinds of people usually get involved in process improvement here,i.e., technical types, leaders, production people, support groups, officepeople, etc?
2. Who would most leaders say are the people most responsible for processimprovement?
3. How are assignments made for process improvement tasks? How easy ordifficult is it to tell what tasks are assigned?
4. How typical is it for improvement assignments to end up with actualimprovements having been made?
5. Are kaizens used here? For what kinds of things? Who participates? Wholeads them?
6. Does improvement work here focus mostly on big projects or are smallimprovements also pursued?
7. Is there a regular way for employees to suggest improvements here? Howeffective is it? How many people make suggestions?
188
CREATING A LEAN CULTURE
Level 1: Pre-implementation
Less Yes Exceeds Improvement made by formal project teams or in responseto disasters
Notes:
Level 2: Beginning implementation
Less Yes Exceeds Implementation team makes small improvements based ondebugging feedback
Less Yes Exceeds Most leaders see improvement as responsibility of supportgroups, i.e., engineering
Less Yes Exceeds Suggestion system may be introduced, but process not sus-tained by line leaders
Notes:

189
APPENDIX—LEAN MANAGEMENT ASSESSMENT
Level 3: First recognizable state
Less Yes Exceeds As lean production process stabilizes, some line leaderssee process improvement as an area for their involvement
Less Yes Exceeds Some line leaders are making improvements to theirprocesses
Less Yes Exceeds VSMs, some supervisors using daily task boards to driveimprovements; many uncomfortable with the process; completed tasks w/ desired results is occasional
Less Yes Exceeds Some leaders participate in kaizens, a few lead kaizens
Notes:
Level 4: System stabilizing
Less Yes Exceeds Line leaders clearly see process improvement within theirresponsibility
Less Yes Exceeds Most line leeaders are leading process improvements intheir areas
Less Yes Exceeds Most leaders are effectively using daily task assignmentboards
Less Yes Exceeds Leaders experimenting with employee suggestions forprocess improvement
Less Yess Exceeds All leaders have participated in kaizens, most now leadthem
Notes:

190
CREATING A LEAN CULTURE
Level 5: Sustainable system
Less Yes Exceeds Daily task assignments from daily tier two and three meet-ings drive small and large improvements
Less Yes Exceeds Employee suggestion system established and sustained withsteady imput of ideas, output of implemented improvements
Less Yes Exceeds Line leaders identifying and leading improvement activitiesin their areas
Less Yes Exceeds Improvement plans/targets visibly displayed at valuestream and department boards
Less Yes Exceeds Many leaders are kaizen facilitators
Less Yes Exceeds Plants have kaizen/lean resource teams to support localimprovement activities
Notes:
GlossaryBalanced line. A series of workstations, such as an assembly line where the timeto do the work is nearly equal in each station within a few seconds. When a lineis balanced to takt time, the time it takes to do the work in each station is equalto takt time or very close—within a second or two of takt. See also Takt time.
Batch and queue. A method of organizing production. In batch and queue, thefocus is on the efficiency of each discrete part of the production operation suchas a machine or a paint shop as compared with the efficiency of the system as awhole from the first operation to final product. Each operation produces a batchof as many of a particular item at a time as possible, based on a separate produc-tion schedule sent to each operation. When the batch is done, it is pushed to thenext operation regardless of the type and quantity of item needed by the nextoperation. The batch sits in queue, waiting for the next operation to get to it.Batch operations typically try to minimize the number of changeovers from oneitem to the next to maximize their efficiency in, for example, parts produced permachine per minute, hour, or day. See also Changeover.
Brownfield. The name given to existing operations, particularly when they are inthe process of being converted from batch-and-queue production to lean produc-tion. Brownfield operations already have established practices and cultures, as dis-
There are several excellent sources of definitions of lean terms and further explanations of them. See for example:Dennis, Pascal. Lean Production Simplified, New York: Productivity Press, 2002.Imai, Masaaki. Gemba Kaizen, New York: McGraw-Hill, 1997. Lean Enterprise Institute. Lean Lexicon, Brookline, MA: Lean Enterprise Institute, 2003.
191
tinct from greenfield operations, which often are literally constructed on whatwas previously an empty field. Greenfields have no history, no culture, and nopreexisting practices.
Changeover. The time it takes to switch production of one product or compo-nent to making a different model, style, type of component, or finished product.Changeover time is often associated with machines or other equipment usedto make or process components for several different product lines or styles.Changeovers consist of elements, such as shutting down the machine or stoppingproduction, removing the tool, die, or fixture for the first part, inserting the toolto make the second part, removing any remaining first parts and their componentmaterials, bringing in the materials and containers to make and hold the secondpart, making a second part and checking it against specifications, and resumingproduction.
Countermeasure. In the Toyota Production System, when a problem arises thatcannot be eliminated immediately, countermeasures are put in place to protectthe process from the problem. When a countermeasure is in place, the problemis not considered fixed or solved; instead, it is considered just to be a band-aideuntil a real solution is found that will eliminate the problem instead of simplycovering it up. For example, holding inventory to protect against a machine thatbreaks down often is a countermeasure to be kept in place until the machine’sreliability can be improved.
Culture. In a workplace, the sum of habits people rely on to get things done;“The way we do things here.” Culture also sums up the things an adult memberof a work group needs to know and comply with in order not to be seen asdeviant by other members. See chapter 1.
Cycle time. See Work content.
Discipline. What happens when someone breaks the rules or fails to meet expec-tations. The second meaning refers to adherence to defined processes, such as fol-lowing the sequence of elements every time in standardized work, or filling in apitch chart as each pitch cycle is completed. This latter meaning of discipline is espe-cially crucial in a lean system where processes are interdependent and closely tiedwith one another and failure in any one can quickly bring the entire system to a halt.
FIFO. First In First Out. When units move between operations in FIFO order,they maintain their sequence. This can be important when work starts simulta-
192
CREATING A LEAN CULTURE
neously, in different areas, on several subcomponents that will come together toform a single unit at the end of the production process. Maintaining FIFOsequence is also important in keeping stored inventory fresh by always using theoldest first.
Five S (5S). Sort, shine, set in order, standardize, sustain. These are five stepsto remove unneeded tools, materials, debris, and clutter; thoroughly clean theentire area and everything in it; establish a logical place for each item; markaddresses/locations for each place and the thing(s) that go in it; and establish asystem to maintain the cleanliness and order you have established. With 5S,everything has a place, and you can tell at a glance what is supposed to be where,what does not belong in an area, and what belongs, but is missing or out of place.It is one form of basic discipline
Five Whys (5 Ws). Asking why five times is a basic method of cause analysis.Each successive question is intended to go deeper into the cause of a situation,typically a problem with production. For example: We missed pitch this period.Why? We ran out of parts. Why? The waterspider didn’t pick up the withdrawalcard. Why? There was no withdrawal card in the container. Why? I took the cardhome in my pocket by accident and lost it. Why? I didn’t put the withdrawal cardin the kanban post when I pulled the container in to begin using it. What wasthe cause? Failure to handle the withdrawal kanban according to the definedprocess: put it in the kanban post before using the first part from the container!
Flow. A goal in lean production in which product moves through the steps in aproduction process with no interruption or waiting between steps. An example offlow is a moving assembly line. The ideal of flow is one-piece flow. In one-pieceflow, as work is completed at one workstation, the unit is passed directly to thenext with no waiting and a new unit arrives at the first workstation without thatoperator having to wait for it. In some cases, flow is not one piece at a time, butrather a small batch or lot at a time, such as a pair of arms for a chair or a set ofdrawers for a storage cabinet.
Flow interrupters. Things that cause production to be halted or slowed belowthe expected pace, until they can be resolved. Running out of parts in an assem-bly process is a flow interrupter. So are machines breaking down unexpectedly,and unplanned absences of production team members.
Gemba walk. A Japanese term meaning “the real place,” or roughly, “where theaction is.” In manufacturing, that means the production floor. Gemba walks are
193
GLOSSARY
one of the primary ways for teaching lean production, and the primary way forteaching lean management. In a gemba walk, a teacher, or sensei, and studentwalk the production floor. The teacher asks the student to tell what s/he sees and,depending on the answer, asks more questions to stimulate the student to thinkdifferently about what is in front of them. This includes learning to see what isnot there, and learning to see what has been accepted as a given, but should bechanged to fit with lean principles. Gemba walks often include assignments to acton what the student has come to see, with follow up on the next gemba walk,typically weekly. See also Sensei.
Heijunka. A Japanese term for a visual method used to smooth out demand forproduction so the demand is level, or stable every interval of time all day long.The intervals can be pitches, fractions of an hour, whole hours, or any otherinterval that fits a particular production process. In addition to leveling workacross intervals, a heijunka system can also be used to introduce the same num-ber and sequence of units of mixed types every interval, reflecting the overall pro-portions of mixed models to be produced in a given day or other productionperiod. Heijunka leveling can be applied equally well to nonproduction activities,for example, when scheduling work to be carried out by a maintenance group.See also Mixed-model line.
Hypothetical construct. An idea or a label applied to an idea that cannot bedirectly observed. A construct is an abstraction such as market appeal, in distinc-tion to something concrete such as gross operating profit or first year sales.
IT. An abbreviation for information technology, meaning computers, computerautomation, and computer networks. IT solutions to information flow and infor-mation management are often, but not always, at odds with the visual controlsapproach in lean production and lean management, where no computer isneeded to assess the status of any process. Computer networks can be helpful inlean systems by serving to broadcast or transmit information from one locationto another, especially where line of sight communication is not possible or mul-tiple configurations of options make simple visual methods less practical.
Job rotation. See Rotation.
Kaizen. A Japanese term meaning “good change.” Kaizen is a way of thinkingand seeing, of always being alert to the opportunity to make changes for improve-ment. It typically involves small changes, rarely more than can be accomplishedby a team of seven working full time for a week. Many lean organizations include
194
CREATING A LEAN CULTURE

kaizen events as a regular part of their continuous improvement activities.Kaizens are structured events carried out by a team assembled for the task underthe direction of a kaizen team leader, where the improvement task is completedstart to finish in a week or less.
Kanban. A Japanese term meaning signboard. Kanbans are used to identify andorder a specified quantity of parts. They include three kinds of information: thepart or item number, the quantity, and authorization either to make parts in thecase of a production instruction kanban, or to take parts in the case of a with-drawal kanban. Kanbans are often printed cards, but can also be designatedempty containers, or empty spots in a rack or on the floor. See also pull signals.
Layout. The arrangement of equipment and material storage in a productionarea, analogous to a floor plan for a room or house. Layouts in lean productionareas are designed to facilitate flow of material and production, with equipmentarranged in the sequence of production steps. See also value stream.
Lean management system. The practices and tools used to monitor, measure,and sustain the operation of lean production operations. Lean management prac-tices identify where actual performance fails to meet expected performance;assigns and follows up improvement activities to bring actual in line withexpected, or to raise the level of expected performance. The basic components ofthe lean management system are standard work for leaders, visual controls, and adaily accountability process.
Lean production. The name for the Toyota Production System popularized byWomack and Jones in Lean Thinking. Womack and Jones identify five elements,or principles, of lean production: Definition of value from the customer’s pointof view, flow production, pull replenishment of what has been consumed, con-stant emphasis on the reduction of waste, and striving for perfection.
Lot size. Lean practitioners often refer to lot sizes, rather than using the word“batch.” In any case, lot size refers to a specific quantity or batch in which partsare produced or procured. Batches, or lots of defined size, are used in leanprocesses where one-piece flow is not yet possible because of bottlenecks or whereresources are shared among value streams. The lot size (and container size) at thepoint where parts are used, typically in assembly; the lot size in which parts areheld in supermarkets; and the lot sizes in which producing workcenters makeparts need to be in close alignment to avoid adding several potential forms ofwaste into the system as a whole. See also flow.
195
GLOSSARY

Machine balance chart. Shows the load on a machine as a stacked bar chart ofthe number of hours per week required to produce each type of part the machinemakes, including the amount of time it is idle while changeovers from one partto the next are performed, and the amount of time it is typically unavailablebecause of breakdowns or planned maintenance. The chart reflects the time amachine must run and change over to produce specified quantities of the parts toreplenish a supermarket without causing the supermarket to run out of any of theparts produced by the machine. A machine balance chart needs to be producedas part of the work involved in setting up a pull system’s supermarket. See also pullsystem and Supermarket.
Mixed-model line. An assembly or progressive build line on which several mod-els of unit are produced, such as two different chair models, each of which can beordered with different options, or different sizes of similar units like storage cab-inets. So, instead of building a single finished good, the line is designed to pro-duce several kinds of finished good in a way that the mix does not interrupt flow.Heijunka scheduling is helpful for introducing the mix in a stable way that allowsthe line to maintain flow. See balanced line and Heijunka.
MRP. Materials Requirements Planning (MRP) is the planning system for con-ventional batch-and-queue production systems. MRP forecasts the need formaterial and components based in part on historical patterns of demand and inpart on current orders. MRP schedules work to be performed in batches to max-imize efficiency of individual workcenters. It is a classic push scheduling system.
Non-cyclical processes. Processes not carried out every production cycle (suchas every time a storage cabinet is assembled on an assembly line). Non-cyclicaltasks are those carried out one or only a few times a day, such as cleaning equip-ment at the end of a shift, or calibrating a process every 100 cycles. Non-cyclicaltasks can be even less frequent, for example, weekly, monthly, or quarterly main-tenance tasks. Compare with Standardized work.
Non-value-adding. Tasks that do not transform parts or materials into finishedproducts. Some non-value-adding work remains necessary in many productionoperations, such as parts traveling on a conveyor through a paint or finishingshop. Applying and curing the finish adds value as it is part of the transformationof materials into products, but travel on the conveyor does not, even though it isnecessary in the way the process is set up today. Tasks either add value or do not;people asked to do non-value-adding work are not themselves without value; theyare only doing what the current system asks of them. Compare with value adding.
196
CREATING A LEAN CULTURE

Pitch. A multiple of takt, first used as a unit of measure in the automotive sup-plier industry, where units such as door handles or mirrors are produced to orderand shipped to assembly plants in standard containers, or packs. The pack quan-tity (for example 24 mirrors) is designated as a pitch as a method to manage pace.If each mirror is produced to a takt time of 20 seconds, 24 units would equaleight minutes of work. Instead of having to focus each 20 seconds, pitch allowsa leader to check pace every 24 takt cycles in this example. Where standard packquantities are not used, the concept is still useful. Pitch can be used to designatean interval of time at which to measure whether the actual pace of productionequals what was expected. Pitch as a time interval can be an hour, half hour, quar-ter hour, or other interval depending on the nature of the product and maturityof the process. See also Takt time.
Priority board. Part of a pull system for replenishing material that has been con-sumed by a customer process. Production instruction kanbans that direct a work-center to make a specified quantity of a specific part are brought to the workcen-ter and placed on its priority board in the order that the cards arrive at the work-center. The cards are, in effect, in line waiting their turn. As the workcenter oper-ator completes a job, s/he takes the first card in line from the next-up position onthe board and puts it in a designated spot (often marked “Running”) in the work-center. The operator or team leader then moves each card up one spot on theboard. See Figure 4.4 for an illustration.
Process focus. Virtually every process in a lean system is defined, documented,and visually controlled. Each process in a lean system is interdependent with one,several, or many other processes. Failure in any single process can quickly bringthe system to a halt. Process focus is the practice and discipline of continually andregularly checking on the status of each process to be sure it is operating normally,or documenting when it is not, and identifying the cause of the abnormal condi-tion and eliminating or preventing it from recurring. Process focus is a principleobjective of the lean management system.
Production instruction card. A type of kanban that authorizes the production of aspecified quantity of a particular component or part. Production instructions are ele-ments in pull production systems. They typically circulate between a supermarketand the workcenter where the part or component is produced when the level of thatpart in the supermarket reaches its reorder point. See also Kanban and Pull signals.
Progressive build line. Another name for assembly lines where a finished unit isbuilt up piece by piece as it moves from one assembly station to the next.
197
GLOSSARY

Progressive build does not require a moving conveyor line, only that a unit movesfrom station to station as it is assembled.
Pull signals, visual pull signals. Pull signals are the devices used to authorizeand request the waterspider to pick and deliver a specified quantity of a specificpart, or to authorize and request a supplying workcenter to make a specifiedquantity of a specific part to replenish what has been taken away from the work-center’s supermarket. The pull signals are, classically, kanban cards, but can beempty racks or containers, empty spots on the floor or a designated location ona shelf or space in a workstation. Pull signals can be fitted with barcodes to enablescanning and electronic ordering or recording, but for a pull system to remainconsistent with a lean philosophy, it must also remain visually verifiable. Thismeans electronic pull signals (appropriate when the distance between supplierand customer is too great to confidently rely on the circulation of cards as the solesignal) and visual signals (the cards) can coexist, but visuals are always a require-ment in lean management. See also Kanban and Supermarket.
Pull, pull system. Used in lean production systems where flow is not practical,pull production is based on replenishing what has been used by a customer, usu-ally the next workstation in a production process but sometimes an actual cus-tomer taking away finished goods. Pull production is typically used where a pieceof equipment makes components for several product lines or value streams, oftenwhere the equipment produces components faster than a single consumingprocess can use them. Pull systems often involve supermarkets where componentsare kept in specified locations and quantities. As customers take componentsaway from the market, signals to replenish what has been removed are sent to theproducing workcenter. See also Kanban and Supermarket.
Queue. Material waiting to be processed is in queue, as in waiting its turn in line.Queues of material between operations are often referred to as WIP, or work inprocess inventory. Queues of WIP between processes are the inevitable result ofproducing components in batches as opposed to one at a time. See also Batch andqueue.
Root cause. The basic source from which a problem grows, as distinct fromsymptoms that are the visible effects of a problem. By doing a problem solvinganalysis to find what is causing a problem, it is often possible to eliminate thecause altogether, or to prevent it from recurring. By analogy, if you cut the topoff a weed, it is likely to grow back from the undisturbed root. If you dig the weedout by the root, it will not come back. See also 5 Whys.
198
CREATING A LEAN CULTURE

Rotation, Rotation pattern. Refers to people moving from job to job at speci-fied intervals or times during the day. Where some jobs involve higher levels ofergonomic stress, rotation might be as frequent as every half hour. In other situ-ations, rotation might be less frequent, such as every hour, two hours, everybreak, at mid-shift, etc. Rotation serves three purposes: First, it mitigates the riskof repetitive motion injuries, letting people vary the muscle groups and posturesfrom station to station. Second it provides a broad base of skilled and experiencedpeople able to step into any of several jobs when needed. Third, it provides manypeople’s eyes on each and every job, improving the chances for thinking of andseeing potential process improvements.
Sensei. A Japanese term for one who has gone before, or teacher. The sensei is themaster in the master-apprentice learning model for lean management and formuch of lean production.
Setup. See Changeover.
Standard work for leaders. One of the key elements of the lean managementsystem, standard work for leaders specifies the actions to be taken each day tofocus on the processes in each leader’s area of responsibility. Unlike standardizedwork for a production workstation, the elements in standard work for leadersusually are not timed, though some of them take place at specific times duringthe day, for example, “Lead tier two meeting (6:30 am).” See chapter 3 for a dis-cussion of standard work for leaders.
Standardized work. Specifications, usually for a production workstation, thatinclude: the sequence in which steps or work elements are performed, expectedtime for each element and the total time for all, takt time, the quantities of inven-tory before, in, and after the workstation. Standard work for production opera-tions also can include specific safety information (for example, identifying poten-tial pinch points) and quality checks to be performed during the sequence ofoperations.
Supermarket. Supermarkets are integral elements in lean pull systems. They areareas where inventory is stored according to specific rules. Each item in the super-market has a designated address as the only place where it is stored. Each item isstored in specific quantities, typically in a specified maximum quantity ofcontainers. Each container is to hold a specified number of the designated item.The point at which an item is to be reordered, the reorder or trigger point, isclearly designated visually. In some cases, minimum quantities are also designated
199
GLOSSARY

visually. One should be able to assess the status of a supermarket by using a sim-ple visual inspection: is the stock stored properly, do part numbers correspond tothe appropriate address, are maximum quantity limits being adhered to, are theredangerously low levels of some parts, are the kanban cards in the proper locationsaccording to the documented process, etc. See also Pull system and Kanban.
Support groups. These are technical specialty departments found in most man-ufacturing plants. They can include engineering, production control (often calledproduction and inventory control (PIC) or materials management), quality con-trol or quality assurance (QC or QA), maintenance, tooling, safety, and humanresources.
Takt time. The rate of customer demand calculated by dividing daily demand inunits into the time available for production. It is typically expressed in seconds,as in: takt time for the XYZ is 54 seconds. That means a completed unit is dueoff the end of the line every 54 seconds. Lean systems are designed to produce atthe takt rate; thus takt is the basis for pace for the entire lean process.
Team leader. Team leaders are the first level of formally designated leadership ina lean production environment. Where production is done by an hourly work-force, team leaders are typically hourly employees who earn a slight premium fortheir position. The primary responsibilities of team leaders are to maintain thetakt pace of production; maintain and improve on standardized work, includingtraining operators in standard work; and being available for limited (5-minute)fill-in when a team member must leave his or her position in an emergency. Teamleaders do not work production except in these situations. Team size is typicallyfive to ten people working in a small area.
Technical lean implementation. Focuses on changes to the layout of the shopfloor, the way inventory is deployed and moves, and changes in how and wherethe production schedule is delivered to the shop floor. Typical areas of focus intechnical implementations include establishing flow production balanced to stan-dardized work at takt time, implementing pull systems with kanban signaling forreplenishment, establishing waterspider routes, and refining parts presentationand container size among other things. Technical implementation differs fromlean management implementation.
Three-tier meetings. These make up the daily accountability process, one of thethree key elements in the lean management system. They are brief, structured,stand-up meetings that take place at or near the beginning of the workday. The
200
CREATING A LEAN CULTURE
first tier involves the work team led by the team leader. The second tier involvesthe team leaders led by the supervisor. The third tier involves the value streamstaff led by the value stream manager. See chapter 5 for a discussion of three-tiermeetings.
Toyota Production System (TPS). Developed over the past 50 years at Toyota,based initially on the writings of Henry Ford. TPS seeks to eliminate waste fromproduction processes. The ideal approach in TPS is for production to operate atexactly the rate of customer demand. This is often expressed as Just-in-Time pro-duction, where nothing is produced until there is specific customer demand forit. See also Pull, Pull system and Flow.
Tugger. A small, usually electric engine often operated by a driver in a standingposition. Tuggers are like small tram engines pulling carts or trailers of materialaround a production area. In lean production systems, tuggers are often used todeliver materials from supermarkets to the workstations in assembly areas wherethe material will be used. This is especially true where the distances are too longto walk or the materials too heavy or large to transport by handcart.
Value adding activity. Anything necessary to transform material on the way tomaking a finished product. Cutting to size, attaching components, making con-nections, applying finish are all examples of value-adding activity. Storing, mov-ing, counting, reworking are all examples of activities that do not add value to thefinished product, even though some of them may be necessary in the current pro-duction process. Compare with Non-value adding.
Value stream. The people and equipment involved in producing a product lineor closely related family of products. Value streams usually include each of theoperations and pieces of equipment needed to make a product lined up orarranged close together in the sequence of production operations. The intent isto minimize the distance parts have to be moved and maximize the speed of flowthrough the production process. In a batch-and-queue organization, like opera-tions are typically grouped together in separate departments, such as forming,molding, cutting, sewing, insertion, subassembly, finishing, final assembly.Batches of parts typically wait, sometimes a long time, between operations andoften must be moved long distances from one operation to the next.
Value-stream manager. In an organizational structure designed to most fullyreflect a lean philosophy, all the support groups related to making a value streamoperate would report on a solid line to the value-stream manager. This means the
201
GLOSSARY

value stream would have a dedicated staff group, as well as the typical line man-agement positions, such as team leaders and department supervisors. Especiallyearly in a lean journey, companies may not be ready to make this organizationalrealignment without creating more turbulence than is worthwhile.
Visual controls. Visual controls are the variety of approaches that make the sta-tus of a process visible at a glance. They include production-tracking charts ofvarious kinds that show actual versus expected performance. They also includeaudit forms for status of safety practices, workplace organization and 5S, compli-ance with specifications for contents of a supermarket, and number and locationof kanban cards. Signs, labeled “parking spaces” on the floor itself, and shadowboards all make it possible to tell where things should and shouldn’t be. Strictlyspeaking, visual controls allow control of processes rather than actually exertingcontrol themselves. See also Process focus.
Waterspider. A name often used for the person who circulates between thepoints where material is consumed and the supermarkets where it is stored.Waterspiders typically have defined routes and defined times, much like busschedules. They pick up empty containers and kanban cards from the point ofconsumption, go to the supermarket and use the withdrawal kanban cards as ashopping list to pull full containers from the supermarket shelf or rack, andreturn to deliver the full containers. Waterspiders sometimes remove finished goodsfrom an assembly area, and sometimes take production instruction kanbans fromthe supermarket to the producing workcenter. See also Supermarket and Kanban.
Work breakdown structure. A basic component in project management, a workbreakdown structure is essentially a list of all the steps, or sub tasks needed toaccomplish a larger task. An example is a recipe where the steps are listed insequence, one at a time, as opposed to simply listing the ingredients and stating,“combine and bake.”
Work content. Refers to the total amount of time required to perform all the ele-ments in the standard work for a workstation. This is often referred to as the cycletime for a task. Total work content, also referred to as total cycle time, refers tothe sum of cycle times of all workstations’ standard work elements. Thus, thecycle times to complete the work elements in each of a series of 9 workstations ina progressive build line might be 45 seconds in each workstation (though rarelyare workstations perfectly balanced this way). The total cycle time would be 9stations times 45 seconds for a total work content of 6 minutes 45 seconds.
Work element. See Standardized work.
202
CREATING A LEAN CULTURE

There are many references on lean production. The ones I have listed hereprovide a good introduction to its concepts and application.
Dennis, Pascal. Lean Production Simplified, New York: Productivity Press, 2002.
Imai, Masaaki. Gemba Kaizen, New York: McGraw-Hill, 1997.
Lean Enterprise Institute, Lean Lexicon, Brookline, MA: Lean EnterpriseInstitute, 2003.
Liker, Jeffrey K. Becoming Lean, New York: Productivity Press, 1998.
Rother, Mike, and Shook, John. Learning to See, Brookline, MA: LeanEnterprise Institute, 1998.
Womack, James, and Jones, Daniel. Lean Thinking, 2nd. Ed, New York: Simonand Schuster, 2003.
References
203


Index5S
audits, 167–68discipline, 94task boards, 60, 61
A-3 form, 127–29Accountability. See also Daily accountabil-
ity processattendance and, 96, 137–39building, 71importance of, 158Apprenticeship. See also Trainingmaster-apprentice model of, 35, 36,
162–63sensei's role in, 91–93
Assessmentassignments, 167–68between-process, 55calibration process of, 167–68categories of, 165conducting, 165–66goal, 164–65interpreting, 168leader standard work, 166lean, 164–68levels of, 165maintenance and process of, 164–68meeting process of, 71purpose of, 164–65scheduling, 166, 171
Assignmentsassessment, 167–68checking, 72–73color coding, 75, 76, 77, 78–79computerized, 60daily accountability process and task
board, 74–77, 80–84follow-up on, 80–81gemba walk, 93making, 34, 71, 80–81project management, 102, 107–8tracking, 74–77, 80–84vacation paradox and, 84–86, 144–45
Attendancecolor-coding, 137–39observations and, 96tracking, 137–39
Audits, 167–68Automation
downfalls of, 62, 64humans v., 10
Backsliding. See also Habitsconsultation for, 163, 164expectation of, 158, 160–61low performance as, 151–52as resistance, 158sensei with, consultation, 163, 164
Batch-and-queue systemdaily accounting process for, 69–70
205
"do whatever it takes" approach to, 9flow and pull v., 6–7, 12–13lean production v., 6–7, 69–70,
119–20management of, 8–9problem solving approach of, 119–20
Breakdown structures, 85
Calibration process, 167–68Capital, 7, 8Case studies
color coding, 78–79daily accountability task board, 82–83dollar value display, 72–73gemba walks, 94, 98IT support benefits, 66–67leader standard work, 30–31leadership, 110management failure, 22–23management success, 6–7problem solving, 94, 122–23,
127–29, 160–61response system, 130–34, 160–61suggestion neglect, 144–45support group benefits, 80–81visual controls, 41, 42, 44–45, 50–51,
56–58Charts. See TrackingColor coding
assignments, 75, 76, 77, 78–79attendance, 138, 139case study on, 78–79computer signaling v., 66–67for daily accountability task board,
75–77tracking and priority board, 49–52,
53Communication
flow and pull, 73n1observing, 97
Completion heijunka, 52, 54–55Computer systems
accuracy and precision of, 63, 64assignments via, 60calculation benefits of, 66–67color coding signals by, 66–67flexibility of, 63, 65
intimidation factor of, 63, 65–66proximity of, 63, 64–65timeliness of, 62–64visual controls v., 62–68
Consultants, choosing, 163, 164Conversion. See also Leadership
human resources policy issues in,153–54
leading, 101–17mental changes for, 5, 8, 14, 104–5,
109physical changes for, 4–5, 8
Culture. See also Lean cultureattributes of, 12–13defining, 3–4, 12inertia of, 12–13
Cycle time, 44
Daily accountability processappearance v. application of, 81–84assignment task board for, 74–77,
80–81, 81–84batch-and-queue v. lean, 69–70case studies on, 82–83color-coding for, 75–77defining, 20discipline for, 105–7follow-up, 171for lean production, 69–70meetings for, 70–81, 108vacation paradox and, 84–86
Day-to-day project management, 75, 77Discipline
accountability, 105–7establishing, 205S, 94gemba walks for, 162–63leadership by, 102, 105–7low performance, 151–52visual controls for, 46–48
Elementsanswers to, 170combining, 21daily accountability process as, 20,
69–87defining, 19–21
206
CREATING A LEAN CULTURE

executing, 21–23failure of, 22–23flow and pull system, 170leader standard work as, 20, 25–37visual controls as, 20, 39–68
Employeesattendance matrix of, 137–39automation v., 10human resource policies and, 153–54knowledge of, 96–97low performance, 151–52neglecting, 144–45qualifications of, 140–42, 154resistance of, 150–51suggestions from, 143–49
Expectationsbacksliding, 158, 160–61defining, 157
Flow and pullbatch-and-queue v., 6–7, 12–13communication, 73n1elements of, 170job-by-job tracking charts for, 48–49priority boards for, 49–52, 53support groups benefiting, 80–81
Gemba walks, 34, 35, 74–75assignments on, 93case study on, 94, 98discipline via, 162–63habits viewed by, 162–63looking for lean management on,
96–97maintaining, 162–63, 170, 171objective of, 94–95observations on, 96–97origin of, 93
Goalsassessing, 164–65perfection, 121–23
Habitsbacksliding, 151–52, 158, 160–61extinguishing, 16–17, 158heroic, 160–61mass v. lean, 14–16
process v. personal, 15unproductive, 14, 16–17
Heijunka status tracking charts, 52,54–55
Heroics, 160–61Honesty, 163Hourly tracking, 49–52, 53Human resources. See EmployeesHypothetical construct, 3
Idea system, 143–44. See also Suggestionsboard, 148, 149
Improvementsactivities option for, 125–26backsliding, 158delegating, 143–45kaizen, 129managing, 126note-taking, 150–51observing, 96ownership attribute for, 112–13perfection v., 121–23performance, 41, 74–77, 84–86,
112–13process focus, 13, 96recommending, 126resistance to, 150–51resources and skills for, 129response systems for, 130–34suggestions for, 143–49team leader notes for, 150–51vacation paradox for, 84–86, 144–45visual controls for, 41, 74–77, 146–49workarounds countering, 120–21
Intimidation factor, 63, 65–66Inventory practices
as cultural attribute, 13pushing v. pulling, 73n1
IT support. See also Computer systemsbenefits of, 66–67need for, 7, 8, 9
Job rotation, 140–42, 154Job-by-job tracking charts, 48–49
Kaizens, 6, 129Kanbans, 49, 67, 170
207
INDEX

Koenigsaeker, George, 116
Labor planningjob rotation and, 140–42observing, 96
Late load logs, 54Layoffs, 154Leader standard work
assessing, 166benefits of, 25–26case studies, 30–31defining, 19developing, 31, 32deviating from, 30–31form and format of, 34–35layers of, 27–29, 32maintaining, 159observing, 97passion for, 105plant manager, 28–29process-based, 25–26responding to, 159reviewing, 35supervisor, 28–29, 30–31team leader, 28–29, 33–34time spent on, 33–34training, 36value stream manager, 28–29, 34
Leadershipavailability in, 96behaviors, 101–3buying into, 150–51case study on, 110consistency, 116–17discipline attribute of, 102, 105–7expectation setting for, 157ownership attribute of, 103, 109–10passion attribute of, 102, 104–5production v. management balance
for, 103, 113–15project management skills for, 102,
107–8risk taking for, 111–12support group relations for, 115–16technical implementation for, 103,
110–12, 113–14thinking process for, 109
visual controls maintenance for, 114Lean conversion. See ConversionLean culture
cultural attributes of, 13future of, 170–71growth of, 5mass production culture v., 11, 12–13observing, 170–71targeting, 3–4
Lean elements. See ElementsLean management
assessing, 164–68balancing, 103, 113–15categories of, 165elements of, 19–23existing, 158failure of, 22–23human resources policy issues in,
153–54improvement activities for, 126leader standard work for, 25–37levels of, 165looking for, 96–97maintaining, 157–72parallel implementation of, 8–9process focus of, 5–7production v., 4–5, 103–13–115project-based, 102, 107–8questions, 168–71successful, 6–7thinking for, 109, 121–23training, 91–99
Lean productionbalancing, 103, 113–15batch-and-queue v., 6–7, 69–70,
119–20daily accounting process for, 69–70features of, 6–7habits, 15leading, 101–17maintaining, 157–72management v., 4–5, 103, 113–15monitoring tools for, 42–61new products using, 160–61non-cyclical, 59–61parallel implementation of, 8–9status of, 13, 49–52, 53
208
CREATING A LEAN CULTURE

technical implementation for, 103,110–12, 113–14
tracking, 27, 42–61Lean thinking, 109, 121–23Likert, Rensis, 116Listening, 146–49
Machine balance charts, 48Maintenance
assessment process for, 164–68consultants for, 163, 164gemba walks for, 162–63, 170, 171honesty, 163leader standard work, 159lean implementation, 157–72overview of, 171–72questions for, 168–71scheduling machine, 59–60visual controls, 61, 114, 159, 162
Management. See Lean management;Project management
Managing operators, 50–51Mass production. See also Batch-and-
queue systemcultural attributes of, 13habits, 14–16lean culture v., 11, 12–13
Master-apprentice model, 35, 36, 162–63Meetings
attendance tracking by, 138characteristics of, 71daily accountability, 70–81, 108process of, 71supervisor led, 74–77support groups in, 78–80team leader led, 72–74tier structure of, 70–72, 108value stream manager led, 78–80
Mental changesenforcing, 14honesty and, 163lean thinking, 109, 121–23physical v., 4–5, 8, 14willingness to make, 104–5
Monitoring tools, 42–61Motivation, 102, 104–5
New products, 160–61Non-cyclical tracking process, 59–61Note taking, 150–51
Observationsattendance and availability, 96breaks, 97gemba walk, 96–97leader standard work, 97lean culture, 170–71organization, 97process focus, 96process improvement, 96
Operators, managing, 50–51Organization, workplace, 97Ownership
improvements from, 112–13leadership attribute of, 103, 109–10
Pareto-charting, 22, 65, 110, 121, 161,185
Passion, 102, 104–5Payroll, 154PDAs, 34–35Perfection, 121–23Performance. See also Tracking
assessing, 55, 164–68between-process, 55consistency, 168dollar value display of, 72–73expected v. actual, 41–42improvement in, 41, 74–77, 84–86,
112–13low, response to, 151–52measuring outcomes of, 11monitoring tools, 42–61non-cyclical, 59–61rule of three for, 162vacation paradox for, 84–86
Personnel. See EmployeesPhysical changes
mental v., 4–5, 8, 14questions to ask during, 168–71
Pitch tracking charts, 46–48Plant managers, 28–29Priority boards, 49–52, 53
209
INDEX
Problem solving. See also Improvementsbatch-and-queue, 119–20case studies, 94, 122–23, 127–29,
160–61heroics v., 160–61lean thinking for, 109, 121–23low performance, 151–52new products, 160–61perfection goal of, 121–23process, structured, 124–29project management for, 127–29response system for, 130–34root cause orientation to, 119–23,
134–35tracking charts for, 127–29training, 94, 124
Process focusdesigning, 9–10disciplinary leadership for, 102,
105–7habits, 15improvement, 13, 96layers of, 106leader standard work based on, 25–26of lean management, 5–7measuring, 11monitoring, 10–11observing, 96problem solving, 124–29visuals for, 20, 39–68
Production. See Lean production; Massproduction
Production tracking charts, 43–46Project management
A-3 form for, 127–29assignments from, 102, 107–8day-to-day, 75, 77job-by-job, 48–49leadership skills for, 102, 107–8problem solving, 127–29
Qualification matrix, 140–42Questions, asking, 168–71
"Re-" processescycles of, 48, 50tracking, 56–58
Real time response, 9, 11Resistance
backsliding as, 158employee improvement, 150–51
Response systemscase study of, 130–34, 160–61heroics v., 160–61leader standard work, 159low performance and, 151–52problem solving using, 130–34real time, 9, 11
Rotation, 140–42, 154
Scheduling. See also Trackingassessments, 166, 171expediting, 9interruptions, 9, 11, 14late load logs for, 54maintenance, 59–60MRP v. pull signals, 12–13PDAs for, 34–35priority boards for, 49–52, 53reducing, 6
Senseis. See also Gemba walksbacksliding consultation with, 163,
164master-apprentice model and, 35, 36,
162–63purpose of, 91–93questions asked by, 96–97, 169–70Toyota trained, 92, 169
Suggestionsemployee-generated, 143–49neglecting, 144–45process for, 147, 149visual controls tracking, 146–49
Supermarkets, 48Supervisors
leader standard work of, 28–29,30–31, 34
meetings with team leaders led by,74–77
meetings with value stream leadersand, 78–80
mistakes of, 30–31, 160–61responsibilities of, 34visual control studies of, 45
210
CREATING A LEAN CULTURE

Support groupsbenefits of, 80–81leader relations with, 115–16meetings with, 78–80pacing, 134
Sustaining. See Maintenance
Tasks. See AssignmentsTeam leaders
discipline established by, 20improvement notes by, 150–51leader standard work of, 28–29,
33–34meetings with crew led by, 72–74meetings with supervisors for, 74–77mental changes of, 14number of, 11objective of, 10responsibilities of, 33–34
Thinking lean, 109, 121–23Toyota
attendance tracking by, 138passion and motivation of, 104problem solving tracking by, 127–29senseis trained by, 92, 169
Trackingassignments, 74–77, 81–84attendance, 137–39between-process, 55daily accountability task board for,
74–77, 81–84day-to-day, 75, 77developing processes for, 159, 1625S tasks, 60, 61heijunka status, 52, 54–55hourly, 49–52, 53job-by-job, 48–49machine balance charts for, 48maintenance, 59–60non-cyclical process, 59–61Pareto-charting for, 22, 65, 110, 121,
161, 185pitch, 46–48
priority board color coded, 49–52, 53problem solving, 127–29production, 27, 43–46qualifications, 140–42refinish reorder, 56–58suggestions, 146–49
Traininggemba walks as, 93–98leader standard work, 36lean management, 91–99learning models for, 35problem solving, 94, 124records, 140–41sensei purpose for, 91–93
Toyota, 92, 169
Vacation paradox, 84–86, 144–45Value stream managers
leader standard work of, 28–29, 34meetings led by, 78–80responsibilities of, 34visual control studies of, 44–45
Visual controls. See also Trackingaccuracy and precision of, 63, 64benefits of, intangible, 67–68case study of, 41, 42, 44–45, 50–51,
56–58computer systems v., 56–58, 62–68data missing from, 159, 162defining, 20discipline enforced by, 46–48flexibility of, 63, 65illustrations of, 40improvement, 41, 74–77, 146–49intimidation factor of, 63, 65–66maintaining, 61, 114, 159, 162monitoring tools for, 42–61proximity of, 63, 64–65suggestion process using, 146–49timeliness of, 62–64value stream managers and, 44–45
Waterspider line-supply, 170
211
INDEX

About the Author
David Mann has worked with more than 30 lean manufacturing conver-sions at Steelcase, and recognized the need for a day-to-day managementapproach that would sustain lean conversions.
In addition to his continuing work in Steelcase manufacturing operations,Mann leads an internal team applying lean principles to enterprise-widebusiness processes at the company. He is a regional board member of theAssociation for Manufacturing Excellence (AME) and serves on the edito-rial board of AME's Target magazine. Mann's other professional serviceincludes membership on the board of examiners for the Shingo Prize forExcellence in Manufacturing, the industry advisory board for the LeanEducation Academic Network, and the Lean Advisory Board for St.Mary's Hospital in Grand Rapids, Michigan. He is an adjunct facultymember in operations management at Ohio State University's FisherCollege of Business, and is a frequent speaker on lean management.
Mann has been with Steelcase since 1987. He is an organizational psy-chologist, earning his Ph.D. at the University of Michigan in 1976. Helives in Grand Rapids, Michigan with his wife, who is a criminal prosecu-tor. They have two daughters in college.
13_Index.qxd 4/10/06 1:26 PM Page 213