Creating a Culture of Health
87
Creating a Culture of Health Steven Aldana, Ph.D. CEO WellSteps
-
Upload
trevor-curtis -
Category
Documents
-
view
12 -
download
0
description
Creating a Culture of Health. Steven Aldana, Ph.D. CEO WellSteps. How Did This Happen?. Two Sides of the River Battle. Follow the Money. Capitalism Employment Politicians Tradition Greed. 50 Year Diabetes Prevalence in the U.S. - PowerPoint PPT Presentation
Transcript of Creating a Culture of Health

Creating a Culture of Health
Steven Aldana, Ph.D.CEO WellSteps


How Did This Happen?


Two Sides of the River Battle
• Capitalism• Employment• Politicians• Tradition• Greed
Follow the Money


50 Year Diabetes Prevalence in the U.S.
http://www.cdc.gov/nchs/data/nhis/earlyrelease/earlyrelease201206_14.pdf


USA
England
Canada
Austria
France
Korea
Percent Overweight
Milwaukee Health Report 2011 , WHO

USA
England
Canada
Austria
France
Korea
Milwaukee Health Report 2011 , WHO
Percent Overweight

How Did This Happen?

Two Sides of the River Battle
• Capitalism• Jobs• Politicians• Tradition• Greed
Follow the Money

Side Effect of Capitalism

Marketing Deception


IngredientsNonfat Yogurt (Cultured Pasteurized Nonfat Milk, Live and Active Cultures: S. Thermophilus, L. Bulgaricus, L. Acidophilus, Bifidus and L. Casei), Evaporated Cane Juice, Pomegranate Seeds, Pomegranate Juice Concentrate, Pectin, Natural Flavor, Locust Bean Gum, Fruit and Vegetable Juice Concentrate (For Color).


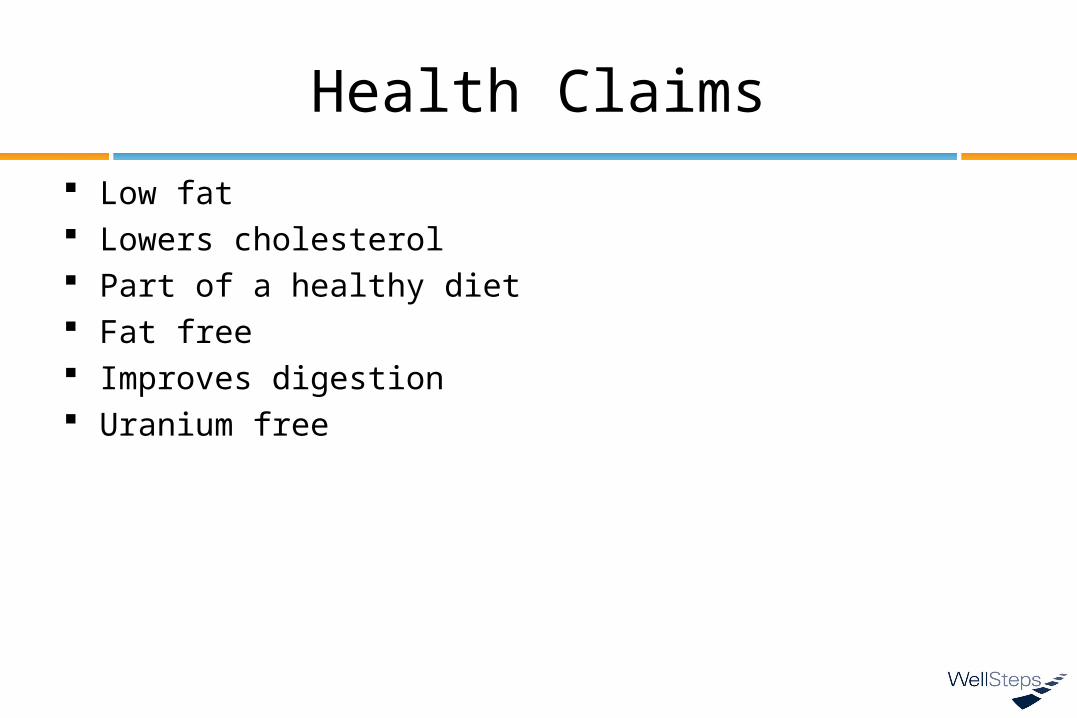
Health Claims Low fat Lowers cholesterol Part of a healthy diet Fat free Improves digestion Uranium free

Endorsements


Karachi, Pakistan

The Problem is: Food manufacturers: Salt, Sugar, Fat US Government Pharmaceutical companies Current health (disease) care system Technology, labor saving devices Greed


The Cavalry is NOT coming.

What is the Solution?
• Communities• Health Care Providers• Governments• Schools• Individuals• Businesses• Worksites

What is the Solution?
• Communities• Health Care Providers• Governments• Schools• Individuals• Businesses• Worksites

Employee-related
expenses
Unhealthybehaviors
Healthrisks
Chronicdisease

XAwareness
Motivation
Skills
Policy
=Effective WellnessPrograms
Reach Impact


Skills and Tools
Policy and Environment
Behavior Change Process
Motivation
Awareness and Education
Impact

Impact

Skills and Tools
Policy and Environment
Behavior Change Process
Motivation
Awareness and Education
Impact
5%
30%
25%
40%

Can Employees Improve Health Behaviors?
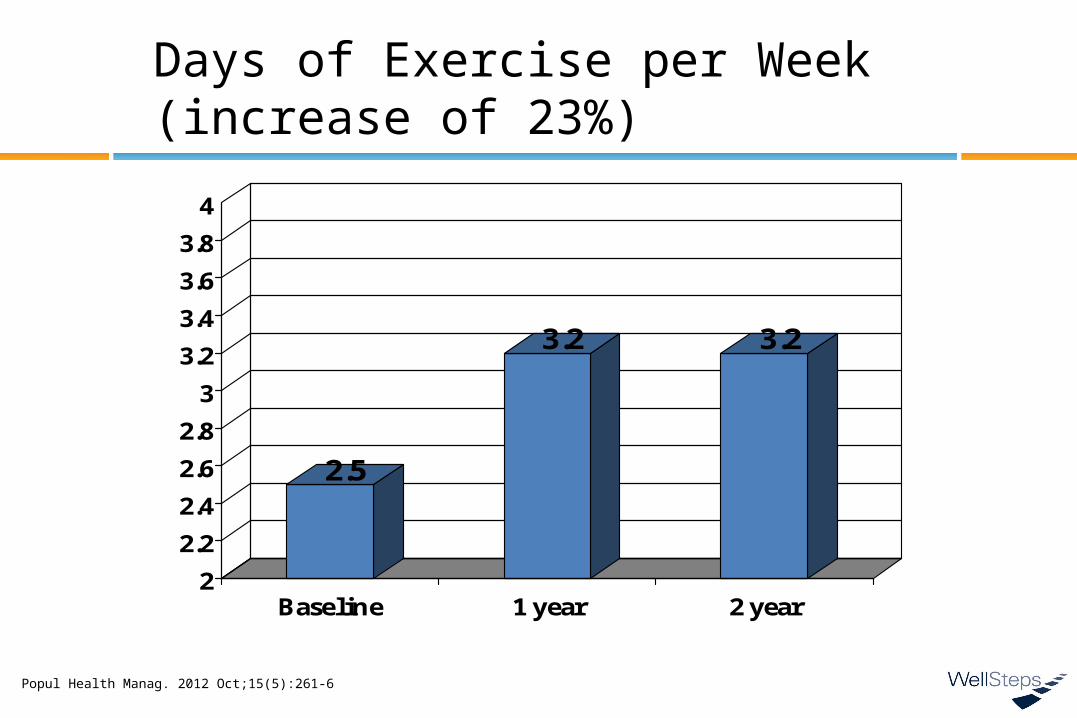
2.5
3.2 3.2
2
2.2
2.4
2.6
2.8
3
3.2
3.4
3.6
3.8
4
Baseline 1 year 2 year
Days of Exercise per Week (increase of 23%)
Popul Health Manag. 2012 Oct;15(5):261-6
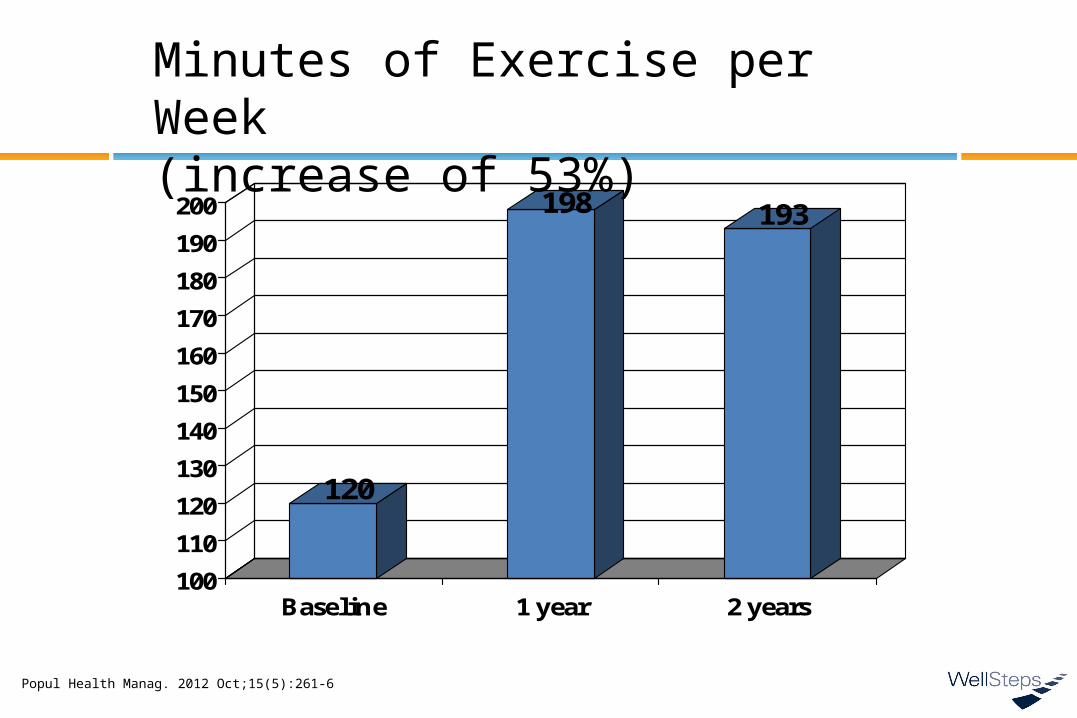
120
198 193
100
110
120
130
140
150
160
170
180
190
200
Baseline 1 year 2 years
Minutes of Exercise per Week (increase of 53%)
Popul Health Manag. 2012 Oct;15(5):261-6

1.62
22.1
1.5
1.6
1.7
1.8
1.9
2
2.1
2.2
2.3
2.4
2.5
Baseline 1 year 2 year
Fruit Servings per Day(increase of 15%)
Popul Health Manag. 2012 Oct;15(5):261-6

2.05
2.4
2.5
2.0
2.1
2.1
2.2
2.2
2.3
2.3
2.4
2.4
2.5
2.5
Baseline 1 year 2 year
Vegetable Servings per Day(increase of 9%)
Popul Health Manag. 2012 Oct;15(5):261-6

Can Employees Improve Health Risks?

BMI
Merrill, et al, 2014 (JOEM)

Systolic BP
Merrill, et al, 2014 (JOEM)

Diastolic BP
Merrill, et al, 2014 (JOEM)

Cholesterol
Merrill, et al, 2014 (JOEM)

Glucose
Merrill, et al, 2014 (JOEM)

Can Employee Health Programs Prevent and Reverse Chronic Disease?

BD Medical
Diabetic
Pre- diabetic
Normal
Baseline 6 months 12 monthsAAOHN, 2006

BD Medical
Diabetic
Pre- diabetic
Normal
Baseline 6 months 12 monthsAAOHN, 2006


Can Employee Wellness Programs Lower Healthcare Costs?

• Self funded• Wellness program started in 2004• Behavior Change campaigns• Incentive program
Prev Med, 2011

Salt Lake County Wellness Program
$200
$300
$400
$500
$600
$700
$800
2004 2005 2006 2007 2008 2009 2010 2011 2012 2013
Participants Non Participants
Ave
rage
Cos
t P
er C
laim
Prev Med, 2011

Salt Lake County Wellness Program
$200
$300
$400
$500
$600
$700
$800
2004 2005 2006 2007 2008 2009 2010 2011 2012 2013
Participants Non Participants
Ave
rag
e C
ost
Per
Cla
im
Prev Med, 2011

Program Cost Program Savings ROI
$1,456,788($919,542 for incentives)
$4,841,898 $3,385,110
Cost Benefit Ratio of 3.32
Prev Med, 2011

XAwareness
Motivation
Skills
Policy
=Effective WellnessPrograms
Reach Impact

Employee-related
expenses
Unhealthybehaviors
Healthrisks
Chronicdisease

Summary
• Our poor health is caused by our unhealthy culture• Few organizations are motivated to change this
culture• Worksites are succeeding at improving population
health• Wellness efforts with both Reach and Impact
improve health and save money

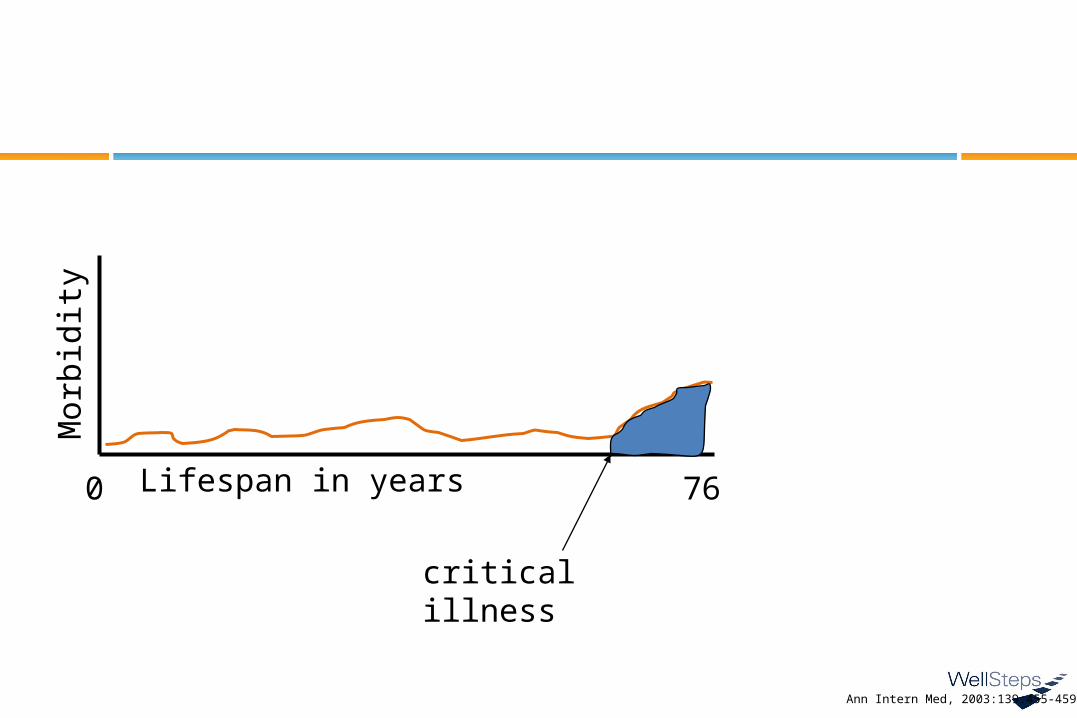
Lifespan in years
Mor
bidi
ty
760
critical illness
Ann Intern Med, 2003:139:455-459

Lifespan in years
Mor
bidi
ty
0 ?76 86
critical illness

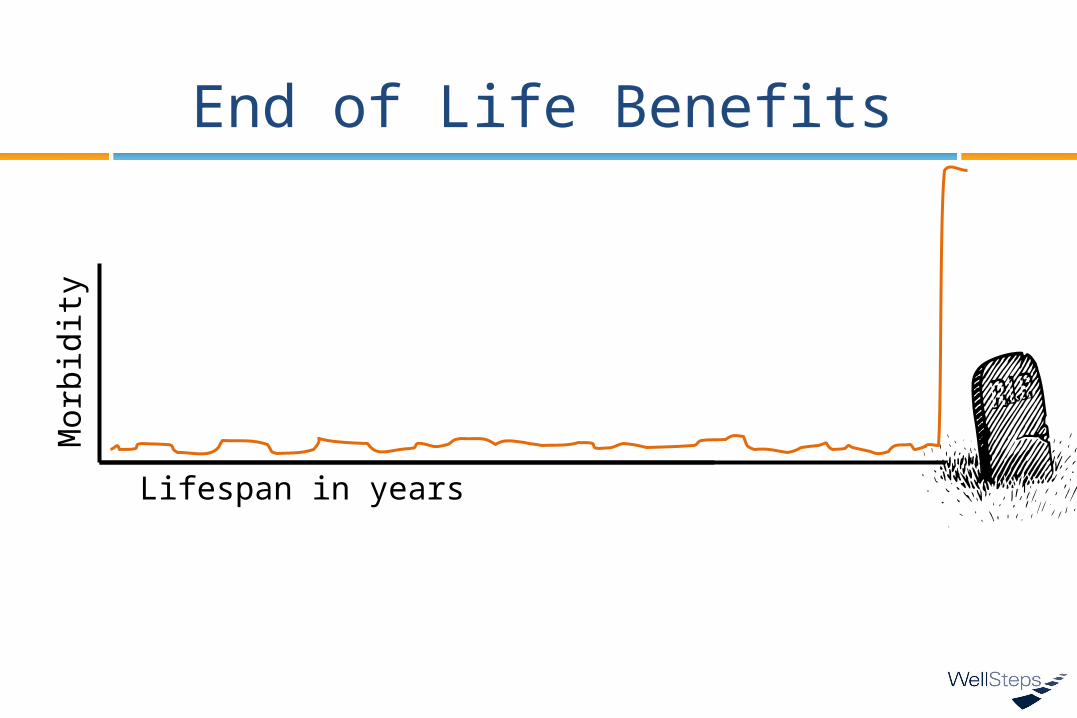
End of Life Benefits
Lifespan in years
Mor
bidi
ty
Lifespan in years
Mor
bidi
ty
10-20 Years

End of Life Benefits
Lifespan in years
Mor
bidi
ty

End of Life Benefits
Lifespan in years
Mor
bidi
ty

End of Life Benefits
Lifespan in years
Mor
bidi
ty
End of Life Benefits
Lifespan in years
Mor
bidi
ty