Creating a Computer Cop - University of...
16
Creating a Computer Cop An Integrated Approach to Recognizing Human Eating Activity Peter Barnum, Dominic Marino, Evan Merz, Matt Pelmear, and Dasun Peramunage Under Randall Nelson University of Rochester May 2003 Abstract Food damage causes untold dollars of damage to computer labs across the world. Most labs have rules that prohibit eating, but theses rules are difficult to enforce. A simple automated system that is capable of detecting violators has the ability to both cut down on violations and to catch violators. In this project, we aim to intelligently identify when people are eating in the University of Rochester computer lab. We created a system that combines object recognition, gesture detection, and sound recognition that signals an alarm whenever someone is found eating food in the lab. Keywords: Computer Assisted Surveillance, Color Histograms, Gesture Recognition, Fast Fourier Transforms 1. Introduction To detect suspicious behavior, a multi-prong approach is ideal. Different methods are better at detecting different instances of eating. Everything in the Vision Lab was available, which includes several pan-tilt-zoom cameras mounted on the ceiling and several high- quality microphones, allowing us to approach the problem from multiple angles. We used these tools to create a system that integrates object, gesture, and sound recognition, all hooked into a central detection server. Certain common objects, such as cracker boxes, can be detected easily by their color histograms, but the object recognizer has difficulty with objects that have not been entered into its database, such as a sandwich. The sandwich can be detected by watching hand motions. The repeated raising of the hand to the mouth signals eating or drinking. The gesture recognition subsystem detects these unusual circumstances and performs equally well for objects that are unknown to the object recognition database. However, more problems arise when the culprit has an unusual food or drink object and consumes it in an unusual way. If both the object detector and the gesture recognizer fail, a sound recognition subsystem can come in and catch sounds such as the hiss during the opening of a soda can. Combined together, these three methods create a superior recognition system. 2. Object Detection 2.1 Overview Many common food and drink objects are detectable by looking at their distinct color histograms. The amount of each color that a scene contains can be matched to a database that contains several distinct items. If a food object is found, then the system immediately knows that there is a violator in the lab. 1
Transcript of Creating a Computer Cop - University of...

Creating a Computer Cop An Integrated Approach to Recognizing Human Eating Activity
Peter Barnum, Dominic Marino, Evan Merz, Matt Pelmear, and Dasun Peramunage
Under Randall Nelson University of Rochester
May 2003 Abstract Food damage causes untold dollars of damage to computer labs across the world. Most labs have rules that prohibit eating, but theses rules are difficult to enforce. A simple automated system that is capable of detecting violators has the ability to both cut down on violations and to catch violators. In this project, we aim to intelligently identify when people are eating in the University of Rochester computer lab. We created a system that combines object recognition, gesture detection, and sound recognition that signals an alarm whenever someone is found eating food in the lab. Keywords: Computer Assisted Surveillance, Color Histograms, Gesture Recognition, Fast Fourier Transforms 1. Introduction
To detect suspicious behavior, a multi-prong approach is ideal. Different methods are better at detecting different instances of eating. Everything in the Vision Lab was available, which includes several pan-tilt-zoom cameras mounted on the ceiling and several high-quality microphones, allowing us to approach the problem from multiple angles. We used these tools to create a system that integrates object, gesture, and sound recognition, all hooked into a central detection server.
Certain common objects, such as cracker boxes, can be detected easily by their color histograms, but the object recognizer has difficulty with objects that have not been entered into its database, such as a sandwich. The sandwich can be detected by watching hand motions. The repeated raising of the hand to the mouth signals eating or drinking. The gesture recognition subsystem detects these unusual circumstances and performs equally well for objects that are unknown to the object recognition database. However, more problems arise when the culprit has an unusual food or drink object and consumes it in an unusual way. If both the object detector and the gesture recognizer fail, a sound recognition subsystem can come in and catch sounds such as the hiss during the opening of a soda can. Combined together, these three methods create a superior recognition system. 2. Object Detection 2.1 Overview Many common food and drink objects are detectable by looking at their distinct color histograms. The amount of each color that a scene contains can be matched to a database that contains several distinct items. If a food object is found, then the system immediately knows that there is a violator in the lab.
1

2.2 Previous Work The notion of using computer
vision to emulate a human’s ability to identify objects is not new. The current field of object detection has two major concerns, the robust detection of items in a scene and the retrieval of image data from a database. The literature shows many novel solutions to these problems.
Selinger and Nelson proposed a system of object recognition that they termed “A cubist approach” [2]. Their identification scheme involves removing certain features from a model, matching these features in an image, and then based on the collection of matches, judging if the model object is in the scene. Another approach by Vola and Jones involves training a system, which uses something similar to Haar Basis functions and a cascading effect that determines the ROI of an image [3]. They claim that their system, once properly trained, is both quick and accurate.
When a large number of images need to be recognized, it is important to have a means to retrieve the data quickly and accurately. The ultimate goal of this data-retrieval research is to access image data based on the image information rather than describe each entry with text. Ma and Manjunath developed a framework, termed NeTra, to retrieve data accurately from a database using color, texture, shape, and spatial information [4].
The approach to object recognition used by this project is primarily influenced by the work of Swain and Ballard [1]. The recognition system they implemented involves the use of color histograms and the histogram intersection algorithm to identify objects in a scene. They also developed an image retrieval system that
employs partial histogram intersection to recognize when an object logged in a database appears in a scene. 2.3 Algorithm
The object recognition algorithm works under the assumption that each object has a unique color scheme. In a situation such as food detection, the objects, in this case foods, have consistent coloration with other objects of the same type. For example, all Coca-Cola cans are the same shade of red and have the same writing and graphics on them. A method exists that extracts this color information from an image of an object, and so it is possible to use this color data to detect the object in most any environment.
There exists a method of representing color information in a model called a color histogram. The purpose of a color histogram is to maintain a count of all the occurrences of each unique color that appears in the image, with each distinctive color being given its own bin. At every pixel in the image, the color of the pixel is matched with its corresponding bin in the histogram, and the value in the color bin is incremented by one. The example in Figure 1 is the color histogram of a Coke can image.
Figure 1: Color Histogram of the coke can image in Figure 2.
2

Figure 2: 216 color Coke can image
The color histogram is internally
represented as a three dimensional matrix, where each axis represents red, green, or blue. A multi-dimensional array is used to represent the histogram because of the difficulties of representing RGB colors in a single dimension array.
Further inquiry into the properties of histograms must be made before they are deemed fit as a means of uniquely describing an object. To be considered worthwhile for use with an object recognition system, a histogram must remain invariant under certain conditions. As described in Swain’s thesis, a histogram is invariant to translation and rotation on a perpendicular axis to the image plane; it is also highly resistant to changes in the viewing angel of the object, occlusions, and changes in size. In the end, it is safe to assume that a color histogram adequately represents a unique problem. However, since objects are three-dimensional it is necessary that a histogram be produced for each different view of the object. For example, a proper representation of a Coke can involves taking a picture of its front and back, because both sides are drastically different from each other.
A database of histograms is prepared for each object model. The database is implemented exactly as Swain suggests in his thesis. There is a pre-detection phase where the database is initialized. Each bin in each model’s database is given a key, which represents the percentage of that color in the image. The bins are then sorted in descending order by key, at which point detection can begin. A histogram of the scene being viewed is created. The bins in the histogram are sorted in ascending order by percentage of each color in the image. Then a particular number of large bins are compared with the database. Only the models with a key that is larger than the image’s key are accepted. If another model’s bin is found, then the model is matched with all previous large image bins.
The previous recognition process uses an algorithm called partial histogram intersection, which is a faster form of the histogram intersection algorithm. The equation for partial histogram intersection is:
∑ ∑= =÷
n
j
n
jjjj MMI
1 1),min(
where I and M are histograms of both the image and model respectively, and both have n buckets. The result of utilizing this algorithm is a value between zero and one, which indicates the degree of similarity between the image histogram and the models histogram.
3
2.4 Results Various tests were performed on
the object detector to test how well it functioned. The first battery of tests checked to see if the special properties of histograms were true. The detector adheres to the properties of histograms discussed earlier (Table 1). All the properties of histograms were tested. All together, the object detector succeeded 88% of the time.
Further testing checked to see if variation in lighting and the scale of the image had a negative impact on recognition capabilities. Our results indicate that large changes in lighting have a dramatic affect on recognition. During testing, the recognition percentages hovered around 20% when the lights in the room were turned down. The object detector performed excellently when part of the object being detected was occluded. However, sometimes key color tags could not be detected and the detector chose the wrong object from the database.
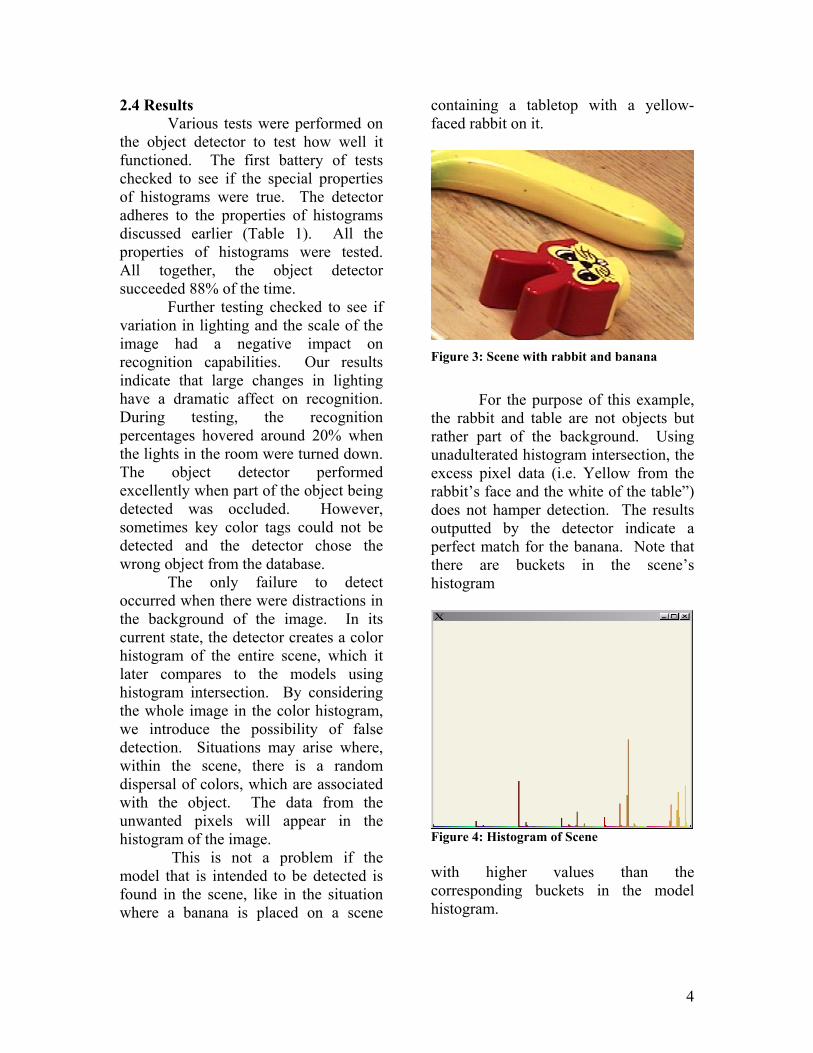
The only failure to detect occurred when there were distractions in the background of the image. In its current state, the detector creates a color histogram of the entire scene, which it later compares to the models using histogram intersection. By considering the whole image in the color histogram, we introduce the possibility of false detection. Situations may arise where, within the scene, there is a random dispersal of colors, which are associated with the object. The data from the unwanted pixels will appear in the histogram of the image.
This is not a problem if the model that is intended to be detected is found in the scene, like in the situation where a banana is placed on a scene
containing a tabletop with a yellow-faced rabbit on it.
Figure 3: Scene with rabbit and banana
For the purpose of this example,
the rabbit and table are not objects but rather part of the background. Using unadulterated histogram intersection, the excess pixel data (i.e. Yellow from the rabbit’s face and the white of the table”) does not hamper detection. The results outputted by the detector indicate a perfect match for the banana. Note that there are buckets in the scene’s histogram
Figure 4: Histogram of Scene with higher values than the corresponding buckets in the model histogram.
4
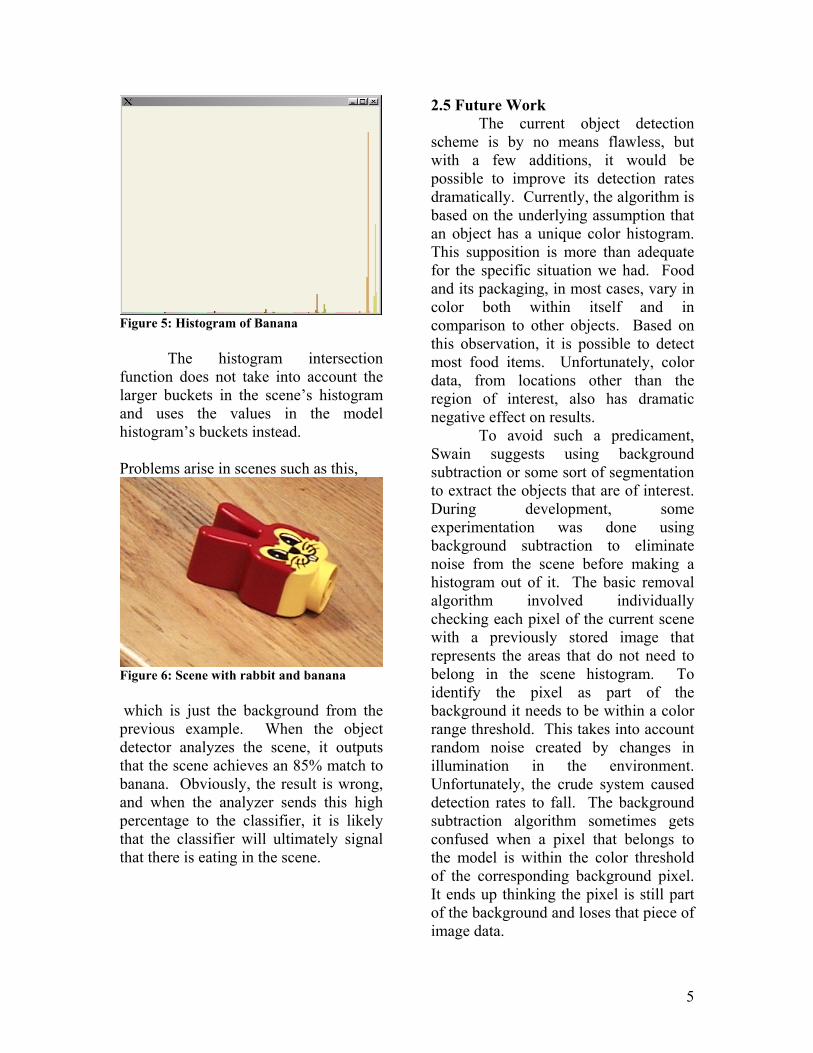
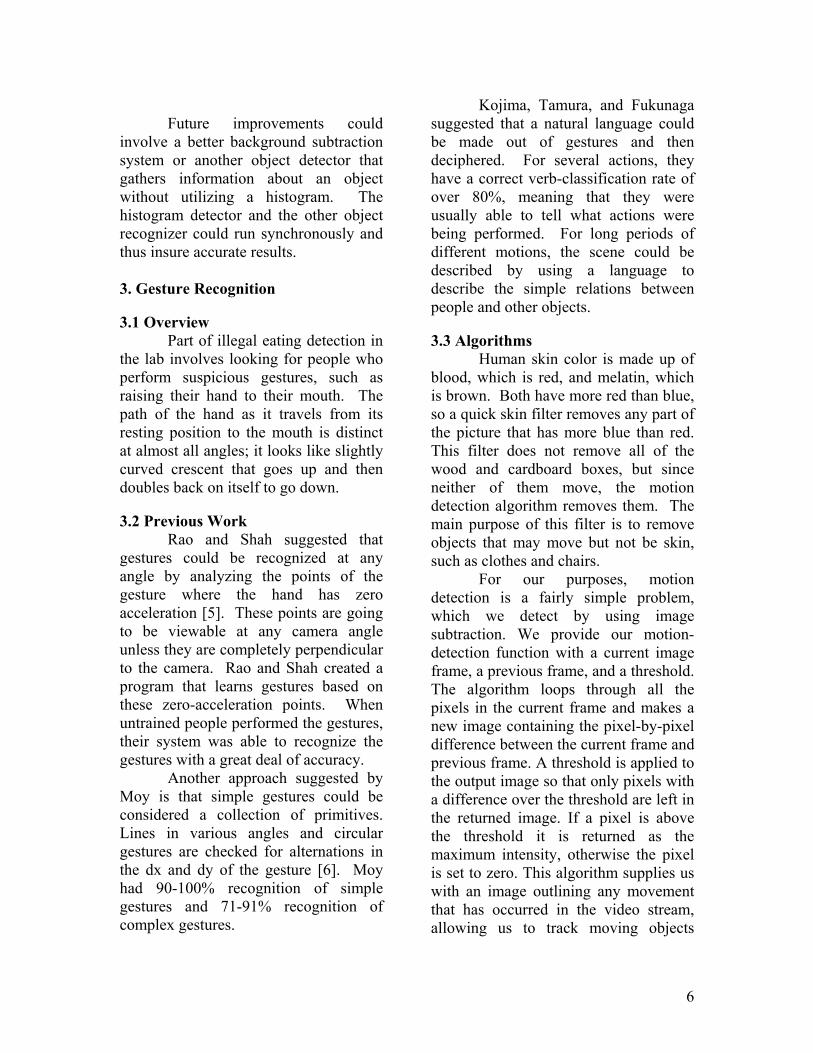
Figure 5: Histogram of Banana The histogram intersection function does not take into account the larger buckets in the scene’s histogram and uses the values in the model histogram’s buckets instead. Problems arise in scenes such as this,
Figure 6: Scene with rabbit and banana which is just the background from the previous example. When the object detector analyzes the scene, it outputs that the scene achieves an 85% match to banana. Obviously, the result is wrong, and when the analyzer sends this high percentage to the classifier, it is likely that the classifier will ultimately signal that there is eating in the scene.
2.5 Future Work The current object detection
scheme is by no means flawless, but with a few additions, it would be possible to improve its detection rates dramatically. Currently, the algorithm is based on the underlying assumption that an object has a unique color histogram. This supposition is more than adequate for the specific situation we had. Food and its packaging, in most cases, vary in color both within itself and in comparison to other objects. Based on this observation, it is possible to detect most food items. Unfortunately, color data, from locations other than the region of interest, also has dramatic negative effect on results. To avoid such a predicament, Swain suggests using background subtraction or some sort of segmentation to extract the objects that are of interest. During development, some experimentation was done using background subtraction to eliminate noise from the scene before making a histogram out of it. The basic removal algorithm involved individually checking each pixel of the current scene with a previously stored image that represents the areas that do not need to belong in the scene histogram. To identify the pixel as part of the background it needs to be within a color range threshold. This takes into account random noise created by changes in illumination in the environment. Unfortunately, the crude system caused detection rates to fall. The background subtraction algorithm sometimes gets confused when a pixel that belongs to the model is within the color threshold of the corresponding background pixel. It ends up thinking the pixel is still part of the background and loses that piece of image data.
5
Future improvements could
involve a better background subtraction system or another object detector that gathers information about an object without utilizing a histogram. The histogram detector and the other object recognizer could run synchronously and thus insure accurate results. 3. Gesture Recognition 3.1 Overview
Part of illegal eating detection in the lab involves looking for people who perform suspicious gestures, such as raising their hand to their mouth. The path of the hand as it travels from its resting position to the mouth is distinct at almost all angles; it looks like slightly curved crescent that goes up and then doubles back on itself to go down. 3.2 Previous Work Rao and Shah suggested that gestures could be recognized at any angle by analyzing the points of the gesture where the hand has zero acceleration [5]. These points are going to be viewable at any camera angle unless they are completely perpendicular to the camera. Rao and Shah created a program that learns gestures based on these zero-acceleration points. When untrained people performed the gestures, their system was able to recognize the gestures with a great deal of accuracy. Another approach suggested by Moy is that simple gestures could be considered a collection of primitives. Lines in various angles and circular gestures are checked for alternations in the dx and dy of the gesture [6]. Moy had 90-100% recognition of simple gestures and 71-91% recognition of complex gestures.
Kojima, Tamura, and Fukunaga suggested that a natural language could be made out of gestures and then deciphered. For several actions, they have a correct verb-classification rate of over 80%, meaning that they were usually able to tell what actions were being performed. For long periods of different motions, the scene could be described by using a language to describe the simple relations between people and other objects. 3.3 Algorithms Human skin color is made up of blood, which is red, and melatin, which is brown. Both have more red than blue, so a quick skin filter removes any part of the picture that has more blue than red. This filter does not remove all of the wood and cardboard boxes, but since neither of them move, the motion detection algorithm removes them. The main purpose of this filter is to remove objects that may move but not be skin, such as clothes and chairs. For our purposes, motion detection is a fairly simple problem, which we detect by using image subtraction. We provide our motion-detection function with a current image frame, a previous frame, and a threshold. The algorithm loops through all the pixels in the current frame and makes a new image containing the pixel-by-pixel difference between the current frame and previous frame. A threshold is applied to the output image so that only pixels with a difference over the threshold are left in the returned image. If a pixel is above the threshold it is returned as the maximum intensity, otherwise the pixel is set to zero. This algorithm supplies us with an image outlining any movement that has occurred in the video stream, allowing us to track moving objects
6

using our centroid-finding and tracking routines. Once areas of moving flesh have been found, it is necessary to decide which belong to distinct hands and faces. The motion image tends to look like a thick line drawn around where the hand or face was in the last frame and where it is in the current frame. Each pixel of the image is checked, and if it is close enough to other pixels, they are considered part of the same object. Unless the hands or face get very close to each other, then they are tagged as distinct objects. Theoretically, any number of hands and faces could be classified, but practically, the system is only able to distinguish about twenty different objects at 320x280 resolution, which is plenty for detecting distinct gestures for every person in the lab. After being segmented, the object blobs are passed to the centroid-finder. The centroid-finder searches through pixels in the image and records the summation of the x and y values of pixels with each color value (Red values 0-255 are used). The x and y sums are then divided by the total number of pixels of that color, yielding an average x and y coordinate for each moving object, which corresponds to the objects centroid The set of coordinates produced by the centroid-finder is stored in a queue, thereby allowing us to track locations through time, after some more analysis: Once the centroids have been detected, the program must decide where the new object came from. It checks to see which object was closest in the last frame, and adds the new position to that object's gesture path. If there are no objects that are close enough, the program will start a new path. Once any path gets beyond a certain set length, it
will start shortening itself automatically. If a gesture path has existed for a while without lengthening, the program assumes that the object has been lost and deletes the path. To detect eating gestures, the gesture is first smoothed out by averaging each point with the points three to its left and right. This removes a lot of the noise, and gestures look like smooth curves without sharp spikes and little loops. Once it has been smoothed, a whole group of statistics is calculated for each gesture, namely average dx, average dy, average heading, total dx, total dy, average x, average y, maximum x, maximum y, minimum x, minimum y, average deviation of dx, average deviation of dy, and average deviation from heading. Some of them are not currently used, but they are left in to add support for detecting more complex gestures in the future. Each path is then checked to see if it is a known gesture. The system recognizes lines drawn from the lower left to the upper right,
Figure 7: Finding a line lines drawn from left to right, circles drawn in either direction,
7

Figure 8: Finding a circle and the curve that corresponds to the eating motion.
Figure 9: Finding the eating motion It is very successful in detecting when a gesture is present, but there are a decent amount of false alarms. Gestures corresponding to eating and drinking all have distinctive elements. The exact values vary from camera to camera and are optimized for the specific angle of each camera. For example, in one of the camera angles, the program checks to see if the gesture is longer on the y-axis than the x-axis, if the average heading is between 1 and 4
radians, and if the average deviation of heading if between .5 and 1.5 radians. Sometimes a person may walk by close to a camera and cause a large amount of random paths to be created. To prevent excess detection during times of extremely high activity, the system will stop sending to the server if the scene becomes too active, and waits a few seconds for the scene to become quiet. This filtering prevents many false alarms. During the multiple repetitions that occur during normally eating, the system usually detects the gesture several times, as long as the hand is not too occluded. However, the system sometimes gets a false positive on some gestures that are not people eating. In order to prevent these false positives, we added a system that looks for repeated eating gestures in the same place. The system only sounds the alarm if it finds the eating gesture in a similar place several times over the course of a few minutes. This multiple-gesture detection scheme filters out random motions and many gestures that could be misclassified as eating. For the purposes of integrating the gesture subsystem with the other pieces, this repeated gesture system has been toned down so it will immediately send the results of detected eating gestures to the main server. 3.4 Results To test the system, we had four untrained subjects come in and try various gestures. Each of the subjects sat at several of the computer stations, with all stations checked at least twice. With each hand tested three times apiece, each subject made the motions of drinking a coke, eating a candy bar, and putting a pen behind their ear. In addition, each subject performed a related action of their choosing,
8

including smoothing hair, rubbing chin, and rubbing nose with either or both hands. There were three cameras set up to watch the five stations. Each camera’s successes and failures to detect eating were counted separately. The results of the experiment can be seen in (Table 2). The dark red bars represent actions that should not be detected as eating and the light green bars are eating gestures. Including all tests at all camera angles, 37% of the eating gestures were found and 14% of the non-eating gestures were misclassified as eating.
For the purposes of the system, these results are promising. Eating only has to be detected a few times for an alarm to be sounded, and the non-eating actions should be infrequent enough to not trigger an alarm. Multiple camera angles lead to an effective overall gesture recognition subsystem. Certain things were attempted for the gesture recognition subsystem that did not work well. These parts were implemented, but did not function in the lab environment. Problems with skin detection, blob segmentation, and centroid finding all cropped up. Motion segmenting based on blurring was experimented with, but did not appear to be useful and so were never fully implemented. Skin detection using HSV turned out to not work well in the lab. The cameras tend to grab light skin as well as the floor as white, and there is so much floor that the image is saturated with so called “flesh.” In addition, the wood tables tend to look like flesh, and since most of the gestures have the wood tables in the background, recognition is difficult. HSV could be made to work, but the mostly red filter combined with the motion filter works well enough.
Initially, the blob segmentation code took the first unused motion pixel and called itself recursively on that pixel, and kept going recursively until the whole blob was found. This was inefficient for samples with large amounts of motion, so we updated the system so that it first labels all of the pixels within a given distance iteratively before recursing. The new system can work at full speed even with a screen full of motion. While the centroid-finder is fairly efficient, it does have some problems. The most significant of these problems is its inability to correctly track objects when they cross past each other. For example, the centroid-tracker is confused when a person facing directly toward the camera starts with their arms outstretched, so they are standing in a 'T' shape, and then moves their hands so their arms cross. Such a problem is not trivial to resolve using our current algorithms, but with different methods of motion detection and tracking, this problem could be resolved and the gesture-tracking could handle more complex input. For a period of time, we experimented with a variation on our image subtraction routine that could have yielded results capable of solving this problem. Our alternate movement-detection routine would not only highlight areas of movement that were above the threshold, but would also 'blur' the edges of the movement so it could extrapolate each part of the object's velocity given only two frames. We ultimately abandoned this plan in favor of the simpler image-subtraction algorithm that was easier to implement, but believe it could be a useful alternative.
9

3.5 Future Work The gesture recognition system works, but there are many things that would be good improvements. The most helpful part would be to make a smarter recognition system. A system that was able to learn what actions are correct could be much more powerful and robust than the current system. It would be helpful to be able to use a more advanced system that would use every piece of data that the gesture is made of, instead of just working with averages. The current system is somewhat view-invariant and speed-invariant, but having it more invariant would allow more cameras to be used together without extra work. To detect flesh, it would be best to have a lookup table of all possible skin tones. This would catch a lot more flesh and remove a lot of noise. This flesh detection method would allow for more precise detection of the interesting objects in the scene. Instead of using pixel change to calculate motion, it would be better to use optical flow. Optical flow is a way to calculate each pixel’s velocity vector [8]. Instead of calculating centroids for each frame of motion, optical flow could allow the program to see where each centroid is moving. If there was confusion over the identity of a centroid, then it could be checked by how close its velocity matches the old version. This estimation process could be done with a Kalman filter, which estimates the future position of the object and finds the new object with the greatest velocity similarity [9]. It would be helpful to more accurately detect which part of the arm is the hand. Currently, if the subject is wearing short sleeves, the system tends to tag the wrist as the hand. The wrist is
fairly close to the hand, but the gesture is subtly different, and it would be better to have precise sampling of where the hand really is. If the arm was fitted to an oval, then the end of the oval that moves the fastest should be the hand, and this would produce a more precise gesture. A smarter smoothing system for the gestures could have better results. Anisotropic diffusion with a Gaussian kernel could allow for smart smoothing that would keep a lot of important information while smoothing out unimportant noise [5]. Rao and Shah successfully used this method to smooth their data for action recognition. 4. Audio Classification and Detection 4.1 Overview
Audio classification has been a problem for computer systems for a significant amount of time, several algorithms have emerged that work with upwards of ninety percent accuracy. Using combinations of features such as the zero crossing reference, the nearest feature line and various other Content Based audio retrieval systems, algorithms have been developed that accurately detect and archive sounds. For our purposes, we solely wish to match an input sound to certain sounds in a pre-created database. We use several methods to match the input sound to a database sound as will be described here. 4.2 Algorithms
A sound is entered in the database in the following manner. A sound is first recorded into a .WAV file to be stored temporarily in the computer. By performing certain operations on the sample, we can extract certain features that are noise robust. What this means is that these features will generally not be
10

affected by background noise. In vision, this terminology is used to describe a feature that is robust against unwanted background images. In audio, noise literally means noise. It is the goal of a noise robust feature to eliminate data that is not beneficial and just takes up space. The features we chose to extract were the zero crossing rate, the frequency domain and the short time energy. These are identical to the ones used by Srinivisan et al [10].
To do any sort of processing, we must divide the sample into smaller parts; we cannot just take an entire day worth of audio and classify it all. At first glance, choosing a large interval seems good, but in order to save space and actually increase accuracy, a small interval is needed. We are tentatively using an interval of 400 milliseconds. At this point, one must further divide the sample into N separate intervals. The variable n is used to denote the separate intervals in N. W(n) is the particular interval we have chosen, based on the current n. The variable m denotes the starting time index. The function x(n) is used to denote the discrete time.
The Zero Crossing Rate of an audio sample is a measure of how many times the amplitude of a sound sample passes through the zero line on a graph, for example, when it is a value of zero. The sound of speech has a high ZCR because of the way that humans speak. A noise such as that of a soda can opening does not have a very high zero crossing rate. The sounds we used in our database all have relatively low ZCR. This works to our advantage, as can be seen later. The ZCR of a sound is not a very good feature for complete classification, but it serves to describe the sound in a simple way. The way to
extract the ZCR at starting sample m is by use of this formula [11]:
)(|)]1([)]([|2/1 mnWnxsignnxsignZmm
−−−= ∑ The sign function returns 1 for all values of x(n) greater than or equal to zero and zero for all other values.
A Fast Fourier Transform is performed on the audio signal to give us the frequency domain of the sound. The transform leaves us with a histogram of frequencies that depend on the size of the signal. The histogram contains the frequencies, spaced by an amount dependent on the quality of the audio and the size of the intervals, and the corresponding average amplitudes for each frequency. This domain is used in finding the Spectral Energy of an audio sample.
Figure 10: Frequencies of music
11

Figure 11: Fourier Transform of same music
The short time energy of an audio sample is given by the following equation, using the same variables as described above.
[12] ∑ −=m
mnWnxEm 2)()((
This equation is used in later processing, as we will see. We recorded several sounds to be in our database. The sound of a bottle of carbonated beverage was our prime model, simply because it cannot be easily mistaken for anything else to the human ear. We assumed that if this sound appears distinct to human ears, then it must have some fairly unique features. Other sounds included the sound of a can opening, which has a distinctive early part as opposed to a bottle, and the sound of a bag of potato chips being handled. A database of these sounds was created and the features were extracted using the program that was written. These features became variables in the data structure created for the sound. The data structure consists of the ZCR, a histogram describing the frequency domain, and the Short Time Energy. Most algorithms of this type have been developed to classify speech vs. music [12]. Very few papers have dealt with the classification that we are dealing with. Therefore, a new algorithm had to be developed. The algorithm consists of a set of comparisons between the features. Certain measures extracted from the various features are compared to each other within certain thresholds to determine if a sound may be the sound we are looking for. The ZCR of a sound can be used by itself as a measure. If the
ZCR is relatively high, we can dismiss the sound as speech or noise. This filtering acts as a good short circuit that allows us to avoid running through a large database of data to extract more information. Should the sound not fall into this category, we next use the short time energy to determine if the sound is just background noise. If the Energy is below a certain level, then it can be dismissed as background noise, such as a keyboard or a mouse click. Finally, if the subsystem fails to distinguish the sound with these features, it has to do a comparison of the feature domain. This is a tedious process, which involves searching through a hash table containing the histogram. A regular hashing function is used to run through the different frequencies to compare each one. If a number of the frequencies are relatively close to each other, we can classify the sound as what we are looking for. Since the database of sounds is relatively small, this algorithm is feasible. Should it be expanded later, the algorithm will need to be changed, but it is fine for our purposes. 4.3 Results
This system was the last one we developed, and is in fact still under development. Due to lack of bookkeeping by our department, the sound card we needed was not found until last week. This has prevented us from developing along the entire course of the project. Unfortunately, time constraints, and work on the other subsystems of the project inhibited the finalization of this system. 4.4 Future Work
The field of audio detection and classification is rapidly expanding. In a
12

way, this subsystem could have been a project by itself. The implementation of a more efficient database would greatly improve speed and enable the user to input many more sounds. In addition, there are several other techniques for deriving noise robust features from sound, included in the literature referenced below. Applications range from security and surveillance to archiving and reference. Overall, this is an exciting field with much new research to be done. 5. Miscellaneous 5.1 Learning For detecting when people are eating, we tested two learning algorithms. The first algorithm is an attempt to learn histograms for object detection, and the second is a simple trainable neural net that decides when the act of eating in the lab is occurring. The histogram learning program provides a way for a user to help the agent build accurate models of objects, to be used in the object recognizer. The goal was to create a single histogram of an object that is view invariant and background invariant and which could locate the object in varied scenes and orientations. To accomplish this we wrote code that takes a frame from a camera and, with input from the user, locates the object in the scene. For each frame as long as the user is willing to train the agent, the agent averages the histogram of the object in the current frame with the average histogram of the object over the previous frames.
Figure 12: Learning a histogram This strategy for defining object histograms seemed logical at the start, but in tests against multiple single-view histograms, the learned histograms did not locate the object as well.
Figure 13: Recognition using learned histograms
Figure 14: Recognition using multiple single-view histograms
13

Although this result was bewildering at first, the explanation is quite intuitive. Although we did create a view-invariant histogram, the process weakened the distinct features of each view of the object. Storing many histograms of the different views will naturally perform better than averaging all these histograms into one, especially since we are using a histogram intersection, which is only partly view-invariant. The other way learning was used was in making the final decision as to when eating occurs. We wanted to assign individual weights to the probabilities being returned by the object detector, gesture recognizer, and sound recognizer, however we did not want these weights to be arbitrarily assigned. To solve this dilemma, we programmed a simple perceptron, which takes the several probabilities as input. To learn the weights of each probability, we used the perceptron learning algorithm as discussed in “Artificial Intelligence: A Modern Approach” [8]: function NEURAL-NETWORK-
LEARNING(examples) return network network <- a network with randomly assigned weights repeat for each e in examples do O <-NEURAL-NET-OUTPUT(network, e) T<-the observed output values from e Update the weights in network based on e,O,,T end until all examples correctly predicted return network In test runs, this algorithm performed fairly well, but the algorithm made the wrong decision in a few ambiguous cases. Assuming that the weights are reasonably accurate, the mistakes could occur because the space of positives is not linearly separable from the space of negatives. In other
words, though locating a coke can may indicate eating far more often than seeing a hand move up to a face does, there can be situations where the opposite is true. A perceptron cannot handle these ambiguities. In the future, a larger neural net or a Bayesian Net could be created to perform such a task. 5.2 Networking In the integration of the three respective pieces of our detection system into the final probability we use TCP/IP network communication as our method of data-transport. This allows each individual component of the analysis to be run on its own computer, eliminating the complexities of condensing all portions of the code into one process that accesses the video digitizer and another that accesses the audio digitizer. We have found the simplicity of this approach is a great advantage as our algorithms can be implemented from multiple camera views and can be located just about anywhere. All network connections are made from the individual components to one central 'server' when the system is booted. This machine runs a simple server that accepts the connections and then listens for a continuous stream of integers representing the probabilities produced by each algorithm. Upon receiving these probabilities, the server feeds them to our perceptron for analysis and final output. 5.3 GUI During the development process, it became necessary to have real-time control of constraints in our algorithms. As the command prompt was used for debugging printouts, we created a simple control window using slider bars that we could link to specific constraints at
14

compile-time. This allowed us to see immediate results from different data ranges and significantly improved our development time of the gesture-recognition algorithm. We most commonly used the controls to adjust detection threshold constraints, as these played a major role in tuning the algorithm to work from different camera angles. 6. Conclusion By using a varied system of detection schemes, we were successfully able to detect when people are eating in the lab. We integrated object detection, gesture recognition, and sound detection to form a cohesive whole. Although the problem is far from being truly solved, the solution presented here is usable in real situations. In theory, this solution could be easily adapted to a task involving recognizing other human activities, such as recognizing when people are studying in the library, recognizing when a worker on an assembly line is doing their job improperly, or even recognizing when people are playing baseball on the baseball field. The solution is relatively robust, and can lead the way for more experiments into human activity recognition.
References [1] Swain, Ballard. “Color Indexing”(thesis) , University of Rochester. [2] Selinger, Nelson. “A Cubist Approach to Object Recognition”, University of Rochester. [3] Vola, Jones. “Robust Real-time Object Detection”, Mitsubishi Electric Research Labs, Compaq CRL. [4] Ma, Wei-Ying and Manjunath, B.S. “NeTra: A toolbox for navigating large image databases”, Hewlett-Packard Laboratories, University of California, Santa Barbra. [5] Rao, Cen and Mubarak Shah, “View-Invariance in Action Recognition” University of Central Florida [6] Moy, Milyn C, “Gesture-Based Interaction with a Pet Robot” MIT Artificial Intelligence Lab / Oracle Corporation [7] Kojima, Atsuhiro, Takeshi Tamure, and Kunio Fukunaga, “Natural Language Description of Human Activities from Video Images Based on Concept Hierarchy of Actions” Osaka Prefecture University [8] Russell, Stuart and Peter Norvig, “AI, A Modern Approach”, Prentice Hall, 1995 [9] Simon, Dan “Kalman Filtering” Innovatia Software, 1998-2001 [10]Srinivasan, Savitha et al “Towads Robust Features for Classifying Audio in the CueVideo System” IEE database [11] Lu, Guojun & Hankinson, Templar “A Technique Towards Automatic Audio Classification and Retrieval” ICSP Proceedings, 1998; IEEE database [12]Zhang, Tong & Kuo, Jay C. C. “Heirarchal Classifcation of Audio Data For Archiving and Retrieving” IEEE database
15

Coke Oreo PaCoke 4 0 Oreo 0 3
Pay-Day 0 0 Snack wells 0 0
Sprite 0 0 Wheat Thins 0 0
Pretzels 0 0
Table 1: The detector was tested agai
Table 2: Empirical test results
Conflict Matrix y-Day Snack wells Sprite Wheat Thins Pretzels0 0 0 0 1 0 0 2 0 0 5 0 0 0 0 0 4 1 0 0 0 0 5 0 0 0 0 0 5 0 0 0 0 0 5
nst partial occlusion, rotation, size variance, and change in angle.
16