
CRÉDIT AGRICOLE S.A.
140
CRÉDIT AGRICOLE S.A. CONDENSED INTERIM CONSOLIDATED FINANCIAL STATEMENTS AS AT 30 JUNE 2020 Approved by the Crédit Agricole S.A. Board of Directors on 5 August 2020 UNAUDITED VERSION
Transcript of CRÉDIT AGRICOLE S.A.
CRÉDIT AGRICOLE S.A.
Consolidated Financial Statements of the Crédit Agricole S.A. Group.
30 June 2020
CONDENSED INTERIM CONSOLIDATED FINANCIAL
STATEMENTS
AS AT 30 JUNE 2020
Approved by the Crédit Agricole S.A. Board of Directors on 5 August 2020
UNAUDITED VERSION

Comptes consolidés du groupe Crédit Agricole S.A. – 30 June 2020
2
CONTENTS GENERAL FRAMEWORK ...................................................................................................... 4
LEGAL PRESENTATION OF THE ENTITY ...................................................................... 4
RELATED PARTIES ............................................................................................................ 5
CONSOLIDATED FINANCIAL STATEMENTS ................................................................... 6
INCOME STATEMENT ....................................................................................................... 6
NET INCOME AND OTHER COMPREHENSIVE INCOME ............................................ 7
BALANCE SHEET - ASSETS .............................................................................................. 8
BALANCE SHEET – LIABILITIES & EQUITY ................................................................. 9
Statement of changes in equity ............................................................................................. 10
CASH FLOW STATEMENT .............................................................................................. 11
NOTES TO THE CONDENSED INTERIM CONSOLIDATED FINANCIAL
STATEMENTS ........................................................................................................................ 14
NOTE 1 Group accounting policies and principles, assessments and estimates applied . 14
NOTE 2 Major structural transactions and material events during the period ................. 18
NOTE 3 Credit Risk .......................................................................................................... 26
3.1 Change in carrying amounts and value adjustments for losses during the period . 26
3.2 Concentrations of credit risk .................................................................................. 33
NOTE 4 Notes on net income and other comprehensive income ..................................... 48
4.1 Interest income and expenses ................................................................................. 48
4.2 Fees and commissions income and expense .......................................................... 49
4.3 Net gains (losses) on financial instruments at fair value through profit or loss .... 49
4.4 Net gains (losses) on financial instruments at fair value through other
comprehensive income ..................................................................................................... 51
4.5 Net gains (losses) from the derecognition of financial assets at amortised cost .... 51
4.6 Net income (expenses) on other activities ............................................................. 52
4.7 Operating expenses ................................................................................................ 52
4.8 Depreciation, amortisation and impairment of property, plant & equipment and
intangible assets ................................................................................................................ 52
4.9 Cost of risk ............................................................................................................. 53
4.10 Net gains (losses) on other assets ....................................................................... 53
4.11 Income tax charge .............................................................................................. 54
4.12 Changes in other comprehensive income ........................................................... 55
NOTE 5 Segment reporting .............................................................................................. 58
5.1 Operating segment information ............................................................................. 61
5.2 Insurance specificities ............................................................................................ 63
NOTE 6 Notes to the balance sheet .................................................................................. 67
6.1 Financial assets and liabilities at fair value through profit or loss ......................... 67
Comptes consolidés du groupe Crédit Agricole S.A. – 30 June 2020
3
6.2 Financial assets at fair value through other comprehensive income ...................... 70
6.3 Financial assets at amortised cost .......................................................................... 73
6.4 Exposure to sovereign risk ..................................................................................... 76
6.5 Financial liabilities at amortised cost ..................................................................... 79
6.6 Non-current assets held for sale and discontinued operations ............................... 80
6.7 Investment property ............................................................................................... 81
6.8 Property, plant & equipment and intangible assets (excluding goodwill) ............. 82
6.9 Goodwill ................................................................................................................ 83
6.10 Insurance company technical reserves ............................................................... 85
6.11 Provisions ........................................................................................................... 87
6.12 Subordinated debt ............................................................................................... 88
6.13 Total equity ........................................................................................................ 89
NOTE 7 Commitments given and received and other guarantees .................................... 93
NOTE 8 Reclassifications of financial instruments .......................................................... 96
NOTE 9 Fair value of financial instruments ..................................................................... 97
9.1 Fair value of financial assets and liabilities recognised at amortised cost ............. 98
9.2 Information about financial instruments measured at fair value ......................... 101
9.3 Estimated impact of inclusion of the margin at inception ................................... 111
NOTE 10 Scope of consolidation as at 30 June 2020 ................................................... 112
NOTE 11 Events subsequent to 30 June 2020 .............................................................. 140

Comptes consolidés du groupe Crédit Agricole S.A. – 30 June 2020
4
GENERAL FRAMEWORK
LEGAL PRESENTATION OF THE ENTITY
Since the Extraordinary General Meeting of Shareholders of 29 November 2001, the Company’s name has been:
Crédit Agricole S.A.
Since 1 July 2012, the address of the Company’s registered office has been: 12, place des États-Unis, 92127
Montrouge Cedex, France.
Registered in the Trade and Companies Register of Nanterre under number 784 608 416
NAF code: 6419Z.
Crédit Agricole S.A. is a French Public Limited Company (Société Anonyme) with a Board of Directors governed
by ordinary company law and more specifically by Book II of the French Commercial Code (Code de commerce).
Crédit Agricole S.A. is also subject to the provisions of the French Monetary and Financial Code and more
specifically Articles L. 512-47 et seq. thereof.
Crédit Agricole S.A. was licensed as an authorised credit institution in the mutual and cooperative banks category
on 17 November 1984. As such, it is subject to oversight by the banking supervisory authorities, and more
particularly by the French Regulatory and Resolution Supervisory Authority (ACPR) and the European Central
Bank.
Crédit Agricole S.A. shares are admitted for trading on Euronext Paris. Crédit Agricole S.A. is subject to the
prevailing stock market regulations particularly with respect to public disclosure obligations.
A bank with mutual roots
SAS Rue La Boétie, which is wholly owned by the Regional Banks, holds the majority of Crédit Agricole S.A.’s
share capital. Shares in SAS Rue La Boétie may not be transferred outside the Regional Banks’ network.
Furthermore, any trading in these shares between Regional Banks is governed by a liquidity agreement that in
particular sets out the procedures for determining the transaction price. This encompasses both disposals of shares
between the Regional Banks and share capital increases in SAS Rue La Boétie.
The Fédération Nationale du Crédit Agricole (FNCA) acts as a consultative and representative body, and as a
communication forum for the Regional Banks.
In accordance with the provisions of the French Monetary and Financial Code (Articles L. 511-31 and L. 511-32),
Crédit Agricole S.A. as the corporate centre of the Crédit Agricole network (as defined in Article R. 512-18 of the
French Monetary and Financial Code) is responsible for exercising administrative, technical and financial control
over the credit institutions affiliated to it in order to maintain a cohesive network and to ensure their proper
functioning and compliance with all regulations and legislation governing them. In that regard, Credit Agricole
S.A. may take all necessary measures notably to ensure the liquidity and solvency of the network as a whole and
of each of its affiliated institutions.

Comptes consolidés du groupe Crédit Agricole S.A. – 30 June 2020
5
RELATED PARTIES
The related parties of Crédit Agricole S.A. are the consolidated companies, including equity-accounted entities,
the Group’s Senior Executives and the Regional Banks, given the Group’s legal structure and due to the fact that
Crédit Agricole S.A. is the central body of the Crédit Agricole network.
In accordance with the internal financial mechanisms at Crédit Agricole, transactions between Crédit Agricole
S.A. and the Regional Banks1 are presented on the balance sheet and income statement as Crédit Agricole internal
transactions (Note 4.1 “Interest income and expenses”, Note 4.2 “Fee and commission income and expenses”,
Note 6.3 “Financial assets at amortised cost” and Note 6.5 “Financial liabilities at amortised cost”).
OTHER SHAREHOLDERS’ AGREEMENTS
Shareholder agreements signed during the year are detailed in Note 2 "Major structural transactions and material
events during the period".
RELATIONSHIPS BETWEEN CONTROLLED COMPANIES AFFECTING THE CONSOLIDATED BALANCE SHEET
A list of Crédit Agricole S.A. companies can be found in Note 10 “Scope of consolidation as at 30 June 2020”.
Since the transactions and outstandings at year-end between the Group’s fully consolidated companies are
eliminated on consolidation, only transactions with companies consolidated by the equity method affect the
Group’s consolidated financial statements.
The main corresponding outstandings and commitments in the consolidated balance sheet as at 30 June 2020 relate
to transactions with the equity-accounted entities for the following amounts:
loans and receivables due from credit institutions: €2,846 million;
loans and receivables due from customers: €2,890 million;
debt due to credit institutions: €1,212 million;
amounts due to customers: €276 million;
commitments given on financial instruments: €6,311 million;
commitments received on financial instruments: €5,923 million.
The transactions entered into with these entities did not have a material effect on the income statement for the
period.
1 With the exception of the Caisse régionale de la Corse, which is fully consolidated.

Comptes consolidés du groupe Crédit Agricole S.A. – 30 June 2020
6
CONSOLIDATED FINANCIAL STATEMENTS
INCOME STATEMENT
(in millions of euros) Notes 30/06/2020 31/12/2019 30/06/2019
Interest and similar income 4.1 12,340 25,107 12,993
Interest and similar expenses 4.1 (6,629) (13,663) (7,255)
Fee and commission income 4.2 5,247 10,556 5,348
Fee and commission expenses 4.2 (3,268) (6,500) (3,557)
Net gains (losses) on financial instruments at fair value through
profit or loss 4.3
(5,557) 17,082 10,487
Net gains (losses) on held for trading assets/liabilities 1,171 4,730 2,681
Net gains (losses) on other financial assets/liabilities at fair
value through profit or loss
(6,728) 12,352 7,806
Net gains (losses) on financial instruments at fair value through
other comprehensive income 4.4
337 162 113
Net gains (losses) on debt instruments at fair value through
other comprehensive income that may be reclassified
subsequently to profit or loss
287 47 42
Remuneration of equity instruments measured at fair value
through other comprehensive income that will not be
reclassified subsequently to profit or loss (dividends)
50 115 71
Net gains (losses) arising from the derecognition of financial
assets at amortised cost 4.5
3 (9) 2
Net gains (losses) arising from the reclassification of financial
assets at amortised cost to financial assets at fair value
through profit or loss
‐ ‐ ‐
Net gains (losses) arising from the reclassification of financial
assets at fair value through other comprehensive income to
financial assets at fair value through profit or loss
‐ ‐ ‐
Income on other activities 4.6 21,480 41,042 22,089
Expenses on other activities 4.6 (14,283) (53,180) (29,968)
Reclassification of net gains (losses) of designated financial
assets applying the overlay approach 5.2
427 (445) (248)
Revenues 10,097 20,152 10,004
Operating expenses 4.7 (6,140) (11,713) (5,980)
Depreciation, amortisation and impairment of property, plant
& equipment and intangible assets 4.8
(533) (1,048) (494)
Gross operating income 3,424 7,391 3,530
Cost of risk 4.9 (1,463) (1,256) (582)
Operating income 1,961 6,135 2,948
Share of net income of equity-accounted entities 179 352 193
Net gains (losses) on other assets 4.10 87 54 22
Change in value of goodwill 6.9 ‐ (589) ‐
Pre-tax income 2,227 5,952 3,163
Income tax charge 4.11 (347) (456) (880)
Net income from discontinued operations 6.6 (1) (38) 8
Net income 1,879 5,458 2,291
Non-controlling interests 287 614 306
NET INCOME GROUP SHARE 1,592 4,844 1,985
Earnings per share (in euros) ¹ (in euros) 6.13 0.473 1.482 0.609
Diluted earnings per share (in euros) ¹ (in euros) 6.13 0.473 1.482 0.609
¹ Corresponds to income including net income from discontinued operations.

Comptes consolidés du groupe Crédit Agricole S.A. – 30 June 2020
7
NET INCOME AND OTHER COMPREHENSIVE INCOME
(in millions of euros) Notes 30/06/2020 31/12/2019 30/06/2019
Net income 1,879 5,458 2,291
Actuarial gains and losses on post-employment benefits 4.12 40 (162) (124)
Other comprehensive income on financial liabilities attributable
to changes in own credit risk ¹ 4.12 91 (74) (51)
Other comprehensive income on equity instruments that will not
be reclassified to profit or loss ¹ 4.12 (129) 53 86
Pre-tax other comprehensive income on items that will not be
reclassified to profit or loss excluding equity-accounted entities 4.12 2 (183) (89)
Pre-tax other comprehensive income on items that will not be
reclassified to profit or loss on equity-accounted entities 4.12 7 (30) (2)
Income tax related to items that will not be reclassified to profit or
loss excluding equity-accounted entities 4.12 11 71 79
Income tax related to items that will not be reclassified to profit or
loss on equity-accounted entities 4.12 (4) 8 2
Other comprehensive income on items that will not be
reclassified to profit or loss from discontinued operations 4.12 ‐ 3 3
Other comprehensive income on items that will not be
reclassified subsequently to profit or loss net of income tax 4.12
16 (131) (7)
Gains and losses on translation adjustments 4.12 (118) 301 71
Other comprehensive income on debt instruments that may be
reclassified to profit or loss 4.12 (198) 1,189 1,482
Gains and losses on hedging derivative instruments 4.12 539 361 504
Reclassification of net gains (losses) of designated financial assets
applying the overlay approach 4.12 (427) 434 241
Pre-tax other comprehensive income on items that may be
reclassified to profit or loss excluding equity-accounted entities 4.12 (204) 2,285 2,298
Pre-tax other comprehensive income on items that may be
reclassified to profit or loss on equity-accounted entities, Group
Share 4.12 (120) 9 ‐
Income tax related to items that may be reclassified to profit or
loss excluding equity-accounted entities
4.12 (138) (481) (624)
Income tax related to items that may be reclassified to profit or
loss on equity-accounted entities 4.12 1 1 2
Other comprehensive income on items that may be reclassified
to profit or loss from discontinued operations 4.12 ‐ (12) (12)
Other comprehensive income on items that may be reclassified
subsequently to profit or loss net of income tax 4.12
(461) 1,802 1,665
OTHER COMPREHENSIVE INCOME NET OF INCOME TAX 4.12 (445) 1,671 1,658
NET INCOME AND OTHER COMPREHENSIVE INCOME 1,434 7,129 3,949
Of which Group share 1,205 6,464 3,626
Of which non-controlling interests 229 665 323
¹ Of which € 1 million of items transferred to Reserves of items that cannot be reclassified

Comptes consolidés du groupe Crédit Agricole S.A. – 30 June 2020
8
BALANCE SHEET - ASSETS
(in millions of euros) Notes 30/06/2020 31/12/2019 30/06/2019
Cash, central banks 156,484 93,079 64,337
Financial assets at fair value through profit or loss 6.1 430,941 399,477 398,256
Held for trading financial assets 267,004 230,721 246,898
Other financial instruments at fair value through profit or
loss 163,937 168,756 151,358
Hedging derivative Instruments 23,149 19,368 21,371
Financial assets at fair value through other comprehensive
income 3 - 6.2 261,760 261,321 263,293
Debt instruments at fair value through other
comprehensive income that may be reclassified to
profit or loss 259,304 258,803 260,115
Equity instruments at fair value through other
comprehensive income that will not be reclassified to
profit or loss 2,456 2,518 3,178
Financial assets at amortised cost 3 - 6.3 1,006,903 906,280 871,453
Loans and receivables due from credit institutions 499,783 438,581 420,022
Loans and receivables due from customers 413,355 395,180 384,828
Debt securities 93,765 72,519 66,603
Revaluation adjustment on interest rate hedged portfolios 8,091 7,145 8,546
Current and deferred tax assets 4,649 4,300 4,173
Accruals, prepayments and sundry assets 44,629 38,349 45,273
Non-current assets held for sale and discontinued operations 6.6 493 475 ‐
Deferred participation benefits ‐ ‐ ‐
Investments in equity-accounted entities 7,392 7,232 6,955
Investment property 6.7 6,600 6,576 6,514
Property, plant and equipment 6.8 5,399 5,598 5,436
Intangible assets 6.8 3,228 3,163 2,566
Goodwill 6.9 15,654 15,280 15,611
TOTAL ASSETS 1,975,372 1,767,643 1,713,784

Comptes consolidés du groupe Crédit Agricole S.A. – 30 June 2020
9
BALANCE SHEET – LIABILITIES & EQUITY
(in millions of euros) Notes 30/06/2020 31/12/2019 30/06/2019
Central banks 1,581 1,896 651
Financial liabilities at fair value through profit or loss 6.1 271,850 246,669 246,324
Held for trading financial liabilities 235,177 206,708 209,820
Financial liabilities designated at fair value through profit
or loss 36,673 39,961 36,504
Hedging derivative Instruments 15,558 13,293 15,344
Financial liabilities at amortised cost 6.5 1,164,792 989,962 938,756
Due to credit institutions 6.5 275,617 142,041 133,949
Due to customers 3 - 6.5 704,090 646,914 611,391
Debt securities 6.5 185,085 201,007 193,416
Revaluation adjustment on interest rate hedged portfolios 10,509 9,183 10,627
Current and deferred tax liabilities 3,855 3,766 3,115
Accruals, prepayments and sundry liabilities 55,644 49,285 53,881
Liabilities associated with non-current assets held for sale and
discontinued operations 488 478 ‐
Insurance company technical reserves 6.10 351,865 356,107 348,228
Provisions 6.11 4,260 4,364 5,927
Subordinated debt 6.12 23,038 21,797 23,136
Total Liabilities 1,903,440 1,696,800 1,645,989
Equity 6.13 71,932 70,843 67,795
Equity - Group share 63,894 62,920 61,216
Share capital and reserves 27,371 27,368 28,133
Consolidated reserves 32,475 27,865 28,234
Other comprehensive income 2,456 2,843 2,864
Other comprehensive income on discontinued operations ‐ ‐ ‐
Net income (loss) for the year 1,592 4,844 1,985
Non-controlling interests 8,038 7,923 6,579
TOTAL LIABILITIES AND EQUITY 1,975,372 1,767,643 1,713,784

Comptes consolidés du groupe Crédit Agricole S.A. - 30 June 2020
10
STATEMENT OF CHANGES IN EQUITY
Group share Non-controlling interests
Share and capital reserves Other comprehensive income Other comprehensive income
(in millions of euros) Share
capital
Share premium
and
consolidated
reserves
Eliminat
ion of
treasury
shares
Other equity
instruments
Total
capital
and
consolidat
ed reserves
Other
comprehensiv
e income on
items that may
be reclassified
to profit and
loss
Other
comprehensiv
e income on
items that will
not be
reclassified to
profit and loss
Total other
comprehensive
income
Net
income Total equity
Capital, associated
reserves and income
Other
comprehensive
income on items
that may be
reclassified to
profit and loss
Other comprehensive
income on items that
will not be reclassified
to profit and loss
Total other
comprehensive
income
Total equity
Total
consolidated
equity
Equity at 1 January 2019 published 8,599 44,129 (151) 5,011 57,588 2,328 (1,105) 1,223 ‐ 58,811 6,826 (114) (7) (121) 6,705 65,516
Impacts of new accounting standards ‐ ‐ ‐ ‐ ‐ ‐ ‐ ‐ ‐ ‐ ‐ ‐ ‐ ‐ ‐ ‐
Equity at 1 January 2019 Restated 8,599 44,129 (151) 5,011 57,588 2,328 (1,105) 1,223 ‐ 58,811 6,826 (114) (7) (121) 6,705 65,516
Capital increase ‐ ‐ ‐ ‐ ‐ ‐ ‐ ‐ ‐ ‐ ‐ ‐ ‐ ‐ ‐ ‐
Changes in treasury shares held ‐ ‐ 20 ‐ 20 ‐ ‐ ‐ ‐ 20 ‐ ‐ ‐ ‐ ‐ 20
Issuance / redemption of equity instruments ‐ (7) ‐ 1,083 1,076 ‐ ‐ ‐ ‐ 1,076 ‐ ‐ ‐ ‐ ‐ 1,076
Remuneration of undated deeply subordinated notes at 1st semester 2019 ‐ (233) ‐ ‐ (233) ‐ ‐ ‐ ‐ (233) (12) ‐ ‐ ‐ (12) (245)
Dividends paid in 1st semester 2019 ‐ (1,976) ‐ ‐ (1,976) ‐ ‐ ‐ (1,976) (378) ‐ ‐ ‐ (378) (2,354)
Impact of acquisitions/disposals on non-controlling interests ‐ ‐ ‐ ‐ ‐ ‐ ‐ ‐ ‐ ‐ ‐ ‐ ‐ ‐ ‐ ‐
Changes due to share-based payments ‐ 12 ‐ ‐ 12 ‐ ‐ ‐ ‐ 12 6 ‐ ‐ ‐ 6 18
Changes due to transactions with shareholders ‐ (2,204) 20 1,083 (1,101) ‐ ‐ ‐ ‐ (1,101) (384) ‐ ‐ ‐ (384) (1,485)
Changes in other comprehensive income ‐ 12 ‐ ‐ 12 1,637 3 1,640 ‐ 1,652 1 25 (9) 16 17 1,669
Of which other comprehensive income on equity instruments that will not be
reclassified to profit or loss reclassified to consolidated reserves ‐ 15 ‐ ‐ 15 ‐ (15) (15) ‐ ‐ 1 ‐ (1) (1) ‐ ‐
Of which other comprehensive income attributable to changes in own credit risk
reclassified to consolidated reserves ‐ (4) ‐ ‐ (4) ‐ 4 4 ‐ ‐ ‐ ‐ ‐ ‐ ‐ ‐
Share of changes in equity-accounted entities ‐ 4 ‐ ‐ 4 1 ‐ 1 ‐ 5 (1) 1 ‐ 1 ‐ 5
Net income for 1st semester 2019 ‐ ‐ ‐ ‐ ‐ ‐ ‐ ‐ 1,985 1,985 306 ‐ ‐ ‐ 306 2,291
Other changes ‐ (136) ‐ ‐ (136) ‐ ‐ ‐ ‐ (136) (65) ‐ ‐ ‐ (65) (201)
Equity at 30 june 2019 8,599 41,805 (131) 6,094 56,367 3,966 (1,102) 2,864 1,985 61,216 6,683 (88) (16) (104) 6,579 67,795
Capital increase 55 96 ‐ ‐ 151 ‐ ‐ ‐ ‐ 151 ‐ ‐ ‐ ‐ ‐ 151
Changes in treasury shares held ‐ ‐ 23 ‐ 23 ‐ ‐ ‐ ‐ 23 ‐ ‐ ‐ ‐ ‐ 23
Issuance / redemption of equity instruments ‐ (109) ‐ (960) (1,069) ‐ ‐ ‐ ‐ (1,069) ‐ ‐ ‐ ‐ ‐ (1,069)
Remuneration of undated deeply subordinated notes at 2nd semester 2019 ‐ (238) ‐ ‐ (238) ‐ ‐ ‐ ‐ (238) (15) ‐ ‐ ‐ (15) (253)
Dividends paid in 2nd semester 2019 ‐ ‐ ‐ ‐ ‐ ‐ ‐ ‐ ‐ ‐ 2 ‐ ‐ ‐ 2 2
Impact of acquisitions/disposals on non-controlling interests ‐ ‐ ‐ ‐ ‐ ‐ ‐ ‐ ‐ ‐ ‐ ‐ ‐ ‐ ‐ ‐
Changes due to share-based payments ‐ 14 ‐ ‐ 14 ‐ ‐ ‐ ‐ 14 6 ‐ ‐ ‐ 6 20
Changes due to transactions with shareholders 55 (237) 23 (960) (1,119) ‐ ‐ ‐ ‐ (1,119) (7) ‐ ‐ ‐ (7) (1,126)
Changes in other comprehensive income ‐ (42) ‐ ‐ (42) 89 (97) (8) ‐ (50) ‐ 42 (7) 35 35 (15)
Of which other comprehensive income on equity instruments that will not be
reclassified to profit or loss reclassified to consolidated reserves ‐ (37) ‐ ‐ (37) ‐ 37 37 ‐ ‐ ‐ ‐ ‐ ‐ ‐ ‐
Of which other comprehensive income attributable to changes in own credit risk
reclassified to consolidated reserves ‐ (4) ‐ ‐ (4) ‐ 4 4 ‐ ‐ ‐ ‐ ‐ ‐ ‐ ‐
Share of changes in equity-accounted entities ‐ 1 ‐ ‐ 1 8 (21) (13) ‐ (12) ‐ (1) ‐ (1) (1) (13)
Net income for 2nd semester 2019 ‐ ‐ ‐ ‐ ‐ ‐ ‐ ‐ 2,859 2,859 308 ‐ ‐ ‐ 308 3,167
Other changes ‐ 26 ‐ ‐ 26 ‐ ‐ ‐ ‐ 26 1,009 ‐ ‐ ‐ 1,009 1,035
Equity at 31 December 2019 8,654 41,553 (108) 5,134 55,233 4,063 (1,220) 2,843 4,844 62,920 7,993 (47) (23) (70) 7,923 70,843
Appropriation of 2019 net income ‐ 4,844 ‐ ‐ 4,844 ‐ ‐ ‐ (4,844) - ‐ ‐ ‐ ‐ ‐ ‐
Equity at 1 January 2020 8,654 46,397 (108) 5,134 60,077 4,063 (1,220) 2,843 - 62,920 7,993 (47) (23) (70) 7,923 70,843
Impacts of new accounting Standards ‐ ‐ ‐ ‐ ‐ ‐ ‐ ‐ ‐ ‐ ‐ ‐ ‐ ‐ ‐ ‐
Equity at 1 January 2020 restated 8,654 46,397 (108) 5,134 60,077 4,063 (1,220) 2,843 - 62,920 7,993 (47) (23) (70) 7,923 70,843
Capital increase ‐ ‐ ‐ ‐ ‐ ‐ ‐ ‐ ‐ ‐ ‐ ‐ ‐ ‐ ‐ ‐
Changes in treasury shares held ‐ ‐ (14) ‐ (14) ‐ ‐ ‐ ‐ (14) ‐ ‐ ‐ ‐ ‐ (14)
Issuance / redemption of equity instruments ‐ ‐ ‐ (4) (4) ‐ ‐ ‐ ‐ (4) ‐ ‐ ‐ ‐ ‐ (4)
Remuneration of undated deeply subordinated notes at 1st semester 2020 ‐ (229) ‐ ‐ (229) ‐ ‐ ‐ ‐ (229) (14) ‐ ‐ ‐ (14) (243)
Dividends paid in 1st semester 2020 ‐ ‐ ‐ ‐ ‐ ‐ ‐ ‐ ‐ ‐ (108) ‐ ‐ ‐ (108) (108)
Impact of acquisitions/disposals on non-controlling interests ‐ ‐ ‐ ‐ ‐ ‐ ‐ ‐ ‐ ‐ ‐ ‐ ‐ ‐ ‐ ‐
Changes due to share-based payments ‐ 6 ‐ ‐ 6 ‐ ‐ ‐ ‐ 6 3 ‐ ‐ ‐ 3 9
Changes due to transactions with shareholders ‐ (223) (14) (4) (241) ‐ ‐ ‐ ‐ (241) (119) ‐ ‐ ‐ (119) (360)
Changes in other comprehensive income ‐ (1) ‐ ‐ (1) (332) 31 (301) ‐ (302) ‐ (10) (18) (28) (28) (330)
Of which other comprehensive income on equity instruments that will not be
reclassified to profit or loss reclassified to consolidated reserves ‐ (1) ‐ ‐ (1) ‐ 1 1 ‐ ‐ ‐ ‐ ‐ ‐ ‐ ‐
Of which other comprehensive income attributable to changes in own credit risk
reclassified to consolidated reserves ‐ ‐ ‐ ‐ ‐ ‐ ‐ ‐ ‐ ‐ ‐ ‐ ‐ ‐ ‐ ‐
Share of changes in equity-accounted entities ‐ ‐ ‐ ‐ ‐ (89) 3 (86) ‐ (86) ‐ (30) ‐ (30) (30) (116)
Net income for 1st semester 2020 ‐ ‐ ‐ ‐ ‐ ‐ ‐ ‐ 1,592 1,592 287 ‐ ‐ ‐ 287 1,879
Other changes ‐ 11 ‐ ‐ 11 ‐ ‐ ‐ ‐ 11 5 ‐ ‐ ‐ 5 16
EQUITY AT 30 JUNE 2020 8,654 46,184 (122) 5,130 59,846 3,642 (1,186) 2,456 1,592 63,894 8,166 (87) (41) (128) 8,038 71,932

Comptes consolidés du groupe Crédit Agricole S.A. – 30 June 2020
11
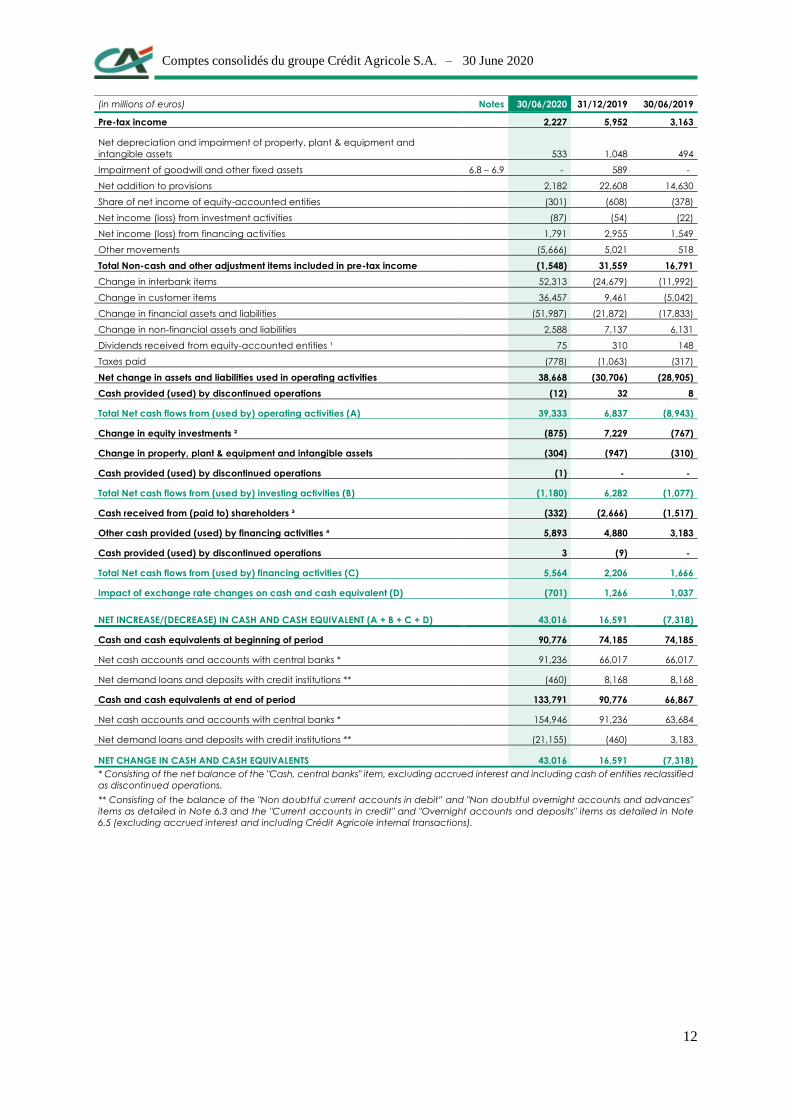
CASH FLOW STATEMENT
The cash flow statement is presented using the indirect method.
Operating activities are representative of income-generating activities of the Crédit Agricole S.A. Group.
Tax inflows and outflows are included in full within operating activities.
Investment activities show the impact of cash inflows and outflows associated with purchases and sales of
investments in consolidated and non-consolidated companies, property, plant and equipment and intangible assets.
This section includes strategic equity investments classified at “Fair value through profit or loss” or “Fair value
through other comprehensive income on items that cannot be reclassified”.
Financing activities show the impact of cash inflows and outflows associated with operations of financial structure
concerning equity and long-term borrowing.
The net cash flows attributable to the operating, investment and financing activities of discontinued operations
are presented on separate lines in the cash flow statement.
Net cash and cash equivalents include cash, debit and credit balances with central banks and debit and credit
demand balances with credit institutions.
Comptes consolidés du groupe Crédit Agricole S.A. – 30 June 2020
12
(in millions of euros) Notes 30/06/2020 31/12/2019 30/06/2019
Pre-tax income 2,227 5,952 3,163
Net depreciation and impairment of property, plant & equipment and
intangible assets 533 1,048 494
Impairment of goodwill and other fixed assets 6.8 – 6.9 ‐ 589 ‐
Net addition to provisions 2,182 22,608 14,630
Share of net income of equity-accounted entities (301) (608) (378)
Net income (loss) from investment activities (87) (54) (22)
Net income (loss) from financing activities 1,791 2,955 1,549
Other movements (5,666) 5,021 518
Total Non-cash and other adjustment items included in pre-tax income (1,548) 31,559 16,791
Change in interbank items 52,313 (24,679) (11,992)
Change in customer items 36,457 9,461 (5,042)
Change in financial assets and liabilities (51,987) (21,872) (17,833)
Change in non-financial assets and liabilities 2,588 7,137 6,131
Dividends received from equity-accounted entities ¹ 75 310 148
Taxes paid (778) (1,063) (317)
Net change in assets and liabilities used in operating activities 38,668 (30,706) (28,905)
Cash provided (used) by discontinued operations (12) 32 8
Total Net cash flows from (used by) operating activities (A) 39,333 6,837 (8,943)
Change in equity investments ² (875) 7,229 (767)
Change in property, plant & equipment and intangible assets (304) (947) (310)
Cash provided (used) by discontinued operations (1) ‐ ‐
Total Net cash flows from (used by) investing activities (B) (1,180) 6,282 (1,077)
Cash received from (paid to) shareholders ³ (332) (2,666) (1,517)
Other cash provided (used) by financing activities ⁴ 5,893 4,880 3,183
Cash provided (used) by discontinued operations 3 (9) ‐
Total Net cash flows from (used by) financing activities (C) 5,564 2,206 1,666
Impact of exchange rate changes on cash and cash equivalent (D) (701) 1,266 1,037
NET INCREASE/(DECREASE) IN CASH AND CASH EQUIVALENT (A + B + C + D) 43,016 16,591 (7,318)
Cash and cash equivalents at beginning of period 90,776 74,185 74,185
Net cash accounts and accounts with central banks * 91,236 66,017 66,017
Net demand loans and deposits with credit institutions ** (460) 8,168 8,168
Cash and cash equivalents at end of period 133,791 90,776 66,867
Net cash accounts and accounts with central banks * 154,946 91,236 63,684
Net demand loans and deposits with credit institutions ** (21,155) (460) 3,183
NET CHANGE IN CASH AND CASH EQUIVALENTS 43,016 16,591 (7,318)
* Consisting of the net balance of the "Cash, central banks" item, excluding accrued interest and including cash of entities reclassified
as discontinued operations.
** Consisting of the balance of the "Non doubtful current accounts in debit” and "Non doubtful overnight accounts and advances"
items as detailed in Note 6.3 and the "Current accounts in credit" and "Overnight accounts and deposits" items as detailed in Note
6.5 (excluding accrued interest and including Crédit Agricole internal transactions).

Comptes consolidés du groupe Crédit Agricole S.A. – 30 June 2020
13
1 Dividends received from equity-accounted entities:
As at 30 June 2020, this amount includes the payment of dividends from insurance entities for €61 million, from Amundi subsidiaries for €10 million and €5 million
for Crédit Agricole S.A.
2 Change in equity investments:
This line shows the net effects on cash of acquisitions and disposals of equity investments.
- the net impact on Group cash of acquisitions and disposals of consolidated equity investments (subsidiaries and equity-accounted entities) as at 30 June 2020
was -€448 million. The main transactions concern the acquisition of Sabadell Asset Management for -€424 million, the full takeover of Ménafinance for -€29
million of net cash acquired, and the acquisition of securities of equity-accounted entities, including Korian for -€17 million.
- During the same period, the net impact of acquisitions and disposals of non-consolidated equity investments on Group cash came to -€427 million, of which -
€293 million from insurance investments and -€72 million from the creation of BOC Wealth Management.
3 Cash received from (paid to) shareholders:
This amount primarily corresponds to -€339 million in dividends paid, excluding dividends paid in shares by Crédit Agricole Group. It breaks down as follows:
- dividends paid by non-controlling interests for -€108 million; and
- interest equivalent to dividends on undated financial instruments treated as equity for -€229 million.
This amount also includes issues and redemptions of equity instruments for +€20 million.
4 Other net cash flows from financing activities:
As at 30 June 2020, bond issues totalled +€14,757 million and redemptions -€7,631 million. Subordinated debt issues totalled +€2,198 million and redemptions
-€1,482 million.
This line also includes cash flows from interest payments on subordinated debt and bonds for -€1,789 million.

Comptes consolidés du groupe Crédit Agricole S.A. – 30 June 2020
14
NOTES TO THE CONDENSED INTERIM
CONSOLIDATED FINANCIAL STATEMENTS
NOTE 1 Group accounting policies and principles, assessments and estimates
applied
1. Group accounting policies and principles, assessments and estimates applied
The condensed interim consolidated financial statements of Crédit Agricole S.A. for the period
ended 30 June 2020 were prepared and are presented in accordance with IAS 34 (Interim
Financial Reporting), which defines the minimum information content and sets out the
recognition and measurement principles that must be applied in an interim financial report.
The standards and interpretations used for the preparation of the condensed interim consolidated
financial statements are identical to those used by Crédit Agricole Group for the preparation of
the consolidated financial statements at 31 December 2019, prepared, pursuant to Regulation
(EC) No 1606/2002, in accordance with IAS/IFRS standards and IFRIC interpretations as
adopted by the European Union (the "carve out" version), thus using certain exceptions in the
application of IAS 39 on macro-hedge accounting.
They were supplemented by the IFRS standards as adopted by the European Union at 30 June
2020 and for which application is mandatory for the first time during financial year 2020.
These cover the following:
Standards, amendments or interpretations
Date of publication
by the European
Union
Date of first-time application: financial years from
Applicable
to the Group
Amendment to the references to the conceptual frame of IFRS
6 December 2019 (UE 2019/2075)
1 January 2020 Yes
IAS 1/IAS 8 Presentation of Financial statements Definition of Material
10 December 2019 (UE 2019/2104)
1 January 2020 Yes
Amendment to IFRS 9, IAS 39 and IFRS 7 Financial Instruments Interest rate benchmark reform
15 January 2020 (UE 2020/34)
1 January 2020 (1) Yes
Amendments to IFRS 3 Business Combinations Definition of Material
21 April 2020 (UE 2020/551)
1 January 2020 Yes
1 The Group decided to early apply the amendment to IFRS 9, IAS 39 and IFRS 7 Financial instruments on the Interest rate benchmark reform from 1 January
2019.
IBOR REFORM
As a user of critical benchmarks, Crédit Agricole Group is acutely aware of their importance
and of the issues relating to their changes in the context of ongoing reforms.
The Crédit Agricole Benchmarks project guides the Group's benchmark transition, proactively
in anticipation of the replacement of benchmarks or by providing for the activation of robust
fallback clauses, whether they currently exist or are to be inserted into the contracts. The aim is
to coordinate the Group entities to prepare all business lines and support our customers in the
transition to new benchmark rates. This project also ensures that Crédit Agricole Group entities
are in compliance with the BMR (Benchmark Regulation).
Following the mapping of our exposures and contracts, the main benchmarks to which the
Group's hedging relationships are exposed are the critical benchmarks as defined in the BMR
(Eonia, Euribor, Libor USD, Libor GBP, Libor JPY, Libor CHF, Libor EUR, Wibor, Stibor).

Comptes consolidés du groupe Crédit Agricole S.A. – 30 June 2020
15
With regard to the Eonia-€STR transition, the precise terms were determined by the ECB
working group on risk-free rates for the euro. Eonia will disappear on the last day of its
publication, 3 January 2022. Concerning the other benchmarks, banking working groups with
the support of the authorities are making progress in determining methodologies for replacing
them using alternative rates calculated based on the Risk-Free Rate (RFR) and recommending
that fallback clauses be inserted in contracts. Market associations such as ISDA and LMA are
also working in this direction. At this point, not all these works have been conclusive and there
are still uncertainties as to the correct conventions selected as well as the precise schedule.
In order to ensure that hedging relationships affected by this benchmark interest rate reform can
continue despite uncertainties about the schedule and the terms of the transition between the
current and new indices, IASB has issued amendments to IAS 39, IFRS 9 and IFRS 7 in
September 2019, which were adopted by the EU on 15 January 2020.
The Group will apply these amendments for as long as uncertainties about the future of the
benchmarks have an impact on the amounts and maturities of interest flows and, as such,
believes that all of its hedging agreements, mainly those related to Eonia, Euribor and Libor
rates (USD, GBP, CHF, JPY), can benefit from them starting 30 June 2020.
As at 30 June 2020, the identification of hedging instruments impacted by the reform and for
which uncertainties remain reveals a nominal amount of €615 billion.
Term of IFRS 16 leases - IFRS IC decision of 26 November 2019
In first half 2019, a question was referred to the IFRS IC relating to the determination of the
enforceable period for the recognition of leases under IFRS 16, in particular for two types of
leases:
Leases with no contractual maturity, which may be terminated subject to notice by each
party;
Contracts with automatic renewal clauses (unless terminated by one of the parties), and
with no contractual penalty due in the event of termination.
At its meeting on 26 November 2019, the IFRS IC noted that, in accordance with IFRS 16 and
in general, a lease is no longer enforceable if both the lessee and the lessor have the right to
terminate it without the permission of the other party, subject at most to a negligible penalty,
and clarified that to determine the enforceable period, all economic aspects of the contract must
be taken into account and the concept of penalty extends beyond the contractual termination
indemnities and includes any economic incentive not to terminate the contract.
This decision constitutes a change of method in the approaches adopted by the Group in the
determination of the duration of leases, and goes beyond the specific cases on which the IFRS
IC was questioned, as noted by the AMF in its recommendations of 31 December 2019. In fact,
the duration of the contract to be used for the measurement of the right of use and the lease
liability is determined under IFRS 16 within that enforceable period. In addition, the application
of a new method following a final decision of the IFRS IC is generally retrospective and
requires the Group to review the lengths of the IFRS 16 transition periods for financial year
2019.
Following the publication of this final decision of IFRS IC, and in order to be compliant with
it by 31 December 2020, Crédit Agricole Group launched a project incorporating the
accounting, finance, risk and IT functions, which can be broken down into three components:
Comptes consolidés du groupe Crédit Agricole S.A. – 30 June 2020
16
Component 1: Identifying the contracts impacted by the decision of the IFRS IC;
Component 2: Assessing the accounting and prudential impacts of the decision of the
IFRS IC on the duration of leases;
Component 3: Ensuring that the information systems are compliant and including the
impacts in the consolidated financial statements.
In particular, the Group identified the following types of leases as being impacted by that
decision:
Property leases treated as commercial leases under French law: the Group applies the
ANC conclusions of 16 February 2018, which state that "in the chart of accounts, there
is no renewal option at the end of the lease and the period during which the contract is
binding is generally nine years (with the non-cancellable period then being three years)".
During the second half of 2020, the Group planned to analyse the effects on commercial
leases close to the 9-year term in relation to the statement of findings by the French
accounting standards setter (ANC) regarding the application of IFRS 16 published in
July 2020, replacing that of 16 February 2018. As at 31 December 2019, the Group was
bound under 775 French commercial leases.
Automatic extensions of property leases treated as commercial leases under French law:
since the enforceable period of those contracts was less than 12 months prior to the
decision of the IFRS IC, those contracts were subject to the transition exemption in
IFRS 16 for contracts with a residual maturity of less than 12 months at the date of
application. In the event of an extension of the enforceable period pursuant to the IFRS
IC decision and a subsequent extension of the lease period beyond 12 months, those
contracts must be written back into the rights of use and the lease liabilities recognised
in the IFRS 16 transition at 1 January 2019. As at 31 December 2019, the Group was
bound under 920 such contracts.
Other contracts all jurisdictions combined: the Group conducts a comprehensive
inventory of contracts whose lease period within the meaning of IFRS 16 would be
amended by the decision of the IFRS IC. These analyses are carried out on a case-by-
case basis, according to the contractual documentation and the legal provisions in force
concerning them.
In the context of the preparation of the financial statements at 30 June 2020, the Group has not
taken this decision into account in the financial statements at 30 June 2020 so that it can have
the time necessary to analyse in a comprehensive manner the accounting consequences of this
decision.
STANDARDS AND INTERPRETATIONS PUBLISHED BY THE IASB AT 30 JUNE
2020 AND NOT YET ADOPTED BY THE EUROPEAN UNION
The standards and interpretations published by the IASB at 30 June 2020 and not yet adopted
by the European Union do not apply to the Group. They will become mandatory only as of the
date planned by the European Union and do not apply to the Group as of 30 June 2020.
This concerns IFRS 17 in particular:
IFRS 17 Insurance Contracts issued in May 2017 will replace IFRS 4. It will apply to the
financial years beginning on or after 1 January 2023 subject to its adoption by the European
Union.
IFRS 17 sets out the new measurement and recognition principles for insurance contract
liabilities and evaluation of their profitability, in addition to their presentation. From 2017 to
2019, scoping work began on the implementation project in order to identify the challenges and

Comptes consolidés du groupe Crédit Agricole S.A. – 30 June 2020
17
impacts of the standard on the Group's insurance subsidiaries. Analysis and preparation for
implementation continue in 2020.
Several amendments issued by the IASB will also be applicable subject to their adoption by the
European Union:
Amendments Date of first-time application : financial years
from
IFRS 16 “Leases”
Rent concessions due to COVID-19 1 June 2020
IFRS 4 “Insurance Contracts”
Extension of the exemption from applying IFRS 9 1 January 2021
IAS 16 “Property, Plant and Equipment”
Proceeds before intended use 1 January 2022
IAS 37 “Provisions, Contingent Liabilities and Contingent Assets”
Costs considered in determining whether a contract is onerous 1 January 2022
2018-2020 annual improvements cycle
- IFRS 1 “First-time Adoption of International Financial Reporting Standards”
- IFRS 9 “Financial Instruments”
- IFRS 16 “Leases”
- IAS 41 “Agriculture”
1 January 2022
IFRS 3 “Business Combinations”
References to the conceptual framework 1 January 2022
IAS 1 “Presentation of Financial Statements”
Classification of current and non-current liabilities 1 January 2023
The intent of the condensed interim consolidated financial statements is to update the
information provided in the Crédit Agricole S.A. consolidated financial statements at 31
December 2019 and should be read in addition to those. Also, only the most significant
information on the change in the financial position and performance of Crédit Agricole S.A. is
mentioned in those half-yearly financial statements.
Estimates made to draw up the consolidated financial statements are by nature based on certain
assumptions and involve risks and uncertainties as to whether they will be achieved in the
future. Accounting estimates that require the formulation of assumptions are used primarily for
measurements performed for financial instruments valued at fair value, unconsolidated equity
investments, valuation of equity-accounted entities, pension schemes and other future benefits
plans, as well as stock option plans, write-downs of bad debts, provisions, goodwill impairment,
and deferred tax assets.
Comptes consolidés du groupe Crédit Agricole S.A. – 30 June 2020
18
NOTE 2 Major structural transactions and material events during the period
The scope of consolidation and changes to it are shown in detail at the end of the notes in Note
10 "Scope of consolidation at 30 June 2020".
2.1 The COVID-19 health crisis
In the context of the COVID-19 health crisis, Crédit Agricole Group mobilised to tackle this
unprecedented situation. In order to support its customers, whose activity would be impacted
by the Coronavirus, the Group was actively involved in measures to support the economy.
2.1.1 State-guaranteed loans
As part of the COVID-19 health crisis and at 25 March 2020, Crédit Agricole Group has offered
all its corporate customers — regardless of their size and status (farmers, professionals, traders,
craftsmen, corporates etc.) — recourse to the massive and unprecedented State-guaranteed
loans mechanism. This is in addition to the measures already announced (payment deferrals,
accelerated procedures for examining applications etc.).
This financing takes the form of a 12-month loan, with the borrower being able to spread
repayments over a further 1- to 5-year period.
The Group offer for the first year takes the form of a zero-interest loan; only the cost of
underwriting is re-invoiced (via a fee paid by the customer) in accordance with the conditions
of eligibility for the loan established by the State.
The maximum loan amount is equal to three months of revenues, allowing entrepreneurs to
access the necessary financing to get through the current troubled period.
The vast majority of these loans share a “Collection” management model and pass the
contractual terms test. They are thus chiefly recorded at amortised cost.
As at 30 June 2020, the amount of State-guaranteed loans granted to customers by Crédit
Agricole S.A. in France was €7.8 billion.
2.1.2 Deferral of payments on financing granted to customers
The Group joined the French banks’ market initiative, in conjunction with the French Banking
Federation (FBF), to offer deferral of payments due on outstanding loans for up to six months
for corporate and professional customers, at no additional cost.
This deferral of payments due without penalties or additional costs and under the same
contractual rate, over a maximum period of six months, means that only the interim interest will
be received after the deferral over the remaining term of the loan and excluding any guarantee
fees from Banque Publique d’Investissement.
As per the Group’s proposal, the deferral of payments due involves:
either an extension of the loan term if the customer wishes to maintain the loan
repayments at the initial amount; or

Comptes consolidés du groupe Crédit Agricole S.A. – 30 June 2020
19
an increase in the repayment amounts after the suspension if the customer wishes to
maintain the initial loan term.
This deferral of payments due is reflected in a delay in the initial repayments to be collected.
As at 30 June 2020, the amount of outstanding customer loans in France benefiting from this
payment deferral amounted to €2.85 billion at Crédit Agricole S.A. level.
2.1.3 Impact of these measures on credit risk
In accordance with the IASB’s statement on 27 March 2020 on the recognition of expected
credit losses pursuant to IFRS 9 Financial Instruments in the current exceptional circumstances,
the importance of judgement was recalled in the application of the IFRS 9 credit risk principles
and the resulting classification of financial instruments.
This deferral of payments due does not automatically call into question clients’ financial
positions. It does not necessarily imply an increased counterparty credit risk. In general,
amendments to agreements cannot be understood as restructuring due to financial difficulties.
This deferral therefore does not result in the outstanding amount whose impairment is based on
the 12-month expected credit losses (Bucket 1) mechanically shifting towards a recognised
impairment of the expected losses at maturity (Bucket 2), nor does it imply an automatic shift
on the part of the outstanding amount to the impaired category (Bucket 3).
Similarly, the calculation of the amount of expected losses must take into account the specific
circumstances and the support measures put in place by the public authorities.
2.1.4 Credit risk assessment
Given the COVID-19 health crisis, the Group has revised its forward-looking macroeconomic
forecasts for determining credit risk estimates.
Information on the selected macroeconomic scenarios
The Group used three main scenarios for the calculation of IFRS 9 provisioning parameters
with projections to 2022.
These three scenarios incorporate differentiated assumptions with regard to the impacts of the
COVID-19 crisis on the economy based on how rapid and complete the return to normal is of
mobility, activity and consumption, which depend largely on health developments, currently
still very uncertain. Customers’ level of trust is also key: health, economic and employment
expectations, can lead to in varying degrees of wait-and-see and precautionary behaviour, which
consequently determines the propensity of households to consume the abundant savings
accumulated during lockdown and the capacity of corporates to make investments. The size,
effectiveness and timing of government stimulus measures also have a significant impact on
the evolution of activity.
The first scenario describes a gradual but not synchronised exit from the crisis, since the
return to full mobility occurs at different rates from country to country. It assumes that
there will not be a second wave of the epidemic

Comptes consolidés du groupe Crédit Agricole S.A. – 30 June 2020
20
After a strict lockdown phase in France and the eurozone (March-May), restrictions were
gradually eased (May-June) and there was an upturn in activity in most sectors. Constraints
linked to compliance with health rules and restrictive measures remain in certain sectors.
Restrictions on activity and mobility produced a double shock, on both supply and demand,
which led to a sharp fall in activity during the lockdown period. The lifting of constraints at the
end of the second and start of the third quarter of 2020 will almost automatically trigger a very
strong rebound during the summer.
Thanks to greatly improved health conditions and the threat of a resurgence of the virus averted,
the restored confidence of households means a making up for lost time in the consumption of
goods made possible by the use of surplus “forced” savings that built up during the lockdown
period. The deterioration in production capacity remains very limited thanks to the support
measures, which are preserving employment and household income. The end of uncertainty and
better visibility for their markets is also enabling corporates to resume their investments more
quickly. This translates into a very marked recession in 2020 on average year-on-year (-7% in
France) and growth that remains solid in 2021 and 2022 (+7.3% and +1.8% respectively), with
most of the catching-up of activity nevertheless taking place in 2020. As a result, real GDP in
2022 will be 1.6% higher than in 2019.
Thanks to the support measures, designed to contain the recessionary effects and the financial
difficulties of customer types, the impact on unemployment in France is currently limited.
In this context, inflation remains very low, averaging only 1% in 2022 in France (0.3% in 2020
and 0.6% in 2021).
Accordingly, the ECB maintains an accommodative policy stance so as to maintain favourable
financial and liquidity conditions and avoid fragmentation of the Eurozone. As a result, interest
rates remain very low over the long term. This, combined with the strong signal provided by
the launch of the European recovery fund financed by joint issuances, will help to contain
European sovereign spreads with the German Bund. The 10-year French Treasury bond (OAT)
will remain about 50 basis points above the Bund.
The second scenario involves a drop in activity, which will turn out to be more negative
in the second quarter and a slower recovery of the economy by the end of 2020
After that, a gradual recovery, which will still be solid at the beginning of 2021, then gradually
moderate, will allow a return to 2019 activity levels by the end of 2022.
In France, the very mixed profile of the trends in activity in 2020 will lead to a gradual recovery
of production in the third and fourth quarters of 2020. There is a slightly sharper decline in GDP
than in scenario 1 (-7.2% in the case of France) followed by a marked recovery in 2021 and
2022 (GDP growth of respectively +5.9% and +1.5%).
The third scenario is characterised by a slightly stronger downturn in activity in the
second quarter and a very sluggish exit from the crisis
The resurgence of the epidemic would result in another widespread lockdown, currently
considered unlikely, of two months in the autumn and the lifting of restrictions will gradually
take place by the end of 2020. In total, the periods outside of lockdown will not be long enough
to allow a return to normal. Activity will only recover partially when periods outside of

Comptes consolidés du groupe Crédit Agricole S.A. – 30 June 2020
21
lockdown are too brief. Households will adopt precautionary behaviours and keep their savings
to the detriment of consumption and, due to a lack of visibility on their markets, corporates will
delay their investments. In France, GDP will contract by around -15% on average year-on-year
in 2020. Gradual recovery will be postponed until 2021, but the trending level of activity will
be negatively affected by a higher rise in unemployment and the destruction of production
capacity, despite support measures, which weigh very heavily on public finances. French GDP
will nevertheless show high growth rates in 2021 and 2022 (+6.6% and +8% respectively), due
to positive base effects in late 2020 and early 2021. In 2022, activity will remain more than 2%
below its 2019 level.
Support measures: Note that the risk parameter projection process has been revised to better
reflect the impact of government measures in the projections. The consequence of this revision
is the mitigation of the suddenness of the intensity of the crisis and its occurrence over a longer
period (3 years).
The variables relating to interest rate levels and, more generally, all variables related to capital
markets have not been modified because their forecasts already structurally incorporate the
effects of the support policies.
Sector and local scenarios: As indicated above, sector supplements established at the local
level (forward-looking local) by certain Group entities may supplement the macroeconomic
scenarios defined centrally.
Including forward-looking locals, the share of B1/B2 provisions (provisioning for performing
loans) and of B3 provisions (provisioning for proven risks) represent 24% and 76% respectively
of the total inventory of provisions at 30/06/2020.
In terms of cost of risk, the share of allocations net of reversals of B1/B2 provisions represents
31% of the cost of risk at 30/06/2020 versus 69% for the B3 share.
Sensitivity analyses of ECL amounts
As an example, a 10-point reduction in the weighting of scenario 1 in the calculations at
30/06/2020 in favour of scenario 3, which is significantly more unfavourable, would lead to a
change in forward-looking central ECL inventory of around 5% of total ECL inventory.
However, such a change in weighting would not necessarily have a significant impact due to
forward-looking local adjustments, which could mitigate the effect.
2.1.5 2019 dividend decision
On 27 March 2020, the European Central Bank issued recommendations asking banks under its
supervision not to pay dividends while the coronavirus crisis continues, until “at least early
October 2020”.
This period seems to be incompatible with the French Commercial Code (Code de commerce),
which prescribes payment of the annual dividend by 30 September at the latest.
Under these conditions, Crédit Agricole S.A.'s Board of Directors, consulted in writing on 1
April 2020 pursuant to the legal provisions on the functioning of the deliberative bodies during
the COVID-19 epidemic, decided not to propose to the General Meeting of 13 May 2020 the

Comptes consolidés du groupe Crédit Agricole S.A. – 30 June 2020
22
distribution of a dividend initially set at €0.70 per share for financial year 2019, and to allocate
all of the earnings for 2019 to a reserve account.
On 28 July 2020, the ECB extended its recommendations not to pay dividends until January
2021.
2.1.6 Mutual-based support system for professionals
In light of the COVID-19 health crisis, and in order to support and help professionals get
through this period, Crédit Agricole Group decided on 22 April 2020 to implement an
unprecedented support system for all its policyholders who have taken out professional multi-
risk insurance with business interruption.
This mutual-based support system leads to the payment of a sum corresponding to a flat-rate
estimate of the loss of revenues of the economic sector concerned during the period.
At 30 June 2020, €237.5 million had been paid to the Group’s professional policyholders under
this system:
€231.5 million was borne by Crédit Agricole Group :
o €96.5 million was borne by Pacifica;
o €96.5 million was borne by the Regional Banks and LCL;
o €38.5 million was borne by La Médicale de France.
€6 million to non-Group companies was borne by insurance agents of La Médicale de
France.
2.2 Main changes in the scope of consolidation
2.2.1 Acquisition of Sabadell Asset Management by Amundi
On 21 January 2020, Amundi and Banco Sabadell announced the signing of a 10-year strategic
partnership for the distribution of asset management products in the Banco Sabadell network in
Spain.
The combination of the strong regional presence of the Banco Sabadell network and Amundi's
comprehensive offering of savings products and solutions creates significant development
potential in Spain between the two partners.
In this context, Amundi acquires Sabadell Asset Management's entire share capital, Banco
Sabadell's asset management subsidiary with €22 billion in assets under management as of 31
December 2019.
On 30 June 2020, with all the regulatory authorisations required to complete this transaction
having been obtained, Amundi acquired Sabadell Asset Management's entire share capital for
a cash purchase price of €430 million. An earnout of up to €30 million could be payable by
2024.
This acquisition, exclusively financed by excess capital from Amundi, resulted in the
recognition of goodwill of €335 million in the financial statements of Crédit Agricole Group at
30 June 2020.

Comptes consolidés du groupe Crédit Agricole S.A. – 30 June 2020
23
In accordance with IFRS 3R, the goodwill presented in this Note is a preliminary assessment
and may be subject to re-appraisal over the coming year.
2.2.2 Additional acquisition of Menafinance shares by Crédit Agricole Consumer
Finance
Following the renewal of its partnership with the FNAC DARTY Group for ten years in March
2020, Crédit Agricole Consumer Finance decided to take control of Menafinance, an entity
providing consumer finance to Darty customers. Hitherto, this entity was under the joint control
of two partners and consolidated using the equity-accounted method within Crédit Agricole
Group.
Thus, on 30 June 2020, Crédit Agricole Consumer Finance acquired the 50% of Menafinance's
share capital held by the FNAC DARTY Group, i.e. 185,358 Menafinance shares for a total
amount of €29.3 million.
Following this transaction, Menafinance is wholly owned by Crédit Agricole Consumer
Finance and is fully consolidated within the Crédit Agricole S.A. Group.
In accordance with IFRS 3R, this additional acquisition has a positive impact on the Group
share of income of €12.6 million for the revaluation of securities previously held. In addition,
it resulted in recognition of goodwill of €25.2 million in the financial statements of the Crédit
Agricole S.A. Group as at 30 June 2020.
2.2.3 Proposed sale of Crédit Agricole Bank Romania (IFRS 5)
Crédit Agricole Bank Romania is a wholly owned subsidiary of Crédit Agricole S.A.
During 2019, Crédit Agricole S.A. initiated a process to put Crédit Agricole Bank Romania up
for sale.
Crédit Agricole Bank Romania's assets and liabilities have thus been reclassified under IFRS 5
in the consolidated financial statements at 31 December 2019.
At 30 June 2020, the disposal plan remains unchanged. Negotiations are underway with
potential buyers.
Crédit Agricole Bank Romania is therefore maintained under IFRS 5 in the consolidated
financial statements of Crédit Agricole S.A. Group as at 30 June 2020 for an amount of €493
million in non-current assets held for sale and for an amount of €488 million in debt related to
non-current assets held for sale.
Net income is classified in Net income from discontinued or held-for-sale operations for an
amount of -€1 million.

Comptes consolidés du groupe Crédit Agricole S.A. – 30 June 2020
24
2.3 "Switch" guarantee mechanism
The "Switch" guarantee mechanism represents a transfer to the Regional Banks of a share of
the regulatory prudential requirements that apply to Crédit Agricole S.A. for its insurance
activities in return for a fixed compensation from the Regional Banks.
2.3.1 Unwinding of 35% of the "Switch" guarantee mechanism
On 2 March 2020, Crédit Agricole S.A. unwound 35% of the "Switch" guarantee mechanism
implemented between the Regional Banks and Crédit Agricole S.A.
The partial unwinding of this intragroup transaction strengthens Crédit Agricole S.A.’s profit
capacity with an accretive impact of €58 million in 2020. One of the Medium-Term Plan targets
is to unwind 50% of the switch by 2022.
For the Regional Banks, this transaction resulted in a 35% drop in commitments given (i.e. €3.2
billion) and a 35% drop in the security deposit provided to Crédit Agricole S.A. (i.e. around €1
billion).
This transaction has no impact on the results nor on the solvency ratios of Crédit Agricole
Group.
2.3.2 Activation of the "Switch" guarantee mechanism
The "Switch" guarantee mechanism covers the adjusted equity-accounted value of Crédit
Agricole Assurances. It is activated if this value decreases over a six-month period.
In the event of activation, the guarantee call leads the Regional Banks to pay Crédit Agricole
S.A. the proceeds of the half-yearly decrease in the equity-accounted value, adjusted by the
coverage ratio that has stood at 44.51% since 2 March 2020 — the date this guarantee was 35%
unwound.
At 30 June 2020, a decrease of €147 million in the estimated adjusted equity-accounted value
of Crédit Agricole Assurances was observed for the first half of 2020. It led to the activation of
the guarantee mechanism for an amount of €65.4 million. This is reflected in the financial
statements of the Crédit Agricole S.A. Group by the recognition of income in profit or loss
under cost of risk for €65.4 million.
Crédit Agricole Assurances' final adjusted equity-accounted value will be known in the third
quarter of 2020. Therefore, the compensation will be adjusted and collected by Crédit Agricole
S.A. by deduction from the security deposit of the Regional Banks, which will immediately be
replenished by a payment of funds.
2.4 Subscription to the TLTRO III (Targeted Longer-Term Refinancing Operations)
refinancing mechanism
A third series of long-term refinancing transactions was decided in March 2019 by the ECB,
the terms of which were revised in September 2019, and again in March and April 2020 in
relation to the COVID-19 pandemic.
The TLTRO III mechanism aims to offer long-term refinancing with a bonus in the event that
a target growth rate on loans is achieved, applied on the 3-year maturity of the TLTRO
transaction, to which an additional temporary incentive is added over the one-year period from

Comptes consolidés du groupe Crédit Agricole S.A. – 30 June 2020
25
June 2020 to June 2021. The Crédit Agricole Group considers that the target growth rate for
loans will be achieved.
Crédit Agricole Group uses the ECB’s TLTRO III facility to support loan activity and to take
advantage of a competitive funding cost. In June 2020, Crédit Agricole S.A. Group borrowed
€88 billion under TLTRO III, while repaying its LTRO drawdown and partially repaying its
TLTRO II drawdown.
2.5 Cheque Image Exchange dispute
In its judgement of 21 December 2017, the Paris Court of Appeal upheld the decision of the
French Competition Authority (ADLC), which in 2010 had fined the major French banks for
colluding to fix the price and terms of clearing cheques.
Just as the other banks party to this procedure, Crédit Agricole Group has filed an appeal with
the French Supreme Court (Cour de cassation).
The Supreme Court ruled in favour of the banks in the CIE (Cheque Image Exchange) case by
a judgement of 29 January 2020 and referred the case back to the Paris Court of Appeal to be
heard by a different judge.
This decision places the case and the parties in the same position as before the Court of Appeal
judgement of 21 December 2017. The banks are therefore once again subject to the
unfavourable decision of the French Competition Authority of 20 September 2010.
In practice, the French Supreme Court decision means Crédit Agricole S.A. is required to pay
back to the State Treasury the difference between the fine imposed by the French Competition
Authority in September 2010 (€82.9 million) and the reduced fine imposed by the Paris Court
of Appeal in December 2017 (€76.6 million), i.e. the sum of €6.4 million.
On the same principle as the fine paid in December 2017, this additional charge is shared
equally between Crédit Agricole S.A. and the Regional Banks and recognised in the
consolidated financial statements at 30 June 2020.

Comptes consolidés du groupe Crédit Agricole S.A. – 30 June 2020
26
NOTE 3 Credit Risk
(See chapter on "Risk Factors – Credit Risk")
3.1 Change in carrying amounts and value adjustments for losses during the period
Value adjustments for losses correspond to the impairment of assets and to provisions for off-
balance sheet commitments recognised in net income (“Cost of Risk”) relating to credit risk.
The following tables present a reconciliation of the opening and closing balances of value
adjustments for losses recognised under Cost of risk and associated carrying amounts, by
accounting category and type of instrument.

Comptes consolidés du groupe Crédit Agricole S.A. – 30 June 2020
27
FINANCIAL ASSETS AT AMORTISED COST: DEBT SECURITIES
Performing assets
Assets subject to 12-month ECL (Bucket 1) Assets subject to lifetime ECL (Bucket 2)
Credit-impaired assets (Bucket 3) Total
(in millions of euros)
Gross carrying
amount Loss allowance
Gross carrying
amount Loss allowance
Gross carrying
amount Loss allowance
Gross carrying amount
(a) Loss allowance (b)
Net carrying amount
(a) + (b)
Balance at 31 December 2019 72,170 (27) 380 (12) 23 (15) 72,572 (53) 72,519
Transfers between buckets during the period (10) ‐ (1) ‐ 11 ‐ ‐ ‐
Transfers from Bucket 1 to Bucket 2 (9) ‐ 9 ‐ ‐ ‐ ‐
Return to Bucket 2 from Bucket 1 ‐ ‐ ‐ ‐ ‐ ‐ ‐
Transfers to Bucket 3 ¹ (1) ‐ (10) ‐ 11 ‐ ‐ ‐
Return from Bucket 3 to Bucket 2 / Bucket 1 ‐ ‐ ‐ ‐ ‐ ‐ ‐ ‐
Total after transfers 72,160 (27) 379 (12) 34 (15) 72,573 (54) 72,519
Changes in gross carrying amounts and loss allowances 20,713 (21) (10) 8 (1) (8) 20,702 (21)
New financial production : purchase, granting, origination,… ² 43,274 (17) 347 ‐ ‐ 43,621 (17)
Derecognition : disposal, repayment, maturity... (22,024) 6 (357) 8 ‐ ‐ (22,381) 14
Write-offs ‐ ‐ ‐
Changes of cash flows resulting in restructuring due to financial difficulties ‐ (5) ‐ ‐ ‐ ‐ ‐ (5)
Changes in models' credit risk parameters during the period (5) ‐ (9) ‐ (14)
Changes in model / methodology ‐ ‐ ‐ ‐ ‐
Changes in scope ‐ ‐ ‐ ‐ ‐ ‐ ‐ ‐
Transfers in non-current assets held for sale and discontinued operations ‐ ‐ ‐ ‐ ‐ ‐ ‐ ‐
Other (537) ‐ ‐ ‐ (1) 1 (538) 1
Total 92,873 (48) 369 (4) 33 (23) 93,275 (75) 93,200
Changes in carrying amount due to specific accounting assessment methods (with no significant
impact on loss allowance) ³ 565 ‐ ‐ 565
Balance at 30 June 2020 93,438 (48) 369 (4) 33 (23) 93,840 (75) 93,765
Contractual amount outstanding of financial assets written off during the period, that are still subject
to enforcement measures ‐ ‐ ‐ ‐
¹ Transfers to Bucket 3 correspond to outstanding amounts initially classified as Bucket 1 which, during the year, were downgraded directly to Bucket 3, or to Bucket 2 and later to Bucket 3.
² Originations in Bucket 2 could include some originated loans in Bucket 1 reclassified in Bucket 2 during the period.
³ Includes the impacts of fair value adjustments of micro-hedged instruments, the impacts relating to the use of the EIR method (notably the amortisation of premiums/discounts), the impacts of the accretion of discounts on restructured loans (recovered as revenue over the remaining term of the asset), the changes in
related receivables and in the currency impact.
Comptes consolidés du groupe Crédit Agricole S.A. – 30 June 2020
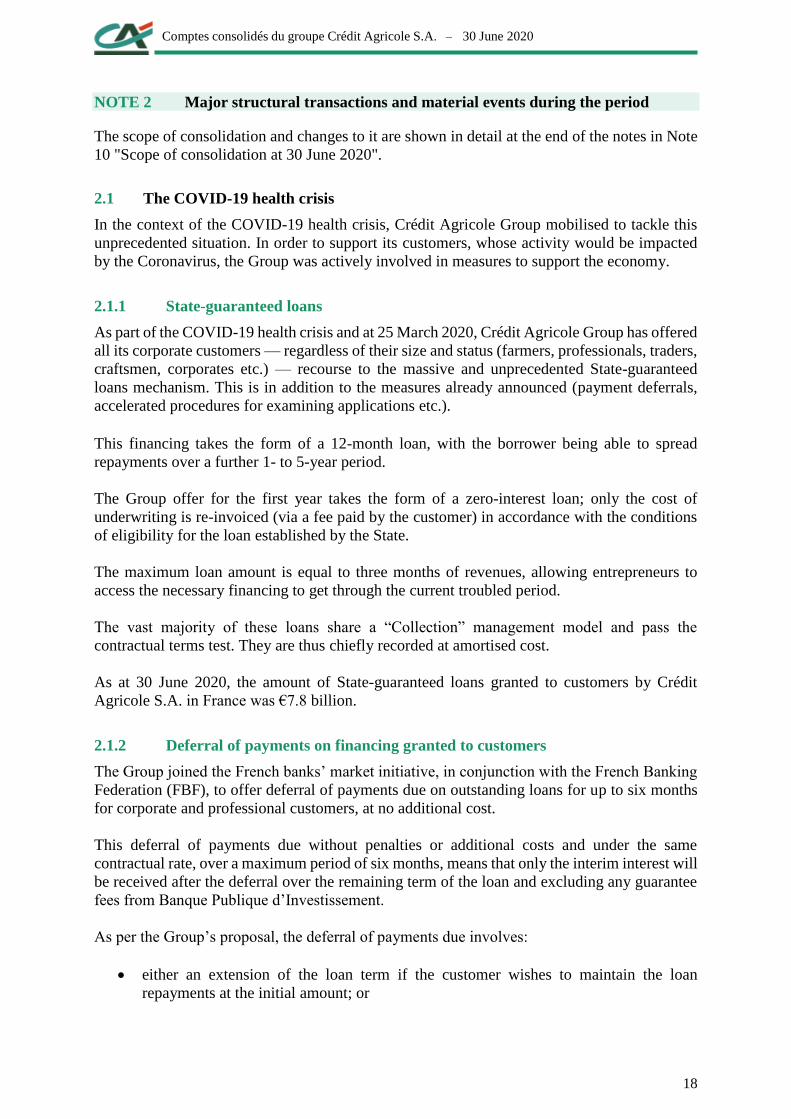
28
FINANCIAL ASSETS AT AMORTISED COST: LOANS AND RECEIVABLES DUE FROM CREDIT INSTITUTIONS (EXCLUDING CRÉDIT AGRICOLE INTERNAL TRANSACTIONS)
Performing assets
Assets subject to 12-month ECL (Bucket 1) Assets subject to lifetime ECL (Bucket 2)
Credit-impaired assets (Bucket 3) Total
(in millions of euros)
Gross carrying
amount Loss allowance
Gross carrying
amount Loss allowance
Gross carrying
amount Loss allowance
Gross carrying amount
(a) Loss allowance (b)
Net carrying amount
(a) + (b)
Balance at 31 December 2019 103,931 (27) 26 ‐ 505 (389) 104,464 (416) 104,048
Transfers between buckets during the period (20) ‐ 20 ‐ ‐ ‐ ‐ ‐
Transfers from Bucket 1 to Bucket 2 (20) ‐ 20 ‐ ‐ ‐
Return to Bucket 2 from Bucket 1 ‐ ‐ ‐ ‐ ‐ ‐ ‐ ‐
Transfers to Bucket 3 ¹ ‐ ‐ ‐ ‐ ‐ ‐ ‐ ‐
Return from Bucket 3 to Bucket 2 / Bucket 1 ‐ ‐ ‐ ‐ ‐ ‐ ‐ ‐
Total after transfers 103,911 (27) 46 ‐ 505 (389) 104,462 (416) 104,046
Changes in gross carrying amounts and loss allowances 18,533 (6) 50 ‐ (15) 8 18,568 2
New financial production : purchase, granting, origination, renegociation … ² 42,653 (14) 83 ‐ 42,736 (14)
Derecognition : disposal, repayment, maturity... (23,634) 23 (31) ‐ (11) 5 (23,676) 28
Write-offs (3) 3 (3) 3
Changes of cash flows resulting in restructuring due to financial difficulties ‐ (3) ‐ ‐ ‐ ‐ ‐ (3)
Changes in models' credit risk parameters during the period (12) ‐ (1) ‐ (13)
Changes in model / methodology ‐ ‐ ‐ ‐ ‐
Changes in scope (179) ‐ ‐ ‐ ‐ ‐ (179) ‐
Transfers in non-current assets held for sale and discontinued operations ‐ ‐ ‐ ‐ ‐ ‐ ‐ ‐
Other (307) ‐ (2) ‐ (1) 1 (310) 1
Total 122,444 (33) 96 ‐ 490 (381) 123,030 (414) 122,616
Changes in carrying amount due to specific accounting assessment methods (with no significant
impact on loss allowance) ³ 718 ‐ 1 719
Balance at 30 June 2020 123,162 (33) 96 ‐ 491 (381) 123,749 (414) 123,335
Contractual amount outstanding of financial assets written off during the period, that are still subject
to enforcement measures ‐ ‐ ‐ ‐
¹ Transfers to Bucket 3 correspond to outstanding amounts initially classified as Bucket 1 which, during the year, were downgraded directly to Bucket 3, or to Bucket 2 and later to Bucket 3.
² Originations in Bucket 2 could include some originated loans in Bucket 1 reclassified in Bucket 2 during the period.
³ Includes the impacts of fair value adjustments of micro-hedged instruments, the impacts relating to the use of the EIR method (notably the amortisation of premiums/discounts), the impacts of the accretion of discounts on restructured loans (recovered as revenue over the remaining term of the asset), the changes in
related receivables and in the currency impact.

Comptes consolidés du groupe Crédit Agricole S.A. – 30 June 2020
29
FINANCIAL ASSETS AT AMORTISED COST: LOANS AND RECEIVABLES DUE FROM CUSTOMERS
Performing assets
Assets subject to 12-month ECL (Bucket 1) Assets subject to lifetime ECL (Bucket 2)
Credit-impaired assets (Bucket 3) Total
(in millions of euros) Gross carrying amount Loss allowance Gross carrying amount Loss allowance Gross carrying amount Loss allowance
Gross carrying
amount (a) Loss allowance (b)
Net carrying
amount (a) + (b)
Balance at 31 december 2019 360 437 (743) 30 825 (1 277) 13 130 (7 192) 404 392 (9 212) 395 180
Transfers between buckets during the period (6 664) 28 4 842 (12) 1 822 (730) - (714)
Transfers from Bucket 1 to Bucket 2 (11 950) 67 11 950 (317) - (250)
Return to Bucket 2 from Bucket 1 6 186 (65) (6 186) 203 - - - 138
Transfers to Bucket 3 ¹ (1 007) 28 (1 146) 121 2 153 (819) - (670)
Return from Bucket 3 to Bucket 2 / Bucket 1 107 (2) 224 (19) (331) 89 - 68
Total after transfers 353 771 (717) 35 667 (1 287) 14 955 (7 922) 404 392 (9 926) 394 467
Changes in gross carrying amounts and loss allowances 19 339 (184) 1 110 (252) (1 447) 279 19 002 (156)
New financial production : purchase, granting, origination, renegociation … ² 129 115 (232) 7 319 (346) 136 434 (578)
Derecognition : disposal, repayment, maturity... (108 775) 164 (6 115) 255 (715) 260 (115 605) 679
Write-offs (704) 648 (704) 648
Changes of cash flows resulting in restructuring due to financial difficulties (1) - (6) 2 (16) 3 (23) 6
Changes in models' credit risk parameters during the period ⁵ (132) (187) (661) - (980)
Changes in model / methodology - 17 - - 17
Changes in scope 272 (3) 28 (3) 40 (27) 340 (33)
Transfers in non-current assets held for sale and discontinued operations - - - - - - - -
Other (1 272) 19 (116) 10 (52) 56 (1 440) 85
Total 373 110 (901) 36 777 (1 539) 13 508 (7 643) 423 394 (10 082) 413 312
Changes in carrying amount due to specific accounting assessment methods
(with no significant impact on loss allowance) ³ 58 (244) 228 43
Balance at 30 june 2020 ⁴ 373 168 (901) 36 533 (1 539) 13 736 (7 643) 423 437 (10 082) 413 355
Contractual amount outstanding of financial assets written off during the
period, that are still subject to enforcement measures - - - -
¹ Transfers to Bucket 3 correspond to outstanding amounts initially classified as Bucket 1 which, during the year, were downgraded directly to Bucket 3, or to Bucket 2 and later to Bucket 3. Provisionning principles by buckets are defined in the Group accounting policies and principles and in the chapter “Risk
factors – credit risk”
² Originations in Bucket 2 could include some originated loans in Bucket 1 reclassified in Bucket 2 during the period.
³ Includes the impacts of fair value adjustments of micro-hedged instruments, the impacts relating to the use of the EIR method (notably the amortisation of premiums/discounts), the impacts of the accretion of discounts on restructured loans (recovered as revenue over the remaining term of the asset), the
changes in related receivables and in the currency impact.
4 As at 30 June 2020, as part of the economic support measures enacted in response to the COVID-19 health crisis, Crédit Agricole S.A. Group granted deferred maturities on customer loans in the amount of €2,85 billion.
⁵ Bucket 3: this line corresponds to changes in the assessment of credit risk on loans that are already in default

Comptes consolidés du groupe Crédit Agricole S.A. – 30 June 2020
30
FINANCIAL ASSETS AT FAIR VALUE THROUGH OTHER COMPREHENSIVE INCOME: DEBT SECURITIES
Performing assets
Assets subject to 12-month ECL (Bucket 1) Assets subject to lifetime ECL (Bucket 2)
Credit-impaired assets (Bucket 3) Total
(in millions of euros) Carrying amount
Of which Loss
allowance Carrying amount
Of which Loss
allowance Carrying amount
Of which Loss
allowance Carrying amount
Of which Loss
allowance
Balance at 31 December 2019 256,189 (135) 2,614 (34) ‐ (4) 258,803 (173)
Transfers between buckets during the period (158) ‐ 156 (2) (2) (2)
Transfers from Bucket 1 to Bucket 2 (158) ‐ 156 (2) (2) (2)
Return to Bucket 2 from Bucket 1 ‐ ‐ ‐ ‐ ‐ ‐ ‐ ‐
Transfers to Bucket 3 ¹ ‐ ‐ ‐ ‐ ‐ ‐ ‐ ‐
Return from Bucket 3 to Bucket 2 / Bucket 1 ‐ ‐ ‐ ‐ ‐ ‐ ‐ ‐
Total after transfers 256,031 (135) 2,770 (36) ‐ (4) 258,801 (175)
Changes in gross carrying amounts and loss allowances 2,087 (98) (322) (5) ‐ ‐ 1,765 (103)
Fair value revaluation during the period 43 (37) ‐ 6
New financial production : purchase, granting, origination, renegociation … ² 24,333 (41) 5,167 (4) 29,500 (45)
Derecognition : disposal, repayment, maturity... (22,078) 11 (5,453) 1 ‐ ‐ (27,531) 12
Write-offs ‐ ‐ ‐ ‐
Changes of cash flows resulting in restructuring due to financial difficulties (3) (3) 4 4 ‐ ‐ 1 1
Changes in models' credit risk parameters during the period (65) (6) ‐ ‐ (71)
Changes in model / methodology ‐ ‐ ‐ ‐ ‐
Changes in scope ‐ ‐ ‐ ‐ ‐ ‐ ‐ ‐
Transfers in non-current assets held for sale and discontinued operations ‐ ‐ ‐ ‐ ‐ ‐ ‐ ‐
Other (208) ‐ (3) ‐ ‐ ‐ (211) ‐
Total 258,118 (233) 2,448 (41) ‐ (4) 260,566 (278)
Changes in carrying amount due to specific accounting assessment methods (with no significant impact on
loss allowance) ³ (1,274) 12 ‐ (1,262)
Balance at 30 June 2020 256,844 (233) 2,460 (41) ‐ (4) 259,304 (278)
Contractual amount outstanding of financial assets written off during the period, that are still subject to
enforcement measures ‐ ‐ ‐ ‐
¹ Transfers to Bucket 3 correspond to outstanding amounts initially classified as Bucket 1 which, during the year, were downgraded directly to Bucket 3, or to Bucket 2 and later to Bucket 3.
² Originations in Bucket 2 could include some originated loans in Bucket 1 reclassified in Bucket 2 during the period.
³ Includes the impacts of the use of the EIR method (notably the amortisation of premiums/discounts)

Comptes consolidés du groupe Crédit Agricole S.A. – 30 June 2020
31
FINANCING COMMITMENTS (EXCLUDING CRÉDIT AGRICOLE INTERNAL TRANSACTIONS)
Performing commitments
Commitments subject to 12-month ECL
(Bucket 1)
Commitments subject to lifetime ECL
(Bucket 2)
Provisioned commitments (Bucket 3) Total
(in millions of euros)
Amount of
commitment Loss allowance
Amount of
commitment Loss allowance
Amount of
commitment Loss allowance
Amount of commitment
(a) Loss allowance (b)
Net amount of
commitment (a) + (b)
Balance at 31 December 2019 148,020 (169) 5,097 (181) 481 (58) 153,598 (409) 153,189
Transfers between buckets during the period (962) (3) 927 (10) 35 (14) ‐ (27)
Transfers from Bucket 1 to Bucket 2 (1,654) 6 1,654 (42) ‐ (36)
Return to Bucket 2 from Bucket 1 703 (9) (703) 27 ‐ 18
Transfers to Bucket 3 ¹ (31) ‐ (26) 5 57 (14) ‐ (9)
Return from Bucket 3 to Bucket 2 / Bucket 1 20 ‐ 2 ‐ (22) ‐ ‐ ‐
Total after transfers 147,058 (172) 6,024 (191) 516 (72) 153,598 (436) 153,162
Changes in commitments and loss allowances 8,556 (4) (447) 42 (122) 11 7,987 49
New commitments given ² 67,150 (33) 1,547 (36) 68,697 (69)
End of commitments (61,997) 38 (1,934) 76 (212) 23 (64,143) 137
Write-offs ‐ ‐ ‐ ‐
Changes of cash flows resulting in restructuring due to financial difficulties ‐ ‐ ‐ ‐ ‐ ‐ ‐ ‐
Changes in models' credit risk parameters during the period (5) 1 (13) (17)
Changes in model / methodology ‐ ‐ ‐ ‐
Changes in scope 1,242 ‐ 8 ‐ ‐ ‐ 1,250 ‐
Other 2,161 (4) (68) 1 90 1 2,183 (2)
Balance at 30 June 2020 155,614 (176) 5,577 (149) 394 (61) 161,585 (387) 161,198
¹ Transfers to Bucket 3 correspond to outstanding amounts initially classified as Bucket 1 which, during the year, were downgraded directly to Bucket 3, or to Bucket 2 and later to Bucket 3.
² New commitments given in Bucket 2 could include some originations in Bucket 1 reclassified in Bucket 2 during the period.

Comptes consolidés du groupe Crédit Agricole S.A. – 30 June 2020
32
GUARANTEE COMMITMENTS (EXCLUDING CRÉDIT AGRICOLE INTERNAL TRANSACTIONS)
Performing commitments
Commitments subject to 12-month ECL
(Bucket 1)
Commitments subject to lifetime ECL
(Bucket 2)
Provisioned commitments (Bucket 3) Total
(in millions of euros)
Amount of
commitment Loss allowance
Amount of
commitment Loss allowance
Amount of
commitment Loss allowance
Amount of commitment
(a) Loss allowance (b)
Net amount of
commitment (a) + (b)
Balance at 31 December 2019 80,129 (48) 4,578 (112) 3,094 (339) 87,800 (498) 87,304
Transfers between buckets during the period (348) 9 82 7 267 (21) ‐ (5)
Transfers from Bucket 1 to Bucket 2 (454) 1 454 (4) ‐ (3)
Return to Bucket 2 from Bucket 1 349 (8) (349) 10 ‐ 2
Transfers to Bucket 3 ¹ (243) 16 (23) 1 267 (21) ‐ (4)
Return from Bucket 3 to Bucket 2 / Bucket 1 ‐ ‐ ‐ ‐ ‐ ‐ ‐ ‐
Total after transfers 79,781 (39) 4,660 (105) 3,361 (360) 87,802 (504) 87,298
Changes in commitments and loss allowances (4,258) (28) (454) (13) (28) 58 (4,740) 17
New commitments given ² 24,066 (26) 1,469 (22) 25,535 (48)
End of commitments (26,538) 9 (1,895) 12 (263) 107 (28,696) 128
Write-offs ‐ ‐ ‐ ‐ (3) 4 (3) 4
Changes of cash flows resulting in restructuring due to financial difficulties ‐ ‐ ‐ ‐ ‐ ‐ ‐ ‐
Changes in models' credit risk parameters during the period (11) (3) (56) ‐ (70)
Changes in model / methodology ‐ ‐ ‐ ‐ ‐
Changes in scope ‐ ‐ ‐ ‐ ‐ ‐
Other (1,786) ‐ (28) ‐ 238 3 (1,576) 3
Balance at 30 June 2020 75,523 (67) 4,206 (118) 3,333 (302) 83,062 (487) 82,575
¹ Transfers to Bucket 3 correspond to outstanding amounts initially classified as Bucket 1 which, during the year, were downgraded directly to Bucket 3, or to Bucket 2 and later to Bucket 3.
² New commitments given in Bucket 2 could include some originations in Bucket 1 reclassified in Bucket 2 during the period.

Comptes consolidés du groupe Crédit Agricole S.A. – 30 June 2020
33
3.2 Concentrations of credit risk
3.2.1 Credit risk concentrations by customer type
FINANCIAL ASSETS DESIGNATED AT FAIR VALUE THROUGH PROFIT OR LOSS BY CUSTOMER TYPE
30/06/2020 31/12/2019
Carrying
amount
Amount of changes in fair
value resulting from changes
in credit risk Carrying
amount
Amount of changes in fair
value resulting from changes
in credit risk
(in millions of euros)
During the
period Cumulative
During the period
General administration ‐ ‐ ‐ ‐ ‐ ‐
Central banks ‐ ‐ ‐ ‐ ‐ ‐
Credit institutions ‐ ‐ ‐ ‐ ‐ ‐
Large corporates 1 ‐ ‐ 1 ‐ ‐
Retail customers ‐ ‐ ‐ ‐ ‐ ‐
Total Financial assets designated
at fair value through profit or loss 1
‐ ‐
1
‐ ‐

Comptes consolidés du groupe Crédit Agricole S.A. – 30 June 2020
34
FINANCIAL ASSETS AT AMORTISED COST BY CUSTOMER TYPE (EXCLUDING CRÉDIT AGRICOLE INTERNAL TRANSACTIONS)
At 30 June 2020
Carrying amount
Performing assets
Credit-impaired
assets (Bucket 3) Total (in millions of euros)
Assets subject to 12-
month ECL (Bucket 1)
Assets subject to
lifetime ECL (Bucket 2)
General administration 48,973 409 107 49,489
Central banks 36,902 ‐ ‐ 36,902
Credit institutions 118,252 97 491 118,840
Large corporates 231,046 21,097 8,884 261,027
Retail customers 154,594 15,395 4,779 174,768
Impairment (982) (1,543) (8,046) (10,571)
TOTAL 588,785 35,455 6,215 630,455
At 31 December 2019
Carrying amount
Performing assets
Credit-impaired
assets (Bucket 3) Total (in millions of euros)
Assets subject to 12-
month ECL (Bucket 1)
Assets subject to
lifetime ECL (Bucket 2)
General administration 38,062 179 112 38,353
Central banks 26,066 ‐ ‐ 26,066
Credit institutions 96,525 27 505 97,057
Large corporates 221,511 16,933 8,421 246,865
Retail customers 154,373 14,092 4,623 173,088
Impairment (800) (1,287) (7,595) (9,682)
TOTAL 535,737 29,944 6,066 571,747
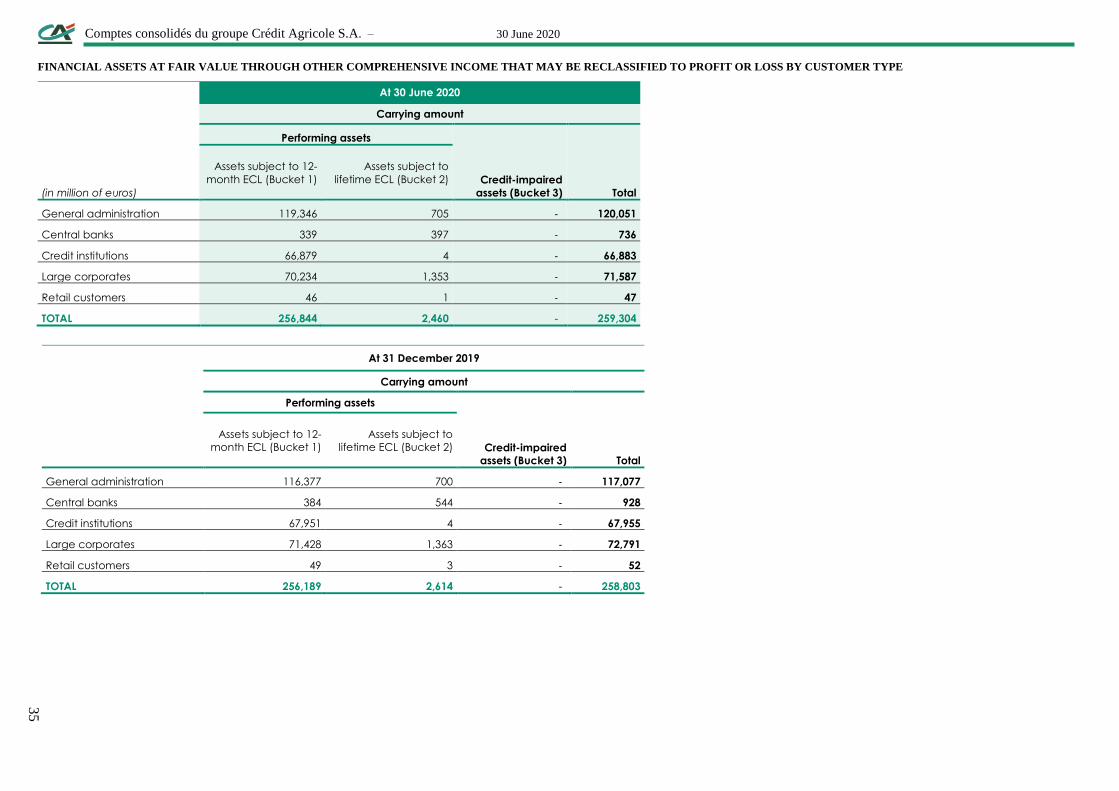
Comptes consolidés du groupe Crédit Agricole S.A. – 30 June 2020
35
FINANCIAL ASSETS AT FAIR VALUE THROUGH OTHER COMPREHENSIVE INCOME THAT MAY BE RECLASSIFIED TO PROFIT OR LOSS BY CUSTOMER TYPE
At 30 June 2020
Carrying amount
Performing assets
Credit-impaired
assets (Bucket 3) Total (in million of euros)
Assets subject to 12-
month ECL (Bucket 1)
Assets subject to
lifetime ECL (Bucket 2)
General administration 119,346 705 ‐ 120,051
Central banks 339 397 ‐ 736
Credit institutions 66,879 4 ‐ 66,883
Large corporates 70,234 1,353 ‐ 71,587
Retail customers 46 1 ‐ 47
TOTAL 256,844 2,460 ‐ 259,304
At 31 December 2019
Carrying amount
Performing assets
Credit-impaired
assets (Bucket 3) Total
Assets subject to 12-
month ECL (Bucket 1)
Assets subject to
lifetime ECL (Bucket 2)
General administration 116,377 700 ‐ 117,077
Central banks 384 544 ‐ 928
Credit institutions 67,951 4 ‐ 67,955
Large corporates 71,428 1,363 ‐ 72,791
Retail customers 49 3 ‐ 52
TOTAL 256,189 2,614 ‐ 258,803

Comptes consolidés du groupe Crédit Agricole S.A. – 30 June 2020
36
DUE TO CUSTOMERS BY CUSTOMER TYPE
(in millions of euros) 30/06/2020 31/12/2019
General administration 19,384 25,015
Large corporates 265,856 219,466
Retail customers 418,850 402,433
TOTAL AMOUNT DUE TO CUSTOMERS 704,090 646,914
FINANCING COMMITMENTS BY CUSTOMER TYPE (EXCLUDING CRÉDIT AGRICOLE INTERNAL TRANSACTIONS)
At 30 June 2020
Amount of commitment
Performing commitments
Provisioned
commitments
(Bucket 3) Total (in million of euros)
Commitments subject
to 12-month ECL
(Bucket 1)
Commitments subject
to lifetime ECL (Bucket
2)
General administration 2,485 329 17 2,831
Central banks 89 ‐ ‐ 89
Credit institutions 15,391 1 1 15,393
Large corporates 117,474 4,169 355 121,998
Retail customers 20,175 1,076 22 21,273
Provisions ¹ (177) (149) (60) (386)
TOTAL 155,437 5,426 335 161,198
¹ Expected or proven losses in respect of off-balance sheet commitments are covered by provisions recognised as
liabilities on the balance sheet.

Comptes consolidés du groupe Crédit Agricole S.A. – 30 June 2020
37
At 31 December 2019
(in million of euros)
Amount of commitment
Performing commitments
Provisioned
commitments
(Bucket 3) Total
Commitments subject
to 12-month ECL
(Bucket 1)
Commitments subject
to lifetime ECL (Bucket
2)
General administration 2,669 214 31 2,914
Central banks 94 ‐ ‐ 94
Credit institutions 12,144 ‐ 1 12,145
Large corporates 114,573 3,921 414 118,908
Retail customers 18,540 961 35 19,536
Provisions ¹ (171) (181) (58) (410)
TOTAL 147,849 4,915 423 153,187
¹Expected or proven losses in respect of off-balance sheet commitments are covered by provisions recognised as
liabilities on the balance sheet.
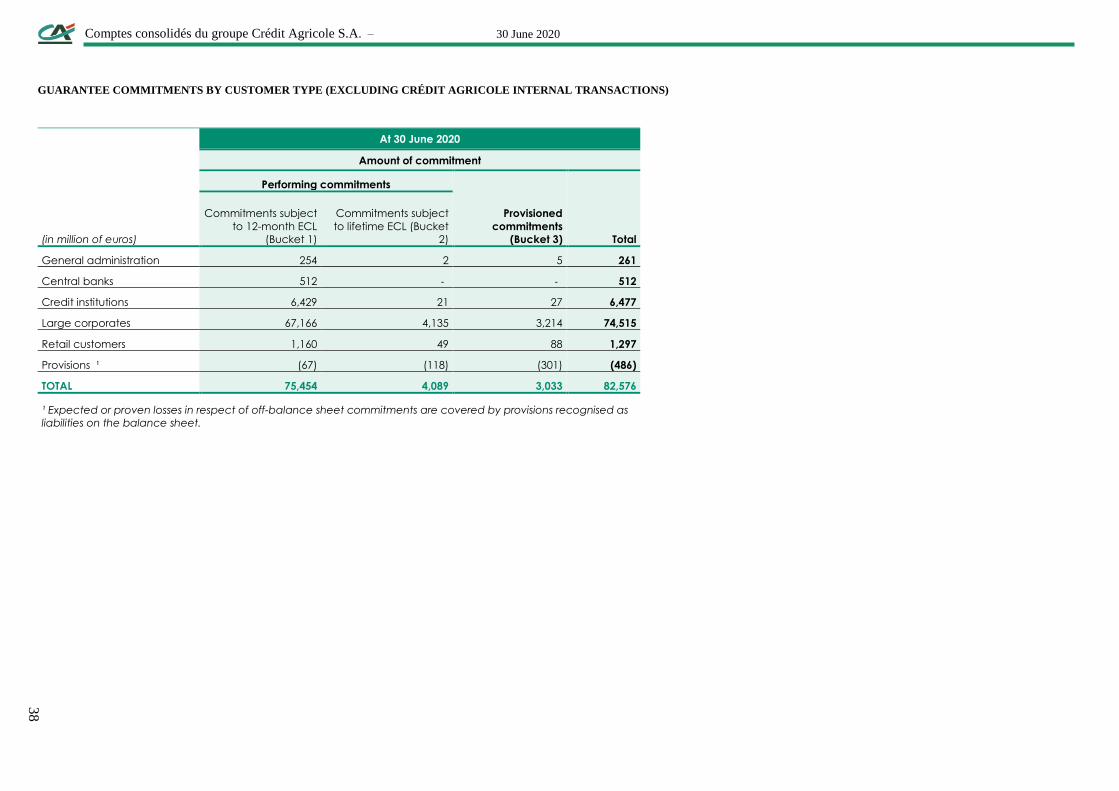
Comptes consolidés du groupe Crédit Agricole S.A. – 30 June 2020
38
GUARANTEE COMMITMENTS BY CUSTOMER TYPE (EXCLUDING CRÉDIT AGRICOLE INTERNAL TRANSACTIONS)
At 30 June 2020
(in million of euros)
Amount of commitment
Performing commitments
Provisioned
commitments
(Bucket 3) Total
Commitments subject
to 12-month ECL
(Bucket 1)
Commitments subject
to lifetime ECL (Bucket
2)
General administration 254 2 5 261
Central banks 512 ‐ ‐ 512
Credit institutions 6,429 21 27 6,477
Large corporates 67,166 4,135 3,214 74,515
Retail customers 1,160 49 88 1,297
Provisions ¹ (67) (118) (301) (486)
TOTAL 75,454 4,089 3,033 82,576
¹ Expected or proven losses in respect of off-balance sheet commitments are covered by provisions recognised as
liabilities on the balance sheet.

Comptes consolidés du groupe Crédit Agricole S.A. – 30 June 2020
39
At 31 December 2019
(in million of euros)
Amount of commitment
Performing commitments
Provisioned
commitments
(Bucket 3)
Total Commitments subject
to 12-month ECL
(Bucket 1)
Commitments subject
to lifetime ECL (Bucket
2)
General administration 291 6 ‐ 297
Central banks 511 ‐ ‐ 511
Credit institutions 7,874 28 47 7,949
Large corporates 70,393 4,504 2,964 77,861
Retail customers 1,060 41 83 1,184
Provisions ¹ (48) (113) (339) (500)
TOTAL 80,081 4,466 2,755 87,302
¹Expected or proven losses in respect of off-balance sheet commitments are covered by provisions recognised as
liabilities on the balance sheet.

Comptes consolidés du groupe Crédit Agricole S.A. – 30 June 2020
40
3.2.2 Credit risk concentrations by geographical area
FINANCIAL ASSETS AT AMORTISED COST BY GEOGRAPHICAL AREA (EXCLUDING CRÉDIT AGRICOLE INTERNAL TRANSACTIONS)
At 30 June 2020
Carrying amount
Performing assets
Credit-impaired
assets (Bucket 3) Total (in millions of euros)
Assets subject to 12-
month ECL (Bucket 1)
Assets subject to lifetime
ECL (Bucket 2)
France (including overseas
departments and territories) 314,524 19,218 4,745 338,487
Other European Union
countries 155,113 9,017 6,015 170,145
Other European countries 17,941 932 275 19,148
North America 36,341 1,688 542 38,571
Central and South America 9,465 1,364 968 11,797
Africa and Middle East 17,934 2,296 1,273 21,503
Asia-Pacific (ex. Japan) 30,885 1,692 379 32,956
Japan 5,956 791 64 6,811
Supranational organisations 1,608 ‐ ‐ 1,608
Impairment (982) (1,543) (8,046) (10,571)
TOTAL 588,785 35,455 6,215 630,455

Comptes consolidés du groupe Crédit Agricole S.A. – 30 June 2020
41
At 31 December 2019
Carrying amount
Performing assets
Credit-impaired
assets (Bucket 3) Total (in millions of euros)
Assets subject to 12-
month ECL (Bucket 1)
Assets subject to lifetime
ECL (Bucket 2)
France (including overseas
departments and territories) 273,736 15,968 4,800 294,504
Other European Union
countries 142,978 7,899 6,015 156,892
Other European countries 18,480 750 265 19,495
North America 34,898 964 392 36,254
Central and South America 9,465 1,219 692 11,376
Africa and Middle East 17,289 2,228 1,241 20,758
Asia-Pacific (ex. Japan) 31,083 1,717 256 33,056
Japan 5,938 486 ‐ 6,424
Supranational organisations 2,670 ‐ ‐ 2,670
Impairment (800) (1,287) (7,595) (9,682)
TOTAL 535,737 29,944 6,066 571,747
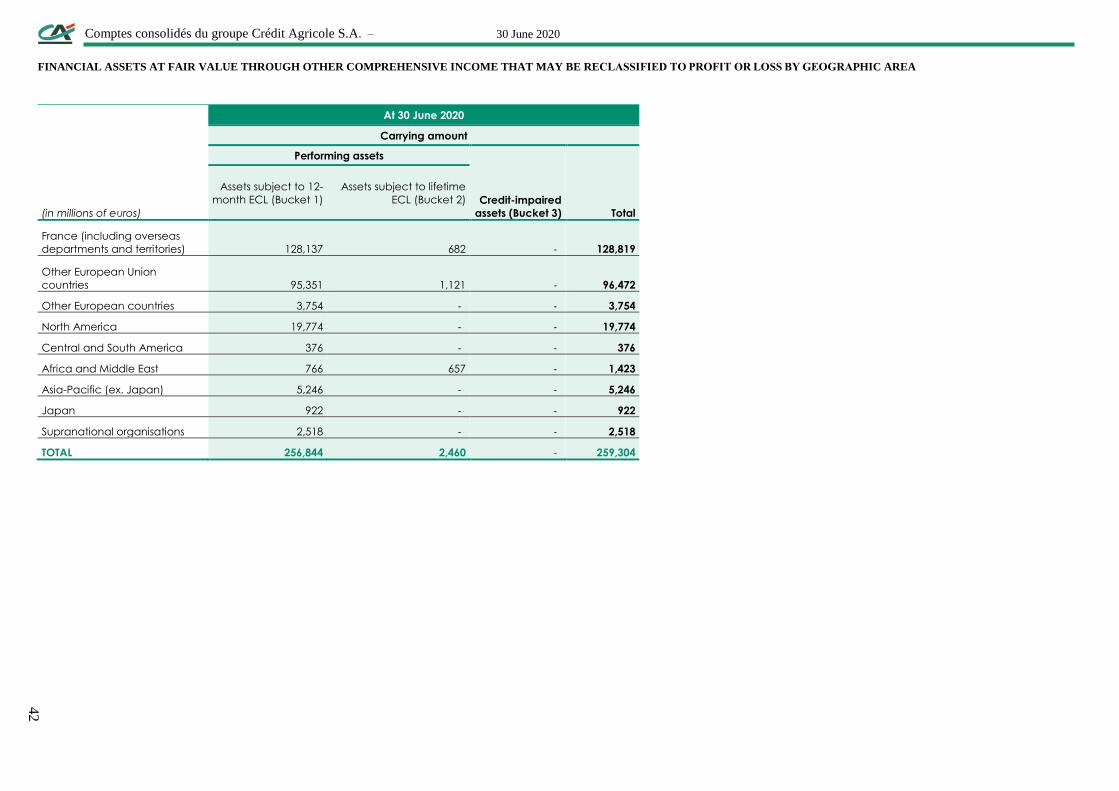
Comptes consolidés du groupe Crédit Agricole S.A. – 30 June 2020
42
FINANCIAL ASSETS AT FAIR VALUE THROUGH OTHER COMPREHENSIVE INCOME THAT MAY BE RECLASSIFIED TO PROFIT OR LOSS BY GEOGRAPHIC AREA
At 30 June 2020
Carrying amount
Performing assets
Credit-impaired
assets (Bucket 3) Total (in millions of euros)
Assets subject to 12-
month ECL (Bucket 1)
Assets subject to lifetime
ECL (Bucket 2)
France (including overseas
departments and territories) 128,137 682 ‐ 128,819
Other European Union
countries 95,351 1,121 ‐ 96,472
Other European countries 3,754 ‐ ‐ 3,754
North America 19,774 ‐ ‐ 19,774
Central and South America 376 ‐ ‐ 376
Africa and Middle East 766 657 ‐ 1,423
Asia-Pacific (ex. Japan) 5,246 ‐ ‐ 5,246
Japan 922 ‐ ‐ 922
Supranational organisations 2,518 ‐ ‐ 2,518
TOTAL 256,844 2,460 ‐ 259,304

Comptes consolidés du groupe Crédit Agricole S.A. – 30 June 2020
43
At 31 December 2019
Carrying amount
Performing assets
Credit-impaired
assets (Bucket 3) Total (in millions of euros)
Assets subject to 12-
month ECL (Bucket 1)
Assets subject to lifetime
ECL (Bucket 2)
France (including overseas
departments and territories) 127,049 893 ‐ 127,942
Other European Union
countries 96,721 917 ‐ 97,638
Other European countries 4,055 ‐ ‐ 4,055
North America 18,695 ‐ ‐ 18,695
Central and South America 333 ‐ ‐ 333
Africa and Middle East 546 804 ‐ 1,350
Asia-Pacific (ex. Japan) 5,522 ‐ ‐ 5,522
Japan 634 ‐ ‐ 634
Supranational organisations 2,634 ‐ ‐ 2,634
TOTAL 256,189 2,614 ‐ 258,803
LIABILITIES TO CUSTOMERS BY GEOGRAPHIC AREA
(in millions of euros) 30/06/2020 31/12/2019
France (including overseas departments and territories) 485,348 442,439
Other European Union countries 134,801 127,097
Other European countries 15,284 14,387
North America 17,755 14,448
Central and South America 4,992 4,435
Africa and Middle East 14,530 17,939
Asia-Pacific (ex. Japan) 15,760 12,889
Japan 15,615 13,271
Supranational organisations 5 9
TOTAL AMOUNT DUE TO CUSTOMERS 704,090 646,914

Comptes consolidés du groupe Crédit Agricole S.A. – 30 June 2020
44
FINANCING COMMITMENTS BY GEOGRAPHICAL AREA (EXCLUDING CRÉDIT AGRICOLE INTERNAL TRANSACTIONS)
At 30 June 2020
(in millions of euros)
Amount of commitment
Performing commitments
Provisioned
commitments
(Bucket 3) Total
Commitments
subject to 12-month
ECL (Bucket 1)
Commitments subject to
lifetime ECL (Bucket 2)
France (including overseas
departments and territories) 66,542 2,432 90 69,064
Other European Union
countries 45,551 1,373 107 47,031
Other European countries 6,598 139 67 6,804
North America 22,457 1,290 16 23,763
Central and South America 2,806 14 93 2,913
Africa and Middle East 5,273 302 1 5,576
Asia-Pacific (ex. Japan) 5,447 25 21 5,493
Japan 940 ‐ ‐ 940
Supranational organisations ‐ ‐ ‐ ‐
Provisions ¹ (177) (149) (60) (386)
TOTAL 155,437 5,426 335 161,198
¹ Expected or proven losses in respect of off-balance sheet commitments are covered by provisions recognised as
liabilities on the balance sheet.

Comptes consolidés du groupe Crédit Agricole S.A. – 30 June 2020
45
At 31 December 2019
(in millions of euros)
Amount of commitment
Performing commitments
Provisioned
commitments
(Bucket 3) Total
Commitments
subject to 12-month
ECL (Bucket 1)
Commitments subject to
lifetime ECL (Bucket 2)
France (including overseas
departments and territories) 57,698 1,912 152 59,763
Other European Union
countries 41,492 1,493 163 43,148
Other European countries 6,565 172 69 6,806
North America 26,025 1,102 80 27,207
Central and South America 3,391 63 17 3,471
Africa and Middle East 5,323 240 ‐ 5,563
Asia-Pacific (ex. Japan) 6,566 85 ‐ 6,651
Japan 959 29 ‐ 988
Supranational organisations ‐ ‐ ‐ ‐
Provisions ¹ (171) (181) (58) (410)
TOTAL 147,849 4,915 423 153,187
¹ Expected or proven losses in respect of off-balance sheet commitments are covered by provisions recognised as
liabilities on the balance sheet.

Comptes consolidés du groupe Crédit Agricole S.A. – 30 June 2020
46
GUARANTEE COMMITMENTS BY GEOGRAPHICAL AREA (EXCLUDING CRÉDIT AGRICOLE INTERNAL TRANSACTIONS)
At 30 June 2020
(in millions of euros)
Amount of commitment
Performing commitments
Provisioned
commitments
(Bucket 3) Total
Commitments
subject to 12-month
ECL (Bucket 1)
Commitments subject to
lifetime ECL (Bucket 2)
France (including overseas
departments and territories) 32,732 960 597 34,289
Other European Union
countries 15,899 1,490 2,335 19,724
Other European countries 3,463 34 ‐ 3,497
North America 10,870 1,285 326 12,481
Central and South America 1,337 1 20 1,358
Africa and Middle East 2,594 86 56 2,736
Asia-Pacific (ex. Japan) 6,338 288 ‐ 6,626
Japan 2,288 63 ‐ 2,351
Supranational organisations ‐ ‐ ‐ ‐
Provisions ¹ (67) (118) (301) (486)
TOTAL 75,454 4,089 3,033 82,576
¹ Expected or proven losses in respect of off-balance sheet commitments are covered by provisions recognised as
liabilities on the balance sheet.

Comptes consolidés du groupe Crédit Agricole S.A. – 30 June 2020
47
At 31 December 2019
(in millions of euros)
Amount of commitment
Performing commitments
Provisioned
commitments
(Bucket 3) Total
Commitments
subject to 12-month
ECL (Bucket 1)
Commitments subject to
lifetime ECL (Bucket 2)
France (including overseas
departments and territories) 35,531 1,133 459 37,123
Other European Union
countries 16,054 1,626 2,132 19,814
Other European countries 4,346 697 ‐ 5,044
North America 10,243 635 397 11,275
Central and South America 1,059 1 29 1,089
Africa and Middle East 3,318 66 76 3,461
Asia-Pacific (ex. Japan) 6,732 235 ‐ 6,966
Japan 2,845 185 ‐ 3,031
Supranational organisations ‐ ‐ ‐ ‐
Provisions ¹ (47) (113) (339) (500)
TOTAL 80,082 4,466 2,755 87,302
¹ Expected or proven losses in respect of off-balance sheet commitments are covered by provisions recognised as
liabilities on the balance sheet.

Comptes consolidés du groupe Crédit Agricole S.A. – 30 June 2020
48
NOTE 4 Notes on net income and other comprehensive income
4.1 Interest income and expenses
(in millions of euros) 30/06/2020 31/12/2019 30/06/2019
On financial assets at amortised cost 8,203 17,407 9,173
Interbank transactions 796 1,702 1,015
Crédit Agricole internal transactions 1,381 2,877 1,463
Customer transactions 5,344 11,429 5,757
Finance leases 337 610 517
Debt securities 345 789 421
On financial assets recognised at fair value through other comprehensive income 2,642 5,312 2,721
Interbank transactions ‐ ‐ ‐
Customer transactions ‐ ‐ ‐
Debt securities 2,642 5,312 2,721
Accrued interest receivable on hedging instruments 1,467 2,351 1,077
Other interest income 28 37 22
INTEREST AND SIMILAR INCOME ¹ ¹ 12,340 25,107 12,993
On financial liabilities at amortised cost (6,009) (12,706) (6,743)
Interbank transactions (663) (1,376) (801)
Crédit Agricole internal transactions (530) (1,008) (493)
Customer transactions (2,513) (6,016) (3,083)
Finance leases (88) (68) (246)
Debt securities (1,972) (3,605) (1,779)
Subordinated debt (243) (633) (341)
Accrued interest receivable on hedging instruments (583) (872) (462)
Other interest expenses (37) (85) (50)
INTEREST AND SIMILAR EXPENSES (6,629) (13,663) (7,255)
¹ of which €94 million in impaired loans (Bucket 3) as at 30 June 2020, compared with €136 million as at 31 December
2019 and €80 million as at 30 June 2019.
² of which interest received under the ECB’s TLTRO III facility

Comptes consolidés du groupe Crédit Agricole S.A. – 30 June 2020
49
4.2 Fees and commissions income and expense
30/06/2020 31/12/2019 30/06/2019
(in millions of euros) Income Expense Net Income Expense Net Income Expense Net
Interbank transactions 118 (29) 89 261 (43) 218 143 (22) 121
Crédit Agricole internal transactions 459 (201) 258 803 (477) 326 373 (260) 113
Customer transactions 637 (126) 511 1,763 (211) 1,552 907 (101) 806
Securities transactions 31 (62) (31) 49 (99) (50) 20 (48) (28)
Foreign exchange transactions 22 (23) (1) 41 (44) (3) 21 (24) (3)
Derivative instruments and other off-balance
sheet items 212 (130) 82 342 (249) 93 381 (341) 40
Payment instruments and other banking and
financial services 1,460 (2,012) (552) 2,506 (3,762) (1,256) 1,200 (1,818) (618)
Mutual funds management, fiduciary and similar
operations 2,308 (685) 1,623 4,792 (1,616) 3,176 2,303 (943) 1,360
TOTAL FEES AND COMMISSIONS INCOME AND
EXPENSE 5,247 (3,268) 1,979 10,556 (6,500) 4,057 5,348 (3,557) 1,791
Large customers and Retail banking (French and International) are the main contributors of the commission income
from the Savings Management and Insurance and Specialized Financial Services businesses.
Commission income from managing Mutual funds, trusts and similar activities are mainly related to savings and insurance
management activities.
4.3 Net gains (losses) on financial instruments at fair value through profit or loss
(in millions of euros) 30/06/2020 31/12/2019 30/06/2019
Dividends received 546 1,505 1,042
Unrealised or realised gains (losses) on held for trading assets/liabilities 2,137 3,878 1,979
Unrealised or realised gains (losses) on equity instruments at fair value through profit or
loss (3,586) 3,462 1,643
Unrealised or realised gains (losses) on debt instruments that do not meet the conditions
of the “SPPI” test (933) 2,860 2,079
Net gains (losses) on assets backing unit-linked contracts (2,778) 6,440 4,029
Unrealised or realised gains (losses) on assets/liabilities designated at fair value through
profit or loss ¹ (46) (1,771) (525)
Net gains (losses) on Foreign exchange transactions and similar financial instruments
(excluding gains or losses on hedges of net investments in foreign operations) (883) 713 232
Gains (losses) from hedge accounting (14) (6) 7
NET GAINS (LOSSES) ON FINANCIAL INSTRUMENTS AT FAIR VALUE THROUGH PROFIT OR
LOSS (5,557) 17,082 10,487
¹ Except spread of issuer loan for liabilities at fair value through equity non-recyclable

Comptes consolidés du groupe Crédit Agricole S.A. – 30 June 2020
50
Analysis of net gains (losses) from hedge accounting:
(in millions of euros)
30/06/2020
Gains Losses Net
Fair value hedges 4,767 (4,778) (11)
Changes in fair value of hedged items attributable to hedged risks 1,575 (2,930) (1,355)
Changes in fair value of hedging derivatives (including termination of hedges) 3,192 (1,848) 1,344
Cash flow hedges ‐ ‐ ‐
Changes in fair value of hedging derivatives - ineffective portion ‐ ‐ ‐
Hedges of net investments in foreign operations ‐ ‐ ‐
Changes in fair value of hedging derivatives - ineffective portion ‐ ‐ ‐
Fair value hedges of the interest rate exposure of a portfolio of financial
instruments 6,132 (6,135) (3)
Changes in fair value of hedged items 2,938 (3,240) (302)
Changes in fair value of hedging derivatives 3,194 (2,895) 299
Cash flow hedges of the interest rate exposure of a portfolio of financial
instruments ‐ ‐ ‐
Changes in fair value of hedging instrument - ineffective portion ‐ ‐ ‐
TOTAL GAINS (LOSSES) FROM HEDGE ACCOUNTING 10,899 (10,913) (14)
(in millions of euros)
31/12/2019
Gains Losses Net
Fair value hedges 6,362 (6,363) (1)
Changes in fair value of hedged items attributable to hedged risks 2,283 (4,151) (1,868)
Changes in fair value of hedging derivatives (including termination of hedges) 4,079 (2,212) 1,867
Cash flow hedges ‐ ‐ ‐
Changes in fair value of hedging derivatives - ineffective portion ‐ ‐ ‐
Hedges of net investments in foreign operations ‐ ‐ ‐
Changes in fair value of hedging derivatives - ineffective portion ‐ ‐ ‐
Fair value hedges of the interest rate exposure of a portfolio of financial
instruments 10,837 (10,842) (5)
Changes in fair value of hedged items 4,401 (6,316) (1,915)
Changes in fair value of hedging derivatives 6,436 (4,526) 1,910
Cash flow hedges of the interest rate exposure of a portfolio of financial
instruments ‐ ‐ ‐
Changes in fair value of hedging instrument - ineffective portion ‐ ‐ ‐
TOTAL GAINS (LOSSES) FROM HEDGE ACCOUNTING 17,199 (17,205) (6)

Comptes consolidés du groupe Crédit Agricole S.A. – 30 June 2020
51
(in millions of euros)
30/06/2019
Gains Losses Net
Fair value hedges 6,504 (6,499) 5
Changes in fair value of hedged items attributable to hedged risks 2,304 (4,144) (1,840)
Changes in fair value of hedging derivatives (including termination of hedges) 4,200 (2,355) 1,845
Cash flow hedges ‐ ‐ ‐
Changes in fair value of hedging derivatives - ineffective portion ‐ ‐ ‐
Hedges of net investments in foreign operations ‐ ‐ ‐
Changes in fair value of hedging derivatives - ineffective portion ‐ ‐ ‐
Fair value hedges of the interest rate exposure of a portfolio of financial
instruments 11,863 (11,861) 2
Changes in fair value of hedged items 4,905 (6,835) (1,930)
Changes in fair value of hedging derivatives 6,958 (5,026) 1,932
Cash flow hedges of the interest rate exposure of a portfolio of financial
instruments ‐ ‐ ‐
Changes in fair value of hedging instrument - ineffective portion ‐ ‐ ‐
TOTAL GAINS (LOSSES) FROM HEDGE ACCOUNTING 18,367 (18,360) 7
4.4 Net gains (losses) on financial instruments at fair value through other comprehensive income
(in millions of euros) 30/06/2020 31/12/2019 30/06/2019
Net gains (losses) on debt instruments at fair value through other comprehensive income that may be
reclassified subsequently to profit or loss ¹ 287 47 42
Remuneration of equity instruments measured at fair value through other comprehensive income that will
not be reclassified subsequently to profit or loss (dividends) ² 50 115 71
NET GAINS (LOSSES) ON FINANCIAL INSTRUMENTS AT FAIR VALUE THROUGH OTHER COMPREHENSIVE INCOME 337 162 113
¹ Excluding realised gains or losses from impaired debt instruments (Bucket 3) mentioned in Note 4.9 “Cost of risk”
² No dividends were paid on equity instruments at fair value through non-recyclable equity derecognised during the
period
4.5 Net gains (losses) from the derecognition of financial assets at amortised cost
(in millions of euros) 30/06/2020 31/12/2019 30/06/2019
Debt securities 5 8 3
Loans and receivables due from credit institutions ‐ ‐ ‐
Loans and receivables due from customers ‐ 1 ‐
Gains arising from the derecognition of financial assets at amortised cost 5 9 3
Debt securities (1) (1) ‐
Loans and receivables due from credit institutions ‐ ‐ ‐
Loans and receivables due from customers (1) (17) (1)
Losses arising from the derecognition of financial assets at amortised cost (2) (18) (1)
NET GAINS (LOSSES) ARISING FROM THE DERECOGNITION OF FINANCIAL ASSETS AT AMORTISED COST ¹ 3 (9) 2
¹ Excluding realised gains or losses from the derecognition of impaired debt instruments (Bucket 3) mentioned in
Note 4.9 "Cost of risk"

Comptes consolidés du groupe Crédit Agricole S.A. – 30 June 2020
52
4.6 Net income (expenses) on other activities
(in millions of euros) 30/06/2020 31/12/2019 30/06/2019
Gains (losses) on fixed assets not used in operations (5) (15) (14)
Other net income from insurance activities 2,657 13,800 8,362
Change in insurance technical reserves 4,471 (26,163) (16,395)
Net income from investment property 92 140 111
Other net income (expense) (18) 100 57
INCOME (EXPENSE) RELATED TO OTHER ACTIVITIES 7,197 (12,139) (7,879)
4.7 Operating expenses
(in millions of euros) 30/06/2020 31/12/2019 30/06/2019
Employee expenses (3,573) (7,147) (3,554)
Taxes other than on income or payroll-related and regulatory contributions ¹ (735) (816) (603)
External services and other operating expenses (1,832) (3,749) (1,823)
OPERATING EXPENSES (6,140) (11,713) (5,980)
¹ Of which -€439 million was recognised in respect of the Single Resolution Fund as at 30 June 2020 and -€337 million
as at 30 June 2019.
4.8 Depreciation, amortisation and impairment of property, plant & equipment and intangible
assets
(in millions of euros) 30/06/2020 31/12/2019 30/06/2019
Depreciation and amortisation (531) (1,047) (494)
Property, plant and equipment ¹ (343) (678) (321)
Intangible assets (188) (369) (173)
Impairment losses (reversals) (2) (1) ‐
Property, plant and equipment ‐ (1) ‐
Intangible assets (2) ‐ ‐
DEPRECIATION, AMORTISATION AND IMPAIRMENT OF PROPERTY, PLANT & EQUIPMENT AND INTANGIBLE
ASSETS (533) (1,048) (494)
¹ Of which -€163 million was recognised in relation to the impairment of the rights of use as at 30 June 2020, -€307
million as at 31 December 2019 and -€145 million as at 30 June 2019.

Comptes consolidés du groupe Crédit Agricole S.A. – 30 June 2020
53
4.9 Cost of risk
(in millions of euros) 30/06/2020 31/12/2019 30/06/2019
Charges net of reversals to impairments on performing assets (Bucket 1 or Bucket 2) (A) (460) 216 25
Bucket 1 : Loss allowance measured at an amount equal to 12-month expected credit loss (220) 24 4
Debt instruments at fair value through other comprehensive income that may be reclassified to
profit or loss (13) (1) 1
Debt instruments at amortised cost (186) 24 (7)
Commitments by signature (21) 1 10
Bucket 2 : Loss allowance measured at an amount equal to lifetime expected credit loss (240) 192 21
Debt instruments at fair value through other comprehensive income that may be reclassified to
profit or loss (2) (1) ‐
Debt instruments at amortised cost (263) 129 17
Commitments by signature 25 64 4
Charges net of reversals to impairments on credit-impaired assets (Bucket 3) (B) (1,023) (1,326) (534)
Debt instruments at fair value through other comprehensive income that may be reclassified to
profit or loss ‐ ‐ ‐
Debt instruments at amortised cost (1,052) (1,195) (527)
Commitments by signature 29 (131) (7)
Other assets (C) (10) (164) (7)
Risks and expenses (D) (10) (15) (13)
Charges net of reversals to impairment losses and provisions (E) =(A)+(B)+(C)+(D) (1,503) (1,289) (529)
Realised gains (losses) on disposal of impaired debt instruments at fair value through other
comprehensive income that may be reclassified to profit or loss ‐ ‐ ‐
Realised gains (losses) on impaired debt instruments at amortised cost ‐ ‐ ‐
Losses on non-impaired loans and bad debt (96) (223) (101)
Recoveries on loans and receivables written off 101 345 104
recognised at amortised cost 101 345 104
recognised in other comprehensive income that may be reclassified to profit or loss ‐ ‐ ‐
Discounts on restructured loans (31) (29) (16)
Losses on commitments by signature ‐ ‐ ‐
Other losses (21) (74) (40)
Other gains ¹ 87 14 ‐
COST OF RISK (1,463) (1,256) (582)
¹ Of which €65 million relates to the call for Insurance Switch guarantees, received (or to be received) from Regional Banks to offset the decline in the
overall equity-accounted value of Crédit Agricole S.A.’s equity investments in Crédit Agricole Assurances (CAA), with the latter being equity-accounted
for regulatory reasons.
4.10 Net gains (losses) on other assets
(in millions of euros) 30/06/2020 31/12/2019 30/06/2019
Property, plant & equipment and intangible assets used in operations 75 51 12
Gains on disposals 77 59 16
Losses on disposals (2) (8) (4)
Consolidated equity investments (1) 22 10
Gains on disposals 9 25 10
Losses on disposals (10) (3) ‐
Net income (expense) on combinations 13 (19) ‐
NET GAINS (LOSSES) ON OTHER ASSETS 87 54 22

Comptes consolidés du groupe Crédit Agricole S.A. – 30 June 2020
54
4.11 Income tax charge
The effective tax rate for the first half of 2020 was 16.9%, based on pre-tax income of €2,048 million (before share
of net income of equity-accounted entities, impairment of goodwill and net income of discontinued operations)
compared to 7.4% (24.6% excluding Emporiki tax product) as at 31 December 2019 and 29.6% as at 30 June 2019.

Comptes consolidés du groupe Crédit Agricole S.A. – 30 June 2020
55
4.12 Changes in other comprehensive income
The breakdown of income and expenses recognised for the period is presented below:
BREAKDOWN OF TOTAL OTHER COMPREHENSIVE INCOME
(in millions of euros) 30/06/2020 31/12/2019 30/06/2019
Other comprehensive income on items that may be reclassified subsequently to
profit or loss net of income tax
Gains and losses on translation adjustments (118) 301 72
Revaluation adjustment of the period (118) 301 72
Reclassified to profit or loss ‐ ‐ ‐
Other changes ‐ ‐ ‐
Other comprehensive income on debt instruments that may be reclassified to
profit or loss (198) 1,189 1,482
Revaluation adjustment of the period (228) 1,181 1,488
Reclassified to profit or loss (73) (38) (20)
Other changes 103 46 14
Gains and losses on hedging derivative instruments 539 361 504
Revaluation adjustment of the period 542 364 507
Reclassified to profit or loss ‐ ‐ ‐
Other changes (3) (3) (3)
Reclassification of net gains (losses) of designated financial assets applying the
overlay approach (427) 434 241
Revaluation adjustment of the period (427) 445 248
Reclassified to profit or loss ‐ ‐ ‐
Other changes ‐ (11) (7)
Pre-tax other comprehensive income on items that may be reclassified to profit
or loss on equity-accounted entities (120) 9 ‐
Income tax related to items that may be reclassified to profit or loss excluding
equity-accounted entities (138) (481) (624)
Income tax related to items that may be reclassified to profit or loss on equity-
accounted entities 1 1 2
Other comprehensive income on items that may be reclassified to profit or loss
from discontinued operations ‐ (12) (12)
Other comprehensive income on items that may be reclassified subsequently to
profit or loss net of income tax (461) 1,802 1,665
Other comprehensive income on items that will not be reclassified subsequently
to profit or loss net of income tax
Actuarial gains and losses on post-employment benefits 40 (162) (124)
Other comprehensive income on financial liabilities attributable to changes in
own credit risk 91 (74) (51)
Revaluation adjustment of the period 91 (86) (55)
Reclassified to reserves ‐ 12 4
Other changes ‐ ‐ ‐
Other comprehensive income on equity instruments that will not be reclassified to
profit or loss (129) 53 86
Revaluation adjustment of the period (129) 77 147
Reclassified to reserves 1 20 (15)
Other changes (1) (44) (46)
Pre-tax other comprehensive income on items that will not be reclassified to
profit or loss on equity-accounted entities 7 (30) (2)
Income tax related to items that will not be reclassified to profit or loss excluding
equity-accounted entities 11 71 79
Income tax related to items that will not be reclassified to profit or loss on equity-
accounted entities (4) 8 2
Other comprehensive income on items that will not be reclassified to profit or loss
from discontinued operations ‐ 3 3
Other comprehensive income on items that will not be reclassified subsequently
to profit or loss net of income tax 16 (131) (7)
OTHER COMPREHENSIVE INCOME NET OF INCOME TAX (445) 1,671 1,658
Of which Group share (387) 1,620 1,641
Of which non-controlling interests (58) 51 17

Comptes consolidés du groupe Crédit Agricole S.A. – 30 June 2020
56
BREAKDOWN OF TAX IMPACTS RELATED TO OTHER COMPREHENSIVE INCOME
31/12/2019 Changes 30/06/2020
(in millions of euros) Gross
Income tax
charges
Net of income
tax
Net of income
tax
of which
Group Share
Gross
Income tax
charges
Net of income
tax
Net of income
tax
of which
Group Share
Gross
Income tax
charges
Net of income
tax
Net of income
tax
of which
Group Share Other comprehensive income on items that may be reclassified
subsequently to profit or loss
Gains and losses on translation adjustments 57 (4) 53 117 (118) ‐ (118) (107) (61) (4) (65) 10
Gains and losses on debt instruments at fair value through other
comprehensive income that may be reclassified to profit or loss 3,666 (954) 2,712 2,699 (198) 60 (138) (133) 3,468 (894) 2,574 2,566
Gains and losses on hedging derivative instruments 848 (259) 589 582 539 (115) 424 417 1,387 (374) 1,013 999
Reclassification of net gains (losses) of designated financial assets applying
the overlay approach 587 87 674 674 (427) (83) (510) (510) 160 4 164 164
Other comprehensive income on items that may be reclassified to profit or
loss excluding equity-accounted entities 5,158 (1,130) 4,028 4,072 (204) (138) (342) (333) 4,954 (1,268) 3,686 3,739
Other comprehensive income on items that may be reclassified to profit or
loss on equity-accounted entities (13) 2 (11) (8) (121) 1 (120) (89) (134) 3 (131) (97)
Other comprehensive income on items that may be reclassified to profit or
loss on equity-accounted entities on discontinued operations ‐ (1) (1) (1) ‐ 1 1 1 ‐ ‐ ‐ ‐
Other comprehensive income on items that may be reclassified
subsequently to profit or loss 5,145 (1,129) 4,016 4,063 (325) (136) (461) (421) 4,820 (1,265) 3,555 3,642
Other comprehensive income on items that will not be reclassified
subsequently to profit or loss
Actuarial gains and losses on post-employment benefits (863) 193 (670) (624) 40 (12) 28 28 (823) 181 (642) (596)
Other comprehensive income on financial liabilities attributable to changes
in own credit risk (214) 57 (157) (153) 91 (27) 64 61 (123) 30 (93) (92)
Other comprehensive income on equity instruments that will not be
reclassified to profit or loss (309) (45) (354) (381) (129) 50 (79) (58) (438) 5 (433) (439)
Other comprehensive income on items that will not be reclassified to profit or
loss excluding equity-accounted entities (1,386) 205 (1,181) (1,158) 2 11 13 31 (1,384) 216 (1,168) (1,127)
Other comprehensive income on items that will not be reclassified to profit or
loss on equity-accounted entities (57) (7) (63) (62) 8 (4) 4 3 (49) (11) (60) (59)
Other comprehensive income on items that will not be reclassified to profit or
loss from discontinued operations 1 ‐ 1 ‐ ‐ ‐ ‐ ‐ 1 ‐ 1 ‐
Other comprehensive income on items that will not be reclassified
subsequently to profit or loss (1,442) 198 (1,243) (1,220) 10 7 17 34 (1,432) 205 (1,227) (1,186)
OTHER COMPREHENSIVE INCOME 3,703 (931) 2,773 2,843 (315) (129) (444) (387) 3,388 (1,060) 2,328 2,456
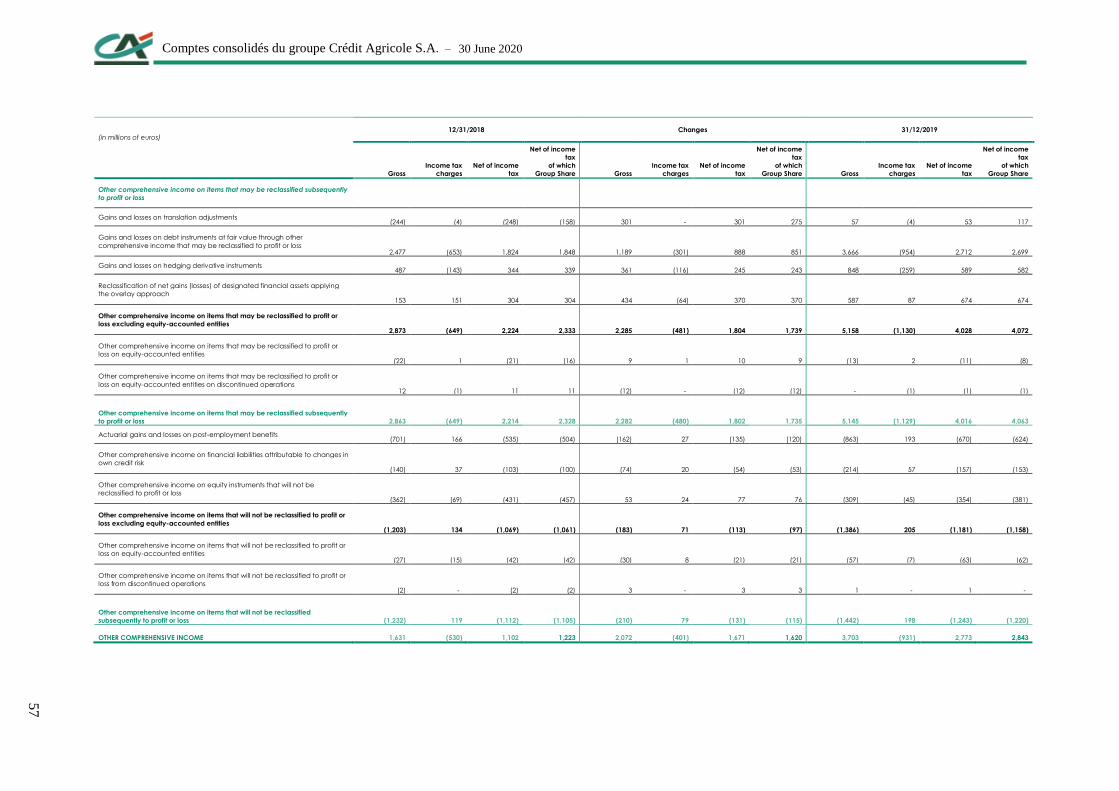
Comptes consolidés du groupe Crédit Agricole S.A. – 30 June 2020
57
(in millions of euros) 12/31/2018 Changes 31/12/2019
Gross
Income tax
charges
Net of income
tax
Net of income
tax
of which
Group Share Gross
Income tax
charges
Net of income
tax
Net of income
tax
of which
Group Share Gross
Income tax
charges
Net of income
tax
Net of income
tax
of which
Group Share
Other comprehensive income on items that may be reclassified subsequently
to profit or loss
Gains and losses on translation adjustments (244) (4) (248) (158) 301 ‐ 301 275 57 (4) 53 117
Gains and losses on debt instruments at fair value through other
comprehensive income that may be reclassified to profit or loss 2,477 (653) 1,824 1,848 1,189 (301) 888 851 3,666 (954) 2,712 2,699
Gains and losses on hedging derivative instruments 487 (143) 344 339 361 (116) 245 243 848 (259) 589 582
Reclassification of net gains (losses) of designated financial assets applying
the overlay approach 153 151 304 304 434 (64) 370 370 587 87 674 674
Other comprehensive income on items that may be reclassified to profit or
loss excluding equity-accounted entities 2,873 (649) 2,224 2,333 2,285 (481) 1,804 1,739 5,158 (1,130) 4,028 4,072
Other comprehensive income on items that may be reclassified to profit or
loss on equity-accounted entities (22) 1 (21) (16) 9 1 10 9 (13) 2 (11) (8)
Other comprehensive income on items that may be reclassified to profit or
loss on equity-accounted entities on discontinued operations 12 (1) 11 11 (12) ‐ (12) (12) ‐ (1) (1) (1)
Other comprehensive income on items that may be reclassified subsequently
to profit or loss 2,863 (649) 2,214 2,328 2,282 (480) 1,802 1,735 5,145 (1,129) 4,016 4,063
Actuarial gains and losses on post-employment benefits (701) 166 (535) (504) (162) 27 (135) (120) (863) 193 (670) (624)
Other comprehensive income on financial liabilities attributable to changes in
own credit risk (140) 37 (103) (100) (74) 20 (54) (53) (214) 57 (157) (153)
Other comprehensive income on equity instruments that will not be
reclassified to profit or loss (362) (69) (431) (457) 53 24 77 76 (309) (45) (354) (381)
Other comprehensive income on items that will not be reclassified to profit or
loss excluding equity-accounted entities (1,203) 134 (1,069) (1,061) (183) 71 (113) (97) (1,386) 205 (1,181) (1,158)
Other comprehensive income on items that will not be reclassified to profit or
loss on equity-accounted entities (27) (15) (42) (42) (30) 8 (21) (21) (57) (7) (63) (62)
Other comprehensive income on items that will not be reclassified to profit or
loss from discontinued operations (2) ‐ (2) (2) 3 ‐ 3 3 1 ‐ 1 ‐
Other comprehensive income on items that will not be reclassified
subsequently to profit or loss (1,232) 119 (1,112) (1,105) (210) 79 (131) (115) (1,442) 198 (1,243) (1,220)
OTHER COMPREHENSIVE INCOME 1,631 (530) 1,102 1,223 2,072 (401) 1,671 1,620 3,703 (931) 2,773 2,843

Comptes consolidés du groupe Crédit Agricole S.A. – 30 June 2020
58
NOTE 5 Segment reporting
DEFINITION OF OPERATING SEGMENTS
According to IFRS 8, information disclosed is based on the internal reporting that is used by
the Executive Committee to manage Crédit Agricole S.A., to assess performance, and to make
decisions about resources to be allocated to the identified operating segments.
Operating segments according to the internal reporting consist of the business lines of the
Group.
As at 30 June 2020, Crédit Agricole S.A.’s business activities were organised into six operating
segments:
the following five business lines:
Savings Management and Insurance,
French Retail banking – LCL,
International Retail banking,
Specialised financial services,
Large Customers,
as well as the “Corporate Centre” business line.
PRESENTATION OF BUSINESS LINE
1. Savings Management and Insurance
This business line brings together:
insurance activities (savings solutions and property and casualty insurance):
life insurance and personal insurance, conducted mainly by Predica in France and CA
Vita in Italy,
property & casualty insurance, conducted primarily by Pacifica,
creditor insurance, conducted by Crédit Agricole Creditor Insurance and group
insurance conducted mainly by Predica in France;
asset management activities of the Amundi Group, offering savings solutions for retail
clients and investment solutions for institutionals;
as well as wealth management activities conducted mainly by Crédit Agricole Indosuez
Wealth Management subsidiaries (CA Indosuez Switzerland S.A. CA Indosuez Wealth
Europe, CFM Indosuez Wealth, CA Indosuez Wealth France).
2. French Retail Banking – LCL
LCL is a French retail banking network with a strong presence in urban areas. It is organised
into four business lines: retail banking for individual customers, retail banking for small
businesses, private banking and corporate banking.
LCL offers a full range of banking products and services, together with asset management,
insurance and wealth management products.

Comptes consolidés du groupe Crédit Agricole S.A. – 30 June 2020
59
3. International Retail Banking
This business line encompasses foreign subsidiaries and investments that are mainly involved
in Retail banking.
These subsidiaries and equity investments are primarily located in Europe: with Gruppo
Bancario CA Italia in Italy, Crédit Agricole Polska in Poland and others in Ukraine and Serbia.
Other subsidiaries operate around the Mediterranean, e.g. Crédit du Maroc and Crédit Agricole
Egypt.
Finally, this division also includes banks that are not significant in size. To this end, Crédit
Agricole Bank Romania is being held for sale.
Foreign consumer credit, leasing and factoring subsidiaries (subsidiaries of Crédit Agricole
Consumer Finance, Crédit Agricole Leasing & Factoring and EFL in Poland, etc.) are not
included in this business line, but in “Specialised financial services”, except Calit in Italy which
is included in International Retail Banking.
4. Specialised financial services
Specialised financial services comprises the Group subsidiaries that provide financial products
and services to individual customers, small businesses, corporates and local authorities in
France and abroad. These include:
consumer finance companies around Crédit Agricole Consumer Finance in France and
through its subsidiaries or partnerships outside France (Agos, FCA Bank, CreditPlus Bank,
Ribank, Credibom, Interbank Group and Bankia).
specialised financial services for companies such as factoring and lease finance (Crédit
Agricole Leasing & Factoring Group, EFL).
5. Large customers
The Large Customers business line includes corporate and investment banking which in turn
consists of two main lines of business most of which are carried out by Crédit Agricole CIB,
and Asset servicing for institutions realised by CACEIS:
financing activities includes corporate banking in France and internationally and
structured finance. Structured Finance consists of originating, structuring and financing
real assets and projects, often collateralised by physical assets (planes, boats, office
buildings, commodities, etc.) or even complex and structured credit instruments;
capital markets and investment banking activities bring together capital market activities
(treasury, foreign exchange, interest rate derivatives, debt markets), and investment
banking activities (mergers and acquisitions consulting and primary equity advisory);
asset servicing: CACEIS Bank for custody and CACEIS Fund Administration for fund
administration. Following its acquisition by CACEIS during the third quarter of 2019,
KAS Bank was integrated into this division in September 2019. And as part of the merger
of the activities of CACEIS and Santander Securities Services (“S3”) finalised in
December 2019, S3’s activities in Spain and 49.99 % of its activities in Latin America
were integrated into this division in December 2019.

Comptes consolidés du groupe Crédit Agricole S.A. – 30 June 2020
60
6. Corporate centre
This segment encompasses:
Crédit Agricole S.A.’s corporate centre function, asset and liability management and
management of debt connected with acquisitions of subsidiaries or equity investments
and the net impact of tax consolidation for Crédit Agricole S.A.;
the results of the private equity business and results of various other Crédit Agricole S.A.
companies (including CA Immobilier, Uni-médias, Foncaris, etc.);
the results from management companies including computing and payment companies
and real-estate companies.
The business line also includes technical volatility impacts related to intragroup transactions.

Comptes consolidés du groupe Crédit Agricole S.A. – 30 June 2020
61
5.1 Operating segment information
Transactions between operating segments are effected at market conditions.
30/06/2020
Asset
gathering
French retail
banking -
LCL
International
retail banking
Specialised
financial services
Large
customers
Corporate
center Total (in millions of euros)
Revenues 2,678 1,728 1,310 1,255 3,293 (167) 10,097
Operating expenses (1,477) (1,170) (873) (681) (2,001) (471) (6,673)
Gross operating income 1,201 558 437 574 1,292 (638) 3,424
Cost of risk 46 (219) (314) (438) (501) (37) (1,463)
Operating income 1,247 339 123 136 791 (675) 1,961
Share of net income of
equity-accounted entities 29 ‐ ‐ 132 5 13 179
Net gains (losses) on other
assets 3 ‐ 66 18 ‐ ‐ 87
Change in value of goodwill ‐ ‐ ‐ ‐ ‐ ‐ ‐
Pre-tax income 1,279 339 189 286 796 (662) 2,227
Income tax charge (323) (109) (53) 18 (103) 223 (347)
Net income from
discontinued operations ‐ ‐ (1) ‐ ‐ ‐ (1)
Net income 956 230 135 304 693 (439) 1,879
Non-controlling interests 139 10 47 46 40 5 287
NET INCOME GROUP SHARE 817 220 88 258 653 (444) 1,592
31/12/2019
Asset
gathering
French retail
banking - LCL
International
retail
banking
Specialised
financial
services
Large
customers
Corporat
e center Total (en millions d'euros)
Revenues 6 077 3 457 2 796 2 716 5 603 (497) 20 152
Operating expenses (2 905) (2 371) (1 753) (1 362) (3 498) (872) (12 761)
Gross operating income 3 172 1 086 1 043 1 354 2 105 (1 369) 7 391
Cost of risk (19) (217) (335) (497) (160) (28) (1 256)
Operating income 3 153 869 708 857 1 945 (1 397) 6 135
Share of net income of equity-
accounted entities 46 ‐ ‐ 295 5 6 352
Net gains (losses) on other
assets 32 2 2 ‐ 6 12 54
Change in value of goodwill ‐ ‐ ‐ ‐ 22 (611) (589)
Pre-tax income 3 231 871 710 1 152 1 978 (1 990) 5 952
Income tax charge (881) (274) (199) (233) (407) 1 538 (456)
Net income from discontinued
operations 8 ‐ (46) ‐ ‐ ‐ (38)
Net income 2 358 597 465 919 1 571 (452) 5 458
Non-controlling interests 325 27 132 104 33 (7) 614
NET INCOME GROUP SHARE 2 033 570 333 815 1 538 (445) 4 844

Comptes consolidés du groupe Crédit Agricole S.A. – 30 June 2020
62
30/06/2019
Asset
gathering
French retail
banking -
LCL
International
retail banking
Specialised
financial services
Large
customers
Corporate
center Total (in millions of euros)
Revenues 2,948 1,747 1,391 1,368 2,806 (256) 10,004
Operating expenses (1,451) (1,197) (878) (690) (1,793) (465) (6,474)
Gross operating income 1,497 550 513 678 1,013 (721) 3,530
Cost of risk (3) (95) (172) (239) (60) (13) (582)
Operating income 1,494 455 341 439 953 (734) 2,948
Share of net income of
equity-accounted entities 25 ‐ ‐ 156 (1) 13 193
Net gains (losses) on other
assets ‐ 1 (1) 1 3 18 22
Change in value of goodwill ‐ ‐ ‐ ‐ ‐ ‐ ‐
Pre-tax income 1,519 456 340 596 955 (703) 3,163
Income tax charge (421) (153) (96) (137) (278) 205 (880)
Net income from
discontinued operations 8 ‐ ‐ ‐ ‐ ‐ 8
Net income 1,106 303 244 459 677 (498) 2,291
Non-controlling interests 157 14 66 58 13 (2) 306
NET INCOME GROUP SHARE 949 289 178 401 664 (496) 1,985

Comptes consolidés du groupe Crédit Agricole S.A. – 30 June 2020
63
5.2 Insurance specificities
GROSS INCOME FROM INSURANCE ACTIVITIES

Comptes consolidés du groupe Crédit Agricole S.A. – 30 June 2020
64
30/06/2020 31/12/2019 30/06/2019
(in millions of euros)
Income statement
prior to
reclassification of
overlay approach
Reclassification
related to overlay
approach
Income statement
post-reclassification
of overlay
approach
Recognition in
accordance with IFRS
9 excluding effect of
overlay approach
Effect of
overlay
approach
Recognition
after effect of
overlay
approach
Recognition in
accordance with IFRS
9 excluding effect of
overlay approach
Effect of
overlay
approach
Recognition
after effect of
overlay
approach
Written premium 14,480 ‐ 14,480 36,967 ‐ 36,967 20,396 ‐ 20,396
Change in unearned premiums (524) ‐ (524) (225) ‐ (225) (653) ‐ (653)
Earned premiums 13,956 ‐ 13,956 36,742 ‐ 36,742 19,743 ‐ 19,743
Other operating income 148 ‐ 148 (124) ‐ (124) (142) ‐ (142)
Investment income 3,819 (3) 3,816 7,737 (4) 7,733 4,101 (1) 4,100
Investment expenses (259) 1 (258) (457) 1 (456) (218) 1 (217)
Gains (losses) on disposals of investments net of impairment
and amortisation reversals 373 363 736 72 103 175 42 98 140
Change in fair value of investments at fair value through
profit or loss (7,935) 3,776 (4,159) 12,405 (4,041) 8,364 7,743 (2,219) 5,524
Change in impairment on investments (100) (229) (329) (39) (112) (151) (4) 36 32
Investment income net of expenses (4,102) 3,908 (194) 19,718 (4,053) 15,666 11,664 (2,085) 9,579
Claims expenses ¹ (7,093) (3,481) (10,574) (49,154) 3,608 (45,546) (27,696) 1,837 (25,859)
Revenue from reinsurance operations 275 ‐ 275 693 ‐ 693 272 ‐ 272
Expenses from reinsurance operations (405) ‐ (405) (736) ‐ (736) (347) ‐ (347)
Net reinsurance income (expense) (130) ‐ (130) (43) ‐ (43) (75) ‐ (75)
Contract acquisition costs (1,096) ‐ (1,096) (2,021) ‐ (2,021) (1,045) ‐ (1,045)
Amortisation of investment securities and similar ‐ ‐ ‐ ‐ ‐ ‐ ‐ ‐ ‐
Administration costs (1,045) ‐ (1,045) (2,163) ‐ (2,163) (1,001) ‐ (1,001)
Other current operating income (expense) (261) ‐ (261) (416) ‐ (416) (228) ‐ (228)
Other operating income (expense) ‐ ‐ ‐ 7 ‐ 7 ‐ ‐ ‐
Operating income 377 427 804 2,547 (445) 2,102 1,220 (248) 972
Financing expenses (124) ‐ (124) (238) ‐ (238) (117) ‐ (117)
Share of net income of associates ‐ ‐ ‐ ‐ ‐ ‐ ‐ ‐ ‐
Income tax charge (262) 83 (179) (591) 51 (540) (322) 66 (256)
Net income from discontinued or held-for-sale operations ‐ ‐ ‐ 8 ‐ 8 8 ‐ 8
Consolidated net income (9) 510 501 1,726 (394) 1,332 789 (182) 607
Non-controlling interests 2 ‐ 2 3 ‐ 3 3 ‐ 3
NET INCOME GROUP SHARE (11) 510 499 1,723 (394) 1,329 786 (182) 604
¹ Including -€11 billion in respect of the cost of claims as at 30 June 2020 (-€11 billion as at 30 June 2019), -€1 billion in changes in policyholder profit-sharing as at 30 June 2020 (-€1 billion as at 30 June 2019)
and -€2 billion in changes in technical reserves as at 30 June 2020 (-€13 billion at 30 June 2019).
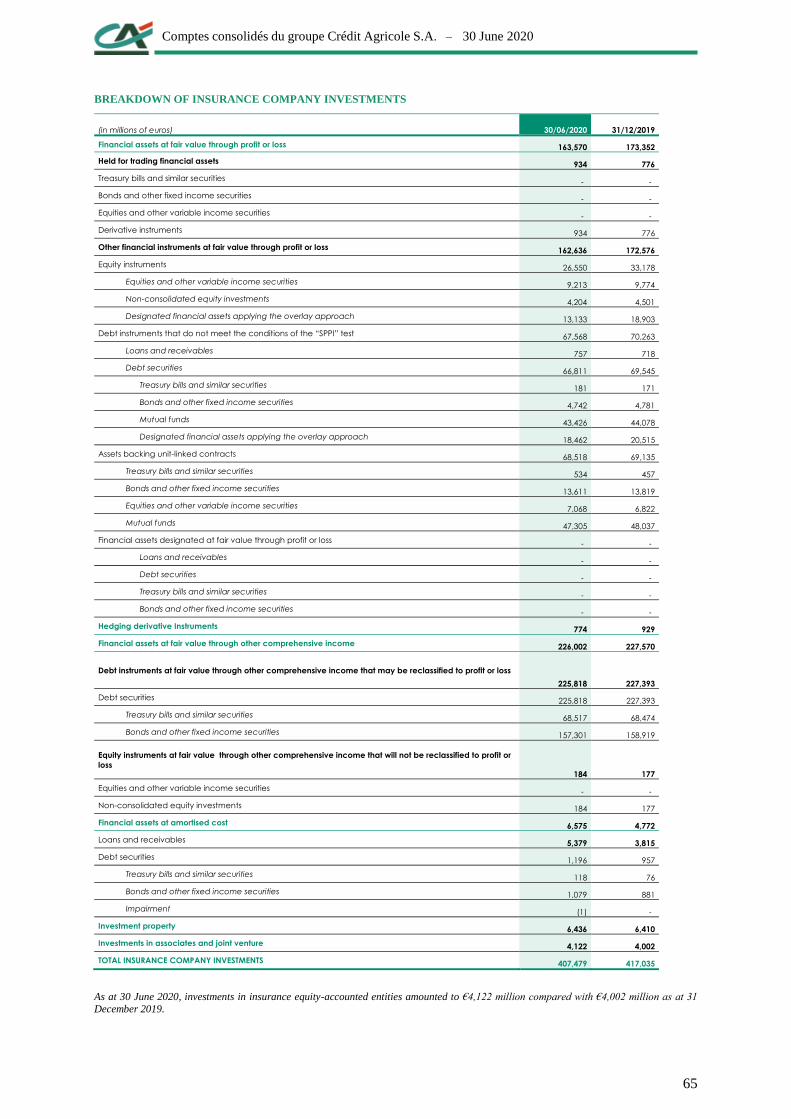
Comptes consolidés du groupe Crédit Agricole S.A. – 30 June 2020
65
BREAKDOWN OF INSURANCE COMPANY INVESTMENTS
(in millions of euros) 30/06/2020 31/12/2019
Financial assets at fair value through profit or loss 163,570 173,352
Held for trading financial assets 934 776
Treasury bills and similar securities ‐ ‐
Bonds and other fixed income securities ‐ ‐
Equities and other variable income securities ‐ ‐
Derivative instruments 934 776
Other financial instruments at fair value through profit or loss 162,636 172,576
Equity instruments 26,550 33,178
Equities and other variable income securities 9,213 9,774
Non-consolidated equity investments 4,204 4,501
Designated financial assets applying the overlay approach 13,133 18,903
Debt instruments that do not meet the conditions of the “SPPI” test 67,568 70,263
Loans and receivables 757 718
Debt securities 66,811 69,545
Treasury bills and similar securities 181 171
Bonds and other fixed income securities 4,742 4,781
Mutual funds 43,426 44,078
Designated financial assets applying the overlay approach 18,462 20,515
Assets backing unit-linked contracts 68,518 69,135
Treasury bills and similar securities 534 457
Bonds and other fixed income securities 13,611 13,819
Equities and other variable income securities 7,068 6,822
Mutual funds 47,305 48,037
Financial assets designated at fair value through profit or loss ‐ ‐
Loans and receivables ‐ ‐
Debt securities ‐ ‐
Treasury bills and similar securities ‐ ‐
Bonds and other fixed income securities ‐ ‐
Hedging derivative Instruments 774 929
Financial assets at fair value through other comprehensive income 226,002 227,570
Debt instruments at fair value through other comprehensive income that may be reclassified to profit or loss
225,818 227,393
Debt securities 225,818 227,393
Treasury bills and similar securities 68,517 68,474
Bonds and other fixed income securities 157,301 158,919
Equity instruments at fair value through other comprehensive income that will not be reclassified to profit or
loss 184 177
Equities and other variable income securities ‐ ‐
Non-consolidated equity investments 184 177
Financial assets at amortised cost 6,575 4,772
Loans and receivables 5,379 3,815
Debt securities 1,196 957
Treasury bills and similar securities 118 76
Bonds and other fixed income securities 1,079 881
Impairment (1) ‐
Investment property 6,436 6,410
Investments in associates and joint venture 4,122 4,002
TOTAL INSURANCE COMPANY INVESTMENTS 407,479 417,035
As at 30 June 2020, investments in insurance equity-accounted entities amounted to €4,122 million compared with €4,002 million as at 31
December 2019.

Comptes consolidés du groupe Crédit Agricole S.A. – 30 June 2020
66
(in millions of euros)
30/06/2020 31/12/2019
Carrying
amount
Unrealised
gains
Unrealised
losses
Carrying
amount
Unrealised
gains
Unrealised
losses
Debt instruments at fair value through other comprehensive
income that may be reclassified to profit or loss
225,818 20,200 (224) 227,393 20,456 (128)
Debt securities 225,818 20,200 (224) 227,393 20,456 (128)
Treasury bills and similar securities 68,517 8,212 (32) 68,474 7,560 (69)
Bonds and other fixed income securities 157,301 11,988 (192) 158,919 12,896 (59)
Equity instruments at fair value through other comprehensive
income that will not be reclassified to profit or loss 184 (1) (33) 177 ‐ (23)
Equities and other variable income securities ‐ ‐ ‐ ‐ ‐ ‐
Non-consolidated equity investments 184 (1) (33) 177 ‐ (23)
Total of financial assets at fair value through other
comprehensive income 226,002 20,199 (257) 227,570 20,456 (151)
Income tax charge (5,269) 68 (5,354) 39
OTHER COMPREHENSIVE INCOME ON FINANCIAL ASSETS AT FAIR
VALUE THROUGH OTHER COMPREHENSIVE INCOME (NET OF
INCOME TAX) 14,930 (189) 15,102 (112)
RECLASSIFICATION BETWEEN NET INCOME AND OTHER COMPREHENSIVE INCOME FOR FINANCIAL
ASSETS DESIGNATED UNDER THE OVERLAY APPROACH
30/06/2020 31/12/2019 30/06/2019
(in millions of euros)
Amount
reported for
the
designated
financial
assets
applying
IFRS9
Amount that
would have
been
reported for
the
designated
financial
assets
applying
IAS39
Amount
reclassified
in other
comprehen
sive income
applying
the overlay
approach
Amount
reported for
the
designated
financial
assets
applying
IFRS9
Amount that
would have
been
reported for
the
designated
financial
assets
applying
IAS39
Amount
reclassified
in other
comprehen
sive income
applying
the overlay
approach
Amount
reported for
the
designated
financial
assets
applying
IFRS9
Amount that
would have
been
reported for
the
designated
financial
assets
applying
IAS39
Amount
reclassified
in other
comprehen
sive income
applying
the overlay
approach
Investment income 444 441 (3) 1,029 1,025 (4) 671 670 (1)
Investment expenses (3) (2) 1 (7) (6) 1 (3) (2) 1
Gains (losses) on disposals of investments net of
impairment and amortisation reversals 8 371 363 71 174 103 29 127 98
Change in fair value of investments at fair value
through profit or loss (3,776) ‐ 3,776 4,041 ‐ (4,041) 2,219 ‐ (2,219)
Change in impairment on investments ‐ (229) (229) ‐ (112) (112) ‐ 36 36
Investment income net of expenses (3,327) 581 3,908 5,134 1,081 (4,053) 2,916 831 (2,085)
Claims paid (3,481) 3,608 1,837
Operating income 427 (445) (248)
Income tax charge 83 51 66
NET INCOME GROUP SHARE 510 (394) (182)

Comptes consolidés du groupe Crédit Agricole S.A. – 30 June 2020
67
NOTE 6 Notes to the balance sheet
6.1 Financial assets and liabilities at fair value through profit or loss
OTHER FINANCIAL INSTRUMENTS AT FAIR VALUE THROUGH PROFIT OR LOSS
(in millions of euros) 30/06/2020 31/12/2019
Held for trading financial assets 267,004 230,721
Other financial instruments at fair value through profit or loss 163,937 168,756
Equity instruments 29,753 36,293
Debt instruments that do not meet the conditions of the “SPPI” test 75,102 72,942
Assets backing unit-linked contracts 59,081 59,520
Financial assets designated at fair value through profit or loss 1 1
CARRYING AMOUNT 430,941 399,477
Of which lent securities 176 615
HELD FOR TRADING FINANCIAL ASSETS
(in millions of euros) 30/06/2020 31/12/2019
Equity instruments 6,379 6,901
Equities and other variable income securities 6,379 6,901
Debt securities 24,643 18,380
Treasury bills and similar securities 19,015 13,665
Bonds and other fixed income securities 5,600 4,607
Mutual funds 28 108
Loans and receivables 111,741 104,645
Loans and receivables due from credit institutions ‐ 61
Loans and receivables due from customers 1,614 894
Securities bought under repurchase agreements 110,127 103,690
Pledged securities ‐ ‐
Derivative instruments 124,241 100,795
CARRYING AMOUNT 267,004 230,721
Securities acquired under repurchase agreements include those that the entity is authorised to use as collateral.
EQUITY INSTRUMENTS AT FAIR VALUE THROUGH PROFIT OR LOSS
(in millions of euros) 30/06/2020 31/12/2019
Equities and other variable income securities 18,920 24,753
Non-consolidated equity investments 10,833 11,540
TOTAL EQUITY INSTRUMENTS AT FAIR VALUE THROUGH PROFIT OR LOSS 29,753 36,293

Comptes consolidés du groupe Crédit Agricole S.A. – 30 June 2020
68
DEBT INSTRUMENTS THAT DO NOT MEET
THE CONDITIONS OF THE “SPPI” TEST
(in millions of euros) 30/06/2020 31/12/2019
Debt securities 71,531 68,733
Treasury bills and similar securities 186 252
Bonds and other fixed income securities 12,879 13,152
Mutual funds 58,466 55,329
Loans and receivables 3,571 4,209
Loans and receivables due from credit institutions ‐ ‐
Loans and receivables due from customers 3,571 4,209
Securities bought under repurchase agreements ‐ ‐
Pledged securities ‐ ‐
TOTAL DEBT INSTRUMENTS THAT DO NOT MEET THE CONDITIONS OF THE “SPPI”
TEST 75,102 72,942
FINANCIAL ASSETS DESIGNATED AT FAIR VALUE THROUGH PROFIT OR LOSS
(in millions of euros) 30/06/2020 31/12/2019
Loans and receivables ‐ ‐
Loans and receivables due from credit institutions ‐ ‐
Loans and receivables due from customers ‐ ‐
Debt securities 1 1
Treasury bills and similar securities ‐ ‐
Bonds and other fixed income securities 1 1
TOTAL FINANCIAL ASSETS DESIGNATED AT FAIR VALUE THROUGH PROFIT OR
LOSS 1 1
FINANCIAL LIABILITIES AT FAIR VALUE THROUGH PROFIT OR LOSS
(in millions of euros) 30/06/2020 31/12/2019
Held for trading financial liabilities 235,177 206,708
Financial liabilities designated at fair value through profit or loss 36,673 39,961
CARRYING AMOUNT 271,850 246,669
This item includes liabilities to holders of UCITS units consolidated in Insurance.
HELD-FOR-TRADING FINANCIAL LIABILITIES
(in millions of euros) 30/06/2020 31/12/2019
Securities sold short 30,918 33,472
Securities sold under repurchase agreements 82,549 74,763
Debt securities 2 55
Derivative instruments 121,708 98,418
CARRYING AMOUNT 235,177 206,708
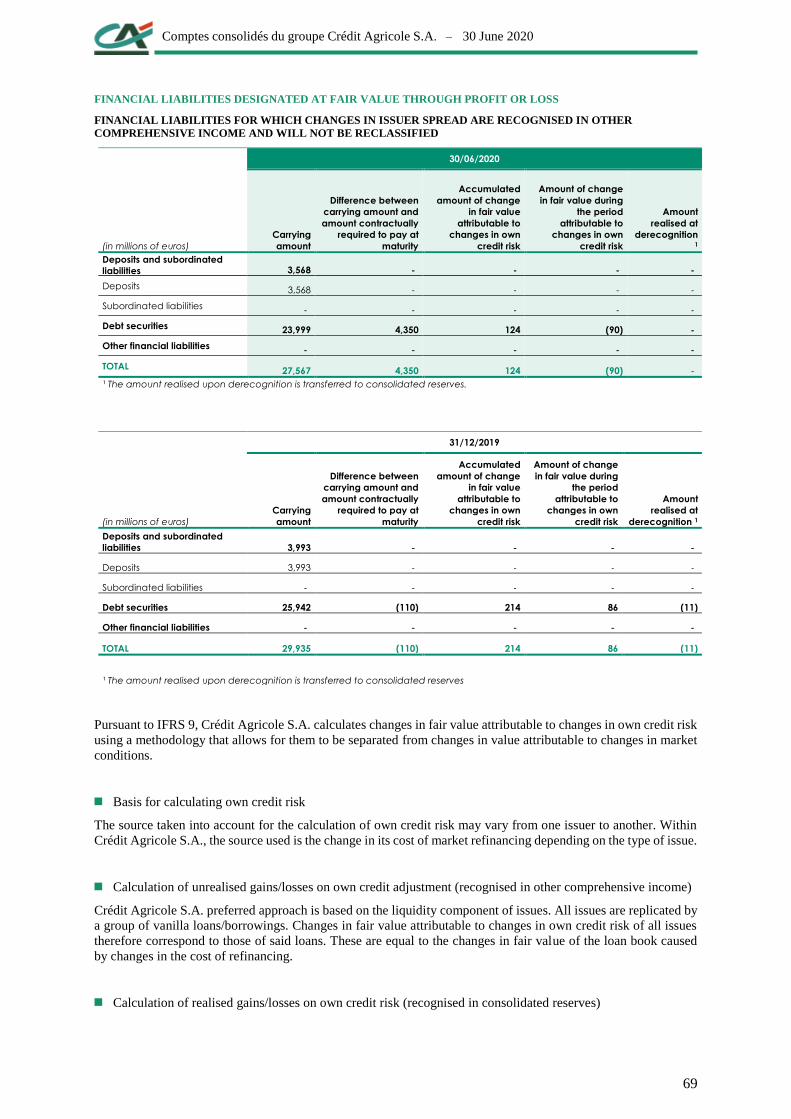
Comptes consolidés du groupe Crédit Agricole S.A. – 30 June 2020
69
FINANCIAL LIABILITIES DESIGNATED AT FAIR VALUE THROUGH PROFIT OR LOSS
FINANCIAL LIABILITIES FOR WHICH CHANGES IN ISSUER SPREAD ARE RECOGNISED IN OTHER
COMPREHENSIVE INCOME AND WILL NOT BE RECLASSIFIED
(in millions of euros)
30/06/2020
Carrying
amount
Difference between
carrying amount and
amount contractually
required to pay at
maturity
Accumulated
amount of change
in fair value
attributable to
changes in own
credit risk
Amount of change
in fair value during
the period
attributable to
changes in own
credit risk
Amount
realised at
derecognition 1
Deposits and subordinated
liabilities 3,568 ‐ ‐ ‐ ‐
Deposits 3,568 ‐ ‐ ‐ ‐
Subordinated liabilities ‐ ‐ ‐ ‐ ‐
Debt securities 23,999 4,350 124 (90) ‐
Other financial liabilities ‐ ‐ ‐ ‐ ‐
TOTAL 27,567 4,350 124 (90) ‐
¹ The amount realised upon derecognition is transferred to consolidated reserves.
(in millions of euros)
31/12/2019
Carrying
amount
Difference between
carrying amount and
amount contractually
required to pay at
maturity
Accumulated
amount of change
in fair value
attributable to
changes in own
credit risk
Amount of change
in fair value during
the period
attributable to
changes in own
credit risk
Amount
realised at
derecognition 1
Deposits and subordinated
liabilities 3,993 ‐ ‐ ‐ ‐
Deposits 3,993 ‐ ‐ ‐ ‐
Subordinated liabilities ‐ ‐ ‐ ‐ ‐
Debt securities 25,942 (110) 214 86 (11)
Other financial liabilities ‐ ‐ ‐ ‐ ‐
TOTAL 29,935 (110) 214 86 (11)
¹ The amount realised upon derecognition is transferred to consolidated reserves
Pursuant to IFRS 9, Crédit Agricole S.A. calculates changes in fair value attributable to changes in own credit risk
using a methodology that allows for them to be separated from changes in value attributable to changes in market
conditions.
Basis for calculating own credit risk
The source taken into account for the calculation of own credit risk may vary from one issuer to another. Within
Crédit Agricole S.A., the source used is the change in its cost of market refinancing depending on the type of issue.
Calculation of unrealised gains/losses on own credit adjustment (recognised in other comprehensive income)
Crédit Agricole S.A. preferred approach is based on the liquidity component of issues. All issues are replicated by
a group of vanilla loans/borrowings. Changes in fair value attributable to changes in own credit risk of all issues
therefore correspond to those of said loans. These are equal to the changes in fair value of the loan book caused
by changes in the cost of refinancing.
Calculation of realised gains/losses on own credit risk (recognised in consolidated reserves)

Comptes consolidés du groupe Crédit Agricole S.A. – 30 June 2020
70
The Group has elected to transfer fair value changes attributable to changes in own credit risk upon unwinding to
consolidated reserves. Accordingly, when there is a total or partial early redemption, a sensitivity-based calculation
is done. This consists of measuring the change in fair value attributable to the changes in own credit risk of a given
issuance as being the sum of the credit spread sensitivities multiplied by the change in this spread between the
issuance date and the redemption date.
FINANCIAL LIABILITIES FOR WHICH CHANGES IN ISSUER SPREAD ARE RECOGNISED IN NET INCOME
(in millions of euros)
30/06/2020
Carrying amount
Difference
between carrying
amount and due
on maturity
Accumulated amount of
change in fair value
attributable to changes
in own credit risk
Amount of change in fair
value during the period
attributable to changes
in own credit risk
Deposits and subordinated liabilities 9,106 841 ‐ ‐
Deposits 9,106 841 ‐ ‐
Subordinated liabilities ‐ ‐ ‐ ‐
Debt securities ‐ ‐ ‐ ‐
Other financial liabilities ‐ ‐ ‐ ‐
TOTAL 9,106 841 ‐ ‐
(in millions of euros)
31/12/2019
Carrying
amount
Difference
between carrying
amount and due
on maturity
Accumulated amount
of change in fair
value attributable to
changes in own credit
risk
Amount of change in fair
value during the period
attributable to changes in
own credit risk
Deposits and subordinated liabilities 10,026 152 ‐ ‐
Deposits 10,026 152 ‐ ‐
Subordinated liabilities ‐ ‐ ‐ ‐
Debt securities ‐ ‐ ‐ ‐
Other financial liabilities ‐ ‐ ‐ ‐
TOTAL 10,026 152 ‐ ‐
6.2 Financial assets at fair value through other comprehensive income
30/06/2020
(in millions of euros)
Carrying
amount
Unrealised
gains
Unrealised
losses
Debt instruments at fair value through other comprehensive
income that may be reclassified to profit or loss 259,304 20,139 (510)
Equity instruments at fair value through other comprehensive
income that will not be reclassified to profit or loss 2,456 524 (963)
TOTAL 261,760 20,663 (1,473)

Comptes consolidés du groupe Crédit Agricole S.A. – 30 June 2020
71
31/12/2019
(in millions of euros)
Carrying
amount
Unrealised
gains
Unrealised
losses
Debt instruments at fair value through other comprehensive
income that may be reclassified to profit or loss 258,803 20,348 (290)
Equity instruments at fair value through other comprehensive
income that will not be reclassified to profit or loss 2,518 617 (938)
TOTAL 261,321 20,965 (1,228)
DEBT INSTRUMENTS RECOGNISED AT FAIR VALUE THROUGH OTHER COMPREHENSIVE INCOME THAT
CAN BE RECLASSIFIED
30/06/2020
(in millions of euros)
Carrying
amount
Unrealised
gains
Unrealised
losses
Treasury bills and similar securities 82,748 8,408 (142)
Bonds and other fixed income securities 176,556 11,731 (368)
Total Debt securities 259,304 20,139 (510)
Loans and receivables due from credit institutions ‐ ‐ ‐
Loans and receivables due from customers ‐ ‐ ‐
Total Loans and receivables ‐ ‐ ‐
Total Debt instruments at fair value through other comprehensive
income that may be reclassified to profit or loss 259,304 20,139 (510)
Income tax charge (5,266) 146
OTHER COMPREHENSIVE INCOME ON DEBT INSTRUMENTS THAT WILL NOT
BE RECLASSIFIED TO PROFIT OR LOSS (NET OF INCOME TAX) 14,873 (364)
31/12/2019
(in millions of euros)
Carrying
amount
Unrealised
gains
Unrealised
losses
Treasury bills and similar securities 82,684 7,806 (151)
Bonds and other fixed income securities 176,119 12,542 (140)
Total Debt securities 258,803 20,348 (291)
Loans and receivables due from credit institutions ‐ ‐ ‐
Loans and receivables due from customers ‐ ‐ ‐
Total Loans and receivables ‐ ‐ ‐
Total Debt instruments at fair value through other comprehensive
income that may be reclassified to profit or loss 258,803 20,348 (290)
Income tax charge (5,341) 81
OTHER COMPREHENSIVE INCOME ON DEBT INSTRUMENTS THAT WILL NOT
BE RECLASSIFIED TO PROFIT OR LOSS (NET OF INCOME TAX) 15,007 (209)

Comptes consolidés du groupe Crédit Agricole S.A. – 30 June 2020
72
EQUITY INSTRUMENTS AT FAIR VALUE THROUGH OTHER COMPREHENSIVE INCOME THAT WILL NOT BE
RECLASSIFIED TO PROFIT AND LOSS
OTHER COMPREHENSIVE INCOME ON EQUITY INSTRUMENTS THAT CANNOT BE RECLASSIFIED
(in millions of euros)
30/06/2020
Carrying
amount
Unrealised
gains
Unrealised
losses
Equities and other variable income securities 687 28 (79)
Non-consolidated equity investments 1,769 496 (884)
Total Equity instruments at fair value through other
comprehensive income that will not be
reclassified to profit or loss 2,456 524 (963)
Income tax charge (23) 28
OTHER COMPREHENSIVE INCOME ON EQUITY
INSTRUMENTS THAT WILL NOT BE RECLASSIFIED TO
PROFIT OR LOSS (NET OF INCOME TAX)
501 (935)
(in millions of euros)
31/12/2019
Carrying
amount
Unrealised
gains
Unrealised
losses
Equities and other variable income securities 802 29 (33)
Non-consolidated equity investments 1,716 588 (905)
Total Equity instruments at fair value through other
comprehensive income that will not be
reclassified to profit or loss 2,518 617 (938)
Income tax charge (65) 19
OTHER COMPREHENSIVE INCOME ON EQUITY
INSTRUMENTS THAT WILL NOT BE RECLASSIFIED TO
PROFIT OR LOSS (NET OF INCOME TAX)
552 (919)

Comptes consolidés du groupe Crédit Agricole S.A. – 30 June 2020
73
EQUITY INSTRUMENTS DERECOGNISED DURING THE PERIOD
(in millions of euros)
30/06/2020
Fair value at the date
of derecognition
Cumulative gains
realised ¹
Cumulative losses
realised ¹
Equities and other variable income securities ‐ ‐ ‐
Non-consolidated equity investments 5 ‐ (1)
Total Investments in equity instruments 5 ‐ (1)
Income tax charge ‐ ‐
OTHER COMPREHENSIVE INCOME ON EQUITY
INSTRUMENTS THAT WILL NOT BE RECLASSIFIED TO
PROFIT OR LOSS (NET OF INCOME TAX) ¹
‐ (1)
¹ Realised gains and losses are transferred to consolidated reserves.
¹ Realised gains and losses are transferred to consolidated reserves.
6.3 Financial assets at amortised cost
(in millions of euros) 30/06/2020 31/12/2019
Loans and receivables due from credit institutions 499,783 438,580
Loans and receivables due from customers ¹ 413,355 395,181
Debt securities 93,765 72,519
CARRYING AMOUNT 1,006,903 906,280
¹ As at 30 June 2020, as part of the economic support measures enacted in response to the COVID-19 health crisis,
Crédit Agricole S.A. granted State-guaranteed loans in the amount of €7.8 billion and deferred maturities on
customer loans in the amount of €2,85 billion.
(in thousands of euros)
31/12/2019
Fair value at the date
of derecognition
Cumulative gains
realised ¹
Cumulative losses
realised ¹
Equities and other variable income securities (1) ‐ (4)
Non-consolidated equity investments 1,058 47 (65)
Total Investments in equity instruments 1,057 47 (69)
Income tax charge ‐ ‐
OTHER COMPREHENSIVE INCOME ON EQUITY
INSTRUMENTS THAT WILL NOT BE RECLASSIFIED TO
PROFIT OR LOSS (NET OF INCOME TAX)
47 (69)

Comptes consolidés du groupe Crédit Agricole S.A. – 30 June 2020
74
LOANS AND RECEIVABLES DUE FROM CREDIT INSTITUTIONS
(in millions of euros) 30/06/2020 31/12/2019
Credit institutions
Loans and receivables 114,223 98,434
of which non doubtful current accounts in debit ¹ 7,498 7,002
of which non doubtful overnight accounts and advances ¹ 31,666 22,484
Pledged securities 1 1
Securities bought under repurchase agreements 8,887 5,358
Subordinated loans 534 538
Other loans and receivables 105 133
Gross amount 123,750 104,464
Impairment (415) (416)
Net value of loans and receivables due from credit institutions 123,335 104,048
Crédit Agricole internal transactions
Current accounts 123 1,294
Securities bought under repurchase agreements 15,977 1,343
Term deposits and advances 359,957 331,504
Subordinated loans 391 392
Total Crédit Agricole internal transactions 376,448 334,533
CARRYING AMOUNT 499,783 438,580
¹ These transactions are partly comprised of the item “Net demand loans and deposits with credit institutions” on
the Cash Flow Statement.
LOANS AND RECEIVABLES DUE FROM CUSTOMERS
(in millions of euros) 30/06/2020 31/12/2019
Loans and receivables due from customers
Trade receivables 23,480 27,824
Other customer loans 363,755 340,041
Pledged securities 181 232
Securities bought under repurchase agreements 3,024 4,071
Subordinated loans 45 45
Insurance receivables 636 314
Reinsurance receivables 849 770
Advances in associates' current accounts 151 143
Current accounts in debit 14,786 14,670
Gross amount 406,907 388,110
Impairment (9,639) (8,813)
Net value of loans and receivables due from customers 397,268 379,297
Finance leases
Property leasing 5,513 5,512
Equipment leases, operating leases and similar transactions 11,017 10,772
Gross amount 16,530 16,284
Impairment (443) (400)
Net value of lease financing operations 16,087 15,884
CARRYING AMOUNT 413,355 395,181
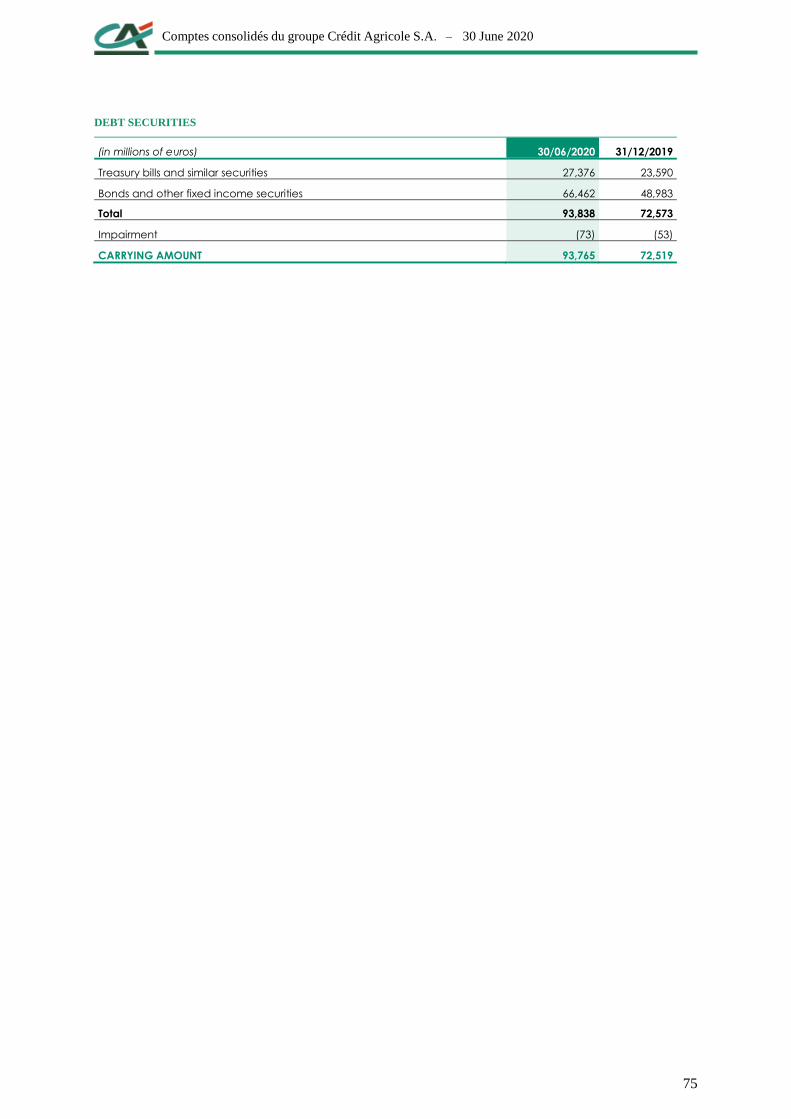
Comptes consolidés du groupe Crédit Agricole S.A. – 30 June 2020
75
DEBT SECURITIES
(in millions of euros) 30/06/2020 31/12/2019
Treasury bills and similar securities 27,376 23,590
Bonds and other fixed income securities 66,462 48,983
Total 93,838 72,573
Impairment (73) (53)
CARRYING AMOUNT 93,765 72,519

Comptes consolidés du groupe Crédit Agricole S.A. – 30 June 2020
76
6.4 Exposure to sovereign risk
The scope of sovereign exposures recorded covers exposures to Governments, but does not include local
authorities. Tax debt is excluded from these amounts.
Exposure to sovereign debt corresponds to an exposure net of impairment (carrying amount) presented both gross
and net of hedging.
Crédit Agricole Group‘s exposure to sovereign risk is as follows:
BANKING ACTIVITY
30/06/2020 Exposures Banking activity net of impairment
(in millions of euros)
Other financial instruments at fair
value through profit or loss
Financial assets at
fair value through
other
comprehensive
income that may
be reclassified to
profit or loss
Financial assets
at amortised
cost
Total banking
activity before
hedging
Hedging Total banking
activity after
hedging
Held-for-trading
financial assets
Other financial
instruments at fair
value through
profit or loss
Saudi Arabia ‐ ‐ ‐ 893 893 ‐ 893
Argentina ‐ ‐ ‐ ‐ ‐ ‐
Austria 183 ‐ ‐ 200 383 (3) 380
Belgium ‐ 8 2,402 1,567 3,977 (298) 3,679
Brazil 26 ‐ 129 169 324 ‐ 324
China 18 ‐ 37 38 93 (2) 91
Egypt 2 7 657 ‐ 666 ‐ 666
Spain ‐ 16 1,338 1,405 2,759 85 2,844
United States 3,720 4 206 1,646 5,576 (34) 5,542
France 202 114 4,700 12,279 17,295 (1,053) 16,242
Greece ‐ ‐ ‐ ‐ ‐ ‐ ‐
Hong Kong 62 ‐ ‐ 723 785 ‐ 785
Iran ‐ ‐ ‐ ‐ ‐ ‐ ‐
Ireland ‐ 14 ‐ ‐ 14 ‐ 14
Italy ‐ 36 2,775 5,131 7,942 (453) 7,489
Japan 104 ‐ ‐ 1,569 1,673 ‐ 1,673
Lituania ‐ ‐ ‐ ‐ ‐ ‐ ‐
Morocco 122 23 233 ‐ 378 ‐ 378
Poland ‐ ‐ 907 233 1,140 ‐ 1,140
United Kingdom ‐ ‐ ‐ ‐ ‐ ‐ ‐
Russia ‐ ‐ ‐ ‐ ‐ ‐ ‐
Syria ‐ ‐ ‐ ‐ ‐ ‐ ‐
Turkey ‐ ‐ ‐ ‐ ‐ ‐ ‐
Ukraine ‐ ‐ 56 286 342 ‐ 342
Venezuela ‐ ‐ ‐ 42 42 ‐ 42
Yemen ‐ ‐ ‐ ‐ ‐ ‐ ‐
Other sovereign
countries 2,361 60 767 5,060 8,248 (37) 8,211
TOTAL 6,800 282 14,207 31,241 52,530 (1,795) 50,735

Comptes consolidés du groupe Crédit Agricole S.A. – 30 June 2020
77
31/12/2019 Exposures Banking activity net of impairment
(in millions of euros)
Other financial instruments at fair
value through profit or loss
Financial assets at
fair value through
other
comprehensive
income that may
be reclassified to
profit or loss
Financial assets
at amortised
cost
Total banking
activity before
hedging Hedging
Total banking
activity after
hedging
Held-for-trading
financial assets
Other financial
instruments at fair
value through
profit or loss
Saudi Arabia ‐ ‐ ‐ 899 899 ‐ 899
Argentina - - - - - - -
Austria 68 4 ‐ 16 88 (1) 87
Belgium ‐ ‐ 2,412 671 3,083 (206) 2,877
Brazil 57 ‐ 77 191 325 ‐ 325
China 12 ‐ 36 ‐ 48 ‐ 48
Egypt 2 8 804 ‐ 814 ‐ 814
Spain ‐ 7 1,290 612 1,909 (2) 1,907
United States 4,083 ‐ 205 2,858 7,146 (21) 7,125
France 41 195 4,724 10,559 15,519 (1,015) 14,504
Greece ‐ ‐ ‐ ‐ ‐ ‐ ‐
Hong Kong 46 ‐ ‐ 890 936 ‐ 936
Iran ‐ ‐ ‐ ‐ ‐ ‐ ‐
Ireland 1 6 ‐ ‐ 7 ‐ 7
Italy 24 96 2,821 4,921 7,862 (452) 7,410
Japan ‐ ‐ ‐ 889 889 8 897
Lituania ‐ ‐ ‐ ‐ ‐ ‐ ‐
Morocco 68 7 258 ‐ 333 ‐ 333
Poland 14 ‐ 722 242 978 ‐ 978
United Kingdom ‐ ‐ ‐ ‐ ‐ ‐ ‐
Russia 1 ‐ ‐ ‐ 1 ‐ 1
Syria ‐ ‐ ‐ ‐ ‐ ‐ ‐
Turkey ‐ ‐ ‐ ‐ ‐ ‐ ‐
Ukraine ‐ ‐ 55 148 203 ‐ 203
Venezuela ‐ ‐ ‐ 42 42 ‐ 42
Yemen ‐ ‐ ‐ ‐ ‐ ‐ ‐
Other sovereign
countries 993 31 699 4,783 6,506 (345) 6,161
Total 5,410 354 14,103 27,721 47,588 (2,034) 45,554

Comptes consolidés du groupe Crédit Agricole S.A. – 30 June 2020
78
INSURANCE ACTIVITY
For the insurance activity, exposure to sovereign debt is presented as net of impairment, before hedging, and
corresponds to an exposure before application of sharing mechanisms between insurer and policyholder specific
to life insurance.
Gross exposures
30/06/2020 31/12/2019 (in millions of euros)
Saudi Arabia 6 6
Argentina 1 ‐
Austria 3,036 3,036
Belgium 3,367 3,299
Brazil ‐ ‐
China ‐ ‐
Egypt ‐ ‐
Spain 1,735 1,318
United States 132 131
France 51,203 52,216
Greece 4 4
Hong Kong ‐ ‐
Iran ‐ ‐
Ireland 191 725
Italy 8,468 7,602
Japan 124 97
Lituania 75 ‐
Morocco ‐ ‐
Poland 331 363
United Kingdom 16 15
Russia ‐ ‐
Syria ‐ ‐
Turkey 2 2
Ukraine ‐ ‐
Venezuela 1 1
Yemen ‐ ‐
Other sovereign countries 2,308 2,219
TOTAL EXPOSURES 71,000 71,035

Comptes consolidés du groupe Crédit Agricole S.A. – 30 June 2020
79
6.5 Financial liabilities at amortised cost
(in millions of euros) 30/06/2020 31/12/2019
Due to credit institutions 275,617 142,041
Due to customers 704,090 646,914
Debt securities 185,085 201,007
CARRYING AMOUNT 1,164,792 989,962
DUE TO CREDIT INSTITUTIONS
(in millions of euros) 30/06/2020 31/12/2019
Credit institutions
Accounts and borrowings 169,739 74,133
of which current accounts in credit ¹ 9,898 10,137
of which overnight accounts and deposits ¹ 2,437 2,359
Pledged securities ‐ ‐
Securities sold under repurchase agreements 23,710 27,169
Total 193,449 101,302
Crédit Agricole internal transactions
Current accounts in credit ¹ 48,131 18,794
Term deposits and advances 33,265 20,876
Securities sold under repurchase agreements 772 1,069
Total 82,168 40,739
CARRYING AMOUNT 275,617 142,041
¹ These transactions are partly comprised of the item “Net demand loans and deposits with credit institutions” on
the Cash Flow Statement.
DUE TO CUSTOMERS
(in millions of euros) 30/06/2020 31/12/2019
Current accounts in credit 277,775 228,339
Special savings accounts 313,524 302,424
Other amounts due to customers 108,168 112,020
Securities sold under repurchase agreements 1,719 1,569
Insurance liabilities 1,143 940
Reinsurance liabilities 590 467
Cash deposits received from ceding and retroceding companies against technical
insurance commitments 1,171 1,155
CARRYING AMOUNT 704,090 646,914

Comptes consolidés du groupe Crédit Agricole S.A. – 30 June 2020
80
DEBT SECURITIES
(in millions of euros) 30/06/2020 31/12/2019
Interest bearing notes ‐ ‐
Interbank securities 9,028 9,289
Negotiable debt securities 67,367 86,272
Bonds ¹ 105,179 101,738
Other debt securities 3,511 3,708
CARRYING AMOUNT 185,085 201,007
¹ Includes issues of Covered Bonds and issues of senior non-preferred bonds.
The debt instruments issued by Crédit Agricole S.A. and subscribed for by Crédit Agricole S.A. Group insurance
companies were eliminated for euro contracts. They were eliminated for the portion backing unit-linked contracts
with financial risk borne by the policyholder.
6.6 Non-current assets held for sale and discontinued operations
BALANCE SHEET OF DISCONTINUED OR HELD FOR SALE OPERATIONS
(in millions of euros) 30/06/2020 31/12/2019
Cash, central banks 45 55
Financial assets at fair value through profit or loss ‐ ‐
Hedging derivative Instruments ‐ ‐
Financial assets at fair value through other comprehensive income 40 (40)
Financial assets at amortised cost 393 370
Revaluation adjustment on interest rate hedged portfolios ‐ ‐
Current and deferred tax assets ‐ ‐
Accruals, prepayments and sundry assets 7 1
Investments in equity-accounted entities ‐ ‐
Investment property ‐ ‐
Property, plant and equipment 5 5
Intangible assets 3 4
Goodwill ‐ ‐
Total Assets 493 475
Central banks ‐ ‐
Financial liabilities at fair value through profit or loss ‐ ‐
Hedging derivative Instruments ‐ ‐
Financial liabilities at amortised cost 429 420
Revaluation adjustment on interest rate hedged portfolios ‐ ‐
Current and deferred tax liabilities ‐ ‐
Accruals, prepayments and sundry liabilities 6 5
Provisions 1 1
Subordinated debt 9 9
Adjustment to fair value of assets held for sale and discontinued operations
(excluding taxes) 43 43
Total Liabilities and equity 488 478
NET ASSET FROM DISCONTINUED OR HELD-FOR-SALE OPERATIONS 5 (3)

Comptes consolidés du groupe Crédit Agricole S.A. – 30 June 2020
81
INCOME STATEMENT FROM DISCONTINUED OPERATIONS
(in millions of euros) 30/06/2020 31/12/2019
Revenues 6 12
Operating expenses (6) (12)
Depreciation, amortisation and impairment of property, plant & equipment and
intangible assets (1) (2)
Cost of risk ‐ (1)
Pre-tax income (1) (3)
Share of net income of equity-accounted entities ‐ ‐
Net gains (losses) on other assets ‐ ‐
Change in value of goodwill ‐ ‐
Income tax charge ‐ ‐
Net income (1) (3)
Income associated with fair value adjustments of discontinued operations ‐ (43)
Net income from discontinued operations (1) (46)
Non-controlling interests ‐ ‐
NET INCOME FROM DISCONTINUED OPERATIONS - GROUP SHARE (1) (46)
DISCONTINUED OPERATIONS CASH FLOW STATEMENT
(in millions of euros) 30/06/2020 31/12/2019
Net cash flows from (used by) operating activities (12) (23)
Net cash flows from (used by) investment activities (1) ‐
Net cash flows from (used by) financing activities 3 7
TOTAL (10) (16)
6.7 Investment property
(in millions of euros) 31/12/2019
Changes in
scope
Increases
(acquisitions)
Decreases
(disposals)
Translation
adjustments
Other
movements 30/06/2020
Gross amount 6,673 ‐ 168 (144) ‐ 7 6,704
Depreciation and
impairment (97) ‐ (2) 2 ‐ (7) (104)
CARRYING AMOUNT ¹ 6,576 ‐ 166 (142) ‐ ‐ 6,600
¹ Including investment property let to third parties
(in millions of euros) 31/12/2019
Changes in
scope
Increases
(acquisitions)
Decreases
(disposals)
Translation
adjustments
Other
movements 31/12/2019
Gross amount 6,492 ‐ 555 (388) ‐ 14 6,673
Depreciation and impairment (84) ‐ (4) 7 ‐ (16) (97)
CARRYING AMOUNT ¹ 6,408 ‐ 551 (381) ‐ (2) 6,576
¹ Including investment property let to third parties

Comptes consolidés du groupe Crédit Agricole S.A. – 30 June 2020
82
6.8 Property, plant & equipment and intangible assets (excluding goodwill)
Property, plant & equipment used in operations include rights of use of fixed assets leased as a lessee.
Depreciation and impairment of property, plant and equipment is presented including depreciation on property,
plant and equipment leased under operating leases.
(in millions of euros) 31/12/2019
Changes in
scope
Increases
(acquisitions)
Decreases
(disposals and
redemptions)
Translation
adjustments
Other
movements 30/06/2020
Property, plant &
equipment used in
operations
Gross amount 10,249 ‐ 330 (245) (37) 6 10,303
Depreciation and
impairment (4,651) ‐ (356) 90 18 (5) (4,904)
CARRYING AMOUNT 5,598 ‐ (26) (155) (19) 1 5,399
Intangible assets
Gross amount 7,808 79 273 (14) (11) 25 8,160
Depreciation and
impairment (4,645) ‐ (226) (8) 6 (59) (4,932)
CARRYING AMOUNT 3,163 79 47 (22) (5) (34) 3,228
(in millions of euros) 31/12/2018 01/01/2019¹ Changes in scope ²
Increases
(acquisitions)
Decreases
(disposals and
redemptions)
Translation
adjustments
Other
movements 31/12/2019
Property, plant &
equipment used in
operations
Gross amount 8,466 9,968 (190) 769 (575) 56 221 10,249
Depreciation and
impairment (4,397) (4,451) 129 (707) 461 (25) (58) (4,651)
CARRYING AMOUNT 4,069 5,517 (61) 62 (114) 31 163 5,598
Intangible assets
Gross amount 6,985 6,926 697 586 (411) 11 (1) 7,808
Depreciation and
impairment (4,698) (4,644) 80 (442) 390 (6) (23) (4,645)
CARRYING AMOUNT 2,287 2,282 777 144 (21) 5 (24) 3,163
¹ Right of use impact recognised in First Time Application of the IFRS 16 standard (Cf note 1.1 Applicable standards and comparability)
² Primarily attributable to the entries of Agos S.p.A and Santander Securities Services S.A.
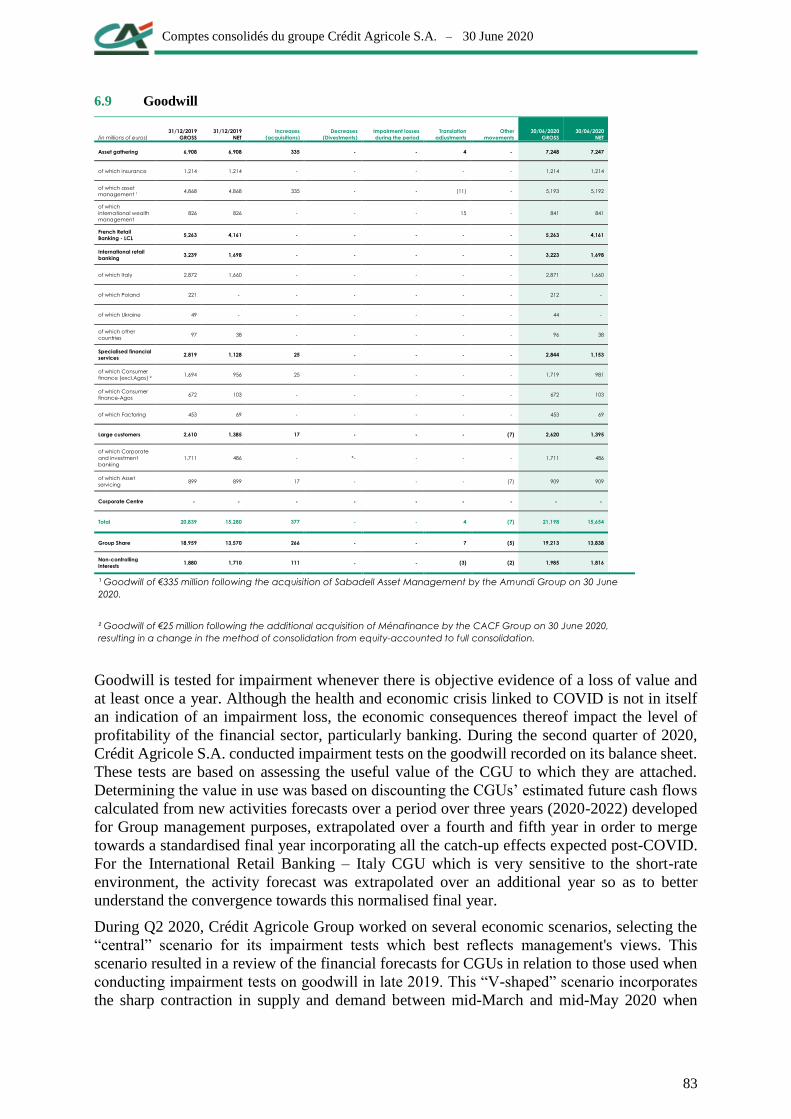
Comptes consolidés du groupe Crédit Agricole S.A. – 30 June 2020
83
6.9 Goodwill
(in millions of euros)
31/12/2019
GROSS
31/12/2019
NET
Increases
(acquisitions)
Decreases
(Divestments)
Impairment losses
during the period
Translation
adjustments
Other
movements
30/06/2020
GROSS
30/06/2020
NET
Asset gathering 6,908 6,908 335 ‐ ‐ 4 ‐ 7,248 7,247
of which insurance 1,214 1,214 ‐ ‐ ‐ ‐ ‐ 1,214 1,214
of which asset
management ¹ 4,868 4,868 335 ‐ ‐ (11) ‐ 5,193 5,192
of which
international wealth
management
826 826 ‐ ‐ ‐ 15 ‐ 841 841
French Retail
Banking - LCL 5,263 4,161 ‐ ‐ ‐ ‐ ‐ 5,263 4,161
International retail
banking 3,239 1,698 ‐ ‐ ‐ ‐ ‐ 3,223 1,698
of which Italy 2,872 1,660 ‐ ‐ ‐ ‐ ‐ 2,871 1,660
of which Poland 221 ‐ ‐ ‐ ‐ ‐ ‐ 212 ‐
of which Ukraine 49 ‐ ‐ ‐ ‐ ‐ ‐ 44 ‐
of which other
countries 97 38 ‐ ‐ ‐ ‐ ‐ 96 38
Specialised financial
services 2,819 1,128 25 ‐ ‐ ‐ ‐ 2,844 1,153
of which Consumer
finance (excl.Agos) ² 1,694 956 25 ‐ ‐ ‐ ‐ 1,719 981
of which Consumer
finance-Agos 672 103 ‐ ‐ ‐ ‐ ‐ 672 103
of which Factoring 453 69 ‐ ‐ ‐ ‐ ‐ 453 69
Large customers 2,610 1,385 17 ‐ ‐ ‐ (7) 2,620 1,395
of which Corporate
and investment
banking
1,711 486 ‐ *‐ ‐ ‐ ‐ 1,711 486
of which Asset
servicing 899 899 17 ‐ ‐ ‐ (7) 909 909
Corporate Centre ‐ ‐ ‐ ‐ ‐ ‐ ‐ ‐ ‐
Total 20,839 15,280 377 ‐ ‐ 4 (7) 21,198 15,654
Group Share 18,959 13,570 266 ‐ ‐ 7 (5) 19,213 13,838
Non-controlling
interests 1,880 1,710 111 ‐ ‐ (3) (2) 1,985 1,816
¹ Goodwill of €335 million following the acquisition of Sabadell Asset Management by the Amundi Group on 30 June
2020.
² Goodwill of €25 million following the additional acquisition of Ménafinance by the CACF Group on 30 June 2020,
resulting in a change in the method of consolidation from equity-accounted to full consolidation.
Goodwill is tested for impairment whenever there is objective evidence of a loss of value and
at least once a year. Although the health and economic crisis linked to COVID is not in itself
an indication of an impairment loss, the economic consequences thereof impact the level of
profitability of the financial sector, particularly banking. During the second quarter of 2020,
Crédit Agricole S.A. conducted impairment tests on the goodwill recorded on its balance sheet.
These tests are based on assessing the useful value of the CGU to which they are attached.
Determining the value in use was based on discounting the CGUs’ estimated future cash flows
calculated from new activities forecasts over a period over three years (2020-2022) developed
for Group management purposes, extrapolated over a fourth and fifth year in order to merge
towards a standardised final year incorporating all the catch-up effects expected post-COVID.
For the International Retail Banking – Italy CGU which is very sensitive to the short-rate
environment, the activity forecast was extrapolated over an additional year so as to better
understand the convergence towards this normalised final year.
During Q2 2020, Crédit Agricole Group worked on several economic scenarios, selecting the
“central” scenario for its impairment tests which best reflects management's views. This
scenario resulted in a review of the financial forecasts for CGUs in relation to those used when
conducting impairment tests on goodwill in late 2019. This “V-shaped” scenario incorporates
the sharp contraction in supply and demand between mid-March and mid-May 2020 when

Comptes consolidés du groupe Crédit Agricole S.A. – 30 June 2020
84
lockdown was in place. This contraction would be reflected by a sharp fall in gross domestic
product in Q2 2020, intensifying that of Q1. This would be followed by a significant upturn in
Q3 2020 linked to a rapid recovery in the consumption of goods, and a gradual recovery of the
consumption of services, helped in particular by the rapid, unprecedented response of regulators
and auditors (adoption of a share buy-back programme, authorisation for banks to make full use
of equity and liquidity buffers, early easing of Pillar 2 capital composition requirements,
extension of the scope of eligible assets under the corporate bond purchasing programme, etc.).
This resumption of activity would then continue at a more gradual pace. The deterioration of
production capacity would remain limited owing to support measures helping to protect jobs
and household income. The scenario is based on a 2022 GDP level that is slightly higher than
that of 2019.
For those CGUs showing a relatively limited difference between the value in use and
consolidated value as at 31 December 2019, additional work was undertaken in connection with
making up the financial statements as at 30 June 2020. These CGUs are French Retail Banking
– LCL, International Retail Banking – Italy, and Consumer Finance (excluding Agos). For the
other CGUs, the positive difference between the value in use and the consolidated value as at
31 December 2019 is such that the Group considers that an update to impairment tests would
not have led to the need for depreciation.
This work consisted of reviewing the value of goodwill based on revised financial forecasts and
on conducting sensitivity analyses, the results of which are presented below. The methodology
remains unchanged compared with the work undertaken as at 31 December 2019, with the
exception of the recognition of a number of regulatory changes: the removal of a number of
counter-cyclical buffers for the term of the plan (including the French buffer, following the
decision of the High Council for Financial Stability (Haut Conseil de Stabilité Financière) of
18 June 2020) and the early application of Article 104a of CRD 5 authorising the hedging of
Pillar 2 requirements (P2R) with 75% of Tier 1 capital, thus reducing the CET1 requirement by
66 basis points in both P2R and P2G for Crédit Agricole S.A., French Retail Banking – LCL,
and Consumer Finance (excluding Agos) and by 77 basis points for the International Retail
Banking – Italy CGU. The valuation parameters, in particular, the discount rates, were updated
as at 30 June 2020.
Therefore, the calculation parameters are as follows:
Discount rate: 7.8% for French Retail Banking CGU – LCL, 8.2% for the Consumer
Finance CGU (excluding Agos) and 9.0% for the International Retail Banking – Italy
CGU,
Allocation of CET1 equity capital: 8.85% for the French Retail Banking – LCL and
Consumer Finance CGUs (excluding Agos), and 8.99% for the International Retail
Banking – Italy CGU,
Perpetual growth rate of cash flows: kept at 2% for the 3 CGUs.
Following this work, Crédit Agricole S.A. did not see any evidence to suggest any depreciation
in goodwill as at 30 June 2020.
Sensitivity tests were conducted on goodwill Group share with changes in the main valuation
parameters. These tests show that the French Retail Banking – LCL CGU, the International
Retail Banking – Italy CGU and the Consumer Finance (excluding Agos) CGU affected by the
consequences of the health crisis and the persistent low interest-rate environment, are sensitive
to deteriorations in the model’s parameters. These tests showed the following results:
With regard to financial parameters:
a change of +50 basis points in discount rates would result in a negative difference

Comptes consolidés du groupe Crédit Agricole S.A. – 30 June 2020
85
between the value in use and the carrying amount of approximately €330 million for the
French Retail Banking – LCL CGU and approximately €320 million for the International
Retail Banking – Italy CGU, and approximately €30 million for the Consumer Finance
(excluding Agos) CGU.
a variation of +100 basis points in the level of CET1 equity allocated to CGUs would
result in a negative difference of approximately €230 million for the International Retail
Banking – Italy CGU. The French Retail Banking – LCL and Consumer Finance
(excluding Agos) CGUs would retain positive differences between the value in use and
the consolidated value.
With regard to operational parameters, they show that only the International Retail Banking
– Italy and Consumer Finance (excluding Agos) CGUs are sensitive to the deterioration in
operational parameters we have simulated:
For the International retail banking – Italy CGU, both the scenario of a +100 bp variation
in the cost/income ratio (1) in the final forecast year, and the scenario of a +10% increase
in the cost of risk for that year would result in a negative difference between the value in
use and the consolidated value of some €140 million.
For the Consumer Finance (excluding Agos) CGU, the +10% increase in the cost of risk
in the final forecast year would result in a negative difference of approximately €150
million between the value in use and the consolidated value. Assuming a +100 bp
increase in the cost/income ratio in the final forecast year, the value in use would remain
higher than the consolidated value.
Sensitivity of CGU values in use to the main valuation parameters
Au 30 juin 2020
Sensitivity to
capital
allocated
Sensitivity to discount
rates
Sensitivity to cost of risk
in the final year
Sensitivity to the
cost/income ratio in the
final year
+ 100 pb - 50 pb + 50 pb - 10% + 10% - 100 pb + 100 pb
Frensh retail banking - LCL (2,5 %) + 8,3 % (6,9 %) + 2,9 % (2,9 %) + 3,3 % (3,3 %)
International retail banking - Italy (4,4 %) + 7,3 % (6,3 %) + 2,4 % (2,4 %) + 2,4 % (2,4 %)
Consumer credit (excluding Agos) (6,4 %) + 9,8 % (8,3 %) + 13,5 % (13,5 %) + 5,5 % (5,5 %)
(1) At constant income
6.10 Insurance company technical reserves
BREAKDOWN OF INSURANCE TECHNICAL RESERVES
30/06/2020
(in millions of euros) Life Non-Life International Creditor Total
Insurance contracts 209,687 6,840 23,690 1,997 242,214
Investment contracts with discretionary profit-sharing 68,569 ‐ 15,484 ‐ 84,053
Investment contracts without discretionary profit-sharing 2,447 ‐ 1,590 ‐ 4,037
Deferred participation benefits (liability) 21,427 ‐ 561 ‐ 21,988
Total Technical reserves 302,130 6,840 41,325 1,997 352,292
Deferred participation benefits (asset) ‐ ‐ ‐ ‐ ‐
Reinsurer's share of technical reserves (1,187) (616) (82) (280) (2,165)
NET TECHNICAL RESERVES 300,943 6,224 41,243 1,717 350,127
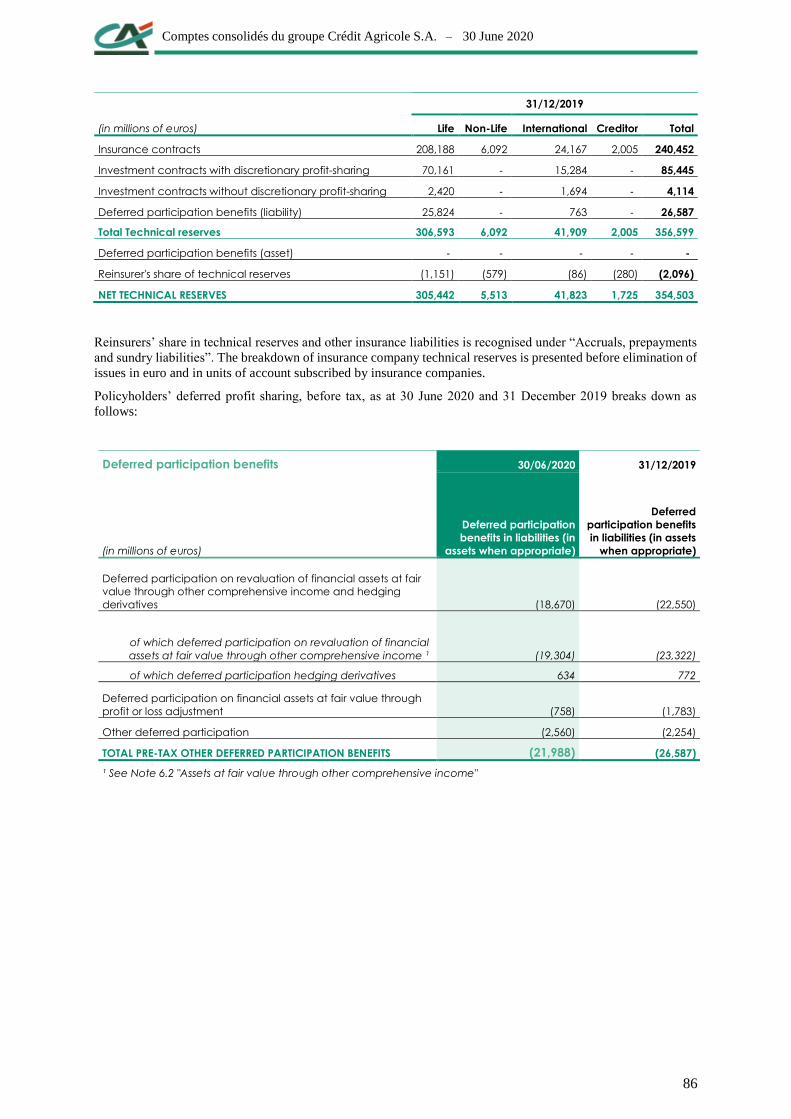
Comptes consolidés du groupe Crédit Agricole S.A. – 30 June 2020
86
31/12/2019
(in millions of euros) Life Non-Life International Creditor Total
Insurance contracts 208,188 6,092 24,167 2,005 240,452
Investment contracts with discretionary profit-sharing 70,161 ‐ 15,284 ‐ 85,445
Investment contracts without discretionary profit-sharing 2,420 ‐ 1,694 ‐ 4,114
Deferred participation benefits (liability) 25,824 ‐ 763 ‐ 26,587
Total Technical reserves 306,593 6,092 41,909 2,005 356,599
Deferred participation benefits (asset) ‐ ‐ ‐ ‐ ‐
Reinsurer's share of technical reserves (1,151) (579) (86) (280) (2,096)
NET TECHNICAL RESERVES 305,442 5,513 41,823 1,725 354,503
Reinsurers’ share in technical reserves and other insurance liabilities is recognised under “Accruals, prepayments
and sundry liabilities”. The breakdown of insurance company technical reserves is presented before elimination of
issues in euro and in units of account subscribed by insurance companies.
Policyholders’ deferred profit sharing, before tax, as at 30 June 2020 and 31 December 2019 breaks down as
follows:
Deferred participation benefits 30/06/2020 31/12/2019
(in millions of euros)
Deferred participation
benefits in liabilities (in
assets when appropriate)
Deferred
participation benefits
in liabilities (in assets
when appropriate)
Deferred participation on revaluation of financial assets at fair
value through other comprehensive income and hedging
derivatives (18,670) (22,550)
of which deferred participation on revaluation of financial
assets at fair value through other comprehensive income ¹ (19,304) (23,322)
of which deferred participation hedging derivatives 634 772
Deferred participation on financial assets at fair value through
profit or loss adjustment (758) (1,783)
Other deferred participation (2,560) (2,254)
TOTAL PRE-TAX OTHER DEFERRED PARTICIPATION BENEFITS (21,988) (26,587)
¹ See Note 6.2 "Assets at fair value through other comprehensive income"

Comptes consolidés du groupe Crédit Agricole S.A. – 30 June 2020
87
6.11 Provisions
(in millions of euros) 31/12/2019
Changes
in scope Additions
Reversals,
amounts used
Reversals,
amounts not
used
Translation
adjustments
Other
movements 30/06/2020
Home purchase
schemes risks 367 ‐ 61 ‐ ‐ ‐ ‐ 428
Execution risks of
commitments by
signature 910 2 417 (4) (449) (1) (3) 872
Operational risks 103 ‐ 8 (7) (17) (1) (13) 73
Employee retirement
and similar benefits 1,667 ‐ 48 (51) (13) 4 3 1,658
Litigation 607 ‐ 14 (28) (10) (1) ‐ 582
Equity investments ‐ ‐ ‐ ‐ ‐ ‐ ‐ ‐
Restructuring 33 ‐ ‐ (2) ‐ ‐ ‐ 31
Other risks 677 ‐ 157 (76) (137) ‐ (5) 616
TOTAL 4,364 2 705 (168) (626) 1 (18) 4,260
As at 30 June 2020, employment-related retirement and similar commitments included €87 million (€103 million
as at 30 June 2019) of provisions arising from social costs of the adaptation plans. The provision for restructuring
includes the non-social costs of those plans.
(in millions of euros) 31/12/2018 01/01/2019
Changes in
scope Additions
Reversals,
amounts used
Reversals, amounts
unused
Translation
adjustments
Other
movements 31/12/2019
Home purchase
schemes risks 245 245 ‐ 122 ‐ ‐ ‐ ‐ 367
Execution risks of
commitments by
signature 872 872 ‐ 776 (41) (710) 8 5 910
Operational risks 68 68 ‐ 35 (11) (9) ‐ 20 103
Employee
retirement and
similar benefits 1,709 1,709 (5) 151 (226) (87) 8 117 1,667
Litigation 2,132 521 2 52 (39) (27) 2 96 607
Equity investments 1 1 ‐ 2 (1) (2) ‐ ‐ ‐
Restructuring 24 24 2 12 (2) (1) ‐ (2) 33
Other risks 758 758 3 132 (72) (120) ‐ (24) 677
TOTAL 5,809 4,198 2 1,282 (392) (956) 18 212 4,364
1 Reclassification of provisions for tax risks relating to income tax from “Provisions” to “Current and deferred tax liabilities” at 1 January
2019 for €1,611 million.

Comptes consolidés du groupe Crédit Agricole S.A. – 30 June 2020
88
Crédit Agricole Consumer Finance Nederland B.V.
The conditions for the review of the interest rates of revolving loans marketed by Crédit Agricole Consumer
Finance Nederland BV, a fully owned subsidiary of Crédit Agricole Consumer Finance SA, and its subsidiaries
are the subject of borrowers’ claims relating to the criteria for revising these rates and possible overpayments of
interests.
On 21 January 2019, in 2 individual cases concerning two subsidiaries of Crédit Agricole Consumer Finance
Nederland BV, the Appeals Committee of KIFID (the Financial Services Complaints Authority) in the Netherlands
decided that in case the consumers had no or insufficient information on the specific factors that determine the
interest rate, the individual interest rate needed to follow the movement of market interest rates on consumer loans.
In May 2020, Crédit Agricole Consumer Finance Nederland B.V. implemented a compensation plan for the benefit
of borrowers which took account of the aforementioned decisions of KIFID.
Amundi – AMF procedure
Following an enquiry carried out between 2017 and 2019, the French Financial Markets Authority (AMF) notified
Amundi of objections on 12 June 2020. The objections concern the management of a number of transactions made
by two Amundi employees between 2014 and 2015. This case was passed on to a Rapporteur who will present
their findings to the Sanctions Committee once the case has been investigated. Amundi is cooperating fully in
respect of this procedure. To date, no sanctions have been imposed against Amundi.
6.12 Subordinated debt
(in millions of euros) 30/06/2020 31/12/2019
Dated subordinated debt ¹ 22,287 20,822
Undated subordinated debt ² 518 747
Mutual security deposits 172 167
Participating securities and loans 61 61
CARRYING AMOUNT 23,038 21,797
¹ Includes issues of dated subordinated notes “TSR”.
² incudes issues of deeply subordinated notes "TSR" and undated subordinated notes "TSDI".
As at 30 June 2020, the outstanding amount of super-subordinated securities is €253 million
compared with €472 million as at 31 December 2019.
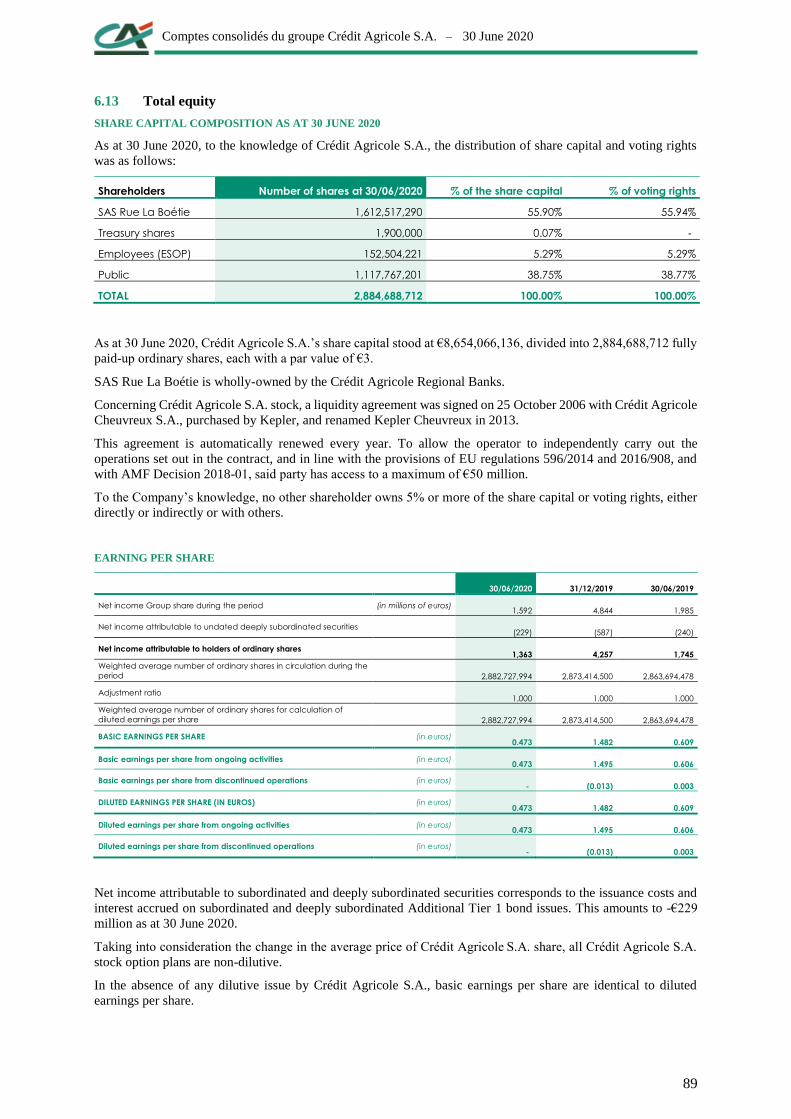
Comptes consolidés du groupe Crédit Agricole S.A. – 30 June 2020
89
6.13 Total equity
SHARE CAPITAL COMPOSITION AS AT 30 JUNE 2020
As at 30 June 2020, to the knowledge of Crédit Agricole S.A., the distribution of share capital and voting rights
was as follows:
Shareholders Number of shares at 30/06/2020 % of the share capital % of voting rights
SAS Rue La Boétie 1,612,517,290 55.90% 55.94%
Treasury shares 1,900,000 0.07% ‐
Employees (ESOP) 152,504,221 5.29% 5.29%
Public 1,117,767,201 38.75% 38.77%
TOTAL 2,884,688,712 100.00% 100.00%
As at 30 June 2020, Crédit Agricole S.A.’s share capital stood at €8,654,066,136, divided into 2,884,688,712 fully
paid-up ordinary shares, each with a par value of €3.
SAS Rue La Boétie is wholly-owned by the Crédit Agricole Regional Banks.
Concerning Crédit Agricole S.A. stock, a liquidity agreement was signed on 25 October 2006 with Crédit Agricole
Cheuvreux S.A., purchased by Kepler, and renamed Kepler Cheuvreux in 2013.
This agreement is automatically renewed every year. To allow the operator to independently carry out the
operations set out in the contract, and in line with the provisions of EU regulations 596/2014 and 2016/908, and
with AMF Decision 2018-01, said party has access to a maximum of €50 million.
To the Company’s knowledge, no other shareholder owns 5% or more of the share capital or voting rights, either
directly or indirectly or with others.
EARNING PER SHARE
30/06/2020 31/12/2019 30/06/2019
Net income Group share during the period (in millions of euros) 1,592 4,844 1,985
Net income attributable to undated deeply subordinated securities (229) (587) (240)
Net income attributable to holders of ordinary shares 1,363 4,257 1,745
Weighted average number of ordinary shares in circulation during the
period 2,882,727,994 2,873,414,500 2,863,694,478
Adjustment ratio 1.000 1.000 1.000
Weighted average number of ordinary shares for calculation of
diluted earnings per share 2,882,727,994 2,873,414,500 2,863,694,478
BASIC EARNINGS PER SHARE (in euros) 0.473 1.482 0.609
Basic earnings per share from ongoing activities (in euros) 0.473 1.495 0.606
Basic earnings per share from discontinued operations (in euros) ‐ (0.013) 0.003
DILUTED EARNINGS PER SHARE (IN EUROS) (in euros) 0.473 1.482 0.609
Diluted earnings per share from ongoing activities (in euros) 0.473 1.495 0.606
Diluted earnings per share from discontinued operations (in euros) ‐ (0.013) 0.003
Net income attributable to subordinated and deeply subordinated securities corresponds to the issuance costs and
interest accrued on subordinated and deeply subordinated Additional Tier 1 bond issues. This amounts to -€229
million as at 30 June 2020.
Taking into consideration the change in the average price of Crédit Agricole S.A. share, all Crédit Agricole S.A.
stock option plans are non-dilutive.
In the absence of any dilutive issue by Crédit Agricole S.A., basic earnings per share are identical to diluted
earnings per share.

Comptes consolidés du groupe Crédit Agricole S.A. – 30 June 2020
90
DIVIDENDS
For the 2019 financial year, Crédit Agricole S.A.’s Board of Directors’ Meeting of 13 February 2020 decided to
recommend to the General Meeting of Shareholders of 13 May 2020 the payment of a dividend of €0.70 per share
in cash, to be paid on 20 May 2020. The intention to distribute dividends for the 2019 financial year was deemed
incompatible with the recommendations of the European Central Bank issued on 27 March, which asked the banks
under its supervision not to pay dividends while the coronavirus crisis continued and not until “at least early
October 2020”. This period seems to be incompatible with the French Commercial Code (Code de commerce)
which prescribes payment of the annual dividend by 30 September at the latest.
Under these conditions, Crédit Agricole S.A.'s Board of Directors, consulted in writing on 1 April 2020 pursuant
to the legal provisions on the functioning of the deliberative bodies during the COVID-19 epidemic, resolved to
propose to the General Meeting of 13 May 2020 the allocation of all of the earnings for 2019 to a reserve account.
(in euros) 2019 2018 2017 2016 2015
Ordinary dividend N/A 0.69 0.63 0.60 0.60
Loyalty dividend N/A N/A 0.693 0.660 0.660
APPROPRIATION OF NET INCOME
The appropriation of net income was approved by the Combined General Meeting of Crédit Agricole S.A. on Tuesday
13 May 2020, on the proposal of the Board of Directors.
Crédit Agricole S.A. parent company posted positive net income of €2,015,810,057.93 in the 2019 financial year.
The Combined General Meeting resolved:
to record that the profit for the financial year amounts to €2,015,810,057.93;
to allocate the amount of €5,475,466.80 to the legal reserve to bring it up to 10% of the share capital;
to appropriate the balance of the profit for the financial year, i.e. the sum of €2,010,334,591.13 to a reserve
account.

Comptes consolidés du groupe Crédit Agricole S.A. – 30 June 2020
91
UNDATED SUBORDINATED AND DEEPLY SUBORDINATED DEBT
The main issues of undated subordinated and deeply subordinated debt classified in shareholders’ equity Group
share are:
Issue date Currency
Amount in
currency at 30
June 2020
At 30 June 2020
Amount in
currency at
31
December
2019
Partial
repurchases
and
redemptions
Amount in euros
at inception rate
Interests paid
Group share
Issuance
costs net of
taxes
Shareholders’
equity Group
share
(in millions of
units)
(in millions of
units)
(in millions of
units)
(in millions of
euros)
(in millions of
euros)
(in millions of
euros)
(in millions of
euros)
1/23/2014 USD 1,750 ‐ 1,750 1,283 (770) (8) 505
4/8/2014 GBP 500 ‐ 500 607 (279) (4) 324
4/8/2014 EUR 1,000 ‐ 1,000 1,000 (403) (6) 591
1/19/2016 USD 1,250 1,250 1,150 (397) (8) 745
2/26/2019 USD 1,250 1,250 1,098 (83) (7) 1,008
Crédit Agricole
S.A. Issues 5,138 (1,932) (33) 3,173
14/10/2014 EUR ‐ (169) (3) (172)
13/01/2015 EUR ‐ (214) (3) (217)
Insurance Issues ‐ (383) (6) (389)
Issues subscribed in-house :
Group share / Non controlling
interests effect ‐ 73 ‐ 73
Issues subscribed by Crédit
Agricole CIB for currency
regulation (8) ‐ ‐ (8)
TOTAL 5,130 (2,242) (39) 2,849
The main issues of undated subordinated and deeply subordinated debt classified in shareholder’s equity – Non
controlling interests share (insurance) are:
Issue date Currency
Amount in
currency at 31
December
2019
Partial
repurchases and
redemptions
Amount in
currency at 30
June 2020
Amount in euros
at inception rate
(in millions of
units)
(in millions of
units)
(in millions of
units)
(in millions of
euros)
14/10/2014 EUR 745 ‐ 745 745
13/01/2015 EUR 1,000 ‐ 1,000 1,000
TOTAL 1,745
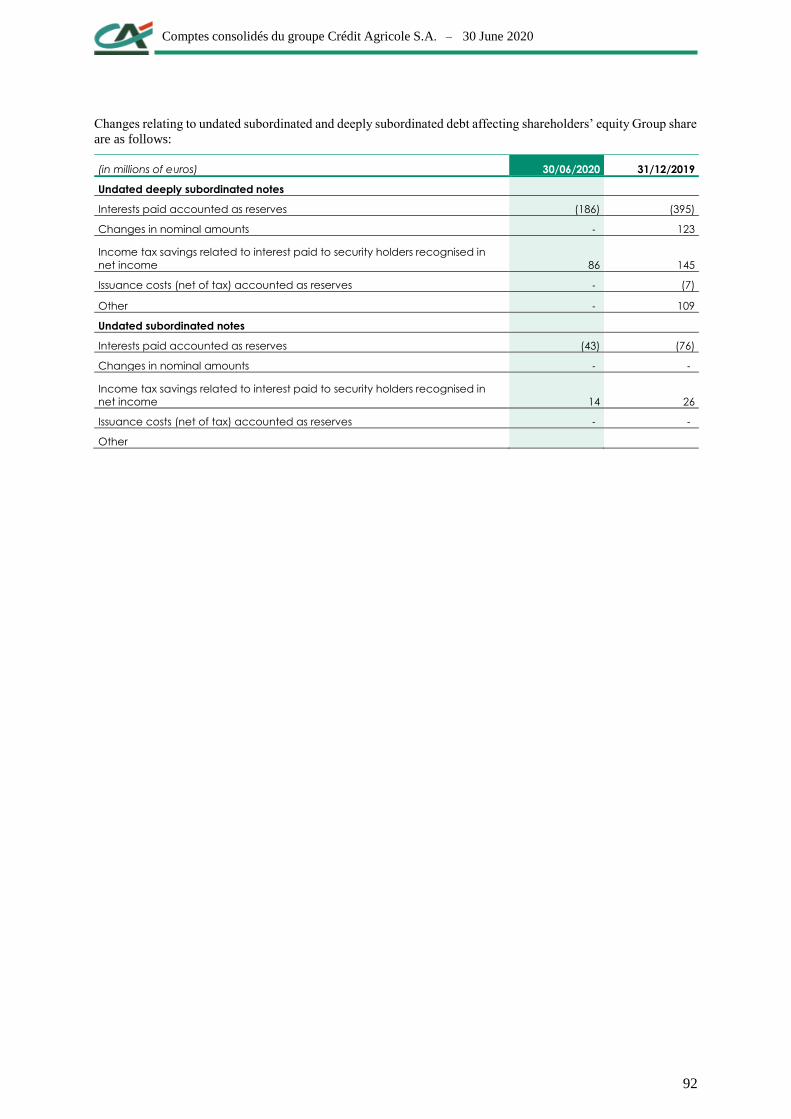
Comptes consolidés du groupe Crédit Agricole S.A. – 30 June 2020
92
Changes relating to undated subordinated and deeply subordinated debt affecting shareholders’ equity Group share
are as follows:
(in millions of euros) 30/06/2020 31/12/2019
Undated deeply subordinated notes
Interests paid accounted as reserves (186) (395)
Changes in nominal amounts ‐ 123
Income tax savings related to interest paid to security holders recognised in
net income 86 145
Issuance costs (net of tax) accounted as reserves ‐ (7)
Other ‐ 109
Undated subordinated notes
Interests paid accounted as reserves (43) (76)
Changes in nominal amounts ‐ ‐
Income tax savings related to interest paid to security holders recognised in
net income 14 26
Issuance costs (net of tax) accounted as reserves ‐ ‐
Other

Comptes consolidés du groupe Crédit Agricole S.A. – 30 June 2020
93
NOTE 7 Commitments given and received and other guarantees
Financing and guarantee commitments and other guarantees include discontinued operations.
COMMITMENTS GIVEN AND RECEIVED
(in millions of euros) 30/06/2020 31/12/2019
Commitments given
Financing commitments 162,738 154,791
Commitments given to credit institutions 16,636 13,433
Commitments given to customers 146,102 141,358
Confirmed credit lines 120,537 112,825
Documentary credits 2,765 4,282
Other confirmed credit lines 117,772 108,543
Other commitments given to customers 25,565 28,533
Guarantee commitments 83,123 87,884
Credit institutions 7,075 8,542
Confirmed documentary credit lines 2,138 3,372
Other garantees ¹ 4,937 5,170
Customers 76,048 79,342
Property guarantees 1,789 2,168
Other customer guarantees 74,259 77,175
Securities commitments 16,228 4,765
Securities to be delivered 16,228 4,765
Commitments received
Financing commitments 141,801 84,102
Commitments received from credit institutions 138,030 81,155
Commitments received from customers 3,771 2,946
Guarantee commitments 338,283 327,988
Commitments received from credit institutions 92,680 94,670
Commitments received from customers 245,603 233,318
Guarantees received from government bodies or similar institutions ² 31,925 25,934
Other guarantees received 213,678 207,385
Securities commitments 15,526 4,556
Securities to be received 15,526 4,556
¹ Of which €5.9 billion relates to Insurance Switch guarantees following the partial early termination on 2 March 2020
² As at 30 June 2020, as part of the economic support measures enacted in response to the COVID-19 health crisis, Crédit Agricole S.A.
Group granted State-guaranteed loans for which it received State guarantees in the amount of €7.3 billion.

Comptes consolidés du groupe Crédit Agricole S.A. – 30 June 2020
94
FINANCIAL INSTRUMENTS GIVEN AND RECEIVED AS COLLATERAL
(in millions of euros) 30/06/2020 31/12/2019
Carrying amount of financial assets provided as collateral (including transferred
assets)
Securities and receivables provided as collateral for the refinancing structures
(Banque de France, CRH, etc.) 365,415 189,444
Securities lent 9,906 8,874
Security deposits on market transactions 23,431 18,155
Other security deposits ‐ ‐
Securities sold under repurchase agreements 108,775 104,627
TOTAL CARRYING AMOUNT OF FINANCIAL ASSETS PROVIDED AS COLLATERAL 507,527 321,099
Carrying amount of financial assets received in garantee
Other security deposits ¹ 2,017 3,102
Fair value of instruments received as reusable and reused collateral
Securities borrowed 5 4
Secutities bought under repurchase agreements 395,017 275,463
Securities sold short 30,913 33,468
TOTAL FAIR VALUE OF INSTRUMENTS RECEIVED AS REUSABLE AND REUSED
COLLATERAL 425,935 308,935
¹ Within the framework of the Insurance Switch guarantees, following the partial early termination on 2 March 2020, Crédit Agricole
S.A. received a deposit of €2 billion
RECEIVABLES PLEDGED AS COLLATERAL
As at 30 June 2020, Crédit Agricole S.A. deposited €187.9 billion of receivables (mainly on behalf of the Regional
Banks) for refinancing transactions to the Banque de France, compared to €81.9 billion at 31 December 2019, and
€48.2 billion of receivables were deposited directly by others subsidiaries (including €2.6 billion in securities).
As at 30 June 2020, Crédit Agricole S.A. deposited €12.1 billion of receivables for refinancing transactions to the
Caisse de Refinancement de l’Habitat on behalf of the Regional Banks, compared to €12.3 billion as at 31
December 2019, and €1.7 billion of receivables were deposited directly by LCL.
As at 30 June 2020, €2.7 billion of receivables of the Regional Banks had been pledged as collateral for the covered
bonds issued by European Secured Notes Issuer (ESNI), a French securitisation company formed by five banks
including Crédit Agricole Group, and €0.5 billion of Crédit Agricole CIB’s receivables were fully transferred as
collateral.
As at 30 June 2020, €40.3 billion of Regional Banks and €10.0 billion of LCL receivables had been pledged as
collateral for the covered bond issues of Crédit Agricole Home Loan SFH, a financial company wholly owned by
Crédit Agricole S.A.
As at 30 June 2020, in the context of transactions with EIB/CEB supranationals, Crédit Agricole S.A. deposited
€2.7 billion in receivables on behalf of the regional banks.
As at 30 June 2020, in the context of refinancing transactions with CDC, Crédit Agricole S.A. deposited €2.7
billion in receivables on behalf of the regional banks.
These processes, for which there is no transfer of contractual cash flows, do not form part of the asset transfers.
GUARANTEES HELD
Guarantees held and assets received as collateral by Crédit Agricole S.A. which it is allowed to sell or to use as
collateral are mostly held within Crédit Agricole S.A. for €211 billion and within Crédit Agricole CIB for €156
billion. The majority of these are receivables pledged as collateral by the Regional Banks to Crédit Agricole S.A.,
the latter acting as the central body with regard to the external refinancing organisations, in order to obtain
refinancing. These receivables (property-related, or loans to businesses or local authorities) are selected and rated
for their quality and retained on the balance sheet of the Regional Banks.
Comptes consolidés du groupe Crédit Agricole S.A. – 30 June 2020
95
The majority of these guarantees consist of mortgage liens, collateral or guarantees received, regardless of the
quality of the assets guaranteed. They are mainly related to repurchase agreements and securities pledged to
guarantee brokerage transactions.
Crédit Agricole S.A. Group policy is to sell seized collateral as soon as possible. Crédit Agricole CIB and Crédit
Agricole S.A. had no such assets as at 30 June 2020.

Comptes consolidés du groupe Crédit Agricole S.A. – 30 June 2020
96
NOTE 8 Reclassifications of financial instruments
PRINCIPLES APPLIED BY THE CRÉDIT AGRICOLE S.A. GROUP
Reclassifications are performed only under exceptional circumstances and following a decision by the Executive
Management of the entity as a result of internal or external changes: significant changes in the entity's activity.
RECLASSIFICATIONS PERFORMED BY CRÉDIT AGRICOLE S.A. GROUP
In 2020, Crédit Agricole S.A. did not carry out any reclassification pursuant to paragraph 4.4.1 of IFRS 9.
Comptes consolidés du groupe Crédit Agricole S.A. – 30 June 2020
97
NOTE 9 Fair value of financial instruments
Fair value is the price that would be received at the sale of an asset or paid to transfer a liability
in a standard transaction between market participants at the measurement date.
Fair value is defined on the basis of the exit price.
The fair values shown below are estimates made on the reporting date using observable market
data wherever possible. These are subject to change in subsequent periods due to developments
in market conditions or other factors.
The calculations represent best estimates. They are based on a number of assumptions. It is
assumed that market participants act in their best economic interest.
To the extent that these models contain uncertainties, the fair values shown may not be achieved
upon actual sale or immediate settlement of the financial instruments concerned.
The fair value hierarchy of financial assets and liabilities is broken down according to the
general observability criteria of the valuation inputs, pursuant to the principles defined under
IFRS 13.
Level 1 of the hierarchy applies to the fair value of financial assets and liabilities quoted in
active markets.
Level 2 of the hierarchy applies to the fair value of financial assets and liabilities with
observable inputs. This agreement includes market data relating to interest rate risk or credit
risk when the latter can be revalued based on Credit Default Swap (CDS) spreads. Securities
bought or sold under repurchase agreements with underlyings quoted in an active market are
also included in Level 2 of the hierarchy, as are financial assets and liabilities with a demand
component for which fair value is measured at unadjusted amortised cost.
Level 3 of the hierarchy is used for financial instruments at fair value for which the valuation
draws upon, exclusively or for a significant part, unobservable market parameters.
Parameters for which no market information is available, or for which the available market
information is considered insufficient, are regarded as unobservable. This qualification may
call upon expert opinion. The information examined may include transactions actually
concluded, firm or indicative quotations and information resulting from market consensus.
In some cases, market values are close to carrying amounts. This concerns the following
reserves in particular:
assets or liabilities at variable rates for which interest rate changes do not have a
significant influence on the fair value, since the rates on these instruments frequently
adjust themselves to the market rates;
short-term assets or liabilities where the redemption value is considered to be close to
the market value;
instruments executed on a regulated market for which the prices are set by the public
authorities;
demand assets and liabilities.
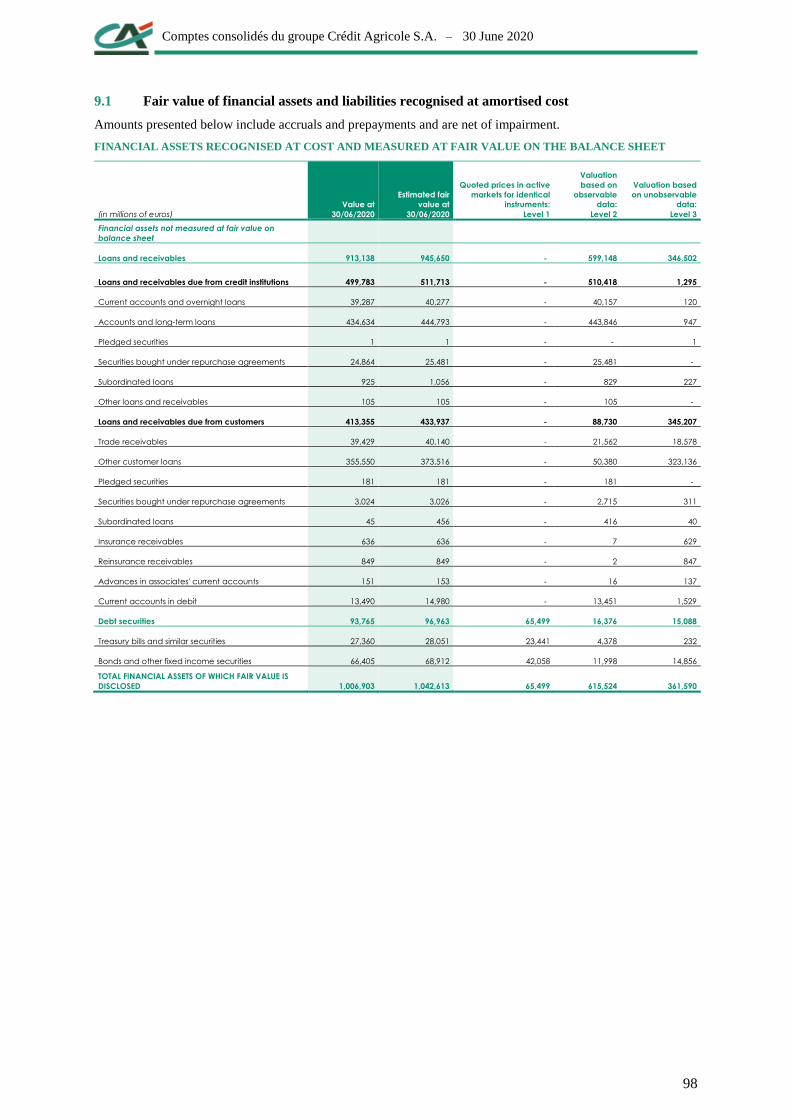
Comptes consolidés du groupe Crédit Agricole S.A. – 30 June 2020
98
9.1 Fair value of financial assets and liabilities recognised at amortised cost
Amounts presented below include accruals and prepayments and are net of impairment.
FINANCIAL ASSETS RECOGNISED AT COST AND MEASURED AT FAIR VALUE ON THE BALANCE SHEET
(in millions of euros)
Value at
30/06/2020
Estimated fair
value at
30/06/2020
Quoted prices in active
markets for identical
instruments:
Level 1
Valuation
based on
observable
data:
Level 2
Valuation based
on unobservable
data:
Level 3
Financial assets not measured at fair value on
balance sheet
Loans and receivables 913,138 945,650 ‐ 599,148 346,502
Loans and receivables due from credit institutions 499,783 511,713 ‐ 510,418 1,295
Current accounts and overnight loans 39,287 40,277 ‐ 40,157 120
Accounts and long-term loans 434,634 444,793 ‐ 443,846 947
Pledged securities 1 1 ‐ ‐ 1
Securities bought under repurchase agreements 24,864 25,481 ‐ 25,481 ‐
Subordinated loans 925 1,056 ‐ 829 227
Other loans and receivables 105 105 ‐ 105 ‐
Loans and receivables due from customers 413,355 433,937 ‐ 88,730 345,207
Trade receivables 39,429 40,140 ‐ 21,562 18,578
Other customer loans 355,550 373,516 ‐ 50,380 323,136
Pledged securities 181 181 ‐ 181 ‐
Securities bought under repurchase agreements 3,024 3,026 ‐ 2,715 311
Subordinated loans 45 456 ‐ 416 40
Insurance receivables 636 636 ‐ 7 629
Reinsurance receivables 849 849 ‐ 2 847
Advances in associates' current accounts 151 153 ‐ 16 137
Current accounts in debit 13,490 14,980 ‐ 13,451 1,529
Debt securities 93,765 96,963 65,499 16,376 15,088
Treasury bills and similar securities 27,360 28,051 23,441 4,378 232
Bonds and other fixed income securities 66,405 68,912 42,058 11,998 14,856
TOTAL FINANCIAL ASSETS OF WHICH FAIR VALUE IS
DISCLOSED 1,006,903 1,042,613 65,499 615,524 361,590

Comptes consolidés du groupe Crédit Agricole S.A. – 30 June 2020
99
(in millions of euros)
Value at
31/12/2019
Estimated fair
value at
31/12/2019
Quoted prices in active
markets for identical
instruments:
Level 1
Valuation
based on
observable
data:
Level 2
Valuation based
on unobservable
data:
Level 3
Financial assets not measured at fair value on
balance sheet
Loans and receivables 833,761 858,085 ‐ 529,155 328,930
Loans and receivables due from credit institutions 438,580 448,243 ‐ 447,039 1,204
Current accounts and overnight loans 30,780 30,793 ‐ 30,618 175
Accounts and long-term loans 400,063 409,649 ‐ 408,849 800
Pledged securities 1 1 ‐ ‐ 1
Securities bought under repurchase agreements 6,701 6,707 ‐ 6,707 ‐
Subordinated loans 929 966 ‐ 738 228
Other loans and receivables 106 127 ‐ 127 ‐
Loans and receivables due from customers 395,180 409,842 ‐ 82,116 327,726
Trade receivables 43,563 42,854 ‐ 20,832 22,022
Other customer loans 332,629 346,991 ‐ 44,075 302,916
Pledged securities 232 232 ‐ 232 ‐
Securities bought under repurchase agreements 4,071 4,073 ‐ 4,073 ‐
Subordinated loans 44 44 ‐ 4 40
Insurance receivables 314 314 ‐ 9 305
Reinsurance receivables 770 770 ‐ 1 769
Advances in associates' current accounts 142 143 ‐ 10 133
Current accounts in debit 13,415 14,421 ‐ 12,880 1,541
Debt securities 72,519 72,706 48,164 7,138 17,404
Treasury bills and similar securities 23,578 23,672 21,996 1,435 241
Bonds and other fixed income securities 48,942 49,034 26,169 5,703 17,162
TOTAL FINANCIAL ASSETS OF WHICH FAIR VALUE IS
DISCLOSED 906,280 930,791 48,164 536,293 346,334

Comptes consolidés du groupe Crédit Agricole S.A. – 30 June 2020
100
FINANCIAL LIABILITIES RECOGNISED AT AMORTISED COST AND MEASURED AT FAIR VALUE ON THE
BALANCE SHEET
(in millions of euros)
Value at
30/06/2020
Estimated fair
value at
30/06/2020
Quoted prices in active
markets for identical
instruments:
Level 1
Valuation
based on
observable
data:
Level 2
Valuation based
on unobservable
data:
Level 3
Financial liabilities not measured at fair value on
balance sheet
Due to credit institutions 275,617 282,180 ‐ 281,030 1,150
Current accounts and overnight loans 60,466 60,896 ‐ 60,896 ‐
Accounts and term deposits 190,669 196,762 ‐ 195,612 1,150
Pledged securities ‐ ‐ ‐ ‐ ‐
Securities sold under repurchase agreements 24,482 24,522 ‐ 24,522 ‐
Due to customers 704,090 706,875 ‐ 388,206 318,669
Current accounts in credit 277,775 277,790 ‐ 277,790 ‐
Special savings accounts 313,524 315,323 ‐ ‐ 315,323
Other amounts due to customers 108,168 109,133 ‐ 108,711 422
Securities sold under repurchase agreements 1,719 1,720 ‐ 1,629 91
Insurance liabilities 1,143 1,143 ‐ 68 1,076
Reinsurance liabilities 590 595 ‐ 8 587
Cash deposits received from ceding and
retroceding companies against technical insurance
commitments 1,171 1,171 ‐ ‐ 1,171
Debt securities 185,085 194,176 70,800 122,730 646
Subordinated debt 23,038 25,442 6,705 18,494 243
TOTAL FINANCIAL LIABILITIES OF WHICH FAIR VALUE IS
DISCLOSED 1,187,830 1,208,673 77,505 810,460 320,708
(in millions of euros)
Value at
31/12/2019
Estimated fair
value at
31/12/2019
Quoted prices in active
markets for identical
instruments:
Level 1
Valuation
based on
observable
data:
Level 2
Valuation based
on unobservable
data:
Level 3
Financial liabilities not measured at fair value on
balance sheet
Due to credit institutions 142,041 142,755 ‐ 142,723 32
Current accounts and overnight loans 31,290 31,287 ‐ 31,287 ‐
Accounts and term deposits 82,514 83,207 ‐ 83,175 32
Pledged securities ‐ ‐ ‐ ‐ ‐
Securities sold under repurchase agreements 28,237 28,261 ‐ 28,261 ‐
Due to customers 646,914 647,017 ‐ 341,395 305,622
Current accounts in credit 228,338 228,337 ‐ 228,301 37
Special savings accounts 302,423 302,425 ‐ 281 302,144
Other amounts due to customers 112,020 112,125 ‐ 111,173 952
Securities sold under repurchase agreements 1,569 1,568 ‐ 1,568 ‐
Insurance liabilities 942 940 ‐ 61 878
Reinsurance liabilities 467 467 ‐ 11 456
Cash deposits received from ceding and
retroceding companies against technical insurance
commitments 1,155 1,155 ‐ ‐ 1,155
Debt securities 201,007 204,181 71,169 132,308 703
Subordinated debt 21,797 22,119 5,754 16,182 183
TOTAL FINANCIAL LIABILITIES OF WHICH FAIR VALUE IS
DISCLOSED 1,011,759 1,016,071 76,922 632,609 306,540

Comptes consolidés du groupe Crédit Agricole S.A. – 30 June 2020
101
9.2 Information about financial instruments measured at fair value
VALUATION METHOD
Financial instruments are valued by management information systems and checked by a team
that reports to the Risk Management department and is independent from the market operators.
Valuations are based on the following:
prices or inputs obtained from independent sources and/or validated by the Market Risk
department using a series of available sources such as pricing service vendors, market
consensus data and brokers;
models approved by the quantitative teams in the Market Risk department.
The valuation produced for each instrument is a mid-market valuation, which does not take
account of the direction of the trade, the bank’s aggregate exposure, market liquidity or
counterparty quality. Adjustments are then made to the market valuations to incorporate those
factors, as well as the potential uncertainties inherent in the models or inputs used.
The main types of valuation adjustments are the following:
Mark-to-Market adjustments
These adjustments correct any potential difference between an instrument mid-market valuation
obtained using internal valuation models and the associated inputs and the valuation obtained
from external sources or market consensus data. These adjustments can be either positive or
negative;
Bid/ask reserves
These adjustments incorporate the bid/ask spread for a given instrument in order to reflect the
price at which the position could be reversed. These adjustments are always negative;
Uncertainty reserves
These adjustments constitute a risk premium taken into account by all market participants.
These adjustments are always negative:
input uncertainty reserves seek to incorporate in the valuation of an instrument any
uncertainty that might exist as regards one or more of the inputs used;
model uncertainty reserves seek to incorporate in the valuation of an instrument any
uncertainty that might exist due to the choice of model used.
In addition, in accordance with IFRS 13 “Fair value Measurement”, Crédit Agricole S.A. prices
into the fair value calculated for its OTC derivatives (i.e. those traded over the counter) various
adjustments linked to:
default risk or credit rating (Credit Valuation Adjustment/Debit Valuation Adjustment)
future funding costs and benefits (Funding Valuation Adjustment)
liquidity risk associated with collateral (Liquidity Valuation Adjustment).

Comptes consolidés du groupe Crédit Agricole S.A. – 30 June 2020
102
Credit Valuation Adjustment (CVA)
The Credit Valuation Adjustment (CVA) is a mark-to-market adjustment that aims to price into
the value of the OTC derivatives the market value of our counterparties’ default risk (risk that
amounts due to us are not repaid in the event of default or a deterioration in creditworthiness).
This adjustment is calculated per counterparty based on the positive future exposure of the
trading portfolio (taking into account any netting or collateral agreements, where such exist)
weighted by the probabilities of default and losses in the event of default. The methodology
used maximises the use of market prices/data (probabilities of default are derived as a priority
directly from listed CDS where these exist, and from proxies of listed CDS or other credit
instruments where these are deemed sufficiently liquid). This adjustment is always negative
and reduces the fair value of the OTC derivative assets held in the portfolio.
Debit Valuation Adjustment (DVA)
The Debit Valuation Adjustment (DVA) is a mark-to-market adjustment that aims to
incorporate the market value of the default risk (potential losses to which Credit Agricole SA
may expose its counterparties in the event of default or a deterioration in its creditworthiness)
in the value of perfectly collateralised OTC derivatives. This adjustment is calculated by
collateral contract type on the basis of negative future exposure profiles of the trading portfolio
weighted by default probabilities (Credit Agricole SA) and losses incurred in the event of
default. The methodology used maximises the use of market prices/data (use of Crédit Agricole
S.A. CDS to determine default probabilities). This adjustment is always positive and reduces
the fair value of the OTC derivative liabilities held in the portfolio.
Funding Valuation Adjustment (FVA)
The Funding Valuation Adjustment (FVA) is a mark-to-market adjustment that aims to
incorporate the additional future funding costs and benefits based on ALM (Asset & Liability
Management) funding costs in the value of uncollateralised or imperfectly collateralised OTC
derivatives. This adjustment is calculated per counterparty based on the future exposure of the
trading portfolio (taking into account any netting or collateral agreements, where such exist),
weighted by ALM funding spreads. The latter take into account the economic maturity of
transactions.
As regards the scope of “clear” derivatives, an FVA adjustment called IMVA (Initial Margin
Value Adjustment) is calculated to take into account the future financing costs and gains of the
initial margins to be posted with the main derivatives clearing houses until the portfolio
matures.
Liquidity Valuation Adjustment (LVA)
The LVA (Liquidity Valuation Adjustment) is the positive or negative valuation adjustment
intended to materialise both the potential absence of collateral payments for counterparties with
a CSA (Credit Support Annex) as well as non-standard compensation of CSAs.
The LVA materialises the profit or loss resulting from additional liquidity costs. It is calculated
on the scope of OTC derivatives with CSAs.

Comptes consolidés du groupe Crédit Agricole S.A. – 30 June 2020
103
BREAKDOWN OF FINANCIAL INSTRUMENTS AT FAIR VALUE BY VALUATION MODEL
Amounts presented below include accruals and prepayments and are net of impairment.
Financial assets measured at fair value
(in millions of euros) 30/06/2020
Quoted prices in
active markets for
identical instruments:
Level 1
Valuation
based on
observable
data: Level 2
Valuation based
on unobservable
data: Level 3
Held for trading financial assets 267,004 29,198 230,373 7,433
Loans and receivables due from credit institutions ‐ ‐ ‐ ‐
Loans and receivables due from customers 1,614 ‐ 1 1,613
Securities bought under repurchase agreements 110,127 ‐ 107,108 3,019
Pledged securities ‐ ‐ ‐ ‐
Held for trading securities 31,022 29,059 1,199 764
Treasury bills and similar securities 19,015 18,143 872 ‐
Bonds and other fixed income securities 5,600 5,138 325 137
Mutual funds 28 28 ‐ ‐
Equities and other variable income securities 6,379 5,750 2 627
Derivative instruments 124,241 139 122,065 2,037
Other financial instruments at fair value through profit or loss 163,937 105,988 48,273 9,676
Equity instruments at fair value through profit or loss 29,753 17,987 7,391 4,375
Equities and other variable income securities 18,920 15,514 2,451 955
Non-consolidated equity investments 10,833 2,473 4,940 3,420
Debt instruments that do not meet the conditions of the “SPPI” test 75,102 46,915 22,912 5,275
Loans and receivables due from credit institutions ‐ ‐ ‐ ‐
Loans and receivables due from customers 3,571 ‐ 3,572 (1)
Debt securities 71,531 46,915 19,340 5,276
Treasury bills and similar securities 186 24 162 ‐
Bonds and other fixed income securities 12,879 1,984 10,259 636
Mutual funds 58,466 44,907 8,919 4,640
Assets backing unit-linked contracts 59,081 41,085 17,970 26
Treasury bills and similar securities 535 523 12 ‐
Bonds and other fixed income securities 4,173 1,213 2,960 ‐
Equities and other variable income securities 7,068 1,202 5,866 ‐
Mutual funds 47,305 38,147 9,132 26
Financial assets designated at fair value through profit or loss 1 1 ‐ ‐
Loans and receivables due from credit institutions ‐ ‐ ‐ ‐
Loans and receivables due from customers ‐ ‐ ‐ ‐
Debt securities 1 1 ‐ ‐
Treasury bills and similar securities ‐ ‐ ‐ ‐
Bonds and other fixed income securities 1 1 ‐ ‐
Financial assets at fair value through other comprehensive income 261,760 242,667 18,829 264
Equity instruments at fair value through other comprehensive income that
will not be reclassified to profit or loss 2,456 955 1,237 264
Equities and other variable income securities 687 342 309 36
Non-consolidated equity investments ¹ 1,769 613 928 228
Debt instruments at fair value through other comprehensive income that
may be reclassified to profit and loss 259,304 241,712 17,592 ‐
Loans and receivables due from credit institutions ‐ ‐ ‐ ‐
Loans and receivables due from customers ‐ ‐ ‐ ‐
Debt securities 259,304 241,712 17,592 ‐
Treasury bills and similar securities 82,748 82,449 299 ‐
Bonds and other fixed income securities 176,556 159,263 17,293 ‐
Hedging derivative Instruments 23,149 11 23,138 ‐
TOTAL FINANCIAL ASSETS MEASURED AT FAIR VALUE 715,850 377,864 320,613 17,373
Transfers from Level 1: Quoted prices in active markets for identical
instruments 1,735 ‐
Transfers from Level 2: Valuation based on observable data 618 109
Transfers from Level 3: Valuation based on unobservable data ‐ 376
TOTAL TRANSFERS TO EACH LEVEL 618 2,111 109 (1) SAS Rue La Boétie shares have been included in Non-consolidated equity investments in Level 2 for €66 million.
Transfers from Level 1 to Level 2 correspond essentially to listed options with equity
underlying.
Transfers from Level 2 to Level 1 correspond essentially to fixed income securities.

Comptes consolidés du groupe Crédit Agricole S.A. – 30 June 2020
104
Level 2 to Level 3 transfers mainly involved securities bought/sold under repurchase
agreements to credit institutions and trading derivatives.
Level 3 to Level 2 transfers mainly involved securities bought/sold under repurchase
agreements to credit institutions and trading derivatives. Several positions have become
observable.
(in millions of euros) 31/12/2019
Quoted prices in
active markets for
identical instruments:
Level 1
Valuation
based on
observable
data: Level 2
Valuation based
on unobservable
data: Level 3
Held for trading financial assets 230,721 23,646 201,576 5,499
Loans and receivables due from credit institutions 61 ‐ 61 ‐
Loans and receivables due from customers 894 ‐ ‐ 894
Securities bought under repurchase agreements 103,690 ‐ 101,771 1,919
Pledged securities ‐ ‐ ‐ ‐
Held for trading securities 25,281 22,762 1,740 779
Treasury bills and similar securities 13,665 12,494 1,170 1
Bonds and other fixed income securities 4,607 3,878 568 161
Mutual funds 108 84 ‐ 24
Equities and other variable income securities 6,901 6,305 2 594
Derivative instruments 100,795 884 98,004 1,907
Other financial instruments at fair value through profit or loss 168,756 113,114 46,358 9,284
Equity instruments at fair value through profit or loss 36,293 25,070 6,852 4,371
Equities and other variable income securities 24,754 21,726 2,027 1,001
Non-consolidated equity investments 11,539 3,344 4,825 3,370
Debt instruments that do not meet the conditions of the “SPPI” test 72,942 45,690 22,535 4,717
Loans and receivables due from credit institutions ‐ ‐ ‐ ‐
Loans and receivables due from customers 4,209 ‐ 3,847 362
Debt securities 68,733 45,690 18,688 4,355
Treasury bills and similar securities 252 111 139 2
Bonds and other fixed income securities 13,152 1,995 10,578 579
Mutual funds 55,329 43,584 7,971 3,774
Assets backing unit-linked contracts 59,520 42,352 16,972 196
Treasury bills and similar securities 457 444 13 ‐
Bonds and other fixed income securities 4,204 1,218 2,986 ‐
Equities and other variable income securities 6,822 1,287 5,351 184
Mutual funds 48,037 39,403 8,622 12
Financial assets designated at fair value through profit or loss 1 1 ‐ ‐
Loans and receivables due from credit institutions ‐ ‐ ‐ ‐
Loans and receivables due from customers ‐ ‐ ‐ ‐
Debt securities 1 1 ‐ ‐
Treasury bills and similar securities ‐ ‐ ‐ ‐
Bonds and other fixed income securities 1 1 ‐ ‐
Financial assets at fair value through other comprehensive income 261,321 243,263 17,772 286
Equity instruments at fair value through other comprehensive income that
will not be reclassified to profit or loss 2,518 1,367 884 267
Equities and other variable income securities 802 457 309 36

Comptes consolidés du groupe Crédit Agricole S.A. – 30 June 2020
105
Non-consolidated equity investments 1,716 910 575 231
Debt instruments at fair value through other comprehensive income that
may be reclassified to profit and loss 258,803 241,895 16,888 20
Loans and receivables due from credit institutions ‐ ‐ ‐ ‐
Loans and receivables due from customers ‐ ‐ ‐ ‐
Debt securities 258,803 241,895 16,888 20
Treasury bills and similar securities 82,684 82,361 323 ‐
Bonds and other fixed income securities 176,119 159,534 16,565 20
Hedging derivative Instruments 19,368 34 19,334 ‐
TOTAL FINANCIAL ASSETS MEASURED AT FAIR VALUE 680,166 380,057 285,040 15,069
Transfers from Level 1: Quoted prices in active markets for identical
instruments 4,420 106
Transfers from Level 2: Valuation based on observable data 474 2,119
Transfers from Level 3: Valuation based on unobservable data 72 1,820
TOTAL TRANSFERS TO EACH LEVEL 546 6,240 2,225
Level 1 to Level 2 transfers concern the reclassification of derivatives instruments from
organized to over the counter markets.
Level 1 to Level 3 transfers involve bonds and other fixed-income securities.
Level 2 to Level 1 transfers mainly involve treasury bills, bonds and other fixed-income
securities.
Level 2 to Level 3 transfers mainly involve securities received under repurchase agreements
from credit institutions and interest rate swaps.
Level 3 to Level 1 transfers mainly involve Treasury bills.
Level 3 to Level 2 transfers mainly involved securities received under repurchase agreements
from clients and trading derivatives including -€0.3 billion related to the review of the
derivatives observability analysis.
Financial liabilities measured at fair value
(in millions of euros) 30/06/2020
Quoted prices in
active markets for
identical instruments:
Level 1
Valuation
based on
observable
data: Level 2
Valuation based
on unobservable
data: Level 3
Held for trading financial liabilities 235,177 30,859 202,503 1,815
Securities sold short 30,918 30,703 215 ‐
Securities sold under repurchase agreements 82,549 ‐ 81,559 990
Debt securities 2 ‐ 2 ‐
Due to credit institutions ‐ ‐ ‐ ‐
Due to customers ‐ ‐ ‐ ‐
Derivative instruments 121,708 156 120,727 825
Financial liabilities designated at fair value through profit or loss 36,673 7,845 20,988 7,840
Hedging derivative Instruments 15,558 ‐ 15,313 245
TOTAL FINANCIAL LIABILITIES MEASURED AT FAIR VALUE 287,408 38,704 238,804 9,900
Transfers from Level 1: Quoted prices in active markets for identical
instruments 1,304 ‐
Transfers from Level 2: Valuation based on observable data ‐ 1,476
Transfers from Level 3: Valuation based on unobservable data ‐ 271
TOTAL TRANSFERS TO EACH LEVEL ‐ 1,575 1,476

Comptes consolidés du groupe Crédit Agricole S.A. – 30 June 2020
106
Transfers from Level 1 to Level 2 correspond essentially to listed options with equity
underlying.
Transfers of liabilities to and from Level 3 are primarily linked to a change in the mapping of
financial liabilities at fair value.
(in millions of euros) 31/12/2019
Quoted prices in
active markets for
identical instruments:
Level 1
Valuation
based on
observable
data: Level 2
Valuation based
on unobservable
data: Level 3
Held for trading financial liabilities 206,708 34,018 171,104 1,586
Securities sold short 33,473 33,259 214 ‐
Securities sold under repurchase agreements 74,762 ‐ 73,842 920
Debt securities 55 ‐ 55 ‐
Due to credit institutions ‐ ‐ ‐ ‐
Due to customers ‐ ‐ ‐ ‐
Derivative instruments 98,418 759 96,993 666
Financial liabilities designated at fair value through profit or loss 39,961 8,763 23,683 7,515
Hedging derivative Instruments 13,293 ‐ 12,981 312
TOTAL FINANCIAL LIABILITIES MEASURED AT FAIR VALUE 259,962 42,781 207,768 9,413
Transfers from Level 1: Quoted prices in active markets for identical
instruments 4,023 ‐
Transfers from Level 2: Valuation based on observable data 35 605
Transfers from Level 3: Valuation based on unobservable data 241 4,676
TOTAL TRANSFERS TO EACH LEVEL 275 8,699 605
Level 1 to Level 2 transfers concern the reclassification of derivatives instruments from
organized to over the counter markets.
Level 2 to Level 1 transfers concern short sales.
Level 2 to Level 3 transfers mainly involved securities bought/sold under repurchase
agreements to credit institutions.
Level 3 to Level 1 transfers mainly involve short sales of Treasury bills.
Level 3 to Level 2 transfers mainly involve securities bought/sold under repurchase agreements
to clients, negotiable debt securities accounted at fair value through profit or loss and trading
derivatives. The review of the observability analysis for derivatives and liabilities measured at
fair value amounts to -€2.1 billion.
Financial instruments classified as Level 1
Level 1 comprises all derivatives quoted in an active market (options, futures, etc.), regardless
of their underlying (interest rate, exchange rate, precious metals, major stock indexes), as well
as equities and bonds quoted in an active market.
A market is considered as being active if quoted prices are readily and regularly available from
exchange, brokers, dealers, pricing services or regulatory agencies, and those prices represent
actual and regularly occurring market transactions on an arm’s length basis.
Corporate, government and agency bonds that are valued on the basis of prices obtained from
independent sources, deemed to be enforceable and updated regularly, are classified in Level 1.
This covers the bulk of sovereign and agency bonds and corporate securities held. Issuers whose
bonds are not quoted are classified in Level 3.

Comptes consolidés du groupe Crédit Agricole S.A. – 30 June 2020
107
Financial instruments classified as Level 2
The main financial instruments classified as Level 2 are:
Liabilities designated at fair value;
Financial liabilities designated at fair value are classified in Level 2 when their embedded
derivative is deemed to be classified in Level 2;
Over-the-counter derivatives.
The main OTC derivatives classified in Level 2 are those valued using inputs considered to be
observable and where the valuation technique does not generate any significant exposure to a
model risk.
Level 2 therefore mainly comprises:
Linear derivative products such as interest rate swaps, currency swaps and forward FX.
They are valued using simple models widely used in the market, based either on directly
observable inputs (foreign exchange rates, interest rates), or inputs derived from
observable market prices (currency swaps);
non-linear vanilla instruments such as caps, floors, swaptions, currency options, equity
options and credit default swaps, including digital options. They are valued using simple
models widely used in the market, based either on directly observable inputs (foreign
exchange rates, interest rates, share prices) or inputs that can be derived from observable
market prices (volatilities);
simple exotic single-underlying instruments such as cancellable swaps, currency
baskets of major currencies;
They are valued using models that are sometimes slightly more complex but still widely used
in the market. Significant valuation parameters are observable. Observable market prices,
obtained notably from brokers’ prices and market consensus where necessary, can be used to
corroborate internal valuations;
securities, equity options and futures listed on a market deemed inactive and for which
independent valuation data is available.
Financial instruments classified as Level 3
Financial instruments classified in Level 3 are those which do not meet the conditions for
classification in Level 1 or 2. They are therefore mainly financial instruments with a high model
risk whose valuation requires substantial use of unobservable inputs.
The initial margin on all new transactions classified in Level 3 is reserved at the date of initial
recognition. It is reintegrated in the profit or loss account either spread over the period during
which the inputs are considered to be unobservable or in full on the date when the inputs become
observable.
Level 3 therefore mainly comprises:
Securities
Securities classified in Level 3 mainly include:
unlisted shares or bonds for which no independent valuation is available;

Comptes consolidés du groupe Crédit Agricole S.A. – 30 June 2020
108
ABSs and CLOs for which there are indicative independent quotes, but which are not
necessarily executable;
ABSs, CLOs and super senior and mezzanine CDO tranches where it cannot be
demonstrated that the market is active.
Liabilities designated at fair value
Financial liabilities designated at fair value are classified in Level 3 when their embedded
derivative is deemed to be classified in Level 3.
Over-the-counter derivatives
Unobservable income includes complex financial instruments that are significantly exposed to
a model risk or that involve parameters that are considered unobservable.
The aggregate of these principles is mapped for observability according to the three levels
indicating for each product, currency and maturity the classification used.
The following are mainly classified as Level 3:
linear interest rate or foreign exchange products for very long maturities in the case of major
currencies, for shorter maturities in the case of emerging currencies; this may include
repurchase transactions based on the maturity of the transactions in question and their
underlying assets;
non-linear interest rate or exchange products for very long maturities in the case of major
currencies, for shorter maturities in the case of emerging currencies;
the complex derivatives below:
certain equity derivatives: optional products in markets that are shallow or very long
maturity options or products whose valuation depends on correlations that cannot be
observed between various underlying equities;
certain exotic interest rate products whose underlying is the difference between two
interest rates (structured products based on differences in rates or products whose
correlations are not observable);
certain products whose underlying is the forward volatility of an index (Euribor,
CMS spread). These products are deemed unobservable as there is significant model
risk and their thin liquidity prevents regular accurate estimates of inputs;
securitisation swaps generating an exposure to the prepayment rate. The prepayment
rate is determined on the basis of historical data on similar portfolios;
hybrid long-term interest rate/foreign exchange products, such as power reverse
dual-currency notes, or products whose underlying is a basket of currencies. The
correlation parameters between interest rates and currencies as well as between the
two interest rates are determined using an internal methodology based on historical
data. Results are cross-checked against market consensus data to ensure that the
overall method is coherent;
multiple underlying products, generating exposure to correlations between various
risk classes (interest rates, credit, foreign exchange, inflation and equities);
CDOs based on corporate credit baskets. These are no longer significant.

Comptes consolidés du groupe Crédit Agricole S.A. – 30 June 2020
10
9
NET CHANGE IN FINANCIAL INSTRUMENTS MEASURED AT FAIR VALUE ACCORDING TO LEVEL 3
Financial assets measured at fair value according to Level 3
(in millions of euros)
Held-for-trading financial assets Other financial instruments at fair value through profit or loss Financial assets at fair value through other comprehensive income
Securities
bought under
repurchase
agreements
Held-for-trading securities
Equity instruments at fair
value through profit or loss Pledged securities
Assets backing unit-linked
contracts
Equity instruments at fair value
through other comprehensive
income that will not be
reclassified to profit and loss
Financial assets designated at fair value
through profit or loss
Debt securities Debt securities
Total
Loans and
receivables
due from
customers
Treasury bills
and similar
securities
Bonds and
other fixed
income
securities
Mutual
funds
Equities and
other
variable
income
securities
Held-for-
trading
securities
Derivative
instruments
Equity and
other
variable
income
securities
Non-
consolidated
equity
investments
Loans and
receivables
due from
customers
Treasury bills
and similar
securities
Bonds and
other fixed
income
securities
Mutual
funds
Debt
securities
Bonds and
other fixed
income
securities
Mutual
funds
Equities and
other
variable
income
securities
Non-
consolidated
equity
investments
Treasury bills
and similar
securities
Bonds and
other fixed
income
securities
Debt
securities
Opening balance
(01/01/2020) 15 069 892 1 919 - 161 23 594 779 1 907 1 000 3 374 362 2 579 3 774 4 354 184 12 35 231 - 20 20
Gains or losses during the
period ¹ (207) (31) 97 - (16) - 31 15 10 (40) (52) (8) (5) - 8 4 (184) - (2) 4 - (20) (20)
Recognised in profit or
loss (197) (16) 86 - (16) - 31 15 10 (40) (52) - (5) - 8 4 (184) - - - - (20) (20)
Recognised in other
comprehensive income (8) (15) 11 - - - - - - - - (8) - - - - - - (2) 6 - - -
Purchases 4 334 1 066 1 360 - 2 - 2 3 210 50 375 - - 59 1 197 1 253 - 14 3 - - - -
Sales (1 290) (578) - - - (23) - (23) - (55) (277) (10) - (2) (339) (341) - - - (5) - - -
Issues - - - - - - - - - - - - - - - - - - - - - - -
Settlements (240) (10) (182) - (3) - - (3) (11) - - (35) - - - - - - - 2 - - -
Reclassifications (31) 279 - - - - - - - - - (310) - - - - - - - - - - -
Changes associated with
scope during the period (3) - - - - - - - - - - - - - - - - - - (3) - - -
Transfers (259) (5) (175) - (7) - - (7) (79) - - 1 6 - - 6 - - - - - - -
Transfers to Level 3 109 - 76 - - - - - 33 - - - - - - - - - - - - - -
Transfers from Level 3 (368) (5) (251) - (7) - - (7) (112) - - 1 6 - - 6 - - - - - - -
CLOSING BALANCE
(30/06/2020) 17 373 1 613 3 019 - 137 - 627 764 2 037 955 3 420 - - 636 4 640 5 276 - 26 36 229 - - -

Comptes consolidés du groupe Crédit Agricole S.A. – 30 June 2020
110
1 This balance includes the gains and losses of the period made on assets reported on the balance sheet at the
closing date, for the following amounts:
Gains/ losses for the period from level 3 assets held at the end of the period (13)
Recognised in profit or loss (14)
Recognised in other comprehensive income 1
Financial liabilities measured at fair value according to Level 3
Total
Financial liabilities held for trading
Financial
liabilities
designated at
fair value
through profit or
loss
Hedging
derivative
instruments (in millions of euros)
Securities
sold short
Securities
sold under
repurchase
agreements
Debt
securities
Due to credit
institutions
Due to
customers
Derivative
Instruments
Opening balance (01/01/2020) 9,413 ‐ 920 ‐ ‐ ‐ 666 7,514 313
Gains or losses during the period ¹ 35 ‐ (58) ‐ ‐ ‐ 109 20 (37)
Recognised in profit or loss 36 ‐ (58) ‐ ‐ ‐ 109 20 (37)
Recognised in other
comprehensive income (1) ‐ ‐ ‐ ‐ ‐ ‐ ‐ ‐
Purchases (4) ‐ 48 ‐ ‐ ‐ 25 (77) ‐
Sales (31) ‐ ‐ ‐ ‐ ‐ ‐ ‐ (31)
Issues 919 ‐ ‐ ‐ ‐ ‐ ‐ 919 ‐
Settlements (1,637) ‐ ‐ ‐ ‐ ‐ (72) (1,564) ‐
Reclassifications ‐ ‐ ‐ ‐ ‐ ‐ ‐ ‐ ‐
Changes associated with scope
during the period ‐ ‐ ‐ ‐ ‐ ‐ ‐ ‐ ‐
Transfers ² 1,205 ‐ 80 ‐ ‐ ‐ 97 1,028 ‐
Transfers to Level 3 1,476 ‐ 80 ‐ ‐ ‐ 138 1,258 ‐
Transfers from Level 3 (271) ‐ ‐ ‐ ‐ ‐ (41) (230) ‐
CLOSING BALANCE (30/06/2020) 9,900 ‐ 990 ‐ ‐ ‐ 825 7,840 245
1 This balance includes the gains and losses of the period made on liabilities reported on the balance sheet at the
closing date, for the following amounts:
Gains/ losses for the period from level 3 assets held at the end of the period 68
Recognised in profit or loss 68
Recognised in other comprehensive income ‐
Gains and losses recognised in profit or loss linked to financial instruments held for transactional purposes and at
fair value through profit or loss and derivatives are recognised as “Net gains or losses on financial instruments at
fair value through profit or loss”. Gains and losses recognised in profit or loss linked to financial assets at fair
value by equity are recognised as “Net gains or losses on financial instruments recognised at fair value in net
equity”.
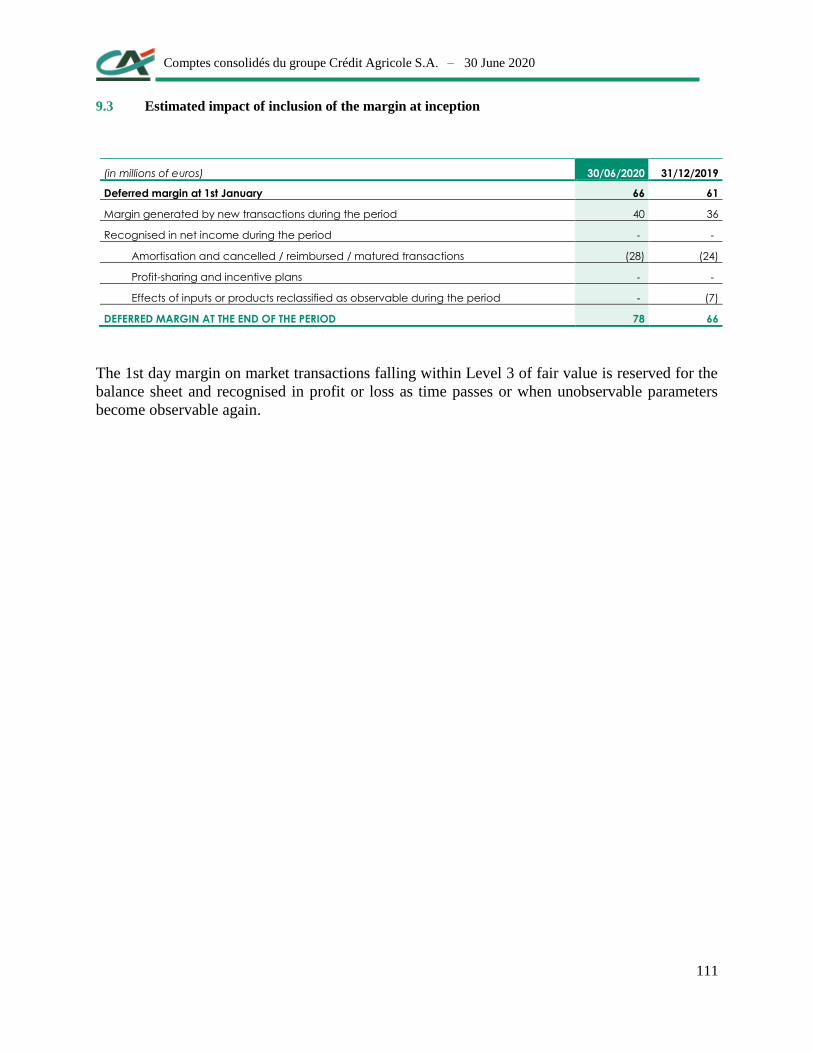
Comptes consolidés du groupe Crédit Agricole S.A. – 30 June 2020
111
9.3 Estimated impact of inclusion of the margin at inception
(in millions of euros) 30/06/2020 31/12/2019
Deferred margin at 1st January 66 61
Margin generated by new transactions during the period 40 36
Recognised in net income during the period ‐ ‐
Amortisation and cancelled / reimbursed / matured transactions (28) (24)
Profit-sharing and incentive plans ‐ ‐
Effects of inputs or products reclassified as observable during the period ‐ (7)
DEFERRED MARGIN AT THE END OF THE PERIOD 78 66
The 1st day margin on market transactions falling within Level 3 of fair value is reserved for the
balance sheet and recognised in profit or loss as time passes or when unobservable parameters
become observable again.
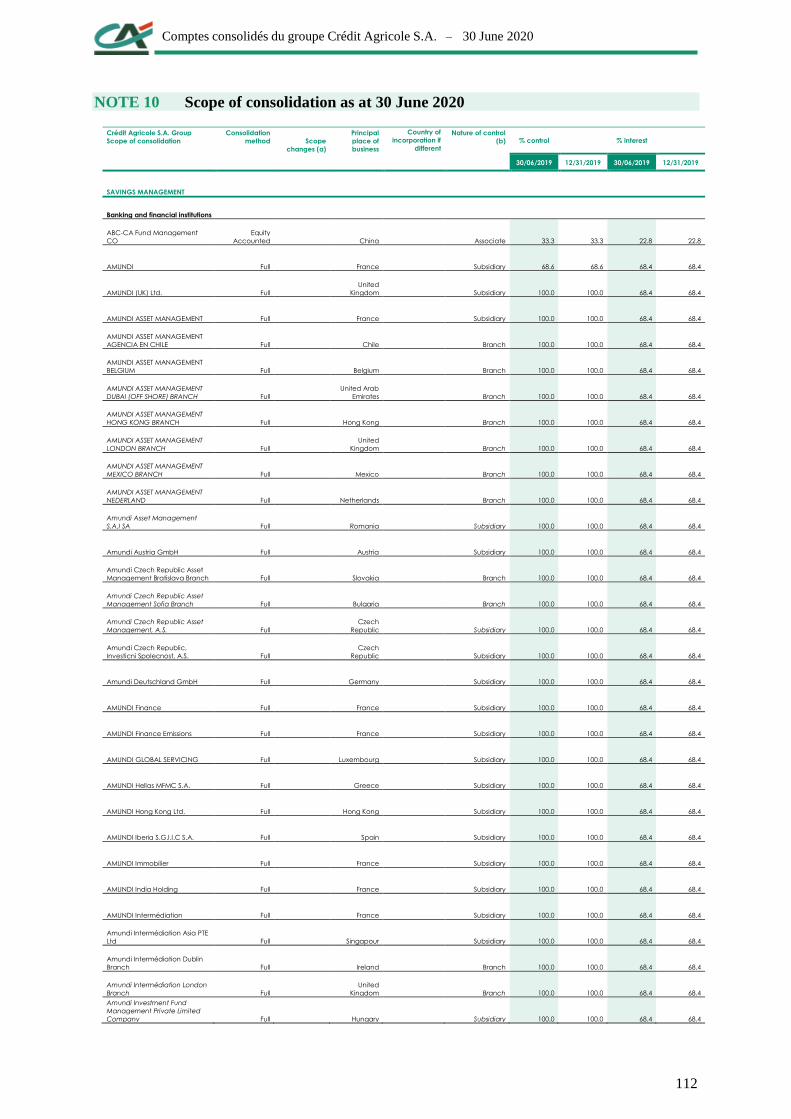
Comptes consolidés du groupe Crédit Agricole S.A. – 30 June 2020
112
NOTE 10 Scope of consolidation as at 30 June 2020
Crédit Agricole S.A. Group
Scope of consolidation
Consolidation
method
Scope
changes (a)
Principal
place of
business
Country of
incorporation if
different
from the
principal place
of business
Nature of control
(b)
% control % interest
30/06/2019 12/31/2019 30/06/2019 12/31/2019
SAVINGS MANAGEMENT
Banking and financial institutions
ABC-CA Fund Management
CO
Equity
Accounted China Associate 33.3 33.3 22.8 22.8
AMUNDI Full France Subsidiary 68.6 68.6 68.4 68.4
AMUNDI (UK) Ltd. Full
United
Kingdom Subsidiary 100.0 100.0 68.4 68.4
AMUNDI ASSET MANAGEMENT Full France Subsidiary 100.0 100.0 68.4 68.4
AMUNDI ASSET MANAGEMENT
AGENCIA EN CHILE Full Chile Branch 100.0 100.0 68.4 68.4
AMUNDI ASSET MANAGEMENT
BELGIUM Full Belgium Branch 100.0 100.0 68.4 68.4
AMUNDI ASSET MANAGEMENT
DUBAI (OFF SHORE) BRANCH Full
United Arab
Emirates Branch 100.0 100.0 68.4 68.4
AMUNDI ASSET MANAGEMENT
HONG KONG BRANCH Full Hong Kong Branch 100.0 100.0 68.4 68.4
AMUNDI ASSET MANAGEMENT
LONDON BRANCH Full
United
Kingdom Branch 100.0 100.0 68.4 68.4
AMUNDI ASSET MANAGEMENT
MEXICO BRANCH Full Mexico Branch 100.0 100.0 68.4 68.4
AMUNDI ASSET MANAGEMENT
NEDERLAND Full Netherlands Branch 100.0 100.0 68.4 68.4
Amundi Asset Management
S.A.I SA Full Romania Subsidiary 100.0 100.0 68.4 68.4
Amundi Austria GmbH Full Austria Subsidiary 100.0 100.0 68.4 68.4
Amundi Czech Republic Asset
Management Bratislava Branch Full Slovakia Branch 100.0 100.0 68.4 68.4
Amundi Czech Republic Asset
Management Sofia Branch Full Bulgaria Branch 100.0 100.0 68.4 68.4
Amundi Czech Republic Asset
Management, A.S. Full
Czech
Republic Subsidiary 100.0 100.0 68.4 68.4
Amundi Czech Republic,
Investicni Spolecnost, A.S. Full
Czech
Republic Subsidiary 100.0 100.0 68.4 68.4
Amundi Deutschland GmbH Full Germany Subsidiary 100.0 100.0 68.4 68.4
AMUNDI Finance Full France Subsidiary 100.0 100.0 68.4 68.4
AMUNDI Finance Emissions Full France Subsidiary 100.0 100.0 68.4 68.4
AMUNDI GLOBAL SERVICING Full Luxembourg Subsidiary 100.0 100.0 68.4 68.4
AMUNDI Hellas MFMC S.A. Full Greece Subsidiary 100.0 100.0 68.4 68.4
AMUNDI Hong Kong Ltd. Full Hong Kong Subsidiary 100.0 100.0 68.4 68.4
AMUNDI Iberia S.G.I.I.C S.A. Full Spain Subsidiary 100.0 100.0 68.4 68.4
AMUNDI Immobilier Full France Subsidiary 100.0 100.0 68.4 68.4
AMUNDI India Holding Full France Subsidiary 100.0 100.0 68.4 68.4
AMUNDI Intermédiation Full France Subsidiary 100.0 100.0 68.4 68.4
Amundi Intermédiation Asia PTE
Ltd Full Singapour Subsidiary 100.0 100.0 68.4 68.4
Amundi Intermédiation Dublin
Branch Full Ireland Branch 100.0 100.0 68.4 68.4
Amundi Intermédiation London
Branch Full
United
Kingdom Branch 100.0 100.0 68.4 68.4
Amundi Investment Fund
Management Private Limited
Company Full Hungary Subsidiary 100.0 100.0 68.4 68.4

Comptes consolidés du groupe Crédit Agricole S.A. – 30 June 2020
113
Crédit Agricole S.A. Group
Scope of consolidation
Consolidation
method
Scope
changes (a)
Principal
place of
business
Country of
incorporation if
different
from the
principal place
of business
Nature of control
(b)
% control % interest
30/06/2019 12/31/2019 30/06/2019 12/31/2019
Amundi Ireland Ltd Full Ireland Subsidiary 100.0 100.0 68.4 68.4
AMUNDI Issuance Full France Subsidiary 100.0 100.0 68.4 68.4
AMUNDI Japan Full Japan Subsidiary 100.0 100.0 68.4 68.4
AMUNDI Japan Holding Full S4 Japan Subsidiary 100.0 68.4
Amundi Luxembourg SA Full Luxembourg Subsidiary 100.0 100.0 68.4 68.4
AMUNDI Malaysia Sdn Bhd Full Malaysia Subsidiary 100.0 100.0 68.4 68.4
Amundi Pioneer Asset
Management Inc Full United States Subsidiary 100.0 100.0 68.4 68.4
Amundi Pioneer Asset
Management USA Inc Full United States Subsidiary 100.0 100.0 68.4 68.4
Amundi Pioneer Distributor Inc Full United States Subsidiary 100.0 100.0 68.4 68.4
Amundi Pioneer Institutional
Asset Management Inc Full United States Subsidiary 100.0 100.0 68.4 68.4
AMUNDI Polska Full Poland Subsidiary 100.0 100.0 68.4 68.4
AMUNDI Private Equity Funds Full France Subsidiary 100.0 100.0 68.4 68.4
AMUNDI Real Estate Italia SGR
S.p.A. Full Italy Subsidiary 100.0 100.0 68.4 68.4
AMUNDI SGR S.p.A. Full Italy Subsidiary 100.0 100.0 68.4 68.4
AMUNDI Singapore Ltd. Full Singapour Subsidiary 100.0 100.0 68.4 68.4
AMUNDI Suisse Full Switzerland Subsidiary 100.0 100.0 68.4 68.4
Amundi Taïwan Limited Full Taiwan Subsidiary 100.0 100.0 68.4 68.4
AMUNDI Tenue de Comptes Full France Subsidiary 100.0 100.0 68.4 68.4
AMUNDI USA Inc Full United States Subsidiary 100.0 100.0 68.4 68.4
AMUNDI Ventures Full France Subsidiary 100.0 100.0 68.4 68.4
BFT INVESTMENT MANAGERS Full France Subsidiary 100.0 100.0 68.4 68.4
CA Indosuez (Suisse) S.A. Hong
Kong Branch Full Hong Kong Switzerland Branch 100.0 100.0 97.8 97.8
CA Indosuez (Suisse) S.A.
Singapore Branch Full Singapour Switzerland Branch 100.0 100.0 97.8 97.8
CA Indosuez (Suisse) S.A.
Switzerland Branch Full Switzerland Branch 100.0 100.0 97.8 97.8
CA Indosuez (Switzerland) S.A. Full Switzerland Subsidiary 100.0 100.0 97.8 97.8
CA Indosuez Finanziaria S.A. Full Switzerland Subsidiary 100.0 100.0 97.8 97.8
CA Indosuez Gestion Full France Subsidiary 100.0 100.0 97.8 97.8
CA Indosuez Wealth (Brazil) S.A.
DTVM Full Brazil Subsidiary 100.0 100.0 97.8 97.8
CA Indosuez Wealth (Europe) Full Luxembourg Subsidiary 100.0 100.0 97.8 97.8
CA Indosuez Wealth (Europe)
Belgium Branch Full Belgium Luxembourg Branch 100.0 100.0 97.8 97.8
CA Luxembourg (succursale
Italie) Full D1 Italy Luxembourg Branch 100.0 100.0 97.8 97.8
CA Indosuez Wealth (Europe)
Spain Branch Full Spain Luxembourg Branch 100.0 100.0 97.8 97.8
CA Indosuez Wealth (France) Full France Subsidiary 100.0 100.0 97.8 97.8
CA Indosuez Wealth (Group) Full France Subsidiary 100.0 100.0 97.8 97.8

Comptes consolidés du groupe Crédit Agricole S.A. – 30 June 2020
114
Crédit Agricole S.A. Group
Scope of consolidation
Consolidation
method
Scope
changes (a)
Principal
place of
business
Country of
incorporation if
different
from the
principal place
of business
Nature of control
(b)
% control % interest
30/06/2019 12/31/2019 30/06/2019 12/31/2019
CA Indosuez Wealth Italy S.P.A. Full Italy Subsidiary 100.0 100.0 97.8 97.8
CFM Indosuez Conseil en
Investissement Full France Subsidiary 70.2 70.2 67.5 67.5
CFM Indosuez Conseil en
Investissement, Succursale de
Noumea Full France Branch 70.2 70.2 69.0 67.5
CFM Indosuez Gestion Full Monaco Subsidiary 70.2 70.2 66.1 66.1
CFM Indosuez Wealth Full Monaco Subsidiary 70.2 70.2 67.5 67.5
CPR AM Full France Subsidiary 100.0 100.0 68.4 68.4
Etoile Gestion Full France Subsidiary 100.0 100.0 68.4 68.4
Fund Channel
Equity
Accounted Luxembourg Joint venture 50.0 50.0 34.3 34.3
Fund Channel Singapore
Branch
Equity
Accounted Singapour Luxembourg Joint venture 50.0 50.0 34.2 34.2
KBI Fund Managers Limited Full Ireland Subsidiary 87.5 87.5 68.4 68.4
KBI Global Investors (North
America) Limited Full Ireland Subsidiary 87.5 87.5 68.4 68.4
KBI Global Investors Limited Full Ireland Subsidiary 87.5 87.5 68.4 68.4
LCL Emissions Full France Subsidiary 100.0 100.0 68.4 68.4
NH-AMUNDI ASSET
MANAGEMENT
Equity
Accounted South Korea Associate 30.0 30.0 20.5 20.5
Pioneer Global Investments LTD
Buenos Aires Branch Full S1 Argentina Branch 100.0 68.4
Pioneer Global Investments LTD
Mexico City Branch Full Mexico Branch 100.0 100.0 68.4 68.4
Sabadell Asset Management,
S.A., S.G.I.I.C. Full E3 Spain Subsidiary 100.0 68.4
Société Générale Gestion (S2G) Full France Subsidiary 100.0 100.0 68.4 68.4
Investment companies
State Bank of India Fund
Management
Equity
Accounted India Associate 37.0 37.0 25.3 25.3
Vanderbilt Capital Advisors LLC Full United States Subsidiary 100.0 100.0 68.4 68.4
WAFA Gestion
Equity
Accounted Morocco Associate 34.0 34.0 23.3 23.3
Insurance
ASSUR&ME Full France
Consolidated
structured entity 100.0 100.0 100.0 100.0
CA Assicurazioni Full Italy Subsidiary 100.0 100.0 100.0 100.0
CACI DANNI Full Italy Ireland Branch 100.0 100.0 100.0 100.0
CACI LIFE LIMITED Full Ireland Subsidiary 100.0 100.0 100.0 100.0
CACI NON LIFE LIMITED Full Ireland Subsidiary 100.0 100.0 100.0 100.0
CACI NON VIE Full France Ireland Branch 100.0 100.0 100.0 100.0
CACI Reinsurance Ltd. Full Ireland Subsidiary 100.0 100.0 100.0 100.0
CACI VIE Full France Ireland Branch 100.0 100.0 100.0 100.0
CACI VITA Full Italy Ireland Branch 100.0 100.0 100.0 100.0
CALIE Europe Succursale
France Full France Luxembourg Branch 100.0 100.0 100.0 100.0
CALIE Europe Succursale
Pologne Full Poland Luxembourg Branch 100.0 100.0 100.0 100.0

Comptes consolidés du groupe Crédit Agricole S.A. – 30 June 2020
115
Crédit Agricole S.A. Group
Scope of consolidation
Consolidation
method
Scope
changes (a)
Principal
place of
business
Country of
incorporation if
different
from the
principal place
of business
Nature of control
(b)
% control % interest
30/06/2019 12/31/2019 30/06/2019 12/31/2019
Crédit Agricole Assurances
(CAA) Full France Subsidiary 100.0 100.0 100.0 100.0
Crédit Agricole Creditor
Insurance (CACI) Full France Subsidiary 100.0 100.0 100.0 100.0
Crédit Agricole Life Full Greece Subsidiary 100.0 100.0 100.0 100.0
Crédit Agricole Life Insurance
Company Japan Ltd. Full Japan Subsidiary 100.0 100.0 100.0 100.0
Crédit Agricole Life Insurance
Europe Full Luxembourg Subsidiary 100.0 100.0 99.9 99.9
Crédit Agricole Vita S.p.A. Full Italy Subsidiary 100.0 100.0 100.0 100.0
Finaref Risques Divers Full France Subsidiary 100.0 100.0 100.0 100.0
Finaref Vie Full France Subsidiary 100.0 100.0 100.0 100.0
GNB SEGUROS Full Portugal Subsidiary 75.0 75.0 75.0 75.0
Médicale de France Full France Subsidiary 100.0 100.0 100.0 100.0
Pacifica Full France Subsidiary 100.0 100.0 100.0 100.0
Predica Full France Subsidiary 100.0 100.0 100.0 100.0
Predica - Prévoyance Dialogue
du Crédit Agricole Full Spain Branch 100.0 100.0 100.0 100.0
Space Holding (Ireland) Limited Full Ireland Subsidiary 100.0 100.0 100.0 100.0
Space Lux Full Luxembourg Subsidiary 100.0 100.0 100.0 100.0
Spirica Full France Subsidiary 100.0 100.0 100.0 100.0
UCITS
37785 QXEURC Full E2 Luxembourg
Consolidated
structured entity 93.4 93.4
ACAJOU Full France
Consolidated
structured entity 100.0 100.0 68.4 68.4
AGRICOLE RIVAGE DETTE Full France
Consolidated
structured entity 100.0 100.0 100.0 100.0
AM DESE FIII DS3IMDI Full France
Consolidated
structured entity 100.0 100.0 100.0 100.0
AMUNDI GRD 24 FCP Full France
Consolidated
structured entity 100.0 100.0 100.0 100.0
AMUNDI PE Solution Alpha Full France
Consolidated
structured entity 100.0 100.0 68.4 68.4
APLEGROSENIEUHD Full Luxembourg
Consolidated
structured entity 50.9 50.9 50.9 50.9
ARTEMID Full France
Consolidated
structured entity 100.0 100.0 100.0 100.0
BFT CREDIT OPPORTUNITES -I-C Full France
Consolidated
structured entity 100.0 100.0 100.0 100.0
BFT opportunité Full France
Consolidated
structured entity 100.0 100.0 100.0 100.0
BFT VALUE PREM OP CD Full France
Consolidated
structured entity 100.0 100.0 100.0 100.0
CA VITA INFRASTRUCTURE
CHOICE FIPS c.I.A. Full France
Consolidated
structured entity 100.0 100.0 100.0 100.0
CA VITA PRIVATE DEBT CHOICE
FIPS cl.A Full France
Consolidated
structured entity 100.0 100.0 100.0 100.0
CA VITA PRIVATE EQUITY
CHOICE Full France
Consolidated
structured entity 100.0 100.0 100.0 100.0
CAA 2013 COMPARTIMENT 5 A5 Full France
Consolidated
structured entity 100.0 100.0 100.0 100.0
CAA 2013 FCPR B1 Full France
Consolidated
structured entity 100.0 100.0 100.0 100.0
CAA 2013 FCPR C1 Full France
Consolidated
structured entity 100.0 100.0 100.0 100.0

Comptes consolidés du groupe Crédit Agricole S.A. – 30 June 2020
116
Crédit Agricole S.A. Group
Scope of consolidation
Consolidation
method
Scope
changes (a)
Principal
place of
business
Country of
incorporation if
different
from the
principal place
of business
Nature of control
(b)
% control % interest
30/06/2019 12/31/2019 30/06/2019 12/31/2019
CAA 2013 FCPR D1 Full France
Consolidated
structured entity 100.0 100.0 100.0 100.0
CAA 2013-2 Full France
Consolidated
structured entity 100.0 100.0 100.0 100.0
CAA 2013-3 Full France
Consolidated
structured entity 100.0 100.0 100.0 100.0
CAA 2014 COMPARTIMENT 1
PART A1 Full France
Consolidated
structured entity 100.0 100.0 100.0 100.0
CAA 2014 INVESTISSMENT PART
A3 Full France
Consolidated
structured entity 100.0 100.0 100.0 100.0
CAA 2015 COMPARTIMENT 1 Full France
Consolidated
structured entity 100.0 100.0 100.0 100.0
CAA 2015 COMPARTIMENT 2 Full France
Consolidated
structured entity 100.0 100.0 100.0 100.0
CAA 2016 Full France
Consolidated
structured entity 100.0 100.0 100.0 100.0
CAA COMMERCES 2 Full E2 France
Consolidated
structured entity 100.0 100.0
CAA INFRASTRUCTURE Full France
Consolidated
structured entity 100.0 100.0 100.0 100.0
CAA INFRASTRUCTURE 2017 Full France
Consolidated
structured entity 100.0 100.0 100.0 100.0
CAA INFRASTRUCTURE 2018 -
COMPARTIMENT 1 Full France
Consolidated
structured entity 100.0 100.0 100.0 100.0
CAA INFRASTRUCTURE 2019 Full France
Consolidated
structured entity 92.1 100.0 92.1 100.0
CAA PR FI II C1 A1 Full France
Consolidated
structured entity 100.0 100.0 100.0 100.0
CAA PRIV EQY 19 CF A Full E2 France
Consolidated
structured entity 100.0 100.0
CAA PRIV.FINANC.COMP.1 A1
FIC Full France
Consolidated
structured entity 100.0 100.0 100.0 100.0
CAA PRIV.FINANC.COMP.2 A2
FIC Full France
Consolidated
structured entity 100.0 100.0 100.0 100.0
CAA PRIVATE EQUITY 2017 Full France
Consolidated
structured entity 100.0 100.0 100.0 100.0
CAA PRIVATE EQUITY 2017 BIS Full France
Consolidated
structured entity 100.0 100.0 100.0 100.0
CAA PRIVATE EQUITY 2017
FRANCE INVESTISSEMENT Full France
Consolidated
structured entity 100.0 100.0 100.0 100.0
CAA PRIVATE EQUITY 2017
MEZZANINE Full France
Consolidated
structured entity 100.0 100.0 100.0 100.0
CAA PRIVATE EQUITY 2017 TER Full France
Consolidated
structured entity 100.0 100.0 100.0 100.0
CAA PRIVATE EQUITY 2018 -
COMPARTIMENT 1 Full France
Consolidated
structured entity 100.0 100.0 100.0 100.0
CAA PRIVATE EQUITY 2018 -
COMPARTIMENT FRANCE
INVESTISSEMENT Full France
Consolidated
structured entity 100.0 100.0 100.0 100.0
CAA PRIVATE EQUITY 2019
COMPARTIMENT 1 Full France
Consolidated
structured entity 100.0 100.0 100.0 100.0
CAA PRIVATE EQUITY 2019
COMPARTIMENT BIS Full France
Consolidated
structured entity 100.0 100.0 100.0 100.0
CAA PRIVATE EQUITY 2019
COMPARTIMENT TER Full France
Consolidated
structured entity 100.0 100.0 100.0 100.0
CAA SECONDAIRE IV Full France
Consolidated
structured entity 100.0 100.0 100.0 100.0
CAREPTA R 2016 Full France
Consolidated
structured entity 100.0 100.0 100.0 100.0
CEDAR Full France
Consolidated
structured entity 100.0 100.0 68.4 68.4
Chorial Allocation Full France
Consolidated
structured entity 99.7 99.7 68.2 68.2
CNP ACP 10 FCP Full France
Consolidated
structured entity 100.0 100.0 100.0 100.0
COMPARTIMENT DS3 -
IMMOBILIER VAUGIRARD Full France
Consolidated
structured entity 100.0 100.0 100.0 100.0
COMPARTIMENT DS3 -
VAUGIRARD Full France
Consolidated
structured entity 100.0 100.0 100.0 100.0
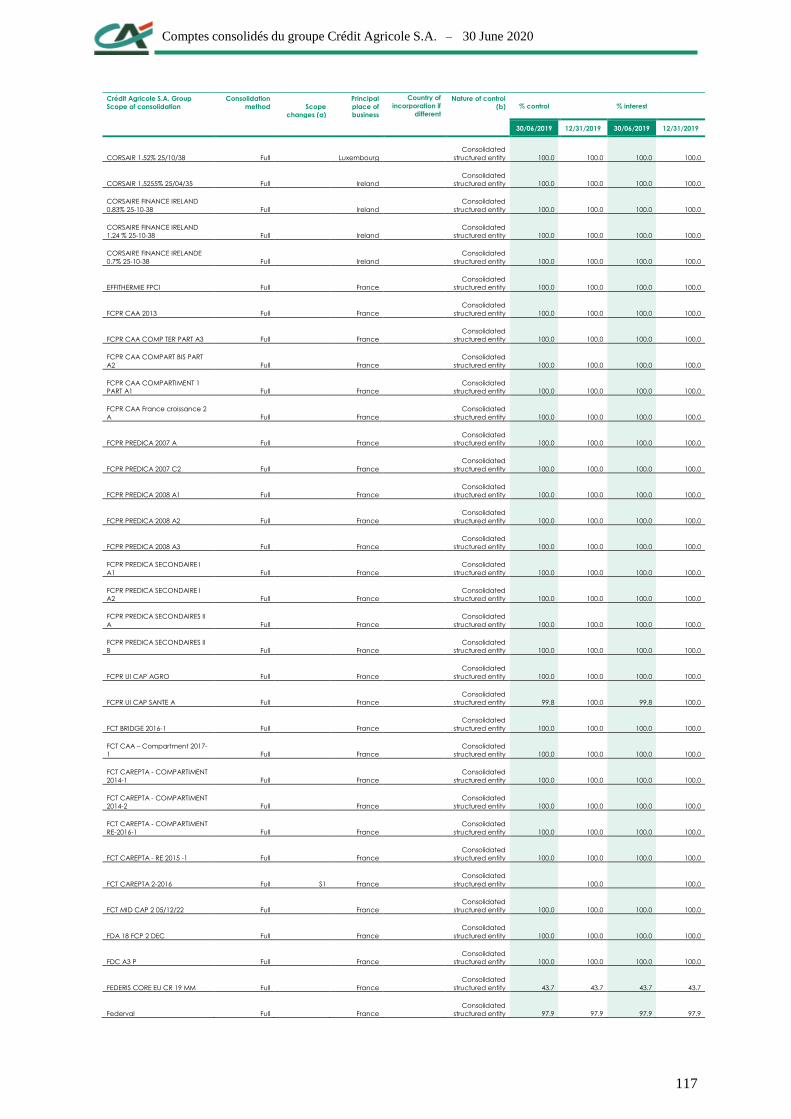
Comptes consolidés du groupe Crédit Agricole S.A. – 30 June 2020
117
Crédit Agricole S.A. Group
Scope of consolidation
Consolidation
method
Scope
changes (a)
Principal
place of
business
Country of
incorporation if
different
from the
principal place
of business
Nature of control
(b)
% control % interest
30/06/2019 12/31/2019 30/06/2019 12/31/2019
CORSAIR 1.52% 25/10/38 Full Luxembourg
Consolidated
structured entity 100.0 100.0 100.0 100.0
CORSAIR 1.5255% 25/04/35 Full Ireland
Consolidated
structured entity 100.0 100.0 100.0 100.0
CORSAIRE FINANCE IRELAND
0.83% 25-10-38 Full Ireland
Consolidated
structured entity 100.0 100.0 100.0 100.0
CORSAIRE FINANCE IRELAND
1.24 % 25-10-38 Full Ireland
Consolidated
structured entity 100.0 100.0 100.0 100.0
CORSAIRE FINANCE IRELANDE
0.7% 25-10-38 Full Ireland
Consolidated
structured entity 100.0 100.0 100.0 100.0
EFFITHERMIE FPCI Full France
Consolidated
structured entity 100.0 100.0 100.0 100.0
FCPR CAA 2013 Full France
Consolidated
structured entity 100.0 100.0 100.0 100.0
FCPR CAA COMP TER PART A3 Full France
Consolidated
structured entity 100.0 100.0 100.0 100.0
FCPR CAA COMPART BIS PART
A2 Full France
Consolidated
structured entity 100.0 100.0 100.0 100.0
FCPR CAA COMPARTIMENT 1
PART A1 Full France
Consolidated
structured entity 100.0 100.0 100.0 100.0
FCPR CAA France croissance 2
A Full France
Consolidated
structured entity 100.0 100.0 100.0 100.0
FCPR PREDICA 2007 A Full France
Consolidated
structured entity 100.0 100.0 100.0 100.0
FCPR PREDICA 2007 C2 Full France
Consolidated
structured entity 100.0 100.0 100.0 100.0
FCPR PREDICA 2008 A1 Full France
Consolidated
structured entity 100.0 100.0 100.0 100.0
FCPR PREDICA 2008 A2 Full France
Consolidated
structured entity 100.0 100.0 100.0 100.0
FCPR PREDICA 2008 A3 Full France
Consolidated
structured entity 100.0 100.0 100.0 100.0
FCPR PREDICA SECONDAIRE I
A1 Full France
Consolidated
structured entity 100.0 100.0 100.0 100.0
FCPR PREDICA SECONDAIRE I
A2 Full France
Consolidated
structured entity 100.0 100.0 100.0 100.0
FCPR PREDICA SECONDAIRES II
A Full France
Consolidated
structured entity 100.0 100.0 100.0 100.0
FCPR PREDICA SECONDAIRES II
B Full France
Consolidated
structured entity 100.0 100.0 100.0 100.0
FCPR UI CAP AGRO Full France
Consolidated
structured entity 100.0 100.0 100.0 100.0
FCPR UI CAP SANTE A Full France
Consolidated
structured entity 99.8 100.0 99.8 100.0
FCT BRIDGE 2016-1 Full France
Consolidated
structured entity 100.0 100.0 100.0 100.0
FCT CAA – Compartment 2017-
1 Full France
Consolidated
structured entity 100.0 100.0 100.0 100.0
FCT CAREPTA - COMPARTIMENT
2014-1 Full France
Consolidated
structured entity 100.0 100.0 100.0 100.0
FCT CAREPTA - COMPARTIMENT
2014-2 Full France
Consolidated
structured entity 100.0 100.0 100.0 100.0
FCT CAREPTA - COMPARTIMENT
RE-2016-1 Full France
Consolidated
structured entity 100.0 100.0 100.0 100.0
FCT CAREPTA - RE 2015 -1 Full France
Consolidated
structured entity 100.0 100.0 100.0 100.0
FCT CAREPTA 2-2016 Full S1 France
Consolidated
structured entity 100.0 100.0
FCT MID CAP 2 05/12/22 Full France
Consolidated
structured entity 100.0 100.0 100.0 100.0
FDA 18 FCP 2 DEC Full France
Consolidated
structured entity 100.0 100.0 100.0 100.0
FDC A3 P Full France
Consolidated
structured entity 100.0 100.0 100.0 100.0
FEDERIS CORE EU CR 19 MM Full France
Consolidated
structured entity 43.7 43.7 43.7 43.7
Federval Full France
Consolidated
structured entity 97.9 97.9 97.9 97.9
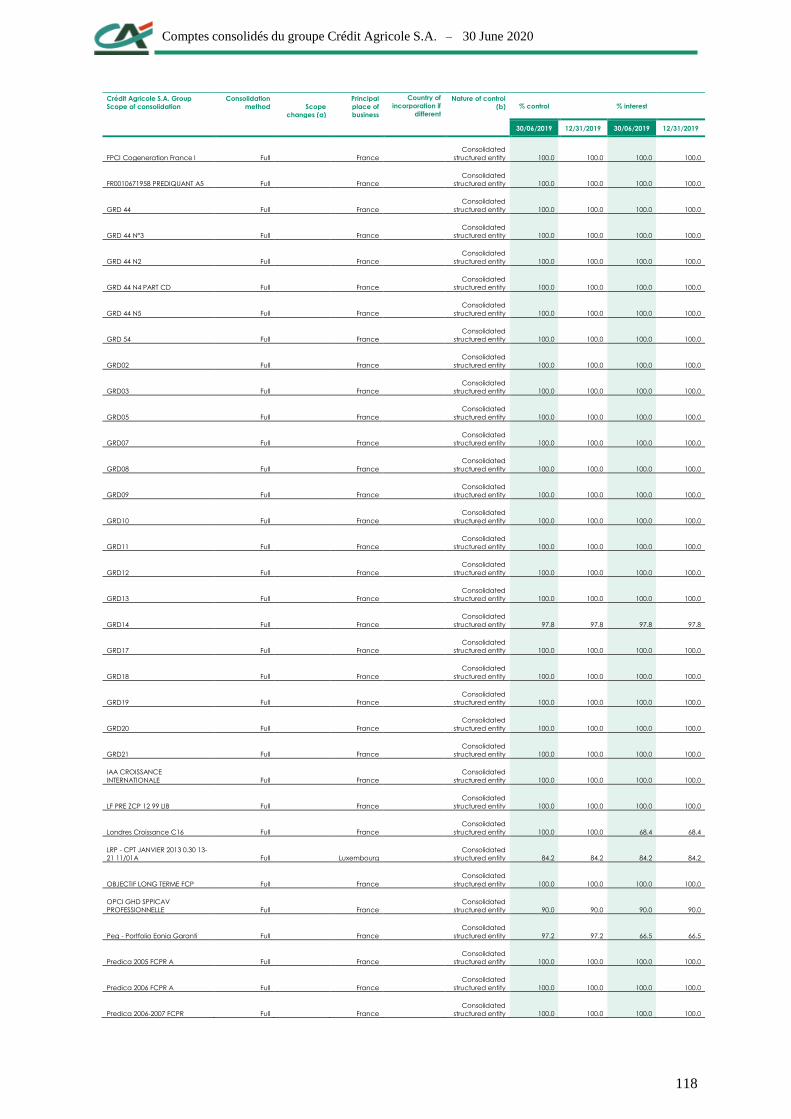
Comptes consolidés du groupe Crédit Agricole S.A. – 30 June 2020
118
Crédit Agricole S.A. Group
Scope of consolidation
Consolidation
method
Scope
changes (a)
Principal
place of
business
Country of
incorporation if
different
from the
principal place
of business
Nature of control
(b)
% control % interest
30/06/2019 12/31/2019 30/06/2019 12/31/2019
FPCI Cogeneration France I Full France
Consolidated
structured entity 100.0 100.0 100.0 100.0
FR0010671958 PREDIQUANT A5 Full France
Consolidated
structured entity 100.0 100.0 100.0 100.0
GRD 44 Full France
Consolidated
structured entity 100.0 100.0 100.0 100.0
GRD 44 N°3 Full France
Consolidated
structured entity 100.0 100.0 100.0 100.0
GRD 44 N2 Full France
Consolidated
structured entity 100.0 100.0 100.0 100.0
GRD 44 N4 PART CD Full France
Consolidated
structured entity 100.0 100.0 100.0 100.0
GRD 44 N5 Full France
Consolidated
structured entity 100.0 100.0 100.0 100.0
GRD 54 Full France
Consolidated
structured entity 100.0 100.0 100.0 100.0
GRD02 Full France
Consolidated
structured entity 100.0 100.0 100.0 100.0
GRD03 Full France
Consolidated
structured entity 100.0 100.0 100.0 100.0
GRD05 Full France
Consolidated
structured entity 100.0 100.0 100.0 100.0
GRD07 Full France
Consolidated
structured entity 100.0 100.0 100.0 100.0
GRD08 Full France
Consolidated
structured entity 100.0 100.0 100.0 100.0
GRD09 Full France
Consolidated
structured entity 100.0 100.0 100.0 100.0
GRD10 Full France
Consolidated
structured entity 100.0 100.0 100.0 100.0
GRD11 Full France
Consolidated
structured entity 100.0 100.0 100.0 100.0
GRD12 Full France
Consolidated
structured entity 100.0 100.0 100.0 100.0
GRD13 Full France
Consolidated
structured entity 100.0 100.0 100.0 100.0
GRD14 Full France
Consolidated
structured entity 97.8 97.8 97.8 97.8
GRD17 Full France
Consolidated
structured entity 100.0 100.0 100.0 100.0
GRD18 Full France
Consolidated
structured entity 100.0 100.0 100.0 100.0
GRD19 Full France
Consolidated
structured entity 100.0 100.0 100.0 100.0
GRD20 Full France
Consolidated
structured entity 100.0 100.0 100.0 100.0
GRD21 Full France
Consolidated
structured entity 100.0 100.0 100.0 100.0
IAA CROISSANCE
INTERNATIONALE Full France
Consolidated
structured entity 100.0 100.0 100.0 100.0
LF PRE ZCP 12 99 LIB Full France
Consolidated
structured entity 100.0 100.0 100.0 100.0
Londres Croissance C16 Full France
Consolidated
structured entity 100.0 100.0 68.4 68.4
LRP - CPT JANVIER 2013 0.30 13-
21 11/01A Full Luxembourg
Consolidated
structured entity 84.2 84.2 84.2 84.2
OBJECTIF LONG TERME FCP Full France
Consolidated
structured entity 100.0 100.0 100.0 100.0
OPCI GHD SPPICAV
PROFESSIONNELLE Full France
Consolidated
structured entity 90.0 90.0 90.0 90.0
Peg - Portfolio Eonia Garanti Full France
Consolidated
structured entity 97.2 97.2 66.5 66.5
Predica 2005 FCPR A Full France
Consolidated
structured entity 100.0 100.0 100.0 100.0
Predica 2006 FCPR A Full France
Consolidated
structured entity 100.0 100.0 100.0 100.0
Predica 2006-2007 FCPR Full France
Consolidated
structured entity 100.0 100.0 100.0 100.0
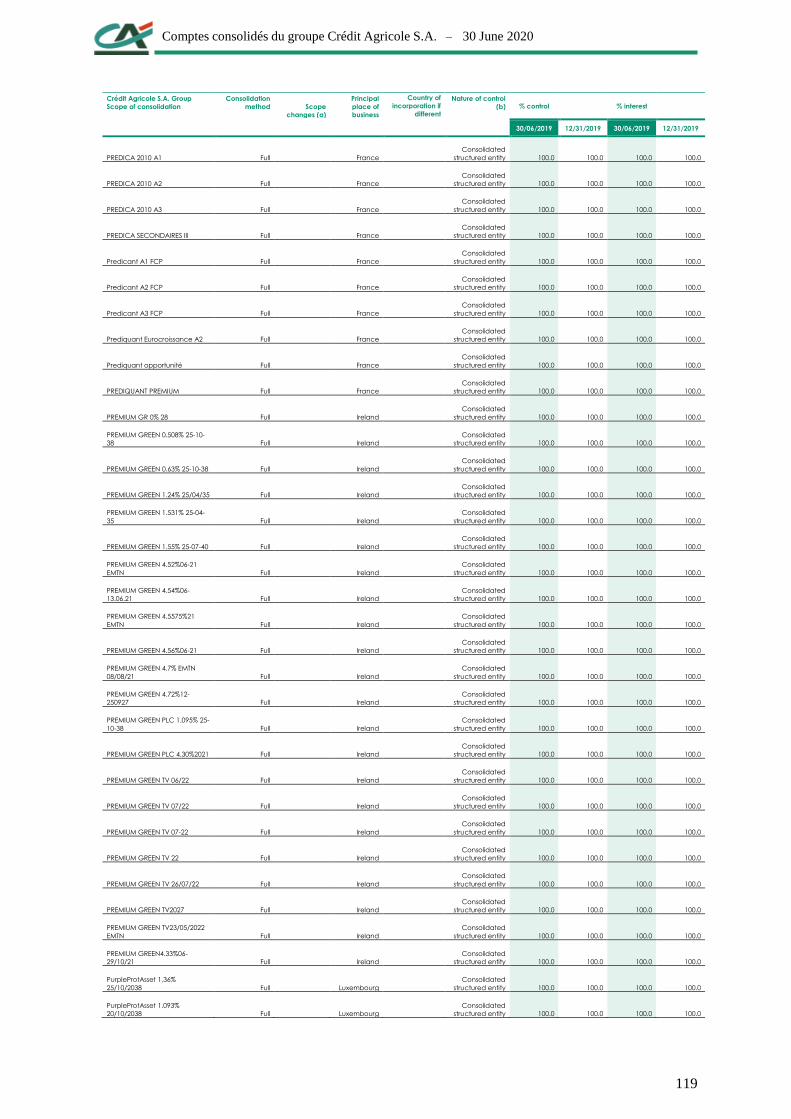
Comptes consolidés du groupe Crédit Agricole S.A. – 30 June 2020
119
Crédit Agricole S.A. Group
Scope of consolidation
Consolidation
method
Scope
changes (a)
Principal
place of
business
Country of
incorporation if
different
from the
principal place
of business
Nature of control
(b)
% control % interest
30/06/2019 12/31/2019 30/06/2019 12/31/2019
PREDICA 2010 A1 Full France
Consolidated
structured entity 100.0 100.0 100.0 100.0
PREDICA 2010 A2 Full France
Consolidated
structured entity 100.0 100.0 100.0 100.0
PREDICA 2010 A3 Full France
Consolidated
structured entity 100.0 100.0 100.0 100.0
PREDICA SECONDAIRES III Full France
Consolidated
structured entity 100.0 100.0 100.0 100.0
Predicant A1 FCP Full France
Consolidated
structured entity 100.0 100.0 100.0 100.0
Predicant A2 FCP Full France
Consolidated
structured entity 100.0 100.0 100.0 100.0
Predicant A3 FCP Full France
Consolidated
structured entity 100.0 100.0 100.0 100.0
Prediquant Eurocroissance A2 Full France
Consolidated
structured entity 100.0 100.0 100.0 100.0
Prediquant opportunité Full France
Consolidated
structured entity 100.0 100.0 100.0 100.0
PREDIQUANT PREMIUM Full France
Consolidated
structured entity 100.0 100.0 100.0 100.0
PREMIUM GR 0% 28 Full Ireland
Consolidated
structured entity 100.0 100.0 100.0 100.0
PREMIUM GREEN 0.508% 25-10-
38 Full Ireland
Consolidated
structured entity 100.0 100.0 100.0 100.0
PREMIUM GREEN 0.63% 25-10-38 Full Ireland
Consolidated
structured entity 100.0 100.0 100.0 100.0
PREMIUM GREEN 1.24% 25/04/35 Full Ireland
Consolidated
structured entity 100.0 100.0 100.0 100.0
PREMIUM GREEN 1.531% 25-04-
35 Full Ireland
Consolidated
structured entity 100.0 100.0 100.0 100.0
PREMIUM GREEN 1.55% 25-07-40 Full Ireland
Consolidated
structured entity 100.0 100.0 100.0 100.0
PREMIUM GREEN 4.52%06-21
EMTN Full Ireland
Consolidated
structured entity 100.0 100.0 100.0 100.0
PREMIUM GREEN 4.54%06-
13.06.21 Full Ireland
Consolidated
structured entity 100.0 100.0 100.0 100.0
PREMIUM GREEN 4.5575%21
EMTN Full Ireland
Consolidated
structured entity 100.0 100.0 100.0 100.0
PREMIUM GREEN 4.56%06-21 Full Ireland
Consolidated
structured entity 100.0 100.0 100.0 100.0
PREMIUM GREEN 4.7% EMTN
08/08/21 Full Ireland
Consolidated
structured entity 100.0 100.0 100.0 100.0
PREMIUM GREEN 4.72%12-
250927 Full Ireland
Consolidated
structured entity 100.0 100.0 100.0 100.0
PREMIUM GREEN PLC 1.095% 25-
10-38 Full Ireland
Consolidated
structured entity 100.0 100.0 100.0 100.0
PREMIUM GREEN PLC 4.30%2021 Full Ireland
Consolidated
structured entity 100.0 100.0 100.0 100.0
PREMIUM GREEN TV 06/22 Full Ireland
Consolidated
structured entity 100.0 100.0 100.0 100.0
PREMIUM GREEN TV 07/22 Full Ireland
Consolidated
structured entity 100.0 100.0 100.0 100.0
PREMIUM GREEN TV 07-22 Full Ireland
Consolidated
structured entity 100.0 100.0 100.0 100.0
PREMIUM GREEN TV 22 Full Ireland
Consolidated
structured entity 100.0 100.0 100.0 100.0
PREMIUM GREEN TV 26/07/22 Full Ireland
Consolidated
structured entity 100.0 100.0 100.0 100.0
PREMIUM GREEN TV2027 Full Ireland
Consolidated
structured entity 100.0 100.0 100.0 100.0
PREMIUM GREEN TV23/05/2022
EMTN Full Ireland
Consolidated
structured entity 100.0 100.0 100.0 100.0
PREMIUM GREEN4.33%06-
29/10/21 Full Ireland
Consolidated
structured entity 100.0 100.0 100.0 100.0
PurpleProtAsset 1,36%
25/10/2038 Full Luxembourg
Consolidated
structured entity 100.0 100.0 100.0 100.0
PurpleProtAsset 1.093%
20/10/2038 Full Luxembourg
Consolidated
structured entity 100.0 100.0 100.0 100.0
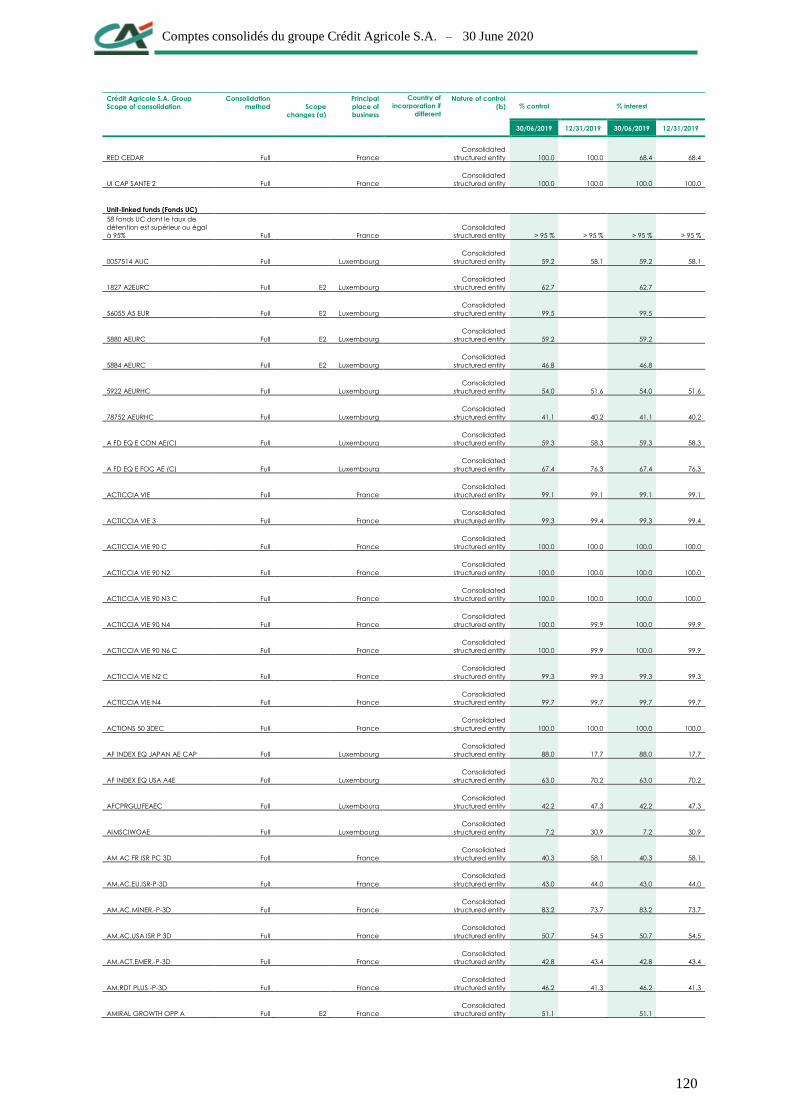
Comptes consolidés du groupe Crédit Agricole S.A. – 30 June 2020
120
Crédit Agricole S.A. Group
Scope of consolidation
Consolidation
method
Scope
changes (a)
Principal
place of
business
Country of
incorporation if
different
from the
principal place
of business
Nature of control
(b)
% control % interest
30/06/2019 12/31/2019 30/06/2019 12/31/2019
RED CEDAR Full France
Consolidated
structured entity 100.0 100.0 68.4 68.4
UI CAP SANTE 2 Full France
Consolidated
structured entity 100.0 100.0 100.0 100.0
Unit-linked funds (Fonds UC)
58 fonds UC dont le taux de
détention est supérieur ou égal
à 95% Full France
Consolidated
structured entity > 95 % > 95 % > 95 % > 95 %
0057514 AUC Full Luxembourg
Consolidated
structured entity 59.2 58.1 59.2 58.1
1827 A2EURC Full E2 Luxembourg
Consolidated
structured entity 62.7 62.7
56055 A5 EUR Full E2 Luxembourg
Consolidated
structured entity 99.5 99.5
5880 AEURC Full E2 Luxembourg
Consolidated
structured entity 59.2 59.2
5884 AEURC Full E2 Luxembourg
Consolidated
structured entity 46.8 46.8
5922 AEURHC Full Luxembourg
Consolidated
structured entity 54.0 51.6 54.0 51.6
78752 AEURHC Full Luxembourg
Consolidated
structured entity 41.1 40.2 41.1 40.2
A FD EQ E CON AE(C) Full Luxembourg
Consolidated
structured entity 59.3 58.3 59.3 58.3
A FD EQ E FOC AE (C) Full Luxembourg
Consolidated
structured entity 67.4 76.3 67.4 76.3
ACTICCIA VIE Full France
Consolidated
structured entity 99.1 99.1 99.1 99.1
ACTICCIA VIE 3 Full France
Consolidated
structured entity 99.3 99.4 99.3 99.4
ACTICCIA VIE 90 C Full France
Consolidated
structured entity 100.0 100.0 100.0 100.0
ACTICCIA VIE 90 N2 Full France
Consolidated
structured entity 100.0 100.0 100.0 100.0
ACTICCIA VIE 90 N3 C Full France
Consolidated
structured entity 100.0 100.0 100.0 100.0
ACTICCIA VIE 90 N4 Full France
Consolidated
structured entity 100.0 99.9 100.0 99.9
ACTICCIA VIE 90 N6 C Full France
Consolidated
structured entity 100.0 99.9 100.0 99.9
ACTICCIA VIE N2 C Full France
Consolidated
structured entity 99.3 99.3 99.3 99.3
ACTICCIA VIE N4 Full France
Consolidated
structured entity 99.7 99.7 99.7 99.7
ACTIONS 50 3DEC Full France
Consolidated
structured entity 100.0 100.0 100.0 100.0
AF INDEX EQ JAPAN AE CAP Full Luxembourg
Consolidated
structured entity 88.0 17.7 88.0 17.7
AF INDEX EQ USA A4E Full Luxembourg
Consolidated
structured entity 63.0 70.2 63.0 70.2
AFCPRGLLIFEAEC Full Luxembourg
Consolidated
structured entity 42.2 47.3 42.2 47.3
AIMSCIWOAE Full Luxembourg
Consolidated
structured entity 7.2 30.9 7.2 30.9
AM AC FR ISR PC 3D Full France
Consolidated
structured entity 40.3 58.1 40.3 58.1
AM.AC.EU.ISR-P-3D Full France
Consolidated
structured entity 43.0 44.0 43.0 44.0
AM.AC.MINER.-P-3D Full France
Consolidated
structured entity 83.2 73.7 83.2 73.7
AM.AC.USA ISR P 3D Full France
Consolidated
structured entity 50.7 54.5 50.7 54.5
AM.ACT.EMER.-P-3D Full France
Consolidated
structured entity 42.8 43.4 42.8 43.4
AM.RDT PLUS -P-3D Full France
Consolidated
structured entity 46.2 41.3 46.2 41.3
AMIRAL GROWTH OPP A Full E2 France
Consolidated
structured entity 51.1 51.1

Comptes consolidés du groupe Crédit Agricole S.A. – 30 June 2020
121
Crédit Agricole S.A. Group
Scope of consolidation
Consolidation
method
Scope
changes (a)
Principal
place of
business
Country of
incorporation if
different
from the
principal place
of business
Nature of control
(b)
% control % interest
30/06/2019 12/31/2019 30/06/2019 12/31/2019
AMUN TRESO CT PC 3D Full France
Consolidated
structured entity 100.0 85.8 100.0 85.8
AMUN.ACT.REST.P-C Full France
Consolidated
structured entity 68.6 70.7 68.6 70.7
AMUN.TRES.EONIA ISR E FCP
3DEC Full France
Consolidated
structured entity 47.5 85.2 47.5 85.2
AMUNDI AC.FONC.PC 3D Full France
Consolidated
structured entity 64.2 56.3 64.2 56.3
AMUNDI ACTIONS FRANCE C
3DEC Full France
Consolidated
structured entity 56.0 56.6 56.0 56.6
AMUNDI AFD AV DURABL P1
FCP 3DEC Full France
Consolidated
structured entity 78.8 78.4 78.8 78.4
AMUNDI ALLOCATION C Full France
Consolidated
structured entity 99.3 97.7 99.3 97.7
AMUNDI B GL AGG AEC Full Luxembourg
Consolidated
structured entity 8.4 55.3 8.4 55.3
AMUNDI BGEB AEC Full Luxembourg
Consolidated
structured entity 45.5 43.7 45.5 43.7
AMUNDI EQ E IN AHEC Full Luxembourg
Consolidated
structured entity 39.6 37.4 39.6 37.4
AMUNDI GBL MACRO MULTI
ASSET P Full France
Consolidated
structured entity 70.1 69.6 70.1 69.6
AMUNDI GLB MUL-ASSET-
M2EURC Full Luxembourg
Consolidated
structured entity 47.5 67.9 47.5 67.9
AMUNDI GLO M/A CONS-M2
EUR C Full Luxembourg
Consolidated
structured entity 76.2 66.0 76.2 66.0
AMUNDI HORIZON 3D Full France
Consolidated
structured entity 66.3 66.0 66.3 66.0
AMUNDI KBI ACTION PC Full France
Consolidated
structured entity 87.7 87.4 87.7 87.4
AMUNDI KBI ACTIONS C Full France
Consolidated
structured entity 53.8 25.2 53.8 25.2
AMUNDI KBI AQUA C Full E2 France
Consolidated
structured entity 83.5 83.5
AMUNDI OBLIG EURO C Full France
Consolidated
structured entity 49.6 48.5 49.6 48.5
AMUNDI PATRIMOINE C 3DEC Full France
Consolidated
structured entity 85.7 85.5 85.7 85.5
AMUNDI PULSACTIONS Full France
Consolidated
structured entity 57.5 57.6 57.5 57.6
AMUNDI SONANCE VIE 7 3DEC Full France
Consolidated
structured entity 97.4 97.4 97.4 97.4
AMUNDI SONANCE VIE N8 3DEC Full France
Consolidated
structured entity 98.6 98.7 98.6 98.7
AMUNDI TRANSM PAT C Full France
Consolidated
structured entity 98.6 98.1 98.6 98.1
AMUNDI VALEURS DURAB Full France
Consolidated
structured entity 63.3 67.9 63.3 67.9
AMUNDI-CSH IN-PC Full France
Consolidated
structured entity 100.0 76.0 100.0 76.0
AMUNDI-EUR EQ GREEN IM-
IEURC Full Luxembourg
Consolidated
structured entity 69.1 80.2 69.1 80.2
AMUNDI-GL INFLAT BD-MEURC Full Luxembourg
Consolidated
structured entity 54.8 60.4 54.8 60.4
AMUNDIOBLIGMONDEP Full France
Consolidated
structured entity 72.6 68.3 72.6 68.3
AMUNDI-VOLATILITY WRLD-
IUSDC Full S1 Luxembourg
Consolidated
structured entity 69.7 69.7
AMUNDI-VOLATILITY WRLD-
OUSDC Full S1 Luxembourg
Consolidated
structured entity 64.5 64.5
ANTINEA FCP Full France
Consolidated
structured entity 30.5 55.2 30.5 55.2
ARC FLEXIBOND-D Full France
Consolidated
structured entity 7.6 49.6 7.6 49.6
ATOUT EUROPE C FCP 3DEC Full France
Consolidated
structured entity 82.3 82.4 82.3 82.4
ATOUT FRANCE C FCP 3DEC Full France
Consolidated
structured entity 41.8 41.9 41.8 41.9

Comptes consolidés du groupe Crédit Agricole S.A. – 30 June 2020
122
Crédit Agricole S.A. Group
Scope of consolidation
Consolidation
method
Scope
changes (a)
Principal
place of
business
Country of
incorporation if
different
from the
principal place
of business
Nature of control
(b)
% control % interest
30/06/2019 12/31/2019 30/06/2019 12/31/2019
ATOUT PREM S ACTIONS 3DEC Full France
Consolidated
structured entity 99.9 100.0 99.9 100.0
ATOUT VERT HORIZON FCP 3
DEC Full France
Consolidated
structured entity 35.2 35.2 35.2 35.2
AXA EUR.SM.CAP E 3D Full France
Consolidated
structured entity 93.0 82.4 93.0 82.4
BA-FII EUR EQ O-GEUR Full Luxembourg
Consolidated
structured entity 50.3 50.7 50.3 50.7
BFT FRAN FUT-C SI.3D Full France
Consolidated
structured entity 51.5 49.2 51.5 49.2
BFT SEL RDT 23 PC Full France
Consolidated
structured entity 99.6 100.0 99.6 100.0
BFT STATERE P (C) Full France
Consolidated
structured entity 44.4 43.6 44.4 43.6
BNP PAR.CRED.ERSC Full France
Consolidated
structured entity 60.8 60.8 60.8 60.8
CA MASTER EUROPE Full France
Consolidated
structured entity 46.1 46.6 46.1 46.6
CA MASTER PATRIMOINE FCP
3DEC Full France
Consolidated
structured entity 98.6 98.5 98.6 98.5
CADEISDA 2DEC Full France
Consolidated
structured entity 40.0 40.0 40.0 40.0
CALIFORNIA 09 Full E2 France
Consolidated
structured entity 67.3 67.3
CHORELIA N2 PART C Full France
Consolidated
structured entity 87.8 87.8 87.8 87.8
CHORELIA N3 PART C Full Luxembourg
Consolidated
structured entity 86.3 86.5 86.3 86.5
CHORELIA N4 PART C Full France
Consolidated
structured entity 88.5 88.6 88.5 88.6
CHORELIA N5 PART C Full France
Consolidated
structured entity 77.7 77.9 77.7 77.9
CHORELIA N6 PART C Full France
Consolidated
structured entity 81.8 58.9 81.8 58.9
CHORELIA N7 C Full E2 France
Consolidated
structured entity 85.9 85.9
CHORELIA PART C Full France
Consolidated
structured entity 85.1 85.2 85.1 85.2
CPR CONSO ACTIONNAIRE FCP
P Full France
Consolidated
structured entity 51.8 51.8 51.8 51.8
CPR CROIS.REA.-P Full France
Consolidated
structured entity 28.3 39.1 28.3 39.1
CPR EUR.HI.DIV.P 3D Full France
Consolidated
structured entity 44.3 43.2 44.3 43.2
CPR EUROLAND ESG P Full E2 France
Consolidated
structured entity 54.7 54.7
CPR FOCUS INF.-P-3D Full France
Consolidated
structured entity 30.3 19.6 30.3 19.6
CPR GLO SILVER AGE P Full France
Consolidated
structured entity 95.1 96.9 95.1 96.9
CPR I-SM B C-AEURA Full Luxembourg
Consolidated
structured entity 60.0 61.1 60.0 61.1
CPR OBLIG 12 M.P 3D Full France
Consolidated
structured entity 88.0 90.5 88.0 90.5
CPR REF.ST.EP.R.0-100 FCP 3DEC Full France
Consolidated
structured entity 100.0 100.0 100.0 100.0
CPR REFL RESP 0-100 I 3DEC Full France
Consolidated
structured entity 99.3 97.0 99.3 97.0
CPR REFL.RESP.0-100 P FCP
3DEC Full France
Consolidated
structured entity 85.4 85.6 85.4 85.6
CPR REFLEX STRATEDIS 0-100 P
3D Full France
Consolidated
structured entity 99.8 99.8 99.8 99.8
CPR RENAI.JAP.-P-3D Full France
Consolidated
structured entity 33.9 66.1 33.9 66.1
CPR SILVER AGE P 3DEC Full France
Consolidated
structured entity 55.7 52.6 55.7 52.6
CPR-CLIM ACT-AEURA Full Luxembourg
Consolidated
structured entity 46.6 53.3 46.6 53.3

Comptes consolidés du groupe Crédit Agricole S.A. – 30 June 2020
123
Crédit Agricole S.A. Group
Scope of consolidation
Consolidation
method
Scope
changes (a)
Principal
place of
business
Country of
incorporation if
different
from the
principal place
of business
Nature of control
(b)
% control % interest
30/06/2019 12/31/2019 30/06/2019 12/31/2019
CPRGLODISOPARAC Full Luxembourg
Consolidated
structured entity 46.6 47.0 46.6 47.0
ECOFI MULTI OPPORTUN.FCP
3DEC Full France
Consolidated
structured entity 79.4 83.3 79.4 83.3
EPARINTER EURO BD Full France
Consolidated
structured entity 47.4 44.7 47.4 44.7
EXAN.PLEI.FD P Full S1 France
Consolidated
structured entity 4.2 4.2
EXANE 1 OVERDR CC Full Luxembourg
Consolidated
structured entity 72.1 63.8 72.1 63.8
FE AMUNDI INC BLDR-IHE C Full Luxembourg
Consolidated
structured entity 80.2 77.8 80.2 77.8
FONDS AV ECHUS FIA A Full France
Consolidated
structured entity 100.0 0.2 100.0 0.2
FONDS AV ECHUS FIA B Full France
Consolidated
structured entity 100.0 100.0 100.0 100.0
FRANKLIN DIVER-DYN-I ACC EU Full Luxembourg
Consolidated
structured entity 50.2 50.1 50.2 50.1
FRANKLIN GLB MLT-AS IN-IAEUR Full Luxembourg
Consolidated
structured entity 80.8 75.1 80.8 75.1
GRD CAR 39 FCP Full France
Consolidated
structured entity 100.0 100.0 100.0 100.0
GRD FCR 99 FCP Full France
Consolidated
structured entity 100.0 100.0 100.0 100.0
GRD IFC 97 FCP Full France
Consolidated
structured entity 100.0 100.0 100.0 100.0
HASTINGS PATRIM AC Full France
Consolidated
structured entity 43.3 41.0 43.3 41.0
HYMNOS P 3D Full France
Consolidated
structured entity 50.3 46.5 50.3 46.5
IGSF-GBL GOLD FD-I C Full Luxembourg
Consolidated
structured entity 42.7 46.3 42.7 46.3
IND.CAP EMERG.-C-3D Full France
Consolidated
structured entity 46.6 80.6 46.6 80.6
INDO ALLOC MANDAT C Full France
Consolidated
structured entity 96.8 2.0 96.8 2.0
INDO-FII EUR CP-IEUR Full Luxembourg
Consolidated
structured entity 59.9 51.7 59.9 51.7
INDOFIIFLEXEG Full E2 Luxembourg
Consolidated
structured entity 53.1 53.1
INDO-GBL TR-PE Full Luxembourg
Consolidated
structured entity 47.8 41.0 47.8 41.0
INDOS.EURO.PAT.PD 3D Full France
Consolidated
structured entity 43.2 43.1 43.2 43.1
INDOSUEZ ALLOCATION Full France
Consolidated
structured entity 99.5 81.6 99.5 81.6
INDOSUEZ EURO DIV G Full Luxembourg
Consolidated
structured entity 85.8 75.8 85.8 75.8
INDOSUEZ NAVIGATOR G Full Luxembourg
Consolidated
structured entity 38.5 40.9 38.5 40.9
INDOSUEZSWZOPG Full S1 Luxembourg
Consolidated
structured entity 50.8 50.8
INVEST RESP S3 3D Full France
Consolidated
structured entity 74.6 74.1 74.6 74.1
JPM US EQY ALL CAP-C HDG Full Luxembourg
Consolidated
structured entity 88.7 88.9 88.7 88.9
JPM US SEL EQ PLS-CA EUR HD Full Luxembourg
Consolidated
structured entity 49.8 57.0 49.8 57.0
JPMORGAN F-JPM US VALUE-
CEHA Full Luxembourg
Consolidated
structured entity ‐ 59.3 ‐ 59.3
JPMORGAN F-US GROWTH-C
AHD Full Luxembourg
Consolidated
structured entity 0.5 49.4 0.5 49.4
LCF CREDIT ERSC 3D Full France
Consolidated
structured entity 50.1 54.7 50.1 54.7
LCL 3 TEMPO AV 11/16 Full France
Consolidated
structured entity 100.0 100.0 100.0 100.0
LCL 6 HORIZ. AV 0615 Full France
Consolidated
structured entity 100.0 100.0 100.0 100.0
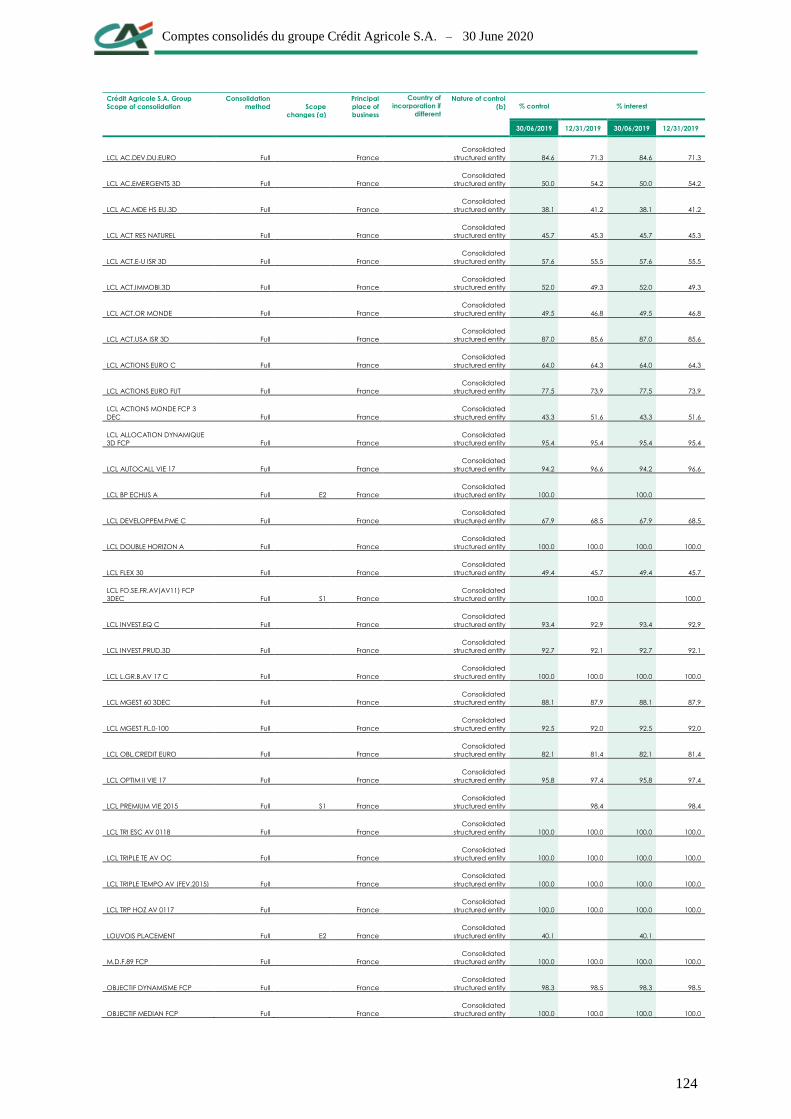
Comptes consolidés du groupe Crédit Agricole S.A. – 30 June 2020
124
Crédit Agricole S.A. Group
Scope of consolidation
Consolidation
method
Scope
changes (a)
Principal
place of
business
Country of
incorporation if
different
from the
principal place
of business
Nature of control
(b)
% control % interest
30/06/2019 12/31/2019 30/06/2019 12/31/2019
LCL AC.DEV.DU.EURO Full France
Consolidated
structured entity 84.6 71.3 84.6 71.3
LCL AC.EMERGENTS 3D Full France
Consolidated
structured entity 50.0 54.2 50.0 54.2
LCL AC.MDE HS EU.3D Full France
Consolidated
structured entity 38.1 41.2 38.1 41.2
LCL ACT RES NATUREL Full France
Consolidated
structured entity 45.7 45.3 45.7 45.3
LCL ACT.E-U ISR 3D Full France
Consolidated
structured entity 57.6 55.5 57.6 55.5
LCL ACT.IMMOBI.3D Full France
Consolidated
structured entity 52.0 49.3 52.0 49.3
LCL ACT.OR MONDE Full France
Consolidated
structured entity 49.5 46.8 49.5 46.8
LCL ACT.USA ISR 3D Full France
Consolidated
structured entity 87.0 85.6 87.0 85.6
LCL ACTIONS EURO C Full France
Consolidated
structured entity 64.0 64.3 64.0 64.3
LCL ACTIONS EURO FUT Full France
Consolidated
structured entity 77.5 73.9 77.5 73.9
LCL ACTIONS MONDE FCP 3
DEC Full France
Consolidated
structured entity 43.3 51.6 43.3 51.6
LCL ALLOCATION DYNAMIQUE
3D FCP Full France
Consolidated
structured entity 95.4 95.4 95.4 95.4
LCL AUTOCALL VIE 17 Full France
Consolidated
structured entity 94.2 96.6 94.2 96.6
LCL BP ECHUS A Full E2 France
Consolidated
structured entity 100.0 100.0
LCL DEVELOPPEM.PME C Full France
Consolidated
structured entity 67.9 68.5 67.9 68.5
LCL DOUBLE HORIZON A Full France
Consolidated
structured entity 100.0 100.0 100.0 100.0
LCL FLEX 30 Full France
Consolidated
structured entity 49.4 45.7 49.4 45.7
LCL FO.SE.FR.AV(AV11) FCP
3DEC Full S1 France
Consolidated
structured entity 100.0 100.0
LCL INVEST.EQ C Full France
Consolidated
structured entity 93.4 92.9 93.4 92.9
LCL INVEST.PRUD.3D Full France
Consolidated
structured entity 92.7 92.1 92.7 92.1
LCL L.GR.B.AV 17 C Full France
Consolidated
structured entity 100.0 100.0 100.0 100.0
LCL MGEST 60 3DEC Full France
Consolidated
structured entity 88.1 87.9 88.1 87.9
LCL MGEST FL.0-100 Full France
Consolidated
structured entity 92.5 92.0 92.5 92.0
LCL OBL.CREDIT EURO Full France
Consolidated
structured entity 82.1 81.4 82.1 81.4
LCL OPTIM II VIE 17 Full France
Consolidated
structured entity 95.8 97.4 95.8 97.4
LCL PREMIUM VIE 2015 Full S1 France
Consolidated
structured entity 98.4 98.4
LCL TRI ESC AV 0118 Full France
Consolidated
structured entity 100.0 100.0 100.0 100.0
LCL TRIPLE TE AV OC Full France
Consolidated
structured entity 100.0 100.0 100.0 100.0
LCL TRIPLE TEMPO AV (FEV.2015) Full France
Consolidated
structured entity 100.0 100.0 100.0 100.0
LCL TRP HOZ AV 0117 Full France
Consolidated
structured entity 100.0 100.0 100.0 100.0
LOUVOIS PLACEMENT Full E2 France
Consolidated
structured entity 40.1 40.1
M.D.F.89 FCP Full France
Consolidated
structured entity 100.0 100.0 100.0 100.0
OBJECTIF DYNAMISME FCP Full France
Consolidated
structured entity 98.3 98.5 98.3 98.5
OBJECTIF MEDIAN FCP Full France
Consolidated
structured entity 100.0 100.0 100.0 100.0
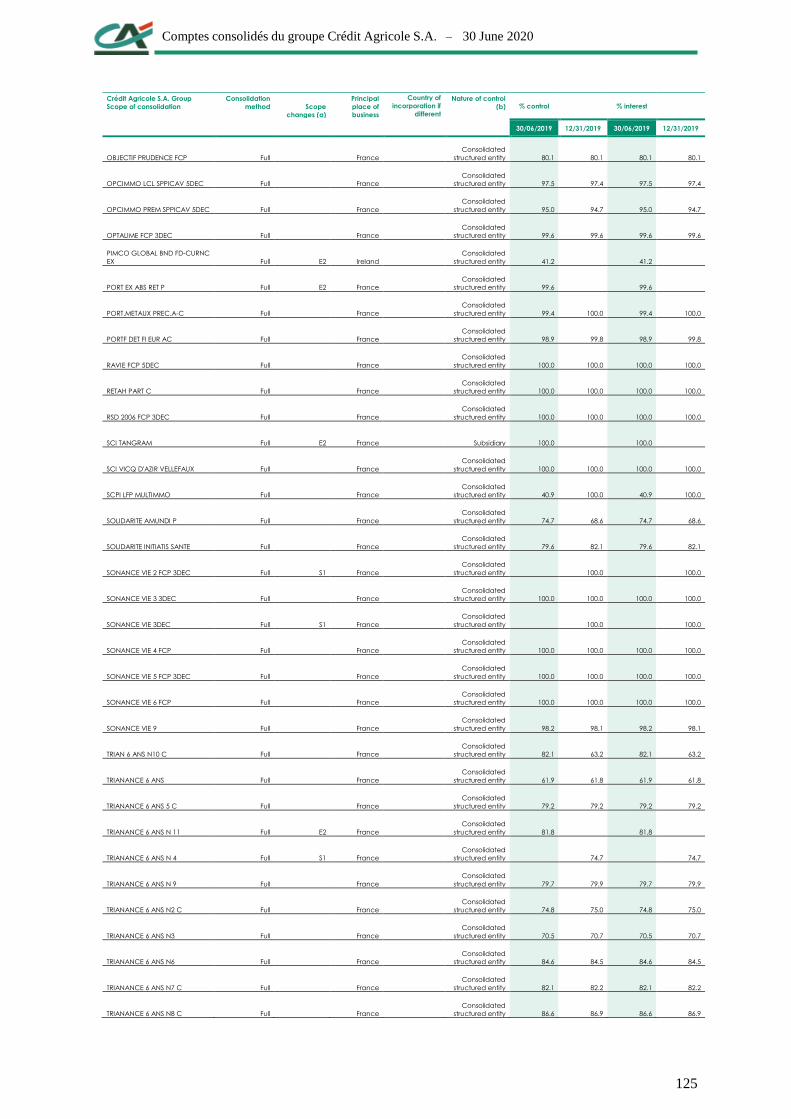
Comptes consolidés du groupe Crédit Agricole S.A. – 30 June 2020
125
Crédit Agricole S.A. Group
Scope of consolidation
Consolidation
method
Scope
changes (a)
Principal
place of
business
Country of
incorporation if
different
from the
principal place
of business
Nature of control
(b)
% control % interest
30/06/2019 12/31/2019 30/06/2019 12/31/2019
OBJECTIF PRUDENCE FCP Full France
Consolidated
structured entity 80.1 80.1 80.1 80.1
OPCIMMO LCL SPPICAV 5DEC Full France
Consolidated
structured entity 97.5 97.4 97.5 97.4
OPCIMMO PREM SPPICAV 5DEC Full France
Consolidated
structured entity 95.0 94.7 95.0 94.7
OPTALIME FCP 3DEC Full France
Consolidated
structured entity 99.6 99.6 99.6 99.6
PIMCO GLOBAL BND FD-CURNC
EX Full E2 Ireland
Consolidated
structured entity 41.2 41.2
PORT EX ABS RET P Full E2 France
Consolidated
structured entity 99.6 99.6
PORT.METAUX PREC.A-C Full France
Consolidated
structured entity 99.4 100.0 99.4 100.0
PORTF DET FI EUR AC Full France
Consolidated
structured entity 98.9 99.8 98.9 99.8
RAVIE FCP 5DEC Full France
Consolidated
structured entity 100.0 100.0 100.0 100.0
RETAH PART C Full France
Consolidated
structured entity 100.0 100.0 100.0 100.0
RSD 2006 FCP 3DEC Full France
Consolidated
structured entity 100.0 100.0 100.0 100.0
SCI TANGRAM Full E2 France Subsidiary 100.0 100.0
SCI VICQ D'AZIR VELLEFAUX Full France
Consolidated
structured entity 100.0 100.0 100.0 100.0
SCPI LFP MULTIMMO Full France
Consolidated
structured entity 40.9 100.0 40.9 100.0
SOLIDARITE AMUNDI P Full France
Consolidated
structured entity 74.7 68.6 74.7 68.6
SOLIDARITE INITIATIS SANTE Full France
Consolidated
structured entity 79.6 82.1 79.6 82.1
SONANCE VIE 2 FCP 3DEC Full S1 France
Consolidated
structured entity 100.0 100.0
SONANCE VIE 3 3DEC Full France
Consolidated
structured entity 100.0 100.0 100.0 100.0
SONANCE VIE 3DEC Full S1 France
Consolidated
structured entity 100.0 100.0
SONANCE VIE 4 FCP Full France
Consolidated
structured entity 100.0 100.0 100.0 100.0
SONANCE VIE 5 FCP 3DEC Full France
Consolidated
structured entity 100.0 100.0 100.0 100.0
SONANCE VIE 6 FCP Full France
Consolidated
structured entity 100.0 100.0 100.0 100.0
SONANCE VIE 9 Full France
Consolidated
structured entity 98.2 98.1 98.2 98.1
TRIAN 6 ANS N10 C Full France
Consolidated
structured entity 82.1 63.2 82.1 63.2
TRIANANCE 6 ANS Full France
Consolidated
structured entity 61.9 61.8 61.9 61.8
TRIANANCE 6 ANS 5 C Full France
Consolidated
structured entity 79.2 79.2 79.2 79.2
TRIANANCE 6 ANS N 11 Full E2 France
Consolidated
structured entity 81.8 81.8
TRIANANCE 6 ANS N 4 Full S1 France
Consolidated
structured entity 74.7 74.7
TRIANANCE 6 ANS N 9 Full France
Consolidated
structured entity 79.7 79.9 79.7 79.9
TRIANANCE 6 ANS N2 C Full France
Consolidated
structured entity 74.8 75.0 74.8 75.0
TRIANANCE 6 ANS N3 Full France
Consolidated
structured entity 70.5 70.7 70.5 70.7
TRIANANCE 6 ANS N6 Full France
Consolidated
structured entity 84.6 84.5 84.6 84.5
TRIANANCE 6 ANS N7 C Full France
Consolidated
structured entity 82.1 82.2 82.1 82.2
TRIANANCE 6 ANS N8 C Full France
Consolidated
structured entity 86.6 86.9 86.6 86.9

Comptes consolidés du groupe Crédit Agricole S.A. – 30 June 2020
126
Crédit Agricole S.A. Group
Scope of consolidation
Consolidation
method
Scope
changes (a)
Principal
place of
business
Country of
incorporation if
different
from the
principal place
of business
Nature of control
(b)
% control % interest
30/06/2019 12/31/2019 30/06/2019 12/31/2019
UNIPIERRE ASSURANCE ( SCPI ) Full France
Consolidated
structured entity 100.0 100.0 100.0 100.0
VENDOME INV.FCP 3DEC Full France
Consolidated
structured entity 92.0 91.2 92.0 91.2
Real estate collective investment fund (OPCI)
Nexus 1 Full Italy
Consolidated
structured entity 78.5 98.5 78.5 98.5
OPCI Camp Invest Full France
Consolidated
structured entity 100.0 80.1 100.0 80.1
OPCI ECO CAMPUS SPPICAV Full France
Consolidated
structured entity 100.0 100.0 100.0 100.0
OPCI Immanens Full France
Consolidated
structured entity 100.0 100.0 68.4 68.4
OPCI Immo Emissions Full France
Consolidated
structured entity 100.0 100.0 68.4 68.4
OPCI Iris Invest 2010 Full France
Consolidated
structured entity 100.0 80.1 100.0 80.1
OPCI MASSY BUREAUX Full France
Consolidated
structured entity 100.0 100.0 100.0 100.0
OPCI Messidor Full France
Consolidated
structured entity 100.0 100.0 100.0 100.0
Predica OPCI Bureau Full France
Consolidated
structured entity 100.0 100.0 100.0 100.0
Predica OPCI Commerces Full France
Consolidated
structured entity 100.0 100.0 100.0 100.0
Predica OPCI Habitation Full France
Consolidated
structured entity 100.0 100.0 100.0 100.0
Non-trading real estate investment company (SCI)
B IMMOBILIER Full France Subsidiary 100.0 100.0 100.0 100.0
DS Campus Full France
Consolidated
structured entity 100.0 100.0 100.0 100.0
FREY RETAIL VILLEBON
Equity
Accounted France Joint venture 47.5 47.5 47.5 47.5
HDP BUREAUX Full France Subsidiary 95.0 95.0 95.0 95.0
HDP HOTEL Full France Subsidiary 95.0 95.0 95.0 95.0
HDP LA HALLE BOCA Full France Subsidiary 95.0 95.0 95.0 95.0
IMEFA 177 Full France
Consolidated
structured entity 100.0 100.0 100.0 100.0
IMEFA 178 Full France
Consolidated
structured entity 100.0 100.0 100.0 100.0
IMEFA 179 Full France
Consolidated
structured entity 100.0 100.0 100.0 100.0
Issy Pont Full France
Consolidated
structured entity 75.0 75.0 75.0 75.0
RUE DU BAC (SCI)
Equity
Accounted France Joint venture 50.0 50.0 50.0 50.0
SCI 1 TERRASSE BELLINI
Equity
Accounted France Associate 33.3 33.3 33.3 33.3
SCI BMEDIC HABITATION Full France Subsidiary 100.0 100.0 100.0 100.0
SCI CAMPUS MEDICIS ST DENIS Full France Subsidiary 70.0 70.0 70.0 70.0
SCI CAMPUS RIMBAUD ST DENIS Full France Subsidiary 70.0 70.0 70.0 70.0
SCI CARPE DIEM
Equity
Accounted France Joint venture 50.0 50.0 50.0 50.0
SCI EUROMARSEILLE 1
Equity
Accounted France Joint venture 50.0 50.0 50.0 50.0
SCI EUROMARSEILLE 2
Equity
Accounted France Joint venture 50.0 50.0 50.0 50.0
SCI FEDERALE PEREIRE VICTOIRE Full France Subsidiary 99.0 99.0 99.0 99.0

Comptes consolidés du groupe Crédit Agricole S.A. – 30 June 2020
127
Crédit Agricole S.A. Group
Scope of consolidation
Consolidation
method
Scope
changes (a)
Principal
place of
business
Country of
incorporation if
different
from the
principal place
of business
Nature of control
(b)
% control % interest
30/06/2019 12/31/2019 30/06/2019 12/31/2019
SCI FEDERALE VILLIERS Full France Subsidiary 100.0 100.0 100.0 100.0
SCI FEDERLOG Full France Subsidiary 99.9 99.9 99.9 99.9
SCI FEDERLONDRES Full France Subsidiary 100.0 100.0 100.0 100.0
SCI FEDERPIERRE Full France Subsidiary 100.0 100.0 100.0 100.0
SCI FONDIS
Equity
Accounted France Associate 25.0 25.0 25.0 25.0
SCI GRENIER VELLEF Full France
Consolidated
structured entity 100.0 100.0 100.0 100.0
SCI HEART OF LA DEFENSE
Equity
Accounted France Associate 33.3 33.3 33.3 33.3
SCI Holding Dahlia Full France
Consolidated
structured entity 100.0 100.0 100.0 100.0
SCI ILOT 13
Equity
Accounted France Joint venture 50.0 50.0 50.0 50.0
SCI IMEFA 001 Full France Subsidiary 100.0 100.0 100.0 100.0
SCI IMEFA 002 Full France Subsidiary 100.0 100.0 100.0 100.0
SCI IMEFA 003 Full France Subsidiary 100.0 100.0 100.0 100.0
SCI IMEFA 004 Full France Subsidiary 100.0 100.0 100.0 100.0
SCI IMEFA 005 Full France Subsidiary 100.0 100.0 100.0 100.0
SCI IMEFA 006 Full France Subsidiary 100.0 100.0 100.0 100.0
SCI IMEFA 008 Full France Subsidiary 100.0 100.0 100.0 100.0
SCI IMEFA 009 Full France Subsidiary 100.0 100.0 100.0 100.0
SCI IMEFA 010 Full France Subsidiary 100.0 100.0 100.0 100.0
SCI IMEFA 011 Full France Subsidiary 100.0 100.0 100.0 100.0
SCI IMEFA 012 Full France Subsidiary 100.0 100.0 100.0 100.0
SCI IMEFA 013 Full France Subsidiary 100.0 100.0 100.0 100.0
SCI IMEFA 016 Full France Subsidiary 100.0 100.0 100.0 100.0
SCI IMEFA 017 Full France Subsidiary 100.0 100.0 100.0 100.0
SCI IMEFA 018 Full France Subsidiary 100.0 100.0 100.0 100.0
SCI IMEFA 020 Full France Subsidiary 100.0 100.0 100.0 100.0
SCI IMEFA 022 Full France Subsidiary 100.0 100.0 100.0 100.0
SCI IMEFA 025 Full France
Consolidated
structured entity 100.0 100.0 100.0 100.0
SCI IMEFA 032 Full France Subsidiary 100.0 100.0 100.0 100.0
SCI IMEFA 033 Full France Subsidiary 100.0 100.0 100.0 100.0
SCI IMEFA 034 Full France Subsidiary 100.0 100.0 100.0 100.0
SCI IMEFA 035 Full France Subsidiary 100.0 100.0 100.0 100.0
SCI IMEFA 036 Full France Subsidiary 100.0 100.0 100.0 100.0
SCI IMEFA 037 Full France Subsidiary 100.0 100.0 100.0 100.0
SCI IMEFA 038 Full France Subsidiary 100.0 100.0 100.0 100.0
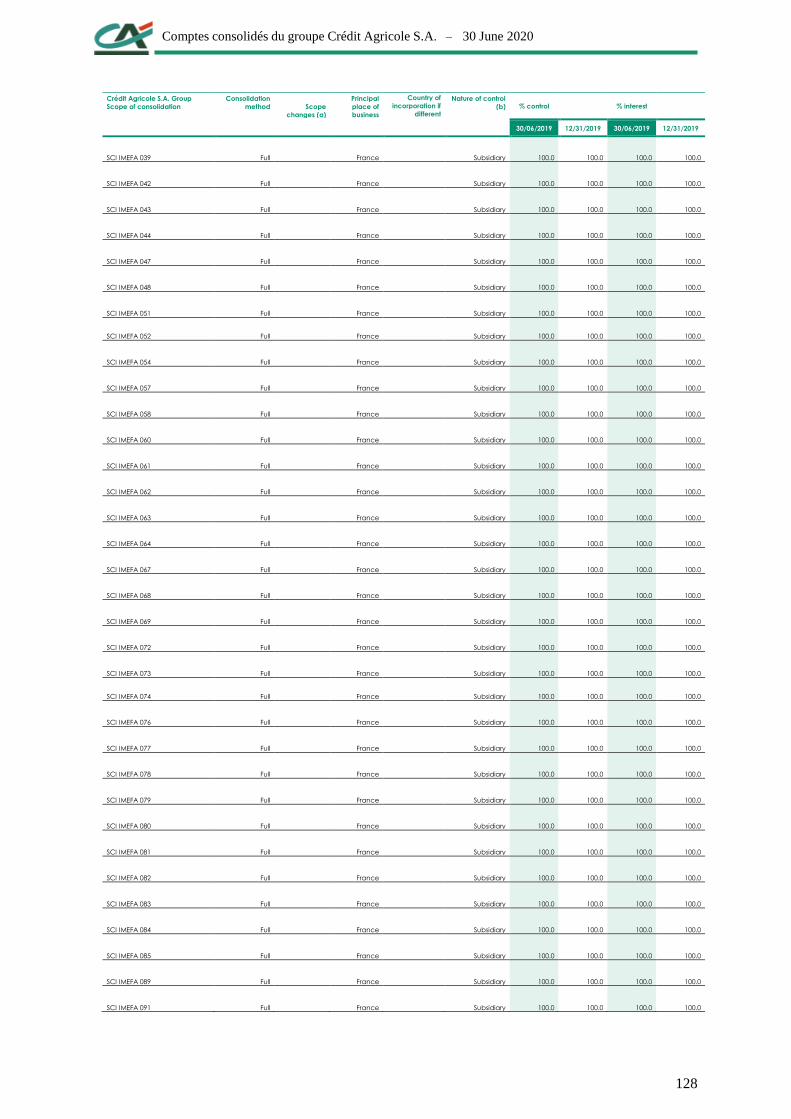
Comptes consolidés du groupe Crédit Agricole S.A. – 30 June 2020
128
Crédit Agricole S.A. Group
Scope of consolidation
Consolidation
method
Scope
changes (a)
Principal
place of
business
Country of
incorporation if
different
from the
principal place
of business
Nature of control
(b)
% control % interest
30/06/2019 12/31/2019 30/06/2019 12/31/2019
SCI IMEFA 039 Full France Subsidiary 100.0 100.0 100.0 100.0
SCI IMEFA 042 Full France Subsidiary 100.0 100.0 100.0 100.0
SCI IMEFA 043 Full France Subsidiary 100.0 100.0 100.0 100.0
SCI IMEFA 044 Full France Subsidiary 100.0 100.0 100.0 100.0
SCI IMEFA 047 Full France Subsidiary 100.0 100.0 100.0 100.0
SCI IMEFA 048 Full France Subsidiary 100.0 100.0 100.0 100.0
SCI IMEFA 051 Full France Subsidiary 100.0 100.0 100.0 100.0
SCI IMEFA 052 Full France Subsidiary 100.0 100.0 100.0 100.0
SCI IMEFA 054 Full France Subsidiary 100.0 100.0 100.0 100.0
SCI IMEFA 057 Full France Subsidiary 100.0 100.0 100.0 100.0
SCI IMEFA 058 Full France Subsidiary 100.0 100.0 100.0 100.0
SCI IMEFA 060 Full France Subsidiary 100.0 100.0 100.0 100.0
SCI IMEFA 061 Full France Subsidiary 100.0 100.0 100.0 100.0
SCI IMEFA 062 Full France Subsidiary 100.0 100.0 100.0 100.0
SCI IMEFA 063 Full France Subsidiary 100.0 100.0 100.0 100.0
SCI IMEFA 064 Full France Subsidiary 100.0 100.0 100.0 100.0
SCI IMEFA 067 Full France Subsidiary 100.0 100.0 100.0 100.0
SCI IMEFA 068 Full France Subsidiary 100.0 100.0 100.0 100.0
SCI IMEFA 069 Full France Subsidiary 100.0 100.0 100.0 100.0
SCI IMEFA 072 Full France Subsidiary 100.0 100.0 100.0 100.0
SCI IMEFA 073 Full France Subsidiary 100.0 100.0 100.0 100.0
SCI IMEFA 074 Full France Subsidiary 100.0 100.0 100.0 100.0
SCI IMEFA 076 Full France Subsidiary 100.0 100.0 100.0 100.0
SCI IMEFA 077 Full France Subsidiary 100.0 100.0 100.0 100.0
SCI IMEFA 078 Full France Subsidiary 100.0 100.0 100.0 100.0
SCI IMEFA 079 Full France Subsidiary 100.0 100.0 100.0 100.0
SCI IMEFA 080 Full France Subsidiary 100.0 100.0 100.0 100.0
SCI IMEFA 081 Full France Subsidiary 100.0 100.0 100.0 100.0
SCI IMEFA 082 Full France Subsidiary 100.0 100.0 100.0 100.0
SCI IMEFA 083 Full France Subsidiary 100.0 100.0 100.0 100.0
SCI IMEFA 084 Full France Subsidiary 100.0 100.0 100.0 100.0
SCI IMEFA 085 Full France Subsidiary 100.0 100.0 100.0 100.0
SCI IMEFA 089 Full France Subsidiary 100.0 100.0 100.0 100.0
SCI IMEFA 091 Full France Subsidiary 100.0 100.0 100.0 100.0

Comptes consolidés du groupe Crédit Agricole S.A. – 30 June 2020
129
Crédit Agricole S.A. Group
Scope of consolidation
Consolidation
method
Scope
changes (a)
Principal
place of
business
Country of
incorporation if
different
from the
principal place
of business
Nature of control
(b)
% control % interest
30/06/2019 12/31/2019 30/06/2019 12/31/2019
SCI IMEFA 092 Full France Subsidiary 100.0 100.0 100.0 100.0
SCI IMEFA 096 Full France Subsidiary 100.0 100.0 100.0 100.0
SCI IMEFA 100 Full France Subsidiary 100.0 100.0 100.0 100.0
SCI IMEFA 101 Full France Subsidiary 100.0 100.0 100.0 100.0
SCI IMEFA 102 Full France Subsidiary 100.0 100.0 100.0 100.0
SCI IMEFA 103 Full France Subsidiary 100.0 100.0 100.0 100.0
SCI IMEFA 104 Full France Subsidiary 100.0 100.0 100.0 100.0
SCI IMEFA 105 Full France Subsidiary 100.0 100.0 100.0 100.0
SCI IMEFA 107 Full France Subsidiary 100.0 100.0 100.0 100.0
SCI IMEFA 108 Full France Subsidiary 100.0 100.0 100.0 100.0
SCI IMEFA 109 Full France Subsidiary 100.0 100.0 100.0 100.0
SCI IMEFA 110 Full France Subsidiary 100.0 100.0 100.0 100.0
SCI IMEFA 112 Full France Subsidiary 100.0 100.0 100.0 100.0
SCI IMEFA 113 Full France Subsidiary 100.0 100.0 100.0 100.0
SCI IMEFA 115 Full France Subsidiary 100.0 100.0 100.0 100.0
SCI IMEFA 116 Full France Subsidiary 100.0 100.0 100.0 100.0
SCI IMEFA 117 Full France Subsidiary 100.0 100.0 100.0 100.0
SCI IMEFA 118 Full France Subsidiary 100.0 100.0 100.0 100.0
SCI IMEFA 120 Full France Subsidiary 100.0 100.0 100.0 100.0
SCI IMEFA 121 Full France Subsidiary 100.0 100.0 100.0 100.0
SCI IMEFA 122 Full France Subsidiary 100.0 100.0 100.0 100.0
SCI IMEFA 123 Full France Subsidiary 100.0 100.0 100.0 100.0
SCI IMEFA 126 Full France Subsidiary 100.0 100.0 100.0 100.0
SCI IMEFA 128 Full France Subsidiary 100.0 100.0 100.0 100.0
SCI IMEFA 129 Full France Subsidiary 100.0 100.0 100.0 100.0
SCI IMEFA 131 Full France Subsidiary 100.0 100.0 100.0 100.0
SCI IMEFA 132 Full France Subsidiary 100.0 100.0 100.0 100.0
SCI IMEFA 140 Full France
Consolidated
structured entity 100.0 100.0 100.0 100.0
SCI IMEFA 148 Full France Subsidiary 100.0 100.0 100.0 100.0
SCI IMEFA 149 Full France Subsidiary 100.0 100.0 100.0 100.0
SCI IMEFA 150 Full France Subsidiary 100.0 100.0 100.0 100.0
SCI IMEFA 155 Full France Subsidiary 100.0 100.0 100.0 100.0
SCI IMEFA 156 Full France Subsidiary 90.0 90.0 90.0 90.0
SCI IMEFA 157 Full France Subsidiary 90.0 90.0 90.0 90.0

Comptes consolidés du groupe Crédit Agricole S.A. – 30 June 2020
130
Crédit Agricole S.A. Group
Scope of consolidation
Consolidation
method
Scope
changes (a)
Principal
place of
business
Country of
incorporation if
different
from the
principal place
of business
Nature of control
(b)
% control % interest
30/06/2019 12/31/2019 30/06/2019 12/31/2019
SCI IMEFA 158 Full France Subsidiary 100.0 100.0 100.0 100.0
SCI IMEFA 159 Full France Subsidiary 100.0 100.0 100.0 100.0
SCI IMEFA 164 Full France Subsidiary 100.0 100.0 100.0 100.0
SCI IMEFA 169 Full France Subsidiary 100.0 100.0 100.0 100.0
SCI IMEFA 170 Full France Subsidiary 100.0 100.0 100.0 100.0
SCI IMEFA 171 Full France
Consolidated
structured entity 100.0 100.0 100.0 100.0
SCI IMEFA 172 Full France
Consolidated
structured entity 100.0 100.0 100.0 100.0
SCI IMEFA 173 Full France Subsidiary 100.0 100.0 100.0 100.0
SCI IMEFA 174 Full France Subsidiary 100.0 100.0 100.0 100.0
SCI IMEFA 175 Full France Subsidiary 100.0 100.0 100.0 100.0
SCI IMEFA 176 Full France Subsidiary 100.0 100.0 100.0 100.0
SCI LE VILLAGE VICTOR HUGO Full France Subsidiary 100.0 100.0 100.0 100.0
SCI MEDI BUREAUX Full France Subsidiary 100.0 100.0 100.0 100.0
SCI PACIFICA HUGO Full France Subsidiary 100.0 100.0 100.0 100.0
SCI PORTE DES LILAS - FRERES
FLAVIEN Full France Subsidiary 100.0 100.0 100.0 100.0
SCI VALHUBERT Full France Subsidiary 100.0 100.0 100.0 100.0
SCI VAUGIRARD 36-44 Full France Subsidiary 100.0 100.0 100.0 100.0
SCI WAGRAM 22/30
Equity
Accounted France Joint venture 50.0 50.0 50.0 50.0
SCI WASHINGTON
Equity
Accounted France Associate 34.0 34.0 34.0 34.0
TOUR MERLE (SCI)
Equity
Accounted France Joint venture 50.0 50.0 50.0 50.0
SCI ACADEMIE MONTROUGE
Equity
Accounted E2 France Joint venture 50.0 50.0
Other
ALTA VAI HOLDCO P Full France Subsidiary 100.0 100.0 100.0 100.0
ALTAREA
Equity
Accounted France Associate 24.7 24.7 24.7 24.7
AMUNDI IT Services Full France Subsidiary 99.6 99.6 69.4 69.4
ARCAPARK SAS
Equity
Accounted France Joint venture 50.0 50.0 50.0 50.0
Azqore Full Switzerland Subsidiary 80.0 80.0 78.2 78.2
Azqore SA Singapore Branch Full Singapour Switzerland Branch 80.0 80.0 80.0 78.2
CA Indosuez Wealth (Asset
Management) Full Luxembourg Subsidiary 100.0 100.0 97.8 97.8
Crédit Agricole Assurances
Solutions Full France Subsidiary 100.0 100.0 100.0 100.0
EUROPEAN MOTORWAY
INVESTMENTS 1 Full Luxembourg Subsidiary 60.0 60.0 60.0 60.0
FIXED INCOME DERIVATIVES -
STRUCTURED FUND PLC Full E1 Ireland
Consolidated
structured entity 100.0 97.8
FONCIERE HYPERSUD
Equity
Accounted France Joint venture 51.4 51.4 51.4 51.4
FREY
Equity
Accounted France Associate 19.3 19.3 19.3 19.3

Comptes consolidés du groupe Crédit Agricole S.A. – 30 June 2020
131
Crédit Agricole S.A. Group
Scope of consolidation
Consolidation
method
Scope
changes (a)
Principal
place of
business
Country of
incorporation if
different
from the
principal place
of business
Nature of control
(b)
% control % interest
30/06/2019 12/31/2019 30/06/2019 12/31/2019
HOLDING EUROMARSEILLE Full France Subsidiary 100.0 100.0 100.0 100.0
Icade
Equity
Accounted France Associate 19.0 19.0 19.0 19.0
INFRA FOCH TOPCO
Equity
Accounted France Associate 35.7 36.9 35.7 36.9
IRIS HOLDING FRANCE Full France Subsidiary 80.1 80.1 80.1 80.1
KORIAN
Equity
Accounted France Associate 24.4 24.4 24.4 24.4
PATRIMOINE ET COMMERCE
Equity
Accounted France Associate 20.5 20.3 20.5 20.3
PREDICA ENERGIES DURABLES Full France Subsidiary 89.2 99.9 89.2 99.9
PREDICA INFRASTRUCTURE SA Full Luxembourg Subsidiary 100.0 100.0 100.0 100.0
PREDIPARK Full France Subsidiary 100.0 100.0 100.0 100.0
RAMSAY – GENERALE DE SANTE
Equity
Accounted France Associate 39.6 39.6 39.6 39.6
SA RESICO Full France Subsidiary 100.0 100.0 100.0 100.0
SAS CRISTAL
Equity
Accounted France Associate 46.0 46.0 46.0 46.0
SAS PARHOLDING
Equity
Accounted France Associate 50.0 50.0 50.0 50.0
SAS PREDI-RUNGIS Full France Subsidiary 85.0 85.0 85.0 85.0
SH PREDICA ENERGIES
DURABLES SAS Full France Subsidiary 99.9 99.9 99.9 99.9
VAUGIRARD AUTOVIA SLU Full Spain Subsidiary 100.0 100.0 100.0 100.0
Vaugirard Infra S.L. Full Spain Subsidiary 100.0 100.0 100.0 100.0
Via Vita Full France Subsidiary 100.0 100.0 100.0 100.0
PREDIWATT Full E2 France
Consolidated
structured entity 100.0 100.0
FRENCH RETAIL BANKING
Banking and financial institutions
FIMO Courtage Full France Subsidiary 100.0 100.0 94.6 94.6
Interfimo Full France Subsidiary 99.0 99.0 94.6 94.6
LCL Full France Subsidiary 95.6 95.6 95.6 95.6
LCL succursale de Monaco Full Monaco France Branch 95.6 95.6 95.6 95.6
Lease financing companies
Investment companies
Tourism - property development
Angle Neuf Full France Subsidiary 100.0 100.0 95.6 95.6
Other
C.L. Verwaltungs und
Beteiligungsgesellschaft GmbH Full S3 Germany Subsidiary 100.0 95.6
Crédit Lyonnais
Développement Économique
(CLDE) Full France Subsidiary 100.0 100.0 95.6 95.6
FCT True Sale (Compartiment
LCL) Full France
Consolidated
structured entity 100.0 100.0 95.6 95.6
INTERNATIONAL RETAIL BANKING

Comptes consolidés du groupe Crédit Agricole S.A. – 30 June 2020
132
Crédit Agricole S.A. Group
Scope of consolidation
Consolidation
method
Scope
changes (a)
Principal
place of
business
Country of
incorporation if
different
from the
principal place
of business
Nature of control
(b)
% control % interest
30/06/2019 12/31/2019 30/06/2019 12/31/2019
Banking and financial institutions
Arc Broker Full Poland Subsidiary 100.0 100.0 100.0 100.0
CREDIT AGRICOLE BANK Full Ukraine Subsidiary 100.0 100.0 100.0 100.0
Crédit Agricole Bank Polska S.A. Full Poland Subsidiary 100.0 100.0 100.0 100.0
Crédit Agricole Banka Srbija
a.d. Novi Sad Full Serbia Subsidiary 100.0 100.0 100.0 100.0
Crédit Agricole Egypt S.A.E. Full Egypt Subsidiary 60.5 60.5 60.2 60.2
Crédit Agricole Friuladria S.p.A. Full Italy Subsidiary 82.0 81.8 62.0 61.9
Crédit Agricole Group Solutions Full Italy
Consolidated
structured entity 100.0 100.0 74.4 74.4
Crédit Agricole Italia Full Italy Subsidiary 75.6 75.6 75.6 75.6
Crédit Agricole Leasing Italia Full Italy Subsidiary 100.0 100.0 79.3 79.3
Crédit Agricole Polska S.A. Full Poland Subsidiary 100.0 100.0 100.0 100.0
Credit Agricole Romania Full Romania Subsidiary 100.0 100.0 100.0 100.0
Credit Agricole Service sp z o.o. Full Poland Subsidiary 100.0 100.0 100.0 100.0
Crédit du Maroc Full Morocco Subsidiary 78.7 78.7 78.7 78.7
SIFIM Full Morocco Subsidiary 100.0 100.0 78.7 78.7
Other
IUB Holding Full France Subsidiary 100.0 100.0 100.0 100.0
SPECIALISED FINANCIAL SERVICES
Banking and financial institutions
Agos Full Italy Subsidiary 61.0 61.0 61.0 61.0
Alsolia Full France Subsidiary 100.0 100.0 100.0 100.0
CACF BANKIA sa
Equity
Accounted Spain Joint venture 51.0 51.0 51.0 51.0
Crealfi Full France Subsidiary 51.0 51.0 51.0 51.0
Credibom Full Portugal Subsidiary 100.0 100.0 100.0 100.0
Crediet Maatschappij " De Ijssel"
B.V. Full Netherlands Subsidiary 100.0 100.0 100.0 100.0
Crédit Agricole Consumer
Finance Full France Subsidiary 100.0 100.0 100.0 100.0
Crédit Agricole Consumer
Finance Nederland Full Netherlands Subsidiary 100.0 100.0 100.0 100.0
Crédit LIFT Full France Subsidiary 100.0 100.0 100.0 100.0
Creditplus Bank AG Full Germany Subsidiary 100.0 100.0 100.0 100.0
De Kredietdesk B.V. Full Netherlands Subsidiary 100.0 100.0 100.0 100.0
DE NEDERLANDSE
VOORSCHOTBANK BV Full Netherlands Subsidiary 100.0 100.0 100.0 100.0
EFL Services Full Poland Subsidiary 100.0 100.0 100.0 100.0
EUROFACTOR GmbH Full Germany Subsidiary 100.0 100.0 100.0 100.0
Eurofactor Italia S.p.A. Full Italy Subsidiary 100.0 100.0 100.0 100.0

Comptes consolidés du groupe Crédit Agricole S.A. – 30 June 2020
133
Crédit Agricole S.A. Group
Scope of consolidation
Consolidation
method
Scope
changes (a)
Principal
place of
business
Country of
incorporation if
different
from the
principal place
of business
Nature of control
(b)
% control % interest
30/06/2019 12/31/2019 30/06/2019 12/31/2019
EUROFACTOR NEDERLAND Full Netherlands Germany Branch 100.0 100.0 100.0 100.0
EUROFACTOR POLSKA S.A. Full Poland Subsidiary 100.0 100.0 100.0 100.0
Eurofactor SA - NV (Benelux) Full Belgium Branch 100.0 100.0 100.0 100.0
Eurofactor S.A. (Portugal) Full Portugal Subsidiary 100.0 100.0 100.0 100.0
Eurofintus Financieringen B.V. Full Netherlands Subsidiary 100.0 100.0 100.0 100.0
FCA Automotive Services UK Ltd
Equity
Accounted
United
Kingdom Joint venture 50.0 50.0 50.0 50.0
FCA Bank
Equity
Accounted Italy Joint venture 50.0 50.0 50.0 50.0
FCA Bank Gmbh, Hellenic
Branch
Equity
Accounted Greece Joint venture 50.0 50.0 50.0 50.0
FCA BANK SPA, IRISH BRANCH
Equity
Accounted Ireland Joint venture 50.0 50.0 50.0 50.0
FCA Bank Germany GmbH
Equity
Accounted Germany Joint venture 50.0 50.0 50.0 50.0
FCA Bank GmbH
Equity
Accounted Austria Joint venture 50.0 50.0 50.0 50.0
FCA BANK S.P.A, BELGIAN
BRANCH
Equity
Accounted D1 Belgium Joint venture 50.0 50.0 50.0 50.0
FCA Capital Danmark A/S
Equity
Accounted Denmark Joint venture 50.0 50.0 50.0 50.0
FCA Capital España EFC S.A.
Equity
Accounted Spain Joint venture 50.0 50.0 50.0 50.0
FCA CAPITAL France SA
Equity
Accounted D1 France Joint venture 50.0 50.0 50.0 50.0
FCA Capital Hellas S.A.
Equity
Accounted Greece Joint venture 50.0 50.0 50.0 50.0
FCA Capital IFIC
Equity
Accounted Portugal Joint venture 50.0 50.0 50.0 50.0
FCA Capital Nederland B.V.
Equity
Accounted Netherlands Joint venture 50.0 50.0 50.0 50.0
FCA Capital Norge AS
Equity
Accounted Norway Joint venture 50.0 50.0 50.0 50.0
FCA Capital Re Limited
Equity
Accounted Ireland Joint venture 50.0 50.0 50.0 50.0
FCA Capital Suisse S.A.
Equity
Accounted Switzerland Joint venture 50.0 50.0 50.0 50.0
FCA Capital Sverige
Equity
Accounted Sweden Joint venture 50.0 50.0 50.0 50.0
FCA DEALER SERVICES ESPANA
SA, Morocco Branch
Equity
Accounted Morocco Spain Joint venture 50.0 50.0 50.0 50.0
FCA Dealer services España,
S.A.
Equity
Accounted Spain Joint venture 50.0 50.0 50.0 50.0
FCA Dealer Services Portugal
S.A.
Equity
Accounted Portugal Joint venture 50.0 50.0 50.0 50.0
FCA Dealer Services UK Ltd
Equity
Accounted
United
Kingdom Joint venture 50.0 50.0 50.0 50.0
FCA BANK SPA ODDZIAL W
POLSCE
Equity
Accounted D1 Poland Joint venture 50.0 50.0 50.0 50.0
FCA Insurance Hellas S.A.
Equity
Accounted Greece Joint venture 50.0 50.0 50.0 50.0
FCA Leasing France
Equity
Accounted France Joint venture 50.0 50.0 50.0 50.0
LEASYS POLSKA
Equity
Accounted D1 Poland Joint venture 50.0 50.0 50.0 50.0
FCA Leasing GmbH
Equity
Accounted Austria Joint venture 50.0 50.0 50.0 50.0
FERRARI FINANCIAL SERVICES
GMBH
Equity
Accounted Germany Joint venture 50.0 50.0 25.0 25.0
FERRARI FINANCIAL SERVICES
GMBH, UK Branch
Equity
Accounted
United
Kingdom Joint venture 50.0 50.0 50.0 50.0
FGA Capital Danmark A/S,
Finland Branch
Equity
Accounted Finland Joint venture 50.0 50.0 50.0 50.0

Comptes consolidés du groupe Crédit Agricole S.A. – 30 June 2020
134
Crédit Agricole S.A. Group
Scope of consolidation
Consolidation
method
Scope
changes (a)
Principal
place of
business
Country of
incorporation if
different
from the
principal place
of business
Nature of control
(b)
% control % interest
30/06/2019 12/31/2019 30/06/2019 12/31/2019
Financierings Data Netwerk B.V.
Equity
Accounted Netherlands Joint venture 50.0 50.0 50.0 50.0
Finaref Assurances S.A.S. Full France Subsidiary 100.0 100.0 100.0 100.0
Finata Zuid-Nederland B.V. Full Netherlands Subsidiary 98.1 98.1 98.1 98.1
GAC - Sofinco Auto Finance
Co.
Equity
Accounted China Associate 50.0 50.0 50.0 50.0
GSA Ltd Full Mauritius Subsidiary 100.0 100.0 100.0 100.0
IDM Finance B.V. Full Netherlands Subsidiary 100.0 100.0 100.0 100.0
IDM Financieringen B.V. Full Netherlands Subsidiary 100.0 100.0 100.0 100.0
IDM lease maatschappij B.V. Full Netherlands Subsidiary 100.0 100.0 100.0 100.0
Iebe Lease B.V. Full Netherlands Subsidiary 100.0 100.0 100.0 100.0
INTERBANK NV Full Netherlands Subsidiary 100.0 100.0 100.0 100.0
INTERMEDIAIRE
VOORSCHOTBANK BV Full Netherlands Subsidiary 100.0 100.0 100.0 100.0
Krediet '78 B.V. Full Netherlands Subsidiary 100.0 100.0 100.0 100.0
Leasys
Equity
Accounted Italy Joint venture 50.0 50.0 50.0 50.0
LEASYS France S.A.S
Equity
Accounted France Joint venture 50.0 50.0 50.0 50.0
LEASYS Nederland
Equity
Accounted Netherlands Joint venture 50.0 50.0 50.0 50.0
LEASYS SPA Belgian Branch
Equity
Accounted Belgium Joint venture 50.0 50.0 50.0 50.0
LEASYS SPA GERMAN BRANCH
Equity
Accounted Germany Joint venture 50.0 50.0 50.0 50.0
LEASYS SPA SUCURSAL ESPANA
Equity
Accounted Spain Joint venture 50.0 50.0 50.0 50.0
Leasys UK Ltd
Equity
Accounted
United
Kingdom Joint venture 50.0 50.0 50.0 50.0
Mahuko Financieringen B.V. Full Netherlands Subsidiary 100.0 100.0 100.0 100.0
Menafinance Full D2 France Subsidiary 100.0 50.0 100.0 50.0
NL Findio B.V Full Netherlands Subsidiary 100.0 100.0 100.0 100.0
RIBANK NV Full Netherlands Subsidiary 100.0 100.0 100.0 100.0
Sofinco Participations Full France Subsidiary 100.0 100.0 100.0 100.0
Ste Européenne de
Développement d'Assurances Full France Subsidiary 100.0 100.0 100.0 100.0
AD SUCCURSALE Full D1 Morocco Branch 100.0 100.0 100.0 100.0
Ste Européenne de
Développement du
Financement Full France Subsidiary 100.0 100.0 100.0 100.0
Themis Courtage
Equity
Accounted Morocco Associate 49.0 49.0 48.9 48.9
Ucafleet
Equity
Accounted France Associate 35.0 35.0 35.0 35.0
VoordeelBank B.V. Full Netherlands Subsidiary 100.0 100.0 100.0 100.0
Wafasalaf
Equity
Accounted Morocco Associate 49.0 49.0 49.0 49.0
WINRENT
Equity
Accounted Italy Joint venture 50.0 50.0 50.0 50.0
Lease financing companies
Auxifip Full France Subsidiary 100.0 100.0 100.0 100.0
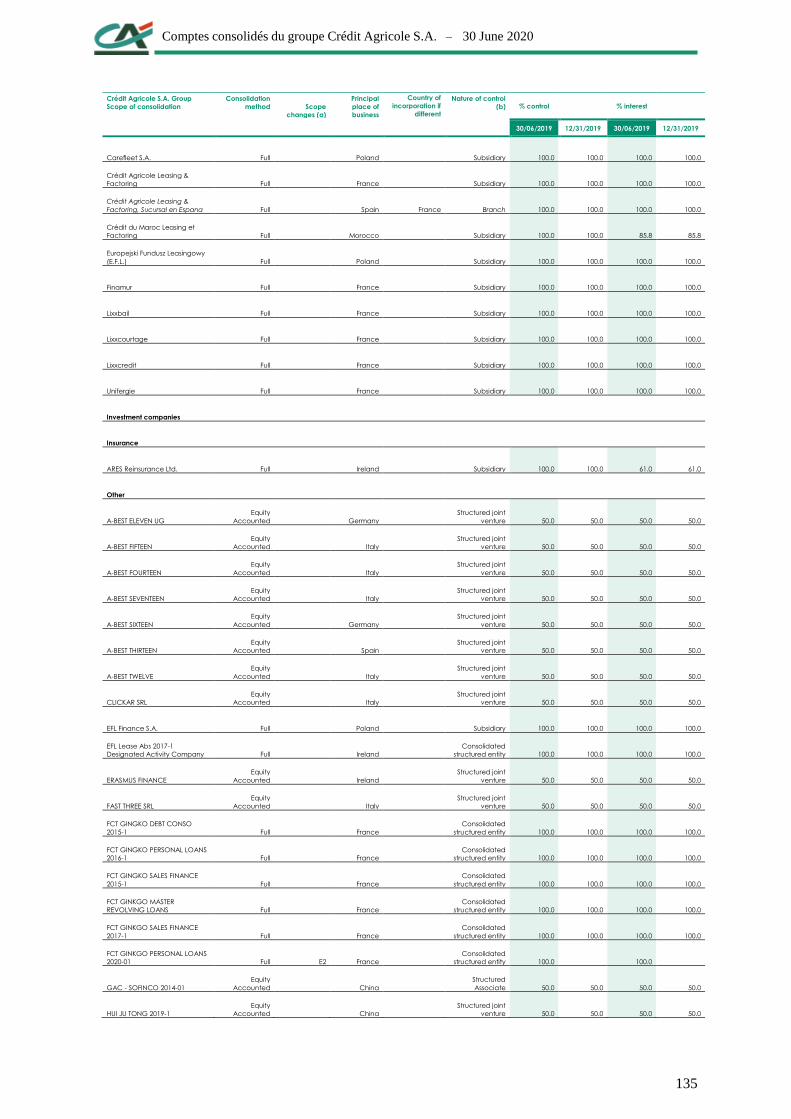
Comptes consolidés du groupe Crédit Agricole S.A. – 30 June 2020
135
Crédit Agricole S.A. Group
Scope of consolidation
Consolidation
method
Scope
changes (a)
Principal
place of
business
Country of
incorporation if
different
from the
principal place
of business
Nature of control
(b)
% control % interest
30/06/2019 12/31/2019 30/06/2019 12/31/2019
Carefleet S.A. Full Poland Subsidiary 100.0 100.0 100.0 100.0
Crédit Agricole Leasing &
Factoring Full France Subsidiary 100.0 100.0 100.0 100.0
Crédit Agricole Leasing &
Factoring, Sucursal en Espana Full Spain France Branch 100.0 100.0 100.0 100.0
Crédit du Maroc Leasing et
Factoring Full Morocco Subsidiary 100.0 100.0 85.8 85.8
Europejski Fundusz Leasingowy
(E.F.L.) Full Poland Subsidiary 100.0 100.0 100.0 100.0
Finamur Full France Subsidiary 100.0 100.0 100.0 100.0
Lixxbail Full France Subsidiary 100.0 100.0 100.0 100.0
Lixxcourtage Full France Subsidiary 100.0 100.0 100.0 100.0
Lixxcredit Full France Subsidiary 100.0 100.0 100.0 100.0
Unifergie Full France Subsidiary 100.0 100.0 100.0 100.0
Investment companies
Insurance
ARES Reinsurance Ltd. Full Ireland Subsidiary 100.0 100.0 61.0 61.0
Other
A-BEST ELEVEN UG
Equity
Accounted Germany
Structured joint
venture 50.0 50.0 50.0 50.0
A-BEST FIFTEEN
Equity
Accounted Italy
Structured joint
venture 50.0 50.0 50.0 50.0
A-BEST FOURTEEN
Equity
Accounted Italy
Structured joint
venture 50.0 50.0 50.0 50.0
A-BEST SEVENTEEN
Equity
Accounted Italy
Structured joint
venture 50.0 50.0 50.0 50.0
A-BEST SIXTEEN
Equity
Accounted Germany
Structured joint
venture 50.0 50.0 50.0 50.0
A-BEST THIRTEEN
Equity
Accounted Spain
Structured joint
venture 50.0 50.0 50.0 50.0
A-BEST TWELVE
Equity
Accounted Italy
Structured joint
venture 50.0 50.0 50.0 50.0
CLICKAR SRL
Equity
Accounted Italy
Structured joint
venture 50.0 50.0 50.0 50.0
EFL Finance S.A. Full Poland Subsidiary 100.0 100.0 100.0 100.0
EFL Lease Abs 2017-1
Designated Activity Company Full Ireland
Consolidated
structured entity 100.0 100.0 100.0 100.0
ERASMUS FINANCE
Equity
Accounted Ireland
Structured joint
venture 50.0 50.0 50.0 50.0
FAST THREE SRL
Equity
Accounted Italy
Structured joint
venture 50.0 50.0 50.0 50.0
FCT GINGKO DEBT CONSO
2015-1 Full France
Consolidated
structured entity 100.0 100.0 100.0 100.0
FCT GINGKO PERSONAL LOANS
2016-1 Full France
Consolidated
structured entity 100.0 100.0 100.0 100.0
FCT GINGKO SALES FINANCE
2015-1 Full France
Consolidated
structured entity 100.0 100.0 100.0 100.0
FCT GINKGO MASTER
REVOLVING LOANS Full France
Consolidated
structured entity 100.0 100.0 100.0 100.0
FCT GINKGO SALES FINANCE
2017-1 Full France
Consolidated
structured entity 100.0 100.0 100.0 100.0
FCT GINKGO PERSONAL LOANS
2020-01 Full E2 France
Consolidated
structured entity 100.0 100.0
GAC - SOFINCO 2014-01
Equity
Accounted China
Structured
Associate 50.0 50.0 50.0 50.0
HUI JU TONG 2019-1
Equity
Accounted China
Structured joint
venture 50.0 50.0 50.0 50.0

Comptes consolidés du groupe Crédit Agricole S.A. – 30 June 2020
136
Crédit Agricole S.A. Group
Scope of consolidation
Consolidation
method
Scope
changes (a)
Principal
place of
business
Country of
incorporation if
different
from the
principal place
of business
Nature of control
(b)
% control % interest
30/06/2019 12/31/2019 30/06/2019 12/31/2019
HUI TONG 2018-3
Equity
Accounted E2 China
Consolidated
structured entity 50.0 50.0
HUI TONG 2019-1
Equity
Accounted E2 China
Consolidated
structured entity 50.0 50.0
HUI TONG 2018-2
Equity
Accounted E2 China
Consolidated
structured entity 50.0 50.0
MAGOI BV Full Netherlands
Consolidated
structured entity 100.0 100.0 100.0 100.0
MATSUBA BV Full Netherlands
Consolidated
structured entity 100.0 100.0 100.0 100.0
NIXES SEVEN SRL
Equity
Accounted Netherlands
Structured joint
venture 50.0 50.0 50.0 50.0
NIXES SIX (LTD)
Equity
Accounted Italy
Structured joint
venture 50.0 50.0 50.0 50.0
RETAIL AUTOMOTIVE CP
GERMANY 2016 UG Full D1 Germany
Consolidated
structured entity 100.0 100.0 100.0 100.0
SUNRISE SPV 20 SRL Full Italy
Consolidated
structured entity 100.0 100.0 61.0 61.0
SUNRISE SPV 30 SRL Full Italy
Consolidated
structured entity 100.0 100.0 61.0 61.0
SUNRISE SPV 40 SRL Full Italy
Consolidated
structured entity 100.0 100.0 61.0 61.0
SUNRISE SPV 50 SRL Full Italy
Consolidated
structured entity 100.0 100.0 61.0 61.0
SUNRISE SPV Z60 Srl Full Italy
Consolidated
structured entity 100.0 100.0 61.0 61.0
SUNRISE SPV Z70 Srl Full Italy
Consolidated
structured entity 100.0 100.0 61.0 61.0
SUNRISE SPV Z80 Srl Full Italy
Consolidated
structured entity 100.0 100.0 61.0 61.0
SUNRISE SRL Full Italy
Consolidated
structured entity 100.0 100.0 61.0 61.0
THETIS FINANCE 2015-1 Full Portugal
Consolidated
structured entity 100.0 100.0 100.0 100.0
CORPORATE AND INVESTMENT BANKING
Banking and financial institutions
Banco Crédit Agricole Brasil S.A. Full Brazil Subsidiary 100.0 100.0 97.8 97.8
Banco S3 México, S.A.
Equity
Accounted Mexico Associate 50.0 50.0 34.7 34.7
BTN Förvaltning AB
Equity
Accounted Sweden Netherlands Associate 20.0 19.5 13.9 13.6
CACEIS Bank Full France Subsidiary 100.0 100.0 69.5 69.5
CACEIS Bank S.A., Germany
Branch Full Germany Branch 100.0 100.0 69.5 69.5
CACEIS Bank, Belgium Branch Full Belgium Branch 100.0 100.0 69.5 69.5
CACEIS Bank, Ireland Branch Full Ireland Branch 100.0 100.0 69.5 69.5
CACEIS Bank, Italy Branch Full Italy Branch 100.0 100.0 69.5 69.5
CACEIS Bank, Luxembourg
Branch Full Luxembourg Branch 100.0 100.0 69.5 69.5
CACEIS Bank, Netherlands
Branch Full D2 Netherlands Branch 100.0 100.0 69.5 69.5
CACEIS Bank, Switzerland
Branch Full Switzerland Branch 100.0 100.0 69.5 69.5
CACEIS Bank, UK Branch Full
United
Kingdom Branch 100.0 100.0 69.5 69.5
CACEIS Belgium Full Belgium Subsidiary 100.0 100.0 69.5 69.5
CACEIS Corporate Trust Full France Subsidiary 100.0 100.0 69.5 69.5
CACEIS Fund Administration Full France Subsidiary 100.0 100.0 69.5 69.5

Comptes consolidés du groupe Crédit Agricole S.A. – 30 June 2020
137
Crédit Agricole S.A. Group
Scope of consolidation
Consolidation
method
Scope
changes (a)
Principal
place of
business
Country of
incorporation if
different
from the
principal place
of business
Nature of control
(b)
% control % interest
30/06/2019 12/31/2019 30/06/2019 12/31/2019
CACEIS Ireland Limited Full Ireland Subsidiary 100.0 100.0 69.5 69.5
CACEIS S.A. Full France Subsidiary 69.5 69.5 69.5 69.5
CACEIS Switzerland S.A. Full Switzerland Subsidiary 100.0 100.0 69.5 69.5
Crédit Agriciole CIB (Belgique) Full Belgium France Branch 97.8 97.8 97.8 97.8
Crédit Agricole CIB (ABU DHABI) Full
United Arab
Emirates France Branch 97.8 97.8 97.8 97.8
Crédit Agricole CIB (Allemagne) Full Germany France Branch 97.8 97.8 97.8 97.8
Crédit Agricole CIB (Canada) Full Canada France Branch 97.8 97.8 97.8 97.8
Crédit Agricole CIB (Corée du
Sud) Full South Korea France Branch 97.8 97.8 97.8 97.8
Crédit Agricole CIB (Dubai
DIFC) Full
United Arab
Emirates France Branch 97.8 97.8 97.8 97.8
Crédit Agricole CIB (Dubai) Full
United Arab
Emirates France Branch 97.8 97.8 97.8 97.8
Crédit Agricole CIB (Espagne) Full Spain France Branch 97.8 97.8 97.8 97.8
Crédit Agricole CIB (Etats-Unis) Full United States France Branch 97.8 97.8 97.8 97.8
Crédit Agricole CIB (Finlande) Full Finland France Branch 97.8 97.8 97.8 97.8
Crédit Agricole CIB (Hong-
Kong) Full Hong Kong France Branch 97.8 97.8 97.8 97.8
Crédit Agricole CIB (Inde) Full India France Branch 97.8 97.8 97.8 97.8
Crédit Agricole CIB (Italie) Full Italy France Branch 97.8 97.8 97.8 97.8
Crédit Agricole CIB (Japon) Full Japan France Branch 97.8 97.8 97.8 97.8
Crédit Agricole CIB (Miami) Full United States France Branch 97.8 97.8 97.8 97.8
Crédit Agricole CIB (Royaume-
Uni) Full
United
Kingdom France Branch 97.8 97.8 97.8 97.8
Crédit Agricole CIB (Singapour) Full Singapour France Branch 97.8 97.8 97.8 97.8
Crédit Agricole CIB (Suède) Full Sweden France Branch 97.8 97.8 97.8 97.8
Crédit Agricole CIB (Taipei) Full Taiwan France Branch 97.8 97.8 97.8 97.8
Crédit Agricole CIB Algérie Bank
Spa Full Algeria Subsidiary 100.0 100.0 97.8 97.8
Crédit Agricole CIB AO Full Russia Subsidiary 100.0 100.0 97.8 97.8
Crédit Agricole CIB Australia
Ltd. Full Australia Subsidiary 100.0 100.0 97.8 97.8
Crédit Agricole CIB China Ltd. Full China Subsidiary 100.0 100.0 97.8 97.8
Crédit Agricole CIB China Ltd.
Chinese Branch Full China Branch 100.0 100.0 97.8 97.8
Crédit Agricole CIB S.A. Full France Subsidiary 97.8 97.8 97.8 97.8
Crédit Agricole CIB Services
Private Ltd. Full India Subsidiary 100.0 100.0 97.8 97.8
ESTER FINANCE TECHNOLOGIES Full D1 France Subsidiary 100.0 100.0 97.8 97.8
KAS Bank N.V. Full Netherlands Subsidiary 100.0 97.4 69.5 67.7
KAS Bank N.V. Frankfurt branch Full Germany Netherlands Branch 100.0 97.4 69.5 67.7
KAS Bank N.V. London branch Full
United
Kingdom Netherlands Branch 100.0 97.4 69.5 67.7
KAS Trust & Depositary Services
B.V. Amsterdam Full S4 Netherlands Subsidiary 97.4 67.7

Comptes consolidés du groupe Crédit Agricole S.A. – 30 June 2020
138
Crédit Agricole S.A. Group
Scope of consolidation
Consolidation
method
Scope
changes (a)
Principal
place of
business
Country of
incorporation if
different
from the
principal place
of business
Nature of control
(b)
% control % interest
30/06/2019 12/31/2019 30/06/2019 12/31/2019
S3 Latam Holdco 1
Equity
Accounted Spain Joint venture 50.0 50.0 34.7 34.7
S3 Latam Holdco 2
Equity
Accounted Spain Joint venture 50.0 50.0 34.7 34.7
CACEIS FUND ADMINISTRATION
SPAIN S.A.U Full D1 Spain Subsidiary 100.0 100.0 69.5 69.5
SANTANDER CACEIS BRASIL
DTVM S.A.
Equity
Accounted D1 Brazil Joint venture 50.0 50.0 34.7 34.7
SANTANDER CACEIS BRASIL
PARTICIPACOES S.A
Equity
Accounted D1 Brazil Joint venture 50.0 50.0 34.7 34.7
SANTANDER CACEIS COLOMBIA
S.A, SOCIEDAD FIDUCIARIA
Equity
Accounted D1 Colombia Joint venture 50.0 50.0 34.7 34.7
Santander Securities Services,
S.A. Full Spain Subsidiary 100.0 100.0 69.5 69.5
UBAF
Equity
Accounted France Joint venture 47.0 47.0 46.0 46.0
UBAF (Corée du Sud)
Equity
Accounted South Korea France Joint venture 47.0 47.0 47.0 46.0
UBAF (Japon)
Equity
Accounted Japan France Joint venture 47.0 47.0 47.0 46.0
UBAF (Singapour)
Equity
Accounted Singapour France Joint venture 47.0 47.0 47.0 46.0
Stockbrokers
Credit Agricole Securities (Asia)
Limited Hong Kong Full Hong Kong Subsidiary 100.0 100.0 97.8 97.8
Credit Agricole Securities (Asia)
Limited Seoul Branch Full South Korea Branch 100.0 100.0 97.8 97.8
Crédit Agricole Securities (USA)
Inc Full D2 United States Subsidiary 100.0 100.0 97.8 97.8
Crédit Agricole Securities Asia
BV (Tokyo) Full Japan Netherlands Branch 100.0 100.0 97.8 97.8
Investment companies
Compagnie Française de l’Asie
(CFA) Full France Subsidiary 100.0 100.0 97.8 97.8
Crédit Agricole CIB Air Finance
S.A. Full France Subsidiary 100.0 100.0 97.8 97.8
Crédit Agricole CIB Holdings
Ltd. Full
United
Kingdom Subsidiary 100.0 100.0 97.8 97.8
Crédit Agricole Global Partners
Inc. Full United States Subsidiary 100.0 100.0 97.8 97.8
Crédit Agricole Securities Asia
BV Full Netherlands Subsidiary 100.0 100.0 97.8 97.8
Doumer Finance S.A.S. Full France Subsidiary 100.0 100.0 97.8 97.8
Fininvest Full France Subsidiary 98.3 98.3 96.2 96.1
Fletirec Full France Subsidiary 100.0 100.0 97.8 97.8
Insurance
CAIRS Assurance S.A. Full France Subsidiary 100.0 100.0 97.8 97.8
Other
Atlantic Asset Securitization LLC Full United States
Consolidated
structured entity 100.0 100.0 ‐ ‐
Benelpart Full Belgium Subsidiary 100.0 100.0 97.4 95.3
Calixis Finance Full S4 France
Consolidated
structured entity 100.0 97.8

Comptes consolidés du groupe Crédit Agricole S.A. – 30 June 2020
139
Branches are mentioned in italic.
(a) Scope changes
Inclusions (E) into the scope of consolidation:
E1 : Breach of threshold
E2 : Creation
E3 : Acquisition (including controlling interests)
Exclusions (S) from the scope of consolidation:
S1 : Discontinuation of business (including dissolution and liquidation)
S2 : Sale to non-Group companies or deconsolidation following loss of control
S3 : Deconsolidated due to non-materiality
S4 : Merger or takeover
S5 : Transfer of all assets and liabilities
Other :
D1 : Change of company name
D2 : Change in consolidation method
D3 : First time listed in the Note on scope of consolidation
D4 : IFRS 5 entities
(b) Nature of control
Subsidiary
Branch
Consolidated structured entity
Joint Venture
Structured joint venture
Joint operation
Associate
Structured associate

Comptes consolidés du groupe Crédit Agricole S.A. – 30 June 2020
140
NOTE 11 Events subsequent to 30 June 2020
No significant event took place after the reporting date.