CRC Project No. CM-137-11-1b
86
CRC Project No. CM-137-11-1b REVIEW TO DETERMINE THE BENEFITS OF INCREASING OCTANE NUMBER ON GASOLINE ENGINE EFFICIENCY: ANALYSIS AND RECOMMENDATIONS – Tasks 2-5 September 2012 COORDINATING RESEARCH COUNCIL, INC. 3650 MANSELL ROAD·SUITE 140·ALPHARETTA, GA 30022
Transcript of CRC Project No. CM-137-11-1b

CRC Project No CM-137-11-1b
REVIEW TO DETERMINE THE BENEFITS OF INCREASING OCTANE NUMBER ON
GASOLINE ENGINE EFFICIENCY ANALYSIS AND RECOMMENDATIONS ndash Tasks 2-5
September 2012
COORDINATING RESEARCH COUNCIL INC
3650 MANSELL ROADSUITE 140ALPHARETTA GA 30022
The Coordinating Research Council Inc (CRC) is a non‐profit corporation
supported by the petroleum and automotive equipment industries CRC
operates through research committees made up of technical experts from
industry and government who voluntarily participate The four main areas of
research within CRC are air pollution (atmospheric and engineering studies)
aviation fuels lubricants and equipment performance heavy‐duty vehicle
fuels lubricants and equipment performance (eg diesel trucks) and light‐
duty vehicle fuels lubricants and equipment performance (eg passenger
cars) CRCrsquos function is to provide the mechanism for joint research
conducted by the two industries that will help in determining an optimum
combination of petroleum products and mobility equipment CRCrsquos work is
limited to research that is mutually beneficial to the two industries involved
Final reports and data are made available to the public
CRC makes no warranty expressed or implied on the application of
information contained in this report In formulating and approving reports
the appropriate committee of the Coordinating Research Council Inc has not
investigated or considered intellectual property which may apply to the
subject matter Prospective users of the report are responsible for protecting
themselves against liability for infringement of intellectual property rights
iii
Final Report
Review to Determine the Benefits of Increasing Octane Number on Gasoline Engine Efficiency Analysis and Recommendations ndash Tasks 2-5
CRC Project No CM-137-11-1b
September 2012
Submitted to
Coordinating Research Council Inc
Submitted by
K G DULEEP
H-D SYSTEMS International
Washington DC 20016
iv
(This page intentionally left blank)
v
EXECUTIVE SUMMARY
E1 OVERVIEW
The overall objectives of Project CM-137-11-1 are to establish the relationship between engine
(and vehicle) energy efficiency for a spark ignition (SI) engine and the octane number and
composition of the fuel This project is sponsored by the Coordinating Research Council (CRC)
and is divided into several tasks The detailed literature review conducted under Task 1 of this
project1 revealed 45 technical papers that covered various aspects of the relationship between
enginevehicle efficiency and fuel octane number and composition The papers covered a wide
range of engine types fuel formulations engine operating conditions and testing constraints
Results were also presented using various metrics eg indicated and brake mean effective
pressure indicated and brake specific fuel consumption relative and absolute efficiency
The Task 1 review found that the relationship between octane number and efficiency was
influenced by a number of intermediate variables covering engine type operating condition and
fuel formulation Hence it was not possible to simply collate the data from the papers and
develop an average relationship considerable effort was required to organize the reported data
into subsets of similar engine types and operating conditions and to convert the different data
metrics into a comparable set of metrics
The analysis was also assisted by inputs from technical experts at three auto-manufacturers (GM
Ford and Toyota) obtained from interviews conducted by H-D Systems staff All three auto-
manufacturers interviewed suggested that this analysis for CRC use only the results from the
engine studies because they anticipated that in vehicle studies many variables were vehicle
calibration dependent and therefore largely uncontrolled in these studies As a result this study
focuses on engine data where all or most of the data on variables relevant to the study was
controlled andor documented
1 The literature review is available at the CRC website as Review to Determine the Benefits of Increasing Octane Number on Gasoline Engine Efficiency (CM-137-11-1) Task 1 report
vi
E2 IDEAL ENGINE EFFICIENCY AND RELATIONSHIP TO FUEL OCTANE NUMBER
The thermal efficiency of an engine using an ideal model of the SI engine operating on the Otto
cycle is a function of the compression ratio and is given by the relationship
t = 1 ndash (1CR) -1 (1)
where t is the thermal efficiency CR the compression ratio and the ratio of specific heat at
constant volume to the specific heat at constant pressure for the combustion gas2 In equation (1)
the efficiency is referred to as lsquoindicated efficiencyrsquo since it does not account for the effects of
friction and pumping losses This equation is true for naturally aspirated SI engines however
boosted engines require more complex equations relating the efficiencies of the compressor and
turbine or supercharger to engine speed and load to describe the net thermal efficiency of the
reciprocating engine and turbosuper-charger combination
The ideal model of the Otto cycle assumes instantaneous combustion of the air-fuel mixture but
actual combustion occurs over finite time and the spark timing affects efficiency The highest
torque (and hence the highest efficiency) at a given engine speed in revolutions per minute
(RPM) and at wide open throttle (WOT) occurs at a spark timing advance level from piston top
dead center (TDC) termed as lsquominimum for maximum brake torquersquo(MBT) timing Higher and
lower levels of spark advance away from the optimum result in reduction in torque and
efficiency However the maximum level of spark advance possible without causing abnormal
combustion or knock in an engine with a specific configuration is related to the fuel octane
number Hence there is a positive correlation between fuel octane number and efficiency as long
as the knock limited spark advance (KLSA) is less than MBT spark advance The fuel octane
number when the KLSA is equal to the MBT at WOT conditions is termed the octane number
requirement (ONR) of the engine
Although the ideal SI enginersquos efficiency relationship is specified by equation (1) the value of
to be used depends on the fuel composition and air-fuel ratio of the engine Air has a of 14 but
for a stoichiometric mixture the values are about 13 for the compression stroke and about 12
2In the case of other SI engine cycles like the Atkinson cycle or Miller cycle the relationship is somewhat different and involves both the compression and expansion ratio but the trend with compression ratio is similar to that of the Otto Cycle
vii
for the expansion stroke Fitting actual pressure-volume data from engines has typically provided
average values of 125 to 13 and values such as 128 are commonly used in the literature
However data from a very detailed modeling analysis by Nissan provided an indicated
efficiency curve with CR that we were able to replicate using a value of 1265
The relationship between engine ONR and CR is defined by a number of engine design and
operating variables including combustion chamber shape and size spark plug location cylinder
head and wall temperatures intake air temperature etc (The list of variables is intended to be
illustrative not comprehensive) The relationship of engine ONR to these variables has been
established empirically for specific engine designs but no simple theoretical relationship has
been determined However a key mechanism used to control knock in SI engines is the spark
timing which impacts the peak and average cycle pressure and hence the torque output of the
engine as well as its efficiency Maximum torque at any operating point (and hence maximum
efficiency) is obtained at MBT spark timing and any spark timing retard from this MBT timing
normally measured in crank angle degrees before TDC causes a reduction in torque as well as a
reduction in the engine octane number limit that we have termed as ONL for convenience The
change in mean effective pressure as a function of spark timing is well understood as is the
nature of the relationship
A study by MIT (Ref 3) provided a robust relationship between spark timing as measured in
degrees retard from MBT timing to Net Indicated Mean Effective Pressure (NIMEP) NIMEP is
the term used to describe average cylinder pressure over the entire two revolutions (720) of the
Otto Cycle Based on the data presented we derived the following equation for wide open
throttle
()(MBT)NIMEP()NIMEP(MBT) = 1 ndash 0512510-3 (s - s mbt)2 (2)
wheres is the spark timing and s mbt is the MBT spark timing This equation assumed that at
WOT NIMEP is approximately equal to IMEP since pumping losses are quite small typically
less than 2 of IMEP Equation (2) shows that a 10 spark retard from MBT timing results in a
51 relative loss in efficiency and a 20 degree retard reduces relative efficiency by 205
Hence small changes in spark timing from MBT have very small efficiency effects but the non-
linear nature of the relationship shows that retard over 10 can cause significant losses in
efficiency
viii
E3 OCTANE NUMBER MEASUREMENT AND FUEL OCTANE NUMBER
A fuelrsquos propensity to auto-ignite and cause ldquoknockrdquo is quantified in terms of the fuelrsquos octane
number (ON) The ON is measured on a standard engine called the CFR (for Cooperative Fuel
Research) engine where the engine is set to run at fixed intake conditions and RPM Modern
engines do not resemble the CFR engine and the measurement conditions for Research and
Motor Octane Number (RON and MON) do not represent typical engine intake air temperatures
cylinder pressures or operating RPM Hence the relationship between CR and fuel octane
number could be substantially different for modern engines
The relevance of RON and MON ratings to modern engines has been examined at the research
engine production engine and vehicle levels and documented in a number of papers and a new
rating termed octane index (OI) has been derived The basic principle is that the OI of a fuel for
modern engines can be expressed as a linear combination of the RON and MON values with K
as the weighting factor such that
OI = RON ndash K(RON ndash MON)
= RON ndash K S (3)
The term (RON ndash MON) in Equation 3 is called the Sensitivity (S) of the fuel In a study by
Shell (Ref4) 21 fuels with a wide range of RON and MON were tested in two single-cylinder
engines The study found that the engine torque increased with spark advance flattening out at a
maximum value at the MBT spark level and declining with further increases in spark advance as
predicted by Equation (2) Many fuels had too high a knock intensity at levels of spark advance
much less than the MBT level so that they were tested only to the knock limitK as defined in
the Equation (3) was determined for each RPMload test condition and was found to be negative
at low RPM (lt2000) and high load K increased with RPM but decreased with increased CR and
load The K value at any speedload condition appeared to be largely independent of fuel type or
RON The result of a negative K value is that for a fuel with Sensitivity (S)gt0the OI is greater
than either the RON or MON of the fuel In general K values that are small or zero imply that
fuel RON is much more important than MON for engine knock suppression and a negative K
indicates that lower values of MON are preferred
ix
Analysis conducted at MIT (Ref 6) and at other research facilities confirmed the finding that K
is negative for modern vehicles The MIT analysis also found that K was
- Only weakly dependent on spark plug location and CR (varying from 98 to 134)
- Non-linearly dependent on air-fuel ratio being highest at lambda = 1 but decreasing
at both richer and leaner air-fuel ratio
- Increased linearly with intake air temperature
- Decreased almost linearly with increased intake air pressure (boost)
The finding that K decreases with intake boost is particularly interesting since it implies that
more sensitive fuels are well suited to turbocharged engines as their OI is significantly higher
than the RON of the fuel The MIT paper indicated that at a boost level of 14 bar the K value
was -065 For a typical retail gasoline with a Sensitivity of about 10 octane numbers the -065
estimate indicates that the OI is 65 numbers above the RON at this boost level
However a recent study by Toyota found that hot spot related pre-ignition occurs at much lower
hot spot temperatures in a high CR engine than in a low CR engine and that the pre-ignition
temperatures for this engine with the different fuels showed MON to have a stronger relationship
than RON to pre-ignition temperature The study also found that increasing MON by 16 (from
80 to 96) resulted in pre-ignition temperature increasing by about 200 C Hence the study
concluded that a higher MON was useful in suppressing hot spot related pre-ignition
E4 EFFECTS OF FUEL COMPOSITION
Fuel composition affects the fuel octane index and latent heat of vaporization and can also
directly influence engine efficiency by changes in the mixture burning velocity Researchers
(Ref 10) find that paraffin compounds have high auto-ignition resistance at higher temperatures
where the kinetics of paraffin decomposition have a negative temperature coefficient Hence the
reference fuels which are a mixture of paraffin compounds are more resistant to knock at higher
temperatures similar to those encountered under the MON test conditions than olefin and
aromatic compounds At conditions closer to those of the RON test the olefin and aromatic
compounds have better knock resistance than paraffin compounds and mixtures containing
higher olefin and aromatic compounds can have an octane number higher than the octane number
of the reference fuel leading to a negative K value
x
In an analysis of fuel effects over a range of air-fuel ratios an ExxonMobilToyota paper (Ref
11) examined the burning velocities of fuels with different mixes of aromatic olefin and paraffin
compounds at values ranging from 1 to 17 The paper stated that laminar burning velocities
varied by more than 11 between the slowest and fastest fuels and that burning velocities
correlate well with olefin content and higher fuel volatility Tests on a variety of fuel
formulations on an engine operating at WOT 2400 RPM and = 1 showed that fuels with high
burning velocities gave up to 3 higher torque at the same spark advance The faster burning
fuels also allowed higher spark advance at the knock limit
In port fuel injected (PFI) engines much of the fuel is inducted into the cylinder after it has
vaporized due to heat transfer from the engine In direct injection (DI) engines the fuel is
introduced into the cylinder in liquid form and the vaporization of fuel causes a reduction in the
air-fuel mixture temperature relative to mixture for a PFI engine thereby reducing the octane
number requirement of the engine The latent heat of vaporization for gasoline is estimated at
420 kJkg and varies somewhat depending on gasoline composition However the introduction
of ethanol has a particularly large effect on temperature since it has a latent heat of vaporization
(LHV) which is approximately double that of gasoline In addition the stoichiometric air-fuel
ratio for ethanol is 90 compared to 145 to 147 for gasoline so that a larger quantity of ethanol
is required at stoichiometric conditions for a given volume of air Analysis shows that if all the
heat of vaporization is taken from the air the temperature drop with gasoline is about 20C while
the drop with ethanol is about 90C The lower temperature causes a significant reduction in the
ONR of the engine
E5 MAJOR FINDINGS OF THE ANALYSIS OF ACTUAL ENGINE EFFICIENCY
The effect of increasing fuel octane number on engine and vehicle energy efficiency cannot be
quantified in a simple way but requires a complex nuanced answer The following findings from
the literature review and analysis are the basis for the conclusions of this report
Relationship between Actual Engine Efficiency and Fuel Octane Number
1) The thermal efficiency of naturally aspirated engines primarily depends on the enginersquos
compression ratio but is also adversely affected by increasing surface to volume ratio of
the combustion chamber which depends directly on the CR and inversely on the cylinder
xi
displacement (and typically the bore size) As a result actual maximum indicated
thermal efficiency is almost constant beyond CR values of 14 for small bore engines
(lt70mm) and almost constant beyond a CR of 16 for bore size over 85mm The marginal
thermal efficiency benefit of increasing CR declines continuously with increasing CR 2) The engine octane number requirement (ONR) is primarily a function of the CR and to a
slightly lesser extent operating conditions of speed and air-fuel ratio It is also a function
of engine design variables such as the shape of the combustion chamber efficacy of
cooling and bore diameter3 The highest octane number requirement occurs at low RPM
(lt1500) and WOT for naturally aspirated engines
Naturally Aspirated Engines
3) The typical ONR for a port fuel injected naturally aspirated engine with a CR of 10 and a
bore diameter of about 85mm operating at = 1 1500 RPM is 100 to 102 RON at WOT
Smaller bore engines have a lower octane number requirement while larger bore engines
have a higher octane number requirement The relationship between ONR and bore
diameter is not well quantified in the literature but may be around 2 to 3 octane numbers
per 10mm based on the data collected for this study Hence a small bore engine (70mm)
at the same conditions can have an ONR of 96 to 99 while a large bore engine (100mm)
can have an ONR of 103 to 106 4) The ONR increases with engine CR by about 4 to 5 octane numbers per unit CR increase
(It is not clear if this relationship holds at higher CR values over 13) The ONR decreases
with RPM and the ONR dependence appears to be approximately linear with time per
revolution (the inverse of RPM) to about 40 ms (1500 RPM) but not all studies confirm
this The ONR declines by approximately 2 octane numbers per 10ms decline in the time
per revolution Hence the ONR declines by about 4 numbers between 1500 RPM and
3000 RPM (40ms to 20ms per revolution) 5) The engine actual octane number limit (ONL) is sensitive to spark timing advance and
air-fuel ratio and these are the two primary control levers used to prevent knock in
production naturally aspirated engines The ONL is reduced with spark retard from MBT
values and this relationship is approximately linear with the OR being reduced by 1
3 The variables listed are illustrative but this not a comprehensive list
xii
octane point for every 15 + 05 degrees spark retard The relationship becomes more
non-linear at retarded timing very close to MBT and at timing advance beyond MBT The
ONL at WOT is highest at of 095 to 1 and every 01 richer or leaner than this level
leads to about a 3 point reduction in ONL 6) The influence of spark timing on torque and engine efficiency is very nonlinear with the
first 5 crank angle degrees (CAD) retard from MBT reducing torque and relative
efficiency by only about 13 while a 10 CAD retard causes a 51 reduction Hence
spark retard by 5 from MBT can reduce the engine ONL by 3 to 4 numbers while having
only modest negative effects of about 13 on available torque and relative thermal
efficiency 7) With direct injection (DI) of the fuel into the cylinder the latent heat of evaporation of
the fuel cools the air-fuel mixture The cooling power of gasoline for a stoichiometric
mixture of air and fuel is about 24 kJkg air The reduced temperature reduces the octane
number requirement by one octane number for about 45 to 6 kJkg of cooling power
Hence direct injection of gasoline reduces the ONR by about 4 to 5 octane numbers
Ethanol has a cooling power that is about 4 times as high as gasoline suggesting a
potential ONL reduction of 16 to 20 octane numbers when a DI engine is fueled with neat
ethanol
Turbocharged Engines
8) The relationship between engine CR spark timing and engine ONL is more complex in a
turbocharged engine since the reciprocating engine and turbocharger act as system If the
engine is not boost limited the optimal combustion phasing for best torque is delayed
relative to that for a naturally aspirated engine since there is a compromise between
enthalpy flow to the turbine and the best torque achieved by the engine At high RPM the
boost air-fuel ratio and spark timing at WOT have to be limited not only to avoid knock
but also to limit turbine inlet temperature (which limits the employment of spark retard)
and engine peak pressure so that fuel octane number effects are very varied across
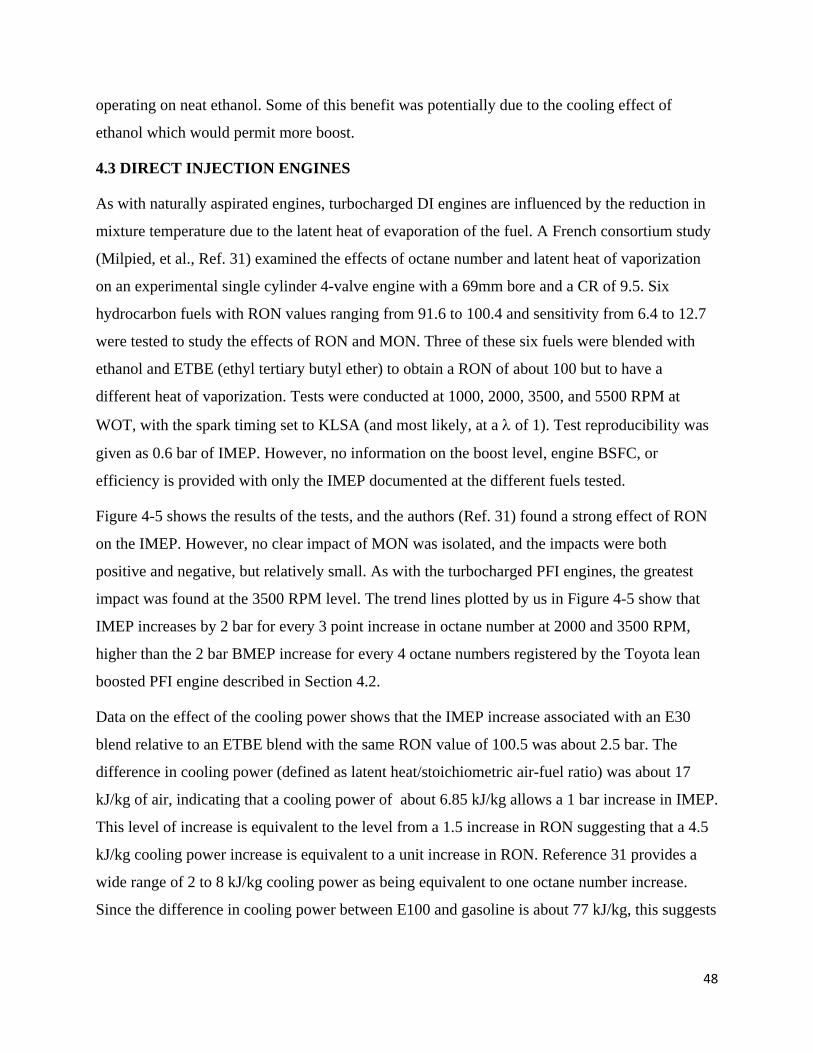
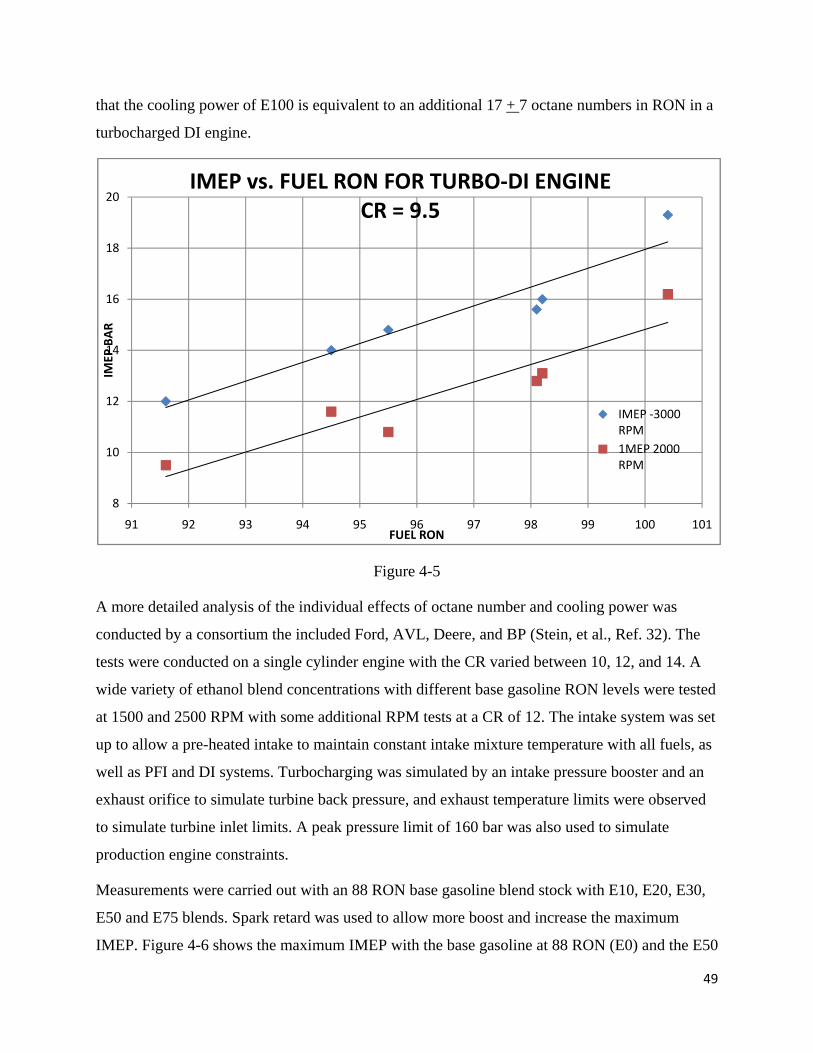
different operating conditions 9) The available data show that increasing fuel octane number increases mid-range torque (~
3000 to 4000 RPM) by 2 to 3 per octane number in RON for a turbocharged PFI
xiii
engine while increasing engine thermal efficiency by about 07 per octane point Low
RPM and high RPM torque are usually limited by other factors as well so that the effect
of octane number increase at these RPM levels may be engine design specific 10) Increasing octane number can have a very significant effect on mid-range torque for
turbocharged DI engines that are not boost limited Limited data on DI engines show that
an 8 increase in fuel RON can increase 3000 RPM torque by about 50 or about 5 per
octane number Torque benefits at high and low RPM may be much smaller as they are
subject to the same constraints as for PFI engines 11) The use of high ethanol concentration blends (E30 and higher) with gasoline may be
particularly beneficial to turbocharged DI engines for two reasons ndash the high RON and
the high cooling power Research shows that with high concentration ethanol blends the
combination of high boost and retarded timing allows knock free operation at very high
brake mean effective pressure (BMEP) levels Recent experimental work has shown the
capability of an E50 blend to allow engine operation at 38 bar to 40 bar indicated mean
effective pressure (IMEP) which is about twice the IMEP level of current gasoline
turbocharged DI engines These high IMEP values will not likely be reproduced in
production engines as ethanol has other limitations such as reduced hot spot pre-ignition
temperature relative to hydrocarbon gasoline
Special Conditions
12) The use of lean burn offers a substantial fuel economy opportunity especially at part load
conditions but is not used in the US due to difficulties in meeting emission standards
Under lean conditions with a homogeneous mixture lower RON fuels have been found to
give better engine efficiency because the lower octane number leads to a combustion
mode described as spark initiated compression ignition of end gases that are not fully
combusted with high octane number fuels If lean combustion becomes viable lower
RON fuels may be more desirable However the limiting condition for engine ONR may
still be at full load where stoichiometric or rich operation is desirable for maximum
power so that the fuel octane number will have to be tailored to this condition in actual
practice
xiv
E5 CONCLUSIONS
One objective of the project was to assess the impact of increasing fuel octane number on engine
and vehicle efficiency The conclusions for a 4 to 5 octane number increase are as follows
1) In PFI naturally aspirated engines with mid-size (~85mm) and larger bore sizes and a
compression ratio (CR) of 10 this octane number increase will facilitate a 1 point
increase in CR which can provide a 2 relative improvement in engine efficiency For
small bore sizes (~70mm) the increase in CR will be similar but the improvement in
engine efficiency will be smaller at 13 to 14
2) For midsize and large bore naturally aspirated DI engines that have a CR of 11 this
octane number increase will facilitate a 1 point increase in CR and allow engine
efficiency to increase by 15 to 16 Small bore engines will have an improvement of
08 to 085
3) Vehicle efficiency gains for vehicles with naturally aspirated engines can be somewhat
larger than engine efficiency gains due to increased engine torque when CR is increased
permitting engine down-speeding This can provide up to a 1 to 2 fuel economy gain
over and above engine efficiency gains
4) In turbocharged engines the effect of this improved octane number could be through the
increase in engine peak torque if the engine is not boost limited In PFI engines the 4 to 5
point octane number increase can provide 10 to 15 more torque In a DI engine this
increase in octane number can translate into a 20 to 25 increase in torque This torque
increase is for operation at 2000 to 4000 RPM at engine speeds below 1500 RPM and
above 4000 RPM other factors control available torque increases so that no general
conclusion is possible
5) The torque increases with turbocharged engines could allow significant downsizing and
down-speeding of the engine but the extent of downsizing and down-speeding is
dependent on engine low RPM performance As an example of the size of the potential
benefit a 5 to 7 fuel economy improvement is possible if the engine can be
downsized by 20 to 25 to keep absolute mid-range torque constant
6) If the octane number increase were to be derived by addition of ethanol to gasoline larger
torque increases may be possible in turbocharged DI engines due to the high latent heat
of vaporization of ethanol An E30 blend with 91 RON gasoline blend-stock could
xv
potentially improve torque by 50 but this level of increase is not proven in any vehicle
application and could be limited by ethanolrsquos lower resistance to hot spot pre-ignition
7) Developments in engine technology will allow CR to increase in the future with no
change to fuel RON and MON The increased use of DI technology will allow CR
increases of 1 unit Engine downsizing with resulting smaller bore sizes as well as the
use of cooled exhaust gas recirculation (EGR) and improved exhaust scavenging may
allow continuing increases in CR over the next decade with unchanged fuel octane
number
E6 DATA GAPS AND RECOMMENDATIONS FOR FUTURE RESEARCH
Two types of data gaps have been identified The first type is where the data exists but are not
public For example the data set is on actual engine efficiency and octane number requirement is
very limited across engine sizes and across the RPM range Other key variables with limited data
include the effect of spark timing as well as the effect of air-fuel ratio on fuel octane number
requirements across a range of engine bore sizes and RPM These data clearly exist for a wide
variety of production engines if manufacturers participate in sharing the data (the origin of the
data can be obscured to maintain confidentiality) the database could pave the way for
developing more robust relationships between efficiency and fuel octane number for different
bore sizes and operating conditions
The second type of gap is where the data available are too limited to provide specific
conclusions Data on turbocharged DI engines especially those with small displacement and
their response to fuel octane number and heat of vaporization in terms of efficiency and torque
improvement across a range of engine speeds (especially at low RPM)are very thin and often
derived from experimental engines Octane number improvements and improvements from
ethanol blends appear to hold significant promise but the available data are inadequate to
estimate the benefits in a real vehicle application Newer technologies are also not represented in
existing data The latest DI engines in Europe have sequential turbocharging with two stage
cooling experiments have been conducted with cooled EGR at all loads and speeds but little
information exists on the interaction with fuel octane number
The testing of turbocharged DI engines of different sizes and those equipped with newer
technology such as sequential turbocharging as well cooled EGR can permit a look forward into
xvi
the future interaction of fuel octane number and engine and vehicle efficiency Future research
should focus on these newest technologies for the greatest relevance to the future
xvii
TABLE OF CONTENTS
EXECUTIVE SUMMARY v
1 INTRODUCTION
11 ANALYSIS OBJECTIVES 1
12 FOCUS OF ANALYSIS 2
13 ORGANIZATION OF THIS REPORT 3
2 IDEAL MODELS OF ENGINE EFFICIENCY AND RELATIONSHIP TO FUEL
PROPERTIES
21 BACKGROUND 4
22 IDEAL CYCLE ENERGY EFFICIENCY 5
23 OCTANE NUMBER MEASUREMENT AND FUEL OCTANE NUMBER 9
24 FUEL COMPOSITION EFFECTS ON OCTANE NUMBER
AND EFFICIENCY 16
25 LATENT HEAT OF VAPORIZATION 18
3 NATURALLY ASPIRATED ENGINES
31 ACTUAL ENGINE EFFICIENCY 20
32 ENGINE OCTANE NUMBER LIMIT AND SPARK ADVANCE 28
33 ENGINE ONR 31
34 EFFECT OF LATENT HEAT OF VAPORIZATION OF FUEL 36
35 LEAN OPERATING CONDITIONS 39
4 TURBOCHARGED PORT AND DIRECT INJECTED ENGINES
41 OVERVIEW 43
42 PORT FUEL INJECTED ENGINES 44
43 DIRECT INJECTION ENGINES 48
xviii
5 FINDINGS AND CONCLUSIONS
51 MAJOR FINDINGS 53
52 STATUS OF CURRENT US NEW VEHICLE FLEET 57
53 CONCLUSIONS 60
6 DATA GAPS AND RESEARCH RECOMMENDATIONS 62
LIST OF ACRONYMS 64
REFERENCES 66
1
1 INTRODUCTION
11 ANALYSIS OBJECTIVES
The overall project objectives are to establish the relationship between engine (and vehicle)
energy efficiency for a SI engine and the octane number and composition of the fuel This
project is sponsored by the Coordinating Research Council (CRC) and is divided into several
tasks The detailed literature review4 conducted under Task 1 of this project revealed 45
technical papers that covered various aspects of the relationship between engine vehicle
efficiency and fuel octane number and composition The papers by research topic are as
follows
- 10 papers on single cylinder research engines
- 24 papers on prototype or production engines
- 4 papers on vehicle tests
- 6 papers that use simulation models and
- 1 review paper
It should be noted that the research focus of these papers was not uniformly on the
relationship between efficiency and fuel octane and in many of the papers the relationship
was only incidental to the main focus of that study The papers covered a wide range of
engine types fuel formulations engine operating conditions and testing constraints Results
were also presented using various metrics eg indicated and brake mean effective pressure
indicated and brake specific fuel consumption relative and absolute efficiency
The Task 1 review found that the relationship between octane number and efficiency was
influenced by a number of intermediate variables covering engine type operating condition
and fuel formulation Hence it was not possible to simply collate the data from the papers
and develop an average relationship considerable effort was required to organize the
reported data into subsets that had data for similar engine types and operating conditions and
to convert the different data metrics into a comparable set of metrics
4 The literature review is available at the CRC website as a separate Task 1 report
2
The analysis was also assisted by interview inputs from technical experts at three auto-
manufacturers (GM Ford and Toyota) obtained from interviews conducted by H-D Systems
staff The interviews provided qualitative inputs useful to the study and manufacturers also
provided two additional papers (References 32 and 37)released after completion of the
literature survey in late 2011 No confidential data directly relevant to the analysis were used
in this study so that all of the results of this study are based on literature in the public domain
All three auto-manufacturers interviewed suggested that this analysis for CRC use only the
results from the engine studies The manufacturers anticipated that in vehicle studies many
variables such as spark timing and fuel enrichment transmission shift points and others were
calibration-dependent and therefore largely uncontrolled in these studies Hence the
relationships between vehicle efficiency (fuel economy) and octane number could not be
derived in any consistent manner from these vehicle studies As a result this study focuses
on engine data where all or most of the data on variables relevant to the study was controlled
andor documented Results from simulation studies are used to develop the correct form of
the theoretical relationships between variables used in the analysis and are compared to
results from tests in some cases
12 FOCUS OF ANALYSIS
Task 1 of this study revealed that the engine operating points where octane number
constraints are typically critical are at WOT and low RPM (lt2000) for naturally aspirated
engines and at high boost and low RPM for turbocharged engines The combination of
stoichiometric operation at low RPM and wide open throttle is considered in some detail in
this analysis since much of the literature on octane Sensitivity and knock is focused on these
conditions While the focus of this analysis is on WOT and low RPM conditions (1200 to
2000 RPM) efficiency implications at part load conditions and at high RPM conditions are
also discussed in the following sections
As noted the issues related to knock and octane number are governed by many variables but
the focus of this analysis is more limited Since most SI engines today use 4-valve heads with
a central spark plug only limited data are available from other combustion chamber designs
with a spark plug at one side and no specific conclusions regarding spark plug location and
octane number were possible In addition issues regarding coolant temperature and intake air
3
temperature are not examined in any detail since for a fully warmed up engine these
temperatures do not vary much across the papers compiled for this study The issues of
octane number effects at part load and at non-stoichiometric air-fuel ratios are very relevant
for vehicle operation and are considered to the extent documented in these data
13 ORGANIZATION OF THIS REPORT
Section 2 of the report is a review of the engineering principles that govern the relationship
between engine efficiency and engine design and operating variables as well as a discussion
of the determination of a fuelrsquos octane number and its relationship to engine design and
operating variables The relationship between octane number and efficiency is then derived
in a two step process with these engine design and operating variables as the intermediate
variables Section 3 of this report examines the findings of the papers analyzed with respect
to naturally aspirated engines while Section 4 examined them with respect to turbocharged
engines Section 5 presents the major findings of the analysis in Sections 2 3 and 4 and
examines the relationships between CR and recommended fuel octane number for the current
US new vehicle fleet in the context of the findings The CRC had also requested specific
conclusions on the efficiency benefit associated with a 4 to 5 octane number increase in US
fuel specifications and these are provided by engine type at the end of Section 5 Section 6
identifies the data gaps in the collected literature and provides some recommendations for
future research directions
4
2 IDEAL MODELS OF ENGINE EFFICIENCY AND RELATIONSHIP TO FUEL PROPERTIES
21 BACKGROUND
The thermal efficiency of an engine using an ideal model of the SI engine operating on the Otto
Cycle is a function only of the compression ratio and is given by the relationship
t = 1 ndash (1CR) -1 (1)
where t is the thermal efficiency CR the compression ratio and the ratio of specific heat at
constant volume to the specific heat at constant pressure In the case of other SI engine cycles
like the Atkinson Cycle or Miller Cycle the relationship is somewhat different and involves both
the compression and expansion ratio but the trend with compression ratio is similar to that of the
Otto Cycle In equation (1) the efficiency is referred to as lsquoindicated efficiencyrsquo since it does not
account for the effects of friction and pumping losses This equation is true for naturally
aspirated SI engines but boosted engines require more complex equations relating the
efficiencies of the compressor and turbine or supercharger to engine speed and load to describe
the net thermal efficiency of the reciprocating engine and turbosuper-charger combination
Efficiency increases non-linearly with increasing CR according to equation (1) The ideal model
of the Otto Cycle assumes instantaneous combustion of the air-fuel mixture but actual
combustion occurs over finite time and the spark timing affects efficiency The highest torque
(and hence the highest efficiency) at a given RPM and WOT occurs at a spark timing advance
level from piston top dead center (TDC) termed as lsquominimum for maximum brake torquersquo or
MBT timing Higher and lower levels of spark advance away from the optimum result in
reduction in torque and efficiency and the shape of the relationship of torque to spark advance is
given by an inverted U-shaped curve However the maximum level of spark advance possible
without causing abnormal combustion or knock in an engine with a specific configuration is
related to the fuel octane number Hence there is a positive correlation between fuel octane
number and efficiency as long as the knock limited spark advance (KLSA) is less than MBT
spark advance The fuel octane number when the KLSA is equal to the MBT at WOT conditions
is termed the octane number requirement (ONR) of the engine and the relationship between fuel
5
octane number and efficiency only holds for fuel octane numbers below the ONR for a specific
engine
However even within this construct of relating fuel octane number to engine thermal efficiency
its application to the real world requires the detailed understanding of the impact of a number of
additional variables The peak indicated engine efficiency of naturally aspirated engines is a
function not only of compression ratio but also a function of the operating conditions such as air-
fuel ratio engine RPM and spark timing (EGR is currently not used at WOT but could be used
in the future) The absolute octane number requirement of an engine is also a function not only of
CR and operating conditions but also of other engine design variables such as combustion
chamber size and shape and engine cooling as well as ambient conditions of intake air
temperature and humidity The variables described are not intended to be comprehensive but are
illustrative The relationships of some of these independent variables to both the ONR and the
efficiency is non linear and can even be potentially decoupled from one another
The analysis in this report uses the data and findings from the literature search in Task 1 to
provide a more comprehensive picture of the most significant engine parameters affecting engine
efficiency and independently ONR The second part of the analysis links the two to provide an
understanding of the complex relationship between efficiency and octane number
22 IDEAL CYCLE ENGINE EFFICIENCY
Although the ideal SI enginersquos efficiency relationship is specified by Equation (1) the value of
to be used depends on the fuel composition and air-fuel ratio of the engine Air has a of 14 but
for a stoichiometric mixture the values are about 13 for the compression stroke and about 12
for the expansion stroke (Heywood Section 44 Ref 1) Fitting actual pressure-volume data
from engines has typically provided average values of 125 to 13 and values such as 128 are
commonly used in the literature However data from a very detailed modeling analysis by
Nissan (Muranaka Takagi and Ishida Ref 2) provided an indicated efficiency curve with CR
that we were able to replicate using a value of 1265 As shown in Figure 2-1 reducing the
value from 14 for an air cycle (where the gas in the cylinder contains only air) to 1265 for a
stoichiometric air-fuel mixture reduces the indicated efficiency by 14 to 15 absolute across
the range of CR values from 8 to 16
6
Figure 2-1
However as pointed out by Muranaka et al (Ref 2) the percentage effect of a unit change in
CR on thermal efficiency is always higher on the air-fuel cycle than on the air cycle since it starts
at a much lower value of efficiency This is shown in Figure 2-2 increasing the CR by 1 unit
from 9 improves indicated thermal efficiency by 373 relative percent5 and from a base of 11 CR
indicated thermal efficiency increases by 27 relative percent using idealized equations for an
air-fuel cycle However consideration of all of the losses in real engines leads to a somewhat
different relationship between indicated efficiency and CR
No ideal equation exists to relate the engine ONR to the compression ratio as this relationship is
defined by a number of engine design and operating variables including combustion chamber
shape and size spark plug location cylinder head and wall temperatures intake air temperature
etc (As before the list is intended to be illustrative not comprehensive) The relationship of
engine ONR to these variables has been established empirically for specific engine designs but
no simple theoretical relationship has been determined However a key mechanism used to
5 The term ldquorelative percentrdquo is used to denote the percent change in percent efficiency If absolute efficiency changes from 40 to 44 the 4 absolute change would equate to a 10 relative change
3500
4000
4500
5000
5500
6000
6500
7000
7500
7 8 9 10 11 12 13 14 15 16 17
Indicated Efficiency
Compression Ratio
Ideal Indicated Efficiency vs CR
Air Cycle
AF Cycle
7
Figure 2-2
control knock in SI engines is the spark timing which impacts the peak and average cycle
pressure and hence the torque output of the engine as well as its efficiency Maximum torque at
any operating point (and hence maximum efficiency) is obtained at MBT spark timing and any
spark timing retard from this MBT timing normally measured in crank angle degrees before
TDC causes a reduction in torque as well as a reduction in the engine octane number limit that
we have termed as ONL for convenience
It should be noted that as spark timing changes at constant RPM and wide open throttle total air
flow may be affected in a minor way due to changes in residual gas temperatures but the
following discussion assumes that the changes in volumetric efficiency and heat transfer with
spark timing can be neglected to provide the following approximation at WOT for any spark
timing relative to MBT conditions
IMEP()IMEP (MBT) ()(MBT)
where is the indicated efficiency The IMEP is the indicated mean effective pressure or the
cylinder pressure averaged over the compression and expansion stroke which is one revolution of
the engine (360)
000
050
100
150
200
250
300
350
400
450
500
7 9 11 13 15 17 19 21
Chan
ge in
Efficieny per CR
Compression Ratio
Theoretical Change in Efficiency per Unit CR Increase
Air Cycle
Fuel Air Cycle
8
The change in mean effective pressure as a function of spark timing is well understood as is the
nature of the relationship (Heywood Section 91 Ref1) A recent study at MIT (Ayala Gerty
and Heywood Ref3) provided a robust relationship between spark timing as measured in
degrees retard from MBT timing to Net Indicated Mean Effective Pressure (NIMEP) NIMEP is
the term used to describe average cylinder pressure over the entire two revolutions (720) of the
Otto cycle and is equal to IMEP ndash PMEP where PMEP is the pumping mean effective pressure
The authors developed a new combustion parameter that related the NIMEP at any spark timing
to the NIMEP at MBT spark timing with the formula
1 ndash NIMEP()NIMEP(MBT)= 0168 (( 1 + 0004443(50 - 50 mbt)2) 05 ndash 1)
Where 50 is the crank angle at 50 mass burn fraction and 50 mbt is the crank angle of the 50
mass burn fraction at MBT spark timing with the difference between the two variables termed
combustion retard The correlation was found to hold across a wide range of loads speeds and
air-fuel ratios This equation is difficult to use in practice since the 50 burn durations are not
known a priori Considering only stoichiometric air-fuel ratios and WOT operation the
combustion retard is closely correlated with spark retard from MBT and the data in Figure 2 of
the MIT paper for this condition were fitted to a quadratic with the resulting fit
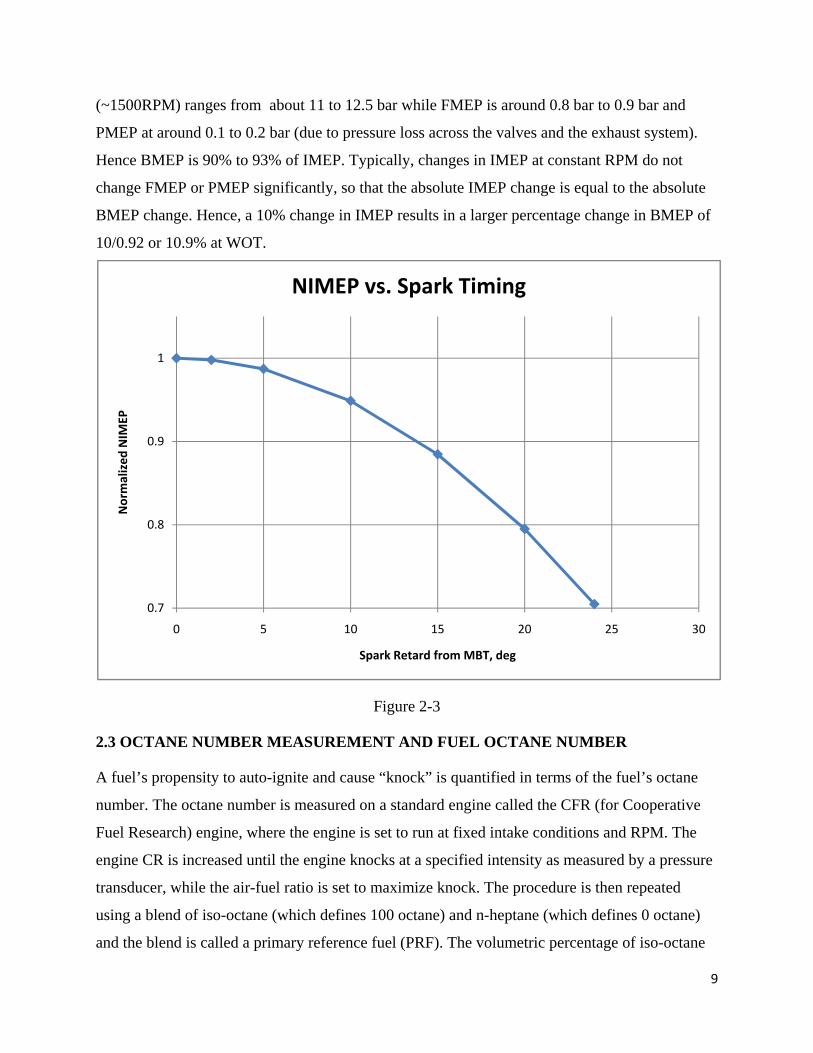
()(MBT) = IMEP()IMEP(MBT) = 1 ndash 0512510-3 (s - s mbt)2 (2)
wheres is the spark timing and s mbt is the MBT spark timing This equation assumed that at
WOT NIMEP is approximately equal to IMEP since pumping losses are quite small typically
less than 2 of IMEP The curve fit in Figure 2-3 shows that a 10spark retard from MBT timing
results in a 51 relative loss in efficiency and a 20 degree retard reduces relative efficiency by
205 Hence small changes in spark timing from MBT have very small efficiency effects but
the non-linear nature of the relationship shows that retard over 10 can cause significant losses in
efficiency
The following sections of this report utilize the relationship (Heywood Section 132 Ref 1)
IMEP = BMEP + FMEP + PMEP (3)
where MEP is the mean effective pressure and I B F and P stand for Indicated Brake Friction
and Pumping respectively Data presented in Ref1 shows that the IMEP of most modern
naturally aspirated engines at wide open throttle stoichiometric operation at low RPM
9
(~1500RPM) ranges from about 11 to 125 bar while FMEP is around 08 bar to 09 bar and
PMEP at around 01 to 02 bar (due to pressure loss across the valves and the exhaust system)
Hence BMEP is 90 to 93 of IMEP Typically changes in IMEP at constant RPM do not
change FMEP or PMEP significantly so that the absolute IMEP change is equal to the absolute
BMEP change Hence a 10 change in IMEP results in a larger percentage change in BMEP of
10092 or 109 at WOT
Figure 2-3
23 OCTANE NUMBER MEASUREMENT AND FUEL OCTANE NUMBER
A fuelrsquos propensity to auto-ignite and cause ldquoknockrdquo is quantified in terms of the fuelrsquos octane
number The octane number is measured on a standard engine called the CFR (for Cooperative
Fuel Research) engine where the engine is set to run at fixed intake conditions and RPM The
engine CR is increased until the engine knocks at a specified intensity as measured by a pressure
transducer while the air-fuel ratio is set to maximize knock The procedure is then repeated
using a blend of iso-octane (which defines 100 octane) and n-heptane (which defines 0 octane)
and the blend is called a primary reference fuel (PRF) The volumetric percentage of iso-octane
07
08
09
1
0 5 10 15 20 25 30
Norm
alized NIM
EP
Spark Retard from MBT deg
NIMEP vs Spark Timing
10
is adjusted until a PRF is found that knocks at the same intensity at the same CR as the fuel
whose octane number is being measured The octane number of the fuel is equal to the
percentage of iso-octane of the PRF that has the same knocking tendency The PRF is a
combination of paraffins but the octane number of typical hydrocarbon fuels depends on the test
conditions since olefin and aromatic hydrocarbons found in commercial gasoline do not have the
same temperature dependence to auto-ignition as paraffins Hence the octane number is
measured at two test conditions one termed ldquoResearch Octane Numberrdquo (RON) test which
specifies a 52 C intake air temperature and an engine speed of 600 RPM with a fixed spark
timing of 13 degrees before top dead center The second test condition is termed ldquoMotor Octane
Numberrdquo (MON) test which specifies a 149 C intake air temperature and an engine speed of 900
RPM with spark timing varied set as a function of CR Under both test conditions air-fuel ratio
is varied to maximize knock By definition the RON and MON of a PRF are numerically the
same Octane numbers higher than 100 are measured using a mix of iso-octane and tetra-ethyl
lead (TEL) and a mixture containing 6 ml gallon TEL has an octane number of 1203
Modern engines do not resemble the CFR engine and the measurement conditions do not
represent typical engine intake air temperatures cylinder pressures or operating RPM These
conditions of RPM pressures and intake air temperature in modern engines are very different
Most modern SI engines operate between 1000 to 5000 RPM during normal driving and intake
air temperatures are close to ambient In addition the combustion chamber shape and air
turbulence in the chamber in modern engines promote substantially faster burn rates than in the
CFR engine Hence the relationship between CR and fuel octane number could be substantially
different for modern engines
The relevance of RON and MON ratings to modern engines have been examined at the research
engine production engine and vehicle levels by a number of papers and a new rating termed
octane index has been derived The basic principle is that the octane index (OI) of a fuel for
modern engines can be expressed as a linear combination of the RON and MON values with K
as the weighting factor such that
OI = (1-K)RON + K MON (4)
11
Equation 4 can be rearranged as
OI = RON ndash K(RON ndash MON)
= RON ndash K S (5)
The term (RON ndash MON) in Equation 5 is called the Sensitivity6 S of the fuel In a study by
Shell (Kalghatgi 2001 Ref 4) 21 fuels with a wide range of RON and MON were tested on two
single-cylinder engines with PFI and a more modern combustion chamber configuration and a
CR of 105(CR was reduced to 8 for some tests in one engine) The spark timing was advanced
until a limiting level of knock was reached with each fuel and the engine brake torque and knock
intensity were measured The study found that the engine torque increased with spark advance
flattening out at a maximum value at the MBT spark level and declining with further increases in
spark advance as predicted by Equation (2) Many fuels had too high a knock intensity at levels
of spark advance much less than the MBT level so that they were tested only to the knock limit
Figure 2-4
6 The capitalized word ldquoSensitivityrdquo in this report is used to denote the difference between RON and MON
80
85
90
95
100
105
110
‐4 ‐2 0 2 4 6 8 10 12
OCTA
NE NUMBER
KLSA at 1200 RPM DEGREES
OCTANE NUMBER vs KLSA
OI
RON
MON
Linear (OI)
Linear (RON)
12
Figure 2-5
The analysis found that the knock limited spark advance was poorly correlated with a fuelrsquos
MON and better correlated with RON but the best correlation was with the fuel OI Figure 2-4
shows the correlation of the different octane ratings with KLSA for one engine at 1200 RPM K
as defined in the equation above was determined for each RPMload test condition and was
found to be negative at low RPM (lt2000) and high load K increased with RPM but decreased
with increased CR and load The K value at any speedload condition appeared to be largely
independent of fuel type or RON The result of a negative K value is that for a fuel with
Sensitivity (S)gt0 the OI is greater than either the RON or MON of the fuel
K was found to decrease with increasing ONR of the engine at the different speedload and CR
values evaluated so that as the ONR of the engine increased K became more negative In a
follow on study by Shell and Toyota (Kalghatgi Nakata and Mogi Ref 5) with DI engines
operating at a CR of 11 and 125 the improved relationship of KLSA to the OI of the fuel
relative to the relationship with either RON or MON was confirmed although the paper reported
a quadratic relationship between KLSA and OI The fit may have been due to some high octane
number fuels used in this study that permitted the OI to meet or exceed the octane number
85
90
95
100
105
110
115
‐05 ‐04 ‐03 ‐02 ‐01 0 01 02 03 04
OCTA
NE NUMBER
REQ
UIREM
ENT
K FUEL SENSTIVITY WEIGHTING FACTOR
OCTANE NUMBER REQUIREMENT vs K
PFI
DI
Linear (PFI)
Linear (DI)
13
requirement of the high CR engine Figure 2-5 shows the relationship between K and the engine
ONR and there is a general trend for K to be more negative with increasing ONR but the data
scatter on K is apparent suggesting that K is influenced by other factors such as engine
combustion chamber design as well
Figure 2-6 shows the KLSA as a function of the OI of the fuel for a DI engine with 125 CR
(from Ref 5) and the departure from linearity is obvious for the high OI fuels while the linear fit
Figure 2-6
is quite good for the low OI fuels As the fuelrsquos OI approaches engine ONR it appears that
knock limited spark advance increases rapidly and the quadratic relationship is similar to that
observed between engine torque and spark advance ie both engine torque and knock become
less sensitive to spark advance when the fuelrsquos octane index is close to the engine ONR and
timing is close to MBT
The finding that K was negative for modern engines was validated by tests at MIT (Mittal and
Heywood 2008 Ref 6) conducted on a single cylinder engine with a CR of 98 at 1500 RPM
‐5
0
5
10
15
20
85 90 95 100 105 110 115
KLSA D
EGREES
OCTANE INDEX
KLSA at 2000RPM vs OIDI ENGINE WITH CR=125
KLSA LOW OI FUELSKLSA NEAR ENGINE OR
14
WOT and a of 1 Tests were conducted on fuels with almost similar RON of about 96 but with
MON values ranging from 875 to 96 The KLSA was found to increase linearly with increasing
fuel Sensitivity (decreasing MON) K was also found to increase with RPM similar to the
finding by Kalghatgi (Ref 4) When we plotted K against 1RPM (or time per revolution) for
both the MIT and Shell data sets a linear dependence of K was observed but the dependence
with RPM was different for the two engines as shown in Figure 2-7 In this case 20ms
corresponds to 3000 RPM while 50ms corresponds to 1200 RPM
Figure 2-7
The reduction in K implies that the RON rating is most important at lower RPM while the MON
becomes a factor in knock resistance at high RPM The MIT analysis also found that K was
- Only weakly dependent on spark plug location and CR (varying from 98 to 134)
- Non-linearly dependent on air-fuel ratio being highest at lambda = 1 but decreasing
at both richer and leaner air-fuel ratio
- Increased linearly with intake air temperature
- Decreased almost linearly with increased intake air pressure (boost)
‐06
‐05
‐04
‐03
‐02
‐01
0
01
02
03
15 20 25 30 35 40 45 50 55
K
TIME PER REVOLUTION MILLISECONDS
K (OCTANE WEIGHTING FACTOR) vs 1RPM
K(MIT)
K(SHELL)
Linear (K(MIT))
Linear (K(SHELL))
15
The finding that K decreases with intake boost is particularly interesting since it implies that
sensitive fuels are well suited to turbocharged engines as their OI is significantly higher than the
RON of the fuel The MIT paper indicated that at a boost level of 14 bar the K value was -065
For a typical retail gasoline with a Sensitivity of about 10 octane numbers the MIT estimate
indicates that the OI is 65 numbers above the RON at this boost level
In a subsequent paper Mittal and Heywood (2009 Ref 7) examined the historical relevance of
RON and MON based on the results from CRC octane number surveys from 1950 to 1990 where
identical tests had been performed to determine vehicle OI with primary reference fuels and full
boiling range fuels K was determined by the equation
K = (RON ndash ON) S (6)
Where RON is the research octane number for the full boiling range fuel and S its Sensitivity
and ON is the octane number of the primary fuel The computations showed that K values had
decreased over time with average K values declining from 028 in 1951 to just under 01 in 1991
This was in spite of the fact that the average knock-limited engine speed increased from 1500
RPM in 1951 to about 2400 in 1991 as K increases with increasing RPM The paper suggested
that increasing CR the reduction of intake air temperature by eliminating intake air pre-heat
improved volumetric efficiency improved engine cooling and decreased bore size were the
contributing factors Simulation modeling of typical engine designs for a 1951 engine and a
modern turbocharged engine supported the calculated values of K The authors suggested that
with the use of DI and turbo-charging K would decline further In an earlier review paper
Kalghatgi (2005 Ref9) came to a similar conclusion suggesting that future engines would avoid
knock using fuels with a lower MON and higher RON
A 2011 paper by Toyota (Sasaki et al Ref37) supports the view that higher MON will continue
to be required in the future to avoid other forms of abnormal combustion The study investigated
pre-ignition due to hot spots by controlling the spark plug center electrode temperature Two
engines were used in the study one a DI engine with a CR of 115 and the second a PFI engine
with a CR of 15 The second engine was used to simulate the cylinder pressures under boosted
conditions for a turbocharged engine the high CR was chosen to obtain better control of cylinder
pressure as in a turbocharged engine the boost pressure varies with spark timing Three
gasolines with different RON and Sensitivity and 15 specific hydrocarbon compounds covering a
16
range of paraffin olefin and aromatic compounds were tested The study confirmed that near
linear relationship of engine torque with fuel RON at 4400 RPM WOT However the study
found that pre-ignition occurs at much lower hot spot temperatures in the high CR engine and
that the pre-ignition temperatures for this engine with the different fuels showed MON to have a
stronger relationship than RON to pre-ignition temperature The study found that increasing
MON by 16(ie from 80 to 96) resulted in pre-ignition temperature increasing by about 200
C The coefficient of determination (R2) of pre-ignition temperature with MON was 093 while it
was only 066 with RON Hence the study concluded that a higher MON was useful in
suppressing hot spot related pre-ignition
24 FUEL COMPOSITION EFFECTS ON OCTANE NUMBER AND EFFICIENCY
Retail fuels for SI engines are a mixture of aromatic paraffin and olefin compounds and can
also include oxygenates like ethers and alcohols The compounds can influence octane number
and fuel efficiency of engines differently since they have different combustion kinetics and
different flame speeds in mixtures with air
A chemical kinetic modeling study by Mittal Heywood and Green (Ref8) concluded that the
auto-ignition chemistry for modern engines occurs in the transition between high temperature
and low temperature combustion regimes corresponding to end-gas temperatures between 500C
and 625C Fuels with higher octane Sensitivity have a stronger temperature dependence of the
auto-ignition delay time which results in slower low temperature combustion and faster high
temperature combustion Modern engines operate with end gas temperatures well below the high
temperature regime where sensitive fuels are less prone to auto-ignite Hence fuels with higher
Sensitivity will be less prone to auto-ignite (ie will show higher octane numbers) when this is
the case
In a review paper Kalghatgi (Ref 9) speculates that the RPM dependence of K could be the
result of a reduction in heat transfer due to less time available and hence resulting in an increase
in mixture temperature and an increase in the pressure rise rate As the end-gas temperature
increases the conditions become closer to those for the MON test and the importance of the
MON increases making K more positive Akihama et al (Ref10) find that paraffin compounds
have high auto-ignition resistance at higher temperatures where the kinetics of paraffin
decomposition have a negative temperature coefficient Hence the reference fuels which are a
17
mixture of paraffin compounds are more resistant to knock at MON conditions than fuels
containing olefin and aromatic compounds At conditions closer to those of the RON test the
olefin and aromatic compounds have better knock resistance and mixtures containing higher
olefin and aromatic compounds can have an octane number higher than the octane number of the
reference fuel leading to a negative K
In an analysis of fuel effects over a range of air-fuel ratios an ExxonMobilToyota paper
(Farrell et al Ref 11) examined the burning velocities of fuels with different mixtures of
aromatic olefin and paraffin compounds at values ranging from 1 to 17 The paper reported
that laminar burning velocities varied by more than 11 between the slowest and fastest fuels
and that burning velocities correlate well with olefin content and higher fuel volatility
Figure 2-8
Figure 2-8 shows the burning velocity of two fuels as a function of air-fuel ratio and that the
burning velocity increases by a factor of 3 between at 09 to 16 Fuel 2 had a 35 aromatic
and 25 olefin content while Fuel 3 had a 35 aromatic and a 8 olefin content Tests of these
0
01
02
03
04
05
06
07
070 090 110 130 150 170 190
BURNING VELOCITY (ms)
LAMBDA
BURNING VELOCITY vs LAMBDA
Fuel 2
Fuel 3
18
fuels on an engine operating at WOT 2400 RPM and = 1 showed that fuels with high burning
velocities gave up to 3 higher torque at the same spark advance The faster burning fuel also
allowed higher spark advance at the knock limit
25 LATENT HEAT OF VAPORIZATION
In PFI engines much of the fuel is inducted into the cylinder after it has vaporized due to heat
transfer from the engine In DI engines the fuel is introduced into the cylinder in liquid form
vaporization of the fuel causes a reduction in the air-fuel mixture temperature relative to mixture
for a PFI engine thereby reducing the octane number requirement of the engine The latent heat
of vaporization for gasoline is estimated at 420 kJkg and varies somewhat depending on
gasoline composition However the introduction of ethanol has a particularly large effect on
temperature as it has a latent heat of vaporization(LHV)which is approximately double that of
gasoline per unit weight at 845 kJkg as reported by Toyota (Nakata et al 2006 Ref 12) In
addition the stoichiometric air-fuel ratio for ethanol is 90 compared to 145 to 147 for gasoline
so that a larger quantity of ethanol is required at stoichiometric conditions for a given volume of
air Ethanol also has a RON of 111 giving it high knock resistance Others have quoted much
higher numbers and an MIT paper (Bromberg and Cohn Ref 13) cited the RON as 129 and the
MON as 102 (which are blending octane numbers) and list the latent heat of vaporization as 910
kJkg However ethanol air mixtures have lower flame speeds than gasoline air mixtures
In a PFI engine the vaporized ethanol volume (to the extent that the ethanol is vaporized before
induction into the cylinder) displaces air and reduces the air volume relative to the air volume
with gasoline so that the engine volumetric efficiency is reduced When used in a DI engine
there is virtually no air displacement effect and the charge cooling due to ethanolrsquos higher LHV
results in volumetric efficiency improvements In the study of knock behavior in a turbocharged
DI engine Milpied et al (Ref 31) compute a ldquocooling powerrdquo value defined as latent heat of
vaporization air-fuel ratio at stoichiometric conditions They used latent heat of vaporization
values of 335 kJkg for gasoline and 910 kJkg for ethanol so the cooling power for ethanol is
44 times that of gasoline while the 845 kJkg value cited above suggests a cooling power
improvement by a factor of 31A paper by Brewster (Ref 33) shows that if all the heat of
vaporization is taken from the air the temperature drop with gasoline is about 20C while the
drop with ethanol is about 90C (using latent heat values closer to those of Ref 31)
19
While ethanol has a lower energy density relative to gasoline the larger quantity of ethanol
required for a stoichiometric mixture with air results in the energy density of the ethanol -air
mixture being only 1 to 2 lower than a stoichiometric gasoline air mixture Hence the use of
ethanol can create some power loss in a PFI engine if most of the fuel enters the cylinder after
vaporization but can result in a power gain in a DI engine due to the colder mixture with ethanol
fuel The power loss or gain does not directly impact engine efficiency but can have secondary
impacts on vehicle efficiency if the power changes are accounted for by changes in engine size
or gear ratio
20
3 NATURALLY ASPIRATED ENGINES
31 ACTUAL ENGINE EFFICIENCY
While the idealized relationship between efficiency and CR was developed in the previous
section real engines have a number of losses that result in the actual indicated efficiency being
much lower than predicted by the ideal cycle relationship Muranaka et al (Ref 2) at Nissan
have estimated the factors that reduce indicated efficiency as follows
- Cooling losses which occur due to heat transfer from the combustion chamber to the
coolant
- Time loss which accounts for the fact that combustion is not instantaneous but occurs as
the piston is moving
- Unburned fuel loss which accounts for portion of fuel that is exhausted as a hydrocarbon
or a product of partial combustion
The analysis developed from detailed simulations in Ref 2 shows that as cylinder volume is
reduced the indicated efficiency decreases At a compression ratio of 9 indicated efficiency
decreases from almost 40 at 2000 cc swept volume to about 36 at 200cc which is a 10
relative loss in indicated efficiency (440) The analysis also found that heat transfer losses and
indicated efficiency reductions were linearly proportional to the combustion chamber surface to
volume ratio
The effect of combustion occurring over a finite time period was also evaluated in Ref 2 and the
authors found unlike historical assumptions that instantaneous combustion would result in the
highest efficiency a combustion duration of 30 crank angle degrees (CAD)was optimal at
shorter durations the higher pressure and temperature resulted in higher heat loss offsetting the
improvement from reduced time loss However the shape of the efficiency curve as a function of
combustion duration shows a broad and relatively flat peak over the 0 to 40 CAD range and the
shape is relatively independent of CR changes over this CAD range
The effect of unburned fuel was also estimated as a function of engine out HC emissions and an
engine out emissions of 3000 ppm HC was equivalent to 2 unburned fuel at = 1 HC
21
concentration increases with decreasing bore size and increasing CR but no specific
relationships were given Estimates of unburned fuel range from 25 to 5 for current engines
but this may be larger for high CR engines and especially for the combination of high CR and
small cylinder size In general available literature treats this effect empirically by multiplying
the engine efficiency computed assuming complete combustion by 096 or 097 as a combustion
efficiency parameter cA smaller value may be required for small bore and high compression
engines
In an attempt to provide a unified estimate of actual efficiency we used the air-fuel cycle
efficiency as a starting point and examined the cooling loss effect for the simplified example of a
disc shaped combustion chamber The surface to volume ratio (SV) of a disc shaped combustion
chamber of height Land bore size b is given by
SV = (b22 +bL) (b2L4) (7)
The combustion chamber height L can be related to the stroke s and compression ratio CR by
CR = L+s L or L = s (CR-1)
Substituting the above expression for L in equation(1) for SV gives
SV = (2(CR-1)s + 4b) or
SV = 2b ((CR-1)bs + 2) (8)
In many modern engines the bore and stroke are very nearly equal (sometimes referred to as a
ldquosquarerdquo engine) and for bs 1 equation (2) simplifies to
SV = 2(CR+1)b (9)
In equation 9 any decrease in bore size also results in displacement reduction due to the
assumption that b = s Since the simulation models show that cooling loss is linearly proportional
to the SV ratio we utilized the following model to fit the actual measured data
HT = (1- A(CR + 1)b) (10)
I = t (1- A(CR + 1)b) c (11)
Where ithe indicated efficiency of a real engine t the ideal cycle efficiency for = 1265 as
described in Section 2 HTthe heattransfer related factor A a constant and c the combustion
22
efficiency parameter In Reference 2 Nissan reported data on two engines one with 500cc swept
volume and the other with 250cc swept volume The bore and stroke were not reported in the
paper and b was computed assuming the bore and stroke were equal so that bore sizes were
86mm for the 500cc engine and 6825mm for the 250cc engine
The fit of this equation to the actual data at 1500 RPM proved to be excellent for constant A =
113mm and c = 096 for the 500cc engine and 095 for the 250cc engine (which is consistent
with the concept that smaller bore engines have higher unburned fuel loss) The same value of c
was used for all compression ratios and we assume that the CR dependence of c has been
subsumed into the heat transfer loss constant k The table below shows the computed efficiency
from the equation to the actual data points (as estimated from the figure) reported by Nissan
Compression
Ratio
Computed
500cc engine
Reported
500cc engine
Computed
250cc engine
Reported
250cc engine
8 3579 358 3425 342
9 3673 3675 3500 350
10 3743 374 3549 356
12 3832 383 3596 359
14 3870 387 3592 Not reported
The relationship of indicated efficiency to CR for the two engines derived above is shown in
Figure 3-1 and the impact of bore size reduction is significant ndash at a CR of 13 the smaller
engine has an efficiency that is 67 (relative) less than that of the larger engine (36 vs 386
absolute) The marginal benefit of a unit increase in CR from 9 to 10 is only 15 and the
equation projects that for engine sizes of 250cc cylinder increasing CR beyond 13 has no
benefit to efficiency The three auto-manufacturers interviewed for this project stated that their
own experience with a 75mm bore engine showed an efficiency maximum at a CR of about 135
to 14 somewhat higher than predicted by this equation
23
Figure 3-1
Ayala Gerty and Heywood from MIT (Ref 3) also plot the increase in NIMEP (IMEP at
WOT) with CR for an engine with an 83mm bore Their paper reports a quadratic curve fit as
NIMEP(NIMEP)98 = 0126 + 0137CR ndash 000487(CR)2 (12)
The fit appears to be based on only three data points at 98 116 and 134 CR the reported
baseline gross efficiency of 390 at 98 CR closely matches the estimate from the equation
derived above without the combustion efficiency parameter and this parameter is not referenced
in the text of the MIT paper However the rate of change of efficiency implied by the quadratic
fit in Equation 12from a CR of 10 to 11 is 345 relative which is much higher than estimated
by Equation 11 and the quadratic estimates a sharp efficiency peak at a CR of 1407 The high
rate of change and peak at 1407 CR implied by the quadratic are not supported by data from
other papers However the consensus view of the three auto-manufacturers consulted was that
3400
3450
3500
3550
3600
3650
3700
3750
3800
3850
3900
7 8 9 10 11 12 13 14 15 16 17
Indicated Efficiency
Compression Ratio
Indicated Efficiency vs CR Nissan Engine Data
86mm bore
6825 mm bore
24
increasing the CR from 10 to 11 would yield about 2 relative efficiency increase Even the
simulations in Reference 2 show significantly higher improvement in thermal efficiency with the
500cc engine showing a 12 relative increase in efficiency with CR increasing from 9 to 16
compared to about 8 from the fit to the measured data points
While there is limited data on absolute efficiency changes with CR from modern engines at
WOT there is more data at part load points Both the Nissan and MIT papers show that the
absolute value of indicated efficiency decreases with decreasing load For example the MIT
paper projects that indicated efficiency declines from about 35 absolute at 8bar1500RPM to
about 33 absolute at 2bar1500 RPM at a lambda of 1 However the relative changes in
indicated efficiency with load were found to be very similar over a range of CR values so that the
normalized changes should be indicative of the change in efficiency at WOT
A comprehensive analysis of the impact of RON and engine thermal efficiency was conducted
by Nakata et al (Ref 15) on naturally aspirated PFI engines one with an Atkinson Cycle and
the second with a normal Otto Cycle Both engines were dimensionally identical with a 75 mm
bore and 847 mm stroke and had a CR of 13 but the Otto cycle engine was also tested at a CR
of 10 Tests on two gasolines with a RON of 915 and 996 respectively were conducted at a
range of loads at 2000 RPM As shown in Figure 3-3 below the higher CR on the Otto Cycle
results in a significant increase in part load efficiency even with the 92 RON gasoline but spark
retard at full load on the 13 CR engine to prevent knock while operating on the 915 RON
gasoline results in brake efficiency levels below those of the 10 CR engine With the 996 RON
gasoline the 13 CR engine was knock limited only at full load but allowed peak thermal
efficiency to improve by 15 relative to the peak efficiency of the 10 CR engine The benefits of
higher RON gasoline to efficiency with the Atkinson Cycle engine (not shown in the figure
below) were much smaller since the effective CR is much lower than the geometric CR of 13
A more recent paper by Nakata et al of Toyota (Ref 15) showed a 9 relative increase in
brake thermal efficiency when CR was increased from 98 to 13 in a 885mm bore size engine or
a 28 increase per CR at a BMEP of 02 MPa Even allowing for the fact that brake thermal
efficiency increase can be higher than indicated efficiency increase the difference cited in both
Toyota papers is larger than that shown by Nissan engine data
25
20
22
24
26
28
30
32
34
36
38
40
0 02 04 06 08 1 12
Brake
Therm
al Efficiency
BMEP Mpa
Effect of CR and RON on Efficiency
CR = 10 915RON
CR = 13 915 RON
CR = 13 996 RON
Figure 3-2
Similarly a paper by Munoz at al of Ford (Ref 14) showed indicated efficiency at 3 part load
points for a PFI engine with a bore size of 89mm from a CR of 85 to a CR of 11 and indicated
efficiency rises by 9 to 10(relative) over the range (See Figure 3-3)The trend line shows a
09 to1 increase in absolute efficiency per unit CR increase or about a 3 increase in relative
efficiency per unit CR increase
Based on the higher sensitivity of efficiency to CR reported by the Toyota and Ford papers we
modified the heat transfer loss HT to fit the simulated efficiency values reported in Reference 2
without the combustion efficiency factor so that the equation was modified to
HT = 096 (1- A(CR + 1)b) (12)
where the 096 factor was incorporated to model heat transfer loss independent of combustion
surface-to-volume ratio and constant A was estimated to be 08mm
26
Figure 3-3
The equation yielded a good fit to the simulated results in Reference 2 over the CR range from 9
to 14 at 1500 RPM but appeared to underestimate the benefit of CR at values over 14 The
computed efficiency versus CR and the marginal benefit of CR increases computed using this
equation for heat transfer in Equation (4) are shown in Figures 3-4 and 3-5 respectively The
marginal benefit is of particular interest to the study and the projected benefit increasing CR
from 10 to 11 is around 2 (relative)for the larger bore engines consistent with auto-
manufacturer inputs on this issue In addition the benefits of increasing CR beyond 14 are less
than 05 per unit increase for small bore engines and small increases in friction with increasing
CR could eliminate this benefit in indicated efficiency The marginal benefits should be
applicable over a range of loads at 1200 to 2000 RPM indicated efficiency increases at higher
RPM especially at higher compression ratio Reference 2 reported that indicated efficiency
increased by 3 (relative) at 3000 RPM and 5 (relative) at 6000 RPM relative to the value at
1500RPM at a CR of 14 However at a CR of 9 the increases at higher RPM were negligible
The higher engine speeds affect the cooling loss due to reduced time for heat transfer and
become significant when cooling loss ratios are high ie for higher SV ratios
32
33
34
35
36
37
38
8 9 10 11 12 13
Indicated Efficiency
Compression Ratio
Efficiency at Part Load vs CR
1bar1500RPM
2bar2000RPM
26bar1500RPM
Linear (1bar1500RPM)
Linear (2bar2000RPM)
27
Figure 3-4
Figure 3-5
34
35
36
37
38
39
40
41
7 8 9 10 11 12 13 14 15 16 17
Indicated Efficiency
Compression Ratio
Indicated Efficiency vs CR at 1500 RPM
86mm bore
6825 mm bore
Bore = Stroke
‐050
000
050
100
150
200
250
300
350
7 8 9 10 11 12 13 14 15 16 17
Chan
ge In
Efficiceny per CR In
crease
Compression Ratio
Relative Efficiency Improvement Per Unit CR Increase at 1500 RPM
86mm Bore
6825mm Bore
1006mm Bore
Bore = Stroke
28
It should also be noted that none of the papers reviewed suggest that the method of fuel induction
affects the indicated efficiency ie port fuel injection or direct injection should have the same
indicated efficiency if all other factors such as bore size CR and RPM are held constant
32 ENGINE OCTANE NUMBER LIMIT AND SPARK ADVANCE
It is well known that the actual engine ONR is a function of many engine design variables but is
primarily a function of the engine CR spark timing and operating point (speed and load) and to
a somewhat lesser degree a function of the engine bore size and air-fuel ratio In general the
engine ONR is defined as the octane number of the PRFthat allows the knock limited spark
advance (KLSA) timing to equal the MBT spark timing at wide open throttle and is a function of
the RPM for a given engine Because of the multivariate nature of the relationship and the fact
that spark timing is the primary control variable used to tune the engine for a particular octane
number fuel the relationship between fuel octane number and spark advance is first detailed
Spark retard from MBT timing reduces the tendency to knock at a given fuel octane number and
the relationship between the level of timing retard and fuel octane number has been extensively
studied by Shell (Kalghatgi Ref 4) Tests conducted on a single cylinder engine with a 4-valve
pent roof combustion chamber (fuel system not documented but appears to be port fuel injected)
and a CR of 105 with a variety of fuels provide the relationship between KLSA and fuel octane
index (defined in Section 23) as shown in Figure 3-4The figure shows a very linear relationship
between fuel octane number and spark advance with the last data point close to spark advance at
MBT The MBT level was indicated as 9 at 1200 RPM with an engine ONR of 1051 and 125
at 3000 RPM with an engine ONR of 1033 so that both the KLSA and ONR of the engine are
strong functions of RPM The 1200 RPM data provides a relationship of spark advance to OI of
about 1 degree per octane number while the 3000 RPM data provides a relationship of 1 degree
per 3 octane numbers The same paper also provided data on an engine with a smaller bore size
of 75mm and the data at 1200 RPM is shown in Figure 3-5 below While the ONR of this engine
at 1200 RPM is given in the paper as 102 at a MBT timing of 14 degrees one data point at an OI
of 1053 and a KLSA of 205 is provided suggesting further increases in spark timing beyond
ONR and is plotted separately
29
Figure 3-4
‐5
0
5
10
15
20
25
94 96 98 100 102 104 106 108
Spark Timing BTD
C deg
Fuel Octane Index
Fuel Octane Index vs Spark Timing BTDC (=1) 1200 RPM
86mm bore
75mm bore
75 mmgtMBT
Linear (86mm bore)
Linear (75mm bore)
Figure 3-5
‐4
‐2
0
2
4
6
8
10
12
14
92 94 96 98 100 102 104 106 108
Spark Timing BTD
C d
eg
Fuel Octane Index
Fuel Octane Index vs Spark Timing BTDC (=1)
KLSA at 1200RPM
KLSA at 3000RPM
30
These data suggest the KLSA vs OI relationship extends beyond the MBT spark level but the
data presented in Section 2 and Figure 3-5 suggest that relationship is not linear at spark timings
close to MBT The smaller bore engine also appears to have a higher spark timing coefficient of
14 degrees per octane number Similar tests conducted at Ford (Russ Ref16) on a single
cylinder PFI engine with a 4 valve head bore size of 902mm and a CR of 10 showed that there
was a 5 to 6 degree difference in knock limited spark advance between two fuels with 97 and 91
RON (MON not given) showing the same coefficient of 1 degree advance per 1 octane number
increase found by Kalghatgi in Ref 4 but Russ (Ref 16) found this difference to be near
constant from 1000 to 3000 RPM He also cites other research confirming this 1 degree per 1
octane number coefficient
The analysis by Russ on the relationship of octane number to other variables in Ref 16 examined
the effect of CR on spark advance with a 91 RON fuel over the 1000 to 3000 RPM speed range
He found that the 91CR engine allowed about 5 to 6 degrees spark advance at KLSA over the
10CR engine with the plots essentially mirroring the plot of spark advance with RPM for the 97
and 91 RON gasoline Russ concludes that a unit increase in CR changed the engine ONR by
about 5 octane numbers and also cited work much older work by Caris and Nelson (Ref17) who
found that increasing the CR from 9 to 11 resulted in approximately a 9 octane number increase
in the engine OR Russ also examined the effect of enrichment on engine ONR He concluded
that the ONR is highest at = 095 and declines by 3 octane numbers for every 01 increase or
decrease from the 095 value
A similar study by Haghgooie (Ref 18) at Ford on a single cylinder 4-valve engine with 94mm
bore and a CR of 87 reported that the KLSA difference between a 91 and 97 RON fuel was
around 8 degrees at 1500 rpm and of 1 which is higher than the 1 degree per octane point
reported in other studies suggesting that the CR may affect the relationship as well His analysis
also found that increasing inlet air temperature by 60C resulted in KLSA being retarded by
about 8 degrees Mittal and Heywood (2008Ref6) at MIT examined the influence of octane on a
single cylinder 4 valve engine of 83mm bore at three different CR values of 98 118 and 134
(the engine being similar to the one used in Ref 3) The Mittal and Heywood study (Ref 6)
focused on the issue of octane index by testing fuels with several different MON values but
nearly identical RON values Testing conducted at 1500 RPM and 1 bar intake air pressure
31
(essentially at WOT) with a of 1 showed that a 4 increase in fuel octane index resulted in
KLSA being advanced by a little less than 6 degrees (CR not provided) which is more consistent
with the result from Haghgooie The relationship of KLSA to fuel OI was found to be linear In a
study by Millo et al (Ref19) using a production Fiat engine with a bore size of 864mm a CR
of 92 tests were conducted at a wide range of RPM at WOT and a of 09 At 2000 RPM the
KLSA difference between a 94 and 98 octane number PRF was about 7 and was nearly
constant to 4000 RPM where the difference was about 8 Hence the KLSA to ON relationship
appears to be higher on average than 1 degree per ON suggested with the other studies reporting
a sensitivity of 15 to 2 degrees spark advance per ON
It is not clear if some of these differences in the octane number to spark advance relationship are
due to differences in measurement methods since the specific knock intensity level which is
considered the ldquoknock limitrdquo is not precisely defined In addition the MBT spark advance is
difficult to determine precisely since the torque peak is broad and timing changes of plus or
minus 2 degrees may be observed in measurement of MBT spark advance as seen in Figure 2-3
These same concerns would apply to the measurement of ONR for a particular engine
33 ENGINE ONR
Due to the many factors affecting the ONR for a particular engine the data available do not have
the uniformity in test conditions and engine conditions to derive a robust relationship between
engine CR and bore size to octane number requirement Data from Kalghatgi (Ref4) offers the
most consistent series of measurements on the ONR and the data are shown in the table below
for tests conducted at WOT with a of 1 on port fuel injected engines
Engine Bore Size CR RPM KLSA(MBT) ONR
A 86 105 1200 9 1051
A 86 105 2000 12 1033
A 86 105 3000 125 1010
A 86 8 1200 15 881
B 75 105 1200 14 102
B 75 105 2000 15 964
32
The data for Engine A indicates that an increase of CR from 8 to 105 increases the engine ONR
by 17 or about 68 octane numbers per CR while a reduction in bore size by 11mm at the same
CR reduces the ONR by 31 octane numbers at 1200 RPM but nearly 7 at 2000 RPM As noted
in Section 32 the study by Russ(Ref 16) showed a KLSA sensitivity of about 5 to 6 for a 09
increase in CR which translates into a 4 to 5 octane number increase in his analysis In addition
the ONR declines by about 2 octane numbers per 1000 RPM increase for Engine A but by about
6 octane numbers per 1000 RPM for Engine B The paper by Millo et al (Ref 19) shows a
change in ONR of about 4 per 1000 RPM at constant spark advance but it is not clear if these
relationships are linear near MBT timing
Figure 3-6
A detailed study conducted by Nippon Oil and Nissan (Okamoto et al Ref 20) contrasted the
performance and ONR of the same engine over a range of CR values using DI and PFI and
provides the most extensive data on a controlled comparison between the octane number
requirements of DI and PFI engines The experimental engine had a 4-valve pent -roof
combustion chamber and 86mm bore diameter and tests were conducted at CR values of 105
12 135 and 15 Tests conditions were 1200 RPM at WOT and was set at 08 Figure 3-6
shows that at the same level of spark advance the ONL of the DI engine is 4 to 5 octane
88
90
92
94
96
98
100
102
0 2 4 6 8 10 12 14
OCTA
NE NUMBER
LIM
IT
KLSA DEGREES
Octane Number Limit vsKLSA CR = 105
PFI
DI
33
numbers lower than the ONL of the PFI engine Conversely at the same fuel octane number the
DI engine had a KLSA that was 5 to 6 degrees more advanced than the KLSA with PFI The
effect of this larger spark advance on torque is non-linear (as shown in Figure 2-3) so that the
increase in torque at low octane numbers with DI is quite large at 90 RON the DI system
provides about 15 increase in peak torque but at 96 RON the increase is about 9
The ONR for PFI and DI engines is shown in Figure 3-7 and except for one data point for the DI
engine at a CR of 12 the other data points indicate that DI has a 4 octane number reduction in
ONR at 105CRand the advantage increases with increasing CR No fuel with an ON over 114
was used so that the ONR for the PFI engine could not be determined but appears to be over 120
from linear extrapolation of the trend line (which may not be accurate if the trend is non-linear)
The 4 octane number reduction in ONR was confirmed by auto-manufacturers relative to current
CR values for PFI engines which are in the 10 to 105 range
Figure 3-7
90
95
100
105
110
115
120
10 11 12 13 14 15 16
ENGINE ONR
COMPRESSION RATIO
Octane Number Requirement for PFI and DI Engines
PFI
DI
Linear (PFI)
34
The Nippon OilNissan paper (Ref 20) also confirmed that brake specific fuel consumption of
PFI and DI engines were near identical at the same CR providing that both engines operated at
MBT (ie spark was not retarded due to knock) The data were generated at 40 Nm 80 Nm and
120 Nm torque values (which we estimate corresponds to about 25 50 and 75 of
maximum torque) and at 1200 and 2400 RPM Hence the thermal efficiency benefits of
increasing CR described in Section 31 of this report should apply equally to both PFI and DI
engines
A few other reports have provided ONR values for DI engines although many of the papers from
the late 1990sto early 2000s have also used prototype engines or early production DI engines In
a joint paper by Shell and Toyota (Kalghatgi Nakata and Mogi Ref 5) the ONR of a prototype
DI engine (unspecified bore size) was determined at different CR values of 110 and 125 over a
range of engine speeds from 1200 RPM to 6000 RPM At 1200 RPM the ONR at 11CR was
found to be 1068 and ata CR of 125 the ONR was found to be 1128 The values are
96
98
100
102
104
106
108
110
112
114
0 10 20 30 40 50 60
OCTA
NE NUMBER
REQ
UIREM
ENT
TIME PER REVOLUTION MILLISECONDS
OCTANE NUMBER REQUIREMENT vs 1RPM
CR = 11
CR = 125
Figure 3-8
significantly higher than those reported by Nissan especially considering that the ONR values
are at a of 085 which should reduce the requirement by 4 to 5 octane numbers relative to the
35
ONR at stoichiometric air-fuel ratio The relationship of ONR with the time per revolution
(inverse of RPM) appears to flatten out at low RPM as shown in Figure 3-8
In a study of fuel octane number effects on a DI engine by Toyota and ExxonMobil(Akihama et
al Ref 21) an engine with a CR of 13 and 86mm bore size was tested at 2000 and 4000 RPM
WOT and a of 087 with a range of fuels Although the ONR of the engine was not directly
determined the KLSA at 100 octane number (PRF fuel) was retarded by about 11 degrees from
MBT at 2000 RPM and by 6 degrees at 4000 RPM suggesting an ONR of about 106 to 107 at
2000 RPM and 103 to 104 at 4000 RPM This is about 2 to 3 octane numbers lower than the
ONR of the 125CR engine shown in the figure above consistent with the expectation of a 4 to 5
number ONR increase per CR In another study by the Cosmo Research Institute (Fukui et al
Ref 22) a Mitsubishi DI engine with an 81mm bore and a CR of 12 was tested with several
fuels Although the engine ONR was not explicitly determined the data show that the ONR at
1200 RPM is about 100 as isooctane allowed operation with MBT spark timing at borderline
knock conditions This ONR level is lower than those reported by the two papers cited above
A study by BP and Toyota (Williams et al Ref 28) reported on the efficiency as a function of
fuel octane number for a PFI Atkinson Cycle engine with a geometric CR of 13 According to
Toyota the actual CR is about 95 at 1500 RPM and 106 at 2800 RPM Tests at WOT and =1
show the engine to have maximum thermal efficiency at a fuel RON of 98 at 1300 RPM and
about 100 RON at 2800 RPM
The following ranges of ONR as a function of CR at low RPM (lt1500) for a bore size of about
85mm and a of 09 to 1 are approximate averages of the papers reviewed and manufacturer
inputs received
CR ONR for PFI ONR for DI
10 100 ndash 102 94 ndash 96
11 105 ndash 107 99 -101
12 109 ndash 111 103 -105
13 113 ndash 115 107 ndash 109
14 117 ndash 119 110 ndash 112
36
34 EFFECT OF LATENT HEAT OF VAPORIZATION OF FUEL
As noted in Section 25 the latent heat of evaporation results in a lower air-fuel mixture
temperature for a DI engine which improves the volumetric efficiency In addition the cooler
mixture allows a higher CR with the same fuel octane number The reduction in ONR by 4 due
to DI was discussed in Section 33 The Nippon Oil Nissan paper (Akihama et al Ref 21)
showed that the increased volumetric efficiency results in a 5 to 6 improvement in torque
with additional improvement from the CR increase which depends on the fuel octane number and
spark timing Figure 3-9 shows the net torque improvement at KLSA comparing the same engine
with DI and PFI at 4 different CR values A net improvement of torque of about 7 if observed
with DI over a range of CR values With the 114 RON fuel the DI engine was not knock limited
except at 15 CR while the PFI engine was knock limited at CR values of 135 and higher In the
case of the 90 RON fuel both the DI and PFI engines were knock limited at all CR values
Figure 3-9
90
95
100
105
110
115
120
10 11 12 13 14 15 16
NORMALIZED TORQUE AT KLSA
COMPRESSION RATIO
EFFECT OF CR ON TORQUE
DI 114RON
PFI 114RON
DI 90RON
PFI 90RON
37
In an analysis by Toyota (Nakata et al 2006 Ref 23) the 15L Atkinson Cycle PFI engine used
in the Prius with a geometric CR of 13 and a bore of 75mm was tested with different levels of
ethanol blends with a base regular gasoline of 915 RON and with a Japanese premium gasoline
with a RON of 996 According to data provided by Toyota the actual CR of the engine at 2800
RPM is 106 The paper reported that the octane number difference between premium and
regular gasoline resulted in only a small improvement in thermal efficiency because the Atkinson
Cycle limits the volumetric efficiency With ethanol blends the volumetric efficiency can be
improved due to charge cooling even with a PFI system if the ethanol is inducted into the
cylinder mostly as a liquid and the engine can run at MBT timing with E50 and higher blends
With neat ethanol (E100) the paper reported that absolute efficiency approached 399 which
was 56 relative improvement over the base (E0) efficiency level The data are shown in Figure
3-10 below for tests conducted at 2800 RPM and = 1
Figure 3-10
In an earlier analysis by Toyota (Nakata etal 2006 Ref 12) similar tests were conducted on the
same engine with a CR of 13 without the valve timing set up for Atkinson Cycle operation In
36
37
38
39
40
41
42
0 10 20 30 40 50 60 70 80 90 100
THER
MAL EFFICIENCY
ETHANOL VOLUMETRIC RATIO
ATKINSON CYCLE EFFICIENCY vs ETHANOL BLEND VOLUME
ETHANOL BLEND
PREMIUM GASOLINE
38
this case volumetric efficiency was affected by increased ethanol concentration decreasing by
2 for E50 and higher concentration blends However thermal efficiency for E0 (ie the base
91 RON gasoline) was reported as 317 absolute thermal efficiency for E100 was reported as
396 absolute nearly the same as that of the Atkinson Cycle engine operated on E100 and also
higher than the 379 reported on 100 RON gasoline These efficiency values show that use of
E100 resulted in 249 relative efficiency gain and the gain with E50 appeared to be on the
order of 20 relative significantly higher than with the Atkinson Cycle engine
In another paper by Toyota (Taniguchi et al Ref24) the use of E100 was examined in a DI
engine with a high CR of 13 and a bore size of 875mm At WOT torque increased by 76
relative to the same DI engine with a CR of 115 running on gasoline with a RON of 964 The
volumetric efficiency improved by up to 38 in contrast to the PFI case The increase in torque
was ascribed to both the increase in volumetric efficiency and the increase in CR made possible
by the higher RON of ethanol and the lower mixture temperature Surprisingly the thermal
efficiency with E100 was found to be only 05 (relative) better than with E0 which Toyota
traced to oil dilution by ethanol During the test blow-by gases were vented and the lost ethanol
was not recovered whereas the blow-by gas would be re-used in the normal situation due to
positive crankcase ventilation The higher volume of E100 required per injection created 3 to 4
higher fuel losses from oil dilution on the cylinder walls relative to gasoline especially at high
RPM In addition the lower flame speeds with ethanol contributed to a 07 decline in relative
efficiency which contributed to the small net effect observed
A study by Caton Hamilton and Cowart (Ref 26) on a CFR engine equipped with PFI used
regular gasoline E10 and E85 to examine the effects of ethanol at a constant speed of 900 RPM
At a CR of 9 and a of 09 E10 allowed a 03 bar increase in IMEP (about 3) by allowing
about 5 degrees spark advance over regular gasoline at KLSA while E85 was not knock limited
and provided a very small IMEP increase over E10 In a sweep of different CR values the
authors found the E10 blend allowed a 05 CR increase over regular gasoline and knock control
required spark retard of about 5 degrees per unit CR increase E85 was knock limited at CR
ratios over 12 but required only 2 degrees of spark retard per unit CR increase Torque with E85
increased by 2 per unit CR increase but torque was flat to negative with CR increases using
regular gasoline or E10 due to the need for spark retard to avoid knock
39
It should be noted that the higher torque with ethanol and ethanol blends can influence vehicle
fuel efficiency over and above changes in engine efficiency by allowing some engine size
reduction without loss of power
36 LEAN OPERATING CONDITIONS
As the relative air-fuel ratios are increased beyond stoichiometric engine efficiency depends
strongly on combustion chamber design turbulence in the chamber and compression ratio
(Heywood Ref 1) The flame speeds under lean conditions are slower as shown in Figure 2-8
but this is compensated for by other factors Ayala Gerty and Heywood (Ref 3) investigated the
factors that affect indicated efficiency as a function of air-fuel ratio and reported on four factors
that shape the relationship
- The value of increases towards that of air as the mixture gets leaner
- Pumping losses are reduced at part throttle conditions due to a higher airflow requirement
to produce the same torque
- Heat transfer losses are reduced due to lower combustion temperature
- The burn duration increases with increasing air-fuel ratio
The first three factors contribute to positive increases in efficiency while the fourth is a negative
factor The effect of increasing is relatively flat at air-fuel ratios over 14 so that as burn
duration increases the loss in efficiency offsets the gain from reduced pumping and heat transfer
loss Based on the data shown in Ref 3 Figure 3-11 shows the efficiency effects of the different
components at a light load point of NIMEP at 35 bar (which we estimate would typically
correspond to a BMEP of about 23 bar) In this case net indicated efficiency peaks at an air-fuel
ratio of about 15 The authors note that the effect of burn duration becomes particularly
pronounced when the duration exceeds 30 crank angle degrees and is in good agreement with
the other literature reviewed here
The influence of the mass burning period on IMEP and indicated efficiency has been confirmed
in other papers Research at the JOMO Technical Center (Hashimoto Inaba and Akasaka Ref
25) where a stratified charge DI engine with a CR of 10 and a bore size of 86mm was tested at
WOT at a of 1 2 and 3 with a wide variety of fuels found a linear relationship between the
90 mass burn period and IMEP at a of 1 They also found that at lean conditions the IMEP
40
was much less sensitive to spark timing due to the long duration of combustion Olefins had
shorter mass burning periods than paraffin and aromatic compounds at lean conditions resulting
in higher IMEP
25
27
29
31
33
35
09 11 13 15 17 19
NET
INDICATED EFFICIENCY
LAMBDA
INDICATED EFFICIENCY vs LAMBDA1500 RPM 35 BAR NIMEP CR OF 98
gamma
gamma+ Pumping +Heat Loss
Burn Duration
Total
Figure 3-11
The effect of octane number at lean combustion conditions was investigated by the Cosmo
Research Institute (Fukui Komoriya and Shimizu Ref 22) on a single cylinder version of a
Mitsubishi DI engine with a CR of 12 and a bore size of 81mm A wide variety of fuels with
RON ranging from 675 to 1022 were tested on this engine at 1200 RPM 67 and 87 kPa
manifold pressure and a of about 18 or 2 At these conditions the indicated efficiency was
highest at a low RON around 70 as shown in Figure 3-12 At these low RON values the refinery
feed-stocks had high auto-ignition intensity but single component fuels had relatively low
intensity The authors speculated that the low octane number fuels had better efficiency as the
fuel mixture near the walls auto-ignited with low octane number fuels providing more complete
combustion The increase in HC emissions with higher octane number fuels confirmed this
41
hypothesis and the authors also observed a correlation between auto-ignition and thermal
efficiency
Figure 3-12
A similar result was obtained by a Toyota-Exxon-Mobil study (Akihama et al Ref 21) with DI
engine having a CR of 13 and a bore size of 86mm Tests were conducted at a of about 19 and
1200 RPM engine speed and a ldquoslightly throttledrdquo intake Two fuels were used a toluene
standardization fuel (TSF) with a RON of 838 and Japanese regular gasoline with a RON of
917 The data presented in the paper show that the lower octane number TSF provided about 5
greater torque and had about 5 greater brake efficiency than the Japanese regular fuel The
indicator diagrams showed that there was a two stage heat release on the TSF with one
corresponding to the flame propagation from the spark plug and the second corresponding to
spark induced compression ignition The authors stated that this auto-ignition differed from
knock in that the pressure rise was not excessively rapid The authors surmised that if CR is
increased further this type of spark induced compression ignition could occur at RON values
similar to regular gasoline (ie at 91 RON)
28
285
29
295
30
305
31
315
32
60 70 80 90 100 110 120 130
INDICATED EFFICIENCY
FUEL RON
INDICATED EFFICIENCY vs FUEL TYPE AND RONSTRATIFIED CHARGE LEAN BURN
SC FUEL
MC FUEL
REFINERY FUEL
42
During the interviews manufacturers confirmed that low octane number fuels were better suited
to very lean combustion that approached Homogeneous Charge Compression Ignition (HCCI)
combustion On the other hand they also stated that at high loads such lean air-fuel ratios could
not be used without very large power loss so that this phenomenon was not directly relevant to
production engines as low octane number fuels could not be used across the operating range
43
4 TURBOCHARGED PORT INJECTION AND DIRECT
INJECTION ENGINES
41 OVERVIEW
Turbocharged engines are treated separately since the use of turbocharging generally requires the
reduction of CR for a given level of fuel octane number which hurts engine thermal efficiency
However the use of turbocharging allows the use of a significantly smaller engine to replace a
naturally aspirated engine and the mechanism that improves vehicle fuel economy is the reduced
pumping and cooling loss of a smaller engine operating at higher load to provide the same output
to the vehicle
Turbocharged engines also operate against different constraints At low RPM (lt1200) the
turbocharger does not provide significant boost and maximum boost is usually not available
until 1800 to 2000 RPM or higher Hence the WOT condition at low RPM may not be the point
where the engine ONR is the highest In addition boost may be limited at high RPM due to
maximum cylinder pressure constraints and spark timing and air-fuel ratio can be constrained by
turbine inlet temperature constraints Hence the impact of fuel octane number may be dissimilar
between naturally aspirated and turbocharged engines Turbocharged engines are knock limited
over more of their operating range than naturally aspirated engines (see Figure 4-1 below) and
octane number benefits in terms of vehicle efficiency may be larger
The efficiency of the turbocharged engine and its relationship to CR and spark advance are also
not represented by the equations shown in Section 3 since the reciprocating engine and turbo
unit act as a system If the engine is not boost limited the optimal combustion phasing for best
torque is delayed relative to that for a naturally aspirated engine since there is a compromise
between enthalpy flow to the turbine and the best torque achieved by the engine At high RPM
the boost air-fuel ratio and spark advance at WOT have to be limited not only to avoid knock
but also to limit turbine inlet temperature so that fuel octane number effects are very non-linear
44
Figure 4-1
42 PORT FUEL INJECTED ENGINES
Turbocharged PFI engines have had modest penetration in the US largely because of weak low
RPM torque An analysis of a 2L PFI engine with turbocharging using fuels of different octane
numbers was reported in a paper by Renault and TOTAL (Duchaussoy Barbier and Schmelzle
Ref 27) The engine had a 95 CR and a bore size of 827mm and was tested with hydrocarbon
fuels ranging in RON from 925 to 1065 Sensitivity for all of the fuels was about 10 The
engine was tested at WOT and the air-fuel ratio was held to stoichiometric across the entire
operating range of RPM from 1200 to 5000 The results are shown in Figure 4-2 and the reduced
low RPM torque is obvious Due to lack of boost the different octane number fuels have almost
no effect at RPM below 1500 RPM but by 2000 RPM the 1065 RON fuel shows a 115
torque advantage over the 925 RON fuel However the effects are quite non-linear with RON as
the 983 RON fuel shows only a 39 torque advantage At 3000 RPM the torque differences
between the various fuels are quite large but decline at higher RPM as turbine inlet temperature
limits control available timing retard and boost At 4000 RPM the 1065 RON fuel offers a 43
torque advantage over the 925 RON fuel
45
Figure 4-2
Reference 27 also examined the effect on increasing MON by decreasing the Sensitivity of the
fuels at constant RON from 10 to 7 (ie a 3 increase in MON) The authors found that the 3
MON increase resulted in about 3 increase in torque at 1500 RPM but the differences were
quite small over 3000 RPM Hence MON increases were found to be helpful at low RPM which
is exactly opposite from the result for naturally aspirated engines
By plotting the results shown in Figure 4-2 against RON with RPM as a parameter the complex
response of turbocharged PFI engines to fuel octane number is illustrated Figure 4-3 shows the
torque as a function of the RON at three different RPM levels and the sensitivity to RON
changes as different constraints come into play ndash boost constraints at low RPM knock
constraints at mid-RPM and turbine inlet temperature constraints at high RPM Also the
efficiency does not increase with torque as boost varies across the fuels but the ranking of fuels
for 1BSFC (ie a measure of efficiency) was identical to the torque based ranking BSFC varied
by about 15 across fuels Each octane number increase in fuel RON provides a 2 increase in
peak torque at 3000 RPM and a 3 increase at 4000 RPM
150
175
200
225
250
275
300
325
0 1000 2000 3000 4000 5000 6000
TORQUE N‐m
RPM
TORQUE vs RPM WITH DIFFERENT FUELTURBOCHARGED PFI ENGINE CR = 95
925 RON
946 RON
983 RON
1065 RON
46
Figure 4-3
BP and Toyota (Williams et al Ref 28) also investigated a 18L turbocharged PFI engine with
a bore size of 805mm but the engine had a very high CR of 13 for a turbocharged version The
paper provided details on engine efficiency at WOT and 2800 RPM with a of 1 and 16 but no
other details such as the boost level and torque output are provided Two reference fuels with
100 and 102 RON were tested with a wide variety of additives (such as diethyl ether and nitro-
methane) toimprove the burn rate The fuel matrix also included E85 and a high aromatic content
108 RON fuel The efficiency improvements measured at the two air-fuel ratios are shown in
Figure 4-4 below The authors attributed part of the data scatter to the large confidence bands
generated by the test method used to measure the calorific value of fuels
Operation at the highest RON value of 108 required reduction of boost to meet cylinder pressure
limits which reduced efficiency However Figure 4-4 shows that relative efficiency increases
about 069 per octane point at = 1 and by 085 per octane point at = 16 It should be
noted that at 2800 RPM there are likely no constraints on available boost or turbine inlet
temperature for these operating conditions
200
220
240
260
280
300
320
90 92 94 96 98 100 102 104 106 108
TORQUE N‐m
FUEL RON
TORQUE vs FUEL RON
2000 RPM
3000 RPM
4000 RPM
47
Figure 4-4
In an earlier paper by BP and Toyota (Williams et al 2009 Ref 29) the same engine was
tested with butanol-gasoline and ethanol-gasoline blends as well as neat ethanol and butanol
The fuels spanned a range of RON numbers from 976 to 111(for neat ethanol) The efficiencies
increased linearly with RON much like Figure 4-4 Indicated sensitivity of thermal efficiency for
both the equal to 1 and 16 cases was in the order 09 to 1 per octane number a little higher
than for the case with additive improved RON found in Reference 28
A more recent paper from Toyota (Nakata et al 2011 Ref 30) provided additional details on
the engine operating parameters with increased RON fuels The paper showed that intake
manifold pressure at the operating condition of 2800 RPM WOT and of 16 increased from
about 30kPa with a 92 RON fuel to about 80kPa with a 105 RON fuel and BMEP increasing
from 075MPa to about 14MPa The increases in both intake manifold pressure and BMEP
appeared to be almost linear with increasing octane number Hence a 15 point increase in RON
provides a near doubling of torque and boost at the lean operating condition and the authors
stated that a diesel like 44 brake thermal efficiency was possible with a lean boosted engine
35
37
39
41
43
45
94 96 98 100 102 104 106 108 110
BRAKE TH
ERMAL EFFICIENCY
FUEL RON
EFFICIENCY vs FUEL OCTANE NUMBERTURBOCHARGED PFI ENGINE CR = 13
at = 16
at = 1
48
operating on neat ethanol Some of this benefit was potentially due to the cooling effect of
ethanol which would permit more boost
43 DIRECT INJECTION ENGINES
As with naturally aspirated engines turbocharged DI engines are influenced by the reduction in
mixture temperature due to the latent heat of evaporation of the fuel A French consortium study
(Milpied et al Ref 31) examined the effects of octane number and latent heat of vaporization
on an experimental single cylinder 4-valve engine with a 69mm bore and a CR of 95 Six
hydrocarbon fuels with RON values ranging from 916 to 1004 and sensitivity from 64 to 127
were tested to study the effects of RON and MON Three of these six fuels were blended with
ethanol and ETBE (ethyl tertiary butyl ether) to obtain a RON of about 100 but to have a
different heat of vaporization Tests were conducted at 1000 2000 3500 and 5500 RPM at
WOT with the spark timing set to KLSA (and most likely at a of 1) Test reproducibility was
given as 06 bar of IMEP However no information on the boost level engine BSFC or
efficiency is provided with only the IMEP documented at the different fuels tested
Figure 4-5 shows the results of the tests and the authors (Ref 31) found a strong effect of RON
on the IMEP However no clear impact of MON was isolated and the impacts were both
positive and negative but relatively small As with the turbocharged PFI engines the greatest
impact was found at the 3500 RPM level The trend lines plotted by us in Figure 4-5 show that
IMEP increases by 2 bar for every 3 point increase in octane number at 2000 and 3500 RPM
higher than the 2 bar BMEP increase for every 4 octane numbers registered by the Toyota lean
boosted PFI engine described in Section 42
Data on the effect of the cooling power shows that the IMEP increase associated with an E30
blend relative to an ETBE blend with the same RON value of 1005 was about 25 bar The
difference in cooling power (defined as latent heatstoichiometric air-fuel ratio) was about 17
kJkg of air indicating that a cooling power of about 685 kJkg allows a 1 bar increase in IMEP
This level of increase is equivalent to the level from a 15 increase in RON suggesting that a 45
kJkg cooling power increase is equivalent to a unit increase in RON Reference 31 provides a
wide range of 2 to 8 kJkg cooling power as being equivalent to one octane number increase
Since the difference in cooling power between E100 and gasoline is about 77 kJkg this suggests
49
that the cooling power of E100 is equivalent to an additional 17 + 7 octane numbers in RON in a
turbocharged DI engine
Figure 4-5
A more detailed analysis of the individual effects of octane number and cooling power was
conducted by a consortium the included Ford AVL Deere and BP (Stein et al Ref 32) The
tests were conducted on a single cylinder engine with the CR varied between 10 12 and 14 A
wide variety of ethanol blend concentrations with different base gasoline RON levels were tested
at 1500 and 2500 RPM with some additional RPM tests at a CR of 12 The intake system was set
up to allow a pre-heated intake to maintain constant intake mixture temperature with all fuels as
well as PFI and DI systems Turbocharging was simulated by an intake pressure booster and an
exhaust orifice to simulate turbine back pressure and exhaust temperature limits were observed
to simulate turbine inlet limits A peak pressure limit of 160 bar was also used to simulate
production engine constraints
Measurements were carried out with an 88 RON base gasoline blend stock with E10 E20 E30
E50 and E75 blends Spark retard was used to allow more boost and increase the maximum
IMEP Figure 4-6 shows the maximum IMEP with the base gasoline at 88 RON (E0) and the E50
8
10
12
14
16
18
20
91 92 93 94 95 96 97 98 99 100 101
IMEP
BAR
FUEL RON
IMEP vs FUEL RON FOR TURBO‐DI ENGINE CR = 95
IMEP ‐3000 RPM
1MEP 2000 RPM
50
blend with a 105 RON rating introduced with upstream fuel injection (UFI)before the mixture
pre-heater with the mixture at the controlled temperature of 52C and also the E50 blend
directly injected into the cylinder The difference in the performance of the engine in the first
two cases is due to the octane number difference between the fuels while the performance
difference between UFI and DI cases for E50 is due to the cooling effect
Figure 4-6
Reference 32 finds that for a given gasoline blend stock increasing ethanol content significantly
increases NIMEP as well as thermal efficiency especially at retarded combustion phasingThe
magnitude of the improvement of NIMEP with E50 is striking as shown in Figure 4-6 E0 has a
maximum IMEP of about 8 bar while for E50 in a DI engine it is 38 bar The authors of Ref 32
attribute the improved performance at retarded timing to the high sensitivity of auto-ignition
kinetics to temperature for ethanol which has a Sensitivity of 18 octane numbers The authors
also find that both the octane number effect and charge cooling effect of high ethanol
concentration blends are very significant for DI engines and are of about equal magnitude In the
figure above the difference in RON between the base gasoline and E50 blend is 17 octane
0
5
10
15
20
25
30
35
40
45
0 5 10 15 20 25 30 35
NET
IMEP
BAR
CRANK ANGLE AT 50 MASS BURN ATDC
SEPARATION OF CHARGE COOLING AND OCTANE EFFECTS ON KNOCK LIMIT
E0
E50 UFI
E50 D
Charge Cooling
Octane Improvement
51
numbers If the cooling effect is of the same size or about 17 numbers for E50 the cooling effect
is almost twice as large as estimated in Ref 31
Another set of tests with a turbocharged DI engine were conducted by Orbital (Brewster Ref
33) using a unique air assisted injector Tests were conducted on a 2L 4 cylinder engine with a
bore size of 86mm and a CR of 104 Test conditions were at 2000 RPM WOT with engine
airflow controlled by the turbocharger waste-gate Boost pressures were relatively low at 36 to
40kPa The study found that E100 enabled 5 to 10 degrees more spark advance and provided
about 12 to 13 more N-m of torque relative to a 98 RON gasoline which is about a 5 torque
increase These numbers are very modest compared to the results in Ref 32 and it is not clear
why timing retard and increased boost caused a net reduction in torque with E100 in this study It
may be that the turbocharger was not fully effective in using the enthalpy of the exhaust gas to
increase boost at an engine RPM of 2000 and this may be a real limitation that is not accounted
for in the previous study At other RPM points the study used the performance with the base
gasoline fuel as a benchmark and optimized spark and boost calibration with E100 to maximize
energy economy at the same torque The study found that brake thermal efficiency is improved
between 7 and 13 increasing with RPM With E100 the same torque level is achieved with
lower boost and with lower exhaust temperatures The author also pointed to some combustion
instability issues at high boost conditions related to the slower burn rate of ethanol
In an analysis of ethanol hot spot pre-ignition Hamilton et al (Ref38) examined the tendency
of E85 and E100 fuels to pre-ignite using a CFR engine with a diesel glow plug to provide a
temperature controlled hot spot Tests were conducted at 900 RPM using CR values of 12 135
and 15 The authors concluded that pre-ignition occurs at 620 to 680C at lambda values of 085
to 105 and higher CR leads to lower pre-ignition temperatures They found that E100 pre-
ignites at 10 to 20 C lower glow plug temperatures than E85 and very high knock intensity
occurs when per-ignition starts at 14 to 8 CAD before TDC The range of temperatures for pre-
ignition are much lower for E100 and E85 than for hydrocarbon gasolines reported in Ref37
(where the range was 800 to 900 C)
MITrsquos Laboratory for Energy and the Environment has been developing the concept of direct
injection of ethanol coupled with port injection of gasoline to tailor the net octane number
benefit to engine load and speed The simulation and experimental work have been reported in
52
references 34 35 and 13 (Bromberg Cohn and Heywood 2006 Bromberg and Cohn 2007
Bromberg and Cohn 2008) The modeling in Ref 35 suggested that direct injection of E100
would be effective in preventing knock For a turbocharged DI engine with a CR of 10 no
ethanol was required until the intake manifold pressure rose beyond 08bar but about 18 of the
energy from E100 was required at 1 bar and 80 at 3 bar At a CR of 12 the ethanol fraction as
a function of manifold pressure was parallel to the curve at 10CR but shifted 02 bar lower intake
manifold pressure Bromberg et al (Ref 13) conclude that this strategy of injecting ethanol
directly as needed results in a very high ldquoeffectiverdquo octane rating When 10 of the energy is
provided by ethanol (ie 14 by volume) the effective octane number of the E100 was found to
be 175Since normal driving is mostly at light load high CR engines can be used with gasoline
to minimize consumption of ethanol The authors modeled vehicular use of ethanol on the US
EPA Federal Test Procedure (FTP) and Highway driving cycles and found that less than 2 of
fuel volume was ethanol on these cycles using a 10 CR PFI+DI engine operating with a
maximum boost of 25 bar
In a subsequent paper (Stein House and Leone Ref 36) Ford reported on an engine developed
along the lines modeled by Bromberg and Cohn This engine was a prototype 35L ldquoEcoboostrdquo
V-6 with a 98 CR itwas a turbocharged engine where the gasoline was introduced with a PFI
system and the ethanol through a DI system This particular engine was constrained to a peak
pressure of 100 bar A BMEP sweep showed that 98 RON gasoline was knock limited above 8
bar BMEP and spark timing had to be retarded by 15 at the maximum BMEP of about 18 bar
when the turbine inlet temperature limit of 950C was reached With E85 no timing retard was
required to about 18 bar BMEP and a peak BMEP of 21 bar was realized being limited by
engine peak pressure limitations When employing a gasoline + ethanol fueling strategy it was
found that to avoid knock at MBT spark timing the mass fraction of E85 at 10 bar BMEP was
40 and rose to 50 at 15 bar after which spark timing had to be retarded to meet engine peak
pressure limits The research also found that spark retard by about 5 was optimal to reduce the
combined BSFC of gasoline + ethanol to the minimum Using this fueling strategy and measured
values of ethanol consumption Ford confirmed that E85 consumption for a Ford F-150 truck
would be less about 1 of total fuel mass on the US EPA FTP and Highway test cycles at the
truckrsquos test weight but would increase to 19 and 30 respectively at the truckrsquos maximum
weight with full payload
53
5 FINDINGS AND CONCLUSIONS
51 MAJOR FINDINGS
The effect of increasing fuel octane number on SI engines and vehicle energy efficiency
cannot be quantified in a simple way but requires a complex nuanced answer The following
findings from the literature review and analysis are the basis for the conclusions in Section
53 of this report
A Relationship between Engine Efficiency and Fuel Octane Number
1) The thermal efficiency of naturally aspirated engines primarily depends on the enginersquos
CR but is also adversely affected by increasing surface-to-volume ratio of the
combustion chamber which depends directly on the CR and inversely on the cylinder
displacement (and typically the bore size) As a result maximum indicated thermal
efficiency is almost constant beyond CR values of 14 for small bore engines (lt70mm)
and almost constant beyond a CR of 16 for bore size over 85mm The marginal thermal
efficiency benefit of increasing CR declines continuously with increasing CR 2) The engine octane number requirement (ONR) is the lowest fuel octane number that
results in borderline knock at wide open throttle when the spark timing is set to MBT
The engine octane number requirement is primarily a function of the CR and to a
slightly lesser extent operating conditions of speed and air-fuel ratio It is also a
function of engine design variables such as the shape of the combustion chamber
efficacy of cooling and bore diameter7 The highest octane number requirement occurs
at low RPM (lt1500) and wide open throttle (WOT) for naturally aspirated engines
B Naturally Aspirated Engines
1) The typical ONR for a port fuel injected naturally aspirated engine with a CR of 10 and
a bore diameter of about 85mmoperating at= 1 1500 RPM is 100 to 102 RON at
WOT Smaller bore engines have a lower octane requirement while larger bore engines
have a higher octane requirement The relationship between ONR and bore diameter is
7 The variables listed are illustrative but this is not a comprehensive list
54
not well quantified in the literature but may be around 2 to 3 octane numbers per
10mm based on the data collected for this study Hence a small bore engine (70mm) at
the same conditions can have an ONR of 96 to 99 while a large bore engine (100mm)
can have an ONR of 103 to 106 2) The ONR increases with engine CR by about 4 to 5 octane numbers per unit CR
increase (It is not clear if this relationship holds at higher CR values over 13) The
ONR decreases with RPM and the ONR dependence appears to be approximately linear
with time per revolution (the inverse of RPM) to about 40 ms (1500 RPM) but not all
studies confirm this The ONR declines by approximately 2 octane numbers per 10ms
decline in the time per revolution Hence the ONR declines by about 4 octane numbers
between 1500 RPM and 3000 RPM (40ms to 20ms per revolution) 3) The engine actual octane number limit (ONL) is sensitive to spark timing advance and
air-fuel ratio and these are the two primary control levers used to prevent knock in
production naturally aspirated engines The ONL is reduced with spark retard from
MBT values and this relationship is approximately linear with the ONL being reduced
by 1 octane point for every 15 + 05 degrees spark retard The relationship becomes
more non-linear at retarded timing very close to MBT and at timing advance beyond
MBT The ONL at WOT is highest at of 095 to 1 and every 01 richer or leaner than
this level leads to about a 3 point reduction in ONL 4) The influence of spark timing on torque and engine efficiency is very non linear with
the first 5 CAD retard from MBT reducing torque and relative efficiency by only about
13 while a 10 CAD retard causes a 51 reduction Hence spark retard by less than
10 from MBT can reduce the engine ONL significantly while having modest effects on
available torque and thermal efficiency 5) With direct injection of the fuel into the cylinder the latent heat of evaporation of the
fuel cools the air-fuel mixture The cooling power of gasoline for a stoichiometric
mixture of air and fuel is about 24 kJkg air The reduced temperature reduces the
octane number requirement by one octane point for about 45 to 6 kJkg of cooling
power Hence direct injection of gasoline reduces the ONR by about 4 to 5 octane
numbers
55
C Turbocharged Engines
1) The relationship between engine CR spark timing and engine ONL is more complex
in a turbocharged engine since the reciprocating engine and turbocharger act as
system If the engine is not boost limited the optimal combustion phasing for best
torque is delayed relative to that for a naturally aspirated engine since there is a
compromise between enthalpy flow to the turbine and the best torque achieved by the
engine At high RPM the boost air-fuel ratio and spark timing at WOT have to be
limited not only to avoid knock but also to limit turbine inlet temperature(which limits
the employment of spark retard) and engine peak pressure so that fuel octane number
effects are very varied across different operating conditions 2) The available data show that increasing fuel RON increases mid-range torque (~ 3000
to 4000 RPM) by 2 to 3 per octane number increase in RON for a turbocharged
PFI engine while increasing engine thermal efficiency by about 07 per octane point
increase Low RPM and high RPM torque are usually limited by other factors as well
so that the effect of octane number increase at these RPM levels may be engine design
specific 3) Increasing octane number can have a very significant effect on mid-range torque for
turbocharged DI engines that are not boost limited Limited data on DI engines shows
that an 8 increase in fuel RON can increase 3000 RPM torque by about 50 or about
5 per octane number Torque benefits at high and low RPM may be much smaller as
they are subject to the same constraints as for PFI engines 4) The use of high ethanol concentration blends (E30 and higher)may be particularly
beneficial to turbocharged DI engines for two reasons Research shows that with high
volume ethanol blends the combination of high boost and retarded timing allows
knock-free operation at very high BMEP levels Recent experimental work has shown
the capability of an E50 blend to allow engine operation at 38 bar to 40 bar IMEP
which is about twice the IMEP level of current gasoline turbocharged DI engines
These high IMEP values will not likely be reproduced in production engines as
ethanol has other limitations such as reduced hot spot pre-ignition temperature relative
to hydrocarbon gasoline
56
D Special conditions
1) The use of lean burn offers a substantial fuel economy opportunity especially at part
load conditions but is not used in the US due to difficulties in meeting emission
standards Under lean conditions with a homogeneous mixture lower RON fuels have
been found to give better engine efficiency as the lower octane number leads to a
combustion mode described as spark initiated compression ignition of end gases that are
not fully combusted with high octane number fuels If lean combustion becomes viable
lower RON fuels may be more desirable However if the limiting condition for engine
ONR is at full load where stoichiometric or rich operation is desirable for maximum
power the fuel octane number will have to be tailored to this condition in actual
practice
E Fuel Issues
On the fuels side the review and analysis provide the following conclusions
1) The existing test procedure to determine fuel octane number (both Research and Motor)
uses test conditions outside the typical operating range of modern engines
2) At low RPM conditions (lt1500 RPM) and WOT the effective octane number of a retail
gasoline (whose MON is 8 to 10 numbers lower than the RON) is actually higher than
RON The fuel Octane Index which is a weighted sum of RON and MON that represents
the performance of the fuel in the engine uses a negative weight for MON so that as
MON decreases the fuel has a higher Octane Index (See conclusion 5 below) The MON
weighting factor K is estimated to be about -02 to -04 for modern engines at low
RPM
3) Available data suggest that the greater the ONR of the engine the more negative the K
value becomes Hence high CR turbocharged engines will have a more negative K value
on average than a moderate CR naturally aspirated engine This implies that fuels with
high RON and low MON are well suited to high ONR engines but the data show a lot of
scatter in the K values for individual engines
4) With increasing RPM K appears to increase linearly with time per revolution (or
1RPM) The increase implies that MON becomes more important at higher RPM Higher
57
MON is also desirable for suppressing other unusual combustion modes In particular hot
spot pre-ignition temperature is better correlated to MON than to RON
5) Olefin and aromatic compounds have higher octane Sensitivity than paraffin compounds
because their combustion kinetics are slower at lower end gas temperatures (similar to the
end gas temperatures in modern engines) and faster at high temperatures (similar to the
end gas temperature on the MON test) relative to paraffin compounds Olefin compounds
have the highest burning velocity and high olefin content fuels can increase engine
relative efficiency by 1 to 2
6) The latent heat of vaporization is an important factor that improves the knock resistance
of a fuel in a DI engine The cooling power as measured by the latent heat of
vaporization divided by the stoichiometric air-fuel ratio is an indicator of the benefit In
this context the cooling power of ethanol is about 4 times as high as gasoline
7) Ethanol also offers high RON (111) and high Sensitivity (17) so that its use in
turbocharged DI engines (where K is most negative) allows very large increases in engine
output and efficiency Experimental results suggest that the benefit in knock resistance
from the evaporative cooling effect is as large as the benefit from the higher RON for
high concentration ethanol blends (E30 and higher) However ethanol also has much
lower hot spot pre-ignition temperature consistent with its lower MON rating which will
limit the benefit of ethanol use in production engines
52 STATUS OF THE CURRENT US NEW VEHICLE FLEET
The benefits of increasing octane number are very dependent on the starting point of CR
efficiency and octane number In the current US market manufacturers designate vehicle
gasoline requirements as ldquoregularrdquo ldquopremium recommendedrdquo and ldquopremium requiredrdquo but
there are no regulatory requirements that must be met to have a premium fuel designations
Regular gasoline has a RON of about 90 to 91 and Sensitivity (RON ndash MON) of about 8 to 10
Premium gasoline has a RON of 95 to 96 and a similar Sensitivity All of the vehicles where
premium gasoline is recommended or required are high performance sports cars and luxury
vehicles with the exception of some mass market DI vehicles designated for premium gasoline
by VW The 2009 vehicle data was analyzed to derive the CR for PFI DI and Turbocharged
engines by fuel octane number (regular or premium) as H-D Systems had access to a
comprehensive database on the technical specifications of all vehicles sold in that model year
58
A regression analysis was conducted with CR as the dependent variable and bore size
turbocharging and the use of DI as independent variables Unfortunately there were only 2 DI
engines with regular gasoline designation and one was turbocharged so that no statistically
significant coefficient was obtained for the regression of data on cars designated for regular
gasoline In the case of cars designated for premium gasoline (either recommended or required)
the spread of bore sizes was quite small and no significant coefficient for bore size was obtained
The resulting regressions (t-statistic in parentheses) are shown below
CR = 1088 ndash 001(Bore mm) -072 (Turbo) for regular gasoline
(424) (-336) (-108)
CR = 1096 - 189 (Turbo) + 099 (DI) for premium gasoline
(200) (225) (112)
It should be noted that most of the bore sizes are concentrated in the 85 to 100mm range in the
US so that the regression is not capturing the effect of small bore sizes in the 65 to 75 mm
range An evaluation of the CR levels at a constant bore size of 86 mm shows the following
levels of CR by engine type and fuel requirement
GRADE NA ndashPFI NA-DI TURBO-PFI TURBO- DI
REGULAR 101 - 935 -
PREMIUM 110 120 92 90
The actual data in the table are in excellent agreement with the findings The 4 to 5 RON
advantage of premium fuel over regular gasoline results in average CR increasing by 09 in
production vehicles that require premium relative to the CR for production vehicles that allow
the use of regular The ldquocooling effectrdquo advantage of DI results in exactly 1 unit increase in CR
The reason that the CR for turbocharged engines for regular and premium gasoline are nearly
identical is due to high performance engines which use higher levels of boost being certified for
premium
59
The regression shows that 101 CR engines are operating on 91 RON gasoline which may
appear to be inconsistent with the finding that the ONR of engines at that CR was found to be
100 to 102 at low RPM Manufacturers acknowledge that current production engines use a
combination of fuel enrichment and spark retard to avoid knock at full load Our estimate is that
the 9 to 11 octane number gap between engine ONR and gasoline RON is managed as follows
Improvement in fuel octane index due to negative K 2 to 3
Spark retard by 6 to 8 from MBT 3 to 4
Fuel enrichment to of 08 to 085 3 to 4
At higher RPM the improvement from the K factor goes to zero or is negative but this is offset
by the decline in engine OR For example the data shows that increasing the RPM from 1500 to
3000 reduces engine OR by 4 octane numbers but the K factor increases from -025 to +01 so
that the OI of the fuel decreases by 3 numbers largely offsetting the decrease in OR
The 2012 baseline data for CR is not expected to be very different from 2009 although there are
many more DI models both naturally aspirated and turbocharged available for use with regular
grade gasoline In addition there have been some market introductions of small displacement
engines (lt15L) that may allow better determination of the effect of bore size on CR In Japan
where small displacement engine are more common small bore 4 cylinder engines (~70mm
bore) with displacement of 1L to 13L have a CR of 115 while 2L engines (~85mm bore size)
have a CR of 106 for engines intended for use with regular gasoline (also 91 RON in Japan)
according to data provided by Toyota to this project The 09 CR increase should increase the OR
by about 4 octane numbers at constant bore size suggesting that the estimate of 2 to 3 octane
point reduction per 10 mm bore size decrease is in the correct range as the 15mm bore size
decrease offsets the effect of a 09 CR increase
CR also has increased over time even as the RON and MON of regular gasoline has stayed
constant In the model year 1980 time frame CR was about 85 and in 2010 it was about 10
suggesting an increase of 05 CR per decade Mittal and Heywood (Ref 6) have documented the
reasons behind this increase and improved cooling elimination of intake air preheat replacement
of carburetors with fuel injection etc have contributed It is not clear if this trend will continue
but we anticipate that the average will continue to improve at 05 CR per decade and may
60
improve even more quickly if the use of DI is widespread by 2020 It is also worth noting that
Mazda has recently introduced a small bore DI engine with a CR of 14 in Japan that uses regular
gasoline with a minimum RON of 89 (no MON limit is specified) Other Mazda engines sold in
Europe and the US have CR values of 12 to 13 on regular gasoline In the US Mazda offers a
2L engine with a 13 CR for use with regular gasoline No detailed data on the engine are
available yet but Mazda brochures suggest very good exhaust scavenging to reduce residual gas
and hence mixture temperature as well as some additional spark retard has been used to permit
the high CR The 2L engine is rated at 154 HP while the previous Mazda 2L engine with a10 CR
had a rating of 148 HP Hence Mazda has managed to increase CR by 3 with no sacrifice in the
power rating The potential for new technology to increase CR with no additional fuel octane
number requirement is demonstrated by this technology Another example of technology that can
reduce the ONR is the use of cooled EGR at full load for turbocharged engines Public
statements by several auto-manufacturers suggest that cooled EGR at full load will be used in
production engines in the near future
53 CONCLUSIONS
One of the objectives of the project was to assess the impact of increasing fuel octane number on
engine and vehicle efficiency The conclusions for a 4 to 5 RON increase are as follows
1) In port fuel injected naturally aspirated engines with mid-size (~85mm) and larger bore
sizes (that account for most of the US market today) and a CR of 10 this octane number
increase will facilitate a 1 point increase in CR which can provide a 2 relative
improvement in engine efficiency For small bore sizes (~70mm) the increase in CR will
be similar but the improvement in engine efficiency will be smaller at 13 to 14
2) For midsize and large bore naturally aspirated DI engines that have a CR of 11 this octane
number increase will facilitate a 1 point increase in CR and allow engine efficiency to
increase by 15 to 16 Small bore engines will have an improvement of 08 to 085
3) Vehicle efficiency gains for vehicles with naturally aspirated engines can be somewhat
larger than engine efficiency gains due to increased engine torque when CR is increased
permitting engine down-speeding This can provide a 1 to 2 fuel economy gain over
and above engine efficiency gains
61
4) In turbocharged engines the effect of this improved octane number could be through the
increase in engine peak torque if the engine is not boost limited In PFI engines the 4 to 5
RON increase can provide 10 to 15more torque In a DI engine this increase in octane
number can translate into a 20 to 25 increase in torque This torque increase is for
operation at 2000 to 4000 RPM at engine speeds below 1500 RPM and above 4000 RPM
other factors control available torque increases so that no general conclusion is possible for
all speeds
5) The torque increases with turbocharged engines could allow significant downsizing and
down-speeding of the engine but the extent of downsizing and down-speeding is dependent
on engine low RPM performance As an example of the size of the potential benefit a 5
to 7 fuel economy improvement is possible if the engine can be downsized by 20 to
25 to keep absolute mid-range torque constant
6) If the octane number increase were to be derived by addition of ethanol to gasoline larger
torque increases may be possible in turbocharged DI engines due to the high latent heat of
vaporization of ethanol An E30 blend with 91 RON gasoline blend-stock could potentially
improve torque by 50 but this level of increase is not proven in any vehicle application
and could be limited by ethanolrsquos lower resistance to hot spot pre-ignition
7) Developments in engine technology will allow CR to increase in the future with no change
to fuel RON and MON The increased use of DI technology will allow a CR increase of 1
unit Engine downsizing with resulting smaller bore sizes as well as the use of cooled
EGR and improved exhaust scavenging may allow continuing increases in CR over the
next decade with unchanged fuel ON
62
6 DATA GAPS AND RESEARCH RECOMMENDATIONS
The detailed literature review reveals a limited selection of studies in the public domain on the
relationship between fuel octane number and enginevehicle efficiency as only 45 papers
relevant to this topic were found after a reasonably exhaustive search Of these 45 many were
only tangentially related to the subject of fuel octane number and engine efficiency but helped
fill some gaps in the complex connections between the two variables In addition many of the
directly relevant papers were from a small number of organizations that reported on different
fuels and test modes for the same engine For example there are nine papers from Toyota and
the papers have used the same set of research engines for their studies
Two types of data gaps have been identified The first type is where the data exists but is not
public For example the data set is on actual engine efficiency and octane number requirement is
very limited across engine sizes and across the RPM range Most papers have used engines in the
85 + 5 mm bore size range and most of the data are for engine speeds of 1200 to 2000 RPM
Other key variables with limited data include the effect of spark timing as well as the effect of
air-fuel ratio on fuel octane number requirements across a range of engine bore sizes and RPM
These data clearly exist for a wide variety of production engines at each auto-manufacturer and
creating a database of these variables is not difficult if manufacturers participate in sharing the
data (the origin of the data can be obscured to maintain confidentiality) Such a database could
pave the way for developing more robust relationships between efficiency and fuel octane
number for different bore sizes and operating conditions
The second type of gap is where the data available are too limited to provide specific
conclusions The data on turbocharged DI engines (especially those with small displacement)
and their response to fuel octane number and heat of vaporization in terms of efficiency and
torque improvement across a range of engine speeds (especially at low RPM) are very thin and
usually derived from experimental engines where the interaction of the reciprocating unit with
the turbocharger is not measured but simulated Octane number improvements and
improvements from ethanol blends appear to hold significant promise but the available data are
inadequate to estimate the benefits in a real vehicle application
63
Newer technologies are also not represented in the database The latest DI engines in Europe
have sequential turbocharging with 2 stage cooling experiments have been conducted with
cooled EGR at all loads and speeds but little information exists on the interaction with fuel
octane number
The testing of turbocharged DI engines of different sizes and those equipped with newer
technology such as sequential turbocharging as well cooled EGR can permit a look forward into
the future interaction of fuel octane number and engine and vehicle efficiency CRC sponsored
testing research should focus on these newest technologies so that findings remain useful for the
future
64
LIST OF ACRONYMS
BP - British Petroleum
BMEP - Brake Mean Effective Pressure
BSFC - Brake Specific Fuel Consumption
CAD - Crank Angle Degrees
CFR - Co-operative Fuels Research
CR - Compression Ratio
CRC - Coordinating Research Council
DI - Direct Injection
Dyno - Dynamometer
EGR - Exhaust Gas Recirculation
ETBE - Ethyl tertiary butyl ether
Exx - Ethanol gasoline blend with the volumetric content of ethanol as a percent xx
FC - Fuel Consumption
HCCI - Homogeneous Charge Compression Ignition
IMEP - Indicated Mean Effective Pressure
ISFC - Indicated Specific Fuel Consumption
K - Weighting factor of MON in the Octane Index
KLSA - Knock Limited Spark Advance
kPa - kilo Pascal
LHV - Latent Heat of Vaporization
MAP - Manifold Air Pressure
MBT - Maximum Brake Torque
MIT - Massachusetts Institute of Technology
MON - Motor Octane Number
MPa - Mega Pascal
NA - Naturally Aspirated
OI - Octane Index of fuel = (1- K)RON + KMON
ONL -Octane Number Limit
65
ONR - Octane Number Requirement of engine
PFI - Port Fuel Injection
PRF - Primary Reference fuel
RON - Research Octane number
RPM - Revolutions Per Minute
S - Sensitivity of the fuel defined as RON - MON
SAE - Society of Automotive Engineers
SI - Spark ignition
SIDI - Spark Ignition Direct Injection
TDC - Top Dead Center (piston position)
66
REFERENCES
1 Heywood John H Internal Combustion Engine Fundamentals McGraw Hill Series in
Mechanical Engineering undated
2 Muranaka S Takagi Y and Ishida T Factors Limiting the Improvement in Thermal
Efficiency of SI Engine at Higher Compression Ratio SAE Paper 870548 February
1987
3 Ayala F Gerty M and Heywood J Effects of Combustion Phasing Relative Air-Fuel
Ratio Compression Ratio and Load on SI Engine Efficiency SAE Paper 2006-01-0229
April 2006
4 Kalghatgi GT Fuel Anti-Knock Quality ndash Part I Engine Studies SAE Paper 2001-01-
3584 September 2001
5 Kalghatgi G NakataK and Mogi K Octane Appetite Studies in Direct Injection
Spark Ignition Engines SAE Paper 2005-01-0244 April 2005
6 Mittal V and Heywood J The Relevance of Fuel RON and MON to Knock Onset in
Modern SI Engines SAE Paper 2008-01-2414 October 2008
7 Mittal V and Heywood J The Shift in Relevance of Fuel RON and MON to Knock
Onset in Modern SI Engines over the Last 70 Years SAE paper 2009-01-2622 October
2009
8 Mittal V Heywood J and Green W The Underlying Physics and Chemistry behind
Fuel Sensitivity SAE Paper 2010-01-0617 2010
9 Kalghatgi G T Auto-Ignition Quality of Practical Fuels and Implications for Fuel
Requirements of Future SI and HCCI Engines SAE Paper2005-01-0239 April 2005
10 AkihamaK et al Fuel Octane and Composition Effects on Efficiency and Emissions in
a High Compression Ratio SIDI Engine SAE Paper 2004-01-1950 June 2004
11 Farrell J et al Fuel Effects on SIDI Efficiency and Emissions SAE Paper 2003-01-
3866 October 2003
12 Nakata K et al The Effect of Ethanol on a Spark Ignition Engine SAE Paper 2006-01-
3380 October 2006
13 Bromberg L and Cohn D R Effective Octane and Efficiency Advantages of Direct
Injection Alcohol Engines MIT Lab for the Energy and Environment Report LFEE
2008-01RP January 2008
67
14 Munoz R et al Effect of Compression ratio on Stratified Charge Direct-Injection
Gasoline Combustion SAE Paper 2005-01-0100 April 2005
15 Nakata K et al The Impact of RON on SI Engine Thermal Efficiency SAE Paper
2007-01-2007 2007
16 Russ M A Review of the Effect of Engine Operating Conditions on Borderline Knock
SAE paper 960497 February 1996
17 Caris C F and Nelson E E A New Look at High Compression Engines SAE
Transactions Vol 67 1959
18 Haghgooie M Effect of Fuel Octane and Inlet Air Temperature on Knock
Characteristics of a Single Cylinder Engine SAE Paper 902134 October 1990
19 Millo F et al The Effect of Unleaded Gasoline Formulation on Antiknock
Performance SAE Paper 941862 October 1994
20 Okamoto K et al Study of Antiknock Performance under Various Octane Numbers
and Compression Ratios in a DISI Engine SAE Paper 2003-01-1804 May 2003
21 Akihama et al op cit June 2004
22 Fukui H Komoriya H and Shimizu T Effects of Octane Number on Stratified
Charge Combustion in a DI Gasoline Engine SAE Paper No 2001-01-1964 May 2001
23 Nakata K et al 2006 op cit
24 Taniguchi S Yoshida K and Tsukasaki Y Feasibility Study of Ethanol Applications
to a DI Gasoline Engine SAE Paper 2007-01-2037 2007
25 Hashimoto K Inaba O and Akasaka Y Effects of Fuel Properties on the Combustion
and Emission of DI Gasoline Engine SAE Paper 2001-01-0253 March 2001
26 CatonP Hamilton L and Cowart J An Experimental and Modeling Investigation into
the Comparative Knock and Performance Characteristics of E85 Gasohol and Regular
Unleaded Gasoline (87 R+M2) SAE Paper 2007-01-0473 April 2007
27 Duchaussoy Y Barbier P and Schmelzle P Impact of Gasoline RON and MON on a
Turbocharged MPI SI Engine Performance SAE Paper 2004-10-2001 June 2005
28 Williams J et al The Impact of Fuel Composition on the Combustion and Emissions of
a Prototype Lean Boosted PFI Engine SAE Paper 2010-01-2094 2010
29 Williams et al Impact of Butanol and Other Bio-Components on the Thermal Efficiency
of Prototype and Conventional EnginesSAE Paper 2009-01-1908 2009
68
30 Nakata K et al The effect of thermal properties on thermal efficiency of advanced
spark ignition engines International Journal of Engine Research 12274 2011
31 Milpied J et al Impact of Fuel Properties on the Performances and Knock Behaviour of
a Downsized Turbocharged DISI Engine SAE Paper 2009-01-0324 2009
32 Stein R et al Effect of Heat of Vaporization ChemicalOctane and Sensitivity on
Knock Limit for Ethanol-Gasoline Blends SAE Paper 2012-01-1277 2012
33 Brewster S Initial Development of a Turbocharged DI E100 Combustion System SAE
Paper 2007-01-3625 August 2007
34 Bromberg L and Cohn D R Effect of Compression Ratio and Manifold Pressure on
Ethanol Utilization in GasolineEthanol Engines MIT Lab for the Energy and
Environment Report March 2007
35 Bromberg L Cohn D R and Heywood J Calculations of Knock Suppression in
Highly Turbocharged GasolineEthanol Engines Using Direct Ethanol InjectionMIT Lab
for the Energy and Environment Report February 2006
36 Stein R House C and Leone T Optimal Use of E85 in a Turbocharged DI Engine
SAE Paper 2009-01-1490 2009
37 Sasaki N et al The Effect of Fuel Compounds on Pre-ignition under High Temperature
and High Pressure Condition SAE Paper 2011-01-1984 2011
38 Hamilton LJ et al Pre-ignition Characteristics of Ethanol and E85 in a Spark Ignition
Engine SAE Paper 2008-01-0321 2008

The Coordinating Research Council Inc (CRC) is a non‐profit corporation
supported by the petroleum and automotive equipment industries CRC
operates through research committees made up of technical experts from
industry and government who voluntarily participate The four main areas of
research within CRC are air pollution (atmospheric and engineering studies)
aviation fuels lubricants and equipment performance heavy‐duty vehicle
fuels lubricants and equipment performance (eg diesel trucks) and light‐
duty vehicle fuels lubricants and equipment performance (eg passenger
cars) CRCrsquos function is to provide the mechanism for joint research
conducted by the two industries that will help in determining an optimum
combination of petroleum products and mobility equipment CRCrsquos work is
limited to research that is mutually beneficial to the two industries involved
Final reports and data are made available to the public
CRC makes no warranty expressed or implied on the application of
information contained in this report In formulating and approving reports
the appropriate committee of the Coordinating Research Council Inc has not
investigated or considered intellectual property which may apply to the
subject matter Prospective users of the report are responsible for protecting
themselves against liability for infringement of intellectual property rights
iii
Final Report
Review to Determine the Benefits of Increasing Octane Number on Gasoline Engine Efficiency Analysis and Recommendations ndash Tasks 2-5
CRC Project No CM-137-11-1b
September 2012
Submitted to
Coordinating Research Council Inc
Submitted by
K G DULEEP
H-D SYSTEMS International
Washington DC 20016
iv
(This page intentionally left blank)
v
EXECUTIVE SUMMARY
E1 OVERVIEW
The overall objectives of Project CM-137-11-1 are to establish the relationship between engine
(and vehicle) energy efficiency for a spark ignition (SI) engine and the octane number and
composition of the fuel This project is sponsored by the Coordinating Research Council (CRC)
and is divided into several tasks The detailed literature review conducted under Task 1 of this
project1 revealed 45 technical papers that covered various aspects of the relationship between
enginevehicle efficiency and fuel octane number and composition The papers covered a wide
range of engine types fuel formulations engine operating conditions and testing constraints
Results were also presented using various metrics eg indicated and brake mean effective
pressure indicated and brake specific fuel consumption relative and absolute efficiency
The Task 1 review found that the relationship between octane number and efficiency was
influenced by a number of intermediate variables covering engine type operating condition and
fuel formulation Hence it was not possible to simply collate the data from the papers and
develop an average relationship considerable effort was required to organize the reported data
into subsets of similar engine types and operating conditions and to convert the different data
metrics into a comparable set of metrics
The analysis was also assisted by inputs from technical experts at three auto-manufacturers (GM
Ford and Toyota) obtained from interviews conducted by H-D Systems staff All three auto-
manufacturers interviewed suggested that this analysis for CRC use only the results from the
engine studies because they anticipated that in vehicle studies many variables were vehicle
calibration dependent and therefore largely uncontrolled in these studies As a result this study
focuses on engine data where all or most of the data on variables relevant to the study was
controlled andor documented
1 The literature review is available at the CRC website as Review to Determine the Benefits of Increasing Octane Number on Gasoline Engine Efficiency (CM-137-11-1) Task 1 report
vi
E2 IDEAL ENGINE EFFICIENCY AND RELATIONSHIP TO FUEL OCTANE NUMBER
The thermal efficiency of an engine using an ideal model of the SI engine operating on the Otto
cycle is a function of the compression ratio and is given by the relationship
t = 1 ndash (1CR) -1 (1)
where t is the thermal efficiency CR the compression ratio and the ratio of specific heat at
constant volume to the specific heat at constant pressure for the combustion gas2 In equation (1)
the efficiency is referred to as lsquoindicated efficiencyrsquo since it does not account for the effects of
friction and pumping losses This equation is true for naturally aspirated SI engines however
boosted engines require more complex equations relating the efficiencies of the compressor and
turbine or supercharger to engine speed and load to describe the net thermal efficiency of the
reciprocating engine and turbosuper-charger combination
The ideal model of the Otto cycle assumes instantaneous combustion of the air-fuel mixture but
actual combustion occurs over finite time and the spark timing affects efficiency The highest
torque (and hence the highest efficiency) at a given engine speed in revolutions per minute
(RPM) and at wide open throttle (WOT) occurs at a spark timing advance level from piston top
dead center (TDC) termed as lsquominimum for maximum brake torquersquo(MBT) timing Higher and
lower levels of spark advance away from the optimum result in reduction in torque and
efficiency However the maximum level of spark advance possible without causing abnormal
combustion or knock in an engine with a specific configuration is related to the fuel octane
number Hence there is a positive correlation between fuel octane number and efficiency as long
as the knock limited spark advance (KLSA) is less than MBT spark advance The fuel octane
number when the KLSA is equal to the MBT at WOT conditions is termed the octane number
requirement (ONR) of the engine
Although the ideal SI enginersquos efficiency relationship is specified by equation (1) the value of
to be used depends on the fuel composition and air-fuel ratio of the engine Air has a of 14 but
for a stoichiometric mixture the values are about 13 for the compression stroke and about 12
2In the case of other SI engine cycles like the Atkinson cycle or Miller cycle the relationship is somewhat different and involves both the compression and expansion ratio but the trend with compression ratio is similar to that of the Otto Cycle
vii
for the expansion stroke Fitting actual pressure-volume data from engines has typically provided
average values of 125 to 13 and values such as 128 are commonly used in the literature
However data from a very detailed modeling analysis by Nissan provided an indicated
efficiency curve with CR that we were able to replicate using a value of 1265
The relationship between engine ONR and CR is defined by a number of engine design and
operating variables including combustion chamber shape and size spark plug location cylinder
head and wall temperatures intake air temperature etc (The list of variables is intended to be
illustrative not comprehensive) The relationship of engine ONR to these variables has been
established empirically for specific engine designs but no simple theoretical relationship has
been determined However a key mechanism used to control knock in SI engines is the spark
timing which impacts the peak and average cycle pressure and hence the torque output of the
engine as well as its efficiency Maximum torque at any operating point (and hence maximum
efficiency) is obtained at MBT spark timing and any spark timing retard from this MBT timing
normally measured in crank angle degrees before TDC causes a reduction in torque as well as a
reduction in the engine octane number limit that we have termed as ONL for convenience The
change in mean effective pressure as a function of spark timing is well understood as is the
nature of the relationship
A study by MIT (Ref 3) provided a robust relationship between spark timing as measured in
degrees retard from MBT timing to Net Indicated Mean Effective Pressure (NIMEP) NIMEP is
the term used to describe average cylinder pressure over the entire two revolutions (720) of the
Otto Cycle Based on the data presented we derived the following equation for wide open
throttle
()(MBT)NIMEP()NIMEP(MBT) = 1 ndash 0512510-3 (s - s mbt)2 (2)
wheres is the spark timing and s mbt is the MBT spark timing This equation assumed that at
WOT NIMEP is approximately equal to IMEP since pumping losses are quite small typically
less than 2 of IMEP Equation (2) shows that a 10 spark retard from MBT timing results in a
51 relative loss in efficiency and a 20 degree retard reduces relative efficiency by 205
Hence small changes in spark timing from MBT have very small efficiency effects but the non-
linear nature of the relationship shows that retard over 10 can cause significant losses in
efficiency
viii
E3 OCTANE NUMBER MEASUREMENT AND FUEL OCTANE NUMBER
A fuelrsquos propensity to auto-ignite and cause ldquoknockrdquo is quantified in terms of the fuelrsquos octane
number (ON) The ON is measured on a standard engine called the CFR (for Cooperative Fuel
Research) engine where the engine is set to run at fixed intake conditions and RPM Modern
engines do not resemble the CFR engine and the measurement conditions for Research and
Motor Octane Number (RON and MON) do not represent typical engine intake air temperatures
cylinder pressures or operating RPM Hence the relationship between CR and fuel octane
number could be substantially different for modern engines
The relevance of RON and MON ratings to modern engines has been examined at the research
engine production engine and vehicle levels and documented in a number of papers and a new
rating termed octane index (OI) has been derived The basic principle is that the OI of a fuel for
modern engines can be expressed as a linear combination of the RON and MON values with K
as the weighting factor such that
OI = RON ndash K(RON ndash MON)
= RON ndash K S (3)
The term (RON ndash MON) in Equation 3 is called the Sensitivity (S) of the fuel In a study by
Shell (Ref4) 21 fuels with a wide range of RON and MON were tested in two single-cylinder
engines The study found that the engine torque increased with spark advance flattening out at a
maximum value at the MBT spark level and declining with further increases in spark advance as
predicted by Equation (2) Many fuels had too high a knock intensity at levels of spark advance
much less than the MBT level so that they were tested only to the knock limitK as defined in
the Equation (3) was determined for each RPMload test condition and was found to be negative
at low RPM (lt2000) and high load K increased with RPM but decreased with increased CR and
load The K value at any speedload condition appeared to be largely independent of fuel type or
RON The result of a negative K value is that for a fuel with Sensitivity (S)gt0the OI is greater
than either the RON or MON of the fuel In general K values that are small or zero imply that
fuel RON is much more important than MON for engine knock suppression and a negative K
indicates that lower values of MON are preferred
ix
Analysis conducted at MIT (Ref 6) and at other research facilities confirmed the finding that K
is negative for modern vehicles The MIT analysis also found that K was
- Only weakly dependent on spark plug location and CR (varying from 98 to 134)
- Non-linearly dependent on air-fuel ratio being highest at lambda = 1 but decreasing
at both richer and leaner air-fuel ratio
- Increased linearly with intake air temperature
- Decreased almost linearly with increased intake air pressure (boost)
The finding that K decreases with intake boost is particularly interesting since it implies that
more sensitive fuels are well suited to turbocharged engines as their OI is significantly higher
than the RON of the fuel The MIT paper indicated that at a boost level of 14 bar the K value
was -065 For a typical retail gasoline with a Sensitivity of about 10 octane numbers the -065
estimate indicates that the OI is 65 numbers above the RON at this boost level
However a recent study by Toyota found that hot spot related pre-ignition occurs at much lower
hot spot temperatures in a high CR engine than in a low CR engine and that the pre-ignition
temperatures for this engine with the different fuels showed MON to have a stronger relationship
than RON to pre-ignition temperature The study also found that increasing MON by 16 (from
80 to 96) resulted in pre-ignition temperature increasing by about 200 C Hence the study
concluded that a higher MON was useful in suppressing hot spot related pre-ignition
E4 EFFECTS OF FUEL COMPOSITION
Fuel composition affects the fuel octane index and latent heat of vaporization and can also
directly influence engine efficiency by changes in the mixture burning velocity Researchers
(Ref 10) find that paraffin compounds have high auto-ignition resistance at higher temperatures
where the kinetics of paraffin decomposition have a negative temperature coefficient Hence the
reference fuels which are a mixture of paraffin compounds are more resistant to knock at higher
temperatures similar to those encountered under the MON test conditions than olefin and
aromatic compounds At conditions closer to those of the RON test the olefin and aromatic
compounds have better knock resistance than paraffin compounds and mixtures containing
higher olefin and aromatic compounds can have an octane number higher than the octane number
of the reference fuel leading to a negative K value
x
In an analysis of fuel effects over a range of air-fuel ratios an ExxonMobilToyota paper (Ref
11) examined the burning velocities of fuels with different mixes of aromatic olefin and paraffin
compounds at values ranging from 1 to 17 The paper stated that laminar burning velocities
varied by more than 11 between the slowest and fastest fuels and that burning velocities
correlate well with olefin content and higher fuel volatility Tests on a variety of fuel
formulations on an engine operating at WOT 2400 RPM and = 1 showed that fuels with high
burning velocities gave up to 3 higher torque at the same spark advance The faster burning
fuels also allowed higher spark advance at the knock limit
In port fuel injected (PFI) engines much of the fuel is inducted into the cylinder after it has
vaporized due to heat transfer from the engine In direct injection (DI) engines the fuel is
introduced into the cylinder in liquid form and the vaporization of fuel causes a reduction in the
air-fuel mixture temperature relative to mixture for a PFI engine thereby reducing the octane
number requirement of the engine The latent heat of vaporization for gasoline is estimated at
420 kJkg and varies somewhat depending on gasoline composition However the introduction
of ethanol has a particularly large effect on temperature since it has a latent heat of vaporization
(LHV) which is approximately double that of gasoline In addition the stoichiometric air-fuel
ratio for ethanol is 90 compared to 145 to 147 for gasoline so that a larger quantity of ethanol
is required at stoichiometric conditions for a given volume of air Analysis shows that if all the
heat of vaporization is taken from the air the temperature drop with gasoline is about 20C while
the drop with ethanol is about 90C The lower temperature causes a significant reduction in the
ONR of the engine
E5 MAJOR FINDINGS OF THE ANALYSIS OF ACTUAL ENGINE EFFICIENCY
The effect of increasing fuel octane number on engine and vehicle energy efficiency cannot be
quantified in a simple way but requires a complex nuanced answer The following findings from
the literature review and analysis are the basis for the conclusions of this report
Relationship between Actual Engine Efficiency and Fuel Octane Number
1) The thermal efficiency of naturally aspirated engines primarily depends on the enginersquos
compression ratio but is also adversely affected by increasing surface to volume ratio of
the combustion chamber which depends directly on the CR and inversely on the cylinder
xi
displacement (and typically the bore size) As a result actual maximum indicated
thermal efficiency is almost constant beyond CR values of 14 for small bore engines
(lt70mm) and almost constant beyond a CR of 16 for bore size over 85mm The marginal
thermal efficiency benefit of increasing CR declines continuously with increasing CR 2) The engine octane number requirement (ONR) is primarily a function of the CR and to a
slightly lesser extent operating conditions of speed and air-fuel ratio It is also a function
of engine design variables such as the shape of the combustion chamber efficacy of
cooling and bore diameter3 The highest octane number requirement occurs at low RPM
(lt1500) and WOT for naturally aspirated engines
Naturally Aspirated Engines
3) The typical ONR for a port fuel injected naturally aspirated engine with a CR of 10 and a
bore diameter of about 85mm operating at = 1 1500 RPM is 100 to 102 RON at WOT
Smaller bore engines have a lower octane number requirement while larger bore engines
have a higher octane number requirement The relationship between ONR and bore
diameter is not well quantified in the literature but may be around 2 to 3 octane numbers
per 10mm based on the data collected for this study Hence a small bore engine (70mm)
at the same conditions can have an ONR of 96 to 99 while a large bore engine (100mm)
can have an ONR of 103 to 106 4) The ONR increases with engine CR by about 4 to 5 octane numbers per unit CR increase
(It is not clear if this relationship holds at higher CR values over 13) The ONR decreases
with RPM and the ONR dependence appears to be approximately linear with time per
revolution (the inverse of RPM) to about 40 ms (1500 RPM) but not all studies confirm
this The ONR declines by approximately 2 octane numbers per 10ms decline in the time
per revolution Hence the ONR declines by about 4 numbers between 1500 RPM and
3000 RPM (40ms to 20ms per revolution) 5) The engine actual octane number limit (ONL) is sensitive to spark timing advance and
air-fuel ratio and these are the two primary control levers used to prevent knock in
production naturally aspirated engines The ONL is reduced with spark retard from MBT
values and this relationship is approximately linear with the OR being reduced by 1
3 The variables listed are illustrative but this not a comprehensive list
xii
octane point for every 15 + 05 degrees spark retard The relationship becomes more
non-linear at retarded timing very close to MBT and at timing advance beyond MBT The
ONL at WOT is highest at of 095 to 1 and every 01 richer or leaner than this level
leads to about a 3 point reduction in ONL 6) The influence of spark timing on torque and engine efficiency is very nonlinear with the
first 5 crank angle degrees (CAD) retard from MBT reducing torque and relative
efficiency by only about 13 while a 10 CAD retard causes a 51 reduction Hence
spark retard by 5 from MBT can reduce the engine ONL by 3 to 4 numbers while having
only modest negative effects of about 13 on available torque and relative thermal
efficiency 7) With direct injection (DI) of the fuel into the cylinder the latent heat of evaporation of
the fuel cools the air-fuel mixture The cooling power of gasoline for a stoichiometric
mixture of air and fuel is about 24 kJkg air The reduced temperature reduces the octane
number requirement by one octane number for about 45 to 6 kJkg of cooling power
Hence direct injection of gasoline reduces the ONR by about 4 to 5 octane numbers
Ethanol has a cooling power that is about 4 times as high as gasoline suggesting a
potential ONL reduction of 16 to 20 octane numbers when a DI engine is fueled with neat
ethanol
Turbocharged Engines
8) The relationship between engine CR spark timing and engine ONL is more complex in a
turbocharged engine since the reciprocating engine and turbocharger act as system If the
engine is not boost limited the optimal combustion phasing for best torque is delayed
relative to that for a naturally aspirated engine since there is a compromise between
enthalpy flow to the turbine and the best torque achieved by the engine At high RPM the
boost air-fuel ratio and spark timing at WOT have to be limited not only to avoid knock
but also to limit turbine inlet temperature (which limits the employment of spark retard)
and engine peak pressure so that fuel octane number effects are very varied across
different operating conditions 9) The available data show that increasing fuel octane number increases mid-range torque (~
3000 to 4000 RPM) by 2 to 3 per octane number in RON for a turbocharged PFI
xiii
engine while increasing engine thermal efficiency by about 07 per octane point Low
RPM and high RPM torque are usually limited by other factors as well so that the effect
of octane number increase at these RPM levels may be engine design specific 10) Increasing octane number can have a very significant effect on mid-range torque for
turbocharged DI engines that are not boost limited Limited data on DI engines show that
an 8 increase in fuel RON can increase 3000 RPM torque by about 50 or about 5 per
octane number Torque benefits at high and low RPM may be much smaller as they are
subject to the same constraints as for PFI engines 11) The use of high ethanol concentration blends (E30 and higher) with gasoline may be
particularly beneficial to turbocharged DI engines for two reasons ndash the high RON and
the high cooling power Research shows that with high concentration ethanol blends the
combination of high boost and retarded timing allows knock free operation at very high
brake mean effective pressure (BMEP) levels Recent experimental work has shown the
capability of an E50 blend to allow engine operation at 38 bar to 40 bar indicated mean
effective pressure (IMEP) which is about twice the IMEP level of current gasoline
turbocharged DI engines These high IMEP values will not likely be reproduced in
production engines as ethanol has other limitations such as reduced hot spot pre-ignition
temperature relative to hydrocarbon gasoline
Special Conditions
12) The use of lean burn offers a substantial fuel economy opportunity especially at part load
conditions but is not used in the US due to difficulties in meeting emission standards
Under lean conditions with a homogeneous mixture lower RON fuels have been found to
give better engine efficiency because the lower octane number leads to a combustion
mode described as spark initiated compression ignition of end gases that are not fully
combusted with high octane number fuels If lean combustion becomes viable lower
RON fuels may be more desirable However the limiting condition for engine ONR may
still be at full load where stoichiometric or rich operation is desirable for maximum
power so that the fuel octane number will have to be tailored to this condition in actual
practice
xiv
E5 CONCLUSIONS
One objective of the project was to assess the impact of increasing fuel octane number on engine
and vehicle efficiency The conclusions for a 4 to 5 octane number increase are as follows
1) In PFI naturally aspirated engines with mid-size (~85mm) and larger bore sizes and a
compression ratio (CR) of 10 this octane number increase will facilitate a 1 point
increase in CR which can provide a 2 relative improvement in engine efficiency For
small bore sizes (~70mm) the increase in CR will be similar but the improvement in
engine efficiency will be smaller at 13 to 14
2) For midsize and large bore naturally aspirated DI engines that have a CR of 11 this
octane number increase will facilitate a 1 point increase in CR and allow engine
efficiency to increase by 15 to 16 Small bore engines will have an improvement of
08 to 085
3) Vehicle efficiency gains for vehicles with naturally aspirated engines can be somewhat
larger than engine efficiency gains due to increased engine torque when CR is increased
permitting engine down-speeding This can provide up to a 1 to 2 fuel economy gain
over and above engine efficiency gains
4) In turbocharged engines the effect of this improved octane number could be through the
increase in engine peak torque if the engine is not boost limited In PFI engines the 4 to 5
point octane number increase can provide 10 to 15 more torque In a DI engine this
increase in octane number can translate into a 20 to 25 increase in torque This torque
increase is for operation at 2000 to 4000 RPM at engine speeds below 1500 RPM and
above 4000 RPM other factors control available torque increases so that no general
conclusion is possible
5) The torque increases with turbocharged engines could allow significant downsizing and
down-speeding of the engine but the extent of downsizing and down-speeding is
dependent on engine low RPM performance As an example of the size of the potential
benefit a 5 to 7 fuel economy improvement is possible if the engine can be
downsized by 20 to 25 to keep absolute mid-range torque constant
6) If the octane number increase were to be derived by addition of ethanol to gasoline larger
torque increases may be possible in turbocharged DI engines due to the high latent heat
of vaporization of ethanol An E30 blend with 91 RON gasoline blend-stock could
xv
potentially improve torque by 50 but this level of increase is not proven in any vehicle
application and could be limited by ethanolrsquos lower resistance to hot spot pre-ignition
7) Developments in engine technology will allow CR to increase in the future with no
change to fuel RON and MON The increased use of DI technology will allow CR
increases of 1 unit Engine downsizing with resulting smaller bore sizes as well as the
use of cooled exhaust gas recirculation (EGR) and improved exhaust scavenging may
allow continuing increases in CR over the next decade with unchanged fuel octane
number
E6 DATA GAPS AND RECOMMENDATIONS FOR FUTURE RESEARCH
Two types of data gaps have been identified The first type is where the data exists but are not
public For example the data set is on actual engine efficiency and octane number requirement is
very limited across engine sizes and across the RPM range Other key variables with limited data
include the effect of spark timing as well as the effect of air-fuel ratio on fuel octane number
requirements across a range of engine bore sizes and RPM These data clearly exist for a wide
variety of production engines if manufacturers participate in sharing the data (the origin of the
data can be obscured to maintain confidentiality) the database could pave the way for
developing more robust relationships between efficiency and fuel octane number for different
bore sizes and operating conditions
The second type of gap is where the data available are too limited to provide specific
conclusions Data on turbocharged DI engines especially those with small displacement and
their response to fuel octane number and heat of vaporization in terms of efficiency and torque
improvement across a range of engine speeds (especially at low RPM)are very thin and often
derived from experimental engines Octane number improvements and improvements from
ethanol blends appear to hold significant promise but the available data are inadequate to
estimate the benefits in a real vehicle application Newer technologies are also not represented in
existing data The latest DI engines in Europe have sequential turbocharging with two stage
cooling experiments have been conducted with cooled EGR at all loads and speeds but little
information exists on the interaction with fuel octane number
The testing of turbocharged DI engines of different sizes and those equipped with newer
technology such as sequential turbocharging as well cooled EGR can permit a look forward into
xvi
the future interaction of fuel octane number and engine and vehicle efficiency Future research
should focus on these newest technologies for the greatest relevance to the future
xvii
TABLE OF CONTENTS
EXECUTIVE SUMMARY v
1 INTRODUCTION
11 ANALYSIS OBJECTIVES 1
12 FOCUS OF ANALYSIS 2
13 ORGANIZATION OF THIS REPORT 3
2 IDEAL MODELS OF ENGINE EFFICIENCY AND RELATIONSHIP TO FUEL
PROPERTIES
21 BACKGROUND 4
22 IDEAL CYCLE ENERGY EFFICIENCY 5
23 OCTANE NUMBER MEASUREMENT AND FUEL OCTANE NUMBER 9
24 FUEL COMPOSITION EFFECTS ON OCTANE NUMBER
AND EFFICIENCY 16
25 LATENT HEAT OF VAPORIZATION 18
3 NATURALLY ASPIRATED ENGINES
31 ACTUAL ENGINE EFFICIENCY 20
32 ENGINE OCTANE NUMBER LIMIT AND SPARK ADVANCE 28
33 ENGINE ONR 31
34 EFFECT OF LATENT HEAT OF VAPORIZATION OF FUEL 36
35 LEAN OPERATING CONDITIONS 39
4 TURBOCHARGED PORT AND DIRECT INJECTED ENGINES
41 OVERVIEW 43
42 PORT FUEL INJECTED ENGINES 44
43 DIRECT INJECTION ENGINES 48
xviii
5 FINDINGS AND CONCLUSIONS
51 MAJOR FINDINGS 53
52 STATUS OF CURRENT US NEW VEHICLE FLEET 57
53 CONCLUSIONS 60
6 DATA GAPS AND RESEARCH RECOMMENDATIONS 62
LIST OF ACRONYMS 64
REFERENCES 66
1
1 INTRODUCTION
11 ANALYSIS OBJECTIVES
The overall project objectives are to establish the relationship between engine (and vehicle)
energy efficiency for a SI engine and the octane number and composition of the fuel This
project is sponsored by the Coordinating Research Council (CRC) and is divided into several
tasks The detailed literature review4 conducted under Task 1 of this project revealed 45
technical papers that covered various aspects of the relationship between engine vehicle
efficiency and fuel octane number and composition The papers by research topic are as
follows
- 10 papers on single cylinder research engines
- 24 papers on prototype or production engines
- 4 papers on vehicle tests
- 6 papers that use simulation models and
- 1 review paper
It should be noted that the research focus of these papers was not uniformly on the
relationship between efficiency and fuel octane and in many of the papers the relationship
was only incidental to the main focus of that study The papers covered a wide range of
engine types fuel formulations engine operating conditions and testing constraints Results
were also presented using various metrics eg indicated and brake mean effective pressure
indicated and brake specific fuel consumption relative and absolute efficiency
The Task 1 review found that the relationship between octane number and efficiency was
influenced by a number of intermediate variables covering engine type operating condition
and fuel formulation Hence it was not possible to simply collate the data from the papers
and develop an average relationship considerable effort was required to organize the
reported data into subsets that had data for similar engine types and operating conditions and
to convert the different data metrics into a comparable set of metrics
4 The literature review is available at the CRC website as a separate Task 1 report
2
The analysis was also assisted by interview inputs from technical experts at three auto-
manufacturers (GM Ford and Toyota) obtained from interviews conducted by H-D Systems
staff The interviews provided qualitative inputs useful to the study and manufacturers also
provided two additional papers (References 32 and 37)released after completion of the
literature survey in late 2011 No confidential data directly relevant to the analysis were used
in this study so that all of the results of this study are based on literature in the public domain
All three auto-manufacturers interviewed suggested that this analysis for CRC use only the
results from the engine studies The manufacturers anticipated that in vehicle studies many
variables such as spark timing and fuel enrichment transmission shift points and others were
calibration-dependent and therefore largely uncontrolled in these studies Hence the
relationships between vehicle efficiency (fuel economy) and octane number could not be
derived in any consistent manner from these vehicle studies As a result this study focuses
on engine data where all or most of the data on variables relevant to the study was controlled
andor documented Results from simulation studies are used to develop the correct form of
the theoretical relationships between variables used in the analysis and are compared to
results from tests in some cases
12 FOCUS OF ANALYSIS
Task 1 of this study revealed that the engine operating points where octane number
constraints are typically critical are at WOT and low RPM (lt2000) for naturally aspirated
engines and at high boost and low RPM for turbocharged engines The combination of
stoichiometric operation at low RPM and wide open throttle is considered in some detail in
this analysis since much of the literature on octane Sensitivity and knock is focused on these
conditions While the focus of this analysis is on WOT and low RPM conditions (1200 to
2000 RPM) efficiency implications at part load conditions and at high RPM conditions are
also discussed in the following sections
As noted the issues related to knock and octane number are governed by many variables but
the focus of this analysis is more limited Since most SI engines today use 4-valve heads with
a central spark plug only limited data are available from other combustion chamber designs
with a spark plug at one side and no specific conclusions regarding spark plug location and
octane number were possible In addition issues regarding coolant temperature and intake air
3
temperature are not examined in any detail since for a fully warmed up engine these
temperatures do not vary much across the papers compiled for this study The issues of
octane number effects at part load and at non-stoichiometric air-fuel ratios are very relevant
for vehicle operation and are considered to the extent documented in these data
13 ORGANIZATION OF THIS REPORT
Section 2 of the report is a review of the engineering principles that govern the relationship
between engine efficiency and engine design and operating variables as well as a discussion
of the determination of a fuelrsquos octane number and its relationship to engine design and
operating variables The relationship between octane number and efficiency is then derived
in a two step process with these engine design and operating variables as the intermediate
variables Section 3 of this report examines the findings of the papers analyzed with respect
to naturally aspirated engines while Section 4 examined them with respect to turbocharged
engines Section 5 presents the major findings of the analysis in Sections 2 3 and 4 and
examines the relationships between CR and recommended fuel octane number for the current
US new vehicle fleet in the context of the findings The CRC had also requested specific
conclusions on the efficiency benefit associated with a 4 to 5 octane number increase in US
fuel specifications and these are provided by engine type at the end of Section 5 Section 6
identifies the data gaps in the collected literature and provides some recommendations for
future research directions
4
2 IDEAL MODELS OF ENGINE EFFICIENCY AND RELATIONSHIP TO FUEL PROPERTIES
21 BACKGROUND
The thermal efficiency of an engine using an ideal model of the SI engine operating on the Otto
Cycle is a function only of the compression ratio and is given by the relationship
t = 1 ndash (1CR) -1 (1)
where t is the thermal efficiency CR the compression ratio and the ratio of specific heat at
constant volume to the specific heat at constant pressure In the case of other SI engine cycles
like the Atkinson Cycle or Miller Cycle the relationship is somewhat different and involves both
the compression and expansion ratio but the trend with compression ratio is similar to that of the
Otto Cycle In equation (1) the efficiency is referred to as lsquoindicated efficiencyrsquo since it does not
account for the effects of friction and pumping losses This equation is true for naturally
aspirated SI engines but boosted engines require more complex equations relating the
efficiencies of the compressor and turbine or supercharger to engine speed and load to describe
the net thermal efficiency of the reciprocating engine and turbosuper-charger combination
Efficiency increases non-linearly with increasing CR according to equation (1) The ideal model
of the Otto Cycle assumes instantaneous combustion of the air-fuel mixture but actual
combustion occurs over finite time and the spark timing affects efficiency The highest torque
(and hence the highest efficiency) at a given RPM and WOT occurs at a spark timing advance
level from piston top dead center (TDC) termed as lsquominimum for maximum brake torquersquo or
MBT timing Higher and lower levels of spark advance away from the optimum result in
reduction in torque and efficiency and the shape of the relationship of torque to spark advance is
given by an inverted U-shaped curve However the maximum level of spark advance possible
without causing abnormal combustion or knock in an engine with a specific configuration is
related to the fuel octane number Hence there is a positive correlation between fuel octane
number and efficiency as long as the knock limited spark advance (KLSA) is less than MBT
spark advance The fuel octane number when the KLSA is equal to the MBT at WOT conditions
is termed the octane number requirement (ONR) of the engine and the relationship between fuel
5
octane number and efficiency only holds for fuel octane numbers below the ONR for a specific
engine
However even within this construct of relating fuel octane number to engine thermal efficiency
its application to the real world requires the detailed understanding of the impact of a number of
additional variables The peak indicated engine efficiency of naturally aspirated engines is a
function not only of compression ratio but also a function of the operating conditions such as air-
fuel ratio engine RPM and spark timing (EGR is currently not used at WOT but could be used
in the future) The absolute octane number requirement of an engine is also a function not only of
CR and operating conditions but also of other engine design variables such as combustion
chamber size and shape and engine cooling as well as ambient conditions of intake air
temperature and humidity The variables described are not intended to be comprehensive but are
illustrative The relationships of some of these independent variables to both the ONR and the
efficiency is non linear and can even be potentially decoupled from one another
The analysis in this report uses the data and findings from the literature search in Task 1 to
provide a more comprehensive picture of the most significant engine parameters affecting engine
efficiency and independently ONR The second part of the analysis links the two to provide an
understanding of the complex relationship between efficiency and octane number
22 IDEAL CYCLE ENGINE EFFICIENCY
Although the ideal SI enginersquos efficiency relationship is specified by Equation (1) the value of
to be used depends on the fuel composition and air-fuel ratio of the engine Air has a of 14 but
for a stoichiometric mixture the values are about 13 for the compression stroke and about 12
for the expansion stroke (Heywood Section 44 Ref 1) Fitting actual pressure-volume data
from engines has typically provided average values of 125 to 13 and values such as 128 are
commonly used in the literature However data from a very detailed modeling analysis by
Nissan (Muranaka Takagi and Ishida Ref 2) provided an indicated efficiency curve with CR
that we were able to replicate using a value of 1265 As shown in Figure 2-1 reducing the
value from 14 for an air cycle (where the gas in the cylinder contains only air) to 1265 for a
stoichiometric air-fuel mixture reduces the indicated efficiency by 14 to 15 absolute across
the range of CR values from 8 to 16
6
Figure 2-1
However as pointed out by Muranaka et al (Ref 2) the percentage effect of a unit change in
CR on thermal efficiency is always higher on the air-fuel cycle than on the air cycle since it starts
at a much lower value of efficiency This is shown in Figure 2-2 increasing the CR by 1 unit
from 9 improves indicated thermal efficiency by 373 relative percent5 and from a base of 11 CR
indicated thermal efficiency increases by 27 relative percent using idealized equations for an
air-fuel cycle However consideration of all of the losses in real engines leads to a somewhat
different relationship between indicated efficiency and CR
No ideal equation exists to relate the engine ONR to the compression ratio as this relationship is
defined by a number of engine design and operating variables including combustion chamber
shape and size spark plug location cylinder head and wall temperatures intake air temperature
etc (As before the list is intended to be illustrative not comprehensive) The relationship of
engine ONR to these variables has been established empirically for specific engine designs but
no simple theoretical relationship has been determined However a key mechanism used to
5 The term ldquorelative percentrdquo is used to denote the percent change in percent efficiency If absolute efficiency changes from 40 to 44 the 4 absolute change would equate to a 10 relative change
3500
4000
4500
5000
5500
6000
6500
7000
7500
7 8 9 10 11 12 13 14 15 16 17
Indicated Efficiency
Compression Ratio
Ideal Indicated Efficiency vs CR
Air Cycle
AF Cycle
7
Figure 2-2
control knock in SI engines is the spark timing which impacts the peak and average cycle
pressure and hence the torque output of the engine as well as its efficiency Maximum torque at
any operating point (and hence maximum efficiency) is obtained at MBT spark timing and any
spark timing retard from this MBT timing normally measured in crank angle degrees before
TDC causes a reduction in torque as well as a reduction in the engine octane number limit that
we have termed as ONL for convenience
It should be noted that as spark timing changes at constant RPM and wide open throttle total air
flow may be affected in a minor way due to changes in residual gas temperatures but the
following discussion assumes that the changes in volumetric efficiency and heat transfer with
spark timing can be neglected to provide the following approximation at WOT for any spark
timing relative to MBT conditions
IMEP()IMEP (MBT) ()(MBT)
where is the indicated efficiency The IMEP is the indicated mean effective pressure or the
cylinder pressure averaged over the compression and expansion stroke which is one revolution of
the engine (360)
000
050
100
150
200
250
300
350
400
450
500
7 9 11 13 15 17 19 21
Chan
ge in
Efficieny per CR
Compression Ratio
Theoretical Change in Efficiency per Unit CR Increase
Air Cycle
Fuel Air Cycle
8
The change in mean effective pressure as a function of spark timing is well understood as is the
nature of the relationship (Heywood Section 91 Ref1) A recent study at MIT (Ayala Gerty
and Heywood Ref3) provided a robust relationship between spark timing as measured in
degrees retard from MBT timing to Net Indicated Mean Effective Pressure (NIMEP) NIMEP is
the term used to describe average cylinder pressure over the entire two revolutions (720) of the
Otto cycle and is equal to IMEP ndash PMEP where PMEP is the pumping mean effective pressure
The authors developed a new combustion parameter that related the NIMEP at any spark timing
to the NIMEP at MBT spark timing with the formula
1 ndash NIMEP()NIMEP(MBT)= 0168 (( 1 + 0004443(50 - 50 mbt)2) 05 ndash 1)
Where 50 is the crank angle at 50 mass burn fraction and 50 mbt is the crank angle of the 50
mass burn fraction at MBT spark timing with the difference between the two variables termed
combustion retard The correlation was found to hold across a wide range of loads speeds and
air-fuel ratios This equation is difficult to use in practice since the 50 burn durations are not
known a priori Considering only stoichiometric air-fuel ratios and WOT operation the
combustion retard is closely correlated with spark retard from MBT and the data in Figure 2 of
the MIT paper for this condition were fitted to a quadratic with the resulting fit
()(MBT) = IMEP()IMEP(MBT) = 1 ndash 0512510-3 (s - s mbt)2 (2)
wheres is the spark timing and s mbt is the MBT spark timing This equation assumed that at
WOT NIMEP is approximately equal to IMEP since pumping losses are quite small typically
less than 2 of IMEP The curve fit in Figure 2-3 shows that a 10spark retard from MBT timing
results in a 51 relative loss in efficiency and a 20 degree retard reduces relative efficiency by
205 Hence small changes in spark timing from MBT have very small efficiency effects but
the non-linear nature of the relationship shows that retard over 10 can cause significant losses in
efficiency
The following sections of this report utilize the relationship (Heywood Section 132 Ref 1)
IMEP = BMEP + FMEP + PMEP (3)
where MEP is the mean effective pressure and I B F and P stand for Indicated Brake Friction
and Pumping respectively Data presented in Ref1 shows that the IMEP of most modern
naturally aspirated engines at wide open throttle stoichiometric operation at low RPM
9
(~1500RPM) ranges from about 11 to 125 bar while FMEP is around 08 bar to 09 bar and
PMEP at around 01 to 02 bar (due to pressure loss across the valves and the exhaust system)
Hence BMEP is 90 to 93 of IMEP Typically changes in IMEP at constant RPM do not
change FMEP or PMEP significantly so that the absolute IMEP change is equal to the absolute
BMEP change Hence a 10 change in IMEP results in a larger percentage change in BMEP of
10092 or 109 at WOT
Figure 2-3
23 OCTANE NUMBER MEASUREMENT AND FUEL OCTANE NUMBER
A fuelrsquos propensity to auto-ignite and cause ldquoknockrdquo is quantified in terms of the fuelrsquos octane
number The octane number is measured on a standard engine called the CFR (for Cooperative
Fuel Research) engine where the engine is set to run at fixed intake conditions and RPM The
engine CR is increased until the engine knocks at a specified intensity as measured by a pressure
transducer while the air-fuel ratio is set to maximize knock The procedure is then repeated
using a blend of iso-octane (which defines 100 octane) and n-heptane (which defines 0 octane)
and the blend is called a primary reference fuel (PRF) The volumetric percentage of iso-octane
07
08
09
1
0 5 10 15 20 25 30
Norm
alized NIM
EP
Spark Retard from MBT deg
NIMEP vs Spark Timing
10
is adjusted until a PRF is found that knocks at the same intensity at the same CR as the fuel
whose octane number is being measured The octane number of the fuel is equal to the
percentage of iso-octane of the PRF that has the same knocking tendency The PRF is a
combination of paraffins but the octane number of typical hydrocarbon fuels depends on the test
conditions since olefin and aromatic hydrocarbons found in commercial gasoline do not have the
same temperature dependence to auto-ignition as paraffins Hence the octane number is
measured at two test conditions one termed ldquoResearch Octane Numberrdquo (RON) test which
specifies a 52 C intake air temperature and an engine speed of 600 RPM with a fixed spark
timing of 13 degrees before top dead center The second test condition is termed ldquoMotor Octane
Numberrdquo (MON) test which specifies a 149 C intake air temperature and an engine speed of 900
RPM with spark timing varied set as a function of CR Under both test conditions air-fuel ratio
is varied to maximize knock By definition the RON and MON of a PRF are numerically the
same Octane numbers higher than 100 are measured using a mix of iso-octane and tetra-ethyl
lead (TEL) and a mixture containing 6 ml gallon TEL has an octane number of 1203
Modern engines do not resemble the CFR engine and the measurement conditions do not
represent typical engine intake air temperatures cylinder pressures or operating RPM These
conditions of RPM pressures and intake air temperature in modern engines are very different
Most modern SI engines operate between 1000 to 5000 RPM during normal driving and intake
air temperatures are close to ambient In addition the combustion chamber shape and air
turbulence in the chamber in modern engines promote substantially faster burn rates than in the
CFR engine Hence the relationship between CR and fuel octane number could be substantially
different for modern engines
The relevance of RON and MON ratings to modern engines have been examined at the research
engine production engine and vehicle levels by a number of papers and a new rating termed
octane index has been derived The basic principle is that the octane index (OI) of a fuel for
modern engines can be expressed as a linear combination of the RON and MON values with K
as the weighting factor such that
OI = (1-K)RON + K MON (4)
11
Equation 4 can be rearranged as
OI = RON ndash K(RON ndash MON)
= RON ndash K S (5)
The term (RON ndash MON) in Equation 5 is called the Sensitivity6 S of the fuel In a study by
Shell (Kalghatgi 2001 Ref 4) 21 fuels with a wide range of RON and MON were tested on two
single-cylinder engines with PFI and a more modern combustion chamber configuration and a
CR of 105(CR was reduced to 8 for some tests in one engine) The spark timing was advanced
until a limiting level of knock was reached with each fuel and the engine brake torque and knock
intensity were measured The study found that the engine torque increased with spark advance
flattening out at a maximum value at the MBT spark level and declining with further increases in
spark advance as predicted by Equation (2) Many fuels had too high a knock intensity at levels
of spark advance much less than the MBT level so that they were tested only to the knock limit
Figure 2-4
6 The capitalized word ldquoSensitivityrdquo in this report is used to denote the difference between RON and MON
80
85
90
95
100
105
110
‐4 ‐2 0 2 4 6 8 10 12
OCTA
NE NUMBER
KLSA at 1200 RPM DEGREES
OCTANE NUMBER vs KLSA
OI
RON
MON
Linear (OI)
Linear (RON)
12
Figure 2-5
The analysis found that the knock limited spark advance was poorly correlated with a fuelrsquos
MON and better correlated with RON but the best correlation was with the fuel OI Figure 2-4
shows the correlation of the different octane ratings with KLSA for one engine at 1200 RPM K
as defined in the equation above was determined for each RPMload test condition and was
found to be negative at low RPM (lt2000) and high load K increased with RPM but decreased
with increased CR and load The K value at any speedload condition appeared to be largely
independent of fuel type or RON The result of a negative K value is that for a fuel with
Sensitivity (S)gt0 the OI is greater than either the RON or MON of the fuel
K was found to decrease with increasing ONR of the engine at the different speedload and CR
values evaluated so that as the ONR of the engine increased K became more negative In a
follow on study by Shell and Toyota (Kalghatgi Nakata and Mogi Ref 5) with DI engines
operating at a CR of 11 and 125 the improved relationship of KLSA to the OI of the fuel
relative to the relationship with either RON or MON was confirmed although the paper reported
a quadratic relationship between KLSA and OI The fit may have been due to some high octane
number fuels used in this study that permitted the OI to meet or exceed the octane number
85
90
95
100
105
110
115
‐05 ‐04 ‐03 ‐02 ‐01 0 01 02 03 04
OCTA
NE NUMBER
REQ
UIREM
ENT
K FUEL SENSTIVITY WEIGHTING FACTOR
OCTANE NUMBER REQUIREMENT vs K
PFI
DI
Linear (PFI)
Linear (DI)
13
requirement of the high CR engine Figure 2-5 shows the relationship between K and the engine
ONR and there is a general trend for K to be more negative with increasing ONR but the data
scatter on K is apparent suggesting that K is influenced by other factors such as engine
combustion chamber design as well
Figure 2-6 shows the KLSA as a function of the OI of the fuel for a DI engine with 125 CR
(from Ref 5) and the departure from linearity is obvious for the high OI fuels while the linear fit
Figure 2-6
is quite good for the low OI fuels As the fuelrsquos OI approaches engine ONR it appears that
knock limited spark advance increases rapidly and the quadratic relationship is similar to that
observed between engine torque and spark advance ie both engine torque and knock become
less sensitive to spark advance when the fuelrsquos octane index is close to the engine ONR and
timing is close to MBT
The finding that K was negative for modern engines was validated by tests at MIT (Mittal and
Heywood 2008 Ref 6) conducted on a single cylinder engine with a CR of 98 at 1500 RPM
‐5
0
5
10
15
20
85 90 95 100 105 110 115
KLSA D
EGREES
OCTANE INDEX
KLSA at 2000RPM vs OIDI ENGINE WITH CR=125
KLSA LOW OI FUELSKLSA NEAR ENGINE OR
14
WOT and a of 1 Tests were conducted on fuels with almost similar RON of about 96 but with
MON values ranging from 875 to 96 The KLSA was found to increase linearly with increasing
fuel Sensitivity (decreasing MON) K was also found to increase with RPM similar to the
finding by Kalghatgi (Ref 4) When we plotted K against 1RPM (or time per revolution) for
both the MIT and Shell data sets a linear dependence of K was observed but the dependence
with RPM was different for the two engines as shown in Figure 2-7 In this case 20ms
corresponds to 3000 RPM while 50ms corresponds to 1200 RPM
Figure 2-7
The reduction in K implies that the RON rating is most important at lower RPM while the MON
becomes a factor in knock resistance at high RPM The MIT analysis also found that K was
- Only weakly dependent on spark plug location and CR (varying from 98 to 134)
- Non-linearly dependent on air-fuel ratio being highest at lambda = 1 but decreasing
at both richer and leaner air-fuel ratio
- Increased linearly with intake air temperature
- Decreased almost linearly with increased intake air pressure (boost)
‐06
‐05
‐04
‐03
‐02
‐01
0
01
02
03
15 20 25 30 35 40 45 50 55
K
TIME PER REVOLUTION MILLISECONDS
K (OCTANE WEIGHTING FACTOR) vs 1RPM
K(MIT)
K(SHELL)
Linear (K(MIT))
Linear (K(SHELL))
15
The finding that K decreases with intake boost is particularly interesting since it implies that
sensitive fuels are well suited to turbocharged engines as their OI is significantly higher than the
RON of the fuel The MIT paper indicated that at a boost level of 14 bar the K value was -065
For a typical retail gasoline with a Sensitivity of about 10 octane numbers the MIT estimate
indicates that the OI is 65 numbers above the RON at this boost level
In a subsequent paper Mittal and Heywood (2009 Ref 7) examined the historical relevance of
RON and MON based on the results from CRC octane number surveys from 1950 to 1990 where
identical tests had been performed to determine vehicle OI with primary reference fuels and full
boiling range fuels K was determined by the equation
K = (RON ndash ON) S (6)
Where RON is the research octane number for the full boiling range fuel and S its Sensitivity
and ON is the octane number of the primary fuel The computations showed that K values had
decreased over time with average K values declining from 028 in 1951 to just under 01 in 1991
This was in spite of the fact that the average knock-limited engine speed increased from 1500
RPM in 1951 to about 2400 in 1991 as K increases with increasing RPM The paper suggested
that increasing CR the reduction of intake air temperature by eliminating intake air pre-heat
improved volumetric efficiency improved engine cooling and decreased bore size were the
contributing factors Simulation modeling of typical engine designs for a 1951 engine and a
modern turbocharged engine supported the calculated values of K The authors suggested that
with the use of DI and turbo-charging K would decline further In an earlier review paper
Kalghatgi (2005 Ref9) came to a similar conclusion suggesting that future engines would avoid
knock using fuels with a lower MON and higher RON
A 2011 paper by Toyota (Sasaki et al Ref37) supports the view that higher MON will continue
to be required in the future to avoid other forms of abnormal combustion The study investigated
pre-ignition due to hot spots by controlling the spark plug center electrode temperature Two
engines were used in the study one a DI engine with a CR of 115 and the second a PFI engine
with a CR of 15 The second engine was used to simulate the cylinder pressures under boosted
conditions for a turbocharged engine the high CR was chosen to obtain better control of cylinder
pressure as in a turbocharged engine the boost pressure varies with spark timing Three
gasolines with different RON and Sensitivity and 15 specific hydrocarbon compounds covering a
16
range of paraffin olefin and aromatic compounds were tested The study confirmed that near
linear relationship of engine torque with fuel RON at 4400 RPM WOT However the study
found that pre-ignition occurs at much lower hot spot temperatures in the high CR engine and
that the pre-ignition temperatures for this engine with the different fuels showed MON to have a
stronger relationship than RON to pre-ignition temperature The study found that increasing
MON by 16(ie from 80 to 96) resulted in pre-ignition temperature increasing by about 200
C The coefficient of determination (R2) of pre-ignition temperature with MON was 093 while it
was only 066 with RON Hence the study concluded that a higher MON was useful in
suppressing hot spot related pre-ignition
24 FUEL COMPOSITION EFFECTS ON OCTANE NUMBER AND EFFICIENCY
Retail fuels for SI engines are a mixture of aromatic paraffin and olefin compounds and can
also include oxygenates like ethers and alcohols The compounds can influence octane number
and fuel efficiency of engines differently since they have different combustion kinetics and
different flame speeds in mixtures with air
A chemical kinetic modeling study by Mittal Heywood and Green (Ref8) concluded that the
auto-ignition chemistry for modern engines occurs in the transition between high temperature
and low temperature combustion regimes corresponding to end-gas temperatures between 500C
and 625C Fuels with higher octane Sensitivity have a stronger temperature dependence of the
auto-ignition delay time which results in slower low temperature combustion and faster high
temperature combustion Modern engines operate with end gas temperatures well below the high
temperature regime where sensitive fuels are less prone to auto-ignite Hence fuels with higher
Sensitivity will be less prone to auto-ignite (ie will show higher octane numbers) when this is
the case
In a review paper Kalghatgi (Ref 9) speculates that the RPM dependence of K could be the
result of a reduction in heat transfer due to less time available and hence resulting in an increase
in mixture temperature and an increase in the pressure rise rate As the end-gas temperature
increases the conditions become closer to those for the MON test and the importance of the
MON increases making K more positive Akihama et al (Ref10) find that paraffin compounds
have high auto-ignition resistance at higher temperatures where the kinetics of paraffin
decomposition have a negative temperature coefficient Hence the reference fuels which are a
17
mixture of paraffin compounds are more resistant to knock at MON conditions than fuels
containing olefin and aromatic compounds At conditions closer to those of the RON test the
olefin and aromatic compounds have better knock resistance and mixtures containing higher
olefin and aromatic compounds can have an octane number higher than the octane number of the
reference fuel leading to a negative K
In an analysis of fuel effects over a range of air-fuel ratios an ExxonMobilToyota paper
(Farrell et al Ref 11) examined the burning velocities of fuels with different mixtures of
aromatic olefin and paraffin compounds at values ranging from 1 to 17 The paper reported
that laminar burning velocities varied by more than 11 between the slowest and fastest fuels
and that burning velocities correlate well with olefin content and higher fuel volatility
Figure 2-8
Figure 2-8 shows the burning velocity of two fuels as a function of air-fuel ratio and that the
burning velocity increases by a factor of 3 between at 09 to 16 Fuel 2 had a 35 aromatic
and 25 olefin content while Fuel 3 had a 35 aromatic and a 8 olefin content Tests of these
0
01
02
03
04
05
06
07
070 090 110 130 150 170 190
BURNING VELOCITY (ms)
LAMBDA
BURNING VELOCITY vs LAMBDA
Fuel 2
Fuel 3
18
fuels on an engine operating at WOT 2400 RPM and = 1 showed that fuels with high burning
velocities gave up to 3 higher torque at the same spark advance The faster burning fuel also
allowed higher spark advance at the knock limit
25 LATENT HEAT OF VAPORIZATION
In PFI engines much of the fuel is inducted into the cylinder after it has vaporized due to heat
transfer from the engine In DI engines the fuel is introduced into the cylinder in liquid form
vaporization of the fuel causes a reduction in the air-fuel mixture temperature relative to mixture
for a PFI engine thereby reducing the octane number requirement of the engine The latent heat
of vaporization for gasoline is estimated at 420 kJkg and varies somewhat depending on
gasoline composition However the introduction of ethanol has a particularly large effect on
temperature as it has a latent heat of vaporization(LHV)which is approximately double that of
gasoline per unit weight at 845 kJkg as reported by Toyota (Nakata et al 2006 Ref 12) In
addition the stoichiometric air-fuel ratio for ethanol is 90 compared to 145 to 147 for gasoline
so that a larger quantity of ethanol is required at stoichiometric conditions for a given volume of
air Ethanol also has a RON of 111 giving it high knock resistance Others have quoted much
higher numbers and an MIT paper (Bromberg and Cohn Ref 13) cited the RON as 129 and the
MON as 102 (which are blending octane numbers) and list the latent heat of vaporization as 910
kJkg However ethanol air mixtures have lower flame speeds than gasoline air mixtures
In a PFI engine the vaporized ethanol volume (to the extent that the ethanol is vaporized before
induction into the cylinder) displaces air and reduces the air volume relative to the air volume
with gasoline so that the engine volumetric efficiency is reduced When used in a DI engine
there is virtually no air displacement effect and the charge cooling due to ethanolrsquos higher LHV
results in volumetric efficiency improvements In the study of knock behavior in a turbocharged
DI engine Milpied et al (Ref 31) compute a ldquocooling powerrdquo value defined as latent heat of
vaporization air-fuel ratio at stoichiometric conditions They used latent heat of vaporization
values of 335 kJkg for gasoline and 910 kJkg for ethanol so the cooling power for ethanol is
44 times that of gasoline while the 845 kJkg value cited above suggests a cooling power
improvement by a factor of 31A paper by Brewster (Ref 33) shows that if all the heat of
vaporization is taken from the air the temperature drop with gasoline is about 20C while the
drop with ethanol is about 90C (using latent heat values closer to those of Ref 31)
19
While ethanol has a lower energy density relative to gasoline the larger quantity of ethanol
required for a stoichiometric mixture with air results in the energy density of the ethanol -air
mixture being only 1 to 2 lower than a stoichiometric gasoline air mixture Hence the use of
ethanol can create some power loss in a PFI engine if most of the fuel enters the cylinder after
vaporization but can result in a power gain in a DI engine due to the colder mixture with ethanol
fuel The power loss or gain does not directly impact engine efficiency but can have secondary
impacts on vehicle efficiency if the power changes are accounted for by changes in engine size
or gear ratio
20
3 NATURALLY ASPIRATED ENGINES
31 ACTUAL ENGINE EFFICIENCY
While the idealized relationship between efficiency and CR was developed in the previous
section real engines have a number of losses that result in the actual indicated efficiency being
much lower than predicted by the ideal cycle relationship Muranaka et al (Ref 2) at Nissan
have estimated the factors that reduce indicated efficiency as follows
- Cooling losses which occur due to heat transfer from the combustion chamber to the
coolant
- Time loss which accounts for the fact that combustion is not instantaneous but occurs as
the piston is moving
- Unburned fuel loss which accounts for portion of fuel that is exhausted as a hydrocarbon
or a product of partial combustion
The analysis developed from detailed simulations in Ref 2 shows that as cylinder volume is
reduced the indicated efficiency decreases At a compression ratio of 9 indicated efficiency
decreases from almost 40 at 2000 cc swept volume to about 36 at 200cc which is a 10
relative loss in indicated efficiency (440) The analysis also found that heat transfer losses and
indicated efficiency reductions were linearly proportional to the combustion chamber surface to
volume ratio
The effect of combustion occurring over a finite time period was also evaluated in Ref 2 and the
authors found unlike historical assumptions that instantaneous combustion would result in the
highest efficiency a combustion duration of 30 crank angle degrees (CAD)was optimal at
shorter durations the higher pressure and temperature resulted in higher heat loss offsetting the
improvement from reduced time loss However the shape of the efficiency curve as a function of
combustion duration shows a broad and relatively flat peak over the 0 to 40 CAD range and the
shape is relatively independent of CR changes over this CAD range
The effect of unburned fuel was also estimated as a function of engine out HC emissions and an
engine out emissions of 3000 ppm HC was equivalent to 2 unburned fuel at = 1 HC
21
concentration increases with decreasing bore size and increasing CR but no specific
relationships were given Estimates of unburned fuel range from 25 to 5 for current engines
but this may be larger for high CR engines and especially for the combination of high CR and
small cylinder size In general available literature treats this effect empirically by multiplying
the engine efficiency computed assuming complete combustion by 096 or 097 as a combustion
efficiency parameter cA smaller value may be required for small bore and high compression
engines
In an attempt to provide a unified estimate of actual efficiency we used the air-fuel cycle
efficiency as a starting point and examined the cooling loss effect for the simplified example of a
disc shaped combustion chamber The surface to volume ratio (SV) of a disc shaped combustion
chamber of height Land bore size b is given by
SV = (b22 +bL) (b2L4) (7)
The combustion chamber height L can be related to the stroke s and compression ratio CR by
CR = L+s L or L = s (CR-1)
Substituting the above expression for L in equation(1) for SV gives
SV = (2(CR-1)s + 4b) or
SV = 2b ((CR-1)bs + 2) (8)
In many modern engines the bore and stroke are very nearly equal (sometimes referred to as a
ldquosquarerdquo engine) and for bs 1 equation (2) simplifies to
SV = 2(CR+1)b (9)
In equation 9 any decrease in bore size also results in displacement reduction due to the
assumption that b = s Since the simulation models show that cooling loss is linearly proportional
to the SV ratio we utilized the following model to fit the actual measured data
HT = (1- A(CR + 1)b) (10)
I = t (1- A(CR + 1)b) c (11)
Where ithe indicated efficiency of a real engine t the ideal cycle efficiency for = 1265 as
described in Section 2 HTthe heattransfer related factor A a constant and c the combustion
22
efficiency parameter In Reference 2 Nissan reported data on two engines one with 500cc swept
volume and the other with 250cc swept volume The bore and stroke were not reported in the
paper and b was computed assuming the bore and stroke were equal so that bore sizes were
86mm for the 500cc engine and 6825mm for the 250cc engine
The fit of this equation to the actual data at 1500 RPM proved to be excellent for constant A =
113mm and c = 096 for the 500cc engine and 095 for the 250cc engine (which is consistent
with the concept that smaller bore engines have higher unburned fuel loss) The same value of c
was used for all compression ratios and we assume that the CR dependence of c has been
subsumed into the heat transfer loss constant k The table below shows the computed efficiency
from the equation to the actual data points (as estimated from the figure) reported by Nissan
Compression
Ratio
Computed
500cc engine
Reported
500cc engine
Computed
250cc engine
Reported
250cc engine
8 3579 358 3425 342
9 3673 3675 3500 350
10 3743 374 3549 356
12 3832 383 3596 359
14 3870 387 3592 Not reported
The relationship of indicated efficiency to CR for the two engines derived above is shown in
Figure 3-1 and the impact of bore size reduction is significant ndash at a CR of 13 the smaller
engine has an efficiency that is 67 (relative) less than that of the larger engine (36 vs 386
absolute) The marginal benefit of a unit increase in CR from 9 to 10 is only 15 and the
equation projects that for engine sizes of 250cc cylinder increasing CR beyond 13 has no
benefit to efficiency The three auto-manufacturers interviewed for this project stated that their
own experience with a 75mm bore engine showed an efficiency maximum at a CR of about 135
to 14 somewhat higher than predicted by this equation
23
Figure 3-1
Ayala Gerty and Heywood from MIT (Ref 3) also plot the increase in NIMEP (IMEP at
WOT) with CR for an engine with an 83mm bore Their paper reports a quadratic curve fit as
NIMEP(NIMEP)98 = 0126 + 0137CR ndash 000487(CR)2 (12)
The fit appears to be based on only three data points at 98 116 and 134 CR the reported
baseline gross efficiency of 390 at 98 CR closely matches the estimate from the equation
derived above without the combustion efficiency parameter and this parameter is not referenced
in the text of the MIT paper However the rate of change of efficiency implied by the quadratic
fit in Equation 12from a CR of 10 to 11 is 345 relative which is much higher than estimated
by Equation 11 and the quadratic estimates a sharp efficiency peak at a CR of 1407 The high
rate of change and peak at 1407 CR implied by the quadratic are not supported by data from
other papers However the consensus view of the three auto-manufacturers consulted was that
3400
3450
3500
3550
3600
3650
3700
3750
3800
3850
3900
7 8 9 10 11 12 13 14 15 16 17
Indicated Efficiency
Compression Ratio
Indicated Efficiency vs CR Nissan Engine Data
86mm bore
6825 mm bore
24
increasing the CR from 10 to 11 would yield about 2 relative efficiency increase Even the
simulations in Reference 2 show significantly higher improvement in thermal efficiency with the
500cc engine showing a 12 relative increase in efficiency with CR increasing from 9 to 16
compared to about 8 from the fit to the measured data points
While there is limited data on absolute efficiency changes with CR from modern engines at
WOT there is more data at part load points Both the Nissan and MIT papers show that the
absolute value of indicated efficiency decreases with decreasing load For example the MIT
paper projects that indicated efficiency declines from about 35 absolute at 8bar1500RPM to
about 33 absolute at 2bar1500 RPM at a lambda of 1 However the relative changes in
indicated efficiency with load were found to be very similar over a range of CR values so that the
normalized changes should be indicative of the change in efficiency at WOT
A comprehensive analysis of the impact of RON and engine thermal efficiency was conducted
by Nakata et al (Ref 15) on naturally aspirated PFI engines one with an Atkinson Cycle and
the second with a normal Otto Cycle Both engines were dimensionally identical with a 75 mm
bore and 847 mm stroke and had a CR of 13 but the Otto cycle engine was also tested at a CR
of 10 Tests on two gasolines with a RON of 915 and 996 respectively were conducted at a
range of loads at 2000 RPM As shown in Figure 3-3 below the higher CR on the Otto Cycle
results in a significant increase in part load efficiency even with the 92 RON gasoline but spark
retard at full load on the 13 CR engine to prevent knock while operating on the 915 RON
gasoline results in brake efficiency levels below those of the 10 CR engine With the 996 RON
gasoline the 13 CR engine was knock limited only at full load but allowed peak thermal
efficiency to improve by 15 relative to the peak efficiency of the 10 CR engine The benefits of
higher RON gasoline to efficiency with the Atkinson Cycle engine (not shown in the figure
below) were much smaller since the effective CR is much lower than the geometric CR of 13
A more recent paper by Nakata et al of Toyota (Ref 15) showed a 9 relative increase in
brake thermal efficiency when CR was increased from 98 to 13 in a 885mm bore size engine or
a 28 increase per CR at a BMEP of 02 MPa Even allowing for the fact that brake thermal
efficiency increase can be higher than indicated efficiency increase the difference cited in both
Toyota papers is larger than that shown by Nissan engine data
25
20
22
24
26
28
30
32
34
36
38
40
0 02 04 06 08 1 12
Brake
Therm
al Efficiency
BMEP Mpa
Effect of CR and RON on Efficiency
CR = 10 915RON
CR = 13 915 RON
CR = 13 996 RON
Figure 3-2
Similarly a paper by Munoz at al of Ford (Ref 14) showed indicated efficiency at 3 part load
points for a PFI engine with a bore size of 89mm from a CR of 85 to a CR of 11 and indicated
efficiency rises by 9 to 10(relative) over the range (See Figure 3-3)The trend line shows a
09 to1 increase in absolute efficiency per unit CR increase or about a 3 increase in relative
efficiency per unit CR increase
Based on the higher sensitivity of efficiency to CR reported by the Toyota and Ford papers we
modified the heat transfer loss HT to fit the simulated efficiency values reported in Reference 2
without the combustion efficiency factor so that the equation was modified to
HT = 096 (1- A(CR + 1)b) (12)
where the 096 factor was incorporated to model heat transfer loss independent of combustion
surface-to-volume ratio and constant A was estimated to be 08mm
26
Figure 3-3
The equation yielded a good fit to the simulated results in Reference 2 over the CR range from 9
to 14 at 1500 RPM but appeared to underestimate the benefit of CR at values over 14 The
computed efficiency versus CR and the marginal benefit of CR increases computed using this
equation for heat transfer in Equation (4) are shown in Figures 3-4 and 3-5 respectively The
marginal benefit is of particular interest to the study and the projected benefit increasing CR
from 10 to 11 is around 2 (relative)for the larger bore engines consistent with auto-
manufacturer inputs on this issue In addition the benefits of increasing CR beyond 14 are less
than 05 per unit increase for small bore engines and small increases in friction with increasing
CR could eliminate this benefit in indicated efficiency The marginal benefits should be
applicable over a range of loads at 1200 to 2000 RPM indicated efficiency increases at higher
RPM especially at higher compression ratio Reference 2 reported that indicated efficiency
increased by 3 (relative) at 3000 RPM and 5 (relative) at 6000 RPM relative to the value at
1500RPM at a CR of 14 However at a CR of 9 the increases at higher RPM were negligible
The higher engine speeds affect the cooling loss due to reduced time for heat transfer and
become significant when cooling loss ratios are high ie for higher SV ratios
32
33
34
35
36
37
38
8 9 10 11 12 13
Indicated Efficiency
Compression Ratio
Efficiency at Part Load vs CR
1bar1500RPM
2bar2000RPM
26bar1500RPM
Linear (1bar1500RPM)
Linear (2bar2000RPM)
27
Figure 3-4
Figure 3-5
34
35
36
37
38
39
40
41
7 8 9 10 11 12 13 14 15 16 17
Indicated Efficiency
Compression Ratio
Indicated Efficiency vs CR at 1500 RPM
86mm bore
6825 mm bore
Bore = Stroke
‐050
000
050
100
150
200
250
300
350
7 8 9 10 11 12 13 14 15 16 17
Chan
ge In
Efficiceny per CR In
crease
Compression Ratio
Relative Efficiency Improvement Per Unit CR Increase at 1500 RPM
86mm Bore
6825mm Bore
1006mm Bore
Bore = Stroke
28
It should also be noted that none of the papers reviewed suggest that the method of fuel induction
affects the indicated efficiency ie port fuel injection or direct injection should have the same
indicated efficiency if all other factors such as bore size CR and RPM are held constant
32 ENGINE OCTANE NUMBER LIMIT AND SPARK ADVANCE
It is well known that the actual engine ONR is a function of many engine design variables but is
primarily a function of the engine CR spark timing and operating point (speed and load) and to
a somewhat lesser degree a function of the engine bore size and air-fuel ratio In general the
engine ONR is defined as the octane number of the PRFthat allows the knock limited spark
advance (KLSA) timing to equal the MBT spark timing at wide open throttle and is a function of
the RPM for a given engine Because of the multivariate nature of the relationship and the fact
that spark timing is the primary control variable used to tune the engine for a particular octane
number fuel the relationship between fuel octane number and spark advance is first detailed
Spark retard from MBT timing reduces the tendency to knock at a given fuel octane number and
the relationship between the level of timing retard and fuel octane number has been extensively
studied by Shell (Kalghatgi Ref 4) Tests conducted on a single cylinder engine with a 4-valve
pent roof combustion chamber (fuel system not documented but appears to be port fuel injected)
and a CR of 105 with a variety of fuels provide the relationship between KLSA and fuel octane
index (defined in Section 23) as shown in Figure 3-4The figure shows a very linear relationship
between fuel octane number and spark advance with the last data point close to spark advance at
MBT The MBT level was indicated as 9 at 1200 RPM with an engine ONR of 1051 and 125
at 3000 RPM with an engine ONR of 1033 so that both the KLSA and ONR of the engine are
strong functions of RPM The 1200 RPM data provides a relationship of spark advance to OI of
about 1 degree per octane number while the 3000 RPM data provides a relationship of 1 degree
per 3 octane numbers The same paper also provided data on an engine with a smaller bore size
of 75mm and the data at 1200 RPM is shown in Figure 3-5 below While the ONR of this engine
at 1200 RPM is given in the paper as 102 at a MBT timing of 14 degrees one data point at an OI
of 1053 and a KLSA of 205 is provided suggesting further increases in spark timing beyond
ONR and is plotted separately
29
Figure 3-4
‐5
0
5
10
15
20
25
94 96 98 100 102 104 106 108
Spark Timing BTD
C deg
Fuel Octane Index
Fuel Octane Index vs Spark Timing BTDC (=1) 1200 RPM
86mm bore
75mm bore
75 mmgtMBT
Linear (86mm bore)
Linear (75mm bore)
Figure 3-5
‐4
‐2
0
2
4
6
8
10
12
14
92 94 96 98 100 102 104 106 108
Spark Timing BTD
C d
eg
Fuel Octane Index
Fuel Octane Index vs Spark Timing BTDC (=1)
KLSA at 1200RPM
KLSA at 3000RPM
30
These data suggest the KLSA vs OI relationship extends beyond the MBT spark level but the
data presented in Section 2 and Figure 3-5 suggest that relationship is not linear at spark timings
close to MBT The smaller bore engine also appears to have a higher spark timing coefficient of
14 degrees per octane number Similar tests conducted at Ford (Russ Ref16) on a single
cylinder PFI engine with a 4 valve head bore size of 902mm and a CR of 10 showed that there
was a 5 to 6 degree difference in knock limited spark advance between two fuels with 97 and 91
RON (MON not given) showing the same coefficient of 1 degree advance per 1 octane number
increase found by Kalghatgi in Ref 4 but Russ (Ref 16) found this difference to be near
constant from 1000 to 3000 RPM He also cites other research confirming this 1 degree per 1
octane number coefficient
The analysis by Russ on the relationship of octane number to other variables in Ref 16 examined
the effect of CR on spark advance with a 91 RON fuel over the 1000 to 3000 RPM speed range
He found that the 91CR engine allowed about 5 to 6 degrees spark advance at KLSA over the
10CR engine with the plots essentially mirroring the plot of spark advance with RPM for the 97
and 91 RON gasoline Russ concludes that a unit increase in CR changed the engine ONR by
about 5 octane numbers and also cited work much older work by Caris and Nelson (Ref17) who
found that increasing the CR from 9 to 11 resulted in approximately a 9 octane number increase
in the engine OR Russ also examined the effect of enrichment on engine ONR He concluded
that the ONR is highest at = 095 and declines by 3 octane numbers for every 01 increase or
decrease from the 095 value
A similar study by Haghgooie (Ref 18) at Ford on a single cylinder 4-valve engine with 94mm
bore and a CR of 87 reported that the KLSA difference between a 91 and 97 RON fuel was
around 8 degrees at 1500 rpm and of 1 which is higher than the 1 degree per octane point
reported in other studies suggesting that the CR may affect the relationship as well His analysis
also found that increasing inlet air temperature by 60C resulted in KLSA being retarded by
about 8 degrees Mittal and Heywood (2008Ref6) at MIT examined the influence of octane on a
single cylinder 4 valve engine of 83mm bore at three different CR values of 98 118 and 134
(the engine being similar to the one used in Ref 3) The Mittal and Heywood study (Ref 6)
focused on the issue of octane index by testing fuels with several different MON values but
nearly identical RON values Testing conducted at 1500 RPM and 1 bar intake air pressure
31
(essentially at WOT) with a of 1 showed that a 4 increase in fuel octane index resulted in
KLSA being advanced by a little less than 6 degrees (CR not provided) which is more consistent
with the result from Haghgooie The relationship of KLSA to fuel OI was found to be linear In a
study by Millo et al (Ref19) using a production Fiat engine with a bore size of 864mm a CR
of 92 tests were conducted at a wide range of RPM at WOT and a of 09 At 2000 RPM the
KLSA difference between a 94 and 98 octane number PRF was about 7 and was nearly
constant to 4000 RPM where the difference was about 8 Hence the KLSA to ON relationship
appears to be higher on average than 1 degree per ON suggested with the other studies reporting
a sensitivity of 15 to 2 degrees spark advance per ON
It is not clear if some of these differences in the octane number to spark advance relationship are
due to differences in measurement methods since the specific knock intensity level which is
considered the ldquoknock limitrdquo is not precisely defined In addition the MBT spark advance is
difficult to determine precisely since the torque peak is broad and timing changes of plus or
minus 2 degrees may be observed in measurement of MBT spark advance as seen in Figure 2-3
These same concerns would apply to the measurement of ONR for a particular engine
33 ENGINE ONR
Due to the many factors affecting the ONR for a particular engine the data available do not have
the uniformity in test conditions and engine conditions to derive a robust relationship between
engine CR and bore size to octane number requirement Data from Kalghatgi (Ref4) offers the
most consistent series of measurements on the ONR and the data are shown in the table below
for tests conducted at WOT with a of 1 on port fuel injected engines
Engine Bore Size CR RPM KLSA(MBT) ONR
A 86 105 1200 9 1051
A 86 105 2000 12 1033
A 86 105 3000 125 1010
A 86 8 1200 15 881
B 75 105 1200 14 102
B 75 105 2000 15 964
32
The data for Engine A indicates that an increase of CR from 8 to 105 increases the engine ONR
by 17 or about 68 octane numbers per CR while a reduction in bore size by 11mm at the same
CR reduces the ONR by 31 octane numbers at 1200 RPM but nearly 7 at 2000 RPM As noted
in Section 32 the study by Russ(Ref 16) showed a KLSA sensitivity of about 5 to 6 for a 09
increase in CR which translates into a 4 to 5 octane number increase in his analysis In addition
the ONR declines by about 2 octane numbers per 1000 RPM increase for Engine A but by about
6 octane numbers per 1000 RPM for Engine B The paper by Millo et al (Ref 19) shows a
change in ONR of about 4 per 1000 RPM at constant spark advance but it is not clear if these
relationships are linear near MBT timing
Figure 3-6
A detailed study conducted by Nippon Oil and Nissan (Okamoto et al Ref 20) contrasted the
performance and ONR of the same engine over a range of CR values using DI and PFI and
provides the most extensive data on a controlled comparison between the octane number
requirements of DI and PFI engines The experimental engine had a 4-valve pent -roof
combustion chamber and 86mm bore diameter and tests were conducted at CR values of 105
12 135 and 15 Tests conditions were 1200 RPM at WOT and was set at 08 Figure 3-6
shows that at the same level of spark advance the ONL of the DI engine is 4 to 5 octane
88
90
92
94
96
98
100
102
0 2 4 6 8 10 12 14
OCTA
NE NUMBER
LIM
IT
KLSA DEGREES
Octane Number Limit vsKLSA CR = 105
PFI
DI
33
numbers lower than the ONL of the PFI engine Conversely at the same fuel octane number the
DI engine had a KLSA that was 5 to 6 degrees more advanced than the KLSA with PFI The
effect of this larger spark advance on torque is non-linear (as shown in Figure 2-3) so that the
increase in torque at low octane numbers with DI is quite large at 90 RON the DI system
provides about 15 increase in peak torque but at 96 RON the increase is about 9
The ONR for PFI and DI engines is shown in Figure 3-7 and except for one data point for the DI
engine at a CR of 12 the other data points indicate that DI has a 4 octane number reduction in
ONR at 105CRand the advantage increases with increasing CR No fuel with an ON over 114
was used so that the ONR for the PFI engine could not be determined but appears to be over 120
from linear extrapolation of the trend line (which may not be accurate if the trend is non-linear)
The 4 octane number reduction in ONR was confirmed by auto-manufacturers relative to current
CR values for PFI engines which are in the 10 to 105 range
Figure 3-7
90
95
100
105
110
115
120
10 11 12 13 14 15 16
ENGINE ONR
COMPRESSION RATIO
Octane Number Requirement for PFI and DI Engines
PFI
DI
Linear (PFI)
34
The Nippon OilNissan paper (Ref 20) also confirmed that brake specific fuel consumption of
PFI and DI engines were near identical at the same CR providing that both engines operated at
MBT (ie spark was not retarded due to knock) The data were generated at 40 Nm 80 Nm and
120 Nm torque values (which we estimate corresponds to about 25 50 and 75 of
maximum torque) and at 1200 and 2400 RPM Hence the thermal efficiency benefits of
increasing CR described in Section 31 of this report should apply equally to both PFI and DI
engines
A few other reports have provided ONR values for DI engines although many of the papers from
the late 1990sto early 2000s have also used prototype engines or early production DI engines In
a joint paper by Shell and Toyota (Kalghatgi Nakata and Mogi Ref 5) the ONR of a prototype
DI engine (unspecified bore size) was determined at different CR values of 110 and 125 over a
range of engine speeds from 1200 RPM to 6000 RPM At 1200 RPM the ONR at 11CR was
found to be 1068 and ata CR of 125 the ONR was found to be 1128 The values are
96
98
100
102
104
106
108
110
112
114
0 10 20 30 40 50 60
OCTA
NE NUMBER
REQ
UIREM
ENT
TIME PER REVOLUTION MILLISECONDS
OCTANE NUMBER REQUIREMENT vs 1RPM
CR = 11
CR = 125
Figure 3-8
significantly higher than those reported by Nissan especially considering that the ONR values
are at a of 085 which should reduce the requirement by 4 to 5 octane numbers relative to the
35
ONR at stoichiometric air-fuel ratio The relationship of ONR with the time per revolution
(inverse of RPM) appears to flatten out at low RPM as shown in Figure 3-8
In a study of fuel octane number effects on a DI engine by Toyota and ExxonMobil(Akihama et
al Ref 21) an engine with a CR of 13 and 86mm bore size was tested at 2000 and 4000 RPM
WOT and a of 087 with a range of fuels Although the ONR of the engine was not directly
determined the KLSA at 100 octane number (PRF fuel) was retarded by about 11 degrees from
MBT at 2000 RPM and by 6 degrees at 4000 RPM suggesting an ONR of about 106 to 107 at
2000 RPM and 103 to 104 at 4000 RPM This is about 2 to 3 octane numbers lower than the
ONR of the 125CR engine shown in the figure above consistent with the expectation of a 4 to 5
number ONR increase per CR In another study by the Cosmo Research Institute (Fukui et al
Ref 22) a Mitsubishi DI engine with an 81mm bore and a CR of 12 was tested with several
fuels Although the engine ONR was not explicitly determined the data show that the ONR at
1200 RPM is about 100 as isooctane allowed operation with MBT spark timing at borderline
knock conditions This ONR level is lower than those reported by the two papers cited above
A study by BP and Toyota (Williams et al Ref 28) reported on the efficiency as a function of
fuel octane number for a PFI Atkinson Cycle engine with a geometric CR of 13 According to
Toyota the actual CR is about 95 at 1500 RPM and 106 at 2800 RPM Tests at WOT and =1
show the engine to have maximum thermal efficiency at a fuel RON of 98 at 1300 RPM and
about 100 RON at 2800 RPM
The following ranges of ONR as a function of CR at low RPM (lt1500) for a bore size of about
85mm and a of 09 to 1 are approximate averages of the papers reviewed and manufacturer
inputs received
CR ONR for PFI ONR for DI
10 100 ndash 102 94 ndash 96
11 105 ndash 107 99 -101
12 109 ndash 111 103 -105
13 113 ndash 115 107 ndash 109
14 117 ndash 119 110 ndash 112
36
34 EFFECT OF LATENT HEAT OF VAPORIZATION OF FUEL
As noted in Section 25 the latent heat of evaporation results in a lower air-fuel mixture
temperature for a DI engine which improves the volumetric efficiency In addition the cooler
mixture allows a higher CR with the same fuel octane number The reduction in ONR by 4 due
to DI was discussed in Section 33 The Nippon Oil Nissan paper (Akihama et al Ref 21)
showed that the increased volumetric efficiency results in a 5 to 6 improvement in torque
with additional improvement from the CR increase which depends on the fuel octane number and
spark timing Figure 3-9 shows the net torque improvement at KLSA comparing the same engine
with DI and PFI at 4 different CR values A net improvement of torque of about 7 if observed
with DI over a range of CR values With the 114 RON fuel the DI engine was not knock limited
except at 15 CR while the PFI engine was knock limited at CR values of 135 and higher In the
case of the 90 RON fuel both the DI and PFI engines were knock limited at all CR values
Figure 3-9
90
95
100
105
110
115
120
10 11 12 13 14 15 16
NORMALIZED TORQUE AT KLSA
COMPRESSION RATIO
EFFECT OF CR ON TORQUE
DI 114RON
PFI 114RON
DI 90RON
PFI 90RON
37
In an analysis by Toyota (Nakata et al 2006 Ref 23) the 15L Atkinson Cycle PFI engine used
in the Prius with a geometric CR of 13 and a bore of 75mm was tested with different levels of
ethanol blends with a base regular gasoline of 915 RON and with a Japanese premium gasoline
with a RON of 996 According to data provided by Toyota the actual CR of the engine at 2800
RPM is 106 The paper reported that the octane number difference between premium and
regular gasoline resulted in only a small improvement in thermal efficiency because the Atkinson
Cycle limits the volumetric efficiency With ethanol blends the volumetric efficiency can be
improved due to charge cooling even with a PFI system if the ethanol is inducted into the
cylinder mostly as a liquid and the engine can run at MBT timing with E50 and higher blends
With neat ethanol (E100) the paper reported that absolute efficiency approached 399 which
was 56 relative improvement over the base (E0) efficiency level The data are shown in Figure
3-10 below for tests conducted at 2800 RPM and = 1
Figure 3-10
In an earlier analysis by Toyota (Nakata etal 2006 Ref 12) similar tests were conducted on the
same engine with a CR of 13 without the valve timing set up for Atkinson Cycle operation In
36
37
38
39
40
41
42
0 10 20 30 40 50 60 70 80 90 100
THER
MAL EFFICIENCY
ETHANOL VOLUMETRIC RATIO
ATKINSON CYCLE EFFICIENCY vs ETHANOL BLEND VOLUME
ETHANOL BLEND
PREMIUM GASOLINE
38
this case volumetric efficiency was affected by increased ethanol concentration decreasing by
2 for E50 and higher concentration blends However thermal efficiency for E0 (ie the base
91 RON gasoline) was reported as 317 absolute thermal efficiency for E100 was reported as
396 absolute nearly the same as that of the Atkinson Cycle engine operated on E100 and also
higher than the 379 reported on 100 RON gasoline These efficiency values show that use of
E100 resulted in 249 relative efficiency gain and the gain with E50 appeared to be on the
order of 20 relative significantly higher than with the Atkinson Cycle engine
In another paper by Toyota (Taniguchi et al Ref24) the use of E100 was examined in a DI
engine with a high CR of 13 and a bore size of 875mm At WOT torque increased by 76
relative to the same DI engine with a CR of 115 running on gasoline with a RON of 964 The
volumetric efficiency improved by up to 38 in contrast to the PFI case The increase in torque
was ascribed to both the increase in volumetric efficiency and the increase in CR made possible
by the higher RON of ethanol and the lower mixture temperature Surprisingly the thermal
efficiency with E100 was found to be only 05 (relative) better than with E0 which Toyota
traced to oil dilution by ethanol During the test blow-by gases were vented and the lost ethanol
was not recovered whereas the blow-by gas would be re-used in the normal situation due to
positive crankcase ventilation The higher volume of E100 required per injection created 3 to 4
higher fuel losses from oil dilution on the cylinder walls relative to gasoline especially at high
RPM In addition the lower flame speeds with ethanol contributed to a 07 decline in relative
efficiency which contributed to the small net effect observed
A study by Caton Hamilton and Cowart (Ref 26) on a CFR engine equipped with PFI used
regular gasoline E10 and E85 to examine the effects of ethanol at a constant speed of 900 RPM
At a CR of 9 and a of 09 E10 allowed a 03 bar increase in IMEP (about 3) by allowing
about 5 degrees spark advance over regular gasoline at KLSA while E85 was not knock limited
and provided a very small IMEP increase over E10 In a sweep of different CR values the
authors found the E10 blend allowed a 05 CR increase over regular gasoline and knock control
required spark retard of about 5 degrees per unit CR increase E85 was knock limited at CR
ratios over 12 but required only 2 degrees of spark retard per unit CR increase Torque with E85
increased by 2 per unit CR increase but torque was flat to negative with CR increases using
regular gasoline or E10 due to the need for spark retard to avoid knock
39
It should be noted that the higher torque with ethanol and ethanol blends can influence vehicle
fuel efficiency over and above changes in engine efficiency by allowing some engine size
reduction without loss of power
36 LEAN OPERATING CONDITIONS
As the relative air-fuel ratios are increased beyond stoichiometric engine efficiency depends
strongly on combustion chamber design turbulence in the chamber and compression ratio
(Heywood Ref 1) The flame speeds under lean conditions are slower as shown in Figure 2-8
but this is compensated for by other factors Ayala Gerty and Heywood (Ref 3) investigated the
factors that affect indicated efficiency as a function of air-fuel ratio and reported on four factors
that shape the relationship
- The value of increases towards that of air as the mixture gets leaner
- Pumping losses are reduced at part throttle conditions due to a higher airflow requirement
to produce the same torque
- Heat transfer losses are reduced due to lower combustion temperature
- The burn duration increases with increasing air-fuel ratio
The first three factors contribute to positive increases in efficiency while the fourth is a negative
factor The effect of increasing is relatively flat at air-fuel ratios over 14 so that as burn
duration increases the loss in efficiency offsets the gain from reduced pumping and heat transfer
loss Based on the data shown in Ref 3 Figure 3-11 shows the efficiency effects of the different
components at a light load point of NIMEP at 35 bar (which we estimate would typically
correspond to a BMEP of about 23 bar) In this case net indicated efficiency peaks at an air-fuel
ratio of about 15 The authors note that the effect of burn duration becomes particularly
pronounced when the duration exceeds 30 crank angle degrees and is in good agreement with
the other literature reviewed here
The influence of the mass burning period on IMEP and indicated efficiency has been confirmed
in other papers Research at the JOMO Technical Center (Hashimoto Inaba and Akasaka Ref
25) where a stratified charge DI engine with a CR of 10 and a bore size of 86mm was tested at
WOT at a of 1 2 and 3 with a wide variety of fuels found a linear relationship between the
90 mass burn period and IMEP at a of 1 They also found that at lean conditions the IMEP
40
was much less sensitive to spark timing due to the long duration of combustion Olefins had
shorter mass burning periods than paraffin and aromatic compounds at lean conditions resulting
in higher IMEP
25
27
29
31
33
35
09 11 13 15 17 19
NET
INDICATED EFFICIENCY
LAMBDA
INDICATED EFFICIENCY vs LAMBDA1500 RPM 35 BAR NIMEP CR OF 98
gamma
gamma+ Pumping +Heat Loss
Burn Duration
Total
Figure 3-11
The effect of octane number at lean combustion conditions was investigated by the Cosmo
Research Institute (Fukui Komoriya and Shimizu Ref 22) on a single cylinder version of a
Mitsubishi DI engine with a CR of 12 and a bore size of 81mm A wide variety of fuels with
RON ranging from 675 to 1022 were tested on this engine at 1200 RPM 67 and 87 kPa
manifold pressure and a of about 18 or 2 At these conditions the indicated efficiency was
highest at a low RON around 70 as shown in Figure 3-12 At these low RON values the refinery
feed-stocks had high auto-ignition intensity but single component fuels had relatively low
intensity The authors speculated that the low octane number fuels had better efficiency as the
fuel mixture near the walls auto-ignited with low octane number fuels providing more complete
combustion The increase in HC emissions with higher octane number fuels confirmed this
41
hypothesis and the authors also observed a correlation between auto-ignition and thermal
efficiency
Figure 3-12
A similar result was obtained by a Toyota-Exxon-Mobil study (Akihama et al Ref 21) with DI
engine having a CR of 13 and a bore size of 86mm Tests were conducted at a of about 19 and
1200 RPM engine speed and a ldquoslightly throttledrdquo intake Two fuels were used a toluene
standardization fuel (TSF) with a RON of 838 and Japanese regular gasoline with a RON of
917 The data presented in the paper show that the lower octane number TSF provided about 5
greater torque and had about 5 greater brake efficiency than the Japanese regular fuel The
indicator diagrams showed that there was a two stage heat release on the TSF with one
corresponding to the flame propagation from the spark plug and the second corresponding to
spark induced compression ignition The authors stated that this auto-ignition differed from
knock in that the pressure rise was not excessively rapid The authors surmised that if CR is
increased further this type of spark induced compression ignition could occur at RON values
similar to regular gasoline (ie at 91 RON)
28
285
29
295
30
305
31
315
32
60 70 80 90 100 110 120 130
INDICATED EFFICIENCY
FUEL RON
INDICATED EFFICIENCY vs FUEL TYPE AND RONSTRATIFIED CHARGE LEAN BURN
SC FUEL
MC FUEL
REFINERY FUEL
42
During the interviews manufacturers confirmed that low octane number fuels were better suited
to very lean combustion that approached Homogeneous Charge Compression Ignition (HCCI)
combustion On the other hand they also stated that at high loads such lean air-fuel ratios could
not be used without very large power loss so that this phenomenon was not directly relevant to
production engines as low octane number fuels could not be used across the operating range
43
4 TURBOCHARGED PORT INJECTION AND DIRECT
INJECTION ENGINES
41 OVERVIEW
Turbocharged engines are treated separately since the use of turbocharging generally requires the
reduction of CR for a given level of fuel octane number which hurts engine thermal efficiency
However the use of turbocharging allows the use of a significantly smaller engine to replace a
naturally aspirated engine and the mechanism that improves vehicle fuel economy is the reduced
pumping and cooling loss of a smaller engine operating at higher load to provide the same output
to the vehicle
Turbocharged engines also operate against different constraints At low RPM (lt1200) the
turbocharger does not provide significant boost and maximum boost is usually not available
until 1800 to 2000 RPM or higher Hence the WOT condition at low RPM may not be the point
where the engine ONR is the highest In addition boost may be limited at high RPM due to
maximum cylinder pressure constraints and spark timing and air-fuel ratio can be constrained by
turbine inlet temperature constraints Hence the impact of fuel octane number may be dissimilar
between naturally aspirated and turbocharged engines Turbocharged engines are knock limited
over more of their operating range than naturally aspirated engines (see Figure 4-1 below) and
octane number benefits in terms of vehicle efficiency may be larger
The efficiency of the turbocharged engine and its relationship to CR and spark advance are also
not represented by the equations shown in Section 3 since the reciprocating engine and turbo
unit act as a system If the engine is not boost limited the optimal combustion phasing for best
torque is delayed relative to that for a naturally aspirated engine since there is a compromise
between enthalpy flow to the turbine and the best torque achieved by the engine At high RPM
the boost air-fuel ratio and spark advance at WOT have to be limited not only to avoid knock
but also to limit turbine inlet temperature so that fuel octane number effects are very non-linear
44
Figure 4-1
42 PORT FUEL INJECTED ENGINES
Turbocharged PFI engines have had modest penetration in the US largely because of weak low
RPM torque An analysis of a 2L PFI engine with turbocharging using fuels of different octane
numbers was reported in a paper by Renault and TOTAL (Duchaussoy Barbier and Schmelzle
Ref 27) The engine had a 95 CR and a bore size of 827mm and was tested with hydrocarbon
fuels ranging in RON from 925 to 1065 Sensitivity for all of the fuels was about 10 The
engine was tested at WOT and the air-fuel ratio was held to stoichiometric across the entire
operating range of RPM from 1200 to 5000 The results are shown in Figure 4-2 and the reduced
low RPM torque is obvious Due to lack of boost the different octane number fuels have almost
no effect at RPM below 1500 RPM but by 2000 RPM the 1065 RON fuel shows a 115
torque advantage over the 925 RON fuel However the effects are quite non-linear with RON as
the 983 RON fuel shows only a 39 torque advantage At 3000 RPM the torque differences
between the various fuels are quite large but decline at higher RPM as turbine inlet temperature
limits control available timing retard and boost At 4000 RPM the 1065 RON fuel offers a 43
torque advantage over the 925 RON fuel
45
Figure 4-2
Reference 27 also examined the effect on increasing MON by decreasing the Sensitivity of the
fuels at constant RON from 10 to 7 (ie a 3 increase in MON) The authors found that the 3
MON increase resulted in about 3 increase in torque at 1500 RPM but the differences were
quite small over 3000 RPM Hence MON increases were found to be helpful at low RPM which
is exactly opposite from the result for naturally aspirated engines
By plotting the results shown in Figure 4-2 against RON with RPM as a parameter the complex
response of turbocharged PFI engines to fuel octane number is illustrated Figure 4-3 shows the
torque as a function of the RON at three different RPM levels and the sensitivity to RON
changes as different constraints come into play ndash boost constraints at low RPM knock
constraints at mid-RPM and turbine inlet temperature constraints at high RPM Also the
efficiency does not increase with torque as boost varies across the fuels but the ranking of fuels
for 1BSFC (ie a measure of efficiency) was identical to the torque based ranking BSFC varied
by about 15 across fuels Each octane number increase in fuel RON provides a 2 increase in
peak torque at 3000 RPM and a 3 increase at 4000 RPM
150
175
200
225
250
275
300
325
0 1000 2000 3000 4000 5000 6000
TORQUE N‐m
RPM
TORQUE vs RPM WITH DIFFERENT FUELTURBOCHARGED PFI ENGINE CR = 95
925 RON
946 RON
983 RON
1065 RON
46
Figure 4-3
BP and Toyota (Williams et al Ref 28) also investigated a 18L turbocharged PFI engine with
a bore size of 805mm but the engine had a very high CR of 13 for a turbocharged version The
paper provided details on engine efficiency at WOT and 2800 RPM with a of 1 and 16 but no
other details such as the boost level and torque output are provided Two reference fuels with
100 and 102 RON were tested with a wide variety of additives (such as diethyl ether and nitro-
methane) toimprove the burn rate The fuel matrix also included E85 and a high aromatic content
108 RON fuel The efficiency improvements measured at the two air-fuel ratios are shown in
Figure 4-4 below The authors attributed part of the data scatter to the large confidence bands
generated by the test method used to measure the calorific value of fuels
Operation at the highest RON value of 108 required reduction of boost to meet cylinder pressure
limits which reduced efficiency However Figure 4-4 shows that relative efficiency increases
about 069 per octane point at = 1 and by 085 per octane point at = 16 It should be
noted that at 2800 RPM there are likely no constraints on available boost or turbine inlet
temperature for these operating conditions
200
220
240
260
280
300
320
90 92 94 96 98 100 102 104 106 108
TORQUE N‐m
FUEL RON
TORQUE vs FUEL RON
2000 RPM
3000 RPM
4000 RPM
47
Figure 4-4
In an earlier paper by BP and Toyota (Williams et al 2009 Ref 29) the same engine was
tested with butanol-gasoline and ethanol-gasoline blends as well as neat ethanol and butanol
The fuels spanned a range of RON numbers from 976 to 111(for neat ethanol) The efficiencies
increased linearly with RON much like Figure 4-4 Indicated sensitivity of thermal efficiency for
both the equal to 1 and 16 cases was in the order 09 to 1 per octane number a little higher
than for the case with additive improved RON found in Reference 28
A more recent paper from Toyota (Nakata et al 2011 Ref 30) provided additional details on
the engine operating parameters with increased RON fuels The paper showed that intake
manifold pressure at the operating condition of 2800 RPM WOT and of 16 increased from
about 30kPa with a 92 RON fuel to about 80kPa with a 105 RON fuel and BMEP increasing
from 075MPa to about 14MPa The increases in both intake manifold pressure and BMEP
appeared to be almost linear with increasing octane number Hence a 15 point increase in RON
provides a near doubling of torque and boost at the lean operating condition and the authors
stated that a diesel like 44 brake thermal efficiency was possible with a lean boosted engine
35
37
39
41
43
45
94 96 98 100 102 104 106 108 110
BRAKE TH
ERMAL EFFICIENCY
FUEL RON
EFFICIENCY vs FUEL OCTANE NUMBERTURBOCHARGED PFI ENGINE CR = 13
at = 16
at = 1
48
operating on neat ethanol Some of this benefit was potentially due to the cooling effect of
ethanol which would permit more boost
43 DIRECT INJECTION ENGINES
As with naturally aspirated engines turbocharged DI engines are influenced by the reduction in
mixture temperature due to the latent heat of evaporation of the fuel A French consortium study
(Milpied et al Ref 31) examined the effects of octane number and latent heat of vaporization
on an experimental single cylinder 4-valve engine with a 69mm bore and a CR of 95 Six
hydrocarbon fuels with RON values ranging from 916 to 1004 and sensitivity from 64 to 127
were tested to study the effects of RON and MON Three of these six fuels were blended with
ethanol and ETBE (ethyl tertiary butyl ether) to obtain a RON of about 100 but to have a
different heat of vaporization Tests were conducted at 1000 2000 3500 and 5500 RPM at
WOT with the spark timing set to KLSA (and most likely at a of 1) Test reproducibility was
given as 06 bar of IMEP However no information on the boost level engine BSFC or
efficiency is provided with only the IMEP documented at the different fuels tested
Figure 4-5 shows the results of the tests and the authors (Ref 31) found a strong effect of RON
on the IMEP However no clear impact of MON was isolated and the impacts were both
positive and negative but relatively small As with the turbocharged PFI engines the greatest
impact was found at the 3500 RPM level The trend lines plotted by us in Figure 4-5 show that
IMEP increases by 2 bar for every 3 point increase in octane number at 2000 and 3500 RPM
higher than the 2 bar BMEP increase for every 4 octane numbers registered by the Toyota lean
boosted PFI engine described in Section 42
Data on the effect of the cooling power shows that the IMEP increase associated with an E30
blend relative to an ETBE blend with the same RON value of 1005 was about 25 bar The
difference in cooling power (defined as latent heatstoichiometric air-fuel ratio) was about 17
kJkg of air indicating that a cooling power of about 685 kJkg allows a 1 bar increase in IMEP
This level of increase is equivalent to the level from a 15 increase in RON suggesting that a 45
kJkg cooling power increase is equivalent to a unit increase in RON Reference 31 provides a
wide range of 2 to 8 kJkg cooling power as being equivalent to one octane number increase
Since the difference in cooling power between E100 and gasoline is about 77 kJkg this suggests
49
that the cooling power of E100 is equivalent to an additional 17 + 7 octane numbers in RON in a
turbocharged DI engine
Figure 4-5
A more detailed analysis of the individual effects of octane number and cooling power was
conducted by a consortium the included Ford AVL Deere and BP (Stein et al Ref 32) The
tests were conducted on a single cylinder engine with the CR varied between 10 12 and 14 A
wide variety of ethanol blend concentrations with different base gasoline RON levels were tested
at 1500 and 2500 RPM with some additional RPM tests at a CR of 12 The intake system was set
up to allow a pre-heated intake to maintain constant intake mixture temperature with all fuels as
well as PFI and DI systems Turbocharging was simulated by an intake pressure booster and an
exhaust orifice to simulate turbine back pressure and exhaust temperature limits were observed
to simulate turbine inlet limits A peak pressure limit of 160 bar was also used to simulate
production engine constraints
Measurements were carried out with an 88 RON base gasoline blend stock with E10 E20 E30
E50 and E75 blends Spark retard was used to allow more boost and increase the maximum
IMEP Figure 4-6 shows the maximum IMEP with the base gasoline at 88 RON (E0) and the E50
8
10
12
14
16
18
20
91 92 93 94 95 96 97 98 99 100 101
IMEP
BAR
FUEL RON
IMEP vs FUEL RON FOR TURBO‐DI ENGINE CR = 95
IMEP ‐3000 RPM
1MEP 2000 RPM
50
blend with a 105 RON rating introduced with upstream fuel injection (UFI)before the mixture
pre-heater with the mixture at the controlled temperature of 52C and also the E50 blend
directly injected into the cylinder The difference in the performance of the engine in the first
two cases is due to the octane number difference between the fuels while the performance
difference between UFI and DI cases for E50 is due to the cooling effect
Figure 4-6
Reference 32 finds that for a given gasoline blend stock increasing ethanol content significantly
increases NIMEP as well as thermal efficiency especially at retarded combustion phasingThe
magnitude of the improvement of NIMEP with E50 is striking as shown in Figure 4-6 E0 has a
maximum IMEP of about 8 bar while for E50 in a DI engine it is 38 bar The authors of Ref 32
attribute the improved performance at retarded timing to the high sensitivity of auto-ignition
kinetics to temperature for ethanol which has a Sensitivity of 18 octane numbers The authors
also find that both the octane number effect and charge cooling effect of high ethanol
concentration blends are very significant for DI engines and are of about equal magnitude In the
figure above the difference in RON between the base gasoline and E50 blend is 17 octane
0
5
10
15
20
25
30
35
40
45
0 5 10 15 20 25 30 35
NET
IMEP
BAR
CRANK ANGLE AT 50 MASS BURN ATDC
SEPARATION OF CHARGE COOLING AND OCTANE EFFECTS ON KNOCK LIMIT
E0
E50 UFI
E50 D
Charge Cooling
Octane Improvement
51
numbers If the cooling effect is of the same size or about 17 numbers for E50 the cooling effect
is almost twice as large as estimated in Ref 31
Another set of tests with a turbocharged DI engine were conducted by Orbital (Brewster Ref
33) using a unique air assisted injector Tests were conducted on a 2L 4 cylinder engine with a
bore size of 86mm and a CR of 104 Test conditions were at 2000 RPM WOT with engine
airflow controlled by the turbocharger waste-gate Boost pressures were relatively low at 36 to
40kPa The study found that E100 enabled 5 to 10 degrees more spark advance and provided
about 12 to 13 more N-m of torque relative to a 98 RON gasoline which is about a 5 torque
increase These numbers are very modest compared to the results in Ref 32 and it is not clear
why timing retard and increased boost caused a net reduction in torque with E100 in this study It
may be that the turbocharger was not fully effective in using the enthalpy of the exhaust gas to
increase boost at an engine RPM of 2000 and this may be a real limitation that is not accounted
for in the previous study At other RPM points the study used the performance with the base
gasoline fuel as a benchmark and optimized spark and boost calibration with E100 to maximize
energy economy at the same torque The study found that brake thermal efficiency is improved
between 7 and 13 increasing with RPM With E100 the same torque level is achieved with
lower boost and with lower exhaust temperatures The author also pointed to some combustion
instability issues at high boost conditions related to the slower burn rate of ethanol
In an analysis of ethanol hot spot pre-ignition Hamilton et al (Ref38) examined the tendency
of E85 and E100 fuels to pre-ignite using a CFR engine with a diesel glow plug to provide a
temperature controlled hot spot Tests were conducted at 900 RPM using CR values of 12 135
and 15 The authors concluded that pre-ignition occurs at 620 to 680C at lambda values of 085
to 105 and higher CR leads to lower pre-ignition temperatures They found that E100 pre-
ignites at 10 to 20 C lower glow plug temperatures than E85 and very high knock intensity
occurs when per-ignition starts at 14 to 8 CAD before TDC The range of temperatures for pre-
ignition are much lower for E100 and E85 than for hydrocarbon gasolines reported in Ref37
(where the range was 800 to 900 C)
MITrsquos Laboratory for Energy and the Environment has been developing the concept of direct
injection of ethanol coupled with port injection of gasoline to tailor the net octane number
benefit to engine load and speed The simulation and experimental work have been reported in
52
references 34 35 and 13 (Bromberg Cohn and Heywood 2006 Bromberg and Cohn 2007
Bromberg and Cohn 2008) The modeling in Ref 35 suggested that direct injection of E100
would be effective in preventing knock For a turbocharged DI engine with a CR of 10 no
ethanol was required until the intake manifold pressure rose beyond 08bar but about 18 of the
energy from E100 was required at 1 bar and 80 at 3 bar At a CR of 12 the ethanol fraction as
a function of manifold pressure was parallel to the curve at 10CR but shifted 02 bar lower intake
manifold pressure Bromberg et al (Ref 13) conclude that this strategy of injecting ethanol
directly as needed results in a very high ldquoeffectiverdquo octane rating When 10 of the energy is
provided by ethanol (ie 14 by volume) the effective octane number of the E100 was found to
be 175Since normal driving is mostly at light load high CR engines can be used with gasoline
to minimize consumption of ethanol The authors modeled vehicular use of ethanol on the US
EPA Federal Test Procedure (FTP) and Highway driving cycles and found that less than 2 of
fuel volume was ethanol on these cycles using a 10 CR PFI+DI engine operating with a
maximum boost of 25 bar
In a subsequent paper (Stein House and Leone Ref 36) Ford reported on an engine developed
along the lines modeled by Bromberg and Cohn This engine was a prototype 35L ldquoEcoboostrdquo
V-6 with a 98 CR itwas a turbocharged engine where the gasoline was introduced with a PFI
system and the ethanol through a DI system This particular engine was constrained to a peak
pressure of 100 bar A BMEP sweep showed that 98 RON gasoline was knock limited above 8
bar BMEP and spark timing had to be retarded by 15 at the maximum BMEP of about 18 bar
when the turbine inlet temperature limit of 950C was reached With E85 no timing retard was
required to about 18 bar BMEP and a peak BMEP of 21 bar was realized being limited by
engine peak pressure limitations When employing a gasoline + ethanol fueling strategy it was
found that to avoid knock at MBT spark timing the mass fraction of E85 at 10 bar BMEP was
40 and rose to 50 at 15 bar after which spark timing had to be retarded to meet engine peak
pressure limits The research also found that spark retard by about 5 was optimal to reduce the
combined BSFC of gasoline + ethanol to the minimum Using this fueling strategy and measured
values of ethanol consumption Ford confirmed that E85 consumption for a Ford F-150 truck
would be less about 1 of total fuel mass on the US EPA FTP and Highway test cycles at the
truckrsquos test weight but would increase to 19 and 30 respectively at the truckrsquos maximum
weight with full payload
53
5 FINDINGS AND CONCLUSIONS
51 MAJOR FINDINGS
The effect of increasing fuel octane number on SI engines and vehicle energy efficiency
cannot be quantified in a simple way but requires a complex nuanced answer The following
findings from the literature review and analysis are the basis for the conclusions in Section
53 of this report
A Relationship between Engine Efficiency and Fuel Octane Number
1) The thermal efficiency of naturally aspirated engines primarily depends on the enginersquos
CR but is also adversely affected by increasing surface-to-volume ratio of the
combustion chamber which depends directly on the CR and inversely on the cylinder
displacement (and typically the bore size) As a result maximum indicated thermal
efficiency is almost constant beyond CR values of 14 for small bore engines (lt70mm)
and almost constant beyond a CR of 16 for bore size over 85mm The marginal thermal
efficiency benefit of increasing CR declines continuously with increasing CR 2) The engine octane number requirement (ONR) is the lowest fuel octane number that
results in borderline knock at wide open throttle when the spark timing is set to MBT
The engine octane number requirement is primarily a function of the CR and to a
slightly lesser extent operating conditions of speed and air-fuel ratio It is also a
function of engine design variables such as the shape of the combustion chamber
efficacy of cooling and bore diameter7 The highest octane number requirement occurs
at low RPM (lt1500) and wide open throttle (WOT) for naturally aspirated engines
B Naturally Aspirated Engines
1) The typical ONR for a port fuel injected naturally aspirated engine with a CR of 10 and
a bore diameter of about 85mmoperating at= 1 1500 RPM is 100 to 102 RON at
WOT Smaller bore engines have a lower octane requirement while larger bore engines
have a higher octane requirement The relationship between ONR and bore diameter is
7 The variables listed are illustrative but this is not a comprehensive list
54
not well quantified in the literature but may be around 2 to 3 octane numbers per
10mm based on the data collected for this study Hence a small bore engine (70mm) at
the same conditions can have an ONR of 96 to 99 while a large bore engine (100mm)
can have an ONR of 103 to 106 2) The ONR increases with engine CR by about 4 to 5 octane numbers per unit CR
increase (It is not clear if this relationship holds at higher CR values over 13) The
ONR decreases with RPM and the ONR dependence appears to be approximately linear
with time per revolution (the inverse of RPM) to about 40 ms (1500 RPM) but not all
studies confirm this The ONR declines by approximately 2 octane numbers per 10ms
decline in the time per revolution Hence the ONR declines by about 4 octane numbers
between 1500 RPM and 3000 RPM (40ms to 20ms per revolution) 3) The engine actual octane number limit (ONL) is sensitive to spark timing advance and
air-fuel ratio and these are the two primary control levers used to prevent knock in
production naturally aspirated engines The ONL is reduced with spark retard from
MBT values and this relationship is approximately linear with the ONL being reduced
by 1 octane point for every 15 + 05 degrees spark retard The relationship becomes
more non-linear at retarded timing very close to MBT and at timing advance beyond
MBT The ONL at WOT is highest at of 095 to 1 and every 01 richer or leaner than
this level leads to about a 3 point reduction in ONL 4) The influence of spark timing on torque and engine efficiency is very non linear with
the first 5 CAD retard from MBT reducing torque and relative efficiency by only about
13 while a 10 CAD retard causes a 51 reduction Hence spark retard by less than
10 from MBT can reduce the engine ONL significantly while having modest effects on
available torque and thermal efficiency 5) With direct injection of the fuel into the cylinder the latent heat of evaporation of the
fuel cools the air-fuel mixture The cooling power of gasoline for a stoichiometric
mixture of air and fuel is about 24 kJkg air The reduced temperature reduces the
octane number requirement by one octane point for about 45 to 6 kJkg of cooling
power Hence direct injection of gasoline reduces the ONR by about 4 to 5 octane
numbers
55
C Turbocharged Engines
1) The relationship between engine CR spark timing and engine ONL is more complex
in a turbocharged engine since the reciprocating engine and turbocharger act as
system If the engine is not boost limited the optimal combustion phasing for best
torque is delayed relative to that for a naturally aspirated engine since there is a
compromise between enthalpy flow to the turbine and the best torque achieved by the
engine At high RPM the boost air-fuel ratio and spark timing at WOT have to be
limited not only to avoid knock but also to limit turbine inlet temperature(which limits
the employment of spark retard) and engine peak pressure so that fuel octane number
effects are very varied across different operating conditions 2) The available data show that increasing fuel RON increases mid-range torque (~ 3000
to 4000 RPM) by 2 to 3 per octane number increase in RON for a turbocharged
PFI engine while increasing engine thermal efficiency by about 07 per octane point
increase Low RPM and high RPM torque are usually limited by other factors as well
so that the effect of octane number increase at these RPM levels may be engine design
specific 3) Increasing octane number can have a very significant effect on mid-range torque for
turbocharged DI engines that are not boost limited Limited data on DI engines shows
that an 8 increase in fuel RON can increase 3000 RPM torque by about 50 or about
5 per octane number Torque benefits at high and low RPM may be much smaller as
they are subject to the same constraints as for PFI engines 4) The use of high ethanol concentration blends (E30 and higher)may be particularly
beneficial to turbocharged DI engines for two reasons Research shows that with high
volume ethanol blends the combination of high boost and retarded timing allows
knock-free operation at very high BMEP levels Recent experimental work has shown
the capability of an E50 blend to allow engine operation at 38 bar to 40 bar IMEP
which is about twice the IMEP level of current gasoline turbocharged DI engines
These high IMEP values will not likely be reproduced in production engines as
ethanol has other limitations such as reduced hot spot pre-ignition temperature relative
to hydrocarbon gasoline
56
D Special conditions
1) The use of lean burn offers a substantial fuel economy opportunity especially at part
load conditions but is not used in the US due to difficulties in meeting emission
standards Under lean conditions with a homogeneous mixture lower RON fuels have
been found to give better engine efficiency as the lower octane number leads to a
combustion mode described as spark initiated compression ignition of end gases that are
not fully combusted with high octane number fuels If lean combustion becomes viable
lower RON fuels may be more desirable However if the limiting condition for engine
ONR is at full load where stoichiometric or rich operation is desirable for maximum
power the fuel octane number will have to be tailored to this condition in actual
practice
E Fuel Issues
On the fuels side the review and analysis provide the following conclusions
1) The existing test procedure to determine fuel octane number (both Research and Motor)
uses test conditions outside the typical operating range of modern engines
2) At low RPM conditions (lt1500 RPM) and WOT the effective octane number of a retail
gasoline (whose MON is 8 to 10 numbers lower than the RON) is actually higher than
RON The fuel Octane Index which is a weighted sum of RON and MON that represents
the performance of the fuel in the engine uses a negative weight for MON so that as
MON decreases the fuel has a higher Octane Index (See conclusion 5 below) The MON
weighting factor K is estimated to be about -02 to -04 for modern engines at low
RPM
3) Available data suggest that the greater the ONR of the engine the more negative the K
value becomes Hence high CR turbocharged engines will have a more negative K value
on average than a moderate CR naturally aspirated engine This implies that fuels with
high RON and low MON are well suited to high ONR engines but the data show a lot of
scatter in the K values for individual engines
4) With increasing RPM K appears to increase linearly with time per revolution (or
1RPM) The increase implies that MON becomes more important at higher RPM Higher
57
MON is also desirable for suppressing other unusual combustion modes In particular hot
spot pre-ignition temperature is better correlated to MON than to RON
5) Olefin and aromatic compounds have higher octane Sensitivity than paraffin compounds
because their combustion kinetics are slower at lower end gas temperatures (similar to the
end gas temperatures in modern engines) and faster at high temperatures (similar to the
end gas temperature on the MON test) relative to paraffin compounds Olefin compounds
have the highest burning velocity and high olefin content fuels can increase engine
relative efficiency by 1 to 2
6) The latent heat of vaporization is an important factor that improves the knock resistance
of a fuel in a DI engine The cooling power as measured by the latent heat of
vaporization divided by the stoichiometric air-fuel ratio is an indicator of the benefit In
this context the cooling power of ethanol is about 4 times as high as gasoline
7) Ethanol also offers high RON (111) and high Sensitivity (17) so that its use in
turbocharged DI engines (where K is most negative) allows very large increases in engine
output and efficiency Experimental results suggest that the benefit in knock resistance
from the evaporative cooling effect is as large as the benefit from the higher RON for
high concentration ethanol blends (E30 and higher) However ethanol also has much
lower hot spot pre-ignition temperature consistent with its lower MON rating which will
limit the benefit of ethanol use in production engines
52 STATUS OF THE CURRENT US NEW VEHICLE FLEET
The benefits of increasing octane number are very dependent on the starting point of CR
efficiency and octane number In the current US market manufacturers designate vehicle
gasoline requirements as ldquoregularrdquo ldquopremium recommendedrdquo and ldquopremium requiredrdquo but
there are no regulatory requirements that must be met to have a premium fuel designations
Regular gasoline has a RON of about 90 to 91 and Sensitivity (RON ndash MON) of about 8 to 10
Premium gasoline has a RON of 95 to 96 and a similar Sensitivity All of the vehicles where
premium gasoline is recommended or required are high performance sports cars and luxury
vehicles with the exception of some mass market DI vehicles designated for premium gasoline
by VW The 2009 vehicle data was analyzed to derive the CR for PFI DI and Turbocharged
engines by fuel octane number (regular or premium) as H-D Systems had access to a
comprehensive database on the technical specifications of all vehicles sold in that model year
58
A regression analysis was conducted with CR as the dependent variable and bore size
turbocharging and the use of DI as independent variables Unfortunately there were only 2 DI
engines with regular gasoline designation and one was turbocharged so that no statistically
significant coefficient was obtained for the regression of data on cars designated for regular
gasoline In the case of cars designated for premium gasoline (either recommended or required)
the spread of bore sizes was quite small and no significant coefficient for bore size was obtained
The resulting regressions (t-statistic in parentheses) are shown below
CR = 1088 ndash 001(Bore mm) -072 (Turbo) for regular gasoline
(424) (-336) (-108)
CR = 1096 - 189 (Turbo) + 099 (DI) for premium gasoline
(200) (225) (112)
It should be noted that most of the bore sizes are concentrated in the 85 to 100mm range in the
US so that the regression is not capturing the effect of small bore sizes in the 65 to 75 mm
range An evaluation of the CR levels at a constant bore size of 86 mm shows the following
levels of CR by engine type and fuel requirement
GRADE NA ndashPFI NA-DI TURBO-PFI TURBO- DI
REGULAR 101 - 935 -
PREMIUM 110 120 92 90
The actual data in the table are in excellent agreement with the findings The 4 to 5 RON
advantage of premium fuel over regular gasoline results in average CR increasing by 09 in
production vehicles that require premium relative to the CR for production vehicles that allow
the use of regular The ldquocooling effectrdquo advantage of DI results in exactly 1 unit increase in CR
The reason that the CR for turbocharged engines for regular and premium gasoline are nearly
identical is due to high performance engines which use higher levels of boost being certified for
premium
59
The regression shows that 101 CR engines are operating on 91 RON gasoline which may
appear to be inconsistent with the finding that the ONR of engines at that CR was found to be
100 to 102 at low RPM Manufacturers acknowledge that current production engines use a
combination of fuel enrichment and spark retard to avoid knock at full load Our estimate is that
the 9 to 11 octane number gap between engine ONR and gasoline RON is managed as follows
Improvement in fuel octane index due to negative K 2 to 3
Spark retard by 6 to 8 from MBT 3 to 4
Fuel enrichment to of 08 to 085 3 to 4
At higher RPM the improvement from the K factor goes to zero or is negative but this is offset
by the decline in engine OR For example the data shows that increasing the RPM from 1500 to
3000 reduces engine OR by 4 octane numbers but the K factor increases from -025 to +01 so
that the OI of the fuel decreases by 3 numbers largely offsetting the decrease in OR
The 2012 baseline data for CR is not expected to be very different from 2009 although there are
many more DI models both naturally aspirated and turbocharged available for use with regular
grade gasoline In addition there have been some market introductions of small displacement
engines (lt15L) that may allow better determination of the effect of bore size on CR In Japan
where small displacement engine are more common small bore 4 cylinder engines (~70mm
bore) with displacement of 1L to 13L have a CR of 115 while 2L engines (~85mm bore size)
have a CR of 106 for engines intended for use with regular gasoline (also 91 RON in Japan)
according to data provided by Toyota to this project The 09 CR increase should increase the OR
by about 4 octane numbers at constant bore size suggesting that the estimate of 2 to 3 octane
point reduction per 10 mm bore size decrease is in the correct range as the 15mm bore size
decrease offsets the effect of a 09 CR increase
CR also has increased over time even as the RON and MON of regular gasoline has stayed
constant In the model year 1980 time frame CR was about 85 and in 2010 it was about 10
suggesting an increase of 05 CR per decade Mittal and Heywood (Ref 6) have documented the
reasons behind this increase and improved cooling elimination of intake air preheat replacement
of carburetors with fuel injection etc have contributed It is not clear if this trend will continue
but we anticipate that the average will continue to improve at 05 CR per decade and may
60
improve even more quickly if the use of DI is widespread by 2020 It is also worth noting that
Mazda has recently introduced a small bore DI engine with a CR of 14 in Japan that uses regular
gasoline with a minimum RON of 89 (no MON limit is specified) Other Mazda engines sold in
Europe and the US have CR values of 12 to 13 on regular gasoline In the US Mazda offers a
2L engine with a 13 CR for use with regular gasoline No detailed data on the engine are
available yet but Mazda brochures suggest very good exhaust scavenging to reduce residual gas
and hence mixture temperature as well as some additional spark retard has been used to permit
the high CR The 2L engine is rated at 154 HP while the previous Mazda 2L engine with a10 CR
had a rating of 148 HP Hence Mazda has managed to increase CR by 3 with no sacrifice in the
power rating The potential for new technology to increase CR with no additional fuel octane
number requirement is demonstrated by this technology Another example of technology that can
reduce the ONR is the use of cooled EGR at full load for turbocharged engines Public
statements by several auto-manufacturers suggest that cooled EGR at full load will be used in
production engines in the near future
53 CONCLUSIONS
One of the objectives of the project was to assess the impact of increasing fuel octane number on
engine and vehicle efficiency The conclusions for a 4 to 5 RON increase are as follows
1) In port fuel injected naturally aspirated engines with mid-size (~85mm) and larger bore
sizes (that account for most of the US market today) and a CR of 10 this octane number
increase will facilitate a 1 point increase in CR which can provide a 2 relative
improvement in engine efficiency For small bore sizes (~70mm) the increase in CR will
be similar but the improvement in engine efficiency will be smaller at 13 to 14
2) For midsize and large bore naturally aspirated DI engines that have a CR of 11 this octane
number increase will facilitate a 1 point increase in CR and allow engine efficiency to
increase by 15 to 16 Small bore engines will have an improvement of 08 to 085
3) Vehicle efficiency gains for vehicles with naturally aspirated engines can be somewhat
larger than engine efficiency gains due to increased engine torque when CR is increased
permitting engine down-speeding This can provide a 1 to 2 fuel economy gain over
and above engine efficiency gains
61
4) In turbocharged engines the effect of this improved octane number could be through the
increase in engine peak torque if the engine is not boost limited In PFI engines the 4 to 5
RON increase can provide 10 to 15more torque In a DI engine this increase in octane
number can translate into a 20 to 25 increase in torque This torque increase is for
operation at 2000 to 4000 RPM at engine speeds below 1500 RPM and above 4000 RPM
other factors control available torque increases so that no general conclusion is possible for
all speeds
5) The torque increases with turbocharged engines could allow significant downsizing and
down-speeding of the engine but the extent of downsizing and down-speeding is dependent
on engine low RPM performance As an example of the size of the potential benefit a 5
to 7 fuel economy improvement is possible if the engine can be downsized by 20 to
25 to keep absolute mid-range torque constant
6) If the octane number increase were to be derived by addition of ethanol to gasoline larger
torque increases may be possible in turbocharged DI engines due to the high latent heat of
vaporization of ethanol An E30 blend with 91 RON gasoline blend-stock could potentially
improve torque by 50 but this level of increase is not proven in any vehicle application
and could be limited by ethanolrsquos lower resistance to hot spot pre-ignition
7) Developments in engine technology will allow CR to increase in the future with no change
to fuel RON and MON The increased use of DI technology will allow a CR increase of 1
unit Engine downsizing with resulting smaller bore sizes as well as the use of cooled
EGR and improved exhaust scavenging may allow continuing increases in CR over the
next decade with unchanged fuel ON
62
6 DATA GAPS AND RESEARCH RECOMMENDATIONS
The detailed literature review reveals a limited selection of studies in the public domain on the
relationship between fuel octane number and enginevehicle efficiency as only 45 papers
relevant to this topic were found after a reasonably exhaustive search Of these 45 many were
only tangentially related to the subject of fuel octane number and engine efficiency but helped
fill some gaps in the complex connections between the two variables In addition many of the
directly relevant papers were from a small number of organizations that reported on different
fuels and test modes for the same engine For example there are nine papers from Toyota and
the papers have used the same set of research engines for their studies
Two types of data gaps have been identified The first type is where the data exists but is not
public For example the data set is on actual engine efficiency and octane number requirement is
very limited across engine sizes and across the RPM range Most papers have used engines in the
85 + 5 mm bore size range and most of the data are for engine speeds of 1200 to 2000 RPM
Other key variables with limited data include the effect of spark timing as well as the effect of
air-fuel ratio on fuel octane number requirements across a range of engine bore sizes and RPM
These data clearly exist for a wide variety of production engines at each auto-manufacturer and
creating a database of these variables is not difficult if manufacturers participate in sharing the
data (the origin of the data can be obscured to maintain confidentiality) Such a database could
pave the way for developing more robust relationships between efficiency and fuel octane
number for different bore sizes and operating conditions
The second type of gap is where the data available are too limited to provide specific
conclusions The data on turbocharged DI engines (especially those with small displacement)
and their response to fuel octane number and heat of vaporization in terms of efficiency and
torque improvement across a range of engine speeds (especially at low RPM) are very thin and
usually derived from experimental engines where the interaction of the reciprocating unit with
the turbocharger is not measured but simulated Octane number improvements and
improvements from ethanol blends appear to hold significant promise but the available data are
inadequate to estimate the benefits in a real vehicle application
63
Newer technologies are also not represented in the database The latest DI engines in Europe
have sequential turbocharging with 2 stage cooling experiments have been conducted with
cooled EGR at all loads and speeds but little information exists on the interaction with fuel
octane number
The testing of turbocharged DI engines of different sizes and those equipped with newer
technology such as sequential turbocharging as well cooled EGR can permit a look forward into
the future interaction of fuel octane number and engine and vehicle efficiency CRC sponsored
testing research should focus on these newest technologies so that findings remain useful for the
future
64
LIST OF ACRONYMS
BP - British Petroleum
BMEP - Brake Mean Effective Pressure
BSFC - Brake Specific Fuel Consumption
CAD - Crank Angle Degrees
CFR - Co-operative Fuels Research
CR - Compression Ratio
CRC - Coordinating Research Council
DI - Direct Injection
Dyno - Dynamometer
EGR - Exhaust Gas Recirculation
ETBE - Ethyl tertiary butyl ether
Exx - Ethanol gasoline blend with the volumetric content of ethanol as a percent xx
FC - Fuel Consumption
HCCI - Homogeneous Charge Compression Ignition
IMEP - Indicated Mean Effective Pressure
ISFC - Indicated Specific Fuel Consumption
K - Weighting factor of MON in the Octane Index
KLSA - Knock Limited Spark Advance
kPa - kilo Pascal
LHV - Latent Heat of Vaporization
MAP - Manifold Air Pressure
MBT - Maximum Brake Torque
MIT - Massachusetts Institute of Technology
MON - Motor Octane Number
MPa - Mega Pascal
NA - Naturally Aspirated
OI - Octane Index of fuel = (1- K)RON + KMON
ONL -Octane Number Limit
65
ONR - Octane Number Requirement of engine
PFI - Port Fuel Injection
PRF - Primary Reference fuel
RON - Research Octane number
RPM - Revolutions Per Minute
S - Sensitivity of the fuel defined as RON - MON
SAE - Society of Automotive Engineers
SI - Spark ignition
SIDI - Spark Ignition Direct Injection
TDC - Top Dead Center (piston position)
66
REFERENCES
1 Heywood John H Internal Combustion Engine Fundamentals McGraw Hill Series in
Mechanical Engineering undated
2 Muranaka S Takagi Y and Ishida T Factors Limiting the Improvement in Thermal
Efficiency of SI Engine at Higher Compression Ratio SAE Paper 870548 February
1987
3 Ayala F Gerty M and Heywood J Effects of Combustion Phasing Relative Air-Fuel
Ratio Compression Ratio and Load on SI Engine Efficiency SAE Paper 2006-01-0229
April 2006
4 Kalghatgi GT Fuel Anti-Knock Quality ndash Part I Engine Studies SAE Paper 2001-01-
3584 September 2001
5 Kalghatgi G NakataK and Mogi K Octane Appetite Studies in Direct Injection
Spark Ignition Engines SAE Paper 2005-01-0244 April 2005
6 Mittal V and Heywood J The Relevance of Fuel RON and MON to Knock Onset in
Modern SI Engines SAE Paper 2008-01-2414 October 2008
7 Mittal V and Heywood J The Shift in Relevance of Fuel RON and MON to Knock
Onset in Modern SI Engines over the Last 70 Years SAE paper 2009-01-2622 October
2009
8 Mittal V Heywood J and Green W The Underlying Physics and Chemistry behind
Fuel Sensitivity SAE Paper 2010-01-0617 2010
9 Kalghatgi G T Auto-Ignition Quality of Practical Fuels and Implications for Fuel
Requirements of Future SI and HCCI Engines SAE Paper2005-01-0239 April 2005
10 AkihamaK et al Fuel Octane and Composition Effects on Efficiency and Emissions in
a High Compression Ratio SIDI Engine SAE Paper 2004-01-1950 June 2004
11 Farrell J et al Fuel Effects on SIDI Efficiency and Emissions SAE Paper 2003-01-
3866 October 2003
12 Nakata K et al The Effect of Ethanol on a Spark Ignition Engine SAE Paper 2006-01-
3380 October 2006
13 Bromberg L and Cohn D R Effective Octane and Efficiency Advantages of Direct
Injection Alcohol Engines MIT Lab for the Energy and Environment Report LFEE
2008-01RP January 2008
67
14 Munoz R et al Effect of Compression ratio on Stratified Charge Direct-Injection
Gasoline Combustion SAE Paper 2005-01-0100 April 2005
15 Nakata K et al The Impact of RON on SI Engine Thermal Efficiency SAE Paper
2007-01-2007 2007
16 Russ M A Review of the Effect of Engine Operating Conditions on Borderline Knock
SAE paper 960497 February 1996
17 Caris C F and Nelson E E A New Look at High Compression Engines SAE
Transactions Vol 67 1959
18 Haghgooie M Effect of Fuel Octane and Inlet Air Temperature on Knock
Characteristics of a Single Cylinder Engine SAE Paper 902134 October 1990
19 Millo F et al The Effect of Unleaded Gasoline Formulation on Antiknock
Performance SAE Paper 941862 October 1994
20 Okamoto K et al Study of Antiknock Performance under Various Octane Numbers
and Compression Ratios in a DISI Engine SAE Paper 2003-01-1804 May 2003
21 Akihama et al op cit June 2004
22 Fukui H Komoriya H and Shimizu T Effects of Octane Number on Stratified
Charge Combustion in a DI Gasoline Engine SAE Paper No 2001-01-1964 May 2001
23 Nakata K et al 2006 op cit
24 Taniguchi S Yoshida K and Tsukasaki Y Feasibility Study of Ethanol Applications
to a DI Gasoline Engine SAE Paper 2007-01-2037 2007
25 Hashimoto K Inaba O and Akasaka Y Effects of Fuel Properties on the Combustion
and Emission of DI Gasoline Engine SAE Paper 2001-01-0253 March 2001
26 CatonP Hamilton L and Cowart J An Experimental and Modeling Investigation into
the Comparative Knock and Performance Characteristics of E85 Gasohol and Regular
Unleaded Gasoline (87 R+M2) SAE Paper 2007-01-0473 April 2007
27 Duchaussoy Y Barbier P and Schmelzle P Impact of Gasoline RON and MON on a
Turbocharged MPI SI Engine Performance SAE Paper 2004-10-2001 June 2005
28 Williams J et al The Impact of Fuel Composition on the Combustion and Emissions of
a Prototype Lean Boosted PFI Engine SAE Paper 2010-01-2094 2010
29 Williams et al Impact of Butanol and Other Bio-Components on the Thermal Efficiency
of Prototype and Conventional EnginesSAE Paper 2009-01-1908 2009
68
30 Nakata K et al The effect of thermal properties on thermal efficiency of advanced
spark ignition engines International Journal of Engine Research 12274 2011
31 Milpied J et al Impact of Fuel Properties on the Performances and Knock Behaviour of
a Downsized Turbocharged DISI Engine SAE Paper 2009-01-0324 2009
32 Stein R et al Effect of Heat of Vaporization ChemicalOctane and Sensitivity on
Knock Limit for Ethanol-Gasoline Blends SAE Paper 2012-01-1277 2012
33 Brewster S Initial Development of a Turbocharged DI E100 Combustion System SAE
Paper 2007-01-3625 August 2007
34 Bromberg L and Cohn D R Effect of Compression Ratio and Manifold Pressure on
Ethanol Utilization in GasolineEthanol Engines MIT Lab for the Energy and
Environment Report March 2007
35 Bromberg L Cohn D R and Heywood J Calculations of Knock Suppression in
Highly Turbocharged GasolineEthanol Engines Using Direct Ethanol InjectionMIT Lab
for the Energy and Environment Report February 2006
36 Stein R House C and Leone T Optimal Use of E85 in a Turbocharged DI Engine
SAE Paper 2009-01-1490 2009
37 Sasaki N et al The Effect of Fuel Compounds on Pre-ignition under High Temperature
and High Pressure Condition SAE Paper 2011-01-1984 2011
38 Hamilton LJ et al Pre-ignition Characteristics of Ethanol and E85 in a Spark Ignition
Engine SAE Paper 2008-01-0321 2008