CRC Perspectives on constraints, opportunities and priorities Colin Kay Pork Producer, Director...
15
CRC Perspectives on constraints, opportunities and priorities Colin Kay Pork Producer, Director NZPIB
-
date post
19-Dec-2015 -
Category
Documents
-
view
214 -
download
0
Transcript of CRC Perspectives on constraints, opportunities and priorities Colin Kay Pork Producer, Director...
CRC Perspectives on constraints, opportunities and priorities
Colin KayPork Producer, Director NZPIB
November 2005

Key issues
• Sustainability
• Profitability

Sustainability
• Manure disposal – treat as a resource• Odour reduction• Country health status• Animal welfare – group housing• Marketing/promotion• Pork quality – boar taint• Pork industry image• Unfair trading - dumping• Obtain, train, retain good staff

Profitability
• Operating profit (EBIT)EBIT = Gross income – variable costs – fixed costs
• Cost of production
All research should result in increase in profit or reduction in COP

% COPVariable Feed costs 628,340 66.36% 1.69
Animal Health 33,750 3.56% 0.09General 29,450 3.11% 0.08Effluent 5,000 0.53% 0.01R&M 30,000 3.17% 0.08Stock replacements 50,050 5.29% 0.13Consultancy 2,000 0.21% 0.01Freight 20,136 2.13% 0.05
798,726
Fixed Power 30,000 3.17% 0.08Vehicles 5,000 0.53% 0.01Labour 100,000 10.56% 0.27Rates 2,000 0.21% 0.01Insurance 3,700 0.39% 0.01Accountancy 3,700 0.39% 0.01Admin 3,700 0.39% 0.01
148,100 Total 946,826$
Cost of capital 60,852$ 0.16
Sows 250 100.00% 2.71No pigs sold 22.17 5,543 CWgt 67 Total DWgt 371,381 COP / Kg CWgt 2.71$

COP relationships
• Price of feed vs. FCR-Use low value by-product – lower
feed costs but higher FCR
-Lower costs but reduce kg sold
COP Feed = cost/kg feed x FCR
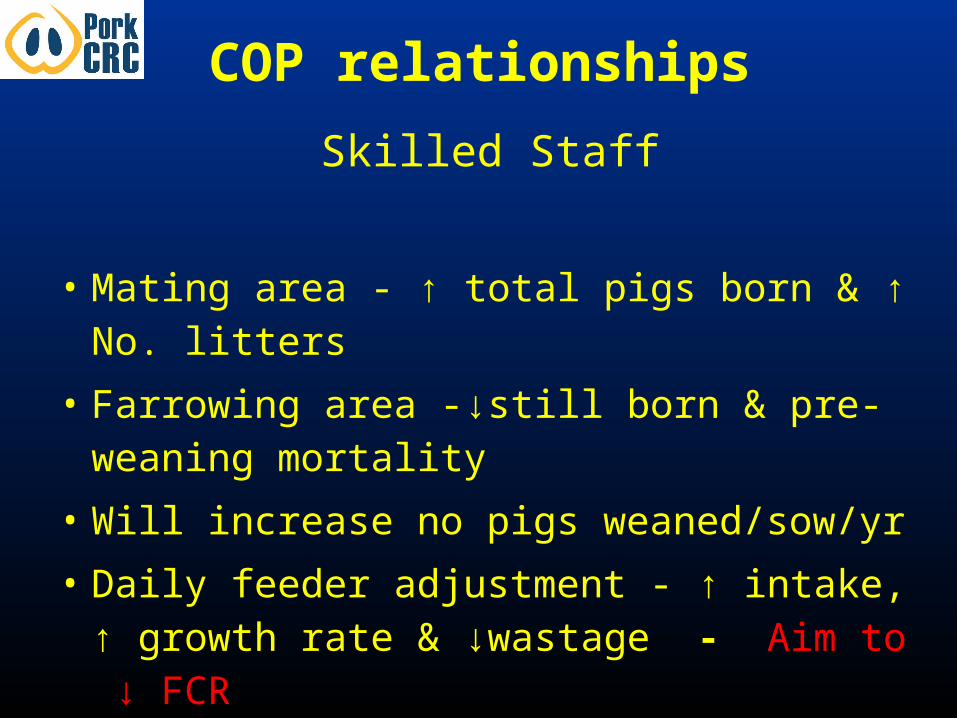
COP relationships
Skilled Staff
• Mating area - ↑ total pigs born & ↑ No. litters
• Farrowing area -↓still born & pre-weaning mortality
• Will increase no pigs weaned/sow/yr
• Daily feeder adjustment - ↑ intake, ↑ growth rate & ↓wastage - Aim to ↓ FCR

COP relationships
Breeding stock
• Improved carcass traits - killing out %, backfat and lean yield
• Increase total pigs born/litter
• ADFI + ADG + FCR

Effect of scale of production
• Compare two herd sizes
–250 sow herd
–500 sow herd
• Marketing 22.17 pigs/sow/year
• Carcass deadweight 67kg average

COPVariable costs Feed costs 1,256,680 71.99% 1.69
Animal Health 67,500 3.87% 0.09General 58,900 3.37% 0.08Effluent 10,000 0.57% 0.01R&M 60,000 3.44% 0.08Stock replacements 100,100 5.73% 0.13Consultancy 4,000 0.23% 0.01Freight 40,272 1,597,452 92% 2.31% 0.05
Fixed costs Power 30,000 1.72% 0.04Vehicles 5,000 0.29% 0.01Labour 100,000 5.73% 0.13Rates 2,000 0.11% 0.00Insurance 3,700 0.21% 0.00Accountancy 3,700 0.21% 0.00Admin 3,700 148,100 8% 0.21% 0.00
Total 1,745,552
Cost of capital 100,000$ 0.13
Sows 500 No pigs sold 22.17 11,086 CWgt 67 Total DWgt 742,762 COP / Kg CWgt 2.48$ 100% 2.48$
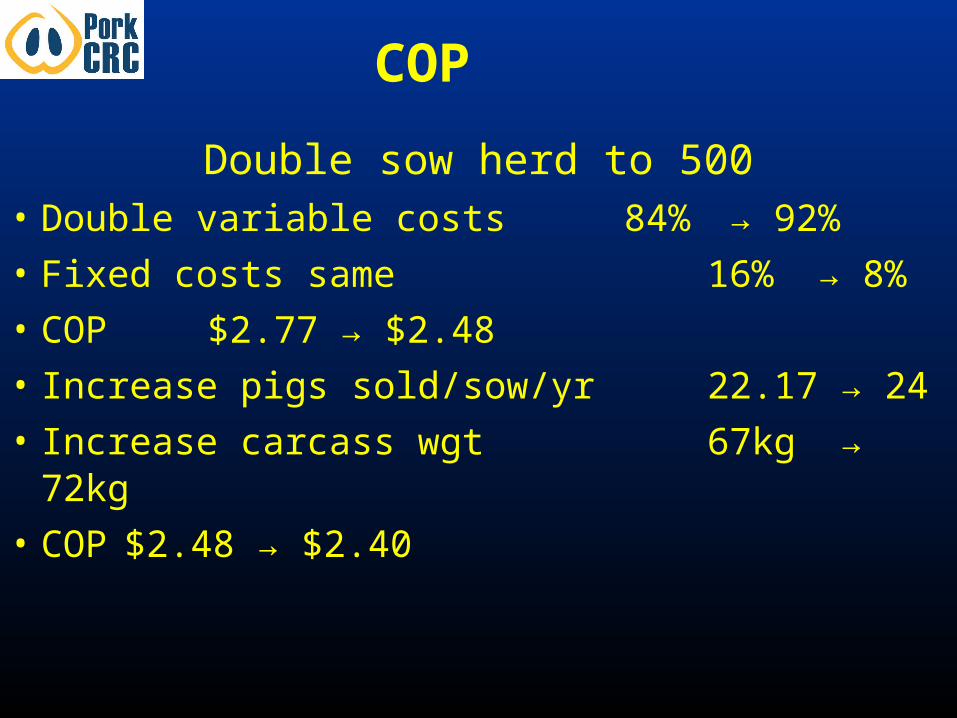
COP
Double sow herd to 500• Double variable costs 84% → 92%
• Fixed costs same 16% → 8%
• COP $2.77 → $2.48
• Increase pigs sold/sow/yr 22.17 → 24
• Increase carcass wgt 67kg → 72kg
• COP $2.48 → $2.40

Profit
• ($/kg – ((cost/kg feed x FRC) + variable costs/kg+ fixed costs/kg))) x volume kg

Constraints
• Scale
• Environmental
• Cost of cereal grains
• Labour

Opportunities
• ↑ Utilisation of feed - ↑ intake ↓ wastage
• ↑ Digestibility of feed ingredients
• By product feeds
• ↓ Reproductive wastage
• Group housing management
• Outdoor production
• ↑ Carcass weights
• Staff training and recruitment
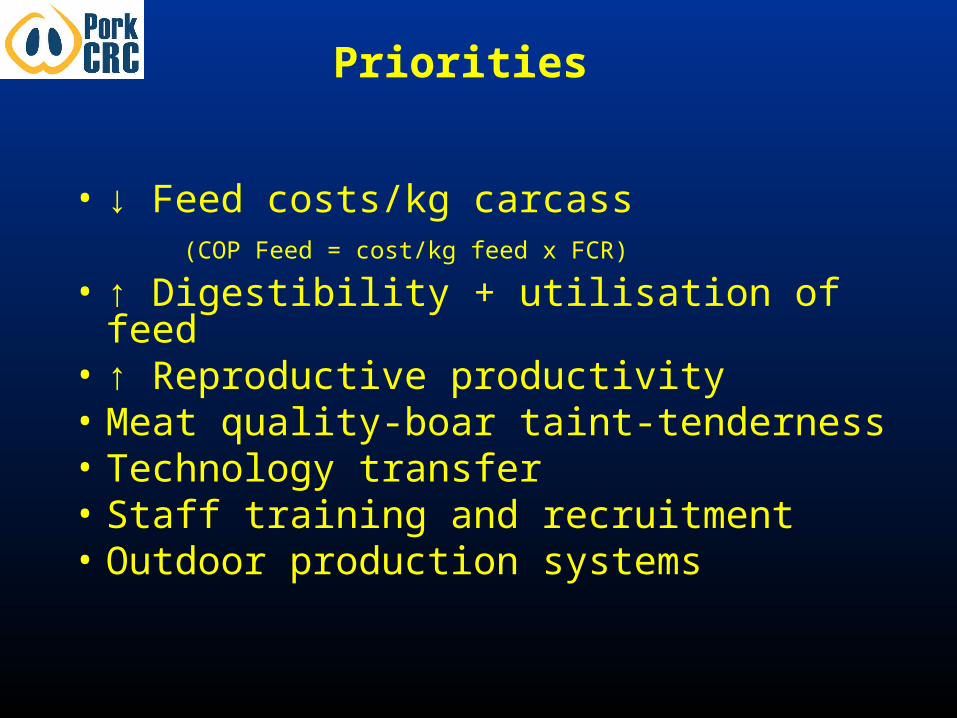
Priorities
• ↓ Feed costs/kg carcass (COP Feed = cost/kg feed x FCR)
• ↑ Digestibility + utilisation of feed • ↑ Reproductive productivity• Meat quality-boar taint-tenderness• Technology transfer• Staff training and recruitment• Outdoor production systems


![Pandering and pork-barrel politics · pork / =∗ >/ (∗)+ >(=∗ ∗= =, ()= < ≥ ()+≥(. / /. / ∗ ∗ ()= ⎧ ⎪⎨ ⎪⎩ ()>) ()∈ ) (∗,)> . ≡ /)]](https://static.fdocuments.net/doc/165x107/5f953f35c33d70257c62d34e/pandering-and-pork-barrel-politics-pork-a-a-a-a-.jpg)