The Impact of Routing Option on Bus Lane - Udayalaksmanakartiyasa
4/04/2011
1
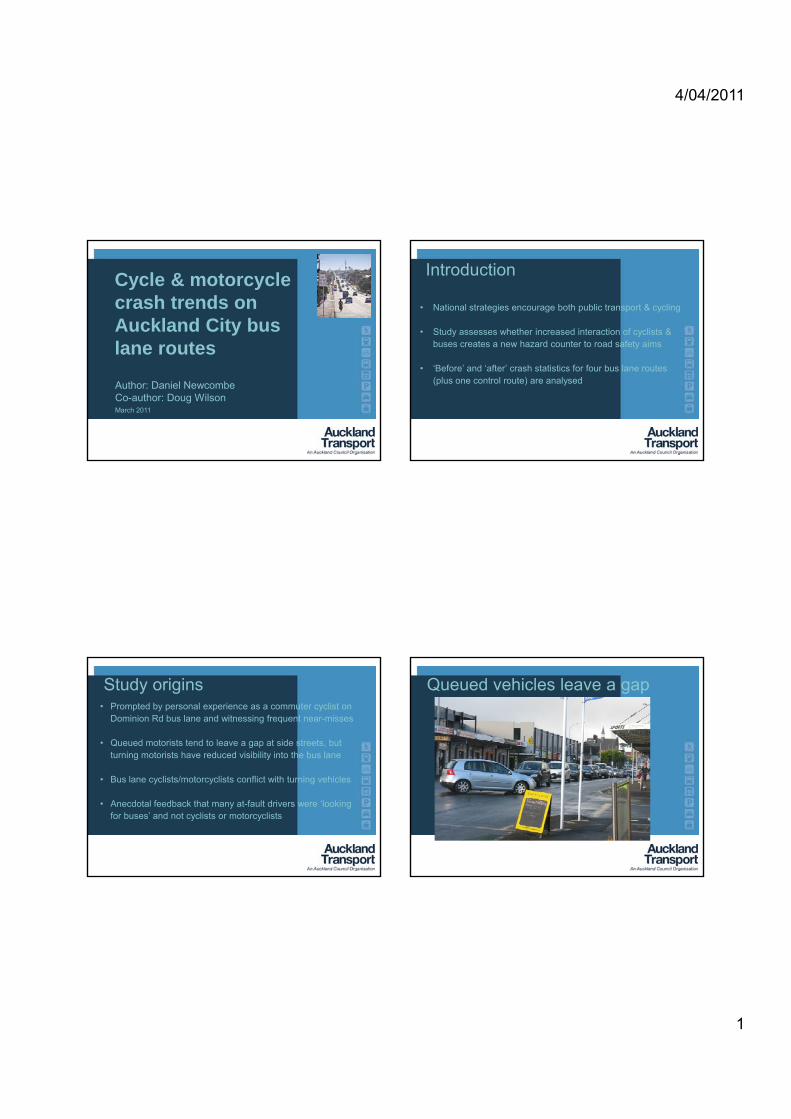
Cycle & motorcycle crash trends on Auckland City bus lane routes
March 2011
Author: Daniel Newcombe Co-author: Doug Wilson
lane routes
Introduction
• National strategies encourage both public transport & cycling
• Study assesses whether increased interaction of cyclists & buses creates a new hazard counter to road safety aims
• ‘Before’ and ‘after’ crash statistics for four bus lane routes (plus one control route) are analysed
Study origins• Prompted by personal experience as a commuter cyclist on
Dominion Rd bus lane and witnessing frequent near-misses
• Queued motorists tend to leave a gap at side streets, but turning motorists have reduced visibility into the bus lane
• Bus lane cyclists/motorcyclists conflict with turning vehicles
• Anecdotal feedback that many at-fault drivers were ‘looking for buses’ and not cyclists or motorcyclists
Queued vehicles leave a gap

4/04/2011
2
Driver cannot see on-coming motorcyclist Bus lanes can be busy even without buses
Auckland cycle safety statistics• Cyclists make up 1-2% of road users but 8% of casualties
• Other vehicle - cars (91%), bus (4%), truck (3%)
• Crossing/turning crashes 33% of movement types
• Poor observation (45%) and failure to give way (33%) most common contributing factors in cycle crashes
• “Cyclist factors” contribute to less than 5%
Auckland City cycle crashes (2000-09)
4/04/2011
3
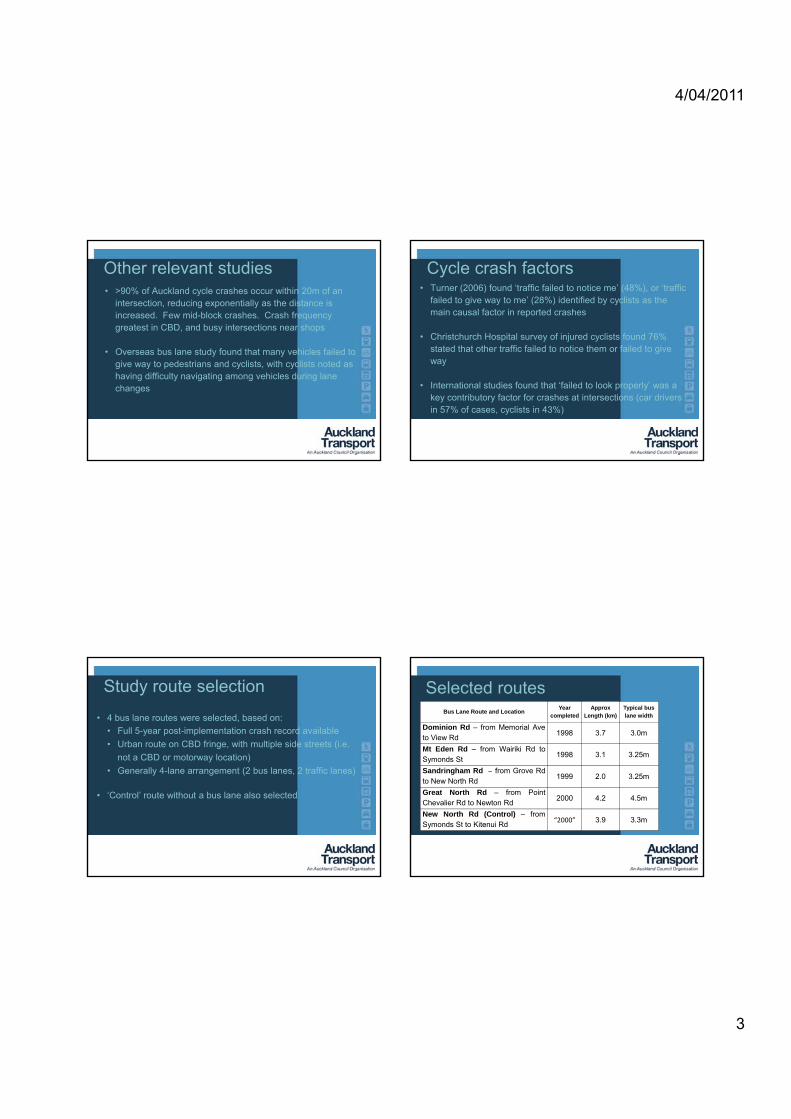
Other relevant studies• >90% of Auckland cycle crashes occur within 20m of an
intersection, reducing exponentially as the distance is increased. Few mid-block crashes. Crash frequency greatest in CBD, and busy intersections near shops
Overseas bus lane study found that many vehicles failed to• Overseas bus lane study found that many vehicles failed to give way to pedestrians and cyclists, with cyclists noted as having difficulty navigating among vehicles during lane changes
Cycle crash factors• Turner (2006) found ‘traffic failed to notice me’ (48%), or ‘traffic
failed to give way to me’ (28%) identified by cyclists as the main causal factor in reported crashes
• Christchurch Hospital survey of injured cyclists found 76% stated that other traffic failed to notice them or failed to givestated that other traffic failed to notice them or failed to give way
• International studies found that ‘failed to look properly’ was a key contributory factor for crashes at intersections (car drivers in 57% of cases, cyclists in 43%)
Study route selection
• 4 bus lane routes were selected, based on:
• Full 5-year post-implementation crash record available
• Urban route on CBD fringe, with multiple side streets (i.e.
not a CBD or motorway location)
• Generally 4-lane arrangement (2 bus lanes, 2 traffic lanes)
• ‘Control’ route without a bus lane also selected
Selected routesBus Lane Route and Location
Year completed
Approx Length (km)
Typical bus lane width
Dominion Rd – from Memorial Aveto View Rd
1998 3.7 3.0m
Mt Eden Rd – from Wairiki Rd toSymonds St
1998 3.1 3.25m
Sandringham Rd – from Grove Rdto New North Rd
1999 2.0 3.25m
Great North Rd – from PointChevalier Rd to Newton Rd
2000 4.2 4.5m
New North Rd (Control) – fromSymonds St to Kitenui Rd
“2000” 3.9 3.3m

4/04/2011
4
Study route locations Total cycle or motorcycle crashes• No discernable change in cycle or motorcycle crashes
following implementation of bus lanes• Sole exception of Dominion Rd – 30% increase recorded• Results indicate bus lanes have little, if any, overall effect on
the safety of cyclists or motorcyclists – pending Dominion Rd assessment
Cycle crashes• No clear trend in cycle crashes • Most routes experienced a slight increase within range
expected by growth in traffic volumes or cyclist numbers • Note lack of major increase in cycle crashes on Dominion
Rd as with motorcycle crashes
Motorcycle crashes• Motorcycle crashes decreased in every route – except
Dominion Rd (which increased by 80%)• No current data available on the proportion of motorcycle
traffic on individual routes but unlikely that Dominion Rd is significantly different to other routes
4/04/2011
5
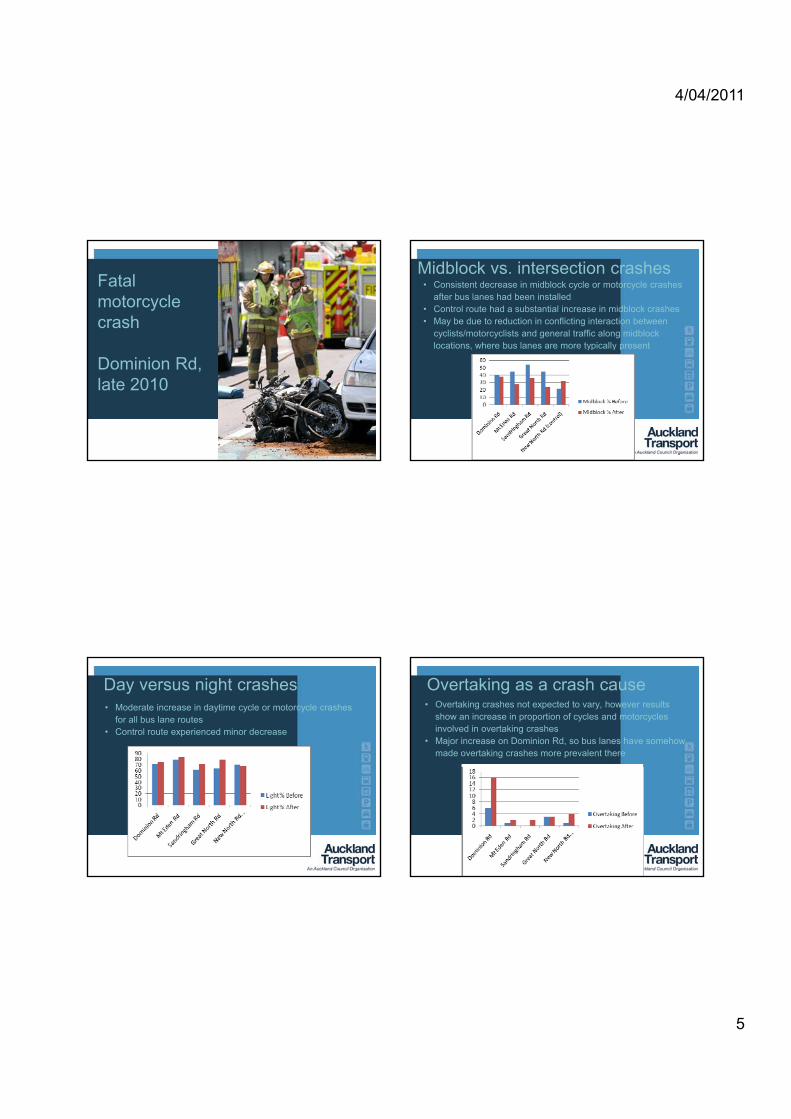
Fatal motorcycle crash
Dominion Rd, late 2010
Midblock vs. intersection crashes• Consistent decrease in midblock cycle or motorcycle crashes
after bus lanes had been installed • Control route had a substantial increase in midblock crashes• May be due to reduction in conflicting interaction between
cyclists/motorcyclists and general traffic along midblock locations, where bus lanes are more typically presenty y
Day versus night crashes• Moderate increase in daytime cycle or motorcycle crashes
for all bus lane routes• Control route experienced minor decrease
Overtaking as a crash cause• Overtaking crashes not expected to vary, however results
show an increase in proportion of cycles and motorcycles involved in overtaking crashes
• Major increase on Dominion Rd, so bus lanes have somehow made overtaking crashes more prevalent there

4/04/2011
6
Cycle accident rate assessment• Economic Evaluation Manual used to assess relative
accident rates of routes with sufficient cyclist data
• Expected or typical crash rates were assessed using “Conflict – urban mid-block pedestrian and cyclist facilities” and “Conflict urban signalised crossroads” modelsand Conflict – urban signalised crossroads models
• Simplistically, combined midblock/intersection results represents typical cycle crash rates for comparison to actual crash rates
ResultsRoute
Midblk. rates
Int. ratesCombined
resultsActual rates
Ratio actual/typical
Dominion Rd 2.158 0.114 2.272 4.98 2.19 ≈ 2.2
Great Nth Rd 2.590 0.199 2.789 1.49 0.53 ≈ 0.5
New North Rd 1.319 0.128 1.447 1.49 1.03 ≈ 1.0
• Dominion Rd has more than double ‘expected’ cycle crashes, whilst Great North Rd has half the ‘expected’ cycle crashes
• Interestingly New North Road, the control route, has almost exactly the ‘expected’ number of cycle crashes
Results analysis• Likely explanation is that Dominion Rd bus lanes are 3.0m,
whereas Great North Rd’s typically closer to 4.5m
• New North Rd lanes vary but are typically 3.25-3.5m
• Indication that more generous bus lane widths result in lowerIndication that more generous bus lane widths result in lower cyclist crash rates, whereas narrower than standard bus lanes can increase cyclist crash rates
• Little else to differentiate the routes from each other in a way that aligns with the ratio of actual versus typical crash rates
Results summary (1)• No discernable increase in cycle or motorcycle crash rates
on bus lane routes (except for Dominion Rd, which appears to have a standalone problem with motorcycle crashes)
• Almost no change in terms of cycle crashes, and an overall decrease in reported motorcycle crashes (bar Dominiondecrease in reported motorcycle crashes (bar Dominion Rd)
• Overall, the results indicate bus lanes have little, if any, effect on the safety of cyclists or motorcyclists
4/04/2011
7
Results summary (2)• Bus lanes decreased midblock cycle or motorcycle crashes
• Increase in daytime cycle or motorcycle crashes
• The presence of buses does not appear to cause a safety issue for cyclists and motorcyclists (very low numbers)
• Bus lanes increased overtaking crashes, particularly at Dominion Rd
Recommendations • Make new bus lanes as wide as standards allow (4.5m
max width)
• Avoid narrower than standard bus lane widths
• Investigate motorcycle and overtaking crash causes on• Investigate motorcycle and overtaking crash causes on Dominion Rd
• Dispel myth that cyclists in bus lanes should be worried about buses. Turning vehicles pose the greatest risk
Questions?