Crash Data Retrieval System Validation Testing
22
Crash Data Retrieval System Validation Testing Wisconsin State Patrol Academy November 2, 2001 2001 Crash Reconstruction In-Service Test Results Compiled By Trooper Tim Austin
Transcript of Crash Data Retrieval System Validation Testing

Crash Data Retrieval System Validation Testing
Wisconsin State Patrol Academy November 2, 2001
2001 Crash Reconstruction In-Service
Test Results Compiled By Trooper Tim Austin

2
TABLE OF CONTENTS
INTRODUCTION..................................................................................................................................... 4
TEST VEHICLES..................................................................................................................................... 5 2000 CHEVROLET BLAZER ........................................................................................................... 5 2000 CHEVROLET RED IMPALA.................................................................................................... 5 2000 CHEVROLET BLACK IMPALA................................................................................................ 6
VALIDATION TESTING INSTRUMENTS ......................................................................................... 7 VERICOM® VC2000 BRAKING TEST COMPUTERS ........................................................................ 7 KUSTOM KR-10 SP RADAR ......................................................................................................... 7
TEST METHODOLOGY ........................................................................................................................ 8 CDR VALIDATION TESTING ......................................................................................................... 8 DECELERATION FACTOR TESTING ................................................................................................ 8
CDR TEST NUMBER ONE .................................................................................................................... 9 CDR DATA................................................................................................................................... 9 RADAR/VC2000 DATA ................................................................................................................ 9
CDR TEST NUMBER TWO ................................................................................................................. 10 CDR DATA................................................................................................................................. 10 RADAR/VC2000 DATA .............................................................................................................. 10
CDR TEST NUMBER THREE............................................................................................................. 11 CDR DATA................................................................................................................................. 11 RADAR/VC2000 DATA .............................................................................................................. 11
CDR TEST NUMBER FOUR ............................................................................................................... 12 CDR DATA................................................................................................................................. 12 RADAR/VC2000 DATA .............................................................................................................. 12
CDR TEST NUMBER FIVE ................................................................................................................. 13
CDR DATA................................................................................................................................. 13 RADAR/VC2000 DATA .............................................................................................................. 13
CDR TEST NUMBER SIX .................................................................................................................... 14 CDR DATA................................................................................................................................. 14 RADAR/VC2000 DATA .............................................................................................................. 14
CDR TEST NUMBER SEVEN ............................................................................................................. 15 CDR DATA................................................................................................................................. 15 RADAR/VC2000 DATA .............................................................................................................. 15
CDR VALIDATION TEST RESULTS SUMMARY .......................................................................... 16 TABLE OF RESULTS..................................................................................................................... 16 DISCUSSION................................................................................................................................ 16
CDR ACCURACY.................................................................................................................................. 16 TEST THREE – FAILURE TO OBTAIN NEAR-DEPLOYMENT FILE .......................................................... 17
3
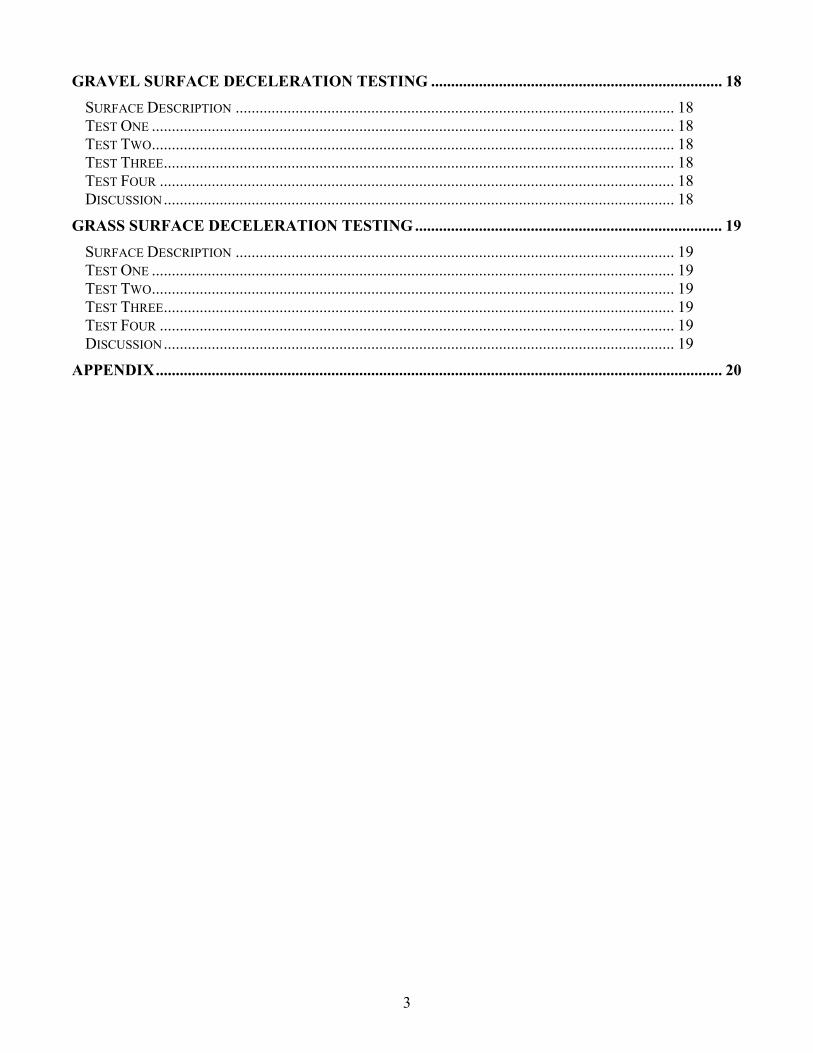
GRAVEL SURFACE DECELERATION TESTING ......................................................................... 18 SURFACE DESCRIPTION .............................................................................................................. 18 TEST ONE ................................................................................................................................... 18 TEST TWO................................................................................................................................... 18 TEST THREE................................................................................................................................ 18 TEST FOUR ................................................................................................................................. 18 DISCUSSION................................................................................................................................ 18
GRASS SURFACE DECELERATION TESTING ............................................................................. 19 SURFACE DESCRIPTION .............................................................................................................. 19 TEST ONE ................................................................................................................................... 19 TEST TWO................................................................................................................................... 19 TEST THREE................................................................................................................................ 19 TEST FOUR ................................................................................................................................. 19 DISCUSSION................................................................................................................................ 19
APPENDIX.............................................................................................................................................. 20

4
INTRODUCTION
As of this writing, the Wisconsin State Patrol has had success in retrieving collision information from passenger cars and trucks. Using hardware and software manufactured by the Vetronix® corporation, data recorded by vehicle Airbag Sensing and Diagnostic Modules (SDM’s) can be recovered and viewed in table and graph form. Currently, the Division only has the ability to retrieve data from late model General Motors vehicles. However, it is anticipated that some vehicles manufactured by the Ford Motor Company will be accessible by early 2002. To explain what exactly this system is, the following summary is offered. In 1997, the National Transportation Safety Board (NTSB) made a recommendation to vehicle manufacturers that crash data be recorded using on-board sensing devices. In response, General Motors expanded the information stored by their Airbag Sensing and Diagnostic Modules (SDM’s). For the purposes of explanation, this is the electronic instrument that “senses” a crash and makes the “decision” as to whether or not the airbags should be deployed. When the vehicle is running, vehicle speed, engine speed, percent throttle, and brake position data is transmitted to the SDM once every second by either the Powertrain Control Module (PCM) or the Antilock Brake System (ABS) module. If the vehicle is involved in a collision and the SDM “decides” to deploy the airbags, it will also take a “snapshot” of the last five data transmissions it received from the PCM and/or the ABS module. The same is true when a near-deployment incident occurs, that is, when the negative longitudinal deceleration is such that the sensor recognizes the event, but does not trigger an airbag deployment. Using hardware and software manufactured by the Vetronix® Corporation, this data can be retrieved and analyzed. On November 2, 2001, Division crash reconstructionists organized and participated in a training study of the Vetronix® Crash Data Retrieval (CDR) system and an examination of deceleration properties on various surfaces. It should be noted here that the intention of this compilation is not to discuss the technical aspects of the CDR system, but rather to simply report test results and offer an interpretation of the data retrieved. It is also stated that the primary purpose of the testing was to provide exposure, training, and experience to Wisconsin State Patrol reconstruction personnel in regards to the SDM data collection process. It was not intended to serve as a scientific validation study of SDM or CDR technologies for external publication.

5
TEST VEHICLES • 2000 Chevrolet Blazer
The first test vehicle utilized is identified as a 2000 Chevrolet Blazer four-door sport utility vehicle. It is red in color, and was manufactured with the engine specifications listed in the below table. This vehicle is privately owned by Trooper Jamie Zynda, who volunteered its use. Trooper Zynda also served as the vehicle driver for the testing.
Vehicle Year 2000
Make Chevrolet
Model Blazer
Type: SUV
Color: Red
Vehicle Identification Number (VIN): 1GNDT13W3Y2356464
Approx Mileage: 39,000
Engine Size: 4.3 Liter, 6-Cylinder
Tire Make: Uniroyal
Tire Model: Laredo
Tire Size: P235-70R15
Tire Tread: 7/32”
• 2000 Chevrolet Red Impala
The second vehicle used in the testing procedures is identified as a 2000 Chevrolet Impala sedan passenger car. The first of two such vehicles, this unit is red in color and utilized by the Wisconsin State Patrol as a police cruiser. The Impala is assigned to Trooper Ted Staffen, who operated the vehicle during its test runs.
Vehicle Year 2000
Make Chevrolet
Model Impala
Type: Sedan
Color Red
Vehicle Identification Number (VIN): 2G1WF55K3Y9256515
Approx Mileage: 63,300
Engine Size: 3.8 Liter, 6-Cylinder
Tire Make: Good Year
Tire Model: Eagle
Tire Size: P225-60R16
Tire Tread: 4/32”

6
• 2000 Chevrolet Black Impala
The third test vehicle is also identified as a Chevrolet Impala sedan. Again, this vehicle has been equipped as a police vehicle for the Wisconsin State Patrol. It is black in color, and presently assigned to the Division’s Headquarters in Madison. During the various tests, it was operated by Lieutenant Dan Lonsdorf.
Vehicle Year 2000
Make Chevrolet
Model Impala
Type: Sedan
Color: Black
Vehicle Identification Number (VIN): 2G1WF55K1Y9256027
Approx Mileage: 27,000
Engine Size: 3.8 Liter, 6-Cylinder
Tire Make: Good Year
Tire Model: Eagle
Tire Size: P225-60R16
Tire Tread: 5/32”
Note: In all tests, vehicle operators and passengers were utilizing safety restraints (seat belts).
- End of Page -

7
VALIDATION TESTING INSTRUMENTS
The following instruments were utilized during the testing process to record data concerning the vehicle decelerations. All units are owned by the Wisconsin State Patrol, and used by investigators on a regular basis.
• Vericom® VC2000 Braking Test Computers According to literature included at the time of purchase, the VC2000 Braking Test Computer utilizes an internal accelerometer to measure motion (acceleration and deceleration) in terms of speed change rate. The G-force sustained by the instrument is sampled 100 times each second to calculate the average G. This computation, in combination with an internal crystal clock, is then used by the instrument to calculate speed. Following a test run, the unit will offer its computations of speed, distance, and time, and list deceleration values for every one tenth of a second. This deceleration data is then further broken down into average and peak values. Serial Number, VC2000 Braking Test Computer One: 92250903 Serial Number, VC2000 Braking Test Computer Two: 98114343
• Kustom KR-10 SP Radar A Kustom KR-10 SP standard police radar device was used to independently measure oncoming vehicle speeds. It was utilized in stationary mode by a trained radar operator, and checked for proper operation both before and after the testing. This particular radar only displays whole numbers, thus essentially rounding the speeds down to the nearest mile per hour.
Unit Serial Number: EE11157
Antenna Serial Number: CC11871
65 Tuning Fork Number: 26996
35 Tuning Fork Number: 28669

8
TEST METHODOLOGY
• CDR Validation Testing To create near-deployment files in the test vehicles, they were accelerated to a high rate of speed, at which point a hard brake application was initiated. As the vehicle was nearing the hard-brake application point, a radar operator observed the vehicles’ approach speeds. A passenger in the test vehicles operated the Vericom VC2000 Braking Test Computer, and recorded the speed, stopping distance, and average deceleration factor calculated by the instrument. The VC2000 was mounted on the windshield glass in accordance with the device’s operations manual (see figure 1). Once the individual vehicle had stopped, the Airbag Sensing and Diagnostic Module was accessed remotely via the Data Link Connection (DLC) port located under the dashboard (figure 2). Using the Vetronix® hardware and software, near-deployment data was recorded (figure 3). This recovered pre-crash data was then compared to the radar operator’s observations and the VC2000 calculations. All data obtained is listed under the next CDR TEST topic heading series. • Deceleration Factor Testing
To determine the deceleration properties of the gravel and grass surfaces, vehicles were first accelerated to a moderate speed range on the questioned terrain. This was then immediately followed by a hard brake application. Again, as the vehicles approached, a radar operator noted their speeds. Likewise, a passenger in the test vehicle operated the Vericom® VC2000 and recorded stop time, stop distance, and the average deceleration factor calculated by the computer. The Vericom® speed data was then compared to the radar operator’s observations. Data results are listed further in this compilation.
Note: All test vehicles were used with the Antilock Brake System(s) operational.
Figure 1
Figure 2
Figure 3

9
CDR TEST NUMBER ONE
Test Vehicle: Chevrolet Impala (Red) VIN 2G1WF55K3Y9256515 • CDR Data
• Radar/VC2000 Data Radar:
N/R VC2000 Indicated Distance:
102 feet VC2000 Indicated Time:
2.79 sec VC2000 Indicated Speed:
50.2 mph VC2000 Indicated Average G:
.820

10
CDR TEST NUMBER TWO
Test Vehicle: Chevrolet Impala (Red) VIN 2G1WF55K3Y9256515 • CDR Data
• Radar/VC2000 Data Radar:
N/R VC2000 Indicated Distance:
180 feet VC2000 Indicated Time:
3.84 sec VC2000 Indicated Speed:
61 mph VC2000 Indicated Average G:
.723

11
CDR TEST NUMBER THREE
Test Vehicle: 2000 Chevrolet Blazer (Red) VIN 1GNDT13W3Y2356464 • CDR Data
The SDM download was not successful. Instead, data from a previous near-deployment incident was recovered. • Radar/VC2000 Data Radar:
N/R VC2000 Indicated Distance:
138 feet VC2000 Indicated Time:
3.40 sec VC2000 Indicated Speed:
55.5 mph VC2000 Indicated Average G:
.743
12
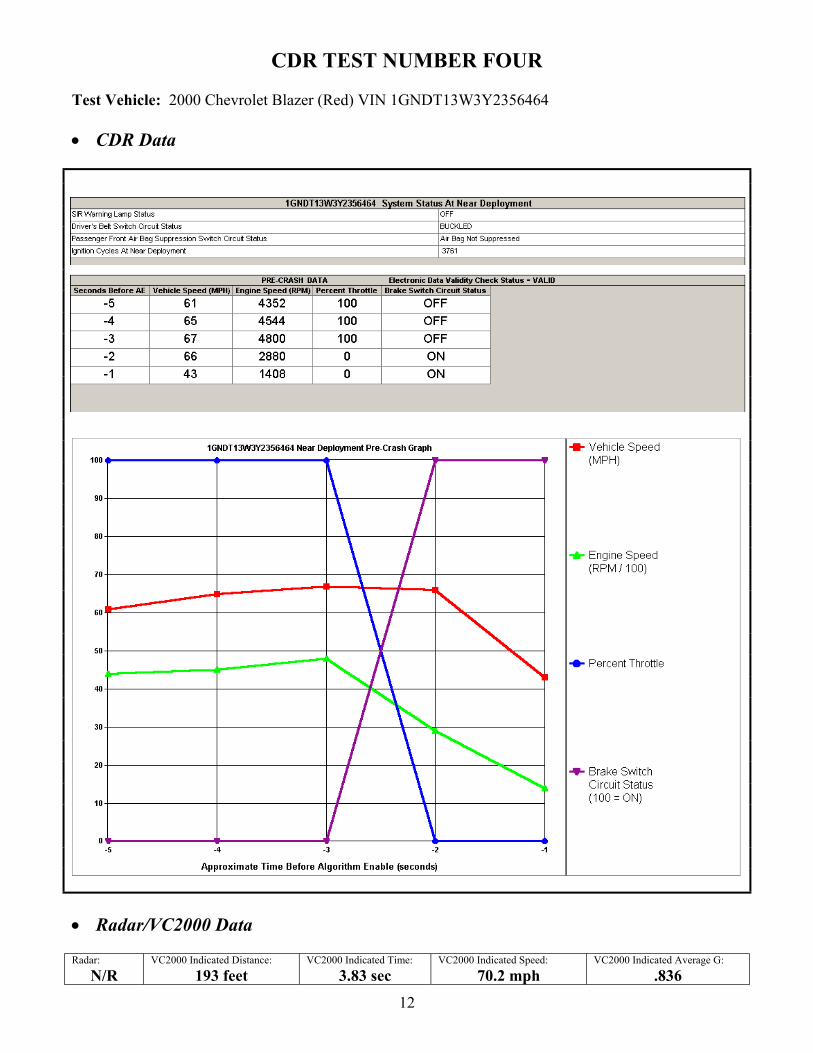
CDR TEST NUMBER FOUR
Test Vehicle: 2000 Chevrolet Blazer (Red) VIN 1GNDT13W3Y2356464 • CDR Data
• Radar/VC2000 Data Radar:
N/R VC2000 Indicated Distance:
193 feet VC2000 Indicated Time:
3.83 sec VC2000 Indicated Speed:
70.2 mph VC2000 Indicated Average G:
.836

13
CDR TEST NUMBER FIVE
Test Vehicle: Chevrolet Impala (Black) VIN 2G1WF55K1Y9256027 • CDR Data
• Radar/VC2000 Data Radar:
63 VC2000 Indicated Distance:
185 feet VC2000 Indicated Time:
3.93 sec VC2000 Indicated Speed:
63.6 mph VC2000 Indicated Average G:
.738
14
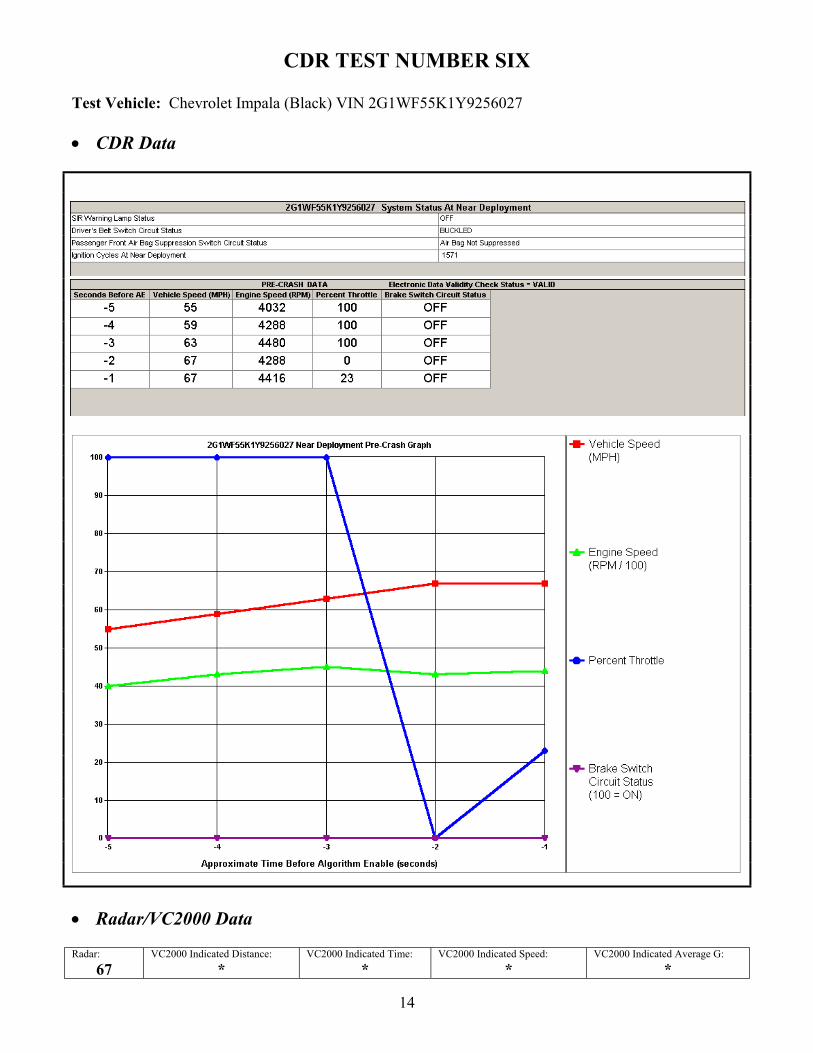
CDR TEST NUMBER SIX
Test Vehicle: Chevrolet Impala (Black) VIN 2G1WF55K1Y9256027 • CDR Data
• Radar/VC2000 Data Radar:
67 VC2000 Indicated Distance:
* VC2000 Indicated Time:
* VC2000 Indicated Speed:
* VC2000 Indicated Average G:
*

15
CDR TEST NUMBER SEVEN
Test Vehicle: Chevrolet Impala (Black) VIN 2G1WF55K1Y9256027 • CDR Data • Radar/VC2000 Data Radar:
45 VC2000 Indicated Distance:
N/R VC2000 Indicated Time:
4.24 sec VC2000 Indicated Speed:
46.5 mph VC2000 Indicated Average G:
.500

16
CDR VALIDATION TEST RESULTS SUMMARY
• Table of Results The following table summarizes the test results and allows for simplified comparison. The SDM and radar speeds listed are the highest speeds observed.
• Discussion CDR ACCURACY In comparing the seven tests for the purposes of CDR validation, an increased weight is placed on the final three runs. These tests, numbers 5, 6, and 7, incorporated the use of the standard police radar to note the highest vehicle speed obtained. Time and preparation limitations prevented the device from being utilized on the first four runs. In each of the latter cases, the highest speed observed by the radar operator matched that which was recorded by the SDM. These comparisons do indeed suggest a validation of the SDM data recordings. Chidester, et al.1 suggests SDM vehicle speed reporting to be accurate to within +/- 4%. However, the three runs utilizing the black 2000 Chevrolet Impala and Kustom radar seem to indicate an even greater accuracy, at least in these limited tests. While a greater emphasis is placed on those runs incorporating the police radar unit, the previous four tests should not be overlooked. With the exception of test three (which will be addressed in the following sub-heading), the SDM speed data was within three whole miles per hour of the VC2000 data. While this may at first appear as a discrepancy, it should be reminded that the VC2000 and SDM record or calculate speed via two very different techniques. The Vericom instrument, which was set to activate at .2 g’s, calculates vehicle speed after obtaining accelerometer data and combining this information with its internal crystal clock. The SDM, however, obtains data directly from the transmission output shaft via magnetic pickup. For all test vehicles, the wheels/tires did match manufacturer’s specifications, thereby increasing the likelihood of accurate vehicle speed recording. The rather small difference in speed readings between the two techniques, however, does indeed serve to validate the SDM data. Other data provided by the SDM, in addition to speed information, was found to be accurate. The Driver’s Belt Switch Circuit Status indicator, for example, correctly reported the driver’s seatbelt use in all seven of the test runs. The ignition cycles were also monitored by test participants, to both ensure an
1 Chidester, Augustus, et al. Recording Automotive Crash Event Data. National Highway Traffic Safety Administration.
Test Number Vehicle Tested SDM Speed Radar Speed VC2000 Speed 1 Red Impala 50 N/A 50.2 2 Red Impala 63 N/A 61 3 Red Blazer N/A N/A 55.5 4 Red Blazer 67 N/A 70.2 5 Black Impala 63 63 63.6 6 Black Impala 67 67 N/A 7 Black Impala 45 45 46.5

17
accurate counting by the SDM’s, and to verify that the data recovered was indeed from the staged test. In each case, the proper numerical sequence was observed. TEST THREE – FAILURE TO OBTAIN NEAR-DEPLOYMENT FILE In test number three, that being the first involving the 2000 Chevrolet Blazer, a near-deployment file was recovered from the SDM. However, an examination of the retrieved data suggested that it had been generated by a prior incident. Although the controlled test parameters may indeed have triggered a near-deployment event, it is possible that it was less severe than the file previously recorded by the module. Therefore, the “snapshot” of pre-crash data did not overwrite that which was previously saved. According to information provided by the Vetronix® Corporation2, near-deployment data recorded by the module can generally only be overwritten by either a more severe occurrence, or with the passage of time in terms of 250 ignition cycles. This time is estimated by Chidester3 to be the equivalent of 60 normal driving days. A second possibility for this failure to obtain a near-deployment file from test number three is that the algorithm may simply not have been enabled. Haight4 offers that in order for a near-deployment event to occur, the SDM must detect that the negative forward acceleration exceeds –1 to –2 g’s. Chidester further explains these requirements, stating that the SDM’s internal longitudinal accelerometer is sampled every 312 microseconds (.000312 seconds). If the SDM detects that two consecutive samples exceed approximately -2 g’s, then algorithm enable occurs. For the sport utility vehicle (SUV) tested, it is probable that the higher end of this range is required for activation. Put simply, the more rugged design intentions of the Chevrolet Blazer would likely mandate a higher threshold for algorithm enable. 2 Vetronix Corporation. CDR Crash Data Retrieval System. 3 Chidester, Augustus, et al. Recording Automotive Crash Event Data. National Highway Traffic Safety Administration. 4 Haight, W.R. Automobile Event Data Recorder Technology. Collision Safety Institute

18
GRAVEL SURFACE DECELERATION TESTING • Surface Description The test surface can best be described as a well-traveled (packed) gravel roadway. • Test One
Vehicle Year 2000
Make Chevrolet
Model Blazer
Type: SUV
Color: Red
Vehicle Identification Number (VIN): 1GNDT13W3Y2356464
Radar Indicated Speed: 45 mph
VC2000 Indicated Time: 4.10 sec
VC2000 Indicated Speed: 45.5 mph
VC2000 Indicated Average G:
.505 • Test Two
Vehicle Year 2000
Make Chevrolet
Model Blazer
Type: SUV
Color: Red
Vehicle Identification Number (VIN): 1GNDT13W3Y2356464
Radar Indicated Speed: 47 mph
VC2000 Indicated Time: 4.50 sec
VC2000 Indicated Speed: 46.1 mph
VC2000 Indicated Average G:
.467 • Test Three
Vehicle Year 2000
Make Chevrolet
Model Impala
Type: Sedan
Color: Black
Vehicle Identification Number (VIN): 2G1WF55K1Y9256027
Radar Indicated Speed: 48 mph
VC2000 Indicated Time: 4.26 sec
VC2000 Indicated Speed: 49.9 mph
VC2000 Indicated Average G: .531
• Test Four Note: This test is also documented under CDR Test Number Seven.
Vehicle Year 2000
Make Chevrolet
Model Impala
Type: Sedan
Color: Black
Vehicle Identification Number (VIN): 2G1WF55K1Y9256027
Radar Indicated Speed: 45 mph
VC2000 Indicated Time: 4.24 sec
VC2000 Indicated Speed: 46.5 mph
VC2000 Indicated Average G: .500
• Discussion The four tests all show agreement and concurrence between the radar indicated speed and VC2000 indicated speed. Each test was completed at near speeds, with reported average deceleration results ranging from .467 g’s to .531 g’s. The average of these drag factors is calculated as .500 g’s.

19
GRASS SURFACE DECELERATION TESTING • Surface Description The terrain utilized was a grass ditch adjacent to a closed Ft. McCoy street. The grass was dry and uncut, measuring approximately 6” to 1’. The underlying soil was composed of a dry sandy loam. • Test One
Vehicle Year 2000
Make Chevrolet
Model Impala
Type: Sedan
Color: Black
Vehicle Identification Number (VIN): 2G1WF55K1Y9256027
Radar Indicated Speed: 30 mph
VC2000 Indicated Time: 3.17 sec
VC2000 Indicated Speed: 33.9 mph
VC2000 Indicated Average G:
.485 • Test Two
Vehicle Year 2000
Make Chevrolet
Model Impala
Type: Sedan
Color: Black
Vehicle Identification Number (VIN): 2G1WF55K1Y9256027
Radar Indicated Speed: 36 mph
VC2000 Indicated Time: 3.26 sec
VC2000 Indicated Speed: 36.4 mph
VC2000 Indicated Average G:
.509 • Test Three
Vehicle Year 2000
Make Chevrolet
Model Blazer
Type: SUV
Color: Red
Vehicle Identification Number (VIN): 1GNDT13W3Y2356464
Radar Indicated Speed: 31 mph
VC2000 Indicated Time: 4.09 sec
VC2000 Indicated Speed: 32.1 mph
VC2000 Indicated Average G: .357
• Test Four
Vehicle Year 2000
Make Chevrolet
Model Blazer
Type: SUV
Color: Red
Vehicle Identification Number (VIN): 1GNDT13W3Y2356464
Radar Indicated Speed: 31 mph
VC2000 Indicated Time: 3.07 sec
VC2000 Indicated Speed: 30.9 mph
VC2000 Indicated Average G: .457
• Discussion For this series of tests, the Chevrolet Impala and Blazer were steered off of the paved portion of the roadway and into a shallow ditch prior to the hard brake application. There was some difficulty in terms of the VC2000 activating prematurely in the Impala due to the test vehicle entering the ditch and traveling over the surface irregularities (bumps) therein. These unsuccessful runs were immediately terminated without data being recorded. The above test results show a drag factor range of .357 g’s on the low end to .509 on the high end. The average of these deceleration factors is calculated to be .452 g’s.

20
APPENDIX
List of Validation Testing Participants

21
TESTING PARTICIPANTS
Wisconsin State Patrol Academy November 2, 2001
PARTICIPANT NAME AGENCY TESTING ROLE Allison, Michael J. Wisconsin State Patrol District 5 Observer
Andraschko, Mark J. Wisconsin State Patrol District 3 Digital Video Camera Operator Asp, Arden A. Wisconsin State Patrol District 5 Observer Austin, Timothy P. Wisconsin State Patrol District 3 VC2000/Radar Operator Berg, Timothy J. Wisconsin State Patrol District 3 Digital Camera Operator Derse, Thomas S. Wisconsin State Patrol District 4 Observer DeStefano, Anthony I. Wisconsin State Patrol District 7 Observer Erdmann, Thomas W. Wisconsin State Patrol District 2 Observer Erickson, Brian D. Wisconsin State Patrol District 6 Observer Fish, David R. Wisconsin State Patrol District 6 Observer Floyd, Lorie J. Wisconsin State Patrol District 5 Observer Fowles, David A. Wisconsin State Patrol District 3 Observer Hanson, Derrek R. Wisconsin State Patrol District 7 Observer Jacobsen, Mark E. Wisconsin State Patrol District 5 Observer Jarvela, Scott A. Wisconsin State Patrol District 2 Observer Jensen, Aaron M. Wisconsin State Patrol District 6 Observer Johnson, Eugene L. Wisconsin State Patrol District 2 Observer Kinlen, Bruce P. Wisconsin State Patrol District 6 Observer Kittelson, Marvin J. Wisconsin State Patrol District 6 Observer Krueger, Steven G. Wisconsin State Patrol District 4 Observer Llanas, Alan J. Wisconsin State Patrol District 2 VC2000 Operator Lonsdorf, Daniel W. Wisconsin State Patrol Hqtrs Black Impala/CDR Operator Marquardt, Michael J Wisconsin State Patrol District 1 Observer McConnell, Dennis M. Wisconsin State Patrol District 4 Observer McCormack, Timothy M. Wisconsin State Patrol District 2 Observer Messa, Martin P. Wisconsin State Patrol District 7 Observer Meyers, Duane R. Wisconsin State Patrol District 3 CDR Operator Parrott, Thomas W. Wisconsin State Patrol District 1 Observer Prouty, Steven L. Wisconsin State Patrol District 2 Observer Rahmer, Thomas J. Wisconsin State Patrol District 4 Observer Reidel, George T. Wisconsin State Patrol District 5 Observer Schilling, Paul R. Wisconsin State Patrol District 7 Observer Smith, Michael D. Wisconsin State Patrol District 2 Observer Sparling, Larry L. Wisconsin State Patrol District 4 Observer Staffen, Theodore D. Wisconsin State Patrol District 1 Red Impala Operator Steele, Daniel P. Wisconsin State Patrol District 5 Observer VerGowe, Jeremy J. Wisconsin State Patrol District 3 Observer
22
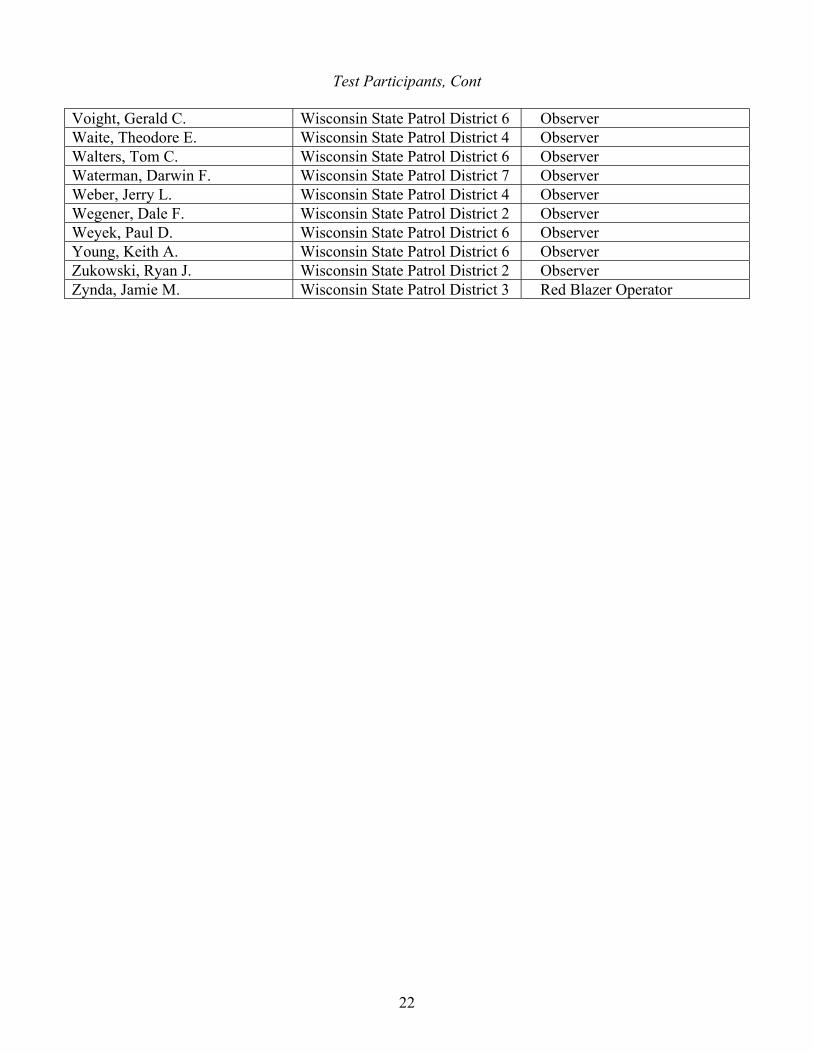
Test Participants, Cont
Voight, Gerald C. Wisconsin State Patrol District 6 Observer Waite, Theodore E. Wisconsin State Patrol District 4 Observer Walters, Tom C. Wisconsin State Patrol District 6 Observer Waterman, Darwin F. Wisconsin State Patrol District 7 Observer Weber, Jerry L. Wisconsin State Patrol District 4 Observer Wegener, Dale F. Wisconsin State Patrol District 2 Observer Weyek, Paul D. Wisconsin State Patrol District 6 Observer Young, Keith A. Wisconsin State Patrol District 6 Observer Zukowski, Ryan J. Wisconsin State Patrol District 2 Observer Zynda, Jamie M. Wisconsin State Patrol District 3 Red Blazer Operator