Crash Analysis - Center for Transportation Research and ... · PDF fileCrash Analysis 5.1...
23
Transcript of Crash Analysis - Center for Transportation Research and ... · PDF fileCrash Analysis 5.1...

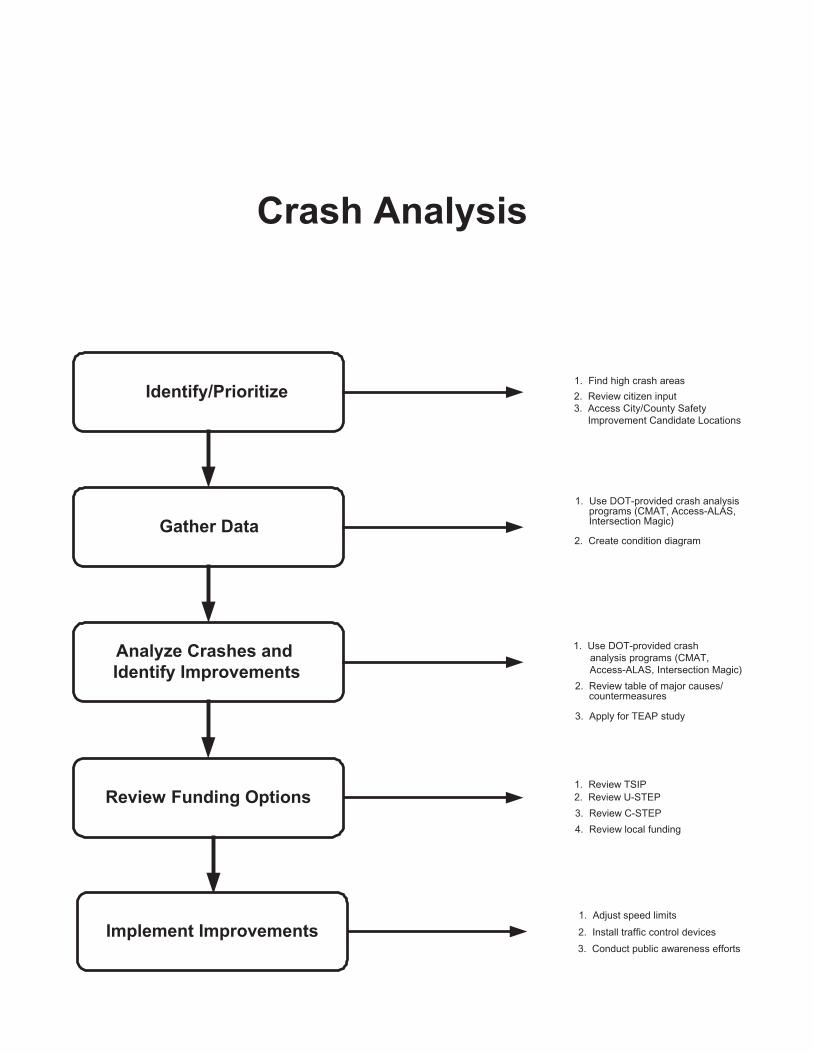
Identify/Prioritize
Analyze Crashes and
Identify Improvements
Gather Data
Review Funding Options
Crash Analysis
1. Review TSIP
2. Review U-STEP
3. Review C-STEP
1. Use DOT-provided crash
analysis programs (CMAT,
Access-ALAS, Intersection Magic)
2. Review table of major causes/ countermeasures
3. Apply for TEAP study
1. Use DOT-provided crash analysis programs (CMAT, Access-ALAS, Intersection Magic)
2. Create condition diagram
1. Find high crash areas
2. Review citizen input
3. Access City/County Safety
Improvement Candidate Locations
Implement Improvements
4. Review local funding
1. Adjust speed limits
2. Install traffic control devices
3. Conduct public awareness efforts

Crash Analysis 5.1
INTRODUCTIONINTRODUCTION
Crashes are rare events. A typical intersection experiences less than one crash per million vehicles that
navigate the intersection. Crashes occur because of various factors including the driver, vehicle, roadway,
and environment. The primary source of crash data is the local law enforcement agencies. Local law
enforcement agencies are usually an excellent source for current conditions at a particular crash location.
Crash data are used to help understand why crashes occur, to help identify high-crash locations, to aid in
the choice of safety programs or countermeasures, and to assist evaluations of countermeasure
effectiveness (Robertson 1994). The main purpose of crash analysis is to improve safety by identifying
crash patterns, mitigating crash severity, and reducing the number of crashes by adopting suitable
countermeasures.
KEY STEPS TO A CRASHKEY STEPS TO A CRASH ANALYSIS STUDY ANALYSIS STUDY
A crash analysis study includes six key steps:
1. Identify the locations that are candidates for improvement. 2. Quantify the main crash trend(s) at a particular location. 3. Determine the source of the problem(s). 4. Evaluate types of improvements to address the crash problem(s). 5. Obtain an expert opinion about safety improvement(s). 6. Obtain funding to implement a safety improvement.
Ident i fy the Locat ions That Are Candidates for ImprovementIdent i fy the Locat ions That Are Candidates for Improvement
The Iowa Department of Transportation (Iowa DOT) Office of Traffic and Safety has developed a
website to assistant jurisdictions in identifying locations within their jurisdiction that are candidates for
safety improvement. Please refer to www.dot.state.ia.us/crashanalysis/.
The first place to navigate on the website is the City or County (as appropriate) Safety Improvement
Candidate Locations (SICL) link. See Figure 5.1. An individual can select their jurisdiction from a list of all
cities or counties in Iowa having a candidate location. Once a city or county is selected, the intersections,
links and nodes with the highest ranking of crashes, crash rates, and crash severity for that jurisdiction are
listed.

5.2 Crash Analysis
Figure 5.1. Iowa DOT SICL Link Listings
The same website also provides a list of the top 200 Safety Improvement Candidate Locations (SICL)
within Iowa as shown above. This link provides the same information as listed above but for the top 200
intersections of concern within the state.
Quant i fy the Main Safety Concern(s) at a Part icular Locat ionQuant i fy the Main Safety Concern(s) at a Part icular Locat ion
The main safety problem(s) at a given location can be quantified a few ways:
• Refer to the Iowa DOT’s lists of safety improvement candidate locations. • Obtain and use crash data and analysis programs from the Iowa DOT. • Consult the Iowa Traffic Safety Data Service. • Calculate the crash rate for an intersection.
Refer to the Iowa DOT’s Lists of Safety Improvement Candidate Locations
The Iowa DOT Office of Traffic and Safety’s City or County (as appropriate) Safety Improvement
Candidate Locations (SICL) listings (www.dot.state.ia.us/crashanalysis/) provide each location’s
statewide rank and crashes by year for a five-year period. Locations that do not meet minimum criteria
are not included in the listings. The minimum criteria are at least one fatal crash, four injury crashes, or
eight total crashes in the most recent five-year analysis period. The locations are ranked according to a
composite of the number of crashes, the severity of the crashes, and the crash rate per traffic volume.
SICL listing also provides a breakdown of crashes at each location by crash severity and injury severity.
Crash Analysis 5.3
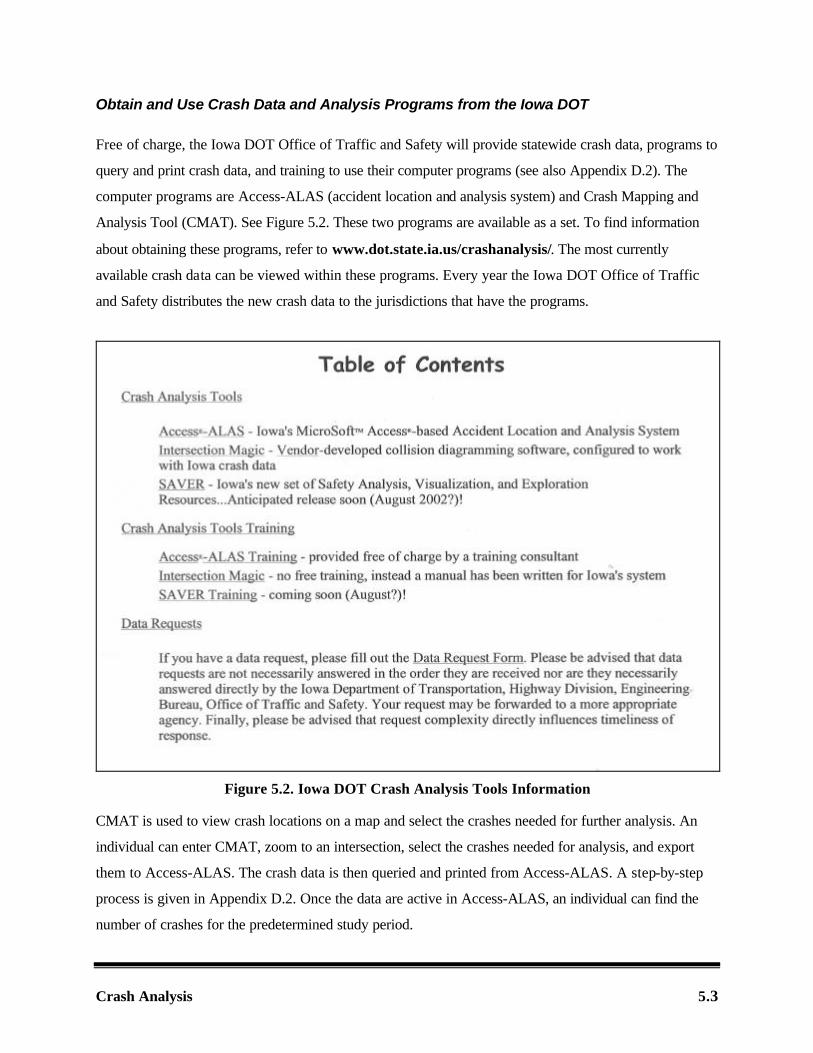
Obtain and Use Crash Data and Analysis Programs from the Iowa DOT
Free of charge, the Iowa DOT Office of Traffic and Safety will provide statewide crash data, programs to
query and print crash data, and training to use their computer programs (see also Appendix D.2). The
computer programs are Access-ALAS (accident location and analysis system) and Crash Mapping and
Analysis Tool (CMAT). See Figure 5.2. These two programs are available as a set. To find information
about obtaining these programs, refer to www.dot.state.ia.us/crashanalysis/. The most currently
available crash data can be viewed within these programs. Every year the Iowa DOT Office of Traffic
and Safety distributes the new crash data to the jurisdictions that have the programs.
Figure 5.2. Iowa DOT Crash Analysis Tools Information
CMAT is used to view crash locations on a map and select the crashes needed for further analysis. An
individual can enter CMAT, zoom to an intersection, select the crashes needed for analysis, and export
them to Access-ALAS. The crash data is then queried and printed from Access-ALAS. A step-by-step
process is given in Appendix D.2. Once the data are active in Access-ALAS, an individual can find the
number of crashes for the predetermined study period.

5.4 Crash Analysis
Consult the Iowa Traffic Safety Data Service
The Center for Transportation Research and Education (CTRE) also offers a service to jurisdictions called
the Iowa Traffic Safety Data Service (ITSDS). ITSDS provides timely access to crash analyses and
reports from many safety and geographic information systems tools developed by the Iowa DOT and
CTRE in recent years. ITSDS facilitates decision-making, effective presentation of information, and
education. The ITSDS is not available to all requestors and is not meant to relieve all traffic data users
from performing their own analyses. Rather, it fills the large gap between what data users can get for
themselves and what can be obtained by experts with the best software and hardware. An example of
crash mapping produced by ITSDS is shown in Figure 5.3. For more information, visit the ITSDS website
at www.ctre.iastate.edu/itsds/.
Figure 5.3. Example Crash Mapping Produced by ITSDS
Calculate the Crash Rate for an Intersection
Finally, a jurisdiction can calculate the crash rate for an intersection and compare the rate to statewide
averages as shown in Table 5.1 (Iowa DOT 1989).

Crash Analysis 5.5
Table 5.1. Iowa Statewide Average Crash Rates by Daily Entering Volume
Rural Municipal
1–999 DEV
1,000–2,499 DEV
2,500–4,999 DEV
5,000–9,999 DEV
10,000+ DEV
1–2,499 DEV
2,500–4,999 DEV
5,000–9,999 DEV
10,000–24,999 DEV
25,000+ DEV
Average crash rate per million entering vehicles 2.1 1.2 0.9 0.7 0.7 1.3 1.0 0.7 0.8 1.0
Note: DEV = daily entering volume. To calculate the crash rate for an intersection, the following data are needed: the number of crashes at the
intersection for the time period of the study (found using the computer programs as described above), the
number of years in the study, and the annual average daily traffic (AADT) for each leg of the intersection.
To develop a crash trend, it is recommended to collect three to five years of crash data.
To obtain the AADT for your intersection, you may have to perform a traffic volume count study as
described in Chapter 3 of this handbook. The AADT is sum of the two-way traffic counts for all the
intersection’s legs, factored to account for the day of the week and the month of the year. In order to
calculate the AADT for an intersection, a jurisdiction may conduct pneumatic road tube counts for all legs
or 8 hours of intersection volume counts. These counts are typically conducted between 7:00 a.m. and
11:00 a.m. and between 2:00 p.m. to 6:00 p.m. Once a jurisdiction has obtained these volumes, they may
contact the Iowa DOT Office of Transportation Data for assistance in using factors to calculate AADT.
The Iowa DOT provides the AADT for some legs of intersections at www.mmsp.dot.state.ia.us/
trans_data/traffic/aadtpdf.html. A jurisdiction can enter this website, click on their city or county and an
AADT map will appear. It is on this map that a jurisdiction may find the AADTs that are needed to
calculate the crash rate.
When using AADT to calculate crash rates, use the following equation (Iowa DOT 1989):
365**AADTs
000,000,1**2
YC
Ri∑
= , (5.1)
where Ri = crash rate per million entering vehicles, C = number of crashes, and Y = number of years
analyzed. For example, at the intersection of 4th Street and Main Street, a total of fifteen crashes occurred
in five years. The two-way AADTs for the legs of the intersection were 4,000, 4,000, 1,000, and 1,000.

5.6 Crash Analysis
The sum of these AADTs equals 10,000 vehicles. The crash rate per million entering vehicles is as
follows:
days 365*years 5* vehicles000,10
000,000,1*crashes 15*2=Ri = 1.64 crashes per million entering vehicles.
The calculation shows that there were 1.64 crashes for every million vehicles that entered the intersection
of 4th Street and Main Street during the given five year period. The statewide average crash rate for this
type of intersection is 0.8 crashes per million entering vehicles. That indicates the crash rate at this
intersection is approximately twice as high as the statewide average and the intersection should be
considered for further analysis. A crash may be higher than the state average but not significantly
different.
Determine the Source of the Problem(s)Determine the Source of the Problem(s)
The source of the problem may be identified in different ways, including using Access-ALAS and
Intersection Magic software programs and completing a crash analysis observation report.
Access-ALAS provides a major crash cause summary, a day/time and accident rate summary, a surface
and light condition summary, and details for all crashes. See Appendix D.2 or go to
www.dot.state.ia.us/crashanalysis/ for more information.
Also, free of charge, the Iowa DOT will provide another program—Intersection Magic—for crash
analysis purposes. To find detailed information about obtaining this program, go to
www.dot.state.ia.us/crashanalysis/. Intersection Magic is a Microsoft Windows based PC application for
crash analysis. Intersection Magic is a node-based application that generates collision diagrams. Starting in
the year 2000, crash data were recorded by real coordinates. Because of this, at this point in time,
Intersection Magic cannot analyze data more current than 1999. Intersection Magic requires intersection
node numbers locate crashes. The intersection node numbers may be obtained within the CMAT program.
Use the crash data selection process described in Appendix D.3 to select the node numbers and then use
Intersection Magic to create a collision diagram. See Figure 5.10.

Crash Analysis 5.7
A jurisdiction may also fill out a crash analysis field observation report (a form is provided in Appendix
D.1; FHWA 1991). The report includes a checklist relating to physical and operational characteristics. A
jurisdiction may wish to fill out the observation form and then compare the results to those from the crash
analysis programs. This may highlight consistencies between the conditions of the particular location and
the type of major causes of the crashes.
Evaluate Types of Improvements to Address the Crash Evaluate Types of Improvements to Address the Crash Problem(s)Problem(s)
Once a safety concern is identified, a jurisdiction can begin to evaluate possible countermeasures. Table
5.2 provides a list of possible countermeasures for safety concerns relating to pedestrians, speed, and sight
distance (Ogden 1996, SEMCOG 1998, NCHRP 2000). Additional information is provided in Appendix
D.4 (FHWA 1991).

5.8 Crash Analysis
Table 5.2. Major Safety Concern Causes and Countermeasures Major Cause Possible Countermeasures
Ran traffic signal
Remove signal sight obstructions Post “Signal Ahead” warning signs Install/replace signal visors and back plates Add signal back plates Install advance flasher signs Install (additional) 12-inch signal lenses Upgrade signalization Review warrants/consider removing signal Synchronize adjacent signals
Ran stop sign
Remove sign sight obstructions Install larger signs Install “Stop”/“Yield Ahead” signs Construct rumble strips in pavement Review warrants/consider removing sign Replace “Stop” with “Yield” sign, if feasible Place flashing beacons overhead or on “Stop” sign Place red flags on “Stop” sign Place “Stop” signs on both sides of road
Failed to yield right-of-way to pedestrian
Add stop bars/crosswalks Post “Ped Xing”/“Advance Xing” signs Place advance pavement messages Add/improve lighting Post “School Xing”/“Advance Xing” signs Use crossing guards near schools Reroute pedestrians to safer crossing Signalize pedestrian crossing Install barrier curbing Add pedestrian refuge islands Post “No Right Turn on Red” sign, if at intersection
Exceeded speed limit
Post/reduce speed limit Increase traffic/speed enforcement Install traffic-calming measures: refer to www.ite.org Install larger signs Install flashing beacons on signs
Turned improperly
Prohibit turns Signalize intersection Reduce speed limit Install raised median Install left turn bays Widen approaches to handle turn lanes Improve signing and pavement markings
Vision was obscured
Eliminate parking Remove obstructions from sight triangles Close/relocate driveways near intersections Signalize intersection Install intersection warning signs
Obtain an Expert Opin ion about Safety ImprovementsObtain an Expert Opin ion about Safety Improvements
Jurisdictions in Iowa may receive an expert opinion about a safety improvement by applying for a Traffic
Engineering Assistance Program (TEAP) study through the Iowa DOT. The intent of this program is to

Crash Analysis 5.9
offer traffic engineering assistance to local governments for improvements in traffic safety and operations
including high crash locations, confusing intersections, school pedestrian routes, railroad crossings, and
truck routes.
Obtain ing Funding to Implement a Safety ImprovementObtain ing Funding to Implement a Safety Improvement
The Iowa DOT offers three funding programs to assist jurisdictions with safety improvements. The
programs are the Traffic Safety Improvement Program (TSIP), the Urban-State Traffic Engineering
Program (U-STEP), and the County-State Traffic Engineering Program (C-STEP). These programs are
described below. Additional detailed information about the current status of the funding can be found in the
Iowa DOT Funding Guide at www.dot.state.ia.us/fundguid.htm.
Traffic Safety Improvement Program
The intent of the TSIP program is to offer funding for traffic safety improvements or studies on public
roads under county, city, or state jurisdiction. Funding per project cannot exceed $500,000. TSIP provides
Traffic Safety Funds (TSF) on an annual basis to projects with the greatest safety benefit/project cost
ratio.
Urban-State Traffic Engineering Program
The intent of the U-STEP program is to offer construction funding to solve traffic operation and safety
problems on primary roads in Iowa cities. Funding per project cannot exceed $200,000 for spot
improvements and $400,000 for linear improvements. Linear improvements are those that span for two or
more intersections. The city must engineer and administer the project, and the project costs are split, 45%
city and 55% state.
County-State Traffic Engineering Program
The intent of the C-STEP program is to offer construction funding to solve traffic operation and safety
problems on primary roads outside incorporated cities. The county must engineer and administer the
project. Funding cannot exceed $200,000 for spot improvements (those limited to one location).
Construction costs are split, 45% county and 55% state. Funding breakdowns for linear improvements are
described in the Iowa DOT funding guide at www.dot.state.ia.us/fundguid.htm.
5.10 Crash Analysis
EXAMPLE CRASH ANALYSEXAMPLE CRASH ANALYSIS SIS STUDYTUDY
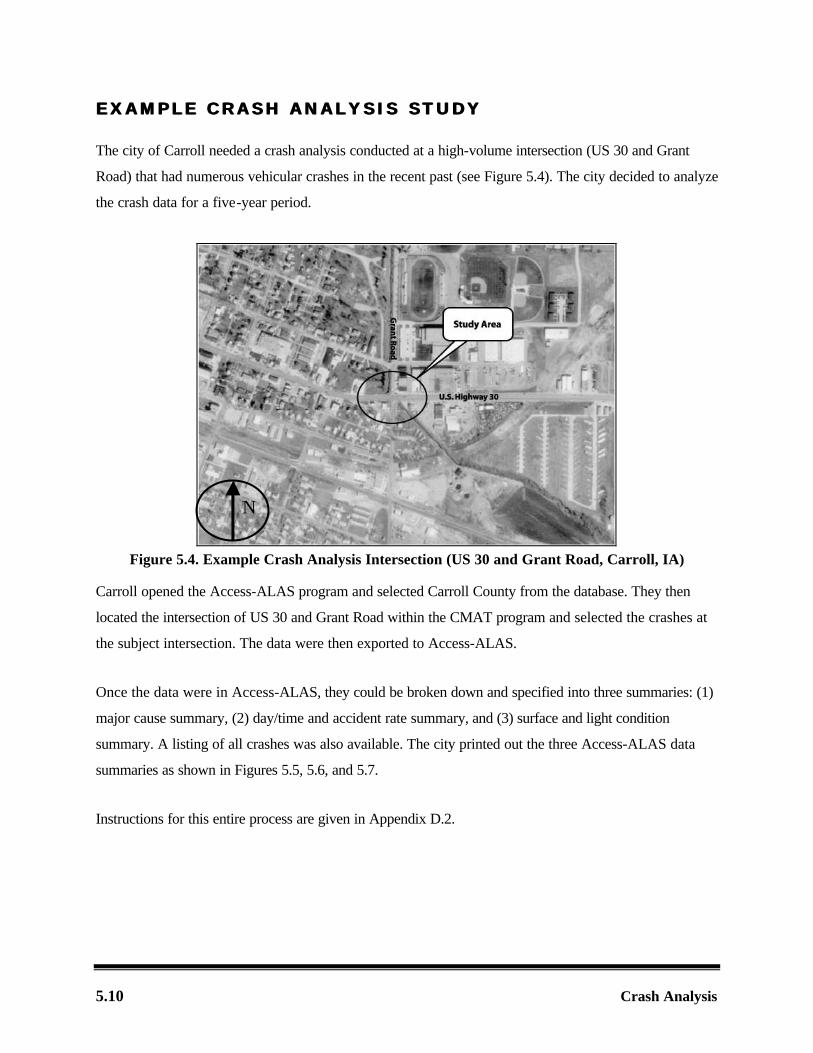
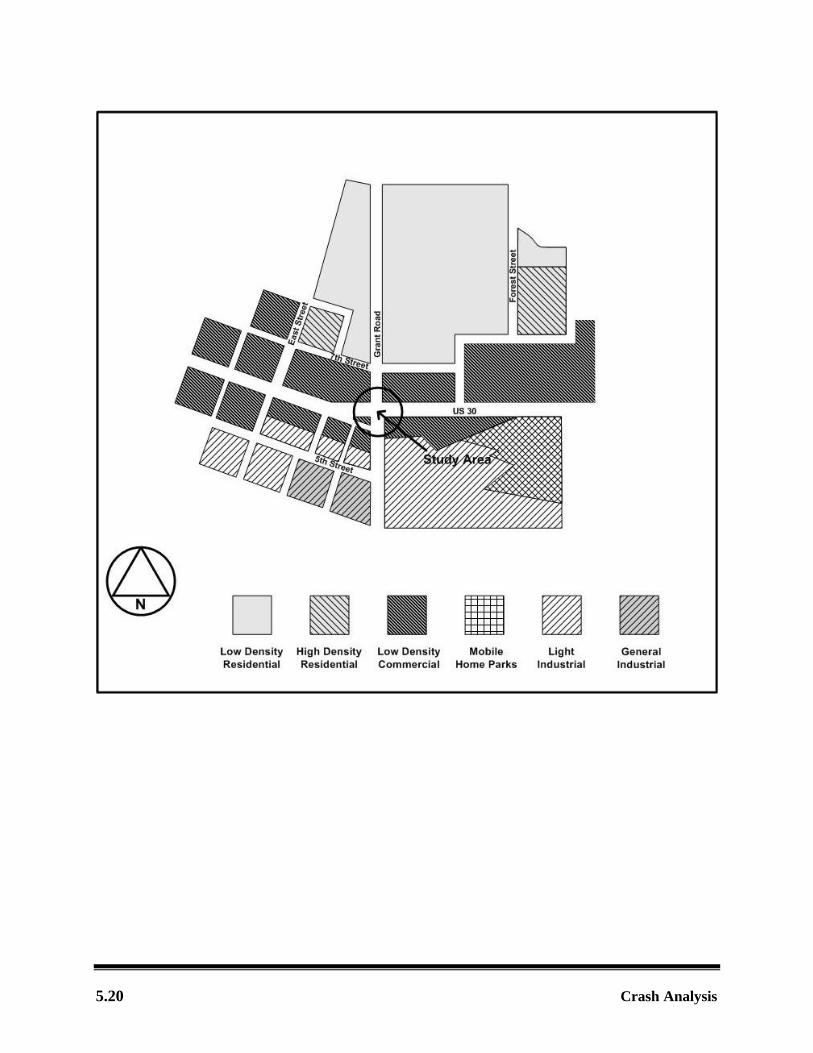
The city of Carroll needed a crash analysis conducted at a high-volume intersection (US 30 and Grant
Road) that had numerous vehicular crashes in the recent past (see Figure 5.4). The city decided to analyze
the crash data for a five-year period.
Figure 5.4. Example Crash Analysis Intersection (US 30 and Grant Road, Carroll, IA)
Carroll opened the Access-ALAS program and selected Carroll County from the database. They then
located the intersection of US 30 and Grant Road within the CMAT program and selected the crashes at
the subject intersection. The data were then exported to Access-ALAS.
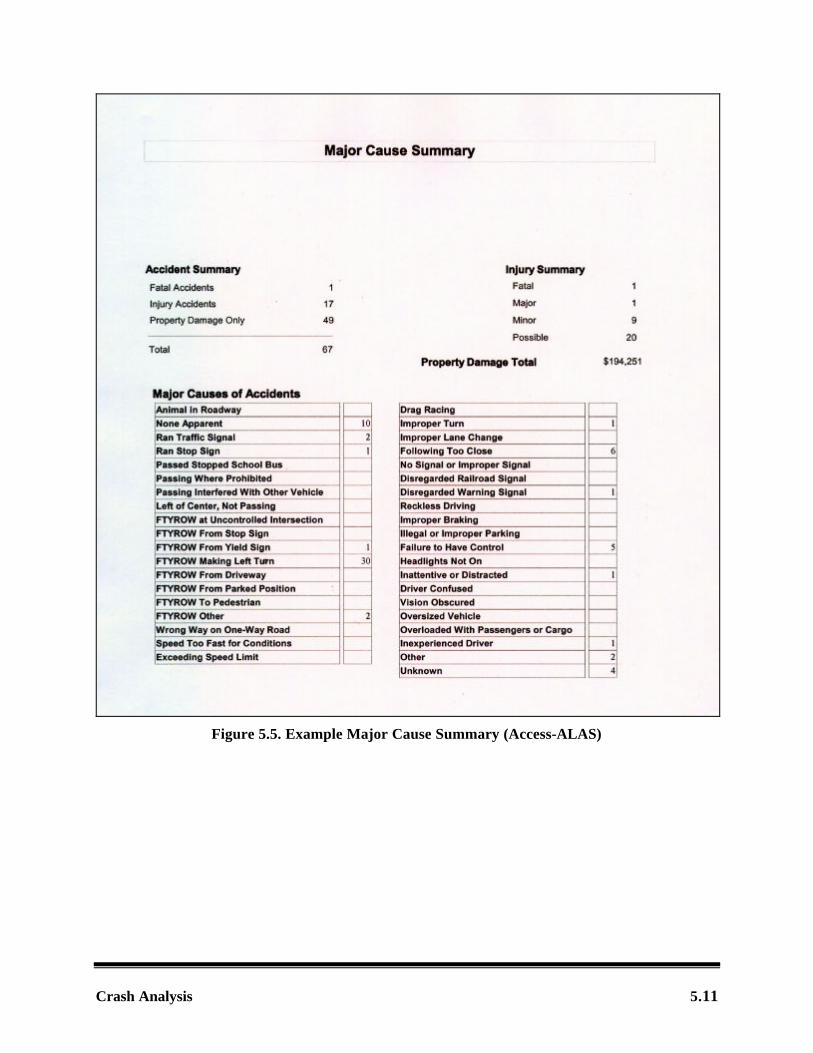
Once the data were in Access-ALAS, they could be broken down and specified into three summaries: (1)
major cause summary, (2) day/time and accident rate summary, and (3) surface and light condition
summary. A listing of all crashes was also available. The city printed out the three Access-ALAS data
summaries as shown in Figures 5.5, 5.6, and 5.7.
Instructions for this entire process are given in Appendix D.2.
N
Crash Analysis 5.11
Figure 5.5. Example Major Cause Summary (Access-ALAS)

5.12 Crash Analysis
Figure 5.6. Example Day/Time and Accident Rate Summary (Access-ALAS)
Crash Analysis 5.13
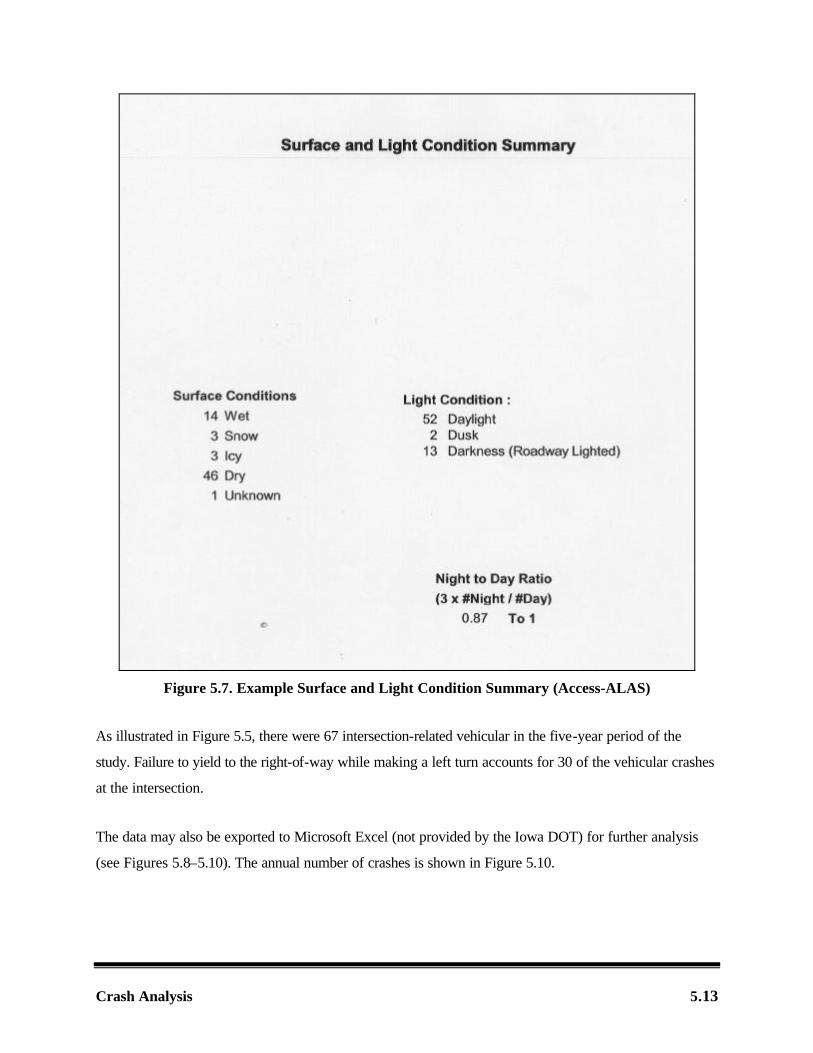
Figure 5.7. Example Surface and Light Condition Summary (Access-ALAS)
As illustrated in Figure 5.5, there were 67 intersection-related vehicular in the five-year period of the
study. Failure to yield to the right-of-way while making a left turn accounts for 30 of the vehicular crashes
at the intersection.
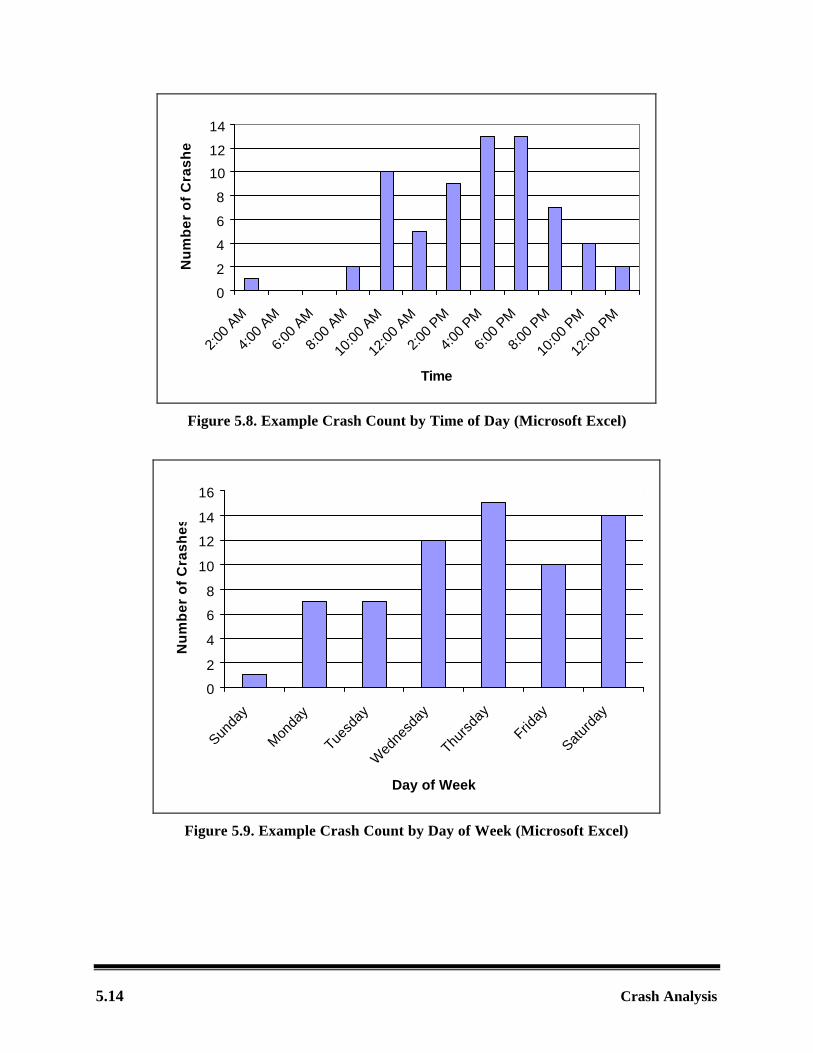
The data may also be exported to Microsoft Excel (not provided by the Iowa DOT) for further analysis
(see Figures 5.8–5.10). The annual number of crashes is shown in Figure 5.10.
5.14 Crash Analysis
0
2
4
6
8
10
12
14
2:00
AM
4:00
AM
6:00
AM
8:00
AM
10:0
0 AM
12:0
0 AM
2:00
PM
4:00
PM
6:00
PM
8:00
PM
10:0
0 PM
12:0
0 PM
Time
Nu
mb
er
of
Cra
sh
es
Figure 5.8. Example Crash Count by Time of Day (Microsoft Excel)
0
2
4
6
8
10
12
14
16
Sunda
y
Mon
day
Tuesd
ay
Wed
nesd
ay
Thurs
day
Friday
Satur
day
Day of Week
Nu
mb
er
of
Cra
sh
es
Figure 5.9. Example Crash Count by Day of Week (Microsoft Excel)

Crash Analysis 5.15
0
2
4
6
8
10
12
14
16
18
1995 1996 1997 1998 1999
Year
Cra
sh
Co
un
t
Figure 5.10. Example Crash Count by Year (Microsoft Excel)
The Access-ALAS analysis shows that most crashes occurred in the daylight under dry conditions. The
major cause of crashes at the intersection of US 30 and Grant Road was failing to yield to the right-of-
way left turning. Half of the crashes occurred on the days of Wednesday, Thursday, and Friday between
4:00 p.m. and 6:00 p.m.
In order to better visualize the types of crashes within the intersection, the city needed a collision diagram.
Collision diagrams may be constructed within the program Intersection Magic. The node number for the
intersection is needed to run Intersection Magic. CMAT can be used to obtain the node number. The node
number is used in Intersection Magic to obtain a collision diagram of all crashes at the intersection of US
30 and Grant Road during the five-year time period. See Figure 5.11. Instructions for this process are
provided in Appendix D.3.
The intersection of US 30 and Grant Road was ranked 21st on the Iowa DOT’s list of statewide candidate
locations for safety improvements. At the time period of the study, the intersection has a leading left-turn
phase for eastbound to northbound traffic. From the Access-ALAS queries, left-turn crashes on the US
30 approaches may be identified as the predominate crash type. Vehicles making left turns from US 30
5.16 Crash Analysis
onto Grant Road may have limited sight distance. Some of the possible countermeasures to reduce these
types of crashes are as follows:
• Split-phase the signal operation for the US 30 movements. • Construct left-turn bays with or without raised medians. • Re-time the traffic signal.
Information on contracting for a crash analysis study, including a project work order using the city of Carroll example, is provided near the end of this chapter.

Crash Analysis 5.17
Figure 5.11. US 30 and Grant Road Collision Diagram (Carroll, IA) (Intersection Magic)
5.18 Crash Analysis
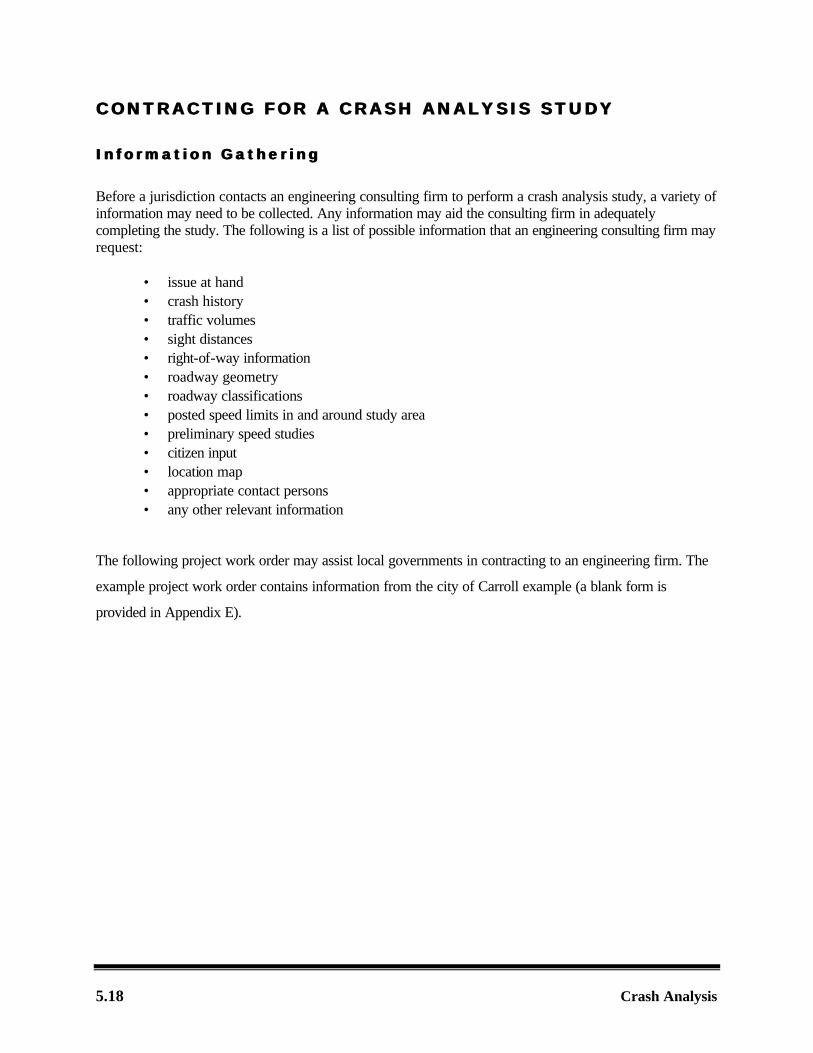
CONTRACTING FOR A CRCONTRACTING FOR A CRASH ANALYSIS STUDYASH ANALYSIS STUDY
In format ion Gather ingInformat ion Gather ing
Before a jurisdiction contacts an engineering consulting firm to perform a crash analysis study, a variety of information may need to be collected. Any information may aid the consulting firm in adequately completing the study. The following is a list of possible information that an engineering consulting firm may request:
• issue at hand • crash history • traffic volumes • sight distances • right-of-way information • roadway geometry • roadway classifications • posted speed limits in and around study area • preliminary speed studies • citizen input • location map • appropriate contact persons • any other relevant information
The following project work order may assist local governments in contracting to an engineering firm. The
example project work order contains information from the city of Carroll example (a blank form is
provided in Appendix E).

Crash Analysis 5.19
Project Work Order : Crash Analys is StudyProject Work Order : Crash Analys is Study
Referenced Agreement
This work order is part of an agreement between Smith Consulting and the city of Carroll for municipal engineering services.
Project Location Description
This work involves conducting a crash analysis study at the intersection of Highway US 30 and Grant Road. A map depicting the location is attached.
Obligation of the City/County
The city shall provide the following items to the consultant: historic traffic volumes, current traffic volumes, posted speed limits, available sight distances, crash history, roadway geometry, roadway classification, and a list of important contacts.
Scope of Consultant Services
This work includes gathering and analyzing crash data. Crash mitigation recommendations will also be required, if needed.
Schedule
Field meeting date: Estimated date of preliminary deliverable: Estimated date of final deliverable: Compensation
Labor cost $ Direct expenses $ Subcontractor cost $ Overhead $ Maximum payable $ Authorization
City of Carroll Smith Consulting City/County Contractor City/County Administrator Project Manager’s Name/Title Signature Signature Date Date
5.20 Crash Analysis
Crash Analysis 5.21
REFERENCESREFERENCES
NCHRP. 2000. Accident Mitigation Guide for Congested Rural Two-Lane Highways. National Cooperative Highway Research Program Report 440. Washington D.C.: Transportation Research Board, National Research Council.
FHWA. 1991. Highway Safety Engineering Studies. NHI Course No. 38031. Washington, D.C.: Federal Highway Administration, U.S. Department of Transportation, pp. 15–17, 61–72.
Iowa DOT. 1989. Accident and Related Data for Rural and Municipal Intersections in Iowa. Ames, Iowa: Iowa Department of Transportation. Iowa.
Iowa DOT. 2000. Hazard Elimination Safety (HES): US 30/Grant Road, Carroll, Iowa. Carroll, Iowa: BRW, Inc., pp. 3–24.
Ogden, K. W. 1996. Development of Countermeasures. In Safer Roads: A Guide to Road Safety Engineering. Aldershot, England: Avebury Technical, pp. 135–150.
Robertson, H. D. 1994. Traffic Accident Studies, In Manual of Transportation Engineering Studies, ed. H. D. Robertson, J. E. Hummer, and D. C. Nelson. Englewood Cliffs, N.J.: Prentice Hall, Inc., pp. 191–218.
SEMCOG. 1998. Traffic Safety Manual. Detroit: Southeast Michigan Council of Government.