Cramer’s Ten Commandments of Trading - TheStreet.com · Cramer’s Ten Commandments of Trading...
12
Transcript of Cramer’s Ten Commandments of Trading - TheStreet.com · Cramer’s Ten Commandments of Trading...


Cramer’s Ten Commandments of Trading
Number 1 Number 2 Number 3
Number 4 Number 5 Number 6
Logo Width=3˝ Logo Width=2˝
Logo Width=0.75˝ Logo Width=0.5˝
Logo Width=1.5˝
Logo Width=1˝
View Our Premium Services
1
Keep It a Trade
Commandment 1
Never turn a trade into an investment.
That’s the number-one commandment of trading, and yet, no matter how many times I say it, no matter how many times I scream it, people just don’t listen.
When I came up with the Ten Commandments of Trading, which I detail in Jim Cramer’s Real Money, I did so after ana-lyzing literally billions of dollars in losing trades. Remember, I am a lab — no, I am the lab, because of the millions of trades I have made in the last 25 years and my insanely rigorous method of analyzing any bad trade north of $5,000.
The sheer magnitude of the sample alone made it worth my while. My tremendous masochistic streak made it doubly worth my while. I would analyze positive trades only when they generated $20,000 in profit, but anything that generated more than $5,000 in losses got the microscope, big time.
The commonality of many of those losses? They started out as trades, a stock bought for a specific event, a specific catalyst, and I turned them into investments, because I failed to wipe the trade off the books the moment it got busted. The bigger the loss, the more I rationalized. I would buy the equivalent of a Research In Motion for the era in advance of the quarter. The results would come out, and I would say, “You know, I am really in it not for the results but for the new Blackberry itera-tion, so let’s buy more.” I would dig in my heels. I was more likely digging my grave.
Or, I might say, “This time Alcoa’s got to get it right. I would put some on.” Then the quarter would come out and it would be a stinker, but on the conference call management would say how things were looking up in aerospace. Suddenly, it would be an aerospace play! Buy more!
How do you decide not to go down this path? By declaring right up front that the position is a trade and noting exactly why you are buying the stock and when the catalyst is go-
ing to occur. The stock comes off no matter what after that catalyst.
This is a brutal rule. It is so easily disobeyed that we seem to do so instinctively. But if you are like me and you sit there and are obsessed with the losses, you just don’t have time to keep disobeying this rule. It’s just too darned damaging to your psyche in the long-term.
Start the process today. You buying the Yahoo! for the quar-ter? After that quarter is reported, you skedaddle, no matter what.
Promise?
Random musings: If you like these commandments, my book is full of them. All equally brutal. All taking advantage of my myriad mistakes. Why let them happen to you?
At the time of publication, Cramer was long Yahoo!.
First Loss is Best
Commandment 2
Good trading, no matter what it’s based on, technicals, fun-damentals, the stars, the news, requires a level of discipline that goes against human nature. We are taught in life to be patient, to let things work out, not to be hasty, yet none of that works when it comes to trading. You have to be willing to cut and run, to use that “flight,” not fight, instinct that we suppos-edly are born with but suppress wholeheartedly when we are grown up.
That’s what the second commandment of trading is about, and that’s why it is the second commandment of trading:
Your first loss is your best loss.
I genuinely believe that most trades need to work almost im-mediately for them to be right. I am willing to put a trade on and take it off immediately even if it doesn’t feel right. There’s a simple reason why that is so. When I trade, I try to trade for

Cramer’s Ten Commandments of Trading
Number 1 Number 2 Number 3
Number 4 Number 5 Number 6
Logo Width=3˝ Logo Width=2˝
Logo Width=0.75˝ Logo Width=0.5˝
Logo Width=1.5˝
Logo Width=1˝
View Our Premium Services
2
points, or for at least a point. Less than that is too hard.
But if I am willing to have a trade go more than a half of a point against me, then it will be almost monumental to get back to even. So I like to stop myself out quickly.(Notice how different this all is from investing, where I expect the stock to go “against” me and welcome it so I can improve my basis.)
So, let’s say that I bought Starbucks Wednesday because I figured the comp numbers would have improved. You have to believe that wherever that stock trades after that number comes out and you have digested it, you are at risk to having a very big loss.
So, you take that first loss. And you move on.
Rather than fight it.
That’s how you have to think, every day, about every trade.
Take Your Losses
Commandment 3
It’s OK to take a loss when you already have one.
So many investors who call me on my radio or television shows have big losses on stocks. They stay in, though, be-cause they genuinely believe that they don’t have a loss until they take it.
That, of course, is ridiculous. It’s another flaw of human nature, another flaw that hurts long-term performance.
If we played with unlimited capital, it wouldn’t matter that we’re hanging on to Applied Materials because it once traded at $30. We could keep our positions in Nortel and JDS Uni-phase because, what the heck, they aren’t that much capital.
But the investing process takes time, inclination and capital that most people don’t have. You can’t find the next Sears Holdings if you are stuck in EMC waiting for it to come back.
You can’t do the homework needed to learn Ultra Petroleum if you are keeping up with the Verizon and BellSouth spending plans that could revitalize or trash JDS Uniphase.
That’s why I always tell people that it’s OK to take the loss, especially if you already have it. The opportunity cost of stay-ing with losers is always either misunderstood or chronically underestimated by investors.
Go through your portfolio. Kick out that AMR that’s been hanging there all these years because you bought it much higher. Sell the Delta you picked up at $11 because you thought the asset too valuable to sell.
And start learning new stories. That’s the way to make bigger money than you are now. Trading Gains, Not Investment Losses
Commandment 4
When you mark something as a trade, you should not expect to make as much money on it as you would as an investment. A trade, like buying something into a quarter, is not about try-ing to make money over a long period of time.
Let’s take Apple Computer. I think that Apple’s a good trade into the quarter on Wednesday. I genuinely believe there is enough good news there that this $42 stock can ramp to $45.
But if there isn’t?
I would be gone either way. I am not going to buy the stock for the quarter and then, if it doesn’t work out, switch it into the investment file because I like the Tiger operating system’s prospects for next quarter, or because the iPod Shuffle’s a really cool gizmo.
And, most important, if it works and the stock goes up the next day, I am not going to say “You know what, this Apple’s one good long-term story. I am going to stick it out.”

Cramer’s Ten Commandments of Trading
Number 1 Number 2 Number 3
Number 4 Number 5 Number 6
Logo Width=3˝ Logo Width=2˝
Logo Width=0.75˝ Logo Width=0.5˝
Logo Width=1.5˝
Logo Width=1˝
View Our Premium Services
3
I can’t do that, because I had earmarked Apple for a trade be-fore I started it. I can’t tell you how many times I have bought something for a trade, had it go up and then held on to it only to lose the trading gain and come up with an investment loss. Hence my commandment:
Never turn a trading gain into an investment loss.
This year, in particular, I am talking to a lot of people who bought stocks for a trade and then ended up carrying them as a loss into the investment column. I recently spoke to one investor who had bought Valero for a trade on gasoline prices, quickly picked up 7 points, and then rode it all the way back to where he bought it because he decided he “liked” Valero.
What does that mean?
You don’t like Valero; you like the profit Valero generated. Never confuse the two.
Or you most certainly will give back the profit.
Tips Are for Waiters
Commandment 5
It’s pithy and the interviewers love it, so whenever I’m asked about my new book, Jim Cramer’s Real Money, the fifth of my Ten Commandments of Trading comes up:
Tips are for waiters.
“What does it mean, Jim?” they ask. Actually, it means that human nature and securities are a potent and devastat-ing mix. People can whisper in your ear that Nokia is going to buy Research In Motion, and you believe, you genuinely believe, because you want the big score. You know that the best moves are takeovers and you are convinced that if you can catch one, it will make up for all the bum steers and bad bets you have made. Tips are winning lottery tickets in most people’s eyes.
That’s the reason I’ve had to default to a simple analogy, tips
are for waiters, to remind myself how stupid tips really are. Does it occur to you, on hearing the tip, that if the person telling you that Nokia is going to buy RIM really knows that’s going to happen, the person is an insider and is breaking the law, and you could get in trouble, too? Does it occur to you that if the person isn’t an insider, he doesn’t know? There sim-ply is no way a tip like that can work. Leave it for the waiter.
It gets more sinister. Most rumors start for a reason: Some-one’s in a bad position. Instead of thinking, “Sure, Cisco is going to buy Nortel,” after you are given that particular tip, you should be thinking “Man, is this guy wearing a ton of Nortel and what won’t he do to get rid of it.”
I know that cynicism isn’t a particularly positive attribute, but when it comes to tips, it sure is. Leave them for the waiter. Do Your Stock Homework
Commandment 6
The game’s tough right now. So tough that you have to be thinking, “It’s just not worth it. When 50,000 people close ac-counts at Ameritrade in a quarter, you have to know that you aren’t suffering your misery all by your lonesome.
It’s always that way when you are rooting for bad news. It’s always that way when you are playing defense.
This is one of those moments when people are looking at some rather huge gains in sectors that may be giving way and they don’t want to ring the register.
All of you in that situation, I want you to remember one of my most important Trading Commandments:You don’t have a profit until you sell.
The way this market looks right now, if you have a big gain in one of these heavy cyclical stocks, you need to think about whether that gain is going to get wiped out or not.
Let’s take Phelps Dodge. I genuinely feel that those who bought Phelps Dodge in the $60s and $70s believe that they
Cramer’s Ten Commandments of Trading
Number 1 Number 2 Number 3
Number 4 Number 5 Number 6
Logo Width=3˝ Logo Width=2˝
Logo Width=0.75˝ Logo Width=0.5˝
Logo Width=1.5˝
Logo Width=1˝
View Our Premium Services
4
are so far away from where they bought the stock that they have the gain. You do not have the gain until you take it. And some needs to be taken.
If we truly are in rotational hell — which I think we are, by the way — you have got to take some of the cyclical winnings off the table, you just have to. Right now, right here.
Stop thinking that you have it in the bank. Instead, put it in the bank. And accept the fact that the offense has made about all it can here and you have to be defensive to play the next move correctly.
Control Your Losses
Commandment 7
Losses do you in. They always do you in. Controlling losses is the most important thing you can do. I don’t really care how you do it. If it is to put on stops in trading, then so be it. If it is to decide that you are never going to let a position run a point against you, then fine. But you must heed the seventh of my 10 Commandments of Trading:
Control losses; winners take care of themselves.
Let’s say you bought Apple for a trade. As soon as that num-ber comes out, that’s the trade, for better or for worse. If you own it the next day, you are making an investment, and you didn’t buy it for an investment. The loss must be taken.
It’s the same if you buy IBM today because you think it is down too much. You have to stop yourself out at $79, or else that, too, becomes an investment, and an investment by de-fault is a very vulnerable place.
What’s amazing about loss control is that it works in every season. Loss control would have saved you a fortune back in 2000. Loss control would have gotten you out of pharma much higher, only to get in now, when pharma’s finally right.The only time loss control doesn’t work is when you are pick-ing a position as an investment to start. Then you are rooting for the market and the stock to go down, so you can buy it
right.
Loss control there means that you don’t buy too much at one level so that you don’t find yourself under water big and then helpless as the stock rallies because you didn’t buy any stock at lower levels to trade around with.
When I review portfolios, I constantly see those that are rocked by one position. In other words, someone let one bad position go against them and go against them and go against them some more. That’s because the person didn’t recognize that you must be an activist about your losses; you must rec-ognize them, remove them, contain them.
If you do, you will be shocked at how often the good positions will make you fortunes that don’t get taken away.
Don’t Fear That You’ll Miss Anything
Commandment 8
We always fear that we will miss the next move. We fear that unless we act now, something is going to happen that is going to injure our finances permanently if we don’t make a trade.
Those fears are wrong, and they’re the reason for my eighth commandment of trading:
Don’t fear missing anything.
Sure, there are moments where the train genuinely feels like it is leaving the station without you. But you know what? I have been trading for 25 years, and believe me, there is always a train behind that last one.
Two weeks ago, for example, it was impossible to stand on the sidelines and watch the oils go up without you. But the oils had been moving up for 18 months; what you were witnessing was more of a buying panic than anything logical. Now these stocks are down huge and nobody wants them. If you feared missing the next move in oil, you might have bought then and no doubt are selling now.
Cramer’s Ten Commandments of Trading
Number 1 Number 2 Number 3
Number 4 Number 5 Number 6
Logo Width=3˝ Logo Width=2˝
Logo Width=0.75˝ Logo Width=0.5˝
Logo Width=1.5˝
Logo Width=1˝
View Our Premium Services
5
That’s the reason this impulse must be controlled.
We have seen it happen endlessly in tech over the last few years. One company would report a good number, say, Yahoo!, and the market would take up all other Net stocks without thinking, including those of companies that Yahoo! was killing!
That was the fear instinct at work again. Invariably, people who acted on it lost money.
What I like to tell myself is, “OK, I missed that Yahoo!. I should have bought it yesterday. Now, rather than play catchup, I will just work harder to find the next Yahoo.”
Control your instincts. There is always another train. Never forget it.
At the time of publication, Cramer was long Yahoo!.
Don’t Trade Off Only the Headlines
Commandment 9
If I didn’t know any better, I would think that headlines are written to pick off errant traders who don’t know enough. Watch tonight, watch when Intel reports. I guarantee you that whatever headline is written for the competing wire services, it won’t tell you what to do. If anything, it will throw you off the scent.
That’s because the headline writer’s job is antithetical to the process of investing and trading. You trade when you have knowledge of outlook, but the outlook comes out after the raw number, which isn’t enough to trade on. That’s why I always say (and why my ninth Commandment of Trading is):
Don’t trade headlines.
Wait for the story. Believe me, you will rarely, if ever, make money if you do nothing but react to the headline.
How bad can it be? Consider Apple. I think that, looking back on the headlines after that company reported, you most defi-nitely would have taken stock rather than sold it, because the headline was written with insufficient information.
Wait for the story. Don’t trade the headline. Resist the quick trigger. You will do much better and generate far more winning trades this way.
At the time of publication, Cramer was long Intel.
Don’t Trade Flow
Commandment 10
Watching the tape is a loser’s game, unless you remember that there are sellers as well as buyers at work. I point this out because I really and truly think that most people see “takes,” or buys of stocks, and they want to go take those stocks themselves.
Wrong!
Trading flow, trading off of takes or hits, is dicey for even a seasoned professional. Most of the time when you see flurries of buying, it’s Wrong! That’s the reason my tenth trading com-mandment is:
Don’t trade flow.
Recently, I saw takes of Morgan Stanley all the way up to $60 off of news of some defections. The stock just snowballed as the “crowd,” which is almost always wrong, figured something big was going to happen.
It sure did. The big happening was that you caught a couple of downgrades as the Street recognized that real revenue producers were abandoning the stock in droves.
Lots of times, the tape reveals sucker plays. Lots of times, people just take because emotionally it feels right. If I were you, I would turn off the ticker. Unless you are a junkie like me and just like to see the ebbs and flows, it really is a meaning-

Cramer’s Ten Commandments of Trading
Number 1 Number 2 Number 3
Number 4 Number 5 Number 6
Logo Width=3˝ Logo Width=2˝
Logo Width=0.75˝ Logo Width=0.5˝
Logo Width=1.5˝
Logo Width=1˝
View Our Premium Services
6
less exercise at best and a losing one at worst.
Don’t be sucked in.
The preceding report was previously published and references to specific stocks may no longer be current. The Ratings Report on the pages that follow was originally published on the date specified therein.
This report may not be disseminated or redistributed in any manner.
TheStreet is a publisher. No content published constitutes a recommendation that any particular investment security, portfolio of securities, transaction or investment strategy is suitable for any specific person. None of the writers or contributors will advise you personally concerning the nature, potential, value or suitability of any particular invest-ment, security, portfolio of securities, transaction, investment strategy or other matter. Do not attempt to contact them seeking personalized investment advice, which they cannot provide. To the extent that any of the content published may be deemed to be invest-ment advice, such information is impersonal and not tailored to the investment needs of any specific person. The views expressed are the authors’ own opinions.
Like all investment strategies, trading in stocks involves risk and volatility. Past perfor-mance is not an indication of future results. Actual results will be based on a consumer’s individual purchase and sale decisions. For full information about historic performance of the Action Alerts PLUS portfolio, please visit http://www.TheStreet.com/staticFull/aap_performance.html
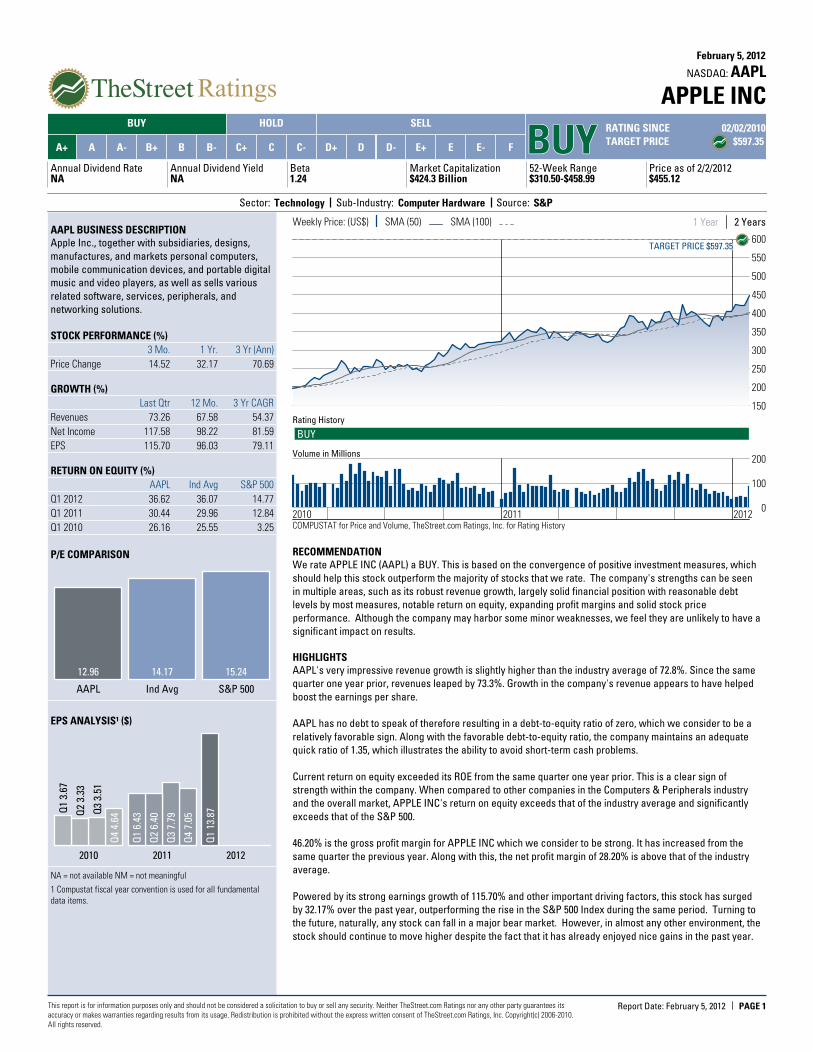
The Apple (AAPL) Ratings Report that follows provides a detailed assessment of the company.
APPLE INCAAPLNASDAQ:
February 5, 2012
BUY HOLD SELL
BUYBUYBUYBUYBUYRATING SINCE 02/02/2010
TARGET PRICE $597.35A+ A A- B+ B B- C+ C C- D+ D D- E+ E E- F
Annual Dividend RateNA
Annual Dividend YieldNA
Beta1.24
Market Capitalization$424.3 Billion
52-Week Range$310.50-$458.99
Price as of 2/2/2012$455.12
Sector: Technology Sub-Industry: Computer Hardware Source: S&P
This report is for information purposes only and should not be considered a solicitation to buy or sell any security. Neither TheStreet.com Ratings nor any other party guarantees itsaccuracy or makes warranties regarding results from its usage. Redistribution is prohibited without the express written consent of TheStreet.com Ratings, Inc. Copyright(c) 2006-2010.All rights reserved.
PAGE 1Report Date: February 5, 2012
AAPL BUSINESS DESCRIPTIONApple Inc., together with subsidiaries, designs,
manufactures, and markets personal computers,
mobile communication devices, and portable digital
music and video players, as well as sells various
related software, services, peripherals, and
networking solutions.
STOCK PERFORMANCE (%)
3 Mo. 1 Yr. 3 Yr (Ann)
Price Change 14.52 32.17 70.69
GROWTH (%)
Last Qtr 12 Mo. 3 Yr CAGR
Revenues 73.26 67.58 54.37
Net Income 117.58 98.22 81.59
EPS 115.70 96.03 79.11
RETURN ON EQUITY (%)
AAPL Ind Avg S&P 500
Q1 2012 36.62 36.07 14.77
Q1 2011 30.44 29.96 12.84
Q1 2010 26.16 25.55 3.25
P/E COMPARISON
12.96
AAPL
14.17
Ind Avg
15.24
S&P 500
EPS ANALYSIS¹ ($)
2012
Q1
13.8
7
2011
Q4
7.05
Q3
7.79
Q2
6.40
Q1
6.43
2010
Q4
4.64
Q3
3.51
Q2
3.33
Q1
3.67
NA = not available NM = not meaningful
1 Compustat fiscal year convention is used for all fundamentaldata items.
Weekly Price: (US$) SMA (50) SMA (100) 2 Years1 Year
2010 2011 2012
150
200
250
300
350
400
450
500
550
600TARGET PRICE $597.35TARGET PRICE $597.35TARGET PRICE $597.35TARGET PRICE $597.35TARGET PRICE $597.35
Rating History
BUY
0
100
200Volume in Millions
COMPUSTAT for Price and Volume, TheStreet.com Ratings, Inc. for Rating History
RECOMMENDATIONWe rate APPLE INC (AAPL) a BUY. This is based on the convergence of positive investment measures, which
should help this stock outperform the majority of stocks that we rate. The company's strengths can be seen
in multiple areas, such as its robust revenue growth, largely solid financial position with reasonable debt
levels by most measures, notable return on equity, expanding profit margins and solid stock price
performance. Although the company may harbor some minor weaknesses, we feel they are unlikely to have a
significant impact on results.
HIGHLIGHTSAAPL's very impressive revenue growth is slightly higher than the industry average of 72.8%. Since the same
quarter one year prior, revenues leaped by 73.3%. Growth in the company's revenue appears to have helped
boost the earnings per share.
AAPL has no debt to speak of therefore resulting in a debt-to-equity ratio of zero, which we consider to be a
relatively favorable sign. Along with the favorable debt-to-equity ratio, the company maintains an adequate
quick ratio of 1.35, which illustrates the ability to avoid short-term cash problems.
Current return on equity exceeded its ROE from the same quarter one year prior. This is a clear sign of
strength within the company. When compared to other companies in the Computers & Peripherals industry
and the overall market, APPLE INC's return on equity exceeds that of the industry average and significantly
exceeds that of the S&P 500.
46.20% is the gross profit margin for APPLE INC which we consider to be strong. It has increased from the
same quarter the previous year. Along with this, the net profit margin of 28.20% is above that of the industry
average.
Powered by its strong earnings growth of 115.70% and other important driving factors, this stock has surged
by 32.17% over the past year, outperforming the rise in the S&P 500 Index during the same period. Turning to
the future, naturally, any stock can fall in a major bear market. However, in almost any other environment, the
stock should continue to move higher despite the fact that it has already enjoyed nice gains in the past year.

APPLE INCAAPLNASDAQ:
February 5, 2012
Sector: Technology Computer Hardware Source: S&P
Annual Dividend Rate
NAAnnual Dividend Yield
NABeta
1.24Market Capitalization
$424.3 Billion52-Week Range
$310.50-$458.99Price as of 2/2/2012
$455.12
This report is for information purposes only and should not be considered a solicitation to buy or sell any security. Neither TheStreet.com Ratings nor any other party guarantees itsaccuracy or makes warranties regarding results from its usage. Redistribution is prohibited without the express written consent of TheStreet.com Ratings, Inc. Copyright(c) 2006-2010.All rights reserved.
PAGE 2Report Date: February 5, 2012
PEER GROUP ANALYSIS
REVENUE GROWTH AND EBITDA MARGIN*
EBITDA Margin (TTM)
Rev
enue
Gro
wth
(TTM
)
-20%
100%
40%-30%
FAVORABLE
UNFAVORABLE
SSYSSSYSSSYSSSYSSSYS
SMCISMCISMCISMCISMCI
HPQHPQHPQHPQHPQAVIDAVIDAVIDAVIDAVID
CCURCCURCCURCCURCCURDELLDELLDELLDELLDELL
NCRNCRNCRNCRNCR
CRAYCRAYCRAYCRAYCRAY
DBDDBDDBDDBDDBD
DDDDDDDDDDDDDDD
AAPLAAPLAAPLAAPLAAPL
Companies with higher EBITDA margins and
revenue growth rates are outperforming companies
with lower EBITDA margins and revenue growth
rates. Companies for this scatter plot have a market
capitalization between $32.9 Million and $424.3
Billion. Companies with NA or NM values do not
appear.
*EBITDA – Earnings Before Interest, Taxes, Depreciation andAmortization.
REVENUE GROWTH AND EARNINGS YIELD
Earnings Yield (TTM)
Rev
enue
Gro
wth
(TTM
)
-20%
100%
15%-15%
FAVORABLE
UNFAVORABLE
SSYSSSYSSSYSSSYSSSYS
SMCISMCISMCISMCISMCI
HPQHPQHPQHPQHPQAVIDAVIDAVIDAVIDAVID
CCURCCURCCURCCURCCURDELLDELLDELLDELLDELL
NCRNCRNCRNCRNCR
CRAYCRAYCRAYCRAYCRAY
DBDDBDDBDDBDDBD
DDDDDDDDDDDDDDD
AAPLAAPLAAPLAAPLAAPL
Companies that exhibit both a high earnings yield
and high revenue growth are generally more
attractive than companies with low revenue growth
and low earnings yield. Companies for this scatter
plot have revenue growth rates between -5.1% and
93.4%. Companies with NA or NM values do not
appear.
INDUSTRY ANALYSISThe computers and peripherals industry includes PC equipment, handheld devices, complex information
technology systems and network equipment. Technological factors such as interoperability of hardware
products and compatibility with the web have brought about industry consolidation. Also, intense competition
and the importance of intellectual property rights have been instrumental to growth. The US computers and
peripherals industry is one of the largest global markets, including companies such as Apple (AAPL), IBM
(IBM), Dell (DELL) and Hewlett-Packard (HPQ).
The industry is capital-intensive with highly automated operations. Larger companies are built on purchasing
power and mass production while smaller firms concentrate on product specialty and superior technology.
Research and development spending at large manufacturers generally varies between 5% and 15% of
product revenue and can be more for smaller companies and low for pure assemblers like Dell. Patent
licensing is a common practice as are disputes arising from patents. Technological advancement renders
products quickly outdated. Many products have a lifespan less than 18 months.
Companies with excellent process technology, capital-intensive components production and flexible
high-volume assembly are expected to dominate the hardware value chain. Companies with patent capital,
close links to component and equipment developers and the ability to afford R&D expenditures and capital
investments will benefit the most in the future. These attributes play into the strategic and technical strengths
of Japanese companies. The US industry has superior design skills, but remains largely fragmented,
undercapitalized and lacks a long-term approach. However, some US companies have been successful in
producing structures, strategy and operational techniques necessary for commercial success.
With the global economic recovery, the computers and peripherals industry is expected to thrive as
corporations continue to automate and upgrade their systems to increase efficiency and enhance
competitive positions. Major players in the sector derive a substantial portion of their revenues from foreign
markets adding geographic diversity to their product sales base. A weaker US dollar has given a pricing edge
to American products and services.
Companies have little room for errors or inefficiencies in such a competitive and economically volatile
environment. According to International Data Corp., price wars and technological evolution can drive down
prices by 25% a year.
Computer storage and peripherals are strong sellers as data storage continues to be a top priority across
businesses. Increasing amounts of data and content and the proliferation of broadband access have
necessitated greater capacity across the storage infrastructure.
PEER GROUP: Computers & Peripherals
Recent Market Price/ Net Sales Net Income
Ticker Price ($)Company Name Cap ($M) Earnings TTM ($M) TTM ($M)
AAPL 455.12APPLE INC 424,340 12.96 127,841.00 32,982.00
SSYS 39.32STRATASYS INC 834 44.68 145.35 19.15
SMCI 17.09SUPER MICRO COMPUTER INC 701 19.42 992.39 38.69
HPQ 28.50HEWLETT-PACKARD CO 56,545 8.72 127,245.00 7,074.00
AVID 10.15AVID TECHNOLOGY INC 392 NM 687.98 -25.57
CCUR 3.58CONCURRENT COMPUTER CP 33 NM 62.70 -4.29
DELL 17.60DELL INC 31,619 9.07 61,732.00 3,655.00
NCR 18.83NCR CORP 2,964 32.47 5,216.00 101.00
CRAY 7.60CRAY INC 276 7.68 363.92 35.40
DBD 32.51DIEBOLD INC 2,036 NM 2,776.86 -54.95
DDD 20.113D SYSTEMS CORP 1,016 27.18 212.16 36.86
The peer group comparison is based on Major Computer Hardware companies of comparable size.
APPLE INCAAPLNASDAQ:
February 5, 2012
Sector: Technology Computer Hardware Source: S&P
Annual Dividend Rate
NAAnnual Dividend Yield
NABeta
1.24Market Capitalization
$424.3 Billion52-Week Range
$310.50-$458.99Price as of 2/2/2012
$455.12
This report is for information purposes only and should not be considered a solicitation to buy or sell any security. Neither TheStreet.com Ratings nor any other party guarantees itsaccuracy or makes warranties regarding results from its usage. Redistribution is prohibited without the express written consent of TheStreet.com Ratings, Inc. Copyright(c) 2006-2010.All rights reserved.
PAGE 3Report Date: February 5, 2012
COMPANY DESCRIPTIONApple Inc., together with subsidiaries, designs,
manufactures, and markets personal computers, mobile
communication devices, and portable digital music and
video players, as well as sells various related software,
services, peripherals, and networking solutions. The
company sells its products worldwide through its online
stores, retail stores, direct sales force, third-party
wholesalers, resellers, and value-added resellers. In
addition, it sells various third-party Macintosh, iPhone,
and iPod compatible products, including application
software, printers, storage devices, speakers,
headphones, and various other accessories and
peripherals through its online and retail stores, and
digital content and applications through the iTunes
Store. The company sells its products to consumer, small
and mid-sized business, education, enterprise,
government, and creative customers. As of September
26, 2009, it had 273 retail stores, including 217 stores in
the United States and 56 stores internationally. The
company, formerly known as Apple Computer, Inc., was
founded in 1976 and is headquartered in Cupertino,
California.
APPLE INC
1 Infinite Loop
Cupertino, CA 95014
USA
Phone: 408-996-1010
Fax: 408-996-0275
http://www.apple.com
STOCK-AT-A-GLANCEBelow is a summary of the major fundamental and technical factors we consider when determining our
overall recommendation of AAPL shares. It is provided in order to give you a deeper understanding of our
rating methodology as well as to paint a more complete picture of a stock's strengths and weaknesses. It is
important to note, however, that these factors only tell part of the story. To gain an even more comprehensive
understanding of our stance on the stock, these factors must be assessed in combination with the stock’s
valuation. Please refer to our Valuation section on page 5 for further information.
FACTOR SCORE
Growth out of 5 stars5.0Measures the growth of both the company's income statement and
cash flow. On this factor, AAPL has a growth score better than 90% of
the stocks we rate.
weak strong
Total Return out of 5 stars4.5Measures the historical price movement of the stock. The stock
performance of this company has beaten 80% of the companies we
cover.
weak strong
Efficiency out of 5 stars5.0Measures the strength and historic growth of a company's return on
invested capital. The company has generated more income per dollar of
capital than 90% of the companies we review.
weak strong
Price volatility out of 5 stars5.0Measures the volatility of the company's stock price historically. The
stock is less volatile than 90% of the stocks we monitor.
weak strong
Solvency out of 5 stars5.0Measures the solvency of the company based on several ratios. The
company is more solvent than 90% of the companies we analyze.
weak strong
Income out of 5 stars0.5Measures dividend yield and payouts to shareholders. This company
pays no dividends.
weak strong
THESTREET.COM RATINGS RESEARCH METHODOLOGY
TheStreet.com Ratings' stock model projects a stock's total return potential over a 12-month period including
both price appreciation and dividends. Our Buy, Hold or Sell ratings designate how we expect these stocks to
perform against a general benchmark of the equities market and interest rates. While our model is
quantitative, it utilizes both subjective and objective elements. For instance, subjective elements include
expected equities market returns, future interest rates, implied industry outlook and forecasted company
earnings. Objective elements include volatility of past operating revenues, financial strength, and company
cash flows.
Our model gauges the relationship between risk and reward in several ways, including: the pricing drawdown
as compared to potential profit volatility, i.e.how much one is willing to risk in order to earn profits; the level of
acceptable volatility for highly performing stocks; the current valuation as compared to projected earnings
growth; and the financial strength of the underlying company as compared to its stock's valuation as
compared to projected earnings growth; and the financial strength of the underlying company as compared
to its stock's performance. These and many more derived observations are then combined, ranked, weighted,
and scenario-tested to create a more complete analysis. The result is a systematic and disciplined method of
selecting stocks.

APPLE INCAAPLNASDAQ:
February 5, 2012
Sector: Technology Computer Hardware Source: S&P
Annual Dividend Rate
NAAnnual Dividend Yield
NABeta
1.24Market Capitalization
$424.3 Billion52-Week Range
$310.50-$458.99Price as of 2/2/2012
$455.12
This report is for information purposes only and should not be considered a solicitation to buy or sell any security. Neither TheStreet.com Ratings nor any other party guarantees itsaccuracy or makes warranties regarding results from its usage. Redistribution is prohibited without the express written consent of TheStreet.com Ratings, Inc. Copyright(c) 2006-2010.All rights reserved.
PAGE 4Report Date: February 5, 2012
Consensus EPS Estimates² ($)IBES consensus estimates are provided by Thomson Financial
9.28
Q2 FY12
42.64 E
2012(E)
47.57 E
2013(E)
INCOME STATEMENT
Q1 FY12 Q1 FY11
Net Sales ($mil) 46,333.00 26,741.00
EBITDA ($mil) 18,061.00 8,183.00
EBIT ($mil) 17,340.00 7,827.00
Net Income ($mil) 13,064.00 6,004.00
BALANCE SHEET
Q1 FY12 Q1 FY11
Cash & Equiv. ($mil) 30,156.00 26,977.00
Total Assets ($mil) 138,681.00 86,742.00
Total Debt ($mil) 0.00 0.00
Equity ($mil) 90,054.00 54,666.00
PROFITABILITY
Q1 FY12 Q1 FY11
Gross Profit Margin 46.24% 39.84%
EBITDA Margin 38.98% 30.60%
Operating Margin 37.42% 29.27%
Sales Turnover 0.92 0.88
Return on Assets 23.78% 19.18%
Return on Equity 36.62% 30.44%
DEBT
Q1 FY12 Q1 FY11
Current Ratio 1.58 1.85
Debt/Capital 0.00 0.00
Interest Expense 0.00 0.00
Interest Coverage NA NA
SHARE DATA
Q1 FY12 Q1 FY11
Shares outstanding (mil) 932 921
Div / share 0.00 0.00
EPS 13.87 6.43
Book value / share 96.60 59.35
Institutional Own % NA NA
Avg Daily Volume 12,419,577 21,576,962
2 Sum of quarterly figures may not match annual estimates due touse of median consensus estimates.
FINANCIAL ANALYSISAPPLE INC's gross profit margin for the first quarter of its fiscal year 2012 has increased when compared to
the same period a year ago. The company grew its sales and net income significantly quarter versus same
quarter a year prior, and was able to outpace the average competitor in the industry when comparing
revenue growth, but not when comparing net income growth. APPLE INC has average liquidity. Currently, the
Quick Ratio is 1.35 which shows that technically this company has the ability to cover short-term cash needs.
The company's liquidity has decreased from the same period last year.
At the same time, stockholders' equity ("net worth") has greatly increased by 64.73% from the same quarter
last year. Together, the key liquidity measurements indicate that it is relatively unlikely that the company will
face financial difficulties in the near future.

APPLE INCAAPLNASDAQ:
February 5, 2012
Sector: Technology Computer Hardware Source: S&P
Annual Dividend Rate
NAAnnual Dividend Yield
NABeta
1.24Market Capitalization
$424.3 Billion52-Week Range
$310.50-$458.99Price as of 2/2/2012
$455.12
This report is for information purposes only and should not be considered a solicitation to buy or sell any security. Neither TheStreet.com Ratings nor any other party guarantees itsaccuracy or makes warranties regarding results from its usage. Redistribution is prohibited without the express written consent of TheStreet.com Ratings, Inc. Copyright(c) 2006-2010.All rights reserved.
PAGE 5Report Date: February 5, 2012
RATINGS HISTORYOur rating for APPLE INC has not changed since
4/13/2009. As of 2/2/2012, the stock was trading at a
price of $455.12 which is .9% below its 52-week
high of $458.99 and 46.6% above its 52-week low of
$310.50.
2 Year Chart
2010 2011
$200
$300
$400
$500
BU
Y: $
195.
86
MOST RECENT RATINGS CHANGES
Date Price Action From To
2/2/10 $195.86 No Change Buy Buy
Price reflects the closing price as of the date listed, if available
RATINGS DEFINITIONS &DISTRIBUTION OF THESTREET.COM RATINGS
(as of 2/2/2012)
40.79% Buy - We believe that this stock has the
opportunity to appreciate and produce a total return of
more than 10% over the next 12 months.
31.99% Hold - We do not believe this stock offers
conclusive evidence to warrant the purchase or sale of
shares at this time and that its likelihood of positive total
return is roughly in balance with the risk of loss.
27.22% Sell - We believe that this stock is likely to
decline by more than 10% over the next 12 months, with
the risk involved too great to compensate for any
possible returns.
TheStreet.com Ratings, Inc.262 Washington Street, 4th FloorBoston, MA 02108www.thestreet.comResearch Contact: 617-531-9717
Sales Contact: 866-321-8726
VALUATIONBUY. This stock's P/E ratio indicates a discount compared to an average of 14.17 for the Computers &
Peripherals industry and a discount compared to the S&P 500 average of 15.24. Conducting a second
comparison, its price-to-book ratio of 4.71 indicates a significant premium versus the S&P 500 average of 2.13
and a premium versus the industry average of 3.98. The price-to-sales ratio is well above both the S&P 500
average and the industry average, indicating a premium.
1 2 3 4 5Price/Earningspremium discount
AAPL 12.96 Peers 14.17
• Average. An average P/E ratio can signify an
industry neutral price for a stock and an average
growth expectation.
• AAPL is trading at a valuation on par with its peers.
1 2 3 4 5Price/CashFlowpremium discount
AAPL 9.36 Peers 9.25
• Average. The P/CF ratio, a stock’s price divided by
the company's cash flow from operations, is useful
for comparing companies with different capital
requirements or financing structures.
• AAPL is trading at a valuation on par to its peers.
1 2 3 4 5Price/Projected Earningspremium discount
AAPL 9.57 Peers 11.09
• Average. An average price-to-projected earnings
ratio can signify an industry neutral stock price and
average future growth expectations.
• AAPL is trading at a valuation on par with its peers.
1 2 3 4 5Price to Earnings/Growthpremium discount
AAPL 0.24 Peers 0.28
• Discount. The PEG ratio is the stock’s P/E divided
by the consensus estimate of long-term earnings
growth. Faster growth can justify higher price
multiples.
• AAPL trades at a discount to its peers.
1 2 3 4 5Price/Bookpremium discount
AAPL 4.71 Peers 3.98
• Premium. A higher price-to-book ratio makes a
stock less attractive to investors seeking stocks
with lower market values per dollar of equity on the
balance sheet.
• AAPL is trading at a premium to its peers.
1 2 3 4 5Earnings Growthlower higher
AAPL 96.03 Peers 70.32
• Higher. Elevated earnings growth rates can lead to
capital appreciation and justify higher
price-to-earnings ratios.
• AAPL is expected to have an earnings growth rate
that significantly exceeds its peers.
1 2 3 4 5Price/Salespremium discount
AAPL 3.32 Peers 2.69
• Premium. In the absence of P/E and P/B multiples,
the price-to-sales ratio can display the value
investors are placing on each dollar of sales.
• AAPL is trading at a premium to its industry on this
measurement.
1 2 3 4 5Sales Growthlower higher
AAPL 67.58 Peers 48.22
• Higher. A sales growth rate that exceeds the
industry implies that a company is gaining market
share.
• AAPL has a sales growth rate that significantly
exceeds its peers.
DISCLAIMER:
The opinions and information contained herein have been obtained or derived from sources believed to be reliable, but
TheStreet.com Ratings, Inc. can not guarantee its accuracy and completeness, and that of the opinions based thereon. Data is
provided via the COMPUSTAT® Xpressfeed product from Standard &Poor’s, a division of The McGraw-Hill Companies, Inc., as
well as other third-party data providers.
TheStreet.com Ratings, Inc. is a wholly owned subsidiary of TheStreet.com, Inc. which is a publisher and has registered as an
investment adviser with the U.S. Securities and Exchange Commission. This research report contains opinions and is provided
for informational purposes only. You should not rely solely upon the research herein for purposes of transacting securities or
other investments, and you are encouraged to conduct your own research and due diligence, and to seek the advice of a
qualified securities professional, before you make any investment. None of the information contained in this report constitutes,
or is intended to constitute a recommendation by TheStreet.com Ratings, Inc. of any particular security or trading strategy or a
determination by TheStreet.com Ratings, Inc. that any security or trading strategy is suitable for any specific person. To the
extent any of the information contained herein may be deemed to be investment advice, such information is impersonal and not
tailored to the investment needs of any specific person.


![Exploiting Excel’s Data Table Creatively in the Study of ...atcm.mathandtech.org/EP2018/invited/4382018_21662.pdf · Cramer’s Rule Cramer’s Rule [7] is a well-known procedure](https://static.fdocuments.net/doc/165x107/5eac9492a44de069a44e3cac/exploiting-excelas-data-table-creatively-in-the-study-of-atcm-crameras-rule.jpg)