cr. Effea of Fiber/ Matrix Interactions on the Properties ... · ‘cr. Effea of Fiber/ Matrix...
168
NASA Conttactor Report 3607 “.s; ,. - . ‘cr. Effea of Fiber/ Matrix Interactions on the Properties of Gxaphite/Epoq Composites Paul E. McMahon and Lincoln Ying CONTRACT NASl-15749 SEPTEMBER 1982 NASA CR 3607 c.1 _" https://ntrs.nasa.gov/search.jsp?R=19830001850 2018-07-21T11:06:03+00:00Z
Transcript of cr. Effea of Fiber/ Matrix Interactions on the Properties ... · ‘cr. Effea of Fiber/ Matrix...
NASA Conttactor Report 3607
“.s; ,. - . ‘cr.
Effea of Fiber/ Matrix Interactions on the Properties of Gxaphite/Epoq Composites
Paul E. McMahon and Lincoln Ying
CONTRACT NASl-15749 SEPTEMBER 1982
NASA CR 3607 c.1 _"
https://ntrs.nasa.gov/search.jsp?R=19830001850 2018-07-21T11:06:03+00:00Z

TECH LIBRARY KAFB, NM
l~ll~~lllnl~rlm~l~~r~l OObZl,~4
NASAGmttactorRepoti3607
Efkcts of Fiber/Matrix Intexxtions on the Properties of Graphite/Epoxy Composites
Paul E. McMahon and Lincoln Ying celanese cofpomion Summit, NewJersey
Repared for Ian ley Resead Center
t un er Comact NMl-15749
MSA National Aeronautics and Space Administration
Sclentiflc and lechnlcrl lnformrtlon Branch
1982


TABLE OF CONTENTS
PAGE
SUMMARY 1
INTRODUCTION 3
BACKGROUND AND LITERATURE REVIEW 5
ROLE OF THE INTERFACE IN COMPOSITE MATERIALS REFERENCES TO THE ROLE OF THE INTERFACE IN
COMPOSITE MATERIALS EFFECT OF INTERPHASE PROPERTIES ON COMPOSITE
PERFORMANCE REFERENCES TO THE EFFECT OF INTERPHASE PROPERTIES ON
COMPOSITE PERFORMANCE ROLE OF INTERFACE/INTERPHASE IN COMPOSITE TOUGHNESS REFEmNCES TO THE ROLE OF INTERFACE/INTERPHASE IN
COMPOSITE TOUGHNESS EFFECT OF MOISTURE ON THE CARBON FIBER/EPOXY
INTERFACE AND INTERPHASE REFERENCES TO EFFECT OF MOISTURE ON THE CARBON FIBER/
EPOXY INTERFACE ADHESION THEORY REFERENCES TO ADHESION THEORY WETTING PHENOMENA REFERENCES TO WETTING PHENOMENA STRESS TRANSFER FROM MATRIX TO FIBER REFERENCES TO STRESS TRANSFER METHODS FOR MEASURING INTERFACIAL BOND STRENGTH REFERENCES TO METHODS FOR MEASURING INTERFACIAL
BOND STRENGTH
5
7
8
16 18
20
22
31 32 36 39 55 57 62 63
82
EXPERIMENTAL 84
MATRIX RESIN 84 EXPERIMENTAL RESULTS AND DISCUSSION 88 REFERENCES 107 EFFECT OF SIZINGS ON COMPOSITE PROPERTIES 108
MODEL DEVELOPMENT 112
CONCLUSIONS AND RECOMMENDATIONS 115
. . , x/u.
TABLE OF CONTENTS (continued)
APPENDIXES
A.
B. C. D.
E. F.
G.
H.
I.
J.
CALCULATIONS FOR THE THICKNESS OF A 1.5% BY WEIGHT EPOXY SIZE ON CARBON FIBER APPARATUS FOR WETTING FORCE MEASUREMENT WETTING FORCE MEASUREMENT PROGRAM PROCEDURES FOR CLEAN GLASSWARE TO PREYENT CONTAMINATION OF WETTING LIQUIDS SINGLE FILAMENT GRAPHITE FIBER TENSILE TEST SINGLE FILAMENT TENSILE STRENGTH AT VARIOUS GAUGE LENGTHS TENSILE FIXTURE TO STUDY SINGLE FILAMENT ADHESION PROPERTIES SINGLE FILAMENT INTERFACIAL SHEAR STRENGTH DETERMINATION PROGRAM WEIBULL DISTRIBUTION OF CRITICAL LENGTH A HISTOGRAM PLOT INSTRUMENTED IMPACT TESTER
iv

LIST OF FIGURES
NO. PAGE
1 FIBER-MATRIX INTERFACE/INTERPHASE IN FIBROUS COMPOSITE MATERIAL
2 COMPOSITE STRENGTH AS A FUNCTION OF INTERFACE MODULUS
3 COMPOSITE MODULUS AS A FUNCTION OF INTERFACE MODULUS
4 COMPOSITE STRAIN ENERGY ABSORBED AS A FUNCTION OF INTERFACE MODULUS
5 TRANSVERSE STRENGTH OF GLASS FIBER REINFORCED COMPOSITES BEFORE AND AFTER TWO HOURS IN BOILING WATER
6 MICELLE STRUCTURE OF THE COPOLYMER MICELLAR ADSORPTION
7 FIXATION OF BLOCK COPOLYMERS ON CARBON FIBRES BY DIPOLE- DIPOLE BONDING
8 SHEAR STRENGTH OF COMPOSITES AFTER WATER TREATMENT AT 5ooc
9 SHEAR STRENGTH AND RESILIENCE OF; RESIN (EPOXY), RESIN + UNTREATED FIBRES, RESIN i- GRAFTED FIBRES
10 MOISTURE ABSORPTION OF CELANESE FURNISHED CELION@ 6000/ 5200 LAMINATES WITH AND WITHOUT NOMINAL SIZING FINISH
11 MOISTURE ABSORPTION OF CELANESE FURNISHED CELION@ 6000/ 5200 LAMINATES --SERIES 743-A AND 115-A SIZING
12 MOISTURE ABSORPTION OF CELANESE FURNISHED CELION@ 6000/ 5200 LAMINATES--SERIES 743-A AND 101-A SIZING
13 MOISTURE ABSORPTION OF CELANESE FURNISHED CELION@ 6000/ 5200 LAMINATES --SERIES 743-A AND 747-A
14 MOISTURE ABSORPTION OF CELANESE FURNISHED CELION@ 6000/. 5200 LAMINATES --SERIES 743-A AND 120-A
15 MOISTURE ABSORPTION OF CELANESE FURNISHED CELION@ 6000/ 5200 LAMINATES --SERIES 743-A, 745-A and 747-A
16 EQUILIBRIUM STATE OF A LIQUID DROP ON A SOLID SURFACE
17 A SESSILE DROP ON AN INCLINED PLANE (GRADIENT = tan@) SHOWING THE ADVANCING Oa AND RECEDING Or ANGLES
4
10
10
11
12
13
14
14
15
23
24
25
26
27
28
39
41

LIST OF FIGURES
NO. PAGE
18 FORCES ACTING ON A SUSPENDED FILAMENT BEFORE AND AFTER CONTACT WITH WETTING LIQUID 44
19 HYSTERESIS OF WETTING MEASURED BY PLOTTING ADVANCING AND RECEDING WETTING FORCE VERSUS IMMERSION FIBER LENGTH 45
20 EFFECT OF FIBER PENETRATION VELOCITY ON CONTACT ANGLES 46
21 ANGLE OF WETTING 0 OF VARIOUS LIQUIDS WITH RESPECT TO CARBON FIBERS 49
22 INTERFACIAL SHEAR STRESS PATTERNS FOR THE ELASTIC AND PLASTIC MATRIX CASES 60
23 A TYPICAL LOAD-DISPLACEMENT CURVE FOR FIBER PULLOUT TEST 64
24 BUTTON-TYPE SPECIMEN FOR FIBER PULLOUT TEST 65
25 BLOCK-TYPE SPECIMEN FOR FIBER PULLOUT .TEST 65
26 RELATIONSHIP OF RESIN LOZENGE THICKNESS TO FIBER PULLOUT FORCE 66
27 EMBEDDED SINGLE FIBER IN A SEMI-INFINITE SOLID UNDER TENSILE LOAD 69
28 SPECIMEN FOR MEASURING THE DEBGNDING ENERGY OF THE FIBER FROM THE SURROUNDING MATRIX 71
29 INTERFACIAL SHEAR STRENGTH SPECIMEN 72
30 INTERFACIAL TRANSVERSE TENSILE STRENGTH SPECIMEN 73
31 SCHEMATIC DIAGRAM OF SINGLE FI;BER INTERFACIAL SHEAR STRENGTH SPECIMEN 75
32 FIBER FRACTURE AND STRESS DISTRTBUTION 76
33 TRANSMITTED POLARIZED LIGHT MICROGRAPH OF A TYPICAL FIBER A FRACTURE AS A FUNCTION OF INCREASING STRAIN 77
34 TRANSMITTED POLARIZED LIGHT MICROGRAPH OF A TYPICAL FIBER B FRACTURE AS A FUNCTION OF INCREASING STRAIN 78
35 HISTOGRAMS OF ASPECT RATIOS .FOR FIBER A AND B 80
36 MICRODEBONDING TEST 81
Vi
LIST OF FIGURES
NO. PAGE
37
38
39
40
41
42
43
44
45
46
47
48
49
'50
51
VISCOSITY-TEMPERATURE PROFILE OF EPI-RES 508. EPOXY RESIN MEASURED BY A BROOKFIELD VISCOMETER WITH SPINDLES NO. 1 AND 2
HISTOGRAPH OF CRITICAL ASPECT RATIO OF T-630.0 STANDARD SIZED CARBON FIBERS
HISTOGRAPH OF THE CRITICAL ASPECT RATIO OF AS-1 UNSIZED CARBON FIBER
HISTOGRAM OF THE CRITICAL ASPECT RATIO OF CELION@ 6000 WITH NO SURFACE TREATMENT AND UNSIZED
HISTOGRAM OF THE CRITICAL ASPECT RATIO OF CELIONQ 6000 WITH SURFACE TREATMENT BUT UNSIZED
HISTOGRAM OF THE CRITICAL ASPECT RATIO OF CELION@ 6000 STANDARD EPOXY COMPATIBLE SIZE (COMMERCIAL PRODUCT)
HISTOGRAM OF THE CRITICAL ASPECT RATIO OF CELION@ 6000 WITH ETP-50 SIZE
HISTOGRAM OF THE CRITICAL ASPECT RATIO OF CELION@ 6000 WITH ETP-10 SIZE
HISTOGRAM OF THE CRITICAL ASPECT OF CELION@ 6000 WITH ‘FRE-25 SIZE
HISTOGRAM OF THE CRITICAL ASPECT RATIO OF CFLION@' 6000 WITH SILICONE RUBBER SIZE
FRACTURE MODE AT FIBER END OF LOW INTERFACIAL BOND STRENGTH (SILICONE RUBBER SIZED AND UNSIZED CARBON FIBERS)
FRACTURE MODE AT FIBER END OF HIGH INTERFACIAL BOND STRENGTH WITH STANDARD EPOXY SIZED CARBON FIBER. BRITTLE FAILURE INTO MATRIX AT FIBER ENDS
FRACTURE MODE AT FIBER END OF LOWER MODULUS FINISH (ETP 50). CARBON FIBER
A SCHEMATIC DIAGRAM OF THE THREE TYPES OF FAILURE MECHANISMS AT FIBER ENDS WITH DIFFERENT FINISHES
A SCHEMATIC DIAGRAM OF AN INNERLAYERED INCLUSION 113.
90
97
97
98
98
99
99
100
100
101
103.
104.
105
106.

LIST OF TABLES
NO.
I
II
III
IV
V
VI
VII
VIII
IX
X
XI
XII
XIII
XIV
xv
XVI
XVII
GLASS TRANSITIQN TEMPERATURES ON INTERPHASE VARIANTS
THERMAL CYCLING DATA
CONTACT ANGLES FOR CARBON FIBERS
SURFACE FREE ENERGIES OF CARBON FIBER
WILHELMY BALANCE MEASUREMENTS OF HERCULES TYPE AU AND TYPE AS CARBON FIBER AT 23OC
ADVANCING AND RECEDING CONTACT ANGLES OF CARBON FIBERS
EFFECT OF WETTABILITY OF CARBON FIBER/EPOXY COMPOSITE SHEAR STRENGTH
SOME TYPICAL PHYSICAL PROPERTIES OF A SINGLE FILAMENT CARBON FIBER
VALUES OF THE ADHESION STRENGTH oA FOR AS-RECEIYED FIBERS
ADHESION STRENGTH OF TREATED FIBRES
SINGLE FILAMENT INTERFACIAL SHEAR STRENGTH OF FIBER A AND FIBER B
TENSILE PROPERTIES OF SYSTEM "F" AT YARIOUS CURE SCHEDULES
RESIN CASTING PROPERTIES OF SYSTEM "F"
WETTING FORCE MEASUREMENTS OF CARBON FIBERS WITH WATER AT 23OC
WETTING FORCE MEASUREMENTS OF CARBON FIBERS WITH EPI- RES 508 RESIN AT 70°C
SINGLE FILAMF,NT INTERFACIAL SHEAR STRENGTH
CELION@ 6000/SYSTEM "F" LAMINATE PROPERTIES
XVIII CELION@ 6000/5208 LAMINATE PROPERTIES
PAGE
29
30
47
48
51
53
54
66
67
68
79
85
86
89
91
96
109
110

SUMMARY
An extensive literature review on the effect of interface/ interphase on composite properties was followed by experiments which illustrate the significance of interphase in composite performance.
The review covered adhesion theory, wetting characteristics of carbon fiber, load transfer mechanisms in a fibrous composite, test methods to measure and evaluate fiber-matrix interfacial bond strengths, effect of moisture at the interface and properties of the interface/interphase, including impact toughness, on com- posite performance. A critical discussion of the literature is presented along with appropriate citations and references.
In contrast to adhesion in glass fiber/epoxy composites, carbon fiber/epoxy adhesion is not simply promoted by "coupling agents" but rather it results from physical and/or chemical inter- actions with the matrix. Much work has been done to characterize the surface energetics of carbon fiber but no correlation has been identified between wetting behavior and interfacial bond strength. Many techniques have been developed to study fiber/ matrix interfacial bond strength but few are applicable to car- bon fiber. Preliminary data have shown that single filament critical length determination is applicable to evaluate carbon fiber - epoxy bond strength. This technique was adapted in this study to evaluate finish variants on carbon fiber in epoxy com- posites.
Moisture at the interface of carbon fiber/epoxy composites has been shown to have little effect on composite properties. The decrease in composite properties in humid environments is primarily due to plasticization of the matrix by water.
Improvement of impact toughness of carbon fiber/epoxy com- posites can be achieved by modification at the fiber/matrix inter- face. However, this is usually associated with a significant decrease in mechanical properties. This is because weak inter- facial bonds allow more impact energy to be absorbed, thereby increasing the impact toughness. A few workers have suggested that "tailoring" interphase properties can improve toughness without lowering the mechanical properties, but, this concept has not yet been demonstrated experimentally.
In this study, experimental results were obtained which show the effect of interphase on composite performance and illustrate its significance. Various finish variants were formulated, based on different chemical and mechanical properties, and applied to Celion@ 6000 carbon fiber. Wetting behavior, studied by the Wilhelmy wetting force technique, and interfacial bond strength, evaluated by single filament critical length determination were characterized for these fibers. Composite properties at room and elevated temperatures and impact toughness were also measured.
1

It is concluded that good wetting is essential to provide good adhesion but better wetting properties do not necessarily translate to better bond strength. Also, it is shown that with a weak interfacial bond strength, impact toughness is improved. But, most significantly, a 30% increase in impact toughness was measured without loss of room temperature and elevated tempera- ture composite mechanical properties by "tailoring" the inter- phase properties.
2
INTRODUCTION
In the last decade, much attention has been focused on fiber- reinforced polymeric matrix composites. These composite materials are both versatile and complex. Their versatility stems from a wide choice of constituent materials available and from the variety of ways in which composites can be fabricated to provide a combina- tion of desired properties. These tailor-made properties are fre- quently not available and cannot be achieved in conventional isotro- pic materials. On the .othe'ti hand, they are complex by virtue of their chemical and mechanical nature and thus should not be regarded as a single material, but as a material system. Inherent in this multi-phase material system is the fiber/matrix interface which is the critical link that provides the structural integrity for the fibrous composites.
Conventionally, the interface is regarded as the bond between fiber and matrix. This interfacial bond is considered to have zero thickness and to result from the interaction between the fiber surface and the matrix material. The interphase region of a fibrous composite is the area immediately adjacent to and including the interface and extends a finite distance into the bulk matrix material. This concept is illustrated in Figure 1.
An extensive review of the literature indicates that much work has been done on fiber/matrix interface characterization. These include the evaluation of fiber surface energetics via wet- ting force measurement; surface elemental analysis via ESCA, AUGER, XPS, etc. and surface topography/morphology studies via SEM. However, little effort has been spent to correlate this information with composite performance. In short, the role of the interface in determining composite properties is not known. Furthermore, little attention has been given to the understand- ing of the nature of the interphase and how it affects composite properties. In particular, the load transfer mechanism in the interphase region is not clear. This report is intended to clarify these areas of uncertainty and to illustrate the influ- ence of the interphase region on composite performance,
3

‘.. -.
\
\
Fiber Matrix Fiber
Interphase Interface Interface Interphase
FIGURE 1. FIBER-MATRIX INTERFACE/INTERPHASE IN FIBROUS COMPOSITE MATERIAL
4
BACKGROUND AND LITERATURE REVIEW
ROLE OF THE INTERFACE IN COMPOSITE MATERIALS
Among many factors that govern the characteristics of a fibrous composite, it is clear that the adhesion at the fiber/ matrix interface plays an important role in structural integrity of these two-phase materials. Since there are a limited number of ways to directly study adhesion at the .interface, composite failure mode and shear strength are commonly employed to assess interfacial bond strengths.
Two extreme cases generally occur in interfacial failure mode studies. For weak interfacial bonding, fiber "pull out" is responsible for the rupture. This is because the fibers are not bonded by the matrix and they slide in their cavities. Therefore, load cannot be transferred in such a discontinuous medium. In this case, the composite fails in a shear mode and the shear strength is usually low. On the other hand, if the inter- facial bonding is strong, then the matrix will transfer the load to the fibers until it reaches the breaking strength of the fibers. In this case, the failure is sudden and catastrophic. A higher shear strength is associated with this kind of tensile failure.
Virgin carbon fibers exhibit lower bondability with polymer matrixes (e.g., epoxy, polyester) and surface treatments are employed to increase the interfacial bond strength. All commer- cially available carbon fibers are surface treated. These surface treatments are generally oxidative in nature and provide functional groups on the fiber surface which increase wettability and/or bondability. Much of the early work has emphasized increases of composite shear strength.
Goan et al(l) studied a sodium chlorate/sulfuric acid oxidation process which doubled composite short beam shear strength. However, this process degraded the fiber tensile strengths. A 4% loss in fiber strength
t impregnated strand
tensile test) was observed. Druin et al 2) studied gas phase oxidation processes where similar results were obtained.
Carbon fiber strength is surface flaw sensitive. Extensive oxidation/etching can increase surface flaws which leads to a reduction in properties. Ehrburger et al, (3) Molleyre and Bastick,(4) Fitzer et al(5) and Duffy(6) studied various types of oxidation processes to optimize the incorporation of functional groups onto the fiber surface and reduce the possibility of exten- sive oxidation/etching.
Ehrburger et al(7,S) found that, by the insertion of weak acidic groups, interlaminar shear strength (ILSS) could be en- hanced just as much as with the incorporation of strong acidic groups on AC (type II), ex-acrylic carbon fiber surfaces. However, the mode of failure was different. A shearing mode of fracture was
5
observed with weak acidic groups while tensile failure was ob- served with strong acidic groups. A possible explanation suggested by the author for this observation was that the.weak acidic groups increased the surface energetics of the fibers and resulted in better wetting and good adsorption which enhanced the coupling. The strong acidic groups - mainly carboxyl.ic or phenolic groups - are coupled with the matrix via tighter and 'stronger primary bonds at the interface which create a brittle composite.
Although little is known about the adhesion mechanisms involved in a fibrous composite material, it is clear that the role of the interface in a composite material is significant.

References to the Role of the Interface in Composite Materials
( 1)
( 2)
( 3)
( 4)
( 5)
( 6)
( 7)
( 8)
J. C. Goan, L. A. Jo& and G. E. Sharpe, "Surface Treatment for Graphite Fibers," Proc. 27th Ann. Tech. Conf. of SpI, 21-E (1972).
M. L. Druin, G. R. Ferment and V. N. P. Rao, "Enhancement of the Surface Characterization of Carbon Fibers," US Patent 3,754,957, Aug. 28 (1973).
P. Ehrburger, J. J. Herque and J. B. Donnet, "Electrochemical Treatment of Carbon and Graphite Fibers," 4th London In- ter. Carbon and Graphite Conf., Sot. of Chem. Ind. (197-6) , 201.
F. Molleyre and M. Bostick, "Modification of the Texture of Carbon Fibers Through Gaseous Oxidization Agents," 4th London Inter. Carbon and Graphite Conf., Sot. of ChK Ind..--(1976), 190.
E. Fitzer, K. H. Geigl and L. M. Manocha, "Surface Chemistry of Carbon Fibers and Its Influence on Mechanical Proper- ties of Phenolic Based Composites," 5th London Inter. Carbon and Graphite Conf., Sot. of Chem. Ind. (1978), 405.
J. V. Duffy, "Carbonized Polymer Coatings as Surface Treatments for Carbon Fibers," Naval Ordnance Lab A320-5203/292-2WFOO- 544-201, NTIS AD-766782.
P. Ehrburger, J. J. Herque and J. B. Donnet, "Interface Prop- erties of Carbon Fiber Composites," 5th London Inter. Carbon and Graphite Conference, 1, Sot. of Chem. Ind. -839-8
P. Ehrburger and J. B. Donnet, "Interface in Composite Mater- ials," Phil. Trans. R. Sot. London, A294 (1980), 495-505.
EFFECT OF INTERPHASE PROPERTIES ON COMPOSITE PERFORMANCE
Commercially available carbon fibers are usually sized with an epoxy compatible finish to enhance handling characteristics. Epoxy-based systems are.generally used since epoxy resins are com- monly used as components of the matrix materials and such mate- rials can be easily applied to the fibers. These sizes also act as lubricants as well as "loose" binders which prevent fiber dam- age and minimize fiber fuzz. The loose binder should not hinder the spreading of the fibers during the prepregging process, but should allow the resin to penetrate bundles and wet individual fibers to eliminate dry spots or voids.
Sizing can be accomplished by passing tows of fibers through a bath containing a dilute solution of the finish material. Fol- lowing such a coating, the fibers must be dried to remove solvent. Better adhesion properties were observed by Drzal et al(l) and Goan et a1t2) with commercial epoxy-sized fibers. This phenomenon can be explained on the basis that the fibers were sized with a low viscosity fluid, thus enhancing wetting. Furthermore, the spontaneous spreading of the sizing solution minimizes trapped air pockets at the interface between fiber and finish.
The overall effect of size materials on composite properties is not fully understood. This is partly because the size materials are applied onto the fiber in very thin layers, normally 1.5% by weight of the fiber, which is equivalent to an approximately 800 A thick coating (Appendix A).
Few analytical techniques can be applied to study the inter- phase of a carbon fiber epoxy composite because of its small dimension. Furthermore, the fiber geometry, and the low atomic number elements on the surface further limit the applicable analyti- cal techniques. These add to the difficulties in understanding the role of the interphase in composite properties. However, some of the effects of interphase can be observed in mechanical tests.
Arai et al(s) showed an increase in both interlaminar shear strength (ILSS) and flexural strength of a carbon fiber epoxy com- posite by electrolytic polymerization of vinyl monomers onto the carbon fibers. Pinchin and Woodhams(4) pyrolyzed graphite onto car- bon fiber surfaces and increased the surface energetics. This was reflected in an increase in shear (ILSS) and flexural strengths. Furthermore, a slight improvement on impact toughness was also measured. An hypothesis, based upon this phenomenon, is that the pyrolytic graphite deposit forms a sheath around the fiber which creates an additional interface. During the debonding and/or crack propagating processes, this additional interface absorbs more energy by exposing additional free surfaces.
Broutman and Agarwalt 6f7) did a theoretical study on composite properties with an interphase layer. Assuming both phases behave
8

elastically with perfect bonding at the interface, it was shown that composite strength reached a maximum when the interphase modulus reached a value of 69 MPa (104 psi). It should be noted that Broutman used the term interface modulus but, according to the definitions of interface and interphase described earlier, interphase modulus is more appropriate because interface is re- garded as zero thickness. Further increases in the interphase modulus do not change the composite strength. This is shown in Figure 2. However, composite modulus continues to increase with increasing interphase modulus (Figure 3). This further increase in modulus without composite strength changing further, .indicates that composite elongation can be maximized at this critical inter- phase modulus (Figure 4).
Although Broutman's theoretical study was not supported by experimental data, the critical interphase modulus determined in his study was significantly lower than the modulus of the matrix. This is similar to the flexible interlayer concept discussed by Benedetto and Nicolais (5). This concept attributes the effective- ness of finishes to stress relief in the interphase region. Since there is a difference in thermal expansion coefficient of the fiber and the matrix, significant residual stress will accumulate at the interface due to elevated temperature curing as well as shrinkage of the matrix during polymerization. However, by incorporation of a flexible interlayer, residual stresses can be relieved. Although these two concepts are different in approach, they both conclude that the properties of the composite can be improved through selec- tive tailoring of the interphase.
Marom and Arridge (12) studied the stress patterns of soft inter- layers on stainless steel inclusions. Reduction of stress concen- tration,at the interface was observed and an improvement in the ul- timate tensile strength was measured. However, Marom stated that optimization of this soft interlayer is necessary to prevent poor transverse properties. Hull, (13) wh
This effect was reported by Gatward and en they coated a flexibilized polyvinyl butyral polymer
onto g1as.s fiber and a decrease in transverse tensile properties was measured.
Taniguchi et al(9)incorporated a flexibilized epoxy at the in- terphase of a carbon fiber/epoxy composite and preliminary data showed improvement in flexural and shear strength. Kardoes et al(lO,ll) and Lavengood et al(l4) coated boron fibers and glass fibers with a low cross-linking density epoxy system to a thick, flexible inner- layer. Increase in mechanical properties, both moisture conditioned and unconditioned, were measured. A 1000% increase in torsional fatigue life was measured and Figure 5 shows the improvement of transverse properties of glass fiber/epoxy composites by incorpora- tion of a soft interphase.
9

L I I I I 1 -0069 .069 .69 6.9 69 69
Interface Modulus (GPa)
FIGURE 2. COMPOSITE STRENGTH AS A FUNCTION OF INTERFACE MODULUS*
20.7.
I .0069 .069 .69 6.9 69 69:
I Interface Modulus @Pa)
FIGURE 3. COMPOSITE MODULUS AS A FUNCTION OF INTERFACE MODULUS*
*From Broutman and Agarwal (Ref. 7) Reproduced by permission.
10

.0069 .069 .69 6.9 69 690 Interface Modulus (GPa)
FIGURE 4. COMPOSITE STRAIN ENERGY ABSORBED AS A FUNCTION OF INTERFACE MODULUS*
*From Broulman and Agarwal (Ref. 7). Reproduced by permission.
11

69-C
56.2
27.6
13.8
cl CONTROL
2 Hr. H,O BOIL
UNCOATEO INMRLAYEREO GLASS tjLASS
FIGURE 5. TRANSVERSE STRENGTH OF GLASS FIBER REINFORCED COMPOSITES BEFORE AND AFTER TWO HOURS IN BOILING WATER"
*From Lavengood and Micheno (Ref. 14). Reproduced by permission.
12

Riess et alc8) developed an interphase Cisoprene-b-(styrene-alt-maleic anhydride)]
material with poly- block copolymer:
CH I 3
[CH2 - C = CH - CH21nCCH2
(Isoprene) (SAW
According to the compatibility of the polymers, the polyiso- prene will agglomerate to form micellar structures at the inter- phase while the SAM block is mixed with the matrix resin to form a continuous phase. This inclusion of a second, elastomeric phase, is to relieve residual stress and to damp the elastic energy as discussed earlier. A proposed interphase structure is shown in Figure 6.
- PI SAM
FIGURE 6. MICELLE STRUCTURE OF THE COPOLYMER MICELLAR ADSORPTION*
*From Riess et al (Ref. 8). Reproduced by permission
This PI-SAM interphase material can couple to the carbon fiber surface through the dipole-dipole interaction sketched in Figure 7.
13
II...

FIGURE 7. FIXATION OF BLOCK COPOLYMERS ON CARBON FIBRES BY DIPOLE-DIPOLE BONDING*
The introduction of this "soft" interphase not only increased the shear strength of the composite, both unconditioned and con- ditioned in water at 50°C, but also improved the impact toughness. Some of these results are shown in Figures 8 and 9.
FIGURE 8. SHEAR STRENGTH OF COMPOSITES AFTER WATER TREATMENT AT 50'C*
0 RESIN
@ RESIN+ FIBRES
0 RESIN +GR.‘rFTED FIBRES
*From Riess et al. (Ref. 8). Reproduced by permission.
14

I SHEAR STRENGTH *
1 2 3 4 5 6 7 6 t$/fnm2
I RESILIENCE 1 *
O,I 0,~ 0.3 0,4 015 46 47 datirn’
FIGURE 8. SHEAR STRENGTH AND RESILIENCE OF: RESIN (EPOXY) RESIN + UNTREATED FIBRES RESIN + GRAFTED FIBRES*
*From Riess et al (Ref. 8). Reproduced by permission.
In reviewing the theoretical concepts together with the limited experimental data, a soft interphase between fiber and matrix clearly improves some of the composite properties. The objective of this report is to provide further understanding of the role of interphase in composite properties and to define guidelines and principles for the selection of optimal interphase materials to improve overall performance.
15

References to the Effec't of Interphase Properties on Composite Performance
( 1)
( 2)
( 3)
( 4)
( 5)
( 6)
( 7)
( 8)
( 9)
(10)
(11)
(12)
L. T. Drzal, M. J. Rich, D. L. Hall, "Structure-Property Relationships at the Composite Interphase," 15th Biennial Conf. on Carbon, Amer. Carbon Sot., June (1981).
. J. C. Goan, L. A. Joe and G. E. Sharpe, "Surface Treatment
for Graphite Fibers," Proc. 27th Ann. Tech. Conf. of SPI. Sec. 21-E (1972).
Kojiro Arai, Okayama; Noriaki Sugai, Fukuoka; "Treatment of Carbon Fibers," US Patent 4,130,465, Dec. 19 (1978).
D. J. Pinchin, R. T. Woodhams, "Pyrolytic Surface Treatment of Graphite Fibers," J. of Mat'l. Sci., 9 (1974), 300-306.
A. T. DiBenedetto and L. Nicolais, "Interfaces in Composites," Adv. in Comp. Mat'ls., G. Piatti, editor, Ch. 8, 153, Applied Sci. Publ., Ltd. (1978):
L. J. Broutman and B. D. Agarwal, "A Theoretical Study of the Effect of an Interfacial Layer on the Properties of Composites," Polym. Eng. SC Sci., 14, S, 581 (Aug. 1974).
L. J. Broutman and B. D. Agarwal, "A Theoretical Study of the Effect of the Interface on Composite Toughness," Proc. 28th Ann. Tech. Conf. SPI, 5-B (1973).
G. Riess and M. Bourdeaux, M. Brie and G. Jouquet, "Surface Treatment of Carbon Fibers with Alternating and Block Copolymers," Proc. 2nd Carbon Fibers Conf., The Plastics Institute, 52 (1974).
Itsuki Taniguchi, Ryuichi Hoh, Toshihiro Iwatsuki and Shiggehiro Ohuchi, "Resinous Composition for Surface- Treating Reinforcing Fibers and Surface Treating Process," US Patent 4,167,538, Sept. (1979).
L. D. Tryson and J. L. Kardos, "The Use of Ductile Inner- layers in Glass Fiber Reinforced Epoxies," Proc. 36th Ann. Tech. Conf., Reinforced Plastics/Composites 1 In- statute, SPI, 2-E (1981).
J. L. Kardos, "Composite Properties Enhancement via a Ductile Innerlayer, I' Critical Link In'terface Symposium at NY Polytech. Inst. (1980).
G. Marom and R. G. C. Arridge, "Stress Concentrations and Transverse Modes of Failure in Composites With a Soft Fiber Matrix Interlayer," Mat'l. Sci. and Eng., 23 - (1976) 23-32.
16

(13) C. Gatward and D. Hull, "Effect of Flexible Interface on Transverse Properties of Polyester-Glass Composite Materials," Pro-c. __ of the Reinforced Plastic Group Meeting on Interface: 5 in Composite. Materials (Ref. C283), Plastic snddubber Institute (1981).
(14) R. E. Lavengood and M. J. Michno, Jr., "The Effects of Thick Innerlayers on the Mechanical Performance of Fiber Reinforced Composites," SPE-EPS Division Tech. Conf., Additives --Their Effect on 'Process Parame.ters' and. Product 'Performance, Oct. 7-8, (1975).
17
ROLE OF INTERFACE/INTERPHASE IN COMPOSITE TOUGHNESS
Toughness in composite materials is not a well defined property. This is due in part to the difficulties in designing test methods to study the toughness of a multi-phased aniso- tropic material. In general, toughness is measured by the resistance of the material to crack growth and propagation. However, for multi-phase anisotropic materials, this is not totally representative.
An increasingly common method in toughness measurement is instrumented impact. This method utilizes a load cell mounted onto an impacter. The load cell is capable of recording load during impact in microseconds. A microprocessor then outputs a load deflection curve together with the energy absorption profile during the course of impact. The maximum force on the load deflection curve is taken as the required load for penetra- tion.
Due to the multi-phase characteristic of a composite, its toughness can be improved in several ways. A toughened matrix and/or a higher strain fiber are both capable of'increasing the toughness of a composite. Although little is known about the interface and interphase, it has the potential to significantly influence the toughness of composites.
The interface can affect the toughness of a composite by providing various energy absorbing mechanisms like debonding, fiber stress relaxation and fiber pullout during, fracture. In the case of weak interfacial bonds, debonding takes place in advance of the crack tip. The degree of debonding, as well as the energy absorbed due to the debonding process, depends largely upon the interfacial bond strength. In the opposite case of strong interfacial bonds, fibers will break prior to debonding and energy is absorbed due to stress relaxation at the ends of the broken fibers. Furthermore, energy is also absorbed due to some fiber pullout which is related to the strength of interfacial bonds. When all of these energies are accounted for, it is expected that the weak interfacial bond will provide very high fracture toughness in composites. observed by many workers.(1-4)
This phenomenon has been
However, by tailoring the interphase properties, a signifi- cant improvement in composite toughness can be obtained without a severe loss of mechanical properties due to weak interfacial bond strength. Broutman et al(S-7) have analytically demonstrated that interphase properties can be tailored to obtain both toughness and strength. In general, a softer material at the interphase is preferred.
Plueddemann(8) incorporated a rubber interphase in glass/ epoxy composites. Improved toughness together with relatively good adhesion strength was obtained. Hancox and Wells(g) coated different amounts of silicone rubber at the surface of carbon
18

fibers. A 107% increase in work of fracture without measurable decrease in flexural strength was determined with 1% by weight silicone rubber.at the interphase of a carbon fiber/epoxy com- posite. Williams(l0) polymerized polyvinylalcohol and polysul- fone onto carbon fiber and enhancement in shear strength, notched fracture toughness and low-velocity impact toughness were achieved. Subramanian and Jakubowski(l1) coated carbon fibers with various kinds of polymers by electropolymerization and demonstrated that impact toughness and shear strength can simultaneously increase when optimum interphase properties were incorporated.
In addition to the mechanical properties of the interphase, the physical thickness of the interphase is another critical parameter that needs to be optimized in order to achieve the ultimate properties of composite materials. As discussed by Han- cox and Wells,(g) when silicone rubber exceeded the 1% by weight level, a dramatic decrease in flexural strength was observed. Similar observations were also reported by Cavano and Winters(l2) and Peiffer.(l3)
Another approach was taken by Atkins(l4) where intermittent bonding along the fiber surface was suggested. The weakly bonded sections allow debonding and fiber pullout during fracture while the strongly bonded areas enable load transfer. The combination of these could then simultaneously provide high fracture toughness and good tensile strength. Furthermore, Reiss et al(lS) incorpor- ated a two-phase block copolymer, polyisoprene-polystyrene-maleic anhydride, at the interphase. Where the polyisoprene is providing the energy absorbing characteristic and the stryene-maleic anhy- dride block (SAM) is enhancing the compatibility and joint strength of the fiber with the matrix, increases in shear strength and toughness were both measured. In addition, this tailored interphase enhanced the moisture-conditioned shear strength.
In view of the results discussed above, composite toughness can be increased without accompanying degradation of the remain- ing mechanical properties. This can be achieved by proper selec- tion of interphase properties, such as transition temperature, modulus, strength, etc. and the physical characteristics such as the quantity and thickness of this interphase.
19

References to the Role of Interface/Interphase in Composite Toughness
( 1)
( 2)
( 3)
( 4)
( 5)
( 6)
( 7)
( 8)
( 9)
(10)
(11)
(12)
P. K. Mallick and L. J. Broutman, "The Influence on the Fracture Toughness of Low Aspect Ratio Fiber Composites," Proc. 29th Ann. Tech. Conf. of SPI, Sec. 13-B (1974).
M. G. Bader, J. E, Bailey and I. Bell, "The Effect of Fiber- Matrix Interface Strength on the Impact and Fracture Properties of Carbon-Fiber-Reinforced Epoxy Resin Com- posites," .J. Phys: D: Appl. Phys., 5 (1973), 572.
D. G. Pires, C. E. Fong, J. F. Mandell and F. J. McGarry, "Fiber/Matrix Interaction Effects on Fracture Toughness of Structural Composites," DTIC, AMMRC-CTR-75-15, (1975).
T. Jones, N. P. Suh and N. H. Sung, "A Method of Improving the Fracture Toughness of Fiber Reinforced Composites," MIT Reports, Dept. of Mech. Eng., MIT-Industry Polymer Processing Program.
P. Yeung and L. J. Broutman, "The Effect of Glass-Resin Inter- face Strength on the Impact Strength of Fiber Reinforced Plastics, )I Pr.o'c. 32nd Ann. Te'ch. Co'n'f'.' 'of SPI, 9-B (1977) .
L. J. Broutman and B. D. Agarwal, "A Theoretical Study of the Effect of an Interfacial Layer on the Properties of Com- posites," Polym. Eng & Sci.', 14, S Aug. (1974), 581.
L. J. Broutman Effect of
and B. D. Agarwal, "A Theoretical Study of the the Interface on Composite Toughness," Proc.
28.th Ann. Tec'h. Conf. of SPI, 5-B (1973).
E. P. Plueddeman, "Bonding Rigid Polymers to Mineral Surfaces Through a Rubbery Interface," Proc. 29th Ann. Tech. Conf. of SPI, 24-A (1974).
N. L. Hancox and H. Wells, "The Effects of Fiber Surface Coat- ings on the Mechanical Properties of CFRP," Fiber Sci. 'and 'Tec'h., ‘10 (1977), 9. -
J. H. Williams, Jr., "Improvement of Composite Fracture Toughness by Fusible Fibers and Coatings," NTIS N77- 71276 (1976).
R. V. Subramanian and J. J. Jakubowski, "Electropolymeriza- tion on Carbon Fibers --Effect on Composite Properties," Polym. Research Sec. Mat'l. Sci. and Eng. Dept., Wash- ington State Univ. Research Report.
P. J. Cavano and W. E. Winters, "Composite Impact Strength Im- provement Through a Fiber/Matrix Interphase," NTIS N76- 13221, 1975.
20

(13) D. G. Peiffer, "Impact Strength of Thick-Interlaper Composites," J. '0.f. 'App.1: po'lym'. Sci., ‘24 (1979), 1451-5. -
(14) A. G. Atkins, "Intermittent Bonding for High Toughness/High Strength Composites,"' 'J.' 'of Mat'l'. Sc'i.,' 10 (1975), 819-832.
-
(15) G. Reiss, M. Bourdeaux, M. Brie and G. Joupuet, "Surface Treat- ment--of Carbon Fibers with Alternating and Block Copolymers," .Proc'. 2n.d Carbon 'Fibe'r's Conf . , The Plastics Institute (1974), 52.
21
l-
EFFECT OF MOISTURE ON THE CARBON FIBER/EPOXY INTERFACE AND INTERPHASE
Moisture is usually found on all solid surfaces and water molecules are usually the. inhibitors/c.ontaminants for adhesive bonding. Water is generally attracted and adsorbed onto the sur- face of solids through 'hydrogen bonding to the 'surface 'hydroxyl groups. The water molecules are normally one 'or two monolayers deep on the solid surface but this is enough to induce stress corrosion and assist crack propagation.
Evidence of adsorbed water molecules at glass fiber/epoxy interfaces has been shown and its detrimental effect on composite properties were discussed by Bascom.(l) According to Bascom, water molecules are attracted by the highly concentrated surface hydroxyl groups on the glass fibers and the reduction in composite properties are due to stress corrosion at the interface as well as in the bulk matrix.
Although carbon fibers also contain many functional groups on their surfaces, moisture has a smaller effect on carbon/epoxy composites. According to Gauche1 and Nash,'(,2) only minor reduc- tions in composite properties are obseryed after long-term exposure to water (12 months). Furthermore, these property reductions were primarily due to the plasticization effect of water on the epoxy matrix. Springer and Loos, (3) and Augl(4r5) showed that by characterizing effects of moisture;on epoxy matrix properties, the moisture effect on carbon/epoxy composites performance can be predicted with a high degree of confidence. In other words, com- posite performance reduction is primarily due to bulk matrix plasticization.
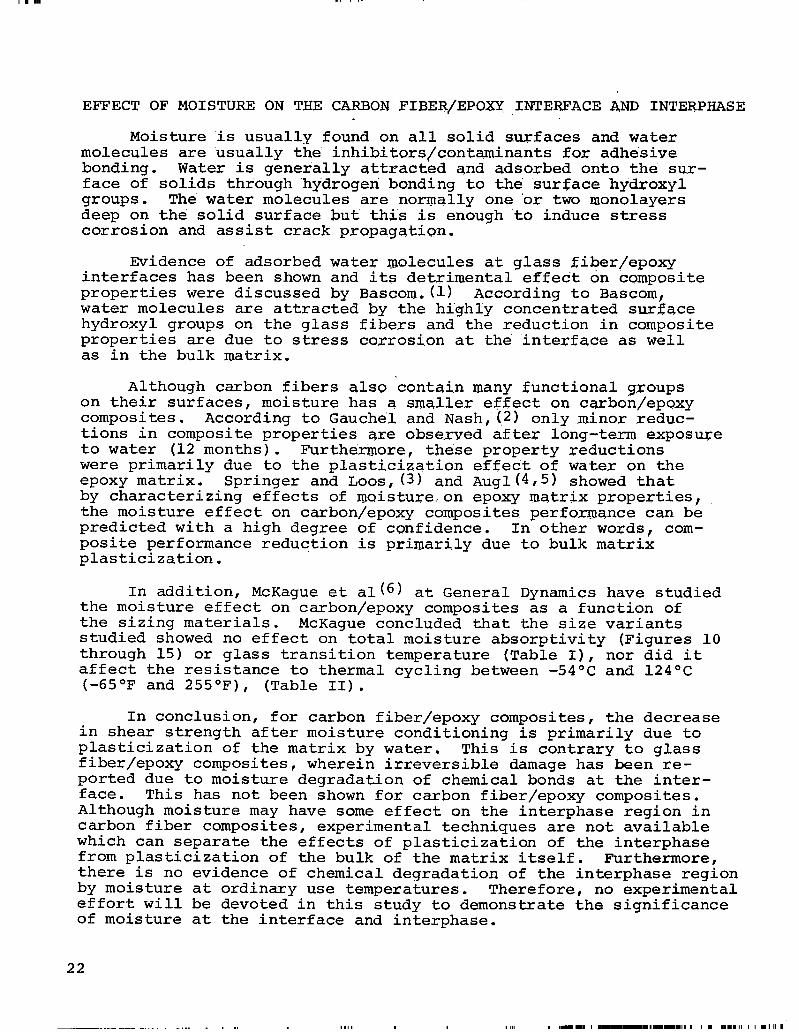
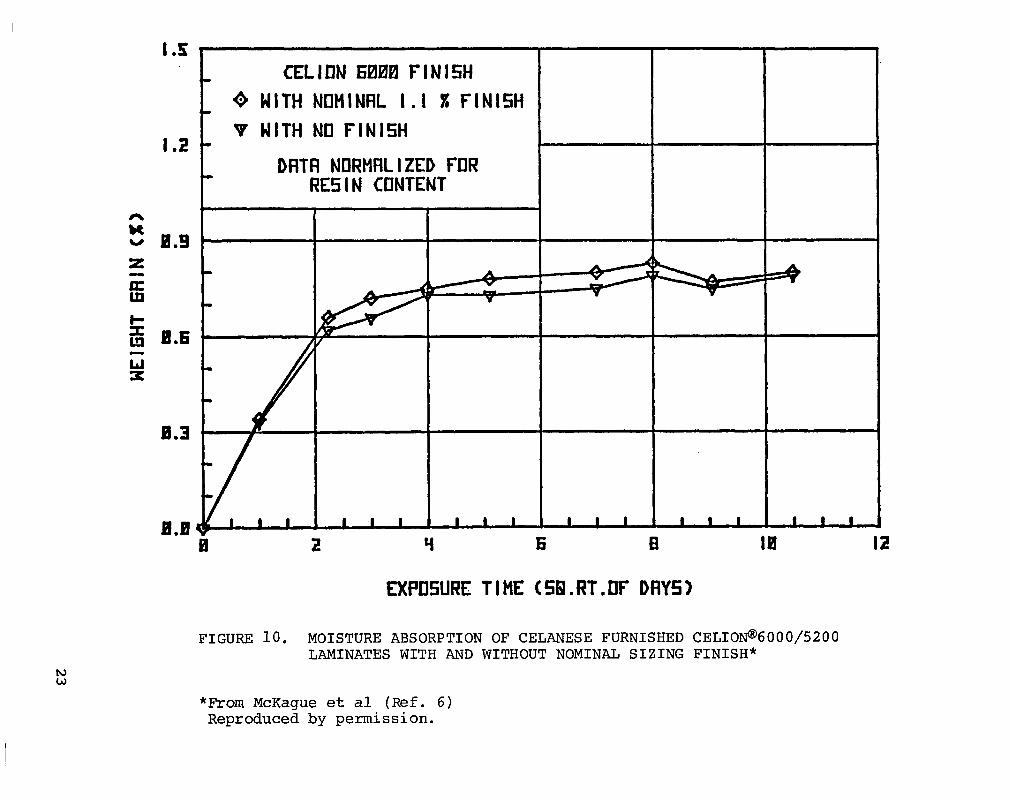
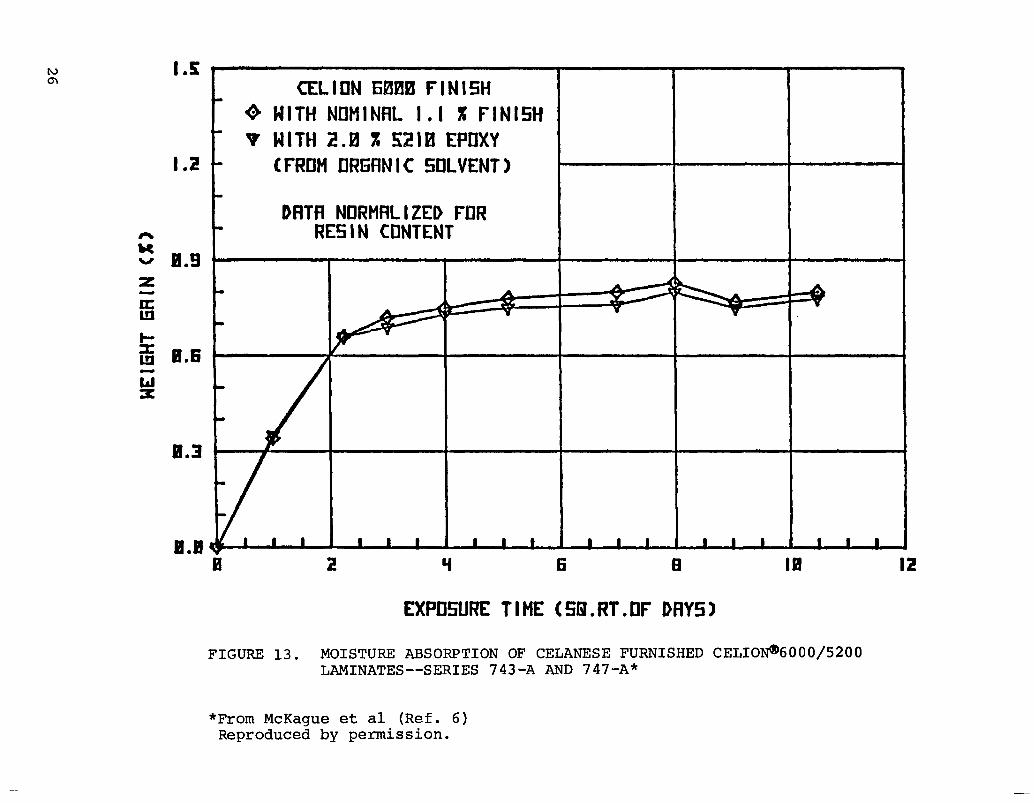
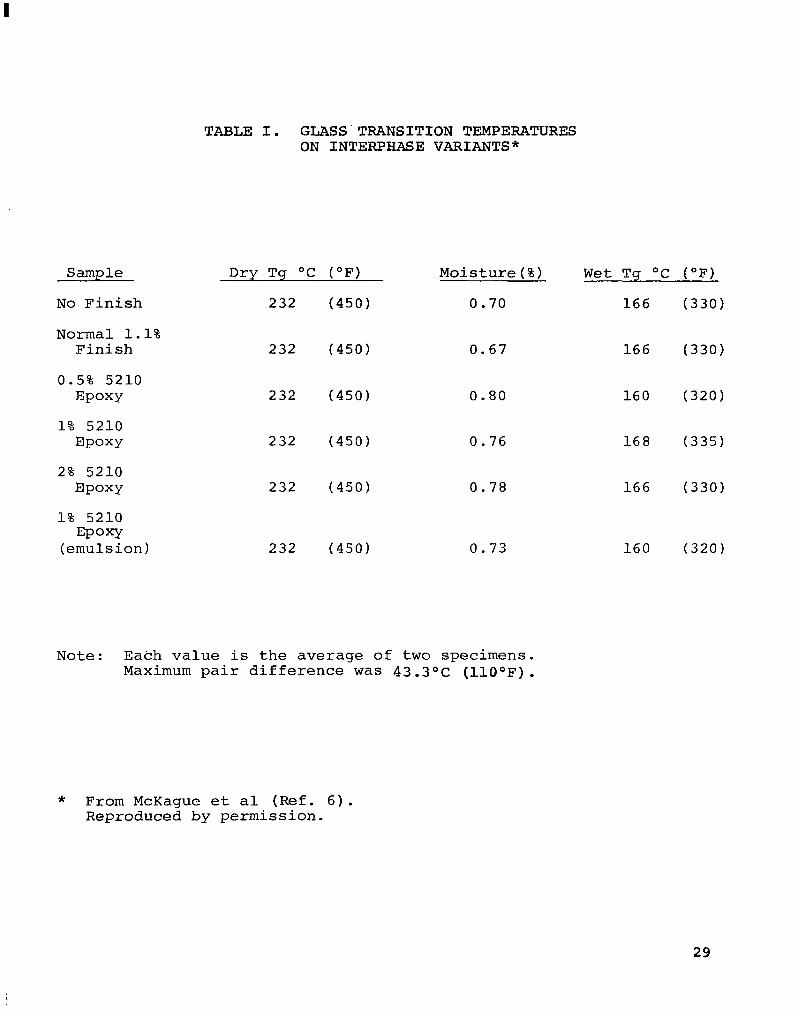
In addition, McKague et al(6) at General Dynamics have studied the moisture effect on carbon/epoxy composites as a function of the sizing materials. McKague concluded that the size variants studied showed no effect on total moisture absorptivity (Figures 10 through 15) or glass transition temperature (Table I), nor did it affect the resistance to thermal cycling between -54OC and 124OC (-65OF and 255OF), (Table II).
In conclusion, for carbon fiber/epoxy composites, the decrease in shear strength after moisture conditioning is primarily due to plasticization of the matrix by water. fiber/epoxy composites,
This is contrary to glass wherein irreversible damage has been re-
ported due to moisture degradation of chemical bonds at the inter- face. This has not been shown for carbon fiber/epoxy composites. Although moisture may have some effect on the interphase region in carbon fiber composites, experimental techniques are not available which can separate the effects of plasticization of the interphase from plasticization of the bulk of the matrix itself. Furthermore, there is no evidence of chemical degradation of the interphase region by moisture at ordinary use temperatures. Therefore, no experimental effort will be devoted in this study to demonstrate the significance of moisture at the interface and interphase.
22
~ ._._.- --- -.... . . . . . . . .
I.S ’ CELKJN 6000 FINlfiH
+ WITH NDMINRL I.1 X FINISH V WITH Nil FINl5H
I.2 - DRTfl NORMRLIZED FDR m
RESIN CONTENT
0.9
EXPDEiURE TIME C58.RT.DF DRY51
FIGURE 10. MOISTURE ABSORPTION OF CELANESE FURNISHED CELION@6000/5200 LAMINATES WITH AND WITHOUT NOMINAL SIZING FINISH*
*From McKague et al (Ref. 6) Reproduced by permission.
CELION 6550 FINI5H + WITH NtJMlNRL I.1 X FINISH v WITH 0.5 X St10 EPIIXY
CFRUM llRGRNlC SOLVENT?
DFlTA NIIRMRLIZED FIJR RESIN CONTENT
EXPlISURE TIME CSB.f?T.DF DflYS)
FIGURE 11. MOISTURE ABSORPTION OF CELANESE FURNISHED CELIOI@6000/5200 LAMINATES--SERIES 743-A AND 115-A SIZING*
*From McKague et al (Ref. 6) Reproduced by permission.

IS l
CELKlN 6000 FINlfiH + WITH NnMlNRL I.1 X FINl5H
- v WITH 1.0 X 5210 EPQXY I.2 - CFRllM QRGRNIC SDLVENT)
8.6
0.3
0.0
.DATR NDRMRL I ZED F’DR REEilN CONTENT
I I I I I I I I I . 0 Y 6 I3 10 I2
EXf’llSURE TIME CSB.RT.llF DftY5)
FIGURE 12. MOISTURE ABSORPTION OF CELANESE FURNISHED CELION@f5000/5200 LAMINATES--SERIES 743-A AND 101-A SIZING*
*From McKague et al (Ref. 6) Reproduced by permission.
N cn IS 1 CELIUN 6000 FINl5H
6 WITH NQMINRL 1.1 X FlNl5l-l - V WITH 2.0 X !i%l0 EPQXY
I.2 - [FROM llRGflNlC SlItVENT)
DRTfl NDRMRLIZED FUR RESIN CONTENT
EXPIISURE TIME CSQ.f?T.flF DflY51
FIGURE 13. MOISTURE ABSORPTION OF CELANESE FURNISHED CELION@6000/5200 LAMINATES--SERIES 743-A AND 747-A*
*From McKague et al (Ref. 6) Reproduced by permission.
I .!i
I .2
CELltIN 6000 FlNl5H + WITH NllMlNflL I. I. % FlNl5H v WITH I.0 X ZZl0 EPUXY
t
CFRIIM flQUEOll5 EMULSIDN) I
t
Dflffl NORMRLIZED FOR RESIN CDNTENT
I I I
Y 6 E
EXPll5URE TIME (58.RT.tlF DflY5)
I0 IZ
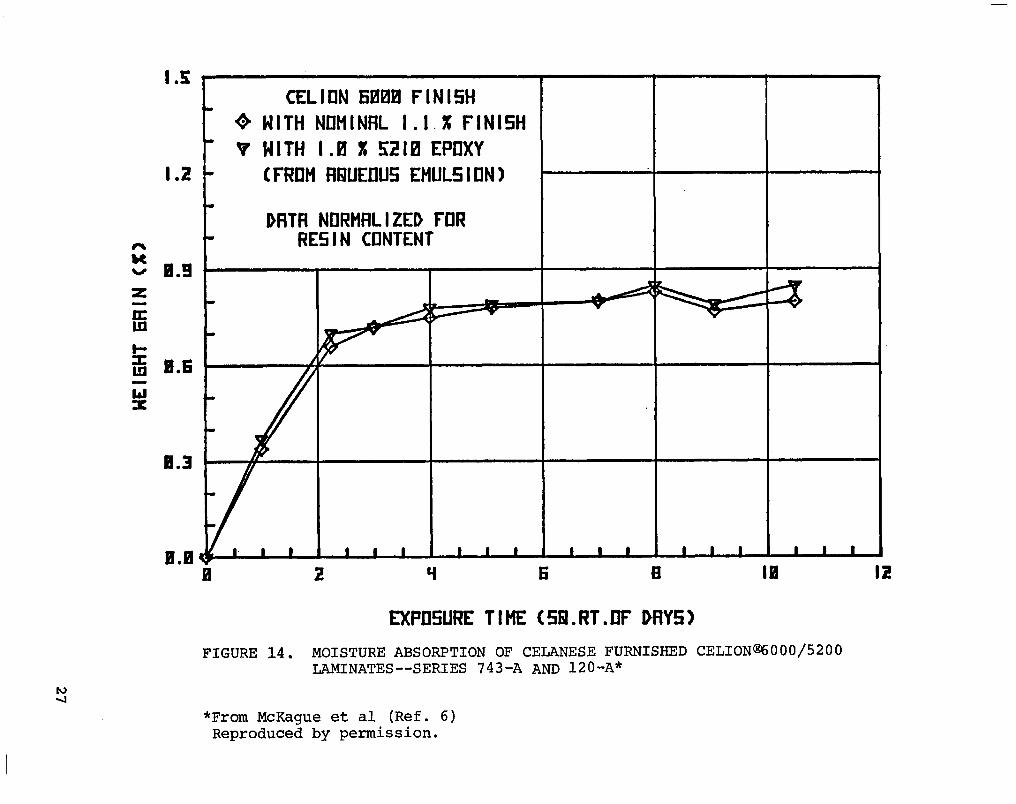
FIGURE 14. MOISTURE ABSORPTION OF CELANESE FURNISHED CELION@6000/5200 IAMINATES--SERIES 743-A AND 120-A*
*From McKague et al (Ref. 6) Reproduced by permission.
v WITH Nil FINISH 0 WITH NIIMINAL I.1 X FlNl5H fit WITH 2.0 X SZl0 EPIIXY
(FROM IIRGRNIC SlILVENT)
DRTfl NIIRMflLlZED FDR
2 Y 6 El IRJ I2
EXPIlfiURE TIME CliQ.RT.IJF DAY51
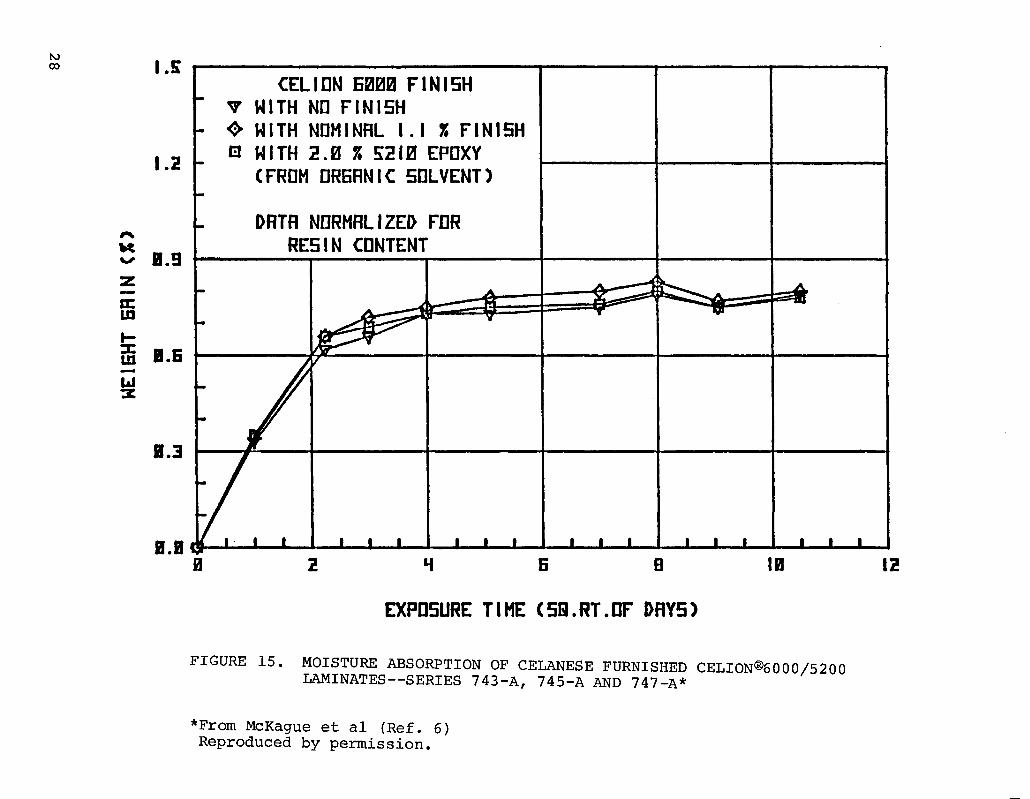
FIGURE 15. MOISTURE ABSORPTION OF CELANESE FURNISHED CELION@6000/5200 LAMINATES--SERIES 743-A, 745-A AND 747-A*
*From McKague et al (Ref. 6) Reproduced by permission.
Sample
No Finish
Normal 1.1% Finish
0.5% 5210 Epoxy
1% 5210 EPOXY
2% 5210 BPoxY
1% 5210 Epoxy
(emulsion)
TABLE I. GLASS TRANSITION TEMPERATURES ON INTERPHASE VARIANTS*
Dry Tg OC (OF) Moisture(%) Wet Tq OC (OF)
232 (450) 0.70 166 (330)
232 (450) 0.67 166 (330)
232 (450) 0.80 160 (320)
232 (450) 0.76 168 (335)
232 (450) 0.78 166 (330)
232 (450) 0.73 160 (320)
Note: Each value is the average of two specimens. Maximum pair difference was 43.30~ (1100F).
* From McKague et al (Ref. 6). Reproduced by permission.
29

TABLE II. THERMAL CYCLING DATA*
‘0.0‘ F.le.mr:a:l’ .pr.op’e’r.t-‘e s
Strength
Sample Uncycled
MPa ksi - -
No Finish 1931 280
Normal 1.1% Finish
1869 271
0.5% 5210 Epoxy
1876 272
1% 5210 EPOXY
1897 275
2% 5210 Epoxy
1841 267
1% 5210 Epoxy (Emulsion)
1938 281
Cycled MPa ksi - e
1924 279
1952 283
1897 275
1938 281
1814 263
1986 288
Modulus
Uncycled Cycled GPa Msi GPa Msf - - P -
142.1 20.6 144.8 21.0
140.7 20.4 144.8 21.0
138.6 20.1 136.6 19.8
135.2 19.6 138.6 20.1
131.0 19.0 132.4 19.2
142.1 20.6 139.3 20.2
*From McKague et al. (Ref. 6). Reproduced by permission.
30
Reference's to Ef.fect of Moisture. 'on the' Carbon Fiber/Epoxy Interface -e -.- __
( 1)
( 2)
( 3)
( 4)
( 5)
( 6)
W. D. Bascom, "Water at-the Interface," Proc. 25th Ann. Tech. Conif'. of' SPI, 13-C (1970) .
J. V. Gauche1 and H. C. Nash, "The Effect of Long-Term Water Immersion on the Fracture Toughness, Strength and Modulus of Graphite-Epoxy Composites," Organic Chemistry Branch, Chemistry Division, Naval Research Laboratory, Wash. DC 20375.
G. S. Springer and A. C. Loos, "Moisture Absorption of Epoxy Matrix Composites Immersed in Liquids and in Humid Air," AFML-TR-79-4175, Final Report, (1979).
J. M. Augl, "Prediction and Verification of Moisture Effects on Carbon Fiber-Epoxy Composites," NSWC-TR-79-43, (1979).
J. M. Augl and A. E. Berger, "The Effect of Moisture on Carbon Fiber Reinforced Composites," NSWC/NOL-TR-77-61 (1977).
L. McKague, J. Fruit and J. Reynolds, "Tests of Graphite Fiber Sizing Effects Upon Laminate Properties,"' SAMP'E J, Nov- Dee, (1979) 6-11.
31
ADHESION THEO.RY
Adhesion, in physical chemistry, is the force of attraction between a solid surface and a second phase. The second phase can be a solid or a liquid. Adhesion leads to sorption, which may be adsorption on a surface or adsorption into a surface layer. Ad- hesion can be due to electrostatic forces, to van der Waals forces or to "chemical" valence forces. In the latter case, one speaks of "chemisorption." The magnitude of the adhesive forces is derived from equilibrium measurements of adsorption energies by thermodynamic methods.
In adhesion technology, only the interaction between a solid surface and a second liquid or solid phase is termed adhesion. The technical process of producing adhesion between two solids is called adhesive bonding. The bonded system is not necessary in a thermo- dynamic equilibrium; frequently the bonding process is irreversible. Therefore, surface interactions cannot be separated experimentally from bulk properties of the system.
In addition, the state of fundamental knowledge concerning the nature of the forces of attraction between bodies, determination of the magnitude of such intrinsic forces, and their relation to measured adhesive joint strengths undoubtedly lags behind state-of-the-art applied technology. One of the main reasons why developing theory has followed behind technology is that the science of adhesion is a truly multi-disciplined subject. The adhesion scientist often needs to consider aspects of surface chemistry and physics, chemistry, polymer chemistry, polymer physics, rheology, stress analysis and fracture phenomena to interpret his data fully.
The mechanisms of adhesion are still not fully understood and many theories are to be found in the current literature. Much of present confusion results from the fact that test methods commonly employed to measure the strengths of adhesive joints are not well suited to theoretical analysis. They introduce geometrical factors and loading factors which are difficult to analyze, and the measured joint strength includes indeterminate contributions from rheological energy losses in the adhesives and substrate. Thus, although the intrinsic adhesion forces acting across the adhesive/substrate inter- face may affect joint strength they are usually completely obscured by other contributions, and information concerning the magnitude of such forces may only be indirectly obtained. This inability to measure the interfacial interactions has been the main obstacle to the development of a comprehensive theory of adhesion.
32

The four principal mechanisms of adhesion which have been pro- posed and widely discussed are:
1. Mechanical Interlocking 2. Diffusion Theory 3. Electronic Theory 4. Adsorption Theory
These are discussed in the following paragraphs.
Mechanical Interlocking
This theory proposes that mechanical keying or interlocking of the adhesive into the irregularities of the substrate surface is the major source of intrinsic adhesion. Much work(1-7) in this area has shown the importance of surface topography/rugosity in intrinsic adhesion forces. However, the observed increase in measured joint strength with increasing surface rugosity may be attributable to other mechanisms.
Diffusion Theory
The diffusion theory of adhesion is based upon the intrinsic adhesion of high polymers to themselves (autohesion), and to each other, due to the mutual diffusion of polymer molecules across the interface. This requires that the macromolecules or chain segments of the polymers (adhesive and substrate) possess sufficient mobility and are mutually soluble, that is, they possess similar values of the solubility parameter. The solubility parameter, 6, is defined by
AHV - RT' 6 = (1)
V
where
AHV = molar heat of vaporization R = gas constant T = temperature (OK) V = molar volume
Voyutskii(8) and others(g'13) ha ve presented the evidence of molecular diffusion and their significant contributions to the in- trinsic adhesion. However, with polymer systems which are highly crosslinked and have a high degree of crystallinity, diffusion theory is not likely to be the principal mechanism of adhesion.
33

Electronic Theory
The electronic theory of adhesion arises from the different electronic bond structures of the adhesive and the substrate which cause some electron transfer on contact to balance Fermi levels. This will result in the formation of a double layer of electrical charge at the interface which contributes to the intrinsic adhesion. This theor
(1%24) was proposed by Deryaguin(14-16) and supported by other
workers. However, the arguments were not strong enough to show its significant contribution to the intrinsic adhesion. None- theless, surface electronic states should not be overlooked.
Adsorotion Theorv
The adsorption theory of adhesion is by far the most generally accepted theory and has been discussed in depth by many authors!25-28). This theory proposes, provided that sufficiently intimate inter- molecular contact is achieved at the interface, that materials will adhere because of the surface forces acting between the atoms in the two surfaces. The most common of such forces are the van der Waals forces (secondary bonds). In addition, chemisorption may well occur and thus ionic, covalent and metallic bonds may operate across the interface (primary bonds).
The thermodynamic work of adhesion required to separate a unit area of two phases forming an interface, WA, may be related to the surface free energies by the Young-Dutire equation.(2g) In the absence of chemisorption and inter-diffusion, the reversible work of adhesion, WA, in an inert medium may be expressed by
WA = Y1 + Y2 - y12 (2)
where
Yl = surface free energy of phase 1
Y2 = surface free energy of phase 2
y12.= interfacial free energy between the phases
This equation only applies to a solid/liquid or liquid/liquid inter- face. However, by assuming that the surface energy of a liquid does not change significantly where it solidifies isothermally and ignoring the shrinking stresses, it may be applied to solid adhesives/ substrate interfaces.
Dukest30) and others(31-34) ha ve been trying to correlate measured strengths of adhesive joints with the thermodynamic work of adhesion, WA. However, only some of the authors have confirmed correlations while others have found no correlations at all. The major cause of this conflict arises from the use of test methods for
34
measuring the strengths of adhesive joints which are not well suited to theoretical analysis. Moreover, correlation can only be expected when the locus of joint failure is purely interfacial. Therefore, even though the thermodynamic work of adhesion affects joint strength, it is often obscured by other contributions.
Although it has been shown that secondary bonding forces alone can give rise to acceptable joint strengths at the interface, many adhesion scientists believe that the additional presence of primary bonding can increase the joint strength and is certainly a must for establishing environmentally stable interfaces. Evidence of the presence of primary interfacialy bonding has been shown via the use of sophisticated,
M-8
surface-speciftsS1analytical tech- niques such as L ser-Raman spectroscopy, .spectroscopy,
x-ray(r@W~le~2~on secondary-ion mass spectroscopy,
attenuated total reflectance infra-red spectroscopy.(3g)
It was recognized by adhesion scientists that the establish- ment of an intimate molecular contact at the interface is a necessary, though sometimes insufficient, requirement for developing strong ad- hesive joints. In other words, the adhesive needs to be able to be spread over the solid substrate surface and needs to displace air and any other contaminants that may be present on the surface. Ideally, an adhesive should conform to the following conditions: (40)
1.
2.
Adhesives in the liquid state must exhibit a zero or near-zero contact angle with the solid substrate.
The adhesive should have a relatively low viscosity (a few centipoises) at some time during the bonding opera- tion.
3. The adhesive should be brought together with the sub- strate at a rate and in a manner that will promote the displacement of any trapped air at the interface.
In order to assess the ability of a given adhesive/substrate combination to meet these criteria, it is necessary to consider wetting equilibria, to ascertain values of the surface free energies of the adhesive and substrate and the free energy of the adhesive/ substrate interface. In addition', the kinetics of the wetting process should also be examined.
35
111 mm I I I I I , , , , , , ,,,, . . , . , , , ,, . . ..-- ___.._ . . . .,, . ._- ._~-
Ref.erences to' Adhesion The.ory
( 1)
( 2)
( 3)
( 4)
( 5)
( 6)
( 7)
( 8)
( 9)
(10)
(11)
(12)
(13)
(14)
E. M. Borroff and W. C. Wake, "Adhesion of Rubber to Textiles," Trans. Institute of the..,Rubber Industry, 25 (1949) 190.
W. C. Wake, "Adhesion and the Formulation of Adhesives," Applied Science Publishers, London, (1976).
D. E. Packham, K. Bright and B. W. Malpass, "Mechanical Factors in the Adhesion of Polyethylene to Aluminium," J. Appl. Po'ly. 'Sci. ; '18 -' (1974) 3237.
J. R. Evans and D. E. Packham, "Adhesion-l," K. W. Allen, editor, Applied Science Publishers, London, (1977).
C. W. Jennings, "Surface Preparation for Adhesive Bonding," Appl. Polymer Sympos., 19 (1972), 49. -
W. D. Bascom, C. 0. Timmons and R. L. Jones, "Apparent Inter- facial Failure in. Mired-Mode Adhesive Fracture," J. Mat'l.
10, Sci., (1975) 1037.
D. R. Mulville and R. Vaishnav, "Interfacial Crack Propagation," J. Adhesion, 1 (1975), 215.
S. S. Voyutskii, "Autohesion and Adhesion of High Polymers," John Wiley and Sons, New York, (1963).
J. N. Anand and H. J. Karam, "Interfacial Contact and Bonding in Autohesion,"“J.' Adhesion, 1. (1969), 16.
R. M. Vasenin, "Adhesion, Fundamentals and Practice," McLaren and Son, London, (1969).
R. P. Campion, "The Influence of Structure on Autohesion (Self- Tack) and Other Forms of Diffusion into Polymers," J. Ad- hesion, L (1975), 1.
F. Bueche, W. M. Cashin and P. Debye, "The Measurement of Self Diffusion in Solid Polymers," J. Chem. Phys., 20 (1952), - 1956.
W. V. Titow, "Adhesion 2," K. W. Allen, editor, Applied Science Publishers, London, (1978).
B. V. Deryaguin, "Theory of Heterocoagulation, Interaction and Mutual Adhesion of Different Particles in Electrolytic Solutions," Research, 8 (1955), 70.
36

(15)
(16)
(17)
(18)
(19)
(20)
(21)
(22)
(23)
(24)
(25)
(26)
B. V. Deryaguin, N. A. Krotova, V. V. Karassev, Y. M. Kivillova and I. N. Aleinikova, "Proceedings of the 2nd International Congress on Surface Activity III," Butterworths, London, (1957) 417.
B. V. Deryaguin and V. P. Smilga, "Adhesion, Fundamentals and Practice;" McLaren and Son, London, (1969) 152.
C. L. Weidner, "Pressure-Sensitive Adhesive Compounds from Rubber, Tackifying Resins, Polyamines and Peroxides," 'Adhesive 'Age, 5 (7) (1963), 30.
S. M. Skinner, R. L. Savage and J. E. Rutzler, "Electrical Phenomena in Adhesion, I, Electron Atmospheres in Di- electrics," J. Appl. Phys., 24 (1953), 439. -
H. Graf von Harrach and B. N. Chapman, "Charge Effects in Thin Film Adhesion," Thin Solid Films, 13 (1972), 157. -
C. Weaver, "Aspects of Adhesion 5," D. J. Alner, editor, University of London Press, London (1969).
C. Weaver, "Adhesion of Metals to Polymers," Faraday Special Discussions, 2 (1972), 18.
B. N. Chapman, "Aspects of Adhesion 6," D. J. Alner, editor, University of London Press, London (1970).
J. Oroshnik and W. K. Croll, "Adhesion Measurements of Thin Films, Thick Films and Bulk Coating," K. L. Mittal, editor, Amer. Sot. Testing Materials, Special Tech. Publication 640 (1977), 158.
C. T. H. Stoddart, D. R. Clarke and C. J. Robbie, "Thin Film Adhesion: Effect of Glow Discharge on Substrate," J. Ad- hesion, 2 (1970), 270.
C. Kemball, "Adhesion," D. D, Eley, editor, Oxford University Press, London (1961), 19.
J. R. Huntsberger, "Treatise on Adhesion and Adhesives," Vol. 1, R. L. Patrick, editor, Marcel Dekker, New York (1967).
(27). A. J. Staverman, "Adhesion and Adhesives," Vol. 1, R. Houwink and G. Salmon, editors, Elsevier, Amsterdam (1965).
(28) W. C. Wake, "Reinforcement and Filler Structure in Rubbers," 'Roy.al Inst'itu.te' of Chemistry Lecture ,Se:ri'es: ,4 (1966) , 1.
(29) T. Young, "Miscellaneous, Works,"' Tr'ans: Roy.' Sot., 95, (1805), - 65.
37
(30) W. A. Dukes and A. J. Kinlock, "Developments in Adhesives 1," W. C. Wake, editor, Applied Science Publishers, London (1977).
(31) K. L. Mittal, "Adhesion'science and Technology," L. H. Lee, editor, Plenum Press, New York (1975).
(32) M. Levine, G. Ilkka and P. Weiss, "Adhesion and Adhesives; Effects of Surface Energetics," J. Polym. Sci., B2 (1964), 215.
(33) D. H. Kaelble, "Peel Adhesion: Influence of Surface Energies and Adhesive Rheology," J. Adhesion, 1 (1969), 102.
(34) C. A. Dahlquist, "Adhesion," ASTM, STP 360 (1974), 46.
(35) J. L. Koenig and P. T. K. Shih, "Ramon Studies of the Glass Fibers-Silane-Resin Interface,' J. Colloid Interf. Sci., 36 (1971), 247. -
(36) R. Bailey and J. Castle, "XPS Study of the Adsorption of Ethoxysilanes on Iron," J. Mat'l. Sci., 12 (1977), 2049. -
(37) M. Gettings and A. J. Kinlock, "Surface Analysis of Poly- siloxane/Metal Oxide Interfaces," Surface 'Interference Analysis,. 1 (1980), 189.
(38) M. Gettings and A. J. Kinlock, "Surface Characterization and Adhesive Bonding of Stainless Steels. II. The Steel/Ad- hesive Interface, " Sur.face Interfere'nce Analysis, 1 (1980) , 189.
(39) S. Crisp, H. J. Prosser and A. D. Wilson, "An Infra-red Spectroscopic Study of Cement Formation Between Metal Oxides and Aqueous Solutions of Poly(acrylic acid)," J. Mat'l. Sci., 11 (1976), 36. -
(40) W. D. Bascom and R. L. Patrick, "The Surface Chemistry of Bonding Metals with Polymer Adhesives," Adhesive Age, 17 (10). -
38
WETTING PHENOMENA
Surface tension is a direct measurement of intermolecular forces. The tension in surface layers is due to the attraction forces exerted on the surface molecules by the bulk material. This internal attraction force leads to a reduced number of molecules at the surface which result in an increased intermolecular distance. This increase in intermolecular distance requires external work to be done which explains why surface tension/surface free energy exist.
The most common type of physical surface attractive forces are van der Waals forces which can be attributed to: (a) dispersion (London-d) forces arising from internal electron motions which are independent of dipole moments and; (b) polar (Keesom-p) forces aris- ing from the orientation of permanent electric dipoles and the in- duction effect of permanent dipoles or polarizable molecules. The dispersion forces are usually weaker than the polar forces but they are universal and all materials exhibit them.
Another type of force that may operate is the hydrogen bond. Hydrogen bonding is the attraction between a hydrogen atom and a second, small and strongly electronegative atom such as fluorine, oxygen or nitrogen. A secondary bond is actually formed between the hydrogen atom and the electronegative (host) atom through an electron-pair on the host species.
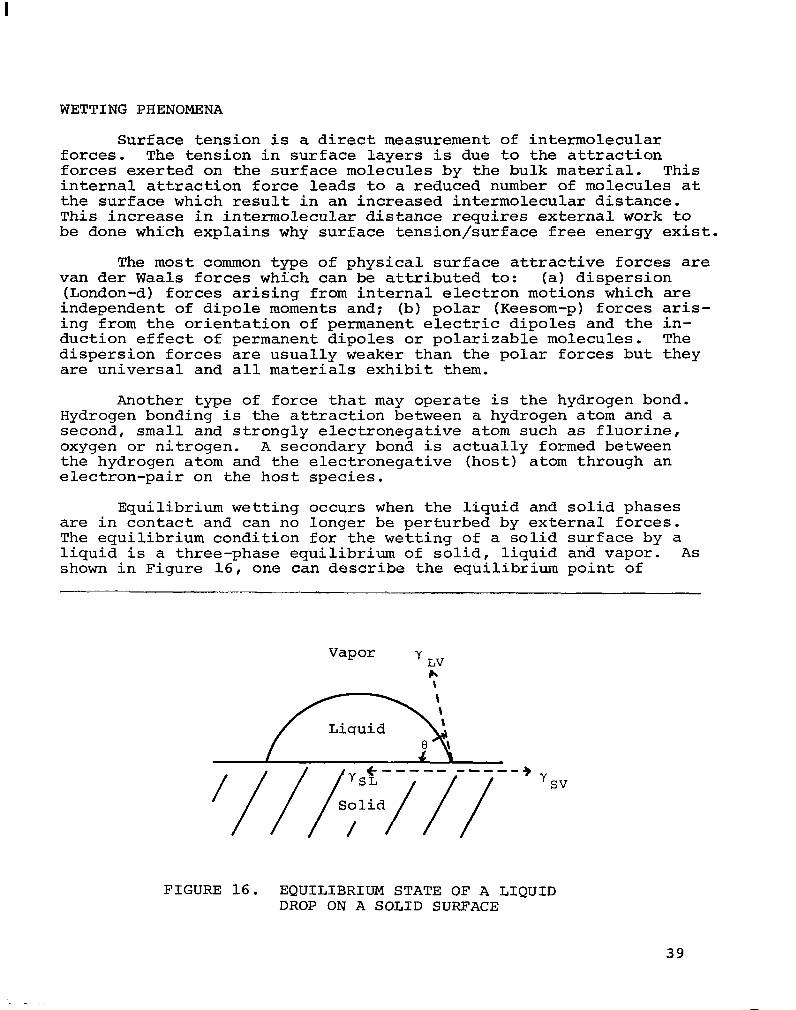
Equilibrium wetting occurs when the liquid and solid phases are in contact and can no longer be perturbed by external forces. The equilibrium condition for the wetting of a solid surface by a liquid is a three-phase equilibrium of solid, liquid and vapor. As shown in Figure 16, one can describe the equilibrium point of
Vapor Y LV h \
FIGURE 16. EQUILIBRIUM STATE OF A LIQUID DROP ON A SOLID SURFACE
39
contact as the intersection of three interfaces--solid-liquid (SL), liquid-vapor (LV), and solid-vapor (SY). The balance of these surface forces/surface tensions on this three-phase intersection is best described by the Young-Dupre equation:(l)
Ysv - %L = YLV cos 8 (3)
where
Ysv = surface tension at solid-vapor interface
YSL = surface tension at solid-liquid'interface
YLV = surface tension at liquid-vapor interface 8 = contact angle
When 8 >90°, the liquid is non-wetting and for 90°>e>Oo, the liquid is wetting but it is nonspreading. When 8 = O", the liquid wets the solid completely and spontaneously and spreads freely over the surface at a rate depending on the liquid viscos- ity and solid surface roughness. Nevertheless, it is also possible for a liquid to spread and wet a solid with contact angle e>O" by the application of an external pressure or force to the liquid.
To apply these concepts to adhesive technology, the surface and interfacial free energies need to be evaluated. However, there are no direct methods available to measure surface free energy, ysv, which complicates the analysis. Nonetheless, the contact angle 8 is a physically measurable parameter and it serves as a convenient means for describing the wettability or degree of wetting on solid surfaces.
When a liquid has a zero contact angle with a solid substrate, surface tension gradients sometimes exist at the spreading front which may either assist or hinder spreading depending upon their directions.(2,3) These surface tension gradients arise from thermal gradients, or, in the case of liquids, from the presence of a more volatile component of different surface free energy (e.g., a trace of impurity). The effect of the surface tension gradients on the spreading rates are relatively small. However, it might have an effect on the redistribution of the wetting liquid after it wets the solid surface.
The topography of the substrate surface also has an effect on the kinetics of wetting. A liquid can spread along fine pores, scratches and other inhomogeneities via capillary action. This spontaneous spreading occurs even if the liquid is non-wetting on a smooth, planar surface. A f'fty per cent increase in s was reported by Bascom et al t
rate 2)
reading
topography plays a minor ro and Cottington et al. (4P Again,
especially if the liquid is 'E e in affecting the rate of spreading,
orcibly spread over .the substrate sur- face. Nonetheless, topography does affect the redistribution of the wetting liquid after its initial "wet-out."
40

Much work(s-12) has been done to obtain quantitative ex- pressions for wetting upon various types of substrate surface topography. Fundamental understanding of the importance of wetting kinetics upon wetting processes (e.g., a process to elim- inate trapped air at the interface during wetting) and interfacial bond strength have yet to be studied.
Dynamic wetting occurs when the liquid or the solid or both are kept in motion relative to the other phase throughout the wetting process. This process is best described by a sessile drop placed on an inclined plane where two contact angles are present. As shown in Figure 17, the advancing angle is the larger, frontier angle as the liquid is progressing to "wet" the solid surface. The advancing angle reflects the tendency of the liquid to wet a virgin surface. The receding angle is the smaller, tail end angle where the liquid is retreating from the "wetted" surface. The receding angle is a measure of the ability of the solid sur- face to remain wetted.
FIGURE 17. A SESSILE DROP ON AN INCLINED PLANE (GRADIENT = tan+) sHowmG THE ADVANCING 'a AND RECEDING er ANGLES
The dynamic wetting angles best characterize the condition where the wetting liquid is forcibly spread onto the substrate surface. Moreover, the advancing angle is very sensitive to surface contamination and surface heterogeneity. This property enables the characterization of the substrate surface and provides insight on the wetting process. The receding angle can be related to the uniformity of the coating after the liquid has wetted the substrate surface.
41

In addition, wetting hysteresis can be obtained by the differ- ence between the advancing angles and the receding angles. The hysteresis of wetting is due to the presence of a large number of metastable states which differ slightly in energy at the surface and are separated from each other by small energy barriers. These metastable states are generally attributed to either surface rough- ness or surface chemical heterogeneity, or both. Surface hetero- geneity can also arise from impurities concentrated at the surface, from crystal imperfections or from differences in the properties of different crystal faces. In general, surfaces are both rough and heterogeneous. It is possible to compare surface roughness and heterogeneity by measuring the hysteresis of wetting.
Experimental Techniques
The surface energetics of fibers can critically affect the wetting behavior and the end-use performance of fibrous materials, e.g., in composite structures. The measurement of spontaneous sur- face wetting is one of the few experimental techniques available for the study -of the solid-surface energetics.
Assessing contact angle measurements on filamentous material is a very difficult experimental task due to the fiber geometry. A preferred technique in direct contact-angle measurement for fibers is a derivative of the tilted plate concept.(13) This involves a small reservoir of liquid which is pierced by the fiber and an arrangement whereby the fiber can be tilted relative to the liquid surface until the meniscus disappears. The contact angle is then measured from the fiber to the liquid surfaces. However, considerable precaution must be taken to obtain the true contact angle. This ex- perimental technique is extremely difficult to apply on fibers with small-cross sectional areas.
An alternate experimental approach which does not require the direct measurement of contact angles is the wetting force measure- ment based on the Wilhelmy balance principle.(l4) This technique is deemed to be promising with filamentous materials, especially with small denier (fine) fibers because of the development of high sensitivity microbalances and the ability to assess both equilibrium and dynamic wetting data. For fibrous composites, dynamic wetting data is very significant because of its ability to prescribe the conditions for prepregging processes.
42

The wetting force measurement, according to Wilhelmy,(l4) is the force exerted on a vertical rod (fiber) inserted into a liquid. This force is expressed by:
FW = IT D yLv cos 0
where FW = wetting force
D = diameter of the fiber
YLV = surface tension
e = contact angle
A mathematical derivation of this expression was performed by A. J. G. Allan. The balance of forces acting on the fiber before and after contact with liquid is illustrated in Figure 18. An important feature of this technique is its applicability to both equilibrium and dynamic conditions. The advancing wetting force can be obtained during the fiber penetrating into the wetting liquid. The equilibrium wetting force is obtained during the stable condition when the fiber is not in motion with respect to the liquid. The re- ceding wetting force can be measured during the pulling out of the fiber from the wetting liquid. The corresponding wetting force ex- pressions are:
FW =ITD~ LV cos 8 (5)
Fa =ITD~ Lv cos e a
Fr =TD~ LV cos 8 r
(6)
(7) where
FW and 8 are the equilibrium wetting force and contact angle respectively
Fa and Ba are the advancing wetting force and contact angle respectively
Fr and er are the receding wetting force and contact angle respectively
By measuring the wetting force, Fw, and the surface tension of the wetting liquid, yLv, work of adhesion, WA can be determined.
wA = YLV + YLV cos ’ (8)
or
FW wA = 'LV + E (9)
43
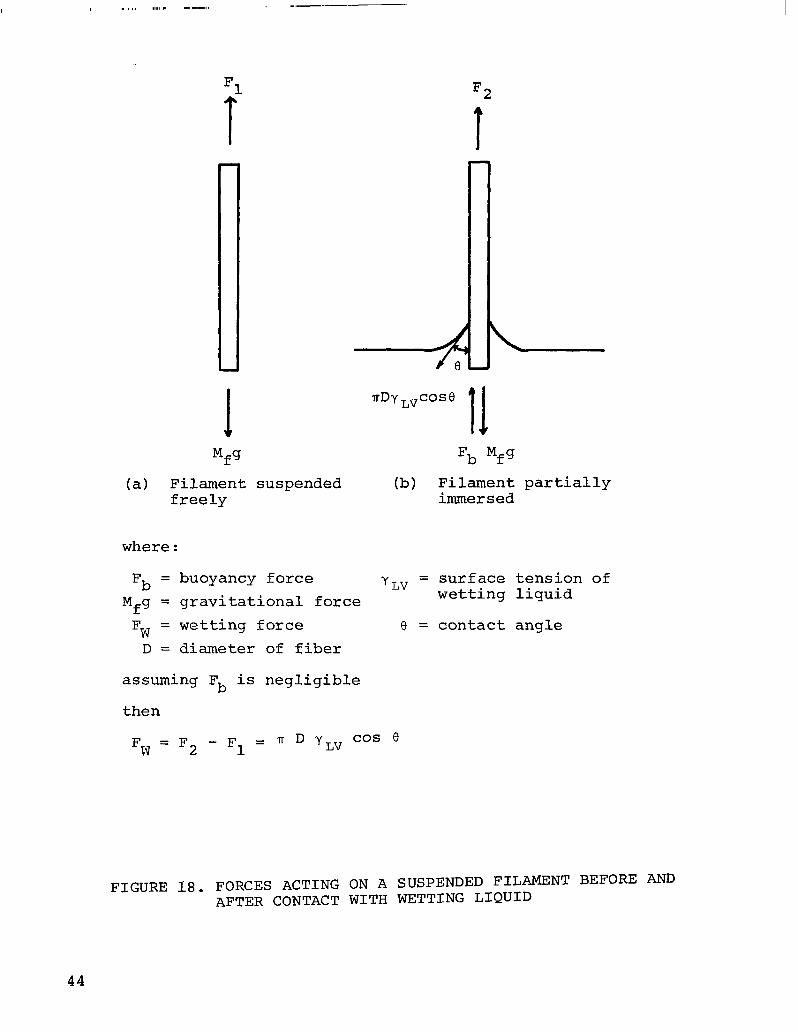
_,.----- -~
Mfg (a) Filament suspended
freely
Fb Mfg (b) Filament partially
immersed
where:
Mfg = gravitational force Fb = buoyancy force Y
Y” T 17 = surface tension of
wetting liquid
FW = wetting force 8 = contact angle D = diameter of fiber
assuming Fb is negligible
then
FW = F2 - Fl = T D y,, cos 8
FIGURE 18. FORCES ACTING ON A SUSPENDED FILAMENT BEFORE AND AFTER CONTACT WITH WETTING LIQUID
44
Furthermore, by attaching a microprocessor to the micro- balance and controlling the fiber immersion/emersion operation, a continuous monitoring of the advancing wetting force and receding wetting force along the fiber can be achieved. This would enable the determination of fiber surface heterogeneity and provide in- sight into the uniformity of the liquid film adhered to the fiber surface. Moreover, this information also shows the frequency of occurence of critical surface contamination which prevents wetting/ bonding.
Critical surface contamination is present in those areas of the surface that has a surface energy lower than the wetting liquid. This lower surface energetics create a thermodynamically unstable condition for the higher surface energy liquid to "wet" the solid surface. Therefore, a localized rejection of the wetting liquid occurs and this leads to the formation of voids during composite fabrication.
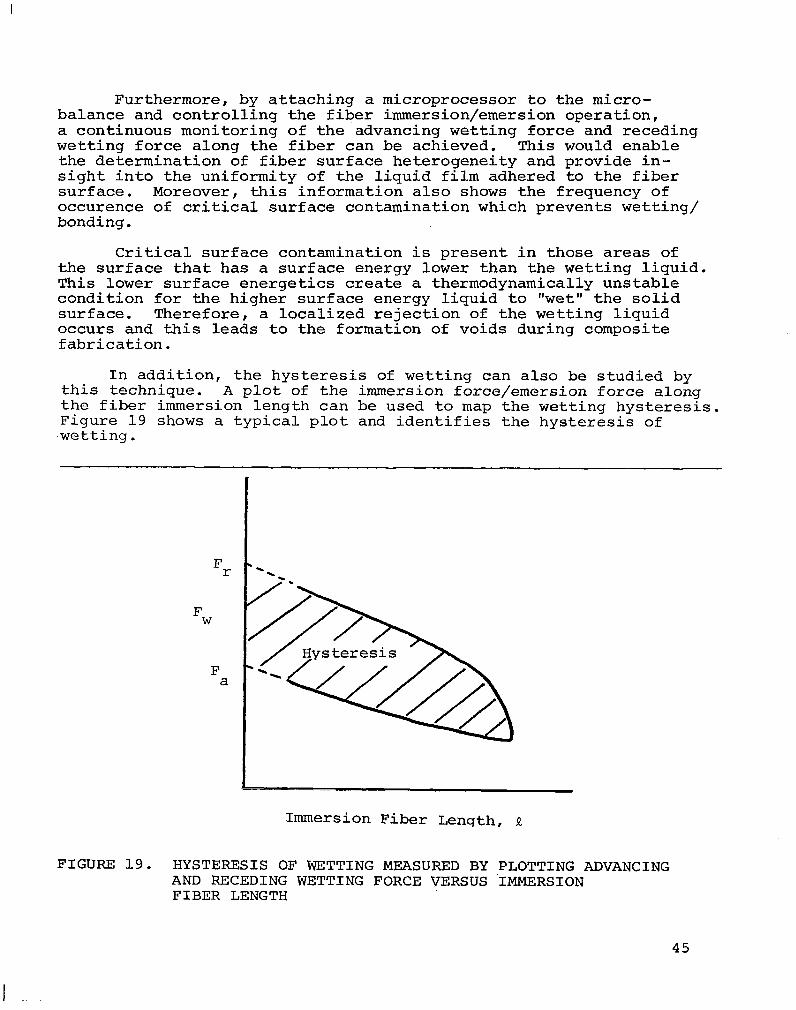
In addition, the hysteresis of wetting can also be studied by this technique. A plot of the immersion force/emersion force along the fiber immersion length can be used to map the wetting hysteresis. Figure 19 shows a typical plot and identifies the hysteresis of wetting.
F a
Immersion Fiber Length, R
FIGURE 19. HYSTERESIS OF WETTING MEASURED BY PLOTTING ADVANCING AND RECEDING WETTING FORCE VERSUS .IMMERSION FIBER LENGTH
45

Although the Wilhelmy wetting force measurement can provide much information, one experimental parameter can affect the accuracy of all these data.(16) The rate of the fiber penetrating into and receding out of the wetting liquid critically affects the measur- ables. As shown in Figure 20, a 90' contact angle (total disappear- ance of the meniscus) is created by this dynamic phenomena at the "critical penetration velocity." This phenomenon cannot be totally eliminated. However, the degree of meniscus depression/elevation can be minimized and controlled by operating at a much slower fiber immersion/emersion rate than the critical velocity and maintaining this rate throughout all studies.
(17-23) This technique has been used by
many authors and information on small.denier fibers, such as, carbon fibers and polyester fibers, have been reported.
(a) (b) 1c.l (d)
where
V = fiber penetration velocity
vc = critical velocity at which meniscus disappears as in (c)
FIGURE 20. EFFECT OF FIBER PENETRATION VELOCITY ON CONTACT ANGLES
Carbon Fiber Surface Energetics
Hammer and Drzal(l9) studied the surface energetics of Hercules Type A carbon fibers via the micro-Wilhelmy wetting force technique. Correlations were found between the oxygen concentration measured by x-ray photoelectron spectroscopy (XPS) and the change in polar/dis- persive ratios of the carbon fibers. This indicated that surface treatments of carbon fibers which promote better fiber matrix adhesion resulted from an increase in the surface free energy. This increase in surface free energy was due to the addition of surface oxygen con- centration during the surface treatment process. Some of the contact angle data are shown in Table III while Table IV lists the measured surface free energies of carbon fibers with their polar and dispersive components.
46

TABLE III. CONTACT ANGLES FOR CARBON FIBERS*
Liquid
Water
Glycerol
Formamide
Methylene Iodide
Ethylene Glycol
Bromonaphthalene
Polypropylene Glycol PG 1200
n-Hexadecane
Y LV (mJ/m2)
72.8
64.0
58.3
50.8
48.3
44.6
31.3
27.6
AU
As Received 300OC V.T.
41° + 40 440 il 40
330 f 20 400 F 10
370 24O f 7'
23' AI 5O 410 k 110
35' 31 6' 30° _+ 6O
290 3z 30 200 f 40
30 I! 30 25' I!Z lo
18O + 8O 27O k 7O
As
As Received 300OC V.T.
29O + 40 33O t- 4O
25' f lo 42' f 9'
220 f 50 27' 2 3'
23O f 5' 3o" f 12O
31° _+ 70 290 -+ 20
26' f 3' 21° It 3O
3O + 3O 25' + lo
220 f 70 23O 2 7O
YLV = surface tension of liquid
AU = Hercules Type A high strength carbon fiber non-surface treated
AS = Hercules Type A high strength carbon fiber surface treated
V.T. = vacuum treated
*From Hammer and Drzal (ref. 19). Reproduced by permission.
47

TABLE IV. SURFACE FREE ENERGIES OF CARBON FIBER*
Fibers
As Received
AU
AS
300°C V.T.
Surface Free Energies
v&(mJ/m2) ~:,(mJ/m~) rsvhJ/m2)
23.6 _+ 2.6 27.4 + 0.3 51.0 2 2.6
30.0 + 1.7 26.4 + 0.1 56.4 + 1.7
AU 24.1 f 1.4 26.3 2 1.1 50.4 + 1.4
AS 26.8 f 1.4 26.0 + 1.2 52.8 + 1.4
P Ysv - Keesom-polar surface free energy of solid.
D Y sv - London-dispersion surface free energy of solid.
P D
Ysv - Surface free energy of solid, ysv = ysv + ysv
AU - Hercules Type A carbon fiber--non-surface treated.
AS - Hercules Type A carbon fiber--surface treated.
V.T. - Vacuum treated.
*From Hammer and Drzal (ref. 19). Reproduced by permission.
48

II
Se11(18) studied the wetting properties of carbon fibers and measured the effect of surface treatments on wetting properties. Figure 21 summarizes his reported results.
00 \-methane
lo- oxidized with nitri
0 acid
I 7 I t I I 20 40 m Surface tension of liquid ol(dynlcm)---t
FIGURE 21. ANGLE OF WETTING 9 OF VARIOUS LIQUIDS WITH RESPECT TO CARBON FIBERS*
*From Sell (ref. 18). Reproduced by permission.
49

Kaelble et al(21f24-25) h ave intensively studied carbon fiber surface energetics via the micro-Wilhelmy balance technique. Some of his data on the contact Angles of carbon fibers are shown in Table V. Kaelble also extended the information on the Keesom- polar and London-dispersive surface free energy with the modified Griffith fracture energy. This enabled the prediction of the inter- facial conditions to Promote crood bond strensth and environmental stability. This expression was done through-t adsorption theory of interfacial interactions. 6 75 e
xtension of the The critical
value of the Griffith fracture stress, bc under normal plane stress loading can be expressed by the following relationships:
yG = R2 - R;
R: = 0.25C(al - a3)2 + (By - B,)~I
R2 = (a 2 - H>2 + (B, - K)2
H = 0.5(al + u3)
K = 0.503, + B3)
(11)
(12)
(13)
(14)
(15)
(16)
(17)
(18)
(19)
a2 and B, = surface properties of the immersion phase at the crack tip
For air: a2= . B, = 0
For water: a2 = 4.67 (mJ/m2) %
B2 = 7.14 (mJ/m2) 4
50
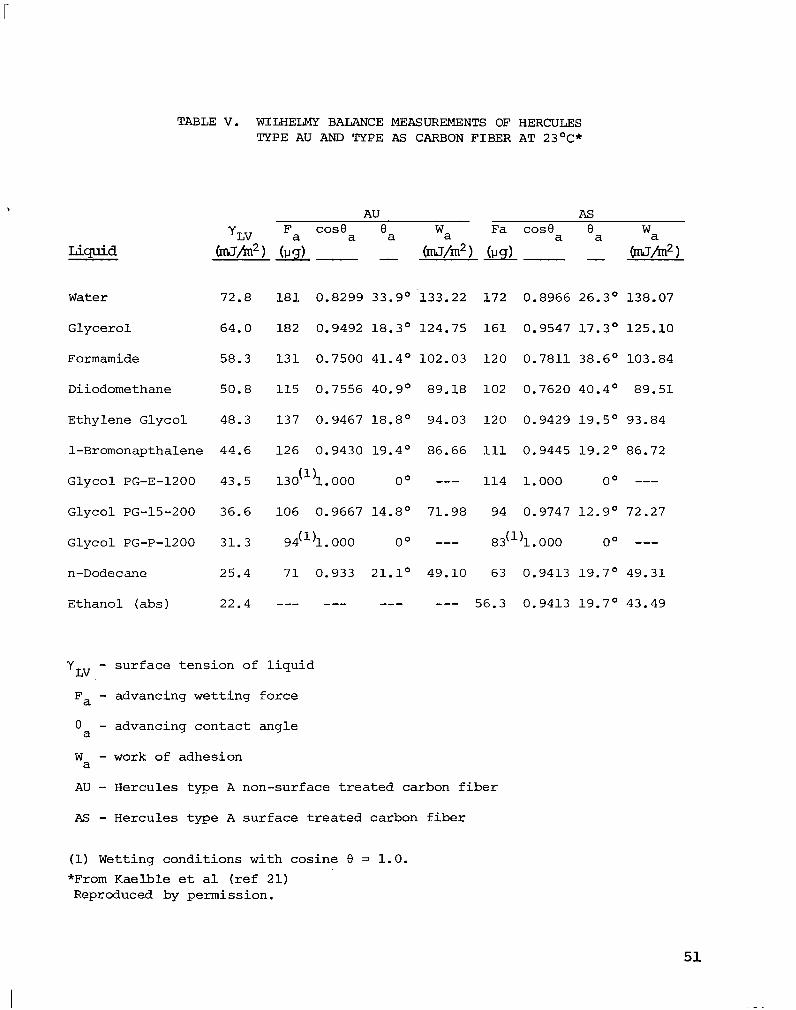
Liquid
TABLE V. WILHELMY BALANCE MEASUREMENTS OF HERCULES TYPE AU AND TYPE AS CARBON FIBER AT 23OC*
AU As
YLV F case Fa case a a 'a wa a 'a wa
Water
Glycerol
Formamide
Diiodomethane
Ethylene Glycol
(ms/tn2 1 (lJg) _ (mJ/m2) (w) ban2 1 _
72.8
64.0
58.3
50.8
48.3
1-Bromonapthalene 44.6
Glycol PG-E-1200 43.5
Glycol PG-15-200 36.6
Glycol PG-P-1200 31.3
n-Dodecane 25.4
Ethanol (abs) 22.4
181 0.8299 33.9O-133.22 172 0.8966 26.3O 138.07
182 0.9492 18.3' 124.75 161 0.9547 17.3O 125.10
131 0.7500 41.4O 102.03 120 0.7811 38.6O 103.84
115 0.7556 40.9O 89.18 102 0.7620 40.4O 89.51
137 0.9467 18.8' 94.03 120 0.9429 19.5' 93.84
126 0.9430 19.4O 86.66 111 0.9445 19.2' 86.72
13O(l)l . 000 00 --- 114 1.000 00 ---
106 0.9667 14.8' 71.98 94 0.9747 12.9O 72.27
94(l)l . 000 00 --- 83(l)l . 000 O" ---
71 0.933 21.10 49.10 63 0.9413 19.7' 49.31
--- --- --- --- 56.3 0.9413 19.7' 43.49
Y LV - surface tension of liquid
Fa - advancing wetting force
8 a - advancing contact angle
W - work of adhesion a
AU - Hercules type A non-surface treated carbon fiber
As - Hercules type A surface treated carbon fiber
(1) Wetting conditions with cosine '3 = 1.0. *From Kaelble et al (ref 21) Reproduced by permission.
51
Through this thermodynamic analysis, Kaelble predicted that in order to have a moisture insensitive interface, a non-polar sur- face for the fiber and the matrix CBI, B, <l.0(mJ/m2)%l was neces- sary. To assure spontaneous wetting to enhance interfacial bond- ing , an increase in London-dispersive contribution to the fiber surface free energy [a, ~6.0(mJ/m2)~l~ is required.
Penn et al(**) studied the advancing and receding contact angles of carbon fibers and the effect of wetting hysteresis. The advancing angle is used to demonstrate how readily the liquid wets the fiber surface; the receding angle is to illustrate how well the fiber surface remains wetted. The data is presented in Table VI. According to Penn, hysteresis of wetting would disappear below a critical surface tension of the wetting liquid. In addition, Penn also tried to correlate the wetting properties of carbon fibers to composite shear strength.(*3) Penn sized the carbon fiber with a silicone fluid to create a hydrophobic surface and also had a hydrophilic size to compare the effect of sizings to composite properties both unconditioned and conditioned.
Some of these data are shown in Table VII. However, the re- ported composite data do not correlate with the wetting angles measured. The hydrophilic sized fiber showed the smallest con- tact angles (best wetting) but it had the lowest short beam shear strength both conditioned and unconditioned. Furthermore, silicone fluid has a poor compatability with epoxy and during prepregging, the silicone fluid could diffuse away from the fiber surface to the prepreg surface. This effect would be more pronounced with filament winding procedures. This is because the filament winding resin systems are more fluid and molecule mobility is enhanced. The similarity of the composite short beam shear strength of the silicone fluid sized fiber and the unsized fiber could be the reflection of the disappearance of the silicone size from the fiber surface. Moreover, Penn stated that silicone fluid was found on the surface of the laminates.*
Overall, much work has been done in measuring contact angles of carbon fibers and theoretical analyses have been made. However, reported values are generally scattered and the conditions at which these measurements were made are not generally clear. Above all, fiber origins, types and properties have not been generally characterized and specified. Therefore, attempting to correlate the reported data is difficult and unclear. This report is in- tended to clarify some of the gray areas and to try to correlate wetting properties of carbon fibers to fiber matrix adhesion and composite properties.
*Private communication with Dr. Lynn Penn.
52

Liquid
TABLE VI. ADVANCING AND RECEDING CONTACT ANGLES OF CARBON FIBERS*
Water 72.4
Formamide 55.6
Methylene Iodide 48.6
Ethylene Glycol 47.5
Br-Naphthalene 45.3
Dimethyl Acetamide 36.7
Hexadecane 2i.4
Carbon Fiber(l) case, 'a case r 'r - -
-0.067 93.8' 0.713 44.5O
0.445 62.9O 0.562 55.8O
0.824 34.5O 0.917 23.5O
0.538 57.5O 0.895 26.5O
0.957 16.9O 0.957 16.9O
0.993 6.78' 0.993 6.78O
0.964 15.4O 0.964 15.4O
(1) Origin and type of carbon fiber unknown.
y LV - surface tension of liquid.
'a - advancing contact angle.
'r - receding contact angle.
*From Penn and Miller (Ref. 22). Reproduced by permission.
53
I

TABLE VII. EFFECT OF WETTABILITY ON CARBON FIBER/EPOXY COMPOSITE SHEAR STRENGTH*
Short Beam Shear (ASTM D2344)
14 Days Water Boil
Fiber Variants 'a 'r RT 82.2'C (180'F) RT 82.2'C (180'F) - - MPa ksi MPa ksi MPa ksi MPa ksi
AS-4 52.3' 22.0' 98.6k4.8 14.320.7 78.622.1 11.4kO.3 80+2.1 11.6kO.3 58.6kO.7 8.5fO.l (unsized)
AS-4 78.6' 24.6' 90.3k2.8 13.1kO.4 76.621.4 ll.lkO.2 81.4k2.8 11.850.4 58.622.1 8.550.3 (hydrophobic size) (silicone fluid)
AS-4 26.7' 0.00' 69.7k0.3 lO.lf0.05 57.2k4.1 8.3kO.6 42.8k4.1 6.2kO.6 33.8k2.1 4.9F0.3
*From Desalvo et al (ref 23) Reporduced by permission.

References to Wettincr Phenomena
( 1)
( 2)
( 3)
( 4)
( 5)
( 6)
( 7)
( 8)
( 9)
(10)
(11)
(12)
(13)
(14)
T. Young, "Miscellaneous Works," Proc. Roy. Sot., Dec. (1804), and Phil. Trans., (1805), 65.
W. D. Bascom and R. L. Patrick, "The Surface Chemistry of Bonding Metals with Polymer Adhesives," Adhesive Age, 17 (101, (1974) 25.
-
W. D. Bascom, R. L. Cottington and C. R. Singleterry, "Advances in Chemistry Series, 43," R. F. Gould, editor, A.C.S., Washington (1964), 355.
R. L. Cottington, C. M. Murphy and C. R. Singleterry, "Ad- vances in Chemistry Series, 43," R. F.. Gould, editor, A.C.S., Washington (1964), 341.
R. N. Wenzel, "Contact Angles on Rough Surfaces," Ind. Eng. Chem., 28 (1963), 988. -
F. E. Bartell and J. W. Shepard, "Surface Roughness as Related to Hysteresis of Contact Angles. I--The System Paraffin- Water-Air," J. Phys. Chem., 57 (1953) 211. -
A. W. Neumann and R. J. Good, "Thermodynamics of Contact Angles," J. Colloid, Interf. Sci., 38 (1972), 341. -
J. C. Oliver and C. Huh and S. G. Mason, "The Apparent Contact Angle of Liquids on Finely-Grooved Solid Surfaces-- A SEM Study," J. Adhesion, 8 (1977), 223.
H. Schonhorn, C. Frisch and T. K. Kwei, "Kinetics of Wetting of Surfaces by Polymer Melts," J. Appl. Phys., 37 (1966), 4967.
-
B. W. Cherry and C. M. Holmes, "Kinetics of Wetting of SUr- faces by Polymers," J. Colloid Interf. Sci., '29 (1969), - 174.
S. Newman, "Kinetics of Wetting of Surfaces by Polymers; Capil- lary Flow," J. Colloid Interf. Sci., 26 (1968), 209. -
B. W, Cherry and S, El Muddaris, "Wetting Kinetics and the Strength of Adhesive Joints," J. Adhesion, 2 (1970), 193.
P. C. Hiemenz, "Principles of Colloid and Surface Chemistry," Ch. 6, Marcel Dekker, Inc. (1977).
J. Wilhelmy, Ann Physik, 119, 117 (1863). --
55

(15)
(16)
(17)
(18)
(19)
(20)
(21)
(22)
(23)
(24)
(25)
(26)
A. J. G. Allan, "Wilhelmy's Plate and Young's Equation," J. of Colloid Sci.., 13, 273-274 (1958)'. -
A. M. Schwartz and Silvestre B. Tejada, "Studies of Dynamic Contact Angles on Solids," J. of Colloid Interf. Sci., 38, No. 2 (1972), 359. -
R. L. Bendure, "Dynamic Adhesion Tension Measurement," J. of Colloid Interf. Sci., 42, No. 1 (1973), 137. -
P. J. Sell, "Wetting Properties of Carbon Fibers," Umschau, 72 (131, (1972) 433.
G. E. Hammer and L. T. Drzal, "Graphite Fiber Surface Analysis by X-Ray Photoelectron Spectroscopy and Polar/Dispersive Free Energy Analysis," Appl. of Surf. Sci., 4 (1980), 340-355.
G. Mozzo and R. Chabord, "Contribution to the Study of Glass- Resin Adhesion," Proc. of the 23rd Ann. Tech. Conf. of SPI, 1968, Sec. 9-C.
D. H. Kaelble, P. J. Dynes and E. H, Cirlin, "Interfacial Bonding and Environmental Stability of Polymer Matrix Composites," J. Adhesion, 5 (1974), 23.
L. S. Penn and B. Miller, "A Study of the Primary Cause of Con- tact Angle Hysteresis on Some Polymeric Solids," J. of Colloid Interf. Sci., 78, No. 1 (1980), 238. -
G. D. M. DiSalvo, L. S. Penn, F, A. Bystry, "Silicone Fluids as Hydrophobic Sizing in Graphite/Epoxy Composites: Physiochemical Analysis," Symp. on Adv. in Polymer Com- posites I. The Interface Poly. Preprints for ACS Nat'l. Meeting, 22, No. 2, August 1981.
D. H. Kaelble, "Interface Degradation Processes and Durability," Polym. Eng. and Sci., 17, No. 7, July 1977, 474.
D. H. Kaelble and P, J. Dynes and L. Maus, "Surface Energy Analysis of Treated Graphite Fibers," 'J. 'Adhesion, 5, (1974) 239.
D. H. Kaelble, "A Relationship Between the Fracture Mechanics and Surface Energetics Failure Criteria," J. of Appl. Polym. Sci., 18 (1974), 1869. -
56

STRESS TRANSFER FROM MATRIX TO FIBER
When a tensile load is applied to an elastic matrix, the matrix will elongate to a value proportional to the load. How- ever, if fiber withahigher elastic modulus is embedded in the matrix, the fiber will restrict the matrix from freely elongating in the regionof the fiber. Shear stresses are produced on planes parallel to the axis of the fibers in the direction of this axis. The tensile stresses in the fiber are introduced by these inter- facial shear stresses. These stress patterns can be identified and evaluated by birefringence techniques.(lr*)
A number of models have been prooosed for calculating the longitudinal tensile stress distribution in an embedded fiber. The models of Cox,(3) DOW(~) and Rosent5) considered the case of an elastic fiber in an elastic matrix. If the matrix deforms elas- tically, the interfacial shear stresses peak at a maximum value near the fiber ends and then decay rapidly toward the center length of the fiber. Conversely, the tensile stresses in the fiber will build to a maximum value provided that the fiber is sufficiently long. The tensile strain of the fiber and the tensile strain of the matrix are nearly equal in the mid-length.
When the load is applied to the fiber by shear stress at the interface, physically, at equilibrium, one must always have:
dP=rd r dx f x,r=%d f
(20)
where
x = distance from end of fiber
P = tensile load in the fiber
df = diameter of the fiber
T = the shear stress evaluated x,r=$d
f at the fiber surface
Generally, 'tx,r in the matrix is a function of both x and r. The magnitude of the interfacial shear stress is largely dependent on the fiber content, on the magnitude of the applied load, and on the physical properties of the filament, matrix and interfacial bonds.
In order to obtain an expression for the shear stress, the following assumptions are made.(3-5)
57

1.
2.
3.
4.
Fiber and matrix both behave elastically.
Fiber is surrounded by a cylinder of matrix material.
The bond between fiber and matrix is perfect throughout any deformation.
Straight radial lines in the fiber and matrix remain straight lines after deformation.
The shear stress between fiber and matrix could then be ex- pressed as follows:(3-5)
where:
; - Xl
1 L o<x<- (21)
2
(22)
and
-r = interfacial shear stress between fiber and matrix X in psi
A = cross-sectional area in in2
E = Young's modulus in psi
G = shear modulus in psi
X = distance from end of fiber, in inches
58

df = diameter of fiber, in inches
L = effective length for load differential between fiber and matrix
P eff = 'a Em Am l-- ( ) Ef
(23)
u a = applied field stress in psi
Subscripts:
f = fiber
m = matrix
Hence, the tensile load in the fiber at distance X is given by:(3-5)
s
X Pf = pf,x=o + IT df T
Xdx 0
(24)
Therefore, the tensile stress in the fiber at position X is obtained by integrating as follows:(3-5)
X
pf, x-o Of= Af
ndf +q- /
T dx' 0 XY
(25)
59
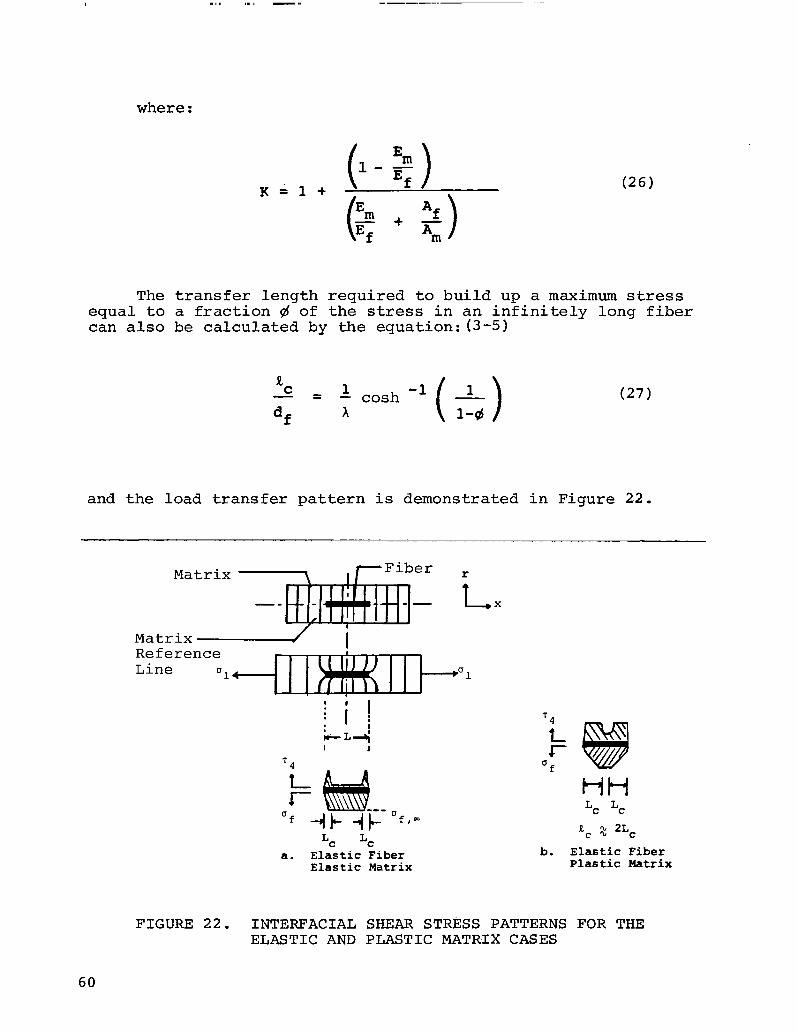
where:
(26)
The transfer length required to build up a maximum stress equal to a fraction d of the stress in an infinitely long fiber can also be calculated by the equation:(J-5)
EC - = A cash df x
(27)
and the load transfer pattern is demonstrated in Figure 22.
Matrix \, Fiber =
--de - I..-- - - I- X
, Matrix Reference Line
Lc ;, a. Elastic Fiber
Elastic Matrix
T4
t r
Of
HH Lc Lc
e -lJ 2L, c 'L, b. Elastic Fiber
Plastic Matrix
FIGURE 22. INTERFACIAL SHEAR STRl%S PATTERNS FOR THE ELASTIC AND PLASTIC MATRIX CASES
60
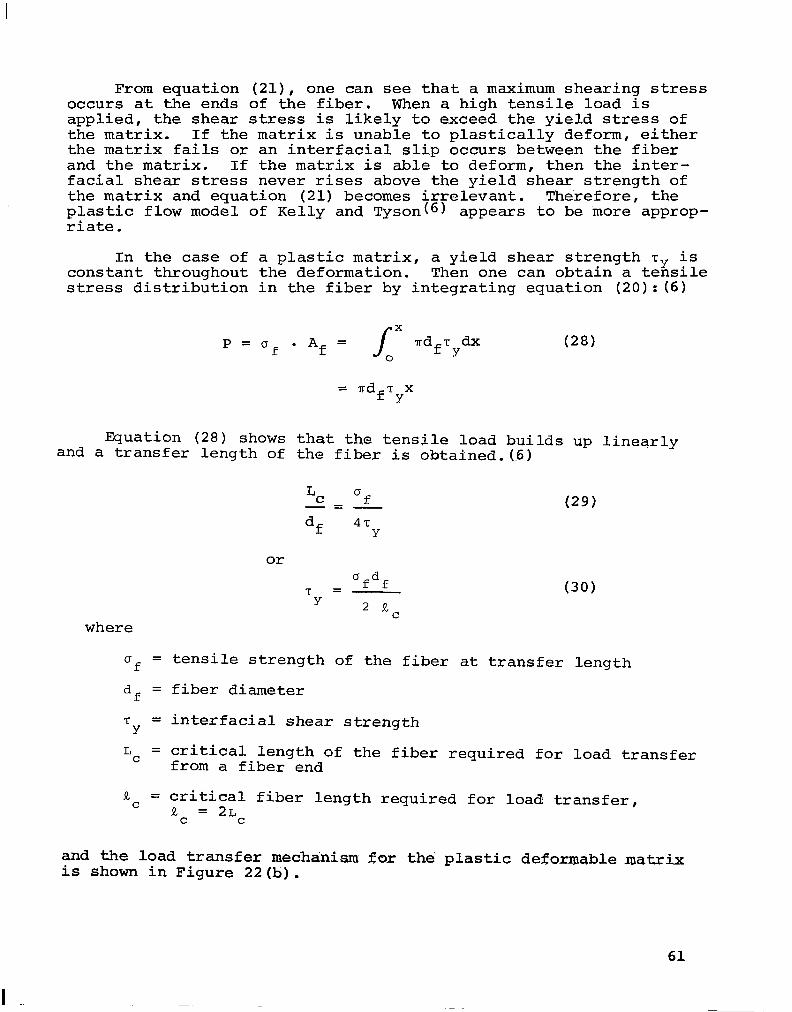
From equation (21), one can see that a maximum shearing stress occurs at the ends of the fiber. When a high tensile load is applied, the shear stress is likely to exceed the yield stress of the matrix. If the matrix is unable to plastically deform, either the matrix fails or an interfacial slip occurs between the fiber and the matrix. If the matrix is able to deform, then the inter- facial shear stress never rises above the yield shear strength of the matrix and equation (21) becomes irrelevant. Therefore, the plastic flow model of Kelly and Tyson(6) appears to be more approp- riate.
In the case of constant throughout stress distribution
a plastic matrix, the deformation.
a yield shear strength ~~ is Then one can obtain a tensile
in the fiber by integrating equation (20): (6)
P = s
X
Of . Af = 0
adf-cydx (28)
Equation (28) shows that the tensile load builds up linearly and a transfer length of the fiber is obtained.(S)
LC af -=- (29)
df 4Ty
or
where
T = afdf (30) Y
2 kc
Of = tensile strength of the fiber at transfer length
df = fiber diameter
T Y
= interfacial shear strength
L C
= critical length of the fiber required for load transfer from a fiber end
% = critical fiber length required for load transfer, EC = 2L
C
and the load transfer mechanism for the 'plastic deformable matrix is shown in Figure 22(b).
61
(1)
(2)
(3)
(4)
(5)
(6)
L. B. Greszczuk, "Micromechanics Failure Criteria for Composites Subjected to Transverse 'Noarmal Loadking," AIAA Journal, 9, No. 7 (1971),.1274.
A. Voloshin, "Stress Field Evaluation in Photoelastic Anisotropic Materials: Experimental Numerical Technique," J. Comp. Mat'l., I 14 (1980), 342.
H. L. Cox, "The Elasticity and Strength of Paper and Other Fibrous Materials," Brit. J. Appl. Phys., 3 (1952), 72.
N. F. Dow, "Study of Stresses Near a Discontinuity in a Filament- Reinforced Composite Metal," General Electric Report TIS R635D61, AD-414673 (19.63).
B. W. Rosen, "Tensile Failure of Fibrous Composites," AIAA J., 2, No. 11 (1964), 1985.
A. Kelly and W. R. Tyson, "Tensile Properties of Fibre-Reinforced Metals: Copper/Tungsten and Copper/Molybdenum," J. Mech. Phys. Solids, 13 (1965), 329.
62
METHODS FOR MEASURING INTERFACIAL BOND STRENGTH
Fiber Pullout Test
Broutman(') developed the single filament fiber-pullout test to measure the interfacial joint strength and interfacial frictional strength. A typical load-displacement curve resulting from such a test is shown in Figure 23. The geometry of the specimen for the fiber pullout test can either be a button-type sample as shown in Figure 24, or a fiber end of controlled length embedded into a bulk matrix as in Figure 25. The relationship which assumes the shear stress to be uniformly distributed along the interface is:
T 'rn "mr z---c- (31) 27TrR 2R
where
T = average shear strength of joint
P m = maximum load applied to fiber
r = radius of fiber
R = embedded fiber length
u m = maximum stress applied to fiber
The embedded fiber length is influenced by the fiber strength so that the maximum embedded length to be used is determined by:
u R ultr = (32) max
2-r
where
u ult
= ultimated tensile strength of the fiber
The theoretical analysis of this test was performed by Lawrence (2)
and Bartog(3) h w o concluded that this test was sensitive to interfacial adhesion properties.
However, this test is not applicable to carbon fiber ,/epoxy joint strength analysis because of the small diameter of the car fiber and the relatively high interfacial bond strength. Using
*bon the
63
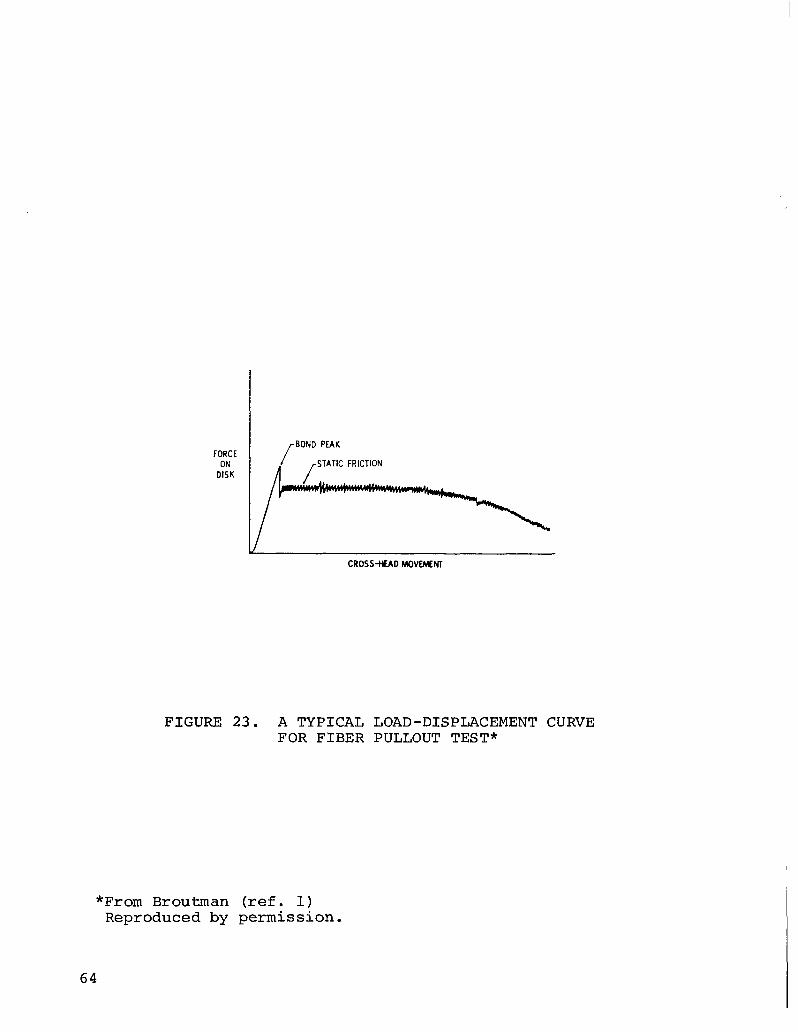
FORCE ON STATIC FRICTION
DISK
CROSS-tE.AD MOVMNl
FIGURE 23. A TYPICAL LOAD-DISPLACEMENT CURVE FOR FIBER PULLOUT TEST*
*From Broutman (ref. 1) Reproduced by permission.
64

P
T Fiber
Matrix 1 -+-
FIGURE 24. BUTTON-TYPE SPECIMEN FOR FIBER PULLOUT TEST
Fiber
Matrix
FIGURE 25. BLOCK-TYPE SPECIMEN FOR FIBER PULLOUT TEST
65

typical properties of carbon fiber shown in Table VIII, the maximum embedded length for carbon fiber/epoxy determined from equation (32) had to be less than lOOurn (3.5 mils).
TABLE VIII. SOME TYPICAL PHYSICAL PROPERTIES OF A SINGLE FILAMENT CARBON FIBER
Tensile strength of carbon fiber at 2.54 x 10m2m gauge length
u = ult 3241 MPa (470 ksi)
Diameter of carbon fiber, d = 7 x 10m6m (0.14 mil)
Interfacial shear strength, T s 70 MPa (10 ksi)
Favre et a1(4) attempted to use this technique to study the joint strength of carbon fiber in various thermoset matrix materials (epoxy, polyester and polyimide). A special fabrication technique
was designed to provide a short embedded length. However, the thick- ness of the resin lozenge was difficult to control and large varia- tions in the data were observed. Moreover, the critical embedment lengths of the fiber for each matrix were not determined. The critical embedment length could be determined by testing specimens with various embedded lengths and relating the fiber pullout force to the embedded length as shown in Figure 26. According to the authors, the joint strength of equation (31) should be calculated
Fiber Pullout
P mfc
Force
R
Embedded Len&h of Fiber
FIGURE 26. RELATIONSHIP OF RESIN LOZENGE THICKNESS TO FIBER PULLOUT FORCE
66

based on Pm c and 2 C
as in equation (33). f
P m,c T - = adR
C
where:
(33)
P m,c = fiber pullout force at maximum embedded length
% = maximum embedded length which allows fiber pullout
This relation was not determined by Favre possibly because of the difficulties in controlling and fabricating ultrathin resin lozen- ges . Some of his data is shown in Tables IX and X.
TABLE IX. VALUES OF THE ADHESION STRF,NGTH aA FOR AS-RECEIVED FIBERS*
Fibre
Counaulds
Type
HT (long staple)
HTS (continuous tow) HM (continuous tow)
HMS (continuous tow)
Modulus (GNm-*)
270
283
330 (ISI batch)
~--
357 (2nd batch) 350
Matrix l
Polyester A Polyester B
Epoxy Polyimide
EPOXY
EPOXY Polyimide
EPOXY Epoxy
OA Nmm-*
5.4 10.4
9.7 17.1 57.3
5.5 12.8
-
I.8 31.4
Morgan II treated (sample) 240 Epoxy
Carbone-Lorraine AG (short staple) 440 EPOXY AGT (continuous tow) 258 Epoxy
Columbia CM R (sample) 42t Epoxy
*Polyester A Rhodester 1108 (RhGne-Poulenc) Polyester B Stratyl A.30(St Gobain) EPOXY Araldite LY 556 + HT 972 (CIBA) Polyimide Kerimid 601 (Rhane-Poulenc)
TManufacturer's data
41.9
1.0 41.6
8.3
*From Favre and Perrin (Ref. 4) Reproduced by permission.
67

--. - . - _- _._._._..
In Table IX,
where
F = the force required for fiber pullout
d = diameter of the fiber
R = thickness of the pastille
TABLE X. ADHESION STRENGTH OF TREATED FIBRES* (Matrix: epoxy LY 556 + HT 972)
Fibre Treatment Modulus (GNm-*)
Tensile strength (Gym. ‘)
5, Nmrn-’
Courtaulds HT (long staple)
- 270 benzene washing 270 oxidation (nitric acid) - oxidation (hypochlorile) 273.5 oxidation (hot air) -
formation of silicon - carbide
Courtaulds H M (continuous)
- 357 oxidation (hypochlorite) 270 IO 325 formation of silicon 281.5
carbide reduction by wet hydrogen 259 pyrolylic carbon coating
-tolucnc 340 -propykne
*From Favre and Perrin (Ref. 4) Reproduced by permission.
2.56 2.56 2.14 2.46 1.96 -
1.73 1.8 1.00 10 1.80 up IO 26 0.88 ( 70)
1.04 3.8
1.83 8.0 1.67 8.0 IO 46
9.1 7.8
:- < -._ 40.0 40.5 18.0
68

Single Filament Shear Fracture Energy Test
Outwater and Murphy(5-7) developed a new testmethod to meas- ure the debonding fracture energy between epoxy resin and single filament glass fibers. The authors considered an infinitely long fiber of diameter "df" and cross-sectional area "Af" embedded in a semi-infinite solid as in Figure 27. Let P be the tensile load at the end of the fiber protruding a distance L from the sur- face of the' resin and let the fiber be debonded a distance "x" into the matrix and GII be the energy required to debond the fiber.
The strain energy, Rf in the filament is:
P2L Rf = -+
J
x(P--~d~x)~ dx
2AEf 0 2AEf
where
T = interfacial shear strength
Ef = Young's modulus of the fiber
(34 1
FIGURE 27. EMBEDDED SINGLE FIBER IN A SEMI-INFINITE SOLID UNDER TENSILE LOAD*
*From Outwater and Murphy (Ref. 5). Reproduced by permission.
69
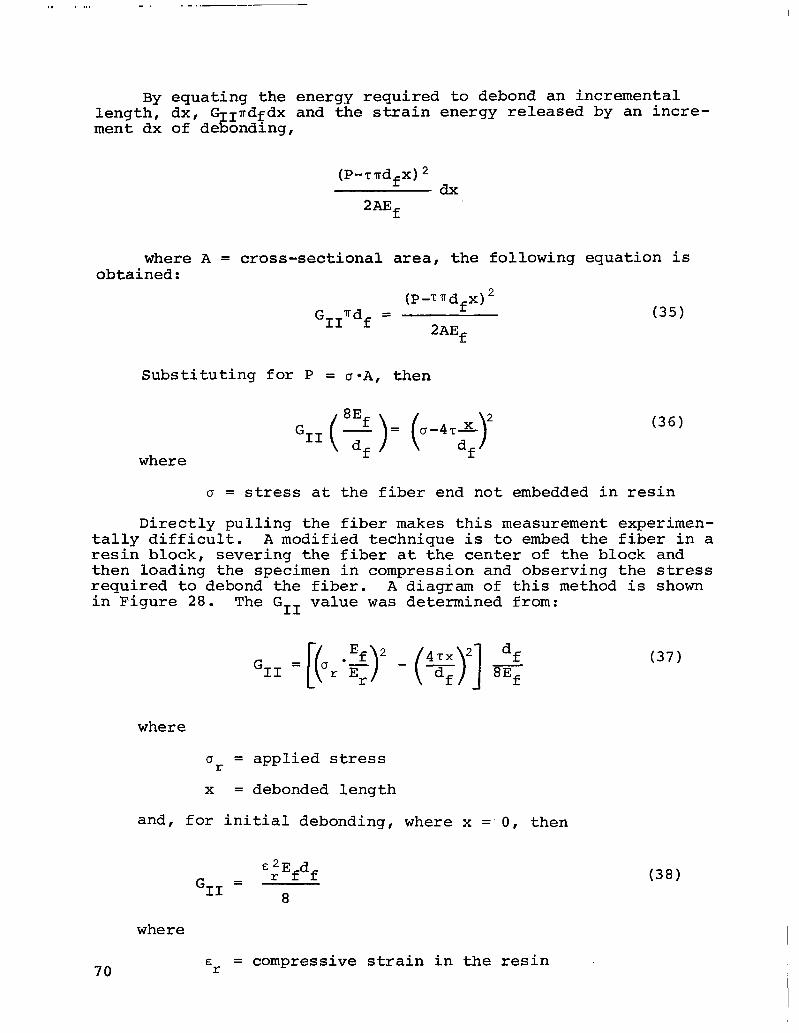
By equating the energy required to debond an incremental length, dx, GIIndfdx and the strain energy released by an incre- ment dx of debonding,
(P-Tsdfx)2 dx
2AEf
where A = cross-sectional area, the following equation is obtained:
GII 'Td (P-TndfxJ2
f = (35) 2AEf
Substituting for P = DOA, then
where
(36)
u = stress at the fiber end not embedded in resin
Directly pulling the fiber makes this measurement experimen- tally difficult. A modified technique is to embed the fiber in a resin block, severing the fiber at the center of the block and then loading the specimen in compression and observing the stress required to debond the fiber. A diagram of this method is shown in Figure 28. The GII value was determined from:
70
where
u r = applied stress
X = debonded length
and, for initial debonding, where x ='O, then
E2E d GII =
rff 8
where
E r = compressive strain in the resin
(37)
(38)
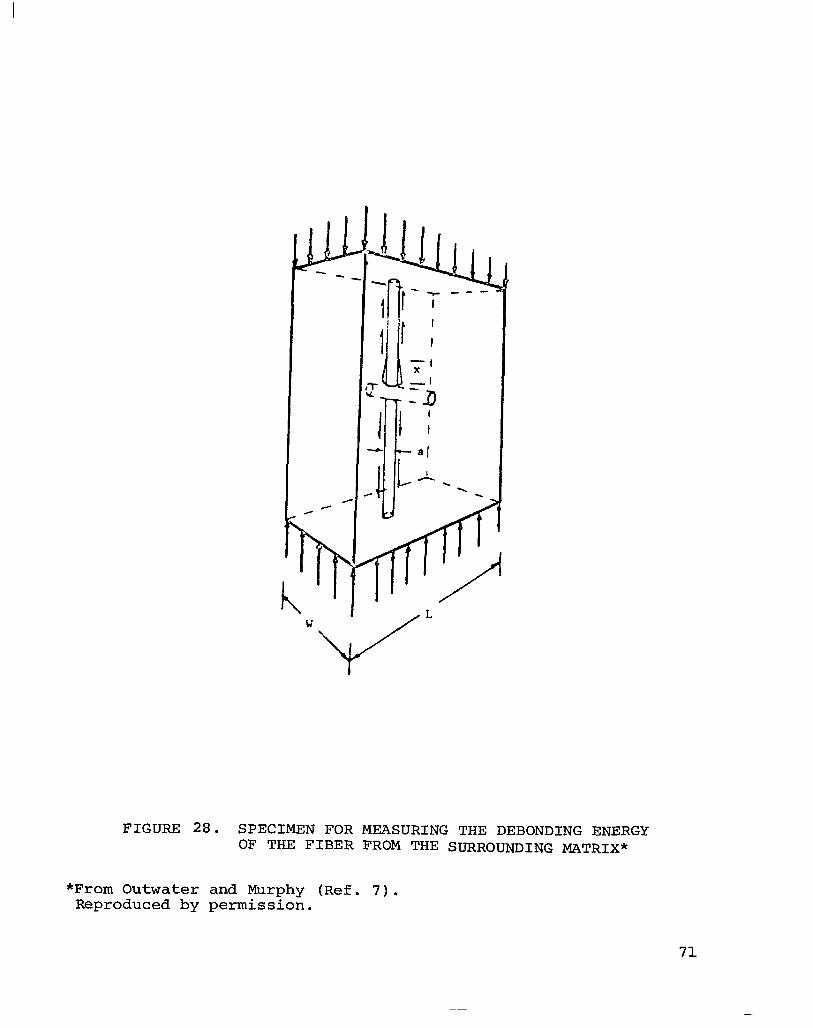
FIGURE 28. SPECIMEN FOR MEASURING THE DEBONDING ENERGY OF THE FIBER FROM THE SURROUNDING MATRIX*
*From Outwater and Murphy (Ref. 7). Reproduced by permission.
71

I I I 11.m,.mm 1.11.m. .,.._. , . ...,,,.. - -._...-- -.-
The data obtained from this test for glass fibers in an epoxy matrix was conclusive. However, due to the small diameter and the brittle nature of the carbon fiber, this test is not applicable for a study of carbon fiber/epoxy adhesion properties. This test requires the observation of initial debonding during compression of the specimen and the small diameter of a carbon fiber makes the observation difficult if not impossible.
Single Filament Interfacial Shear and Transverse Tensile Debonding Strength Determination
Broutman(lrStg)h as also developed tests to characterize the interfacial shear debonding strength and interfacial transverse tensile strength. Interfacial shear strength is determined by embedding a single filament in the center of an epoxy casting as shown in Figure 29. Upon subjection to compression, the fiber
+.27cm+
Fiber 1.27cm -
L-
i
T 3.81~~1
1
FIGURE 29. INTERFACIAL SHEAR STRENGTH SPECIMEN
will debond at the interface by shear. The shear stress can be determined from:
T = 2.50 (39)
where
T = interfacial shear stress
u = axial compression stress in specimen
72

Interfacial transverse tensile strength was determined in a similar manner. The specimen for this test is shown in Figure 30.
;81cm
k-4 0.64cm
FIGURE 30. INTERFACIAL TRANSVERSE TENSILE STRENGTH SPECIMEN
Due to the curvature of the matrix and the difference in the Poisson's ratios of the fiber and the matrix, the fiber will debond at the interface through transverse tensile stress. This transverse tensile stress can be determined from:
SC- amhm-vf)Ef
(l+prn) Ef + (1-uf-2u;) Em
where
S = transverse tensile stress
u m = axial compression stress on specimen
lJ = Poisson's ratio
E = elastic modulus
Subscripts: f = fiber
m = matrix
(40)
These tests have been use 7
to evaluate carbon fiber/epoxy ad- hesion properties by Hawthorne lo) and Mullin. However, they both concluded that these tests were not applicable to carbon fibers due to the low compression strain of the carbon fibers. Compression fracture and local buckling occured prior to the debonding of the fiber.
73

Single 'Filament Critical Length Determination
The single filament critical length determination is an experi- mental technique derived from the load transfer analysis discussed under "Stress Transfer from Matrix to Fiber.." Xelly(l6) illustrated the multiple fracture phenomenon in a system consisting of tungsten wires embedded in a copper matrix. After deformation, the copper matrix was dissolved and the wire fragments extracted. On analysis of the fragment length distribution, it was found that its bounds were approximately 2, and R,/2; where R, was the critical fiber length and was determined from:
where
Ofdf Rc = -
2T Y
(41)
Of = tensile .strength of fiber at R, gauge length
df = diameter of fiber
TY = interfacial shear strength
Equation (41) is a rearrangement of equation (30). Recalling the definition of critical fiber length, this result is not unexpected. The longest fibers capable of surviving in this load situation will have a length just under R ; since longer fibers, by definition, must fracture. C
Analogous ex eriments were run by Ongchin et al,(lS) McGarry(l9) and Fraser et al( !? 2, f or glass fibers in both thermoplastic and thermoset (epoxy) matrixes. Conclusive results were obtained. Wardsworth and Spilling,(lT) Ishikawa et al(l3) and Drzal et a1(14,15) applied this technique to carbon fiber in an epoxy matrix.
Drzal(l4) embedded a single filament of carbon fiber into an ASTM two-and-one-half inch length epoxy casting as in Figure 31. These specimens were then subjected to a tensile deformation. The schematic of the fiber fracture and stress distribution is Presented in Figure 32 (taken from Ref. 14). Figures 33 and 34 show the transmitted polarized light micrographs of a non-surface treated (fiber A) and a surface treated (fiber R) fiber during tensile de- formation and their corresponding shear strength data are presented in Table XI. The effect of carbon fiber surface treatments on ad- hesion is shown clearly by the histogram of the aspect ratios of the two types of fibers in Figure 35.
In addition, the failure mechanisms during debonding can also be observed and characterized.(ls) The epoxy sized carbon fiber promoted a higher interfacial bond strength. The higher joint strength created matrix cracking after fiber fracture whereas no matrix cracking was observed with the non-surface treated, unsized fiber and the surface treated, unsized fiber.
74

Section A-A
FIGURE 31. SCHEMATIC DIAGRAM OF SINGLE FIBER INTERFACIAL SHEAR STRENGTH SPECIMEN*
*From Drzal et al (Ref. 14). Reproduced by permission.
75
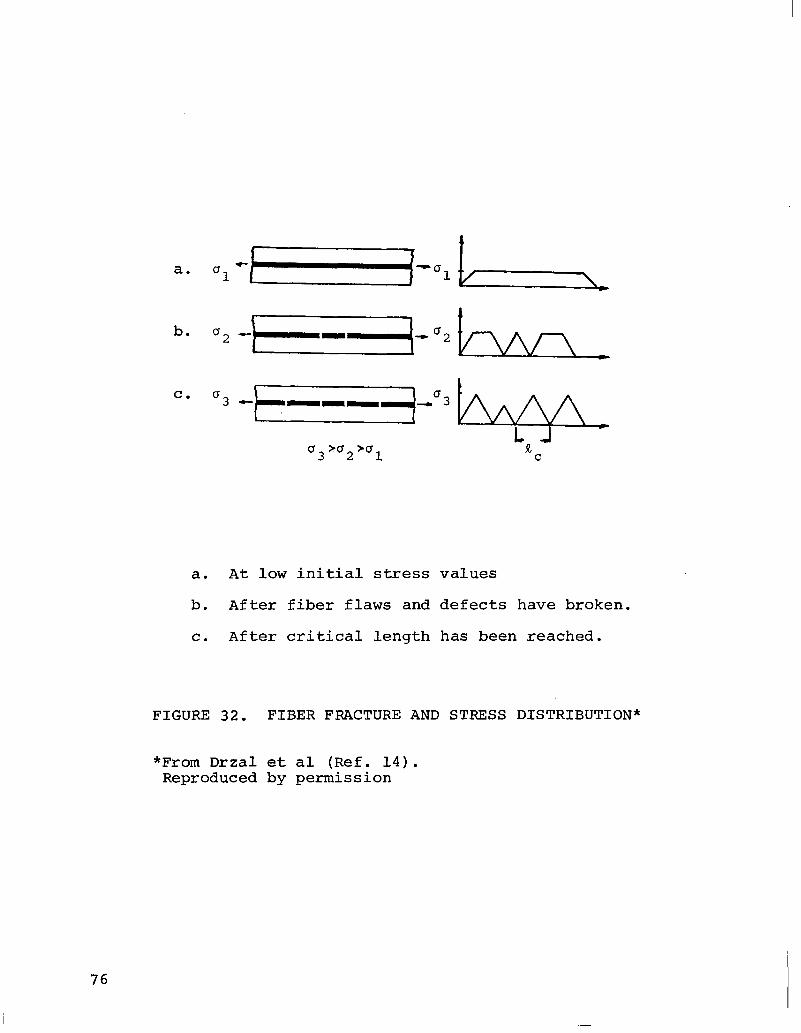
a. At low initial stress values
b. After fiber flaws and defects have broken.
C. After critical length has been reached.
FIGURE 32. FIBER FRACTURE AND STRESS DISTRIBUTION*
76
*From Drzal et al (Ref. 14). Reproduced by permission
-

1 FIBER A / EPON 828 - mPDA 1
FIGURE 33. TRANSMITTED POLARIZED LIGHT MICROGRAPH OF A TYPICAL FIBER A FRACTURE AS A FUNCTION OF INdREASING STRAIN*
*From Drzal et al (Ref. 14). Reproduced by permission.
77

FIBER B / EPON 828 - mPDA
FIGURE 34.' TRANSMITTED POLARIZED LIGHT MICROGRAPH OF A TYPICAL FIBER B FRACTURE AS A FUNCTION OF INCREASING STRAIN*.
*From Drzal et al (Ref. 14). Reproduced by permission.
78
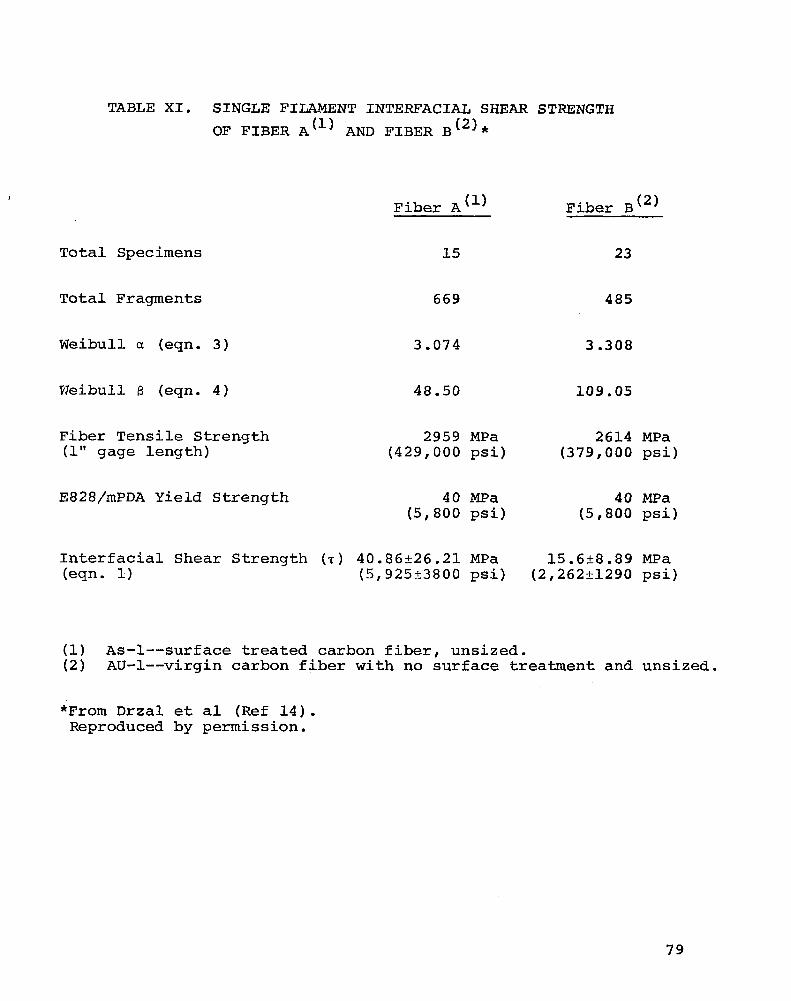
TABLE XI. SINGLE FILAMENT INTERFACIAL SHEAR STRENGTH OF FIBER A(1) AND FIBER B(2)*
Total Specimens 15 23
Total Fragments 669 485
Weibull a (eqn. 3) 3.074 3.308
t7eibull ,3 (eqn. 4) 48.50 109.05
Fiber A(1)
Fiber Tensile Strength (1" gage length)
E828/mPDA Yield Strength
2959 MPa (429,000 psi)
40 MPa (5,800 psi)
2614 MPa (379,000 psi)
40 MPa (5,800 psi)
Interfacial Shear Strength (T) 40.86k26.21 MPa 15.6k8.89 MPa (eqn. 1) (5,925+3800 psi) (2,262+1290 psi)
Fiber B(2)
(1) As-l-- surface treated carbon fiber, unsized. (2) AU-l--virgin carbon fiber with no surface treatment and unsized.
*From Drzal et al (Ref 14). Reproduced by permission.
79

FIbER R vs. PIbER b
I/d Aspect Ratio
Total number of breaks as a function of length to diameter ratio.
FIGURE 35. HZSTOGRAMS OF ASPECT RATIOS FOR FIBER A AND B*
*From Drzal et al (Ref. 14). Reproduced by permission.
80
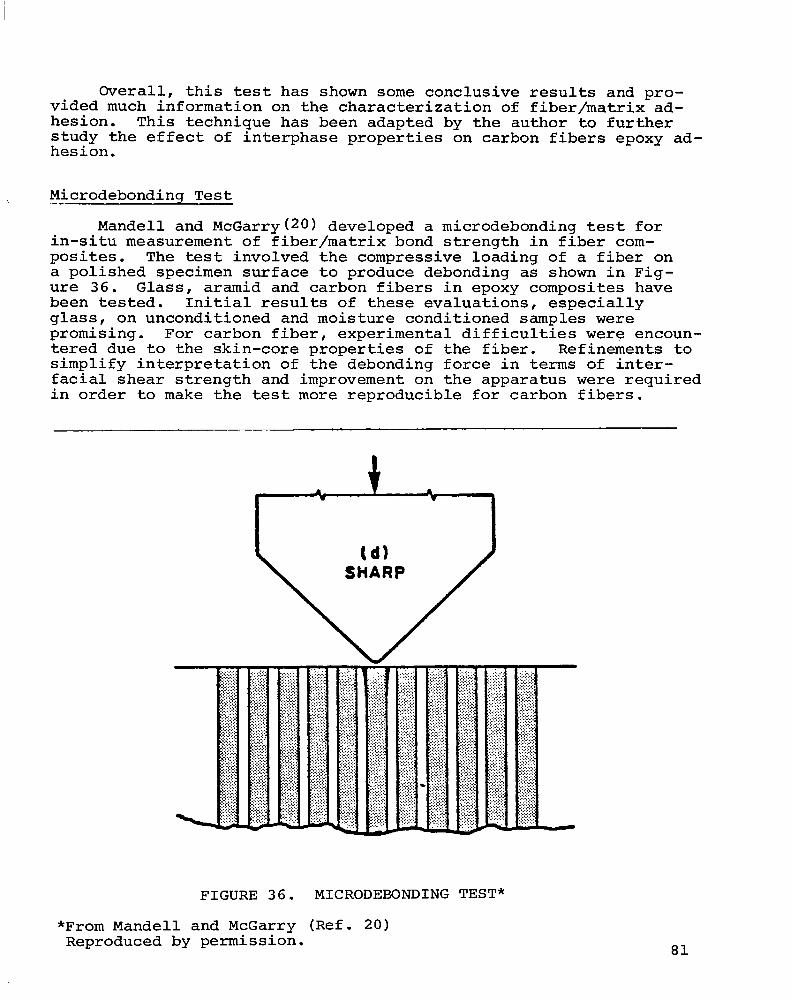
Overall, this test has shown some conclusive results and pro- vided much information on the characterization of fiber/matrix ad- hesion. This technique has been adapted by the author to further study the effect of interphase properties on carbon fibers epoxy ad- hesion.
Microdebonding Test
Mandell and McGarry(20) developed a microdebonding test for in-situ measurement of fiber/matrix bond strength in fiber com- posites. The test involved the compressive loading of a fiber on a polished specimen surface to produce debonding as shown in Fig- ure 36. Glass, aramid and carbon fibers in epoxy composites have been tested. Initial results of these evaluations, especially glass, on unconditioned and moisture conditioned samples were promising. For carbon fiber, experimental difficulties were encoun- tered due to the skin-core properties of the fiber. Refinements to simplify interpretation of the debonding force in terms of inter- facial shear strength and improvement on the apparatus were required in order to make the test more reproducible for carbon fibers.
FIGURE 36. MICRODEBONDING TEST*
*From Mandell and McGarry (Ref. 20) Reproduced by permission. 81

( 1)
( 2)
( 3)
( 4)
( 5)
( 6)
( 7)
( 8)
( 9)
(10)
(11)
(12)
(13)
References to Methods for Measuring Interfacial Bond Strength
L. J. Broutman, "Measurement of the Fiber-Polymer Matrix In- terfacial Strength," Interfaces in Composite, ASTM STP 452 (1969), 27.
P. Lawrence, "Some Theoretical Considerations of Fibre Pull- Out from an Elastic Matrix," J. of Mat'l. Sci., 7 (1972), 1.
P. Bar-tog, "Analysis of Pull-Out Tests on Fibres Rnbedded in Brittle Matrices,', J. of Mat'l. Sci., 15 (1980), 3122. -
J. P. Favre, J. Perrin, "Carbon Fiber Adhesion to Organic Matrices," J. of Mat'l. Sci., Z, (1972), 1113.
J. 0. Outwater and M. C. Murphy, "On the Fracture Energy of Unidirectional Laminates,', Proc. of the 24th Ann. Tech. Conf., SPI, Sec. 11-C, 1 (1969).
J. 0. Outwater and M. C. Murphy, "Fracture Energy of Unidirec- tional Laminates," Modern Plastics, Sept. (1970), 160.
J. 0. Outwater and M. C. Murphy, "The Influences of Environ- ment and Glass Finishes on the Fracture Energy of Glass- Epoxy Joints," Proc. of the 25th Ann. Tech. Conf., SPI, Sec. 16-D, 1 (1970).
L. J. Broutman, "Mechanical Requirements of the Fiber-Matrix Interface," Proc. of the 25th Ann. Tech. Conf., SPI, Sec. 13-B, 1 (1970).
L. J. Broutman, "Glass-Resin Joint Strengths and Their Effect on Failure Mechanisms in Reinforced Plastics," Polym. Eng. and 'Sci., 5, July (1966), 263.
H. M. Hawthorne and E. Teghtsoonian, "Graphite Fibre-Epoxy Matrix Interface Interactions," J. Adhesion, 5 (1974), 85.
J. V. Mullin and V. F'. Mazzio, "The Effects of Matrix and Inter- face Modification on Local Fractures of Carbon Fibers in Epoxy," J. Mech. Phys. Solids, 20 (1972), 391. -
W. A. Fraser, F. H. Achker and A. T. DiBenedetto, "A Computer Modeled Single Filament Technique for Measuring Coupling and Sizing Agent Effects in Fiber Reinforced Composites," Proc. of the 30th Ann. Tech. Conf. of SPI, Sec. 22-A (1975), 1.
M. Ishikawa, I. Narisawa and H. Ogawa, Faculty of Engineering, Yamagata University, "A Study on the Interlaminar Shear Fracture in Carbon Fiber Composites,"
82
(14) L. T. Drzal, M. J. Rich, J. D. Camping, W. J. Park, "Inter- facial Shear Strength and Failure Mechanisms in Graphite Fiber Composites," Proc. of the 35th Ann. Tech. Conf. of SPI, Sec. 20-C, 1 (1980).
(15) L. T. Drzal, M. J. Rich and D. L. Hall, "Structure-Property Relationships at the Composite Interphase," 15th Biennial Conference on Carbon, Amer. Carbon Society, June (1981).
(16) A. Kelly, "The Strengthening of Metals by,Dispersed Particles," Proc. 'Roy. Sot., London, 19282, 63 (1964).
(17) N. J. Wadsworth and I. Spilling, "Load Transfer from Broken Fibers in Composite Materials," Brit. J. Appl. Phys., Ser. 2, 1 (1968), 1049.
(18) L. Ongchin, W. K. Olender and F. H. Ancker, "Fiber Matrix Ad- hesion and the Fracture Behavior of Glass Reinforced High Density Polyethylene,"' Proc. of 'the 27th Ann. Tech. Conf,. ,of SPI, Sec. 11-A (1972).
(19) F. J. McGarry and M. Fujiwara, "Resin-fiber Load Transfer in Reinforced Plastics," Modern Plastics, 143, July (1968).
(20) J. F. Mandell and F. J. McGarry, 'Microdebonding Test for in-situ Bond Strength Measurement;" Summary of Presen- tation at the 3rd Annual Army Composites Research Re- view, Ott (1980) .
83
EXPERIMENTAL
INTRODUCTION
After reviewing the information available in the literature, it is apparent that little effort has been spent on the correlation of theoretical analyses with experimentally determined composite properties; and there is limited evidence that the nature of the interphase can be used to optimize composite properties. In order to clarify some of these uncertain areas, the following experiments were designed to examine the relationship between wetting and in- terfacial shear strength. Also, various finish variants were formulated to demonstrate the effect of interphase properties on composite performance.
MATRIX RESIN
For carbon fiber composites, diglycidyl ether of bisphenol A (DGEBA) epoxies are commonly used in the matrix resin. In order to have a typical matrix that is suitable.for both critical length determination and composite fabrication, system "F" was formulated for the evaluations reported herein. This resin is prepared by mixing 100 parts of Epi-Res 508" and 22.5 parts of Epi-Pure 841.* A unique feature of this system is its high ten- sile elongation-to-break value of 8%, A cure schedule of two hours at 93OC was used combined with a post-cure at 150°C for two hours. The tensile properties of system "F" castings, evaluated at different cure schedules, are shown in Table XII. This high elongation-to-break property of system "F" allows multiple frac- ture of the embedded fiber without matrix failure which enables critical length determination. Some of the other properties ob- tained from castings of system "F" are presented in Table XIII.
Finiisth Variants
To study the effect of fiber/matrix interphase on composite performance, four finish variants'were developed and applied to Celion@ 6000 (C-6K) unsized fiber. These four variants are:
1. C-GK/SR -RTV 615**silicone rubber
2. C-6K/FRE 25 - An organophosphazene ***elastomer blended with Epon 828 at 25 parts elastomer to 100 parts epoxy
* Product of Celanese Plastics and Specialties Co., Louisville, Ky. ** Product of General Electric Co. ***Product of Firestone Co.
84

TABLE XII. TENSILE PROPERTIES OF SYSTEM "F" AT VARIOUS CURE SCHEDULES
Composition:
EPI-RES 508* 100 parts by weight EPI-CURE 841* 22.5 parts by weight
Cure Schedule
Time Temp Sample 0 (" --
1 2 85 2 150 82.1 11.9 3.02 0.44 5.56
2 2 85 3 150 79.3 11.5 2.92 0.42 5.22
3 2 85 4 150 82.1 11.9 2.90 0.42 5.77
4 2 85 2 160 84.8 12.3 2.97 0.43 6.78
5 2 85 2 170 79.3 11.5 2.87 0.42 5.36
6 2 85 2 180 77.2 11.2 2.88 0.42 3.20
7 2 93 2 150 92.4 13.4 3.15 0.46 7.99
8 2 93 3 150 89.0 12.9 3.01 0.44 5.89
9 2 93 4 150 91.7 13.3 2.93 0.43 7.60
10 2 93 2 160 80.0 11.6 2.93 0.43 5.75
11 2 93 2 180 80.0 11.6 2.88 0.42 5.55
Post Cure
?g!iy s
Tensile Strength-Modulus MPa ksi GPa Msi - - - P
Elonga- tion-to
break %
*Celanese Plastics and Specialties Co.
85

TABLE XIII. RESIN CASTING PROPERTIES OF SYSTEM IIF"*
Elonga- Tensile tion-to Flexural
Strenqth Modulus break Strenqth Modulus MPa ksi GPa Msi % MPa ksi GPa Msi - - - m - - - -
RT 92.4 13.4 3.15 0.456 7.99 102.8 14.9 2.90 0.420
121OC 39.3 5.7 1.93 0.280 9.71 72.4 10.5 2.01 0.292
3 Day H20 boil, tested at RT
97.2 14.1 2.60 0.377
Transition Temperature Determined by TMA:
Initial T 9
= 176OC After 3 day H20 Boi = 142OC After 7 day H20 Boil = 143OC
Heat Deflection Temperature = 155OC C@ 1.82 MPa (264 psi)1
Notched Izod = 58.7 J/m of notch (1.10 ft-lbs/in of notch)
*Composition: Epi-Res 508, 100 parts by weight Epi-Cure 841, 22.5 parts by weight
Cure Schedule: 2 hours @ 93OC 2 hours @ 150°C
86

3. C-6K/ETP 10 -An epoxy-thermoplastic blend (in-house devel- oped material) with 10 parts thermoplastic in 1OO'parts epoxy.
4. C-GK/ETP 50- Same as item 3 except this consisted of 50 parts thermoplastic in 100 parts epoxy.
Silicone rubber (a prepolymer) was dissolved in n-hexane, then the curing agent was added to the solution before sizing. The silicone rubber was mixed at a ratio of 10 parts silicone rubber prepolymer to 1 part curing agent.
The FRE 25 sizing solution was prepared by dissolving the organophosphazene prepolymer in acetone. Then, Epon 828 was added in the ratio of 25 parts elastomer to 100 parts epoxy. Just before sizing, 1% by weight of the elastomer of Esperox 10 (t-butyl perbenzoate) was added to the solution. This organoper-
oxide was used as a curing agent for the organophosphazine elas- tomer.
ETP 50 and ETP 10 were dissolved in acetone and the concen- tration of all the sizing solutions were adjusted together with the sizing speed to allow approximately 1% by weight pickup by the fibers.
Silicone rubber was selected to demonstrate the effect of a very soft interphase together with a weak interfacial joint strength. FRE 25 was used to illustrate the effect of a second, soft and dispersed phase at the interphase. Organophosphazene was selected because of its high temperature performance combined with a relatively high strength for an elastomeric material; it is also tough and is compatible with epoxy resins. The purpose of the polyblend material is to maintain the strength at the inter- face while the elastomeric material is damping the impact and/or blunting crack tips to enhance toughness.
The same principles were applied in the selection of the thermo- plastic-epoxy blend, ETP 10 and ETP 50. The only difference is that the thermoplastic epoxy blends provide higher modulus as well as strength. The difference in concentrations is to provide step- wise increases in modulus and strength at the interphase.
Although the properties of the finish variants were not charac- terized due to many unsuccessful attempts to make castings from these materials, it is estimated that the moduli of the interphases should be in the foll'owing order:
ETP 10 > ETP 50 > FRE 25 > SR
87

EXPERIMENTAL RESULTS AND DISCUSSION
Wetting Force Measurement
The Wilhelmy micro-balance wetting force technique was used to characterize the surface of carbon fibers. A micro-computer was used to control the wetting experiment as well as to carry out the data processing. The details of the apparatus construction are discussed in Appendix B and the program developed by the authors for an HP-85A micro-computer is attached in Appendix C.
To characterize the surface energetics of the carbon fiber, double distilled water was used initially. A very careful cleaning procedure for the glassware which contains the wetting liquid was required so that the surface tension of the. contained water approaches 72.4 x low3 N/m. This vigorous cleaning process is detailed in Appendix D. 10-3
By employing this cleaning process, a consistent 72.3 x N/m f 1 x 10m4 N/m surface tension for water was measured. Con-
tact angles for unsized fibers were measured successfully with water as the wetting liquid. However, when the fibers contained finish, misleading wetting forces were obtained. This is primarily due to the finish slowly dissolving into and contaminating the water. As a consequence, a significant drop in surface tension of the water took place. This caused the wetting force to drop during the ex- periment. Some of these results are listed in Table XIV. The large scatter of data within each region with little or no hysteresis effects indicates that the surface tension of the wetting liquid was changing during the experiment. The surface tension of the water dropped as much as 5 x 10m3 N/m after experiments were conducted.
Under this condition, water, as well as other commonly used liquids with known surface tension are not applicable for this study because of the contamination/dilution process. Nevertheless, in order to understand the wetting behavior and to prescribe the optimum prepregging condition, a major component of the matrix resin should be used as the wetting liquid. Although contamination by finish from the sized fiber still continues, this is representative of the prepregging process. A DGEBA epoxy resin, Epi-Res 508, was selected to be the wetting liquid. Epi-Res 508 was chosen because of its relatively low viscosity and it is the major component of the matrix used in this study. A viscosity-temperature profile of Epi- Res 508 was determined in a Brookfield viscometer and is shown in Figure 37. An insulated clean beaker was used to contain and to maintain the resin at approximately 70°C. At this temperature, a reasonable low viscosity, 0.16 Pa (160 cps) was obtained and no sig- nificant dynamic wetting phenomenon was observed. The wetting force data obtained for a series of fibers and finishes are shown in Table XV.
Comparing the data in Table XV, the effect of finish variants on wetting behavior was demonstrated. The receding angles of all the samples are all similarly high suggesting that, once the fibers
88

TABLE XIV. WETTING FORCE MEASUREMENTS OF CARBON FIBERS WITH WATER AT 23OC
Advancing, pg Equilibrium, pg Receding, ug Sample '('contact ang'le; 8 )(contact angle, B)(contact angle, or)
C-SW(l) 82.3 f 5.5 89.4 ?I 7.2 97.5 2 9.7 (60° Z!I 2.3O) (57O f 3O) (53O z!z 4.3O)
AS-i(2) 81.7 f 7.5 91.3 f 9.8 108.0 f 8.0 (61° IIZ 3O) (57O f 4O) (50° + 3.3O)
c-6KE(3) 44.2 + 14.6 41.8 f 24.0 63.5 f 10.0
T-63OO(4) 90.9 2 18.3 91.3 rf: 23.3 100.4 + 21.4
(1) CelionQ 6000 unsized carbon fiber. (2) Hercules AS-l unsized carbon fiber. (3) Celion@ 6000 standard epoxy compatible sized fiber,
commercial product. (4) Thornel T-6300 standard commercial sized fiber.
89

EPI-RES 508
0.01
Temperature ("C)
FIGURE 37. VISCOSITY-TEMPERATURE PROFILE OF EPI-RES 508 .EPOXY RESIN MEASURED BY A BROOKFIELD VISCOMETER WITH SPINDLES NO. 1 AND 2.
90

TABLE XV. WETTING FORCE MEASUREMENTS OF CARBON FIBERS WITH EPI-RES 508 RESIN AT 70°C
Sample
T-6300(') AS-lt2) C-6KV(3) c-6Ku(4) C-6KEt5) C-6K/ETP 50t6) C-6K/ETP 10t7) C-6K/FRE 25(8) C-6K/SR(')
Advancing, pg Equilibrium, ug Receding, pg
72.8 ?I 27.6 .57.2 + 10.6 67.0 + 11.3 75.6 !I 19.4 55.8 + 19.5
107.4 f 28.4 86.0 IL 40.0 71.7 f 10.7 -1.6 rl: 18.2
95.6 + 18.5 74.4 2 5.4 80.2 + 9.9 83.2 + 19.5 91.4 f 13.3
127.2 + 29.4 103.0 Z?Z 39.0
82.0 SC 12.6 50.6 f 4.1
103.8 sz 20.2 87.2 + 7.8 92.2 + 14.9 88.6 zk 20.9
102.4 + 12.9 135.0 f 29.1 109.0 f 43.0
90.2 f 14.9 99.8 ZIG 48.2
Note: All carbon fibers were surface treated except C-6KV.
(1) (2) (3) (4) (5) (6) (7) (8) (9)
Thornel standard sized 6000 filament per tow carbon fiber. Hercules unsized carbon fiber. Celion@ 6000 virgin fibers --no surface treatment and unsized. Celion@ 6000 unsized carbon fiber. Celion@ 6000 standard epoxy compatible size, commercial product. Celion@ 6000 sized with finish variant ETP 50. Celion@ 6000 sized with finish variant ETP 10. Celion@ 6000 sized with finish variant FRE 25. Celion@ 6000 sized with finish variant SR.
91

are "wetted," there is little or no rearrangement of the resin film on the surface of the fiber. However, in the advancing measurements, large variations are observed. This suggests that some finish variants have better compatibility with the matrix resin and can be wetted easier. For example, silicone rubber coated Celion@ 6000 showed the lowest wetting force (negative) which indicates that, in order to wet this surface,
additional external forces are needed to forcibly wet it. This will most likely also result in poor adhesion.
On the other hand, the finish variant ETP50 showed the highest advancing wetting force which suggests that the resin is highly compatible with this surface and it will probably translate to good interfacial adhesion. Furthermore, with a high advancing wetting force fiber, better quality prepreg is likely, due to the minimization of trapped air at the interface by rapid advance- ment of the wetting liquid/resin. In other words, improved lam- inate properties are anticipated.
Sincle Fi'lament Adhesion Test
As previously discussed, the single filament critical length determination was identified to be one of the better methods for characterization of carbon fiber/epoxy interfacial bond strength. Recall the load transfer mechanism, wherein the critical length, Qc is determined by equation (41):
Qc = af df (41) 2T
Y
where
of is the tensile strength of the fiber at critical length
df is the diameter of the fiber
-c Y
is the interfacial shear strength
By determining of and measuring Q, and df, the interfacial shear strength, 'C can be obtained as already stated by rearranging equation (41) to the form shown for equation (30):
= Pf df T (30) Y
2Qc
92

The critical length and the diameter of the fiber can be measured optically by embedding a single filament in an epoxy matrix and stressing the specimen to a strain value such that no additional fracture can be obtained with additional stress. However, to ob- tain the tensile strength of carbon fiber at the critical length is itself an involved task. Carbon fiber strength is sensitive to gauge length and the critical length of carbon fiber is too small to experimentally test in a reliable manner. Nevertheless, it was shown(l) that a linear relationship can be obtained by plotting single filament tensile strength versus the logarithm of gauge lengths. The test method is described in Appendix E.
Gauge lengths of 7.62 cm (3-inch), 2.54 cm (l-inch), 1.27 cm (+-inch), 0.635 cm (+-inch) and 0.254 cm (l/lo-inch) were tested
for each fiber type and finish variant and best fit straight lines were obtained from these five data points for each variant. These straight lines were then extrapolated to the critical length and the tensile strengths were obtained. The results of these gauge length studies are presented in Appendix F.
To perform the adhesion test, a single filament of carbon fiber was aligned in the center of an ASTM 6.35 cm (2+ inch) dogbone epoxy casting. The dimensions of the dogbone specimens are 0.32 cm (l/8 inch) wide x 0.16 cm (l/16 inch) deep with a 2.54 cm (1 inch) long gauge section. Fabrication of the specimen and alignment of the fiber was accomplished with the aid of an RTV-630* silicone rubber mold. A silicone rubber mold was used because of the ease in making a flexible mold cavity by casting the rubber around stand- ard ASTM injection-molded dogbone specimens. Moreover, the use of silicone rubber molds also prevents fiber surface contamination be- cause they do not require the application of mold release agents.
Sprue spots were cut precisely in the center of each end for each dogbone to a depth of 0.08 cm (l/32 inch) to align and secure each fiber to be embedded. Once the fiber was aligned, a drop of rubber cement was used to hold it in place. During the fiber selec- tion, mounting and the application of rubber cement, the section of the fibers placed in the mold cavity were not handled nor contamin- ated.
After the rubber cement was set, system "F" resin was intro- duced with an eye dropper into the cavity. Extreme care was exer- cised to prevent damaging and/or mis-aligning the fiber. Then the whole was degassed in a vacuum oven and cured according to the schedule previously described.
Since system "F" is an amber transparent solid, visual and microscopic evaluation of the fiber and the critical length can be performed with ease. Furthermore, system "F" also exhibits photo- elastic properties which can be used to evaluate the stress patterns at the interphase.
*General Electrrc Co., Srlrcon Rubber Dept., Waterford, NY.
93

.
To apply this test to the above mentioned specimen, .a special tensile fixture was designed and mounted onto a stage micrometer for a Leitz ortholux optical microscope. Long working distance ob- jectives and polarizing condensers were used. The details of the design for the tensile fixture are presented in Appendix G.
To carry out this study, the specimen was initially examined for fiber alignment, breakage and residual stress. Due to the low cure and post cure temperatures employed with this system, together with a slow cool down rate, no apparent residual stresses were ob- served in the samples. The specimen was then stressed to different strain values at approximately 0.5% intervals and at each strain level, the number of the broken segments was counted. When this number remains constant with increasing strain, the critical length of the fiber is reached. This test was repeated on at least ten specimens for each fiber type/finish variant and the cumulative fiber lengths were used to determine the critical length.
Once the segment lengths of the fibers were obtained, a statistical approach to determine the critical length of the fiber was used. According to Drzal et al, t2) these data sets fit the two parameter Weibull distribution auite well.
forX>o (42)
where
X is the aspect ratio, fiC/df
a is the shape parameter
6 is the scale parameter
The maximum likelihood methods were employed to estimate the parameters of the Weibull distribution. These parameters are solutions to
5 ( i=l i
a
) 0 %I x i 5* x
i=l ( >
i 1 = 0 (43)
fx a
0 i=l i
15 x i=l
( i
a n
lla
(44)
94

A computer program was developed to evaluate these two parameters, a, 8, numericall.y, these were then used to calculate the shear strength and the listing is attached in Appendix H. The mean and the variance of the interfacial shear strength were then obtained from
y= af 2Br ( )
1-t (45)
and
r(l- 2 ) - r2 (l- + ) (46) a
where
r is the Gamma function
Another program was also developed to plot the cumulative function and the population density function (histogram) of the critical aspect ratio for each fiber type/finish variant. This program is also listed in Appendix I.
The results of the interfacial bond strength determinations for the different fiber types/finish variants are listed in Table.XVI and the histograms of the critical aspect ratios are shown in Figures 38 through 46. The results clearly indicate that the surface treatment improved the interfacial adhesion significantly and that coating the carbon fibers with silicone rubber inhibits interfacial bonding. The remainder of the sized and unsized fibers together with the other finish variants did not show meaningful difference.
An underlying reason for the lack of additional distinctions is the large variation in the shear strengths and the 1:l rela- tionship between extrapolated tensile strength and shear strength. This effect is seen in the AS-1 data shown in Appendix F whereby an abnormally high extrapolated tensile strength translates directly to a proportionally high shear strength.
In conclusion, this test can be used to identify strong and weak interfacial bond strengths successfully. ?Xowever, due to the nature of this test, it cannot reliably differentiate small differences.
95

TABLE XVI. SINGLE FILAMENT INTERFACIAL SHEAR STRENGTH
Sample ufr~ce
MPa ksi
T-6300(l) (Sized) 4414 640
5931 860
c-6Kv(2) 2772 402 3.255 71.385
C-6KU 4828 700 3.413 45.282
C-6KE(l) 5379 780 3.094 47.092
C-GK/ETP 50 5400 783 3.752 47.394
C-GK/ETP 10 5655 820 3.857 51.726
C-GK/FRE 25 5172 750 3.742 46.899
C-GK/SR 4276 620 3.001 185.952
(1) Commercially available carbon fibers
a -
3.657
3.294
li
46.368
41.736
MPa
60 + 29
92.6 t 53.2
25.4' 2 14.9
68.6' + 37.1
76.3 + 48.9 -
71.1 + 33.2
67.7 2 30.3
68.9 + 32.3 -
15.57 + 10.56
ksi
8.682 + 4.211 -
13.43. + 7.707
3.687 5 2.159
9.948 f 5.382
11.07 2 7.09
10.31 f 4.81
9.81 + 4.39
9.99 f 4.68
2.257 + 1.531 -
(2) Virgin carbon fibers with no surface treatment and unsized
.T6E 1-l E 1 E: 11 L L D I S T R ! B IU T I 0 t4
HSPECT RATIO
FIGURE 38. HISTOGRAPH OF CRITICAL ASPECT RATIO OF T-6300 STANDARD SIZED CARBON FIBERS
.R:3 1 WEIl3ULL DISTRIBUTION FlJNCTIrJN
P 0 P U L A T I 0 N D E N E; I T ‘l A S - 1 8488r
.- - <.. -,. ,, ?
.:. '.
: ,'
: . . .
. . \.. .
1 26 48 5r3 8 8 1 B 8
ASPECT RATICl
FIGURE 39. HISTOGRAPH OF THE CRITICAL ASPECT RATIO OF AS-1 UNSIZED CARBON FIBER
97

14 E I i3 11 L L D 3: S T R I E: U T 1 11 t.1 C6V
P 0 P U L A T I 0 t4 [I E t4 S I T ‘i’ C: - 6 8 8 8 1-l t-4
84r3Br
&i2giQ -
Z’ ..’ c_- .--.-- . . .._..
c; ,. 2 . . - . . /’ . . .
;SlQQ- . . .' '. . .* . . . !I _ i' . . . . . . '.L . .
8 o~~~---------*~ ' . . . .. . .
2:8 48 5 0 88 1k.l
ASPECT MT;0
FIGURE 40. HISTOGRAM OF THE CRITICAL ASPECT RATIO OF CELION@ 6000 WITH NO SURFACE TREATMENT AND UNSIZED
RSPECT EAT10
FIGURE 41. HISTOGRAM OF THE CRITICAL ASPECT RATIO OF CELION@ 6000 WITH SURFACE TREATMENT BUT UNSIZED
98
W E I E l-1 L L .CGE
D I S T R I E U T 1 0 t.1 F’ [I P l-l L H T 1 0 1.4
8488 [I E t.1 S 1 T ‘1’ c’ I:: - 6 0 @ 8 E :a
ASPECT RftTIO .
FIGURE 42. HISTOGRAM OF THE CRITICAL ASPECT RATIO OF CELION@ 6000 STANDARD EPOXY COMPATIBLE SIZE (COMMERCIAL PRODUCT)
.ET5 1.1 E I E 1-1 L L D I S T R I E 11 T’ I 0 t.4
F’ 0 P U L H T I Ci N [I E tI S I T Y E T F' 5 @ 8488
ASPECT RATIO
FIGURE 43. HISTOGRAM OF THE CRITICAL ASPECT RATIO OF CELION@ 6000 WITH ETP-50 SIZE
99
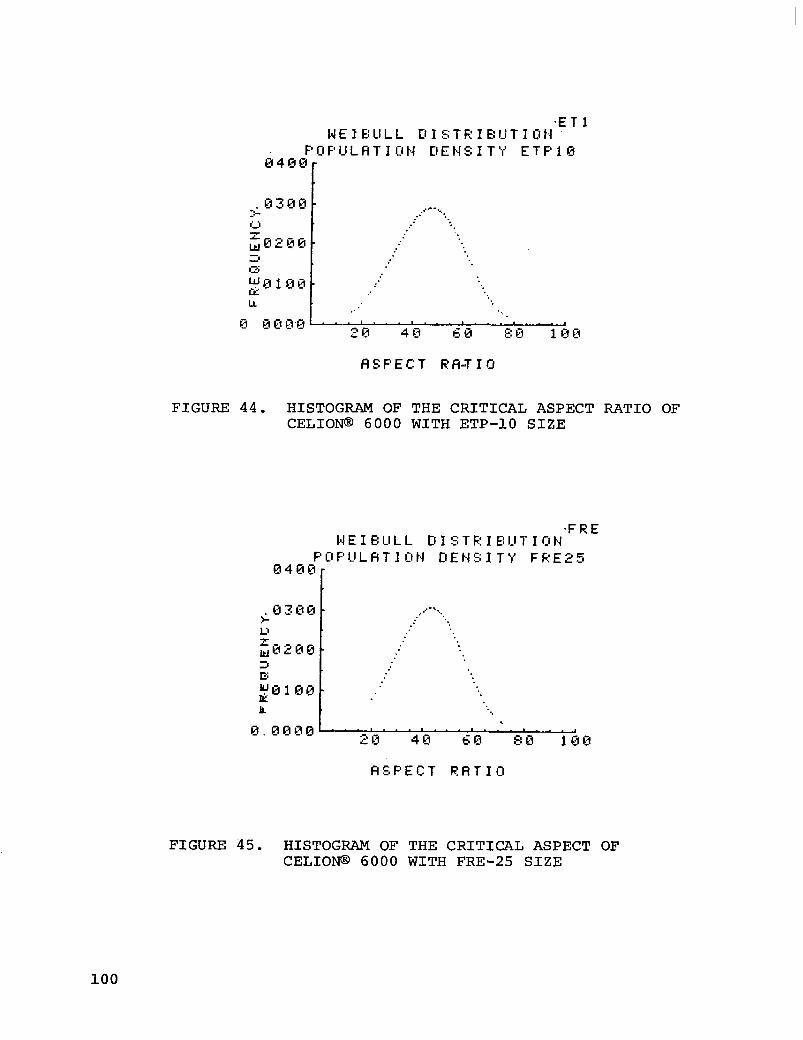
t3SPECT R/ST10
FIGURE 44. HISTOGRAM OF THE CRITICAL ASPECT RATIO OF CELION@ 6000 WITH ETP-10 SIZE
.FRE W E I E U L L Cl 1 S T R I B l-1 -i I 0 t.1
,P.., .’ .,
: ._
RSPECT RATIO
FIGURE 45. HISTOGRAM OF THE CRITICAL ASPECT OF CELION@ 6000 WITH FRE-25 SIZE
100

bl E I E U L L 11 I S T R I E IJ T I 0 1.1
0.00001 . . . 4 100 k00 300 400
ASPECT RATIO
FIGURE 46. HISTOGRAM OF THE CRITICAL ASPECT RATIO OF CELION@ 6000 WITH SILICONE RUBBER SIZE
101
Although this test cannot differentiate small differences numerically in interfacial bond strength, it does provide some information on fracture behavior of different fiber types/finish variants. Three distinctly different types of fracture behaviors were observed. The optical photomicrographs of these fracture behavior patterns are shown in Figures 47 through 49 and a schematic diagram of these three fracture modes is presented in Figure 50.
From this information, it is clear that the commercial epoxy- based sized fibers provide a higher interfacial shear strength and that brittle matrix cracks were initiated at the fiber fracture ends. However, ETP-50 sized Celion@ 6000 produced a ductile, energy absorbing type of crack at the interphase. Further in- crease in stress on the latter fibers created a sharp, brittle crack extending into the bulk matrix material. These observa- tions suggest that it may be possible to achieve both high shear strength and increased fracture toughness simultaneously.
102
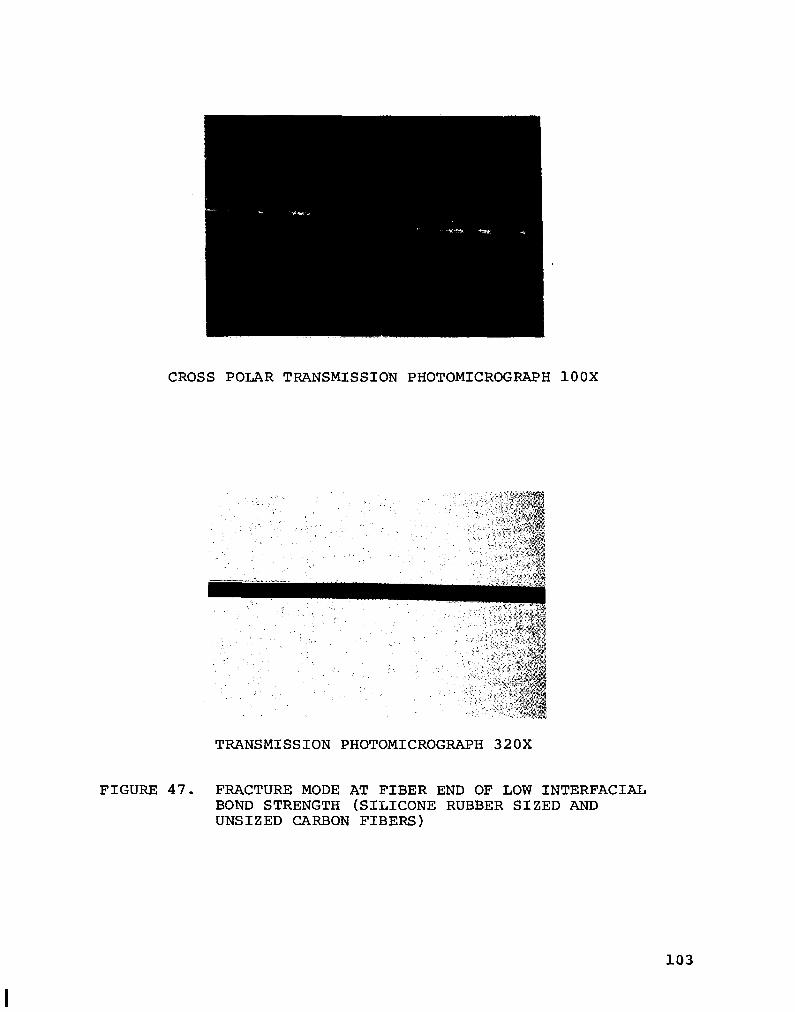
CROSS POLAR TRANSMISSION PHOTOMICROGRAPH 100X
TRANSMISSION PHOTOMICROGRAPH 320X
FIGURE 47. FRACTURE MODE AT FIBER END OF LOW INTERFACIAL BOND STRENGTH (SILICONE RUBBER SIZED AND UNSIZED CARBON FIBERS)
103

TRANSMISSION PHOTOMICROGRAPH 320X
CROSS POLAR PHOTOMICROGRAPH 200X
FIGURE 48. FRACTURE MODE AT FIBER END OF HIGH INTERFACIAL BOND STRENGTH WITH STANDARD EPOXY SIZED CARBON FIBER. BRITTLE FAILURE INTO MATRIX AT FIBER ENDS.
104

CROSS POLAR PHOTOMICROGRAPH 320X
TRANSMISSION PHOTOMICROGWH 320X
FIGURE 49. FRACTURE MODE AT FIBER END OF LOWER MODULUS FINISH (ETP 50) CARBON FIBER. A DUCTILE FRACTURE MODE AT INTERPHASE INDICATES A TOUGH FRACTURE BEHAVIOR. THE INNERLAYER IS IDENTIFIED BY THE SHARP BRITTLE CRACK EXTENDED INTO THE BULK MATRIX MATERIAL.
II
105

a) Typical unsized fiber or weak interfacial bonding - no matrix crack.
b) Celion@6000 standard epoxy sized fiber brittle cracks initiated at fiber ends.
Cl Celion@%OOO sized with ETP-50 different crack geometry immediately adjacent to fiber. Brittle matrix crack developed outside the interphase region.
FIGURE 50. A SCHEMATIC DIAGRAM OF THE THREE TYPES OF FAILURE MECHANISMS AT FIBER ENDS WITH DIFFERENT FINISHES
106

References
(1) P. E. McMahon, "Graphite Fiber Tensile Property EValuation," SAMPLE Quarterly, Vol. 6, No. 1, Oct. (1974).
(2) L. T. Drzal, M. J. Rich, J. D. Camping and W. J. Park; "Inter- facial Shear Strength and Failure Mechanisms in Graphite Fiber Composites," _Proc. 35th Ann. Tech. Conf. of SPI, Sec. 20-C (1980).
107

Effect 'of Sizings 'on 'Composite Properties
The finish variants were formulated and applied to Celion@ 6000 unsized carbon fiber. A three-inch wide prepreg tape with 'a thick- ness of 0.127 mm (5 mils) was prepared from each variant. Laminates were then fabricated us‘ing a match-metal-die molding technique. 0°-tensile properties together with 0°-flexural, 90q-flexural and short beam shear (SBS) at both room temperature and 93.3OC (200'F) were measured. An ETI-Dynatup drop dart instrumented impact tester (Appendix J) was used to measure the impact toughness of additional laminates. An approximately quasi-isotropic, [+45/90/-45/O/ 45/9O]s lay-up was used for the impact toughness measurements. To character- ize the toughess of these laminates, the maximum penetration force, PF recorded on the tester is reported along with PI, the force assoc- iated with initial damage. These composite properties together with the wetting force measurements and the single filament adhesion strength are presented in Table XVII.
To further evaluate this toughness enhancement obtained with resin system "F," a commercial resin system 5208 is used. Finish variant ETP-50 and a standard commercial size (serving as a control) were applied to Celion@ 6000 unsized fiber and their properties are presented in Table XVIII.
Comparing the wetting force measurements with both the single filament adhesion strength and the composite shear strength, it can be seen that good wetting is required for good adhesion, However, better wetting as measured herein does not necessarily provide stronger interfacial bonding. This also suggests that once the fibers are "wetted," regardless of how the wetting is achieved, either forcibly wet or due to differences in surface energetics, then some adhesion can be achieved. This is identified in the silicone 'rubber sized car- bon fiber composites where structural integrity is maintained in spite of chemical incompatibility. However, stronger interfacial bond strengths are clearly obtained with the other finish variants and the control. This probably arises from more favorable chemical bonding at the interface.
Although a 1:l correlation between the single filament adhesion strength and the composite shear strength was not demonstrated, the single filament test is still very useful. This test method provides valuable insight into adhesion fundamentals, the underlying composite shear strength and the failure mechanisms involved in corresponding composites.
It is noteworthy that three of the finish variants selected in this study, ETP-50, ETP-10 and FBE-25 all show significant increases in impact toughness with no corresponding decreases in other mechani- cal properties either at room or elevated temperature. This impact
108

E N3m (dull
m-llurl4dl
N6v
C-uv
C-(R
CUlFDUl
CM10
.XvRG25
CW
‘-mc~~ I-II
--ama:
72.W21.6 95.6416.5 103.Yrn.l
57.2410.6 14.445.4 97.247.0
67.a411.3 60.249.9 92.2414.9
75.6419.4 93.2419.5 W.648.9
55.6419.5 91.4413.3 102.4412.9
107.ct26.4 127.a29.4 135.w29.1
w.ww.0 103.0439.0 109.Q443.0
71.?610.7 12.112.6 P3.2414.9
-1.6416.2 9.644.1 99.Y46.2
59.9f29.0 (6.68t4.20
.92.6453.2 1669 131.0 113.434a.71) (2421 ll9.0)
25.313.9 (X69+2.021
66.6d31.1 19.954s.M~
76.346.9 (ll.OTt7.09l
Il.lf33.2
67.7Q.3
66.w32.3
15.57ilO.54 1621 127.6 12.257fl.531) I2351 l16.51
1669 142.6 1242) (10.71
1641 144.2 (2671 120.9)
a69 153.8 l3ml 122.3
1?9l 141.4 I2601 lrn.5)
1766 130.3 (2Yl (10.91
2OM 141.4 I2951 lrn.51
1131 145.5 (251) (21.1)
m m
m m
m m
1952 151.7 I2631 (22.0)
1655 144.0 I2691 (21.0)
1626 146.2 1265) 121.2)
1683 133.1 12731 (19.3)
1766 133.1 12591 (19.31
1414.' 115.9 fmw 119.1)
1800 121.4 I2611 (17.61
1676 115.9 1241) 116.61
1331' 127.5 1193)' 116.5)
1910 123.4 I2771 (17.91
lE46 123.4 1266) 1179)
2090 127.6 lx331 (10.5)
1566 122.1 12301 117.7
1931 127.6 I2801 rl6.51
M6.9 110.3 lll7l 118.91
m 99.31 I14.4)
M m
n.93 Ill.31
m m
m m
m m
1069 I1551
61.36 lIl.4)
931 1135)
04.03 112.3)
973 66.21 I14211 19.61
1096 r1581
745 I1081
14.44 4.21 63.45 91.03 51.24 1391 l10.6) 11.191 (9.11 (13.2l l6.31 13141
26.21 7.59 m.00 M.Q 24.26 1066 0.6) (1.101 (2.91 15.0) (4.1) 14241
6.63 m 93.10 Il.281 113.5)
7.11 M 111.45 Il.041 (12.11
m m 49.66 17.2)
m m 66.21 m m 112.51
1.45 71.03 95.66 (1.W (10.3) (13.9)
1.52 74.46 66.96 Il.091 (10.6) (12.61
s.b3 71.03 65.52 Il.261 (10.3) (12.41
93.3-c
T1,
m
91 ” abl yLbl
m la
la la M
m la M
m m m
51.24 (6.3)
1lM I2671
1461 13331
6.45 I6.231
51.24 1466 1926 10.47 16.31 l3Yll 14331 11.711
56.55 072 1935 10.67 16.2) 13311 14361 (1.11)
1637 (413)
22m (4991
9.34 cc.691
11.62 (6.72)
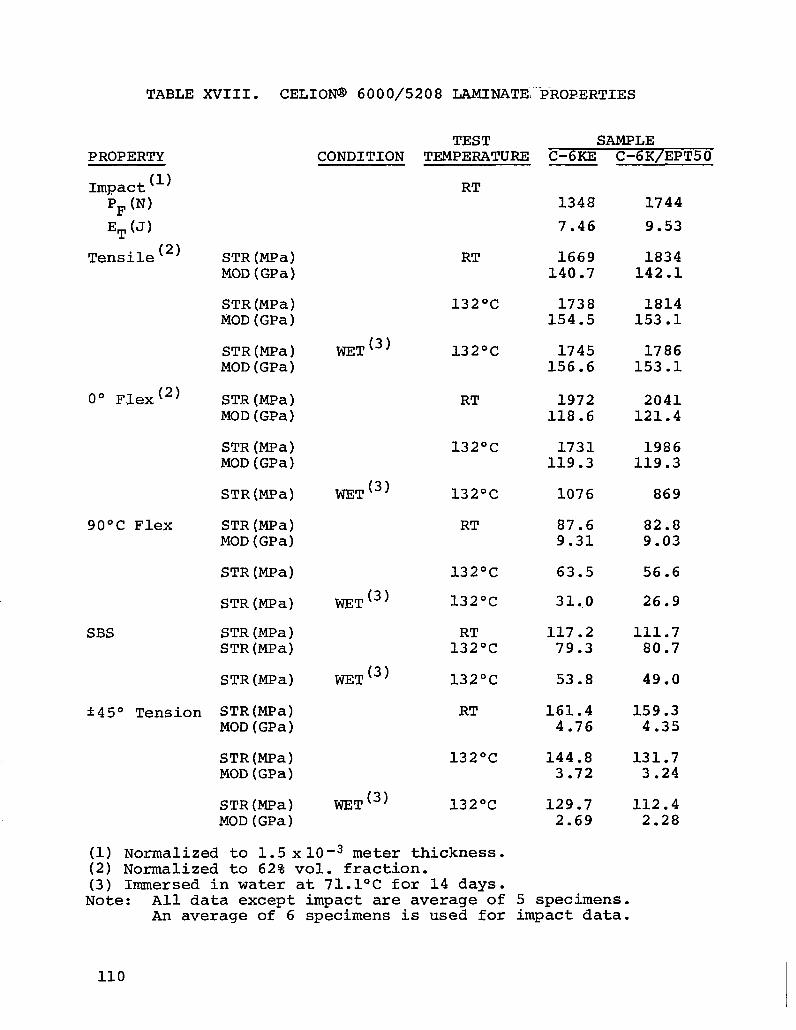
TABLE XVIII. CELION@ 6000/5208 LAMINATE,
PROPERTY
Impact(') pF (NJ ET(J)
Tensile(2)
O" Flex(2)
90°C Flex
SBS
STR(MPa) MOD(GPa)
STR(MPa) EiOD(GPa)
STR(MPa) MOD(GPa)
STR(MPa) MOD(GPa)
STR(MPa) MOD(GPa)
STR(MPa)
STR(MPa) MOD(GPa)
STR(MPa)
STR(MPa)
STR(MPa) STR(MPa)
STR(MPa)
k45O Tension STR(MPa) MOD(GPa)
STR(MPa) MOD(GPa)
STR(MPa) MOD(GPa)
TEST CONDITION TEMPERATURE
RT
RT
132OC
WETI 132OC
RT
132OC
WETt3) 132OC
RT
132OC
WET(3) 132OC
RT 132OC
WET(3) 132OC
RT
132OC
WET(3) 132OC
(1) Normalized to 1.5 x~O-~ meter thickness. (2) Normalized to 62% vol. fraction. (3) Immersed in water at 71.1°C for 14 days.
Note: All data except impact are average of 5 - -
PROPERTIES
SAMPLE C-6KE C-6K/EPT50
1348 1744 7.46 9.53
1669 1834 140.7 142 .l
1738 1814 154.5 153.1
1745 1786 156.6 153.1
1972 2041 118.6 121.4
1731 1986 119.3 119.3
1076 869
87.6 82.8 9.31 9.03
63.5
31,o
117.2 79.3
56.6
26.9
111.7 80.7
53.8 49.0
161.4 159.3 4.76 4.35
144.8 131.7 3.72 3.24
129.7 112.4 2.69 2.28
specimens. An average of 6 specimens is used for impact data.
110
toughness improvement is also shown in the 5208 resin system. The mechanisms involved are not fully understood. It is postulated that the softer innerlayer at the interphase diminishes some 'of the in- ternal residual stresses and thereby eliminates stress concentrations. The significant improvements in impact toughness may arise from damp- ing effects of shock waves at each fiber interphase 'where 'an energy dissipating material is not present. In any case, this study has demonstrated that tailoring of the interphase properties can enable significant improvement of composite performance.
111

MODEL DEVELOPMENT
The analytical model discussed under the section, "Stress Transfer from Matrix to Fiber," is valid only if there is no interphase region. However, it was shown by Drzal et al(l) and by the authors that an interphase does exist and its effect on composite properties is significant. Therefore, a modification of the existing analytical model is essential.
From the observations and the results of this study, several recommendations can be made by the authors to support the develop- ment of a new analytical model which includes a third phase - the interphase region.
Experimentally, the authors have shown that incorporation of a lower modulus interphase region results in the observation of a different fracture mechanism. This energy absorbent inner layer also improves the impact toughness of the composite. Further, there is some indication that the transverse matrix crack which occurs at a fiber fracture is blunted and that the tensile strength of a laminate is slightly enhanced. However, it has to be made clear that not only the physical properties of the interphase are important, but the chemical nature of the interphase also has to be considered. This is because some chemical bonding is required to provide strong interfacial shear strength to maximize the load transfer across the interface. The thickness of this interphase may itself be crucial. An annulor layer which is too thin may not be effective in improving impact resistance, while too thick a layer may lower other laminate properties such as transverse tension and compression, etc.
A schematic diagram of the modified model with the incorporated inner layers is shown in Figure 51. A micromechanistic approach can be taken to analyze the stresses in each region. Two approaches with different assumptions can be taken.
First, consider the fiber to be very rigid, when under stress and the true deformation of the fiber to be negligible compared to the matrix and the inner layer. In this case, a ductile inner layer of low shear modulus combines with the matrix to undergo large deformations in transferring tensile load to the fiber. Or second, consider the fiber to be an inclusion in the inner layer material, then treat the fiber/inner layer composite with its inherent characteristics as an inclusion in the bulk matrix.
After the stress states are determined, then classical micro- mechanistic approach can be used to study the composite properties. The resulting analytical model should include a third phase intro- duced by either (or both) of the approaches illustrated in Figure 51.
To incorporate the experimental results reported here, some refining experiments are necessary:
112

v is the shear modulus
K is the bulk modulus
and subscript
m = matrix
I = interphase
f = fiber
FIGURE 51. A SCHEMATIC DIAGRAM OF AN INNERLAYERED INCLUSION
113

What is the modulus of the interphase?
What is the composition gradient (and property gradient) across the interphase?
What is the effect of interphase thickness?
What is the degree of bonding required at the fiber surface? (Is the perfect bonding assumption a valid one?)
What is the effect of finish on the load transfer to an adjacent fiber? (What is the loaded length of the ad- jacent fiber in the vicinity of a fracture?)
The answers to these questions and additional experimental observations would be amenable to analytical modelling to predict and account for the observed phenomenon. A valid model must be consistent with the observations.
114

CONCLUSIONS AND RECOMMENDATIONS
An extensive literature review on the role of interface and interphase in composite properties has been completed and ex- periments were designed to clarify some of the uncertainties encountered in this survey.
Wetting angle measurement on fiber surfaces is the most commonly used technique to predict adhesion strength due to wetting. However, no direct correlation has been shown between wetting angle measure- ments and fiber-to-matrix bond strength. In this study, wetting behavior has been characterized by the Wilhelmy wetting force measurement and interfacial shear strengths have been studied via the single filament critical length determination. The results indicate that intimate contact is necessary for adhesion, but chemical bonding may be responsible for higher interfacial bond strength.
Further, the results also indicate that by tailoring the inter- phase, different failure mechanisms can be achieved without signif- icant loss in interfacial bond strength. This approach was in- vestigated more thoroughly by an in depth evaluation of laminate properties. A significant improvement in impact toughness was obtained without loss of static mechanical properties. The con- clusions of this study can be summarized as the following:
1.
2.
3.
4.
5.
Good wetting properties are essential to provide god bond- ability, but better wetting properties do not necessarily provide stronger adhesive joint strengths.
Single filament critical length determination is a good analytical tool to characterize carbon fiber/epoxy adhesion properties and inherent failure mechanisms.
Single filament adhesion strength and composite shear strength are only loosely correlated.
Different failure mechanisms are identified in testing of single filaments of carbon fiber with different finish variants embedded in an epoxy matrix.
A significant 30% increase in impact toughness was measured without loss at room, elevated temperatures and hot-wet mechanical properties by incorporation of a "tailored- interphase" into the composite.
115

6. A modified analytical model is necessary to better understand the effect of the interface and interphase on composite per- formance.
7. A better understanding of the load transfer mechanisms in- volved in this more complex 3-component composite environ- ment is necessary to prescribe the optimum interphase proper- ties.
116
APPENDIX A. CALCULATIONS FOR THE THICKNESS OF A 1.5% BY WEIGHT EPOXY SIZE ON CARBON FIBER
Density of carbon fiber, pf = 1.76 g/cc
Diameter of carbon fiber, r = 7 x 10v4 cm
Density of epoxy size, ps = 1.182 g/cc
Assume unit length, R = 1 cm
Volume of the fiber, Vf = rr2R = 1.539 x 10⁻⁶ cc
Weight of the fiber, Wf = VfPf = 2.709 x 10⁻⁶ g
.*. Weight of the enoxy size, W, = 1.5% Wf
= 4.064 x 1O-8 g
Volume of the epoxy size, V, = FJ,/ps
= 3.438 x lO-8 cc
But, V, = r(R2- r2)R = 3.438 x 10⁻⁸ cc
.a. R= 7.08 x 10⁻⁴ cm
Thickness of epoxy size, A = R-r = 800 i
A-l
APPENDIX B. APPARATUS FOR WETTING FORCE MEASUREMENT
A Cahn 26 automatic electrobalance was used to measure the wetting force of a single filament carbon fiber. This electro- balance was interfaced through a BCD interface module to an HP-85A microcomputer. This arrangement allowed the data to be stored, plotted and manipulated during the experiment.
In order to assess the advancing, receding and equilibrium wetting force, a constant speed moving stage for the wetting liquid was required. This stage was made from a modified micromanipulator and a high torque, variable speed electric motor. The electric motor was controlled automatically by the microcomputer to allow automation of this experiment. The program developed for this process is listed in Appendix C and a schematic diagram of this set-up is presented in Figure B-l.
A single filament of carbon fiber was selected and attached to the end of a thin gauge hang-down wire with rubber cement. This fiber was then connected to the balance and the weight of the fiber was tared. The wetting liquid contained in a perfectly cleaned beaker was raised by the micromanipulator until the fiber end was just immersed in the liquid. Then the program would automatically accumulate the data from the microbalance and control the stage to obtain the wetting force during the advancing, station- ary and receding positions.
B-l

I I I 111
l-l Microbalance
I II
j
II Hang m Wire
Fiber
Wettinq Liquid
Micro- Motor Manipulator
Closed Chmber to Eliminate Air Current and Dust
7 1
[
. I
Vicroccmputer
FIGURE B-l. APPARATUS ASSEMBLY FOR WETTING FORCE MEASUREMENT
B-2
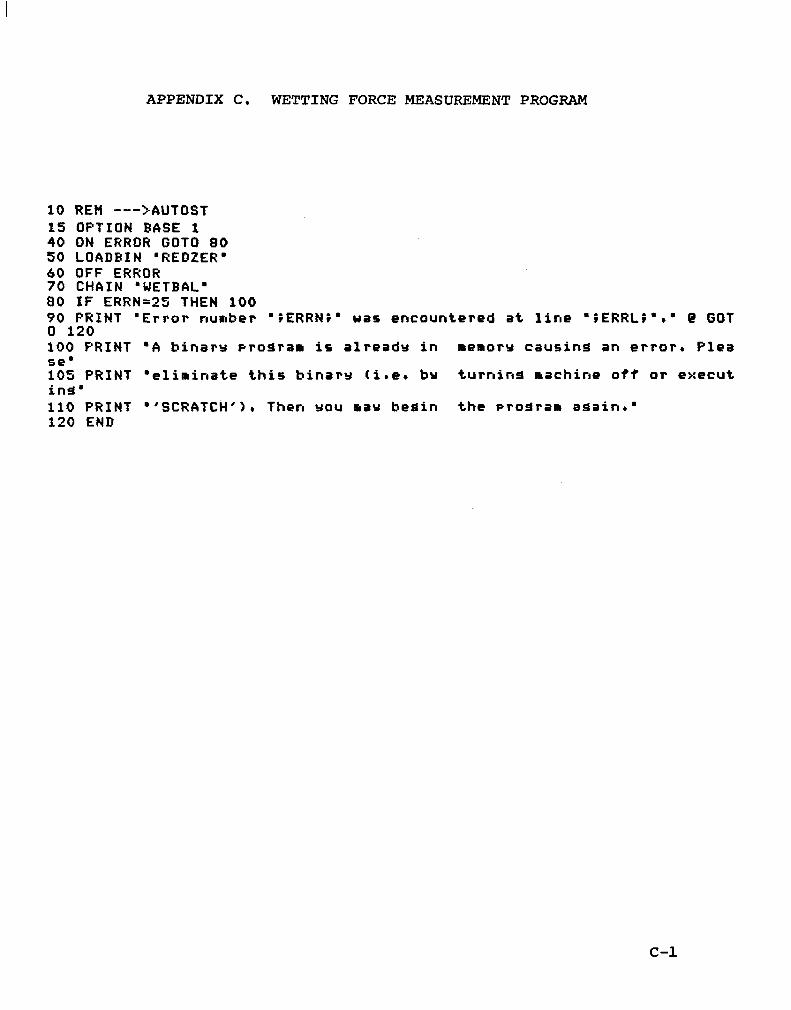
APPENDIX C. WETTING FORCE MEASUREMENT PROGRAM
10 REtl --->AUTOST 15 OPTION BASE 1 40 ON ERROR GOT0 80 50 LOADEIN ‘REDZER’ 60 OFF ERROR 70 CHAIN ‘WETBAL’ 80 IF ERRN=2S THEN 100 90 PRINT 'Error number 'iERRNi* uas encountered at line ‘iERRLi’,’ @ GOT 0 120 100 PRINT 'A binary proarar is already in memory causing an error* Plei3 se. 105 PRINT 'eliminate this binary (i.e. bu turnird machine off or execut ins' 110 PRINT .‘SCRATCH’)r Then YOU may begin the prosiram Baain+' 120 END
C-l
Introduction
REDZER is a binary program designed to enhance array manipulation capa-
bilities of the HP-85. An array can be reorganized (redimensioned) or
initialized to zero with use of one of the two statements offered.- This
binary program can be loaded into the HP-85 by the following command:
LOADBIN "REDZER"
For a further discussion of binary programs, see page 193 of the HP-85
Owner's Manual and Programing Guide.
ARRAY (RE)ORGANIZATION
You can reorganize an array into a more useful configuration by redim-
sioning that array. This changes the working size of the array; subse-
quent statements affect only the elements included in the new working
size. However, elements not included in the new working size are still
associated with the array. The values of these elements are not changed,
and they can be accessed if the array is again redimensioned.
REDIM array (redim subscripts) [,array (redim subscripts)...]
The redimensioning subscripts are numeric expressions, variables, or con-
stants that specify a new upper bound for each dimension. The number
of subscripts must be the same as the number specified in the original
DIM, REAL, SHORT, or INTEGER statements. Furthermore, the total number
of elements in the new working size cannot exceed the number originally
dimensioned.
c-2
Examples:
DIM A(4) ,B(2,4) ,C(l ,g)
REDIM A(3)
REDIM B (3,2)
REDIM A(4),B(2,4)
X=2 @ REDIM C(2*X-l,lWX-1)
OPTION BASE 0 assumed.
Redimensions working size from five to four elements.
Redimensions B from 3 x 5 matrix (15 elements) into 4 x 3 matrix (12 elements).
Redimensions A and B back to original sizes.
Redimensions C from 2 x 10 matrix into 4 x 5 matrix.
When a matrix is redimensioned, the values of its elements are reassigned
to different positions within the matrix. Values of matrix elements are
stored in order from left to right along each row, from the first row
to the last. The redimensioning takes the elements out of the matrix
in that order, and reassigns them in accordance with the new working
size of the matrix.
The following example shows how values.of ,matrix elements are reassigned
when a matrix originally declared to be 3 x 3 is redimensioned into a
2 x 2 matrix. The values of the original matrix elements are integers
that indicate the order in which the elements are stored before the re-
dimensioning.
Example:
10 OPTION BASE 1
20 DIM A(3,3)
30 DATA 1,2,3,4,5,6,7,8,9
40 FOR I-l TO 3
50 READ A(1 ,l) ,A(I,2) ,A(I,3)
60 NE.XT I
70 K=3 @ GOSUB 130
80 REDIM A(2,2)
Array A is originally dimensioned as 3 x 3.
Assigns values 1 through 9 to the elements of matrix A.
Displays original 3 x 3 matrix.
Redimensions A down td a 2 x 2 matrix.
c-3
Displays redimensioned 2 x 2 matrix.
Redimensions A back up to a 3 x 3 matrix.
Displays redimensioned 3 x 3 matrix.
Subroutine that displays matrix A.
90 K=2 @ GOSUB 130
100 REDIM A(3,3)
110 K=3 @ GOSUB 130
120 END
130 FOR I=1 TO K
140 FOR J=l TO K
150 .DISP A(1 ,J);
160 NEXT J
170 DISP
180 NEXT I
190 DISP
200 RETURN
[RUN1 123 456
789
Nine elements of original 3 x 3 matrix.
12 ? A 3L)
123
456
789
Four elements of redimensioned 2 x 2 matrix. Values of elements
1Y have been reassigned sequential within new working size.
Nine elements of 3 x 3 matrix w original values still assigned.
ith
Note that redimensioning a matrix does not isolate a submatrix. In other
words, if you redimension a 3 x 3 matrix into a 2 x 2 matrix, the resulting
matrix is not the 2 x 2 submatrix from the upper left corner of the original
matrix.
c-4

16 DISP USING '7/' i @ DIkP ' WILHELMY BALANCE’ e DISP . D ATA ACQUISITION' 17 DISP 'Data from tape file(Y/N)* @ INPUT YC 18 IF UPCI(Y$Clrll)='Y' THEN 2000 21 DISP USING '3/' i @ DISP ‘Erlter data collection interval (l-3 seconds /point)' 22 INPUT S2 23 DISP ‘Enter no. of points to be collected for Advancing Resion (300 m ax) ' 24 INPUT Nl 26 DISP ‘Enter no + of points to be collected for Still Redion (200 max)'
5 ! WILHELMY BALANCE DATA ACGUISITION,.,pRGGR~~ WETEAL,,,G,V, NELSON S/7 /81 .r.VERSION 5.12.81 8 OPTION E&SE 1 9 DItl D(lr1400)rS2~10)~S1~C6O~~Vl~t84l 10 DIfl Y(700)rM(3)rS(3)rA*C203 1s I=0 e 02=1400
27 INPUT N2 28 CLEAR @ ON KEY) 1r'START' GOT0 50 29 ON tiEY# 6r’UP’ GOSUB 6200 30 ON KEYI 7r’DGWN’ GOSUB 6250 31 ON KEY# 8r’STOP’ GOSUB 6300 32 OFF KEYI 3 @ OFF KEYI 4 I? OFF KEYt 2 37 ! 38 GCLEAR @ CLEFlR @ KEY LABEL 39 GOSUB 6000 ! INITIALIZE INTERFACE 40 GOT0 40 50 DISP 'Enter Ssm~le Description (20 Chars maxi n-o commas)'
51 INPUT A$ 52 PRINT USING '7/' i @ PRINT ' WILHELMY BALANCE’ @ PRINT '
DATA ACQUISITION @ PRINT 53 PRINT A$ 54 PRINT P PRINT ‘DATA INTERVAL=‘iS2;’ SECONDS/POINT' 55 PRINT 'ADVANCING REGION='iNli' POINTS' 56 PRINT 'STILL REGION='iN2;' POINTS’ 57 PRINT 'RECEEDING REGION='iNli' POINTS' 58 PRINT @ PRINT 80 Yl=O e Y2=0 e II=0 85 GOSUR 7'000 P Dl=D/lOO @ D2=Dl ! START TIMER 86 LOCATE Orl30,01100 87 FRAME 90.SCALE Or2XNltN2rO~Dl 1OC MOVE NlrO @ DRAW NlrDl 102 MOVE NltN2rO @ DRAW NltN2,Dl 103 LORG 6 @ MOVE N1/2rDl @ LABEL 'ADVANCING' 104 MOVE NltN2/2rDl @ LABEL 'STILL' 105 MOVE NltN2tN1/2rDl I? LABEL 'RECEDING' 120 MOVE 010 135 GOSUE 6230 ! MOTOR ON-FWD 140 I=0 @ J=I lS0 IF I=J THEN 150 155 GOSUE SO30 160 Y(I)rY=D 170 J=I 180 GOSUB 770 182 PEN 1 185 MOUE IpY(I)
C-5
190 PLOT IrY(I) 200 IF I=Nl THEN GOT0 220 210 GOT0 150 220 ! 225 GOSUE 6330 ! MOTOR OFF 230 FRINT 250 OFF TIMER# 1 i? PRINT 'ADVANCING:' 254 PRINT USING '~OAI~D~~D~/,~OA~~DI~D' i = MEAN = 'in;' STDEU = ‘iSO R(Sl) 260 PRINT 270 M(l)=M I? n=o e Yl=O e Y2=0 280 ! TURN ON TIMER FOR STILL REGION 290 GOSUE 7000 ! START TIMER 310 I=0 @ J=I 320 IF I=J THEN 320 325 GOSUB 5030 330 Y(NltI)rY=D P J=I 340 GOSUE 770 342 MOUE NltI~Y(NltI) 344 DRAW NltIrY(Nlt1) 346 IF I=N2 THEN 390 350 GOT0 320 390 OFF TIMER# 1 G PRINT 'STILL:" 400 FRINT USING m10Av6D.3D~/r10Ar6D.3D' i ' MEAN = ‘;Mi’ STDEV = ‘;SQ R(Sl) 410 FRINT 420 M(2)=M @ M=O 0 Yl=O @ Y2=0 430 ! TURNGN TIMER FOR RECEDING REGION 450 GOSUD 7000 ! START TIMER 455 GOSUE 6280 ! MOTOR REV 460 I=# P J=I 470 IF I=J THEN 470 475 GOSUB 5030 480 Y(NltN2tI)rY=D @ J=I 490 GOSUE 770 492 MOUE NltN2tI~Y(NltN2+1) 494 DRAW NltN2tI~Y~NltN2tI) 496 IF I=Nl THEN 510 500 GOT0 470 510 ! STOP ROUTINE 520 GOSUB 6300 ! STOP MOTOR 530 OFF TIMER# 1 @ FRINT 'RECEDING REGION:' 540 PRINT USING '~OAI~D.~D~/~~OA,~D.~D' i ' MEAN = ‘iMi’ STDEV = ';SQ R(Sl) 550 PRINT @ COPY 554 ON tiEYt 5r’STORE’ GOT0 1000 555 ON KEYI 3r’LIST GOT0 900 556 ON KEYI 4r ‘PLOT’ GOT0 560 557 GOT0 37 558 ON KEY# 2r ‘READ’ GOT0 1900 559 GOT0 37 560 ! REPLOT GRAFH-TO SCALE 561 GCLEAR 562 DISF 'WHICH REGION DO YOU WANT TO PLOT (A=ADUANCINGi S=STILL; R=RECE DING)' 563 INPUT Al*@ N3=0 564 IF UPC%(Al%tlrll)=' A’ THEN N3=1 @ N4=Nl @ M%='ADVANCING. 565 IF UPC$(Al$tl,ll)='S' THEN N3=Nltl B N4=NltN2 P M$=‘STILL’
'C-6

566 IF UPCs(Al$Cl,ll)=m R' THEN N3=NltN2+1 @ N4=2*NltN2 @ M$=‘RECEDING. 567 IF N3=0 THEN 562 570 PRINT USING '4/' ; 580 Y8=- l.E99 @ YQ=l.E99 590 FOR I=N3 TO N4 600 Y8=MAX(Y(I)rY8) @ Y9=MIN(Y(I)rY9) 610 NEXT I 611 CLEAR I? DISF 'MIN Y VALUE=‘iY’) G DISP ‘MAX Y UALUE=‘;Y8 G DISP 'DO Y OU WANT TO SET SCALE(Y/N)‘i 612 INPUT Al%@ IF UFC$(Alstlrll)='Y' THEN 613 ELSE 614 613 DISF ‘ENTER Ymin,Ymax' @ INFUT Y9rY8@ GOT0 615 614 Y9=0 G Y8=Dl 615 LOCATE 30,120,20r80 616 SCALE N3-lrN4rYPvY8 617 FXD Or3 @ LAXES -~N4-N3+1)/10~~Y8-Y9)./10~N3-1~Y9~2~2 618 SETGU @ MOUE 70~3 @ LORG 4 @ LABEL 'TIME(sec)' 619 MOUE 8945 P LDIR 90 c) LABEL ‘FORCE(ms)’ @ LDIR 0 @ SETUU 635 MOVE (N3tN4)/2,Y8t(Y8-Y9)t3/20 @ LORG 4 @ LABEL M$ 640 MOUE N3-lr0 650 FOR I=N3 TO N4 655 MOUE IIY(I) 660 LORG 5 665 IF N4-N3:‘~40 THEN PLOT ItY(I) ELSE LABEL ‘t* 670 NEXT I 680 COPY 690 PRINT USING '7/' i 715 GOT0 37 720 END 770 ! RUNNING AWERAGEv STD DEW 780 M=((I-l)tMtY)/I 790 Yl=YltY 800 Y2=Y2tY*Y 810 Sl=(Y2-YltYl/I)/I 820 RETURN 900 ! LIST 902 CLEAR YO4 DISF ‘WHICH REGION DO YOU WANT TO LIST (A=ADVANCINGi S=STILL; R=RECE DING)' 906 INPUT .A189 N3=0 908 IF UFC$(Al$Ll~ll)=' A’ THEN N3=1 @ N4=Nl G M$='ADUANCING' 910 IF UFC$(Al$Cl,ll~=' S’ THEN N3=Nltl @ N4=NltN2 @ M%='STILL' 912 IF UFC$(Al$Clrl3)=' R’ THEN N3=NltN2+1 @ N4=2*NltN2 f! MI='RECEDING' 914 IF N3=0 THEN 904 915 PRINT USING '3/' i P PRINT MS @ PRINT 'TIME(sec) FORCE(mzf)’ 920 DISF ‘ENTER NUMBER OF DATA POINTS PER PRINTED VALUE’ @ INPUT N5 950 FOR I=N3 TO N4 STEP N5 952 F9=3 954 IF D2>*20 THEN F9=2 956 IF D2<= 2 THEN F9=4 958 ON F9 GOT0 959r959v960v965 959 PRINT USING 'DDDZ.DD~~XIDDDZ.DD' i ISS;I,Y(I) @ GOT0 970 960 PRINT USING 'DDDZIDD~~X~DD~~ZIDDD' i ISS2rYt1) @ GOTO 970 965 PRINT USING .DDDZ,DD~~XIDDDZ,DDDD' i ItS2rYtI) 970 NEXT I 980 PRINT USING '7/. i 990 GOT0 37 1000 ! STORE ACCORDING TO ESDM FORMAT 1010 Ol-21rNltN2 (? N7=2 @ S7=3
c-7
1020 Vl$=‘TIME FORCE ’ 1030 Sl$='ADU. STILL RECED.’ 1040 S2(1)=1 I? S212)=Nl+l @ S2(3)=Nl+N2+1 1045 REDIH D(N7,Ol) 1050 FOR I=1 TO 01 1060 D(l,I)=S2tI 1070 D(2rI)=Y(I) 1080 NEXT I 1140 CLEAR 1150 DISP ' ): $ $ f $TORE DATA $ f * X ’ 0 PRINT 1160 DISP 'File names must be <=.6 charac- ters long. (Type ‘E’ to exit) I 1170 DISF ‘Name of data file = ';@ INPUT F1 1180 IF LEN(F$)>O AND LEN(F$)<7 THEN 1210 1185 IF F$=‘E’ OR NOT LEN(F$) THEN 1530 1190 GOSUB 1590 1200 GOT0 1140 1205 IF F$~lr13=BEg AND LEN(F$)=l THEN 1530 1210 DISF 'Is data medium placed in tape drive(TrPe ‘E’ to exit>';@ IN PUT NQ 1220 ON FNA(N$) GOT0 1210~1230r1210~1530 1230 CLEAR 1240 ON ERROR GOSUB 1710 1250 x=0 1260 ASSIGNt 1 TO F1 1270 OFF ERROR 1280 IF X=1 THEN 1360 1290 DISF ‘A file of this name has been found, Do you wish to store.
1300 DISF ‘Present data set under this name and destroy old data set ';@ INPUT N$ 1310 ON FNA(N$) GOT0 1290r1370~1140r1530 1330 GOSUB 1590 1340 CLEAR @ GOT0 1290 1360 CREATE F$r(8+02*8) DIV 700-i-2,700 1370 ASSIGNt 1 TO F$ 1375 CLEAR 1390 FRINTt lrl i A9rOlrN7rUl~~S7,Sl~~S20 1400 READ9 192 1410 PRINT# 1 i D(r) 1420 ASSIGNt 1 TO t 1430 CLEAR 1440 PRINTER IS 2 1450 PRINT ‘ftt*t*t*t6ttttf*tt*****~********’;’*’;TA~(32);.*. 1460 PRINT '*'iTAB(l4)i'STORE'iTABoi't' 1470 PRINT 't'iTAB(32)i'f 'i't******************************** 1480 FRJNT 1490 PRINT *Data and related information is stored in 'iF$i',' 1500 PRINT 1510 DISF 'Is program medium replaced in device ';e INPUT NS 1520 ON FNA(N$) GOT0 1510~1530~1510t1530 1530 CLEAR 1560 GOT0 37 1590 BEEF 1600 DISP 'ImProPer resPonse--Please trr i3Sain.. 1610 WAIT 1500 1620 RETURN 1710 IF ERRN=67 THEN X=1
%-8

1720 RETURN 1730 DEF FNA(A$) 1740 IF LENtA%)= THEN FNA=l ELSE FNA=POS('YNEgrUPC$(A$Cl~l~~~+l 1750 FN END 1900 ! TRAP FOR UNINTENDED LOSS OF DATA 1905 CLEAR 1910 DISP ‘Readinf data froa tape will overwrite current memory’ 1920 DISP 'Continue (E to exit)';@ INPUT N$ 1930 ON FNA(N$) GOT0 1920,2000~554~554 2000 ! READ DATA FROM TAPE BSDM FORMAT 2005 CLEAR 2010 DISP ‘Name of data file=';@ INPUT F1 2020 DISF 'Is data medium Placed in tape drive(Trpe ‘E’ to exit)';@ IN PUT N9 2030 ON FNA(N$) GOT0 2020~2040~2020r2l90 2040 CLEAR 2050 ON ERROR GOT0 2080 2060 ASSIGNC 1 TO F$ 2070 OFF ERROR @ GOT0 2090 2080 DISF 'File ‘iF%i’ not found’ e GOT0 2010 2090 READt 191 i A%rOlrN7~Wl$rS7rSl$rS2(r) 2100 REDIM D(N7,Ol) 2110 READI lr2 2120 READI 1 i D(p) 2130 ASSIGN) 1 TO $ 2140 PRINT ‘DATA ENTERED FROM TAPE FILE 'iF$ e PRINT 2150 Nl=S2(2)-1 @ N2=S2(3)-S2(2) 2160 FOR I=1 TO 01 2170 Y(I)=D(2rI) 2180 NEXT I 2185 S2=D(lr2)-D(lrl) 2186 Dl=D(2r01/2) 2190 GOT0 554 4900 ! ",',i", !, INTERRUPT PROCESSING
500'0 ENTER 3 i R3,Q4 ! READ VALUE 5001 IF ABS(Q3)*<60000 THEN 5000 5010 I=I+l 5020 RETURN 5021 !. 5022 ! INPUT DECODING 5023 ! 5030 Ql=Q3 5031 Q2=Q4 5032 IF tJl#Q3 THEN 5030 5040 IF INT(Q2/10)=1 THEN 5045 5042 DISP ‘Overranse’ 5045 Q2=RMD(Q2rlO) 5050 IF Q2>0 AND a2<9 THEN 5100 5060 ! 5070 Q2=1 5075 DISP ‘Exponent Error* 5080 GOT0 5190 5090 ON Q2 GOT0 5l40r5160~5060r5180~5O6O~5O6O~5O6O~5l85 5100 ON Q2 GOT0 5140r5160,5060~5180~5060~5060~5060~5185 5140 Q2=.1 5150 GOT0 5190
c-9
5160 Q2=.01 5170 GOT0 5190 5180 Q2=,001 5184 GOT0 5190 5185 Q2=+0001 5190 D=Ql*Q2 5210 RETURN 6000 ! “,5;“, !, DATA INITIALIZATION
6030 RESET 3 6040 CONTROL 391 i 0 ! NO INTERRUPTS 6050 CONTROL 3r2 i 0 ! CLEAR OUTFUT BITS 6060 CONTROL 393 i 5 ! 5 DIGITS 6070 CONTROL 3~4 i 0 ! NO EXPONENT 6080 CONTROL 395 i 2 ! 2 FUNCTIONS 6090 CONTROL 3~6 i 0 ! NO DECIMAL 6100 CONTROL 397 i 0 ! NO HANDSHAKE 6110 CONTROL 3~8 i 0 6120 CONTROL 379 i 15 6130 CONTROL 3~10 i 0 6140 RETURN 6200 ! 6210 ! MOTOR ON-FWD 6220 ! 6230 CONTROL 392 i 1 6240 RETURN 6250 ! 6260 ! MOTOR ON-REV 6270 ! 6280 CONTROL 392 i 3 6290 RETURN 6300 ! 6310 ! MOTOR OFF 6320 ! 6330 CONTROL 3~2 i 0 6340 RETURN 7000 GOSUB 5000 ! READ START VALUE 7005 GOSUD 5030 ! DECODE VALUE 7010 D=49999fQ2 ! SET MAX VALUE 7020 ON TIMER9 l,lOOOtS2 GOSUB 5000 7030 RETURN
c-10

APPENDIX D. PROCEDURES FOR CLEAN GLASSWARE TO PREVENT CONTAMINATION OF WETTING LIQUIDS
1. Glassware is placed in boiling 1:l diluted nitric acid for five minutes.
2. Then it is rinsed with double distilled water.
3. It is next steamed with double distilled water for thirty minutes.
4. It is then vacuum dried at 15OOC for ten hours.
5. Finally, it is individually wrapped in aluminum foil and stored in a dessicator.
D-l

APPENDIX E. SINGLE FILAMENT GRAPHITE FIBER TENSILE TEST
A representative number (generally 20) of single filaments are randomly selected from a tow sample. The filaments are center- line mounted on special slotted paper tabs as shown in Figure E-l. The paper tabs are gripped such that the test specimen is uniaxially aligned in the jaws of an Instron. An Instron constant cross-head speed of 0.02 inch/min and a chart speed of ten inches/min are employed. The procedure of mounting the graphite fiber on the tabs is as follows:
1. The strand bundle is placed loosely on a suitable work surface.
2. A dental pick is used to gently separate the filaments and a suitable test specimen is selected.
3. A tab of pre-punched slot is used as the mounting medium. The single filament is centered along the slot of a mounting tab and a small strip of tape is used to anchor one end to this tab.
4. The filament is lightly stretched and the opposite end is anchored in the same manner.
5. A small amount of sealing wax is carefully placed on top of the filament at each edge of the slot to secure the filament to the tab.
E-l

Cardboard Tab
Wax Bead
Graphite Fiber
Cut Tab Here
I i
1 f$$$$& Masking Tape
I
FIGURE E-l. GRAPHITE FIBER MOUNTED ON A TAB
E-2

APPENDIX F. SINGLE FILAMENT TENSILE STRENGTH AT VARIOUS GAUGE LENGTHS
F-l

8400
7200
5800
.OOl 0.1 Q.25 0,5 1 3 5
- -. - ,,. ! .I - ~ “. / .
1
" -I' j-
/Ill/
1400
1200
100.0
800
600
(2.54x10'4cm) (2.54~10'3an). (2.54~1O'~an) (0.254~~1) (.2,54cm). Gauge Length (i,n)
FIGURE F-l. T-6300 (STANDARD SIZED PRODUCT) LOT #1141-4
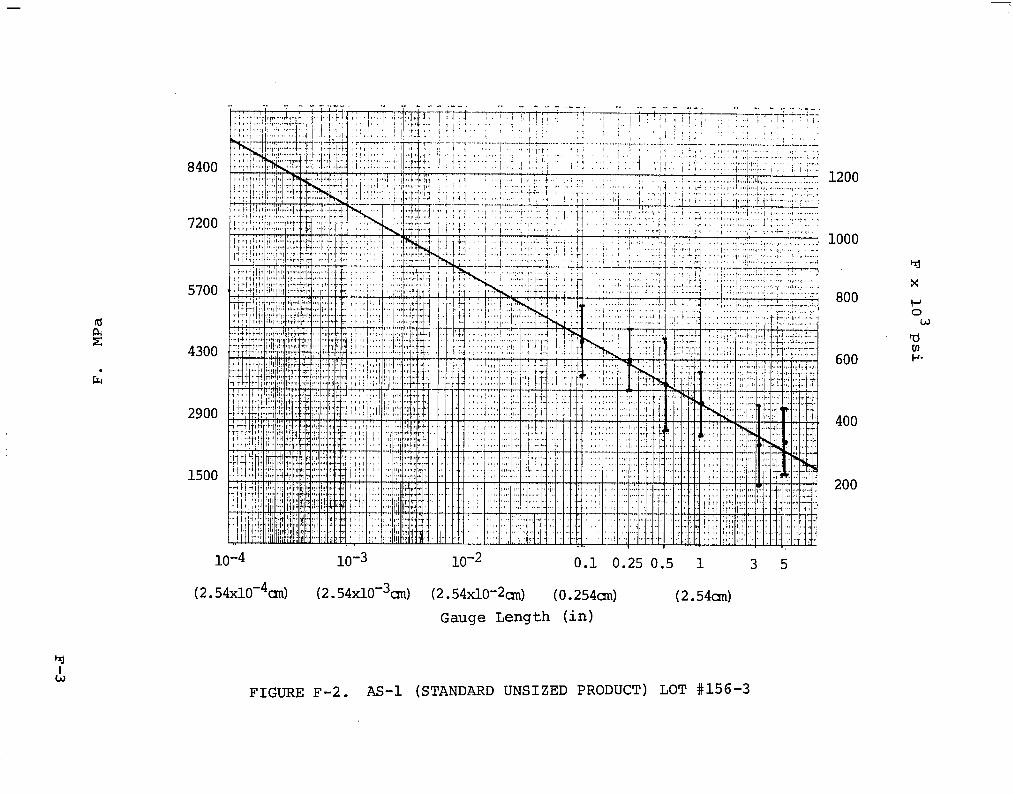
8400
7200
5700
4300
2900
1500
10-d 10-3 10-2 0.1 0.25 0.5 1 3 5
(2.54x10⁻⁴& (2.54~1O-~an) (2.54x10⁻²an) (0.254un) (2.54cm) Gauge Length (in)
FIGURE F-2. AS-1 (STANDARD UNSIZED PRODUCT) LOT #156-3
800
600
200

9500
8400
7200
5800
4400
2900
1500
(2
10-4
.54xlO'4m) (2.54~1O'~cm) (0.254an)
Gauge Length (in)
0.25
L
(i
.._
‘1.
c
_(
C-I 4-L
._ _._
_
.
.,. _
+ ‘_I
1; ’ I I
_i 1
I.5
.d A ,. .:
:,
- . .
.
. _
-. .-
.
t
.__
I
3 5
400
200
FIGURE F-3. C-6Kv (UNSIZED, NONTREATED) LOT #7411
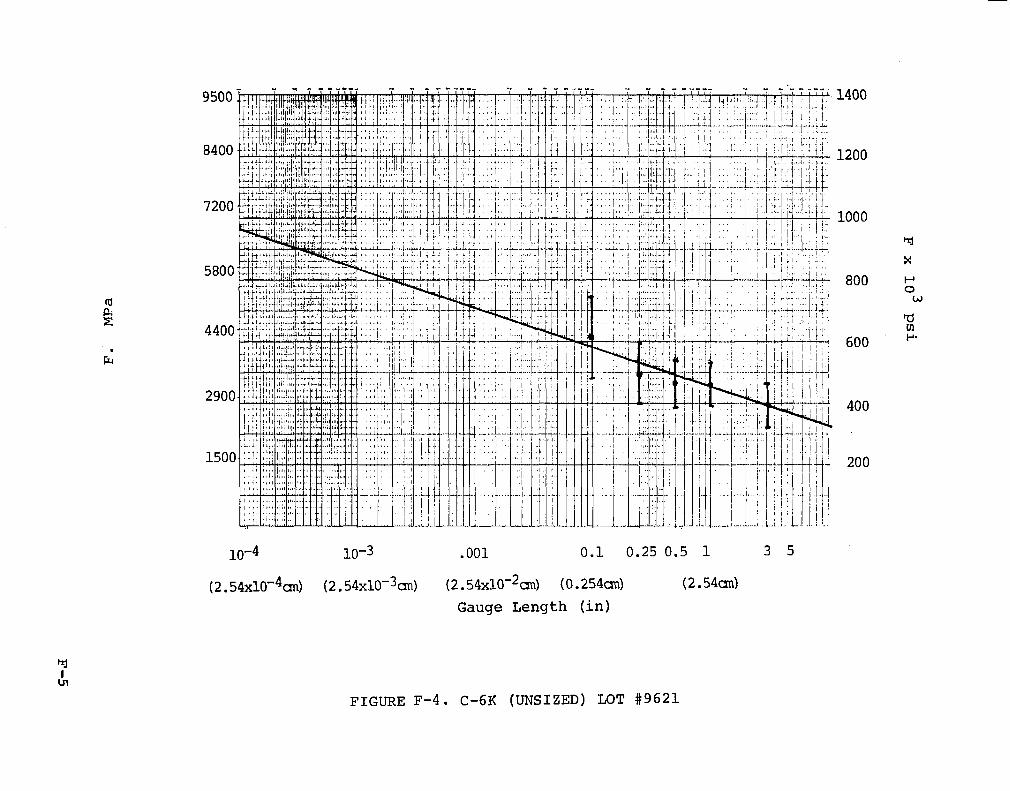
‘I _.I. I
-+
-.
5 0.1 0.25 O., 1 3 5
(2.54~1O'~cm) (2,54~1O-~an) (2.54~lO'~an) (0.254~11) (2.54~~)
Gauge Length (in)
.! I_
.’ ,
I
-i--
j--
I, i_.
1400
1200
1000
400
200
FIGURE F-4. C-6K (UNSIZED) LOT #9621

9500
8400
7200
5800
4400
2900
1500
(2.
lQ74
,54xlO'4cm)_
lQY3
(2.54xlo-3un)
. . -. “A.,... . L
-.
. .
.._
.
.
10-2 O,l 0,25 0.5
(~.,54xlO'2an~ (:Q,254un1
Gauge Length (in)
(2,54ad
1200
1000 -A x
800 : W
6QQ
20Q
FIGURE F-5. C-6KE (STANDARD SIZE) LOT #0431
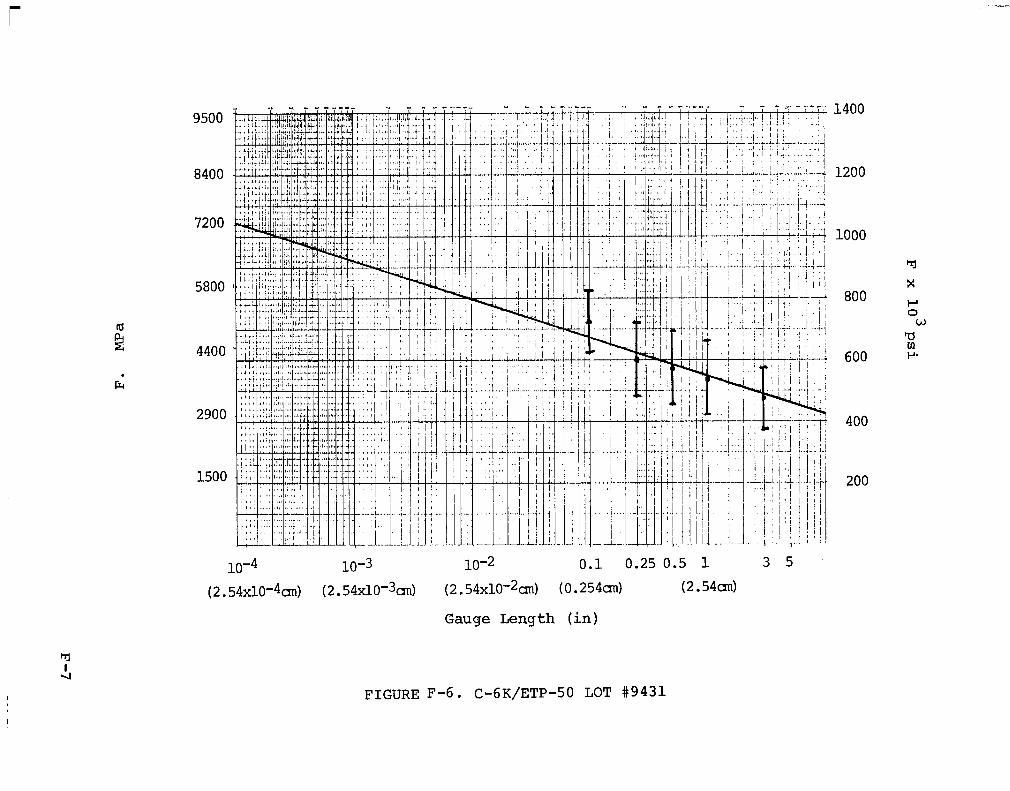
8400
7200
5800
4400
2900
1500
10-4
r-l 1,.
l-l 7 ..-.
(2.54x10⁻⁴an) (2.54xlo-3an) (2.54x10'2d (0.254an)
i
I-
0.1 0.25 0.5
Gauge Length (in)
FIGURE F-6. C-6K/ETP-50 LOT #9431
Ij
!.. .i
-lj- i
/ i
‘1
I /
; !
x 800 ~
0 W
2 600 I-J-
400
200

a 2
Es]
9500
8400
7200
580C
44oc
29oc
150(
. . I .
(2.54x10'4cln) (2.54x10'3cm) (2.54x10'2an) (0.254an) (2.54cmI
0.1 0.25
._.i.-
1400
1200
1000
800
600
Gauge Length (in)
FIGURE F-7. C-GK/ETP-10 LOT #9Y31

9500
8400
7200
5800
4400
2900
1500
'1000
800
600
400
d
.! -1
I I
: ,I I ,& !
5
+..,-
( 1, 0.5
!
.i ij. __i-._j ..!,
1 3 0.1 0.25
(P.254a-d (2,54d- (:2,54x10⁻⁴Qn~ (~.54xlO’3an). (2 l 54xl@d
Gauge Length (in)
FIGURE F-8. C-6K/FRE-25 LOT #9732

d
9500
8400
7200
5800
4400
2900
1500
I
. .
.
._ .
I_ c.
-4 --1
.~....,
.
,
\
I
-. T _ .- .].I I, -,
(2.54x10⁻⁴m) (2.54x10⁻³cm) (2.54~1O-~un) (0.254cm) (2.54a.l-d Gauge Length (in)
~f1400
.- 1200
1
.I 1000
800
600
400
200
FIGURE F-9. C-6K/SR LOT #9732 .

APPENDIX G. TENSILE FIXTURE TO STUDY SINGLE FILAMENT ADHESION PROPERTIES
d C e f I
b& c &
1‘ T T 1‘ '_ 4-l
a
: b
b
b a a -- a i
a a --- --- .- --. .- --. - -
0 0 0 0 -- -- - - - - - - - - -_ -_ -- -- - - -- --
--- --- - - es-4 es-4 0 0 0 0
- - m-w. m-w. 0 0 ,- ,- ---m-B. ---m-B. , , , , 1 g
.- --
\ Space i
g=7.9xlO -3rn h=1.3x10⁻²m i=8xlO -41n
0
B 0
Q--
FIGURE G-l. TENSILE FIXTURE FOR LEITZ OPTICAL MICROSCOPE DRAWN TO SIZE
G-l

APPENDIX H. SINGLE FILAMENT INTERFACIAL SHEAR STRENGTH DETERMINATION PROGRAM
The purpose of this program is to apply a Weibull Distribution statistical analysis of the critical aspect ratio of the fibers where Weibull parameters as well as the average shear strength and the variance of the shear strength are determined.
H-l

10 !'tft INTERFACIAL SHEAR STRENGTH PROGRAM -- CRITICAL LENGTH DETERtiINA TION tS* 20 DItl D(500)rL(500~rR~350) 30 ON KEY# 1, ‘ENTER’ GOT0 170 40 ON KEY# 2r ‘STORE’ GOT0 600 50 ON KEYt 3r 'DISPLAY GQTO 760 60 ON KEY# 4r'EDIT' GOT0 940 70 ON KEY# 51 ‘CALC’ GOT0 1200 80 ! ON KEYt 6r'HISTO' GOT0 90 ! ON KEYI 7r’WEIBULL’ GOT0 ‘1:; ; ON KEYI SI’NORHAL’ GOT0
120 CLEAR @ KEY LABEL 130 DISF 'INTERFACIAL SHEAR STRENGTH DETERtlINATION!' 140 DISF 'CRITICAL LENGTH MEASUREHENT.’ 150 DISF ‘SELECT OPTION’ 160 GOT0 160 170 ! *a** DATA ENTRY **** 180 CLEAR @ DISF ‘ENTER DATA FROM KEYBOCIRD (K) OR TAPE (T)?’ 190 INPUT Y% 200 IF Y$= ‘K’ THEN 250 210 IF Y9= ‘T’ THEN 500 220 GOT0 180 230 ! 240 ! 250 ! *St ENTER DATA FROM KEYBOARD *** 260 ! 270 CLEAR P DISF ‘ENTER SAMPLE NAME?’ 280 INPUT A% 290 DISF ‘MEAN VALUE OF FIBER CRITICAL LENGTH (MICRON) IS:';@ INPUT Wl 320 DISF ‘TENSILE STRENGTH (PSI) OF FIBER AT'iWli' GAGE LENGTH IS:';@ IN PUT S 350 DISF ‘THE TOTAL NUHBER OF SPECIMEN TESTED:‘;@ INFUT Nl 380 DISF ‘THE TOTAL NUMBER OF BREAKS:‘;@ INPUT N 410 DISP ‘ENTER FIBER DIAMETER AND CRITICAL LENGTH (HICRON)' 420 FOR I=1 TO N 430 DISF 'D('iIi')r L('iIi')=' 450 INPUT D(I)PL(I) 460 NEXT I 470 GOT0 120 480 ! 490 ! **** DATA ENTRY *IS** 500 ! 505 DISF 'INSERT DATA FILE TAPE! (WAIT FOR THE NEXT COMtlAND!~’ 506 BEEF
'507 WAIT 3000 510 DISF ‘ENTER FILE NAME:';@ INPUT Al 520 ASSIGNI 1 TO UFCI(A$) 530 READt 1 i A$~WlrS1NlrNvD0rL0 570 ASSIGNQ 1 TO * 580 GOT0 120 590 ! 2;; ; ttt STORE DATA ON TAPE ***
620 &SF 'INSERT DATA FILE TAPE! [WAIT FOR THE NEXT COMHAND!J’ 621 BEEF 622 WAIT 3000 630 CLEAR @ DISF ‘ENTER FILE NAME’;@ INPUT A$
H-2
640 DISF .NEW OR EXISTING FILE (N/E)?. 650 INPUT Qbl? IF UPC$(G$ClrlJ)='N' THEN 660 ELSE GOT0 670 660 CREATE UFC$(A%)rSO 670 ASSIGNI 1 TO UPCI(A*) 680 FRINTt 1 i A$~W~~SIN~~N,DO,LO 720 ASSIGNt 1 TO t 730 DISP ‘DATA ON’iUPC$(Ai)im STORED ON TAPE’ i? KEY LABEL 735 WAIT 3000 740 GOT0 120 750 ! 760 ! *** DISPLAY DATA t** 770 ! 780 CLEAR P DISP ‘DATA IN HEMORY? <Y OR N)'i@ INPUT T$ 790 IF T$=‘Y’ THEN 810 800 IF T$=‘N’ THEN 120 805 DISP ‘ENTER Y OR N’ 806 GOT0 780 810 CLEAR I? PRINT l SAtlFLE’vA$ 920 PRINT USING 830 i *TENSILE STRENGTH (PSI) OF FIBER ATmrW1vmGAGE LENG TH 1S:'rS 830 IMAGE ~~Av~D.~DI~~A~D.~DE 840 PRINT USING 850 i ‘TOTAL NUtlEER OF SPECIMENS TESTED 1S:'rNl 850 IMAGE 42Ap2D 860 PRINT USING 870 i ‘TOTAL NUMBER OF BREAKS 1S:'rN 870 IMAGE 32Ar3D 880 FOR I=1 TO N 890 PRINT USING 900 i 'D('rIv')r L('r11')='rD(I)rL(1) 900 IMAGE ~A~~D~~A~~Dv~A~~D.~D~~D.~D 910 NEXT I 920 GOT0 120 930 ! '9;; ; EDIT ROUTINE tffbS
960 CLEAR e DISF 'ADD(A)? CHANGE(C)9 END(E)';@ INPUT Z% 970 IF Z$=‘A’ THEN 1000 980 IF Z$='C' THEN 1110 985 IF Z$=' E’ THEN 120 990 GOT0 960 1000 ! ADD ROUTINE 1010 DISF 'ENTER ADDITIONAL NUMBER OF SFECIHENS TESTED:‘;@ INPUT Ml 1020 DISF ‘ENTER ADDITIONAL NUMBER OF BREAKS:‘;@ INPUT M 1030 Nl=NltMl 1040 FOR I=Ntl TO NtM 1050 DISP mD(m~IIm)r L(.tII.)=. 1070 INPUT D(I)rL(I) 1080 NEXT I 1090 N=NtM 1100 GOT0 960 1110 ! CHANGE ROUTINE 1112 DISP ‘CHANGE TENSILE STRENGTH (S)r MEAN CRITICAL LENGTH (W)r DIAHET ER AND LENGTH (L)’ 1113 INPUT D$ 1114 IF D$='S' THEN 1117 1115 IF D$= ‘L’ THEN 1120 1116 IF D$=‘W’ THEN 1181 1117 DISP ‘TENSILE STRENGTH=‘rS 1118 DISF ‘CHANGE TO TENSILE STRENGTH=’ @ INPUT S 1119 GOT0 1180
H-3
1120 DISF ‘ENTER ITEH # TO CHANGE’ 1130 INPUT I 1140 DISF ‘OLD VALUES:’ 1150 DISF 'D('rIr')r L(',I~').='ID(I)~L(I) 1160 DISF ‘NEW VALUES:’ 1170 DISF 'D('r11')~ L('v-I~~)=~;Q INPUT D(I),L(I) 1180 GOT0 960 1181 DISF ‘HEAN CRITICAL LENGTH=’ rW1 1182 DISF ‘CHANGE TO flEAN CRITICAL LENGTH=’ @ INPUT Wl 1183 GOT0 960 1190 ! ',z;", ; SSt WEIEULL DISTRIBUTION PARMETERS ***
1220 SlpS2tS3,CvF2=0 1230 ! INITIALIZE ALFHA TO BE 10 1240 A=10 1250 ! INITIALIZE ITERATION STEP TO BE 1 1260 x=1 1270 ! ASPECT RATIO DETERMINATION 1280 FOR I=1 TO N 1290 R(I)=L(I)/D(I) 1295 NEXT I 1299 CLEAR 1300 DISF ‘STORE DATA FOR HISTOGRAM/WEIBULL PLOT ? (Y OR N)'i@ INFUT QI 1310 IF QI=‘Y’ THEN 1330 1320 IF Q9=‘N’ THEN 1460 1325 GOT0 1300 1330 ! ;“,‘-“, ; STORE ASFECT RATIO FOR HISTO/WE$EULL/NORMAL PLOT fSf
13& CLEAR P DISF ‘ENTER FILE NAME? (END WITH H) ';@ INPUT 3$ 1370 DISF ‘NEW OR EXISTING FILE (N/E)?’ 1380 INPUT FS@ IF UPC$~P$tl~ll)='N' THEN 1390 ELSE GOT0 1400 1390 CREATE UFC$(D$),20 1400 ASSIGNI 1 TO UPC$(E$) 1420 FRINTI 1 i NvRO 1440 ASSIGN# 1 TO * 1450 DISF ‘DATA ON ‘iUPC$(B%)i’ STORED ON TAPE,’ 1460 DISF 'DO YOU WANT A PRINT OUT? (Y/N)?' @ INPUT C1 1461 IF C$=‘Y’ THEN 1463 1462 IF C$=‘N’ THEN 1468 1463 PRINT USING 1464 ; .N’v.R’ 1464 IMAGE A18XpA 1465 FOR I=1 TO N @ PRINT USING 1466 i IIR(I) @ NEXT I 1466 IMAGE 3DpSXp3D+3D 1468 BEEF 1469 CLEAR 1470 Sl,S2rS3=0 1480 FOR I=1 TO N 1490 Sl=SltR(I)^AfLOG(R(I)) 1500 SZ=S2tR(I)-A 1510 S3=S3tLOG(R(I)) 1520 NEXT I 1525 DISF 'A='iA 1526 DISF ‘F2=‘;F2 1530 ! 1540 F=Sl/S2-l/A-S3/N 1545 DISF ‘F=‘;F
H-4

1550 IF ABS~F)<.000001 THEN 1680 1560 IF C>O THEN 1600 1570 F2=F 1580 C=l 1590 GOT0 1650 1600 IF F2>0 THEN 1630 1610 IF FXO THEN 1650. 1620 GOT0 1640 1630 IF F>O THEN 1650 1640 X=-X/l0 1650 4=4-X 1660 F2=F 1670 GOT0 1470 1680 ! 1690 B=(l/NtS2)-(l/A) 1700 F=l-l/A 1710 GOSUE 1960 1900 G2=G 1910 T=S/2/BtG2 1920 F=l-2/A 1921 DISP ‘P=‘pP 1930 GOSUB 1960 1940 V=Sn2/4/B^2*(G-G2^2) 1941 V=SGR(V) 1945 GOT0 2310 1950 ! ;%i !, GAMMA FUNCTION SUBROUTINE fff
1980 IF P-57(=0 THEN 2020 2000 G=l.E75 2001 DISF ‘P>57rOVERFLOWrG SET TO 1.E75.i 2002 WAIT 3000 2003 BEEP 2010 RETURN 2020 Pl=P 2030 E=,OOOOOl 2040 c=o 2050 G=l 2060 IF Fl-2X=0 THEN 2110 2070 IF Pi-2X=0 THEN 2220 2080 Pl=Fl-1 2090 G=G*Fl. 2100 GOT0 2070 2110 IF Pi-l<0 THEN 2140 2120 IF Pl-1=0 THEN 2270 2130 IF Fl-l>O THEN 2220 2140 IF Fl-E>O THEN 2190 2150 Z=SGN(Fl)*INT(ABS(Pl)-,5)-P1 2160 IF ABS(Z)-E<=O THEN 2280 2170 IF l-Z-E<=0 THEN 2280 2180 IF Pl-l>O THEN 2220 2190 G=G/Fl 2200 Fl=Fltl 2210 GOT0 2180 2220 Z=Pl-1 2230 W=Zt(-.5684729tZt~.25482OStZ~-.0514993)) 2240 W=Zt(.985854tZS(-. 8764218+2*(,8328212tW))) 2250 Gl=ltZ$(-.5771017tW)
H-5

2260 G=GtGl 2270 RETURN 2280 DISP ‘P IS WITHIN l,E-6 OF BEING A -UE INTEGER' 2281 WAIT 3000 2282 PEEP 2290 RETURN 2300 ! 2310 ! DATA OUTPUT ffX 2320 PRINT USING 2330 i l SAHPLE:‘,A$ 2330 IHAGE 7A110A 2340 PRINT USING 2350 i ‘TOTAL NUHBER OF SPECIHENS='rNl 2350 IMAGE 26Av3D 2360 PRINT USING 2370 i ‘TOTAL NUMBER OF BREAKS=‘vN 2370 IMAGE 23A,4D 2380 PRINT USING 2390 i ‘WEIEULL DISTRIBUTION ALPHA=‘rA 2390 IMAGE 27Av3D.3D 2400 PRINT USING 2410 i 'WEIBULL DISTRIBUTION PETA=‘rB 2410 IMAGE 26A~4De3D 2420 PRINT USING 2430 i 'TENSILE STRENGTH (PSI) OF FIBER AT'rWlr' GAGE L ENGTH=’ IS 2430 IMAGE 35A14D.3D113A1D.3DE 2440 PRINT USING 2450 i 'INTERFACIAL SHEAR STRENGTH=‘tT 2450 IMAGE ~~AID,~IIE 2460 PRINT USING 2470 i 'VARIANCE OF THE SHEAR STRENGTH=‘vU 2470 IMAGE 3lA,D,3DE 2480 ! 2490 END
H-6
APPENDIX I. WEIBULL DISTRIBUTION OF CRITICAL-LENGTH A HISTOGRAM PLOT
The purpose of this program is to plot the Weibull Distribu- tion curve and the population density curve of the critical aspect ratio of the fibers.
I-l

10 COH 29 20 ! ftSSbDATA PLOT PROGR~H**ttf*tttttWERSION 6,09S*tS*t*** 30 DIM ~~~~~~~~~~~~~~~~~~~~~~~~~~~~~~~~~~~~~~~~~~~~~~~~~~~~~~~~~~~~~~~~~ Yl(2r350)rR(350) 40 DIH TlbC801 50 ! tt*tfINITIALIZATION**********************************$ 60 Gb=‘AG’ Q N%=‘NY’ Q K$=‘KTC’ Q Ll(O)=O Q S$=" Q N=O 70 Nl=O @ Z9=1 Q DEG 80 ON KEY) lr.ENTER’ GO’TO 180 90 ON KEYI 2r’SETUP’ GOT0 530 100 ON KEY1 3,'HEADING' GOT0 830 110 ON KEYt 4~’ PLOT’ GOT0 2130 120 ON KEY) 5r’STORE’ GOT0 390 130 ON KEY# 6r'EDIT' GOT0 1460 140 ON KEYC 7,’ LEGEND’ GOT0 1390 i50 ON KEYt 89’ RANGE’ GOT0 900 160 CLEAR Q KEY L.AAEEL 170 GOT0 170 is0 ! 190 ! *****DATA ENTRYS*ttttbff*SStbS********************** 200 CLEAR Q DISP ‘Enter Data Prom Keyboard(K) or Tape(T) or from Calcula tion(C)' 210 220 230 240 250 260 270 280 290 300 310 320 330 340 350 360 370 380 390 400 410 420 430 440 450 460 470 480
INPUT G$Q ~2=POS~K$,lJPC$~QStlrll~) IF Q2=0 THEN 200 ON a2 GOT0 240~750r741 FOR I=Ntl TO 6 CLEAR Q DISP ‘Enter Data for Set ';I;* (Y/N)' INPUT Q$Q Q2=POS~N~~UPC$(Q$Cl,ll~) IF R2=0 THEN 250 ON Q2 GOT0 370~290 DISP ‘Enter Data Pairs(ENDLINE ends)' FOR J=l TO 100 DISP 'X(miI;m~miJim)r Y~miIim~miJim~ = ';Q INPUT Q$rR$ IF Q$=” THEN 350 X'.IIJ)=UAL(R$) Q Yl(IvJ)=UAL(R$) NEXT J Nl(I)=J-1 Q Nl=NltNl(I) NEXT I N=I-1 ON Z9 GOT0 530~160 ! *:tSStSTORE DATA ON TAPE*** Z9=2 CLEAR Q DISP 'Store. on Tare(Y/N)' GOSUE 3190 Q ON Q9 GOT0 1609430 DISP 'FILE NAHE';Q INPUT F$ ISISP ‘New or Existins File (N/E)’ INPUT a$Q IF UPCb(R$Clrll)=‘N' THEN 460 ELSE GOT0 470 CREATE UPC$(F$)tSO ASSIGNP 1 TO UPC$(F$) PRINTI 1 i N~NlOrXO~YO,XlrYlrX~~~~Yl~~~~LlOrPotL~~~S~~~S~~T~~Y~~X
%,FlrF2rQl,X2,X3,Y2rY3 490 PRINTt 1 i Tl%. 500 ASSIGNt 1 TO $ 505 CLEAR 510 DISP ‘DATCI SET ‘iUPC$(F%)i’ STORED ON TAPE’ Q KEY LABEL 520 Z9=2 Q GOT0 170 530 ! *****DETERMINE COLOR9 LINE AND SYHEOLftbSSff*f*ftSS 540 CLEAR
I-2
550 FOR I=1 TO N 560 DISP 570 DISP ‘ENTER PEN # (1-4)~’ Q DISP ‘LINETYPE # (l-8) AND PL OTTING SYMBOL # (l-6)' 580 DISP 'FOR IlATh SET';1 590 IF I=1 THEN 600 ELSE -700 600 PRINT ‘PEN CDLOR KEY’ Q PRINT ‘l= BLACK' @ PRINT l 2 RED' Q PRINT '3
GREEN’ @ PRINT ‘4 BLUE’ 610 PRINT Q PRINT 'LINETYPE KEY. e PRINT ml= SOLID' 620 PRINT '2 BLANK' e PRINT l 3 DOT' Q PRINT '4 S+DASH' 630 PRINT '5 L.msH* e PRINT '6 BASHDOT. 640 PRINT ‘7 L.DASH/S.DASH’ Q PRINT ‘8 DASH/DOT/DOT* 650 PRINT Q PRINT 660 PRINT 'PLOTTING SYMBOL KEY' 670 PRINT 'l= DOT’ Q PRINT '2 CIRCLE' Q PRINT '3 SQUARE' 680 F'RINT '4 TRIANGLE’ Q PRINT ‘5 PLUS SIGN' Q PRINT '6 DIAMOND’ 690 PRINT Q PRINT Q PRINT Q PRINT 700 INPUT P(I)YL(I)YS(I) 710 IF P(I)<1 OR P(I)>4 THEN 700 720 IF L(I),<1 OR L(I)>8 THEN 700 730 IF S(I)<1 OR S(I)>.6 THEN 700 740 NEXT I e 0N z9 GOTO 83od60 741 ! CALCULATION FOR WEIBULL DISTRIBUTION 742 DISP ‘ENTER FILE NAME WITH RO MATRIX FOR WEIBULL DISTRIBUTION' Q IN PUT FbQ ASSIGN# 1 TO F$ 743 REABC 1 i N5rRO 744 ASSIGNI 1 TO t 745 N=l Q Nl(l)=NS 746 DISP ‘ENTER VALUES’ Q INPUT AYE 747 CLEAR @ DISP ‘CUMULATIVE PLOT (C) OR DENSITY POPULATION PLOT (II)?’ Q
INPUT E9 748 IF E$='C' THEN 750 749 IF E$='D' THEN 752 ELSE 747 750 FOR I=1 TO N5 P X(~YI)=(R(I)/B)"A Q Yl~lrI)=1-EXP(-X(lrI~~ e X(lrI)= R(I) Q NEXT I 751 Z?=2 P GOT0 160 752 FOR I=1 TO N5 P X(lrI)=(R(I)/B)^A @ Yl~lrI~=A/BS~R~I~/B~-~~-l)*EXP~- X(1~1)) Q X(l,I)=R(I) 753 NEXT I 754 Z9=2 G! GOT0 160 759 ! DATA ENTRYt#tt*tttf**ttt* 760 ISISP ‘ENTER FILE NAHE'PQ INPUT F$ 770 ASSIGN# 1 TO UPC$(F%) 780 READI 1 i NYN~O~XOYYOYX~~Y~~X~Y~YY~~Y~YL~OYPOYLOYSOYS~YT~YY~YX~ YF~,F~YQ~YX~?X~?Y~YY~ 790 RERB# 1 i TlQ 800 ASSIGNI 1 TO t 810 Z9=2 820 GOT0 160 830 ! *****ENTER HEADINGSStSStStf~*S~%~*~~****~******** 840 CLEAR Q DISP ‘ENTER TITLE'iQ INPUT Tt 850 DISP ‘ENTER SUBTITLE’iQ INPUT Tl% 860 DISF ‘ENTER X axis TITLE’;@ INPUT X1 870 DISP .ENTER Y axis TITLE'iQ INPUT Y% 880 P(O)=1 890 ON Z9 GOT0 900~160 900 ! t*tffDEFINE GRAPH*tf*tt**tt*tf*t**~************** 910 xo?Yo=lo-99 e Xl?Yl=-10-99
I-3
1010 FOR I=1 TO N 1020 FOR J=l TO NItI) 1030 XO=HIN(XOYX(IYJ)) Q Xl=HAX(XlyX(IyJ)) 1040 YO=HIN(YOYYI(IYJ)) Q Yl=HAX(Ylryl(IyJ)) 1050 NEXT J 1060 NEXT I 1070 DISP 'X DATA RANGE 1s 'iX0;' TO 'ix1 1080 DISP 'Y DATA RANGE IS 'iY0;' TO .iYl 1100 DISP '~0 YOU WISH ~0 SET GRAPH LIMITS .;e GOSUB 3170 1110 ON Q9tl GOT0 1100t1160~1120 1120 DISP ‘ENTER XminrXmaxrYminrYmax 'i 1140 INPUT XOYX~YYOYY~ 1150 IF Xl<XO OR Yl<YO THEN 1120 1160 DISP 'DO YOU WISH AXES OR GRID (A or G1.i 1170 INPUT R$Q Rl=POS(G$rR$) 1175 DISP Q DISP ‘NUMERICAL LABELS:’ 1177 DISP ‘on horizontal axisrr.m 1180 ON Qltl GOT0 1160~1190~1240 1190 DISP 'Units per label? units per tic mark’; 1200 INPUT X3rX2@ X3=INT(X3/X2++51) Q IF X3(0 THEN 1190 1205 DISP @ DISP 'on vertical axis.r.' 1210 DISP 'Units per label? units per tic mark'; 1220 INPUT Y3,Y2@ Y3=INT(Y3/Y2) Q IF Y3<0 THEN 1210 1230 GOT0 1290 1240 DISP 'units per GRID LINE?units per tic mark’; 1250 INPUT X3?X2@ X3=INT(X3/X2+.51) Q IF X3<0 THEN 1240 1255 DISP @ DISP 'on vertical ax1sb4* . 1260 DISP 'units per GRID LINEpunits Per GRID LINE'; 1270 INPUT Y3rY2Q Y3=INT(Y3/Y2+.51) Q IF Y3<0 THEN 1260 1280 ON ERROR GOSUB 3220 1290 IF Y2<1 THEN F2=2 ELSE F2=0 1300 IF Y2.c.l THEN F2=4 1310 IF X2(1 THEN F1=2 ELSE Fl=O 1320 IF X2.<,1 THEN Fl=4 1330 DISP 'INTEGER LABELS ON X-AXIS'; 1340 GOSUB 3170 1350 ON a9 GOT0 1370~1360 1360 Fl=O 1370 OFF ERROR. 1380 ON Z9 GOT0 1390,160 ;D; ;,rT~#f$;~W;R LEGENDS%%*%**
1410 FOR I=1 TO N 1420 DISP ‘Enter Legend for Group 'iI 1430 INPUT Ire s$=S$tI* Q L~(I)=LEN(SW 1440 NEXT I 1450 ON Z9 GOT0 390,160 1460 ! EDIT ROUTINE 1470 CLEAR Q DISP ‘Enter data set number’ 1480 INPUT I 1490 DISP ‘There are'iNl(I)i' data pairs (XrY) in this set' 1500 DISP Q DISP ‘Enter startin 8 endinf item numbers for list (ENDLINE
ends)’ 1510 INPUT D$irE$ 1520 IF III=” THEN 2122 1530 FOR J=VAL(D$) TO HIN(VAL(E%)rNl(I)) 1540 DISP Jim= miX(I~J);mrmiY1~I~J) 1550 NEXT J
I-4

1560 DISP ‘Add(A)r DeletefD)rChan~e(C)r Insert(I)rE 1570 INPUT Yl% 1580 IF UPC$(Y~%C~Y~I)='A~ THEN 1640 1590 IF UPCt(Yl$Clrll)='D' THEN 1700 1600 IF UPC$~Yl$~lrll)=~C~ THEN 2050 1610 IF UPCI(Y1$Clrll~='I~ THEN 1850 1620 IF UPC$(Yl$tlrll)=+ THEN 1500 1630 GOT0 1500 1640 ! ADD ROUTINE 1650 DISP 'X('i1i.r 'iNl~I~tli'~tY~'iIi'~~;Nl~I~tl;~~ =' 1660 Nl(I)=Nl(I)tl 1670 INPUT X~IYN~(I)~~Y~(IYN~~I)) 1680 GOT0 1560 1690 ! 1700 ! DELETE ROUTINE 1710 DISP ‘Enter item # to delete' 1720 INPUT J 1730 DISP l X~'iIiBrDiJi~~tY~giI;~~~;J;g~ = 'iXf11J)i' 'iYl(I,J) 1740 DISP ‘Enter D to delete' 1750 ! 1760 INPUT Yl% 1770 IF UPC~(Y~~C~Y~I)#~D~ THEN 1560 1780 Nl(I)=Nl(I)-1 1790 FOR Jl=J TO Nl(I) 1800 X(I?Jl)=X(I~Jltl) 1810 ! 1820 Yl(I~Jl)=Yl(IvJl+l) 1830 NEXT Jl 1840 DISP 'Item'iJi' deleted' Q GOT0 1560 1850 ! INSERT ROUTINE 1860 DISP 'Insert item before item #' 1870 ! 1880 INPUT J 1890 DISP 'X(giIi'~'iJi')rY('iI;'~';J;') = ' 1900 INPUT G8rG9 1910 Nl(I)=Nl(I)+l 1920 FOR Jl=Nl(I) TO J+l STEP -1 1930 ! 1940 X(IYJI)=X(IYJ~-~) 1950 Y1(1~Jl)=Yl(1~Jl-l) 1960 NEXT Jl 1970 X(I,J)=G8 1980 Yl(I?J)=G9 1990 ! 2000 GOT0 1560 2010 ! 2020 ! 2030 ! 2040 ! 2050 ! CHANGE ROUTINE 2060 DISP ‘Enter Item # to Chanfe’ 2070 INPUT J 2080 DISP 'Old Values:' Q DISP 2090 DISP X(IYJ);'Y';Y~(IIJ) 2100 DISP e DISP ‘Enter New Values. 2110 INPUT X(I?J)rYl(I,J)Q DISP I? DISP 2120 GOT0 1560 2122 CLEAR e PRINT USING 991. i e PRINT ‘Press RANGE User Ker before
I-5

PLOT’ e KEY LABEL e G0~0 170 2130 ! %%SbSGRAPHft%bt%%fSS%%%%%%%~%%%%%%%%%%%%%%%%%%%%%%%% 2140 DISP ‘PLOT ON:’ 2150 DISP ' 1. HP SCREEN’ 2160 DISP ’ 2. PLOTTER’ @ DISP ’ 3+ POSTER’ 2170 INPUT Z 2180 IF Z=l THEN 2270 2190 IF Z=2 THEN 2230 2200 IF Z=3 THEN 2230 2210 GOT0 2140 2220 Z9=2 2230 PLOTTER IS 705 2240 IF Z=3 THEN 2280 2250 LIHIT 0~250~15,195 2260 GOT0 2280 2270 PLOTTER IS 1 2280 LOCATE 26,120~20,80 2290 SCALE XOYX~YYOYY~ 2300 FXD ~ld2 Q CSIZE 4rr6r0 Q LINETYPE 1 e GCLEAR e PEN 1 2310 ON Ql GOT0 2320~2340 2320 LAXES -X~YY~~XOYYO~X~YY~ 2330 GOT0 2350 2340 LGRID -XZYY~YXOYYOYX~YY~ Q FRAHE 2350 PEN P(O) Q HOVE XOt(Xl-XO~/2,Y1t(Yl-YO)$3/2O 2360 LORG 4 @ CSIZE 2SZt2r.7~0 2370 LABEL T1 2380 CSIZE 2tZ+lr.7 2390 LABEL Tl$ 2400 SETGU 2410 HOVE 70~3 2420 LORG 4 2430 LABEL X% 2440 HOVE 8~45 2450 LDIR 90 I! LABEL YS 2460 LIIIR 0 2470 SETUU 2650 ! SSfftPLOT DATAtt%S%*ftttbtf*tt%%%*%%%%%*%********* 2660 FOR I=1 TO N 2670 PEN P(I) 2680 HOVE X(I~l)rYl(1~1) 2690 GOSUB 2890 2700 HOVE X(I~l)rYl(Irl) 2710 FOR J=2 TO Nl(I) 2720 LINETYPE L(I) 2730 DRAW X(IYJ)YY~(IYJ) 2740 GOSUB 2890 2750 HOVE X(IYJ)YY~(IYJ) 2760 NEXT J 2770 GOSUB 2800 2780 NEXT I Q PEN 0 :7,8,2,,fF Z=l THEN CLEAR Q DISP USING '7/' i Q DISP ‘Press KEY
Q WAIT 2000 2784 IF z=l THEN CLEAR Q GRAPH e GOTO 170 2790’ GOT0 160 2800 ! ff%fSDRAW KEYt%t**%%tt%bt6%%%*%%*%%***%%%**%******% 2810 SETGU Q LINETYFE L(I) 2820 HOVE 110~96-3*(1-l) 2830 IDRAW 5~0
I-6
LABEL when

2840 2850 2860 2870 2880 2890.. 2900 2910 2920 2930 2940 2950 2960 2970 2980 2990 3000 3010 3020 3030 3040 3050 3040 3070 3080 3090 3100 3110 3120 3130 3140 3150 3160 3170 3180 3190 3200 3210 3220 3230 3240
GOSUB 2890 Q SETGU HOVE 117r96-3%(1-1) LORG 2 e CSIZE 3?.6 e LDIR 0 LABEL S$CL1(1-1~+1~L1(1~1 SETUU Q RETURN ! tStt%PLOT SYHBOLS%S%StS%t*t*S%%%%%%*%%**%%%%%*%%%%% SETGU Q LINETYPE 1 ON S(I) GOT0 2920~2940~2990~3040~3080~3130 ! *****DOT***************** RPLOT 010 P SETUU Q RETURN ! tftd%CIRCLEtt*tt**tt%%%%% IHOVE r15~0 FOR A=0 TO 360 STEP 30 PDIR A e RPLOT .8rO NEXT A (I SETUU @ RETURN ! fftbtSQUAREtff*t*f**%***% IMOVE -I?-1 IDRAW 2~0 Q IDRCIW 012 IDRAW -2?O @ IDRAW OY-2 SETUU @ RETURN ! ttttSTRIANGLEd*t***t*%*** IHOVE 0~1 IDRAW 1 r-2 @ IDRAW -2~0 IDRAW 1~2 t? SETUU P RETURN ! ****#PLUS SIGNtt*t**fttt* I;;:; ;Y; I! IDRAW 01-2
IDRFIW 1:0 @ IDRAW -2ro SETUU @ RiTURN ! tt*ttDIAHONDttttbttt***** IHOVE 0~1 e IDRAW lr-1 IDRAW -1 r-l @ IDRAW -1~1 IDRAW lrl @ SETUU I? RETURN ! tttt*YES OR NOb*t*bt*Stf*tSt%*ft**~***%************$ DISP ‘(Y/N)’ INPUT R$@ Q9=POS(N$,Q$) IF Q9=0 THEN 3180 RETURN !, ttfSSCHECK FOR DIVISION BY%t**f*f**tStZEROt*tttff IF ERRN=8 THEN FlrF2=0 RETURN
I-7

APPENDIX J. INSTRUMENTED IMPACT TESTER
The ETI-Dynatup drop dart instrumented impact tester monitors and records the entire impact event, from initial impact and acceleration from rest to plastic bending to fracture initiation and propagation to failure. Also, the drop dart system permits dynamic tests to be made at impact energies and velocities not available with other testing machines.
The drop dart impact test consists of a drop tower and instru- mentation package - a microprocessor. The drop tower is a gravity driven impact machine equipped with remote controls for release of the hammer and tup assembly, and a motorized lift mechanism for easy return of the hammer to a predetermined drop position. An automatic rebound brake is furnished as standard.
The hammer and tup assembly is designed so that the weight of the hammer can be varied and the tups can be interchanged. The base plate of the drop tower permits interchangeability of anvil supports to accommodate different specimen size and geometries.
A typical output is shown in Figure J-l. PI and PF are the loads correspond to the initial damage of the composite and the maximum load required for punch through. The corresponding energy ab- sorbed at each stage is EI and EF. The total energy absorbed during the whole event is ET. In this report, PF and ET are used to characterize the impact toughness of the laminates.
J-l

1792 (400)
1344 (300)
z 1 896
2 (200)
:
448 (100)
0
PF
PI
: . ; .
.’ f . .’ . a :
.’
L d
ETI-300 TYPICAL OUTPUT
10.85 (8.00)
8.14(6.00)
(2:) (2:) (236) 10.2 (0.4)
i 2
5.42(4.00) g
2.71(2.00)
0
Deflection--mm (in)
FIGURE J-l. TYPICAL OUTPUT OF AN ETI-DYNATUP INSTRUMENTED IMPACT TESTER
J-2
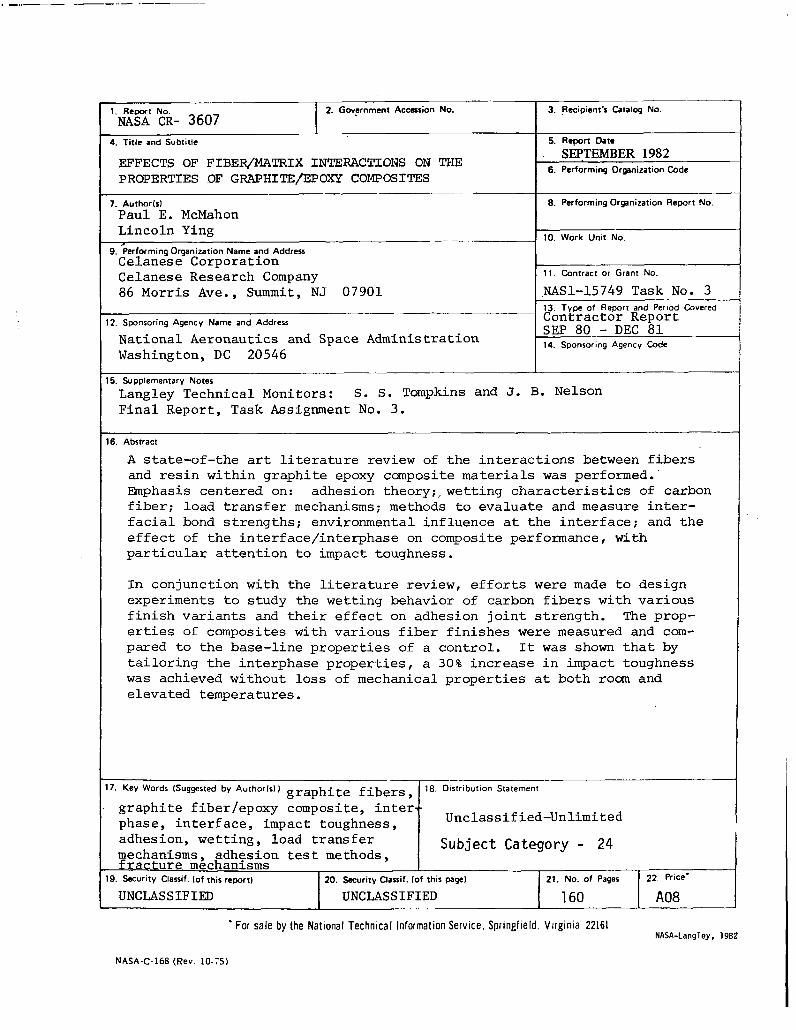
. _,..- -_ _--.._... - .--
4. Title and Subtitle
EFFECTS OF FIBER/MATRIX INTERACTIONS ON THE PROPERTIES OF GRAPHITE/EPOXY COMPOSITES
7. AuthorM 6. Performing Organization Report NI Paul E. McMahon Lincoln Ying
10. Work Unit No. 9. &forming Organization Name and Address
Celanese Corporation Celanese Research Company 86 Morris Ave., Summit, NJ 07901
12. Sponsoring Agencv Name and Address
National Aeronautics and Space Administration Washington, DC 20546
_____ 3. Recipient’s Catalog No.
5. Report Dare
SEPTEMBER 1982 6. Performing Organization Code
11. Contract or Grant No.
NASl-15749 Task No. I 13. Type of Reporr and Period Cover Contractor Report SEP 80 - DEC 81 14. Sponrormg Agencv Code
I 5. Supplementary Notes
Langley Technical Monitors: s. s. Tompkins and J. B. Nelson Final Report, Task Assignment No. 3.
16. Abstract
A state-of-the art literature review of the interactions between fibers and resin within graphite epoxy composite materials was performed. Rnphasis centered on: adhesion theory;, wetting characteristics of carbor fiber; load transfer mechanisms; methods to evaluate and measure inter- facial bond strengths: environmental influence at the interface; and the effect of the interface/interphase on composite performance, with particular attention to impact toughness.
In conjunction with the literature review, efforts were made to design experiments to study the wetting behavior of carbon fibers with various finish variants and their effect on adhesion joint strength. The prop- erties of composites with various fiber finishes were measured and com- pared to the base-line properties of a control. It was shown that by tailoring the interphase properties, a 30% increase in impact toughness was achieved without loss of mechanical properties at both roan and elevated temperatures.
17. Key Words (Suggested by Authorfsl) graphite fibers , 16. Dnstribution Statement
graphite fiber/epoxy composite, inter,- phase, interface, impact toughness, Unclassified-Unlimited
-
adhesion, wetting, load transfer mechanisms adhesion test methods,
Subject Category - 24 fracture m&hanisms
19. %CUrity Clawif. (of this report) 20. Security Classif. (of this paget 21. No. of Pages 22. Price’
UNCLASSIFIED UNCLASSIFIED 160 A08
. For sale by the National Technical Information Service, Springfield. Virginia 22161 NASA-Langley. 1982
NASA-C-168 (Rev. 10-X)


![Sizes Payload Compensation path XY up to 20 kg - Comoso · Compensation path XY ... Material CR CR CR CR NBR CR CR CR CR CR CR NBR NBR NBR NBR NBR ... Bending [Nm/rad] 474 552 1025](https://static.fdocuments.net/doc/165x107/5af1b3557f8b9ac57a903b0d/sizes-payload-compensation-path-xy-up-to-20-kg-path-xy-material-cr-cr-cr-cr.jpg)