CR Curriculum Research DG & Development Group€¦Brian Lawton Paul R. Brandon ... Curriculum...
51
CR DG Curriculum Research & Development Group Brian Lawton Paul R. Brandon University of Hawai‘i at Mänoa
Transcript of CR Curriculum Research DG & Development Group€¦Brian Lawton Paul R. Brandon ... Curriculum...
CRDG
Curriculum Research& Development Group
Brian LawtonPaul R. Brandon
University of Hawai‘i at Mänoa
Brian Lawton
Line
Evaluation of the Second Year of theArts and Literacy for All Research Project
Brian LawtonPaul R. Brandon
Program Research and Evaluation OfficeCurriculum Research & Development Group
University of Hawai‘i at Mānoa
March 2009

ii
ABSTRACT
Curriculum Research & Development Group, University of Hawai#i at Mānoa provided
evaluation services to the Hawai‘i Arts Alliances’ Arts and Literacy for All (ALA) research
project, a four-year endeavor funded by the U.S. Department of Education (ED) Arts Education
Model Development and Dissemination (AEMDD) grant project. The project was implemented
in two public schools on the island of O‘ahu, with two matched public schools serving as a
control group. The purpose of the project is to train Grade 3-5 elementary school teachers in how
to use drama and dance strategies to teach core subject matter. This is the report for the second
year of the project (first year of project implementation). The first year of the project was for
planning and development purposes. Teachers were trained in a summer institute, in full-day
workshops, and were provided in-class mentoring with expert art educators. The goals of the
project were to positively effect student outcomes, including reading achievement and interest in
the arts; to positively affect teachers’ effective use of the arts strategies and attitudes toward
teaching with the arts; and to create a classroom community through active student engagement.
The primary purpose of our second year evaluation, the focus of this report, was to collect
baseline information on students and teachers and provide formative evaluation information to
the project for future improvements. In this report, we show that the project was well-received
by the teachers and students and that it was successful in creating a sense of classroom
community. The project did not have any effect on student achievement during its first year of
implementation, however, the teachers did not implement the arts activities as frequently as
expected.

iii
CONTENTS
Abstract . . . . . . . . . . . . . . . . . . . . . . . . . . . . . . . . . . . . . . . . . . . . . . . . . . . . . . . . . . . . . . . . . . . . ii
Figures . . . . . . . . . . . . . . . . . . . . . . . . . . . . . . . . . . . . . . . . . . . . . . . . . . . . . . . . . . . . . . . . . . . . . . v
Tables . . . . . . . . . . . . . . . . . . . . . . . . . . . . . . . . . . . . . . . . . . . . . . . . . . . . . . . . . . . . . . . . . . . . . . vi
Executive Summary . . . . . . . . . . . . . . . . . . . . . . . . . . . . . . . . . . . . . . . . . . . . . . . . . . . . . . . . . . vii
Chapter I: Introduction . . . . . . . . . . . . . . . . . . . . . . . . . . . . . . . . . . . . . . . . . . . . . . . . . . . . . . . . . . 1
Project Overview . . . . . . . . . . . . . . . . . . . . . . . . . . . . . . . . . . . . . . . . . . . . . . . . . . . . . . . . . . . 1
Components of ALA . . . . . . . . . . . . . . . . . . . . . . . . . . . . . . . . . . . . . . . . . . . . . . . . . . . . . 2
Component 1. Arts Integrated Whole School Model . . . . . . . . . . . . . . . . . . . . . . . . . 2
Component 2. ARTS FIRST Essential Arts Toolkit . . . . . . . . . . . . . . . . . . . . . . . . . . 2
Component 3. Teacher Professional Development . . . . . . . . . . . . . . . . . . . . . . . . . . . 3
Component 4. In-Class Artist Mentoring . . . . . . . . . . . . . . . . . . . . . . . . . . . . . . . . . . 4
ALA Teacher Knowledge and Skill Development . . . . . . . . . . . . . . . . . . . . . . . . . . . . . . 4
Evaluation Background . . . . . . . . . . . . . . . . . . . . . . . . . . . . . . . . . . . . . . . . . . . . . . . . . . . 6
Chapter II: Methods and Results . . . . . . . . . . . . . . . . . . . . . . . . . . . . . . . . . . . . . . . . . . . . . . . . . . 8
Evaluation Design . . . . . . . . . . . . . . . . . . . . . . . . . . . . . . . . . . . . . . . . . . . . . . . . . . . . . . . . . . 8
Participating Schools . . . . . . . . . . . . . . . . . . . . . . . . . . . . . . . . . . . . . . . . . . . . . . . . . . . . . . . . 9
Evaluation Topics Addressed . . . . . . . . . . . . . . . . . . . . . . . . . . . . . . . . . . . . . . . . . . . . . . . . 11
Instruments and Methods of Data Collection . . . . . . . . . . . . . . . . . . . . . . . . . . . . . . . . . . . . 12
Student Outcomes . . . . . . . . . . . . . . . . . . . . . . . . . . . . . . . . . . . . . . . . . . . . . . . . . . . . . . 12
Stanford Achievement Test 10th Edition (SAT10) . . . . . . . . . . . . . . . . . . . . . . . . . . . 13
Grade 3 . . . . . . . . . . . . . . . . . . . . . . . . . . . . . . . . . . . . . . . . . . . . . . . . . . . . . . . . . 13
Grade 4 . . . . . . . . . . . . . . . . . . . . . . . . . . . . . . . . . . . . . . . . . . . . . . . . . . . . . . . . . 14
Grade 5 . . . . . . . . . . . . . . . . . . . . . . . . . . . . . . . . . . . . . . . . . . . . . . . . . . . . . . . . . 14
Hawai#i State Assessment (HSA) . . . . . . . . . . . . . . . . . . . . . . . . . . . . . . . . . . . . . . . 15
Grade 3 . . . . . . . . . . . . . . . . . . . . . . . . . . . . . . . . . . . . . . . . . . . . . . . . . . . . . . . . . 15
Grade 4 . . . . . . . . . . . . . . . . . . . . . . . . . . . . . . . . . . . . . . . . . . . . . . . . . . . . . . . . . 15
Grade 5 . . . . . . . . . . . . . . . . . . . . . . . . . . . . . . . . . . . . . . . . . . . . . . . . . . . . . . . . . 16
Interest in the Arts Questionnaire . . . . . . . . . . . . . . . . . . . . . . . . . . . . . . . . . . . . . . . 16
Grade 3 . . . . . . . . . . . . . . . . . . . . . . . . . . . . . . . . . . . . . . . . . . . . . . . . . . . . . . . . . 17
Grade 4 . . . . . . . . . . . . . . . . . . . . . . . . . . . . . . . . . . . . . . . . . . . . . . . . . . . . . . . . . 17
Grade 5 . . . . . . . . . . . . . . . . . . . . . . . . . . . . . . . . . . . . . . . . . . . . . . . . . . . . . . . . . 18

iv
Teachers’ Attitudes and Opinions about the Project . . . . . . . . . . . . . . . . . . . . . . . . . . . . 18
Teacher Attitude Toward Teaching with the Arts Survey . . . . . . . . . . . . . . . . . . . . . 18
Summer Institute Quality Survey . . . . . . . . . . . . . . . . . . . . . . . . . . . . . . . . . . . . . . . 19
Likert scale items . . . . . . . . . . . . . . . . . . . . . . . . . . . . . . . . . . . . . . . . . . . . . . . . . 19
Open-ended response items . . . . . . . . . . . . . . . . . . . . . . . . . . . . . . . . . . . . . . . . . 19
Teacher Focus Groups . . . . . . . . . . . . . . . . . . . . . . . . . . . . . . . . . . . . . . . . . . . . . . . . 21
Opinions about the professional development activities . . . . . . . . . . . . . . . . . . . 21
Factors that affect the use of the arts strategies . . . . . . . . . . . . . . . . . . . . . . . . . . 22
Effects of using the arts strategies . . . . . . . . . . . . . . . . . . . . . . . . . . . . . . . . . . . . 22
Teachers’ Use of the Arts Strategies Survey . . . . . . . . . . . . . . . . . . . . . . . . . . . . . . . 23
Frequency and Quality of Implementation of Arts Strategies . . . . . . . . . . . . . . . . . . . . . 25
Weekly Teacher Log . . . . . . . . . . . . . . . . . . . . . . . . . . . . . . . . . . . . . . . . . . . . . . . . . 25
Quality of Program Implementation Observations . . . . . . . . . . . . . . . . . . . . . . . . . . 25
Teachers Use of the Arts Strategies Survey . . . . . . . . . . . . . . . . . . . . . . . . . . . . . . . . 29
Student Opinions about and Exposure to the Arts Strategies . . . . . . . . . . . . . . . . . . . . . 31
Student Focus Groups . . . . . . . . . . . . . . . . . . . . . . . . . . . . . . . . . . . . . . . . . . . . . . . . 31
Student Exposure to the Arts Survey . . . . . . . . . . . . . . . . . . . . . . . . . . . . . . . . . . . . . 31
Unintended Consequences and Other Contextual Variables . . . . . . . . . . . . . . . . . . . . . . 33
Principal Interviews . . . . . . . . . . . . . . . . . . . . . . . . . . . . . . . . . . . . . . . . . . . . . . . . . . 33
Teacher Focus Groups . . . . . . . . . . . . . . . . . . . . . . . . . . . . . . . . . . . . . . . . . . . . . . . . 34
Chapter III: Discussion . . . . . . . . . . . . . . . . . . . . . . . . . . . . . . . . . . . . . . . . . . . . . . . . . . . . . . . . 35
Student Outcomes . . . . . . . . . . . . . . . . . . . . . . . . . . . . . . . . . . . . . . . . . . . . . . . . . . . . . . . . . 35
Stanford Achievement Test 10th Edition (SAT10) and
Hawai#i State Assessment (HSA) . . . . . . . . . . . . . . . . . . . . . . . . . . . . . . . . . . . . . . . 35
Interest in the Arts Questionnaire . . . . . . . . . . . . . . . . . . . . . . . . . . . . . . . . . . . . . . . . . . 35
Teachers Attitudes and Opinions About the Project . . . . . . . . . . . . . . . . . . . . . . . . . . . . . . . 36
Frequency and Quality of Implementation of Arts Strategies . . . . . . . . . . . . . . . . . . . . . . . . 37
Student Opinions about and Exposure to the Arts Strategies . . . . . . . . . . . . . . . . . . . . . . . . 38
Unintended Consequences and Other Contextual Variables . . . . . . . . . . . . . . . . . . . . . . . . . 39
Summary . . . . . . . . . . . . . . . . . . . . . . . . . . . . . . . . . . . . . . . . . . . . . . . . . . . . . . . . . . . . . . . . 39
References . . . . . . . . . . . . . . . . . . . . . . . . . . . . . . . . . . . . . . . . . . . . . . . . . . . . . . . . . . . . . . . . . . 40

v
FIGURES
Figure II-1 The project’s switching replications research design. . . . . . . . . . . . . . . . . . . . . . . 9
Figure II-2 SAS program used to calculate propensity score for use as a covariate. . . . . . . . 13
Figure II-3 Proportion of teachers’ responses to the ALA weekly log over
a 28-week period . . . . . . . . . . . . . . . . . . . . . . . . . . . . . . . . . . . . . . . . . . . . . . . . . 26

vi
TABLES
Table I-1 Overview of the ALA Arts Strategies . . . . . . . . . . . . . . . . . . . . . . . . . . . . . . . . . . 5
Table II-1 Demographic Characteristics of Participating ALA Schools . . . . . . . . . . . . . . . 10
Table II-2 Evaluation Topics and Methods of Data Collection . . . . . . . . . . . . . . . . . . . . . . 11
Table II-3 Grade 3 SAT10 ANCOVA Results . . . . . . . . . . . . . . . . . . . . . . . . . . . . . . . . . . . 14
Table II-4 Grade 4 SAT10 ANCOVA Results . . . . . . . . . . . . . . . . . . . . . . . . . . . . . . . . . . . 14
Table II-5 Grade 5 SAT10 ANCOVA Results . . . . . . . . . . . . . . . . . . . . . . . . . . . . . . . . . . . 14
Table II-6 Grade 3 HSA ANCOVA Results . . . . . . . . . . . . . . . . . . . . . . . . . . . . . . . . . . . . . 15
Table II-7 Grade 4 HSA ANCOVA Results . . . . . . . . . . . . . . . . . . . . . . . . . . . . . . . . . . . . . 16
Table II-8 Grade 5 HSA ANCOVA Results . . . . . . . . . . . . . . . . . . . . . . . . . . . . . . . . . . . . . 16
Table II-9 Grade 3 Interest in the Arts Questionnaire ANCOVA Results . . . . . . . . . . . . . . 17
Table II-10 Grade 4 Interest in the Arts Questionnaire ANCOVA Results . . . . . . . . . . . . . . 17
Table II-11 Grade 5 Interest in the Arts Questionnaire ANCOVA Results . . . . . . . . . . . . . . 18
Table II-12 Teacher Attitude Toward Teaching with the Arts Survey ANCOVA Results . . 19
Table II-13 Descriptive Statistics for the Summer Institute 2007 Quality Survey . . . . . . . . . 20
Table II-14 Descriptive Statistics for Items 3–8 on the Teacher Use of the Arts Survey . . . . 24
Table II-15 Average Number, Duration, and Purpose for Responding Teachers’
Use of the ALA Arts Strategies Over a 28-Week Period . . . . . . . . . . . . . . . . . . 26
Table II-16 Six Quality Criteria Used in the Assessment of Teachers Quality
of Program Implementation . . . . . . . . . . . . . . . . . . . . . . . . . . . . . . . . . . . . . . . . . 27
Table II-17 Descriptive Statistics for Items 1 and 2 on the Teacher Use
of the Arts Survey . . . . . . . . . . . . . . . . . . . . . . . . . . . . . . . . . . . . . . . . . . . . . . . . 30
Table II-18 Proportion of Student Responses on the Student Exposure to
the Arts Survey . . . . . . . . . . . . . . . . . . . . . . . . . . . . . . . . . . . . . . . . . . . . . . . . . . 32

vii
Evaluation of the Second Year of theArts and Literacy for All Research Project
EXECUTIVE SUMMARY
Brian Lawton and Paul R. BrandonCurriculum Research & Development Group
University of Hawai‘i at Mānoa
March 2009
A team at Curriculum Research & Development Group at the University of Hawai‘i atMānoa conducted an evaluation of the second year of the Arts and Literacy for All (ALA)research project. This is an executive summary of the full evaluation report.
ALA is a four-year project funded by a grant to the Hawai#i Arts Alliance (HAA) from theU.S. Department of Education’s (ED) Arts Education Model Development and Dissemination(AEMDD) Grant Program. With the cooperation of the Hawai‘i Department of Education(HDOE), HAA implemented the project in two randomly assigned public schools on O‘ahu. Agroup of two randomly assigned, matched public schools served as the control group. Theprimary purpose of this report is to present baseline results and formative evaluation information.The intended audiences of the report are HAA and its project development team, the HDOE, andthe USDOE.
The ALA project trained teachers, through a series of professional development activities, inhow to use standards-based arts strategies to teach basic core academic material. The primarygoals of the project are to positively affect student reading achievement, actively engage studentsin the learning process, improve teacher practice with using the arts strategies, and improveteacher attitudes about teaching with arts. In School Year 2007–2008, the focus of this report, theproject provided services to teachers and students in Grades 3–5.
The Topics and Methods Addressed in the StudyThe evaluation examined student outcomes, teachers’ attitudes and opinions about the
project, the frequency and quality of implementation of the arts strategies, student opinions aboutand exposure to the arts strategies, and unintended consequences and other contextual variablesthat might affect project findings.
The methods that the evaluation team used to collect data included student achievement tests,student and teacher questionnaires, student and teacher focus groups, teacher logs, and principalinterviews. A project teacher observation method for examining the quality of program imple-mentation was also pilot-tested. The evaluation team analyzed the achievement and question-naire data by using statistical significance tests to determine between-group differences,descriptively analyzed the teacher log results, and summarized the teacher and student focusgroups and principal interview results.

viii
Preliminary Findings of the Study The second year evaluation found virtually no statistically significant differences between
groups on the student outcome measures. However, results from the teacher focus groups,teacher surveys, and student focus groups provided evidence that improvements to studentlearning did occur. The teachers’ attitudes and opinions about the project were generally positiveand indicated that participation in the project has increased their confidence in using the artsstrategies and their willingness to take risks in the classroom. The teachers’ frequency of artsstrategy use was relatively low. The teachers indicated that this was the result of the insufficientplanning time required to use the arts strategies as well as perceived curriculum constraints. Theteachers recognized the benefits of using the arts in creating a classroom community andacknowledged that their students enjoyed the lessons in which the arts strategies are used—twofindings that were also evident in students’ opinions about the project. The teachers alsoindicated that they would like to have more planning time with mentors, an aspect of theprogram that the teachers felt was the most valuable, to enhance their practice of using the artsstrategies. At this juncture of the evaluation, we recommend, to the extent possible, that theproject provide more in-class mentoring to help with planning of arts-integrated lessons, provideongoing feedback to teachers about the quality of their implementation of the arts strategies, andreinforce consistent use of the arts strategies.

CHAPTER IINTRODUCTION
Under a Memorandum of Agreement (MOA) with the Hawai#i Arts Alliance (HAA),
Curriculum Research & Development Group (CRDG), University of Hawai#i at Mānoa has
provided formative and summative evaluation services to the second year (School Year
2007–2008) of the Arts and Literacy for All (ALA) Research Project, a four-year endeavor
funded by the U. S. Department of Education (ED) Arts Education Model Development and
Dissemination (AEMDD) Grant Program (Award No. U351D060016).
ALA is a project to study the effects of integrating the arts in core subject matter, with an
emphasis on reading comprehension. This report covers the first year of implementation of the
project, in which two randomly-assigned public elementary schools served as the treatment
group and two randomly-assigned public schools served as the control group. All schools are
located on the island of O‘ahu. The first year of the project was a development and planning
year.
In this report, we include
1) an overview of the ALA project and its primary components;
2) an overview of the evaluation design and methods;
3) results on student achievement tests, student and teacher questionnaires, project student and
teacher focus groups, project principal interviews, project teacher weekly use logs, and the
pilot-test of a quality of implementation measure; and
4) a discussion of the findings.
Final conclusions about the merit and worth of the project will not be discussed until the final-
year report of the project (SY 2009–2010). The intended audiences of this report are the HAA
and its project development team, the Hawai#i Department of Education (HDOE), and the ED.
Project Overview
The ALA project is a whole-school model designed to improve student learning and teaching
practice through arts integration. The Hawaiian word Ala can be interpreted as “path or road” or
“to awaken or renew.” ALA is a model for infusing standards-based arts into instruction and is
intended to positively affect student achievement and education reform in Hawai#i. ALA is
intended to address the deficiencies in elementary school students’ exposure to drama and dance

2
activities and to use the arts strategies to help improve student achievement in basic subjects,
with an emphasis on reading comprehension achievement.
The goals of the Arts & Literacy for All project are to:
1) show improvement in student reading achievement through the integration of standards-
based drama and dance strategies into academic instruction;
2) effectively engage students in learning and increase positive interest in the arts;
3) improve teaching practices and teachers’ attitudes toward teaching with the arts using
standards based arts strategies;
4) observe and document changes in teaching pedagogy as they affect at-risk students.
Components of ALA
The ALA project consists of four primary components.
Component 1. Arts Integrated Whole School Model. ALA is designed for students and
teachers in Grades K–5. In Year 2, School Year [SY] 2007–2008 the project provided services to
students and teachers in Grades 3–5 in two randomly-assigned schools serving as the treatment
group (Group A), with two randomly-assigned schools serving as the control group (Group B).
In Year 3, the project will provide services to Grades 3–5 students and teachers in Group B and
add services to Grades K–2 students and teachers in Group A. In Year 4, the final year of the
project, the project will add services to Grades K–2 students and teachers in Group B and
provide continued support to teachers and students in Group A. Because of the nature of the data
collected to measure effects of the project, we only collect data from students in Grades 3–5
from the two groups.
Component 2. ARTS FIRST Essential Arts Toolkit for the K-5 Classroom Teacher:
Hawai‘i Fine Arts Grade Level Guide, Supplement to the Hawai‘i Department of Education’s
Arts Instructional Guide (HAA, 2003, 2007). The ARTS FIRST Essential Arts Toolkit is a
grade-level guide designed for use by elementary classroom teachers. The first edition of the
Toolkit (2003) was developed and piloted during the first round of AEMDD funding in a
three-year research project titled the ARTS FIRST Windward Research Project (AFWRP)
(Brandon, Lawton, & Krohn-Ching, 2004, 2005, 2007). The second edition of the Toolkit (2007)
reflects the learning gained during the research project and incorporates the 2005 revision of the
Hawai`i Content and Performance Standards III. HAA developed the Toolkit in collaboration

3
with the ARTS FIRST partners, as mandated by Act 306 of the 2001 legislature. The partners
include the HDOE, the University of Hawai‘i at Mānoa College of Education, the University of
Hawai‘i at Mānoa College of Arts and Humanities, the Hawai‘i State Foundation on Culture and
the Arts, and the Hawai‘i Association of Independent Schools.
The Toolkit provides a framework to connect arts strategies for the visual arts, music, dance,
and drama with the HDOE’s standards for other academic subjects such as reading and mathe-
matics in Grades K–5. It is the intent of the Toolkit to enrich teachers’ knowledge in the arts by
focusing on the most essential arts content and to assist them in linking essential arts learning to
other classroom instruction. In the ALA project, the Toolkit is provided to every teacher. It
encourages them to think about the arts using four sets of organizational concepts: (a) three big
ideas— how the arts are organized, how the arts communicate, and how the arts shape and
reflect culture; (b) three artistic processes—create, perform, and respond; (c) three levels of
questions—describe, interpret, and evaluate; and (d) three thinking tools—observing, pattern-
ing, and representing (Root-Bernstein & Root-Bernstein, 1999). A full copy of the Toolkit can
be found at http://hawaiiartsalliance.org/teaching_arts/arts_toolkit/arts_toolkit.html.
Component 3. Teacher Professional Development. The core of ALA is the in-depth
professional development (PD) provided to the participating teachers. The PD is designed to give
teachers the opportunity to fully comprehend the elements and principles of drama and dance
and to use strategies in these two art forms to teach core academic subject material. ALA’s PD
consists of an intensive summer institute and three additional PD days during the school year.
For Year 2 of the project, the summer institute was held June 12–15, 2007 and three additional
PD days were held October 13, 2007, December 1, 2007, and December 4, 2007. During the
summer institutes, teachers become familiar with the basic elements of drama and dance and
become immersed in the art making process. The summer institute is designed to allow teachers
to collaboratively bond as a learning community with other participating teachers and the expert
art educators. Teachers are introduced to arts strategies that are designed to engage students in
the active learning process. The additional PD workshops are designed to be particpatory
experiences for the teachers and art educators and consist of warm-ups, whole– and small–group
activities, group discussions and reflections, sharing by teachers about their experience with
implementation of the art strategies, sharing of the lessons that the teachers are using in their

4
classrooms, and planning time between the teachers and art educators about how to continue the
arts integration process.
Component 4. In-Class Artist Mentoring. A key component of the ALA project is the series
of in-class mentor sessions by expert art educators over the course of the school year. Each
teacher is paired with an expert art educator—(mentor)— who are the same individuals that
helped conduct the training in the summer institute and additional PD workshops. Over the
course of the mentoring process, the mentors are responsible for (a) modeling the art strategies
for the teacher in the classroom with the teacher’s students, (b) co-teaching with the teacher to
build teacher confidence, and (c) observing and providing feedback to the teacher implementing
the art strategies. The mentors work closely with the classroom teachers to prepare arts-inte-
grated instruction as well as discuss how to manage the classroom during the arts-integration
process.
ALA Teacher Knowledge and Skill Development
The summer institute, PD workshops, and in-class mentoring components of the ALA project
are intended to impart specific knowledge and skill sets to the teachers about the arts integration
process. As part of the ALA project, teachers are expected to learn and be able to teach the
elements and vocabulary of drama and dance (i.e., body, shape, energy, etc.) and how to apply
this knowledge using specific art strategies. The strategies are the core of the arts integration
process. In Table I-1, we present and provide a brief definition for each of the strategies that the
teachers were taught in the first year of implementation. The first three art strategies listed in the
table (Domino, Echo, and Mirror) are designed more for classroom management and student
energizer and focusing techniques, and the last three strategies in the table (Snapshot, Tableau,
and Expressive Dance) are designed to engage students further in the active learning process of
the subject matter (e.g., vocabulary learning, understanding character traits of a story, and so
forth).
It is through the development of the teachers’ knowledge and skill development about how to
use the arts to teach core subject matter that the project hopes to show positive effects on the
intended project outcomes, particular reading comprehension. The PD and artist mentoring
components of ALA are designed to engage teachers in active teaching, through the use of the
art strategies, which in turn engage students in the active learning process. Active learning has

5
been defined as “instructional activities involving students in doing things and thinking about
what they are doing” (Bonwell and Eison, 1991, p. 2). Chickering and Gamson (1987) suggest
that students “must talk about what they are learning, write about it, relate it to past experiences,
and apply it to their daily lives. They must make what they learn part of themselves” (p. 2).
The theory of the active learning process is closely tied to the constructivist approach to
learning. It is though the use of the arts strategies, which are encompassed by the three thinking
tools of observing, patterning, and representing (Root-Bernstein & Root-Bernstein, 1999), that
students, through inquiry and reflection, become active learners. The process encourages
students to (a) examine details closely to gain a deeper understanding of the subject material
(observing), (b) discover patterns of elements of different subject material (patterning), and (c)
use this information to express ideas bodily (representing). For example, by having students act
out or dance out a story that they read in class, they are able to experience the characters’ traits
and ultimately gain greater comprehension of what they are reading.
Lowman (1984: as cited in Bonwell and Eison, 1991) suggests that teachers wanting to
create an active learning environment must “create a supportive intellectual and emotional
Table I-1Overview of the ALA Arts Strategies
Strategy Definition
DominoPassing a shape, movement, and/or sound, around a circle, oneperson at a time
EchoThe leader does a shape, movement, and/or sound. The follower(s)repeat the shape, movement, and/or sound.
MirrorAs the leader moves, the follower(s) mirror the movementsimultaneously.
Snapshot A frozen image created individually
Tableau A frozen image created by two or more people.
Expressive DanceUsing elements of dance (body energy, space, and time) tocommunicate or represent an idea.
6
environment that encourages students to take risks” (p. 3). For the type of active learning that the
ALA project is trying to impart to the teachers—that is, engaging students in inquiry and
reflection through the use of arts strategies—there should be a sense of community in the
classroom. It is ALA’s goal that teachers gain an understanding of the different learning styles of
their students and, through modeling and engagement in the art strategies, create an environment
in which the students feel comfortable about using the arts strategies and become more actively
engage in their own learning.
Evaluation Background
The ALA research project is the second arts education project funded under the AEMDD
grant program and implemented in Hawai‘i public schools by the HAA and evaluated by CRDG.
The first project, called the ARTS FIRST Windward Research Project (AFWRP) (Brandon,
Lawton, & Krohn-Ching, 2004, 2005, 2007), provided services to three randomly-assigned
public elementary schools in the Windward School District on the island of O‘ahu, with three
randomly-assigned public elementary schools in the same district serving as a control group.
In our evaluation of the AFWRP, we concluded that the arts strategies used in the project had
a small effect on student outcomes. These results were tentative, however, because of the low
level of use of the arts strategies by the teachers, as well the potential influence on student
achievement of competing academic programs. Overall, we found that the project was well
received by teachers and students and that the low level of arts strategy use was primarily due to
the teachers’ perception of not having enough time. In addition, teachers indicated that there
were too many strategies to learn, that they would liked to have focused on more than one art
form, and that, overall, the strategies might not have been sufficient to affect outcomes.
However, the teachers also indicated that participation in the project enhanced their teaching
ability, their confidence with using the arts, and their attitudes about the arts; furthermore, they
believed that project activities created a sense of classroom community and increased student
confidence and attitudes.
We recommended several steps to improve similar future projects: (a) identify the most
effective strategies that the teachers are most likely to implement and focus on them without
significant revision, (b) ensure that implementation levels of the arts activities are increased, and
(c) instruct the teachers how to recognize problems in using the activities. In addition, we

7
recognized several challenges in evaluating the project, including (a) those having to do with
collecting data on young students, particularly measuring student affect (e.g., attitudes toward
school) and (b) those addressing the AEMDD program’s requirements for rigorous evaluation
design. A full account of these evaluation challenges will be presented in a monograph currently
under development by the ED’s AEMDD program (Brandon, Lawton, & Krohn-Ching, in-press).

8
CHAPTER IIMETHODS AND RESULTS
Evaluation Design
The evaluation study described in this report used a quasi-experimental, pre/post matched-
group “switching replications” design (Shadish, Cook, & Campbell, 2002) in four volunteer
schools on the island of O%ahu. It involves two non-equivalent groups, with two schools in each
group, each receiving treatment in alternating sequences such that (a) when the first group
receives the treatment, the other serves as a control, and (b) when the control group later receives
treatment, the original treatment group serves as a continued-treatment control. In Figure II-1,
we present the diagram of this switching replications design. The design addresses one of the
major problems in experimental or quasi-experimental designs—the need to deny treatment to
some participants through random assignment. It assures that everyone will eventually get access
to the project training.
Year 1 of the project period (School Year [SY] 2006–2007) was for project planning and
instrument development purposes and no services were provided to the schools. In Year 2 (SY
2007–2008), the focus of this report, Group A was compared with Group B, when Group A had
received one year of training (shown by the symbol X+ in Figure II-1) and Group B had received
no treatment (X). This is labeled Comparison I (CI), a project-control comparison, in Figure II-1.
The groups will be compared again in Year 3 (SY 2008–2009), when Group A is in the second
year of training (X++) and Group B has completed the first year of training (X+). In Figure II-1,
this is labeled Comparison II (CII), a full-treatment/partial-treatment comparison. The groups will
be compared a third time at the end of Project Year 4 (SY 2009–2010), when Group A is in a
sustainability period (Xs) and Group B has received the second year of training (X++). In Figure
II-1, this is labeled Comparison III (CIII), a project-sustainability comparison.
The four schools were matched in pairs as closely as possible on school size, socio-economic
status (SES, as measured by free/reduced-price lunch status), mean reading achievement
(measured by the Hawai‘i State Assessment), and ethnicity. (For ethnicity, we focused on the
percentage of students who were grouped into the four largest ethnic categories in Hawai‘i.
Children of Hawaiian/part-Hawaiian and Filipino ancestries tend to score similarly low on test
scores, and children of Caucasian and Japanese ancestries tend to score similarly high. All other

9
students were grouped as Other.) The two matched pairs were then randomly assigned to either
Group A or Group B. Identifying matched schools in this manner ensures that the influence of
school contexts on project outcomes is similar between groups, and it increases statistical power.
Random assignment within the pairs will ensure that treatment order is not affected by the
school’s desire to participate in one or the other of the two groups—a desire that might result in
selection bias.
The project team’s considerable experience in its previous AEMDD evaluation has shown
that teachers need training in several institutes and extensive mentoring in the classroom if they
are to become familiar with the arts strategies. Furthermore the form and duration of the
professional development are necessary in order for teachers’ fluency in their use of the arts
strategies is at a sufficient level to affect student academic achievement (Guskey, 2000). Given
these requirements, serving more than four schools would be prohibitively expensive.
Participating Schools
ALA project staff undertook extensive efforts to recruit schools that were interested in
participating in the study. In Table II-1, we show the participating schools, by group membership
and the respective demographic characteristics. In addition to selecting Title I schools, as
required by grant guidelines, the project sought to identify schools who met three criteria: (a)
they had met NCLB Annual Yearly Progress (AYP) requirements, (b) they needed to improve
student scores further, and (c) they did not have rigid prescriptive reading programs. The reasons
for these criteria, respectively, are that (a) AYP schools are more likely than non-AYP schools
School Year
2007–2008 2008–2009 2009–2010
Group A X+CI
X++CII
XsCIII
Group B X X+ X++
Figure II-1. The project’s switching replications research design. School Year (SY) 2007–2008 is theproject-control group comparison (CI), where the Group A receives the treatment (X+) and the Group Breceives no treatment (X). SY 2008–2009 is the full-treatment/partial-treatment comparison (CII), whereGroup A receives a second year of treatment (X++) and Group B receives the first year of treatment (X+).SY 2009–2010 is a project-sustainability comparison (CIII), where Group A is in a sustainability period(Xs) and Group B receives their second year of treatment (X++).

Table II-1Demographic Characteristics of Participating ALA Schools for School Year 2007–2008a
Group School Grade
Ethnicityb SESc Gender
Hawaiian/part-Hawaiian
Filipino Japanese Caucasian Other Low High Male Female
A
1A(N = 230)
3 11.36% 45.45% 0.00% 13.64% 29.55% 52.27% 47.73% 51.14% 48.86%
4 7.35% 54.41% 0.00% 14.71% 23.53% 58.82% 41.18% 51.47% 48.53%
5 12.16% 48.65% 0.00% 20.27% 18.92% 60.81% 39.19% 51.35% 48.65%
Total 10.43% 49.13% 0.00% 16.09% 24.35% 56.96% 43.04% 51.30% 48.70%
2A(N = 154)
3 8.62% 22.41% 22.41% 3.45% 15.52% 15.52% 56.90% 72.41% 27.59%
4 15.22% 23.91% 21.74% 4.35% 34.78% 21.74% 78.26% 56.52% 43.48%
5 20.00% 28.00% 8.00% 4.00% 40.00% 30.00% 70.00% 44.00% 56.00%
Total 14.29% 24.68% 17.53% 3.90% 29.22% 22.08% 67.53% 58.44% 41.56%
A Total 11.98% 39.32% 7.03% 11.20% 26.30% 42.97% 52.86% 54.17% 45.83%
B
1B(N = 169)
3 28.07% 3.51% 12.28% 12.28% 43.86% 24.56% 75.44% 52.63% 47.37%
4 20.31% 1.56% 15.63% 9.38% 51.56% 15.63% 84.38% 50.00% 50.00%
5 8.33% 4.17% 14.58% 18.75% 54.17% 12.50% 87.50% 43.75% 56.25%
Total 19.53% 2.96% 14.20% 13.02% 49.70% 17.75% 82.25% 49.11% 50.89%
2B(N = 149)
3 10.71% 0.00% 5.36% 7.14% 76.79% 64.29% 35.71% 57.14% 42.86%
4 20.41% 2.04% 8.16% 4.08% 65.31% 67.35% 32.65% 48.98% 51.02%
5 13.64% 0.00% 4.55% 4.55% 77.27% 65.91% 34.09% 59.09% 40.91%
Total 14.77% 0.67% 6.04% 5.37% 73.15% 65.77% 34.23% 55.03% 44.97%
B Total 17.30% 1.89% 10.38% 9.43% 60.69% 40.25% 59.75% 51.89% 48.11%
a Student information is for students who completed the Hawai‘i State Assessment (HSA) in the Spring of 2008.b Ethnicity grouping is based on the groups that show the greatest variability on the HSA.c SES is based on the number of students who receive free or reduced-price lunch (low SES) and the students who do not (high SES).
11
to allow research to be conducted and implemented fully in their classrooms, (b) schools that
need further improvement are likely to be looking for ways to enhance teacher practices and
improve student achievement, and (c) schools with prescriptive reading programs (e.g., Success
for All) are unlikely to allow teachers to deviate from a rigid sequence of activities and steps. To
ensure the schools’ confidentiality, the school names are not provided in this report.
Evaluation Topics Addressed
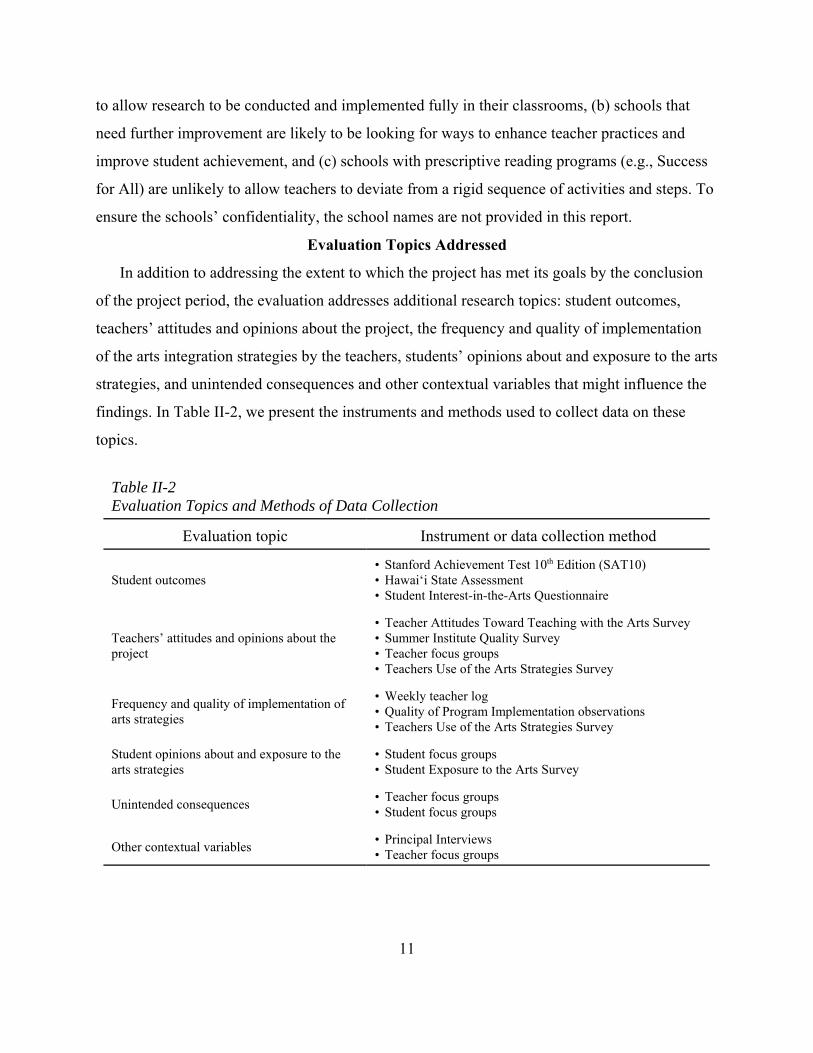
In addition to addressing the extent to which the project has met its goals by the conclusion
of the project period, the evaluation addresses additional research topics: student outcomes,
teachers’ attitudes and opinions about the project, the frequency and quality of implementation
of the arts integration strategies by the teachers, students’ opinions about and exposure to the arts
strategies, and unintended consequences and other contextual variables that might influence the
findings. In Table II-2, we present the instruments and methods used to collect data on these
topics.
Table II-2Evaluation Topics and Methods of Data Collection
Evaluation topic Instrument or data collection method
Student outcomes• Stanford Achievement Test 10th Edition (SAT10)• Hawai‘i State Assessment• Student Interest-in-the-Arts Questionnaire
Teachers’ attitudes and opinions about theproject
• Teacher Attitudes Toward Teaching with the Arts Survey• Summer Institute Quality Survey• Teacher focus groups• Teachers Use of the Arts Strategies Survey
Frequency and quality of implementation ofarts strategies
• Weekly teacher log• Quality of Program Implementation observations• Teachers Use of the Arts Strategies Survey
Student opinions about and exposure to thearts strategies
• Student focus groups• Student Exposure to the Arts Survey
Unintended consequences• Teacher focus groups• Student focus groups
Other contextual variables• Principal Interviews• Teacher focus groups

12
Instruments and Methods of Data Collection
The description of the data collection methods and instruments presented in this section is
organized by evaluation topics (see Table II-2).
Student Outcomes
The study of student outcomes examines the extent to which the Year 2 project group
students (Group A) showed greater gains in reading achievement and interest in the arts than the
Year 2 control group students (Group B), after controlling for preexisting differences between
groups. To control for preexisting differences between the non-equivalent groups, we chose to
calculate propensity scores for the students (e.g., Luellen, Shadish, & Clark, 2005). Shadish,
Cook, and Campbell (2002) suggest using a propensity score, which is “the predicted probability
of being in the treatment (versus control) group from a logistic regression equation” (p. 162), to
deal with the selection bias that can occur when using non-equivalent, quasi-experimental
research designs. The balancing in propensity score analysis happens by adjusting outcome
scores by “removing” the effects of specific preexisting differences from the outcome scores.
Our propensity scores were calculated by using students’ SES (free/reduced-price lunch status),
gender, ethnicity, and pretest scores. Rosenbaum and Rubin (1984) suggested using propensity
scores that use matching and stratification to adjust for the preexisting differences between
groups. “Stratification divides participants into strata so members of the treatment and control
groups have similar propensity scores within strata” (Luellen et al., p. 537). In Figure II-2, we
present the SAS software program used to create propensity scores and to produce the five
stratified groups for Grade 3 students.
For our analysis of the data we used an analysis of covariance (ANCOVA) for each of the
student outcomes, with the students’ propensity score strata as the covariate. ANCOVA tests
whether the project treatment has an effect on the outcome variable (e.g., posttest score) after
removing the variance for the preexisting differences (e.g., propensity score). ANCOVA is a
method of adjusting for the effects of characteristics of the student population over which
researchers have no control. There is some controversy among statisticians about using
ANCOVA to correct for initial group differences; as Elashoff (1969) said, “Covariate analysis
can indeed be useful where assignment to groups is not random but the results must be inter-
preted with caution” (p. 386). Given the limited control we had over the schools participating in

1We do not show standard deviations or standard errors of the mean for any of the ANCOVA results becausethe software does not show them when the LS option is used.
13
the study, we needed a way to adjust for initial group differences; however, we do not suggest
that the analysis entirely eliminates the differences due to non-equivalent groups.
Stanford Achievement Test 10th Edition (SAT10)
We administered the SAT10 in the Fall and Spring of SY 2007–2008 to all project and
control students in Grades 3–5. Data were collected only from the reading comprehension
section of the SAT10. Students in Grades 3 took the Primary 2 version of the SAT10 for their
pretest and the Primary 3 version for their posttest. Grade 4 students took the Primary 3 version
for their pretest and the Intermediate 1 version for their posttest. Grade 5 students took the
Intermediate 1 version for their pretest and the Intermediate 2 version for their posttest. Project
and control group scores were compared by using the ANCOVA procedure described earlier.
Grade 3. A total of 172 students (85 project group students and 87 control group students)
completed the pretest and posttest for the SAT10. The results of the ANCOVA, given in Table
II-3, show no statistically significant differences between groups, with propensity score as the
covariate. Least square means (LS means) were calculated for each group. LS means are group
mean scores adjusted for differences in group size.1 The control group (LS mean = 619.25)
slightly outperformed the project group (LS mean = 612.90) in Grade 3 SAT posttest reading
scores.
proc logistic des data=ala.sat_g3;class group ses gender ethnicity;model group = ses gender ethnicity gr3_SAT_pre_ss;output out=ala.sat_propensity_gr3 pred=propscore;title 'grade3 propscore';run;proc rank data=ala.sat_propensity_gr3 groups=5 /*five strata*/ out=ala.sat_propensity_gr3_ranks;ranks rnks;var propscore;data ala.sat_propensity_gr3_strata;set ala.sat_propensity_gr3_ranks;strata=rnks+1;run;
Figure II-2. SAS program used to calculate propensity score for use as a covariate.

14
Grade 4. A total of 148 students (97 project group students and 51 control group students)
completed the pretest and posttest for the SAT10. The results of the ANCOVA, with propensity
score as the covariate, show a statistically significant difference between groups in favor of the
control group. The results of the ANCOVA are presented in Table II-4. The control group LS
mean is 632.90 and project group LS mean is 616.88.
Grade 5. A total of 150 students (92 project group students and 58 control group students)
completed the pretest and posttest for the SAT10. The results of the ANCOVA with propensity
score as the covariate, show no statistically significant difference between groups. The results of
the ANCOVA are presented in Table II-5. The control group (LS mean = 640.34) slightly
outperformed the project group (LS mean = 635.15) in Grade 5 SAT posttest reading scores.
Table II-3Grade 3 SAT10 ANCOVA Results, with Propensity Score Strata as the Covariate
Source df Type III SS F value Pr > F
Group 1 1127.07 .73 .39
Strata 4 12403.11 2.02 .09
Table II-4Grade 4 SAT10 ANCOVA Results, with Propensity Score Strata as the Covariate
Source df Type III SS F value Pr > F
Group 1 6189.35 4.02 .05
Strata 4 5130.29 .83 .51
Table II-5Grade 5 SAT10 ANCOVA Results, with Propensity Score Strata as the Covariate
Source df Type III SS F value Pr > F
Group 1 696.29 .72 .40
Strata 4 25962.34 6.75 <.01

15
Hawai#i State Assessment (HSA)
The HSA is administered statewide by the HDOE in the spring of each school year. The
purpose of the assessment is to measure students’ achievement in reading, writing, and mathe-
matics. For the purpose of this evaluation only reading scores were examined. An ANCOVA
was used to compare groups on the HSA for Grades 3, 4, and 5. Because HSA is administered
only one time a year, however, our propensity scores did not include student pretest scores for
this particular measure.
The primary reason for including the HSA in our evaluation of student outcomes is the
importance that is placed on the schools to show improvements in students’ HSA test scores
under the No Child Left Behind Act. While we will present the results of our analysis of the
HSA in this report, the HSA will primarily be examined longitudinally at the conclusion the
project. Also, because of the limited information of the results provided for the HSA, we place
more emphasis on the SAT10 scores as a measure of the project’s effects on student reading
achievement.
Grade 3. A total of 243 students (130 project group students and 113 control group students)
completed the HSA in Spring 2008. The results of the ANCOVA, with propensity score as the
covariate, show no statistically significant differences between groups. The results of the
ANCOVA are presented in Table II-6. The project group (LS mean = 311.15) outperformed the
control group (LS mean = 310.25) in Grade 3 HSA reading scores.
Grade 4. A total of 226 students (114 project group students and 112 control group students)
completed the HSA in Spring 2008. The results of the ANCOVA, with propensity score as the
covariate, show no statistically significant difference between groups. The results of the
ANCOVA are presented in Table II-7. The project group (LS mean = 306.47) outperformed the
control group (LS mean = 300.36) in Grade 4 HSA reading scores.
Table II-6Grade 3 HSA ANCOVA Results, with Propensity Score Strata as the Covariate
Source df Type III SS F value Pr > F
Group 1 23.53 .02 .88
Strata 4 7262.94 1.85 .12
16
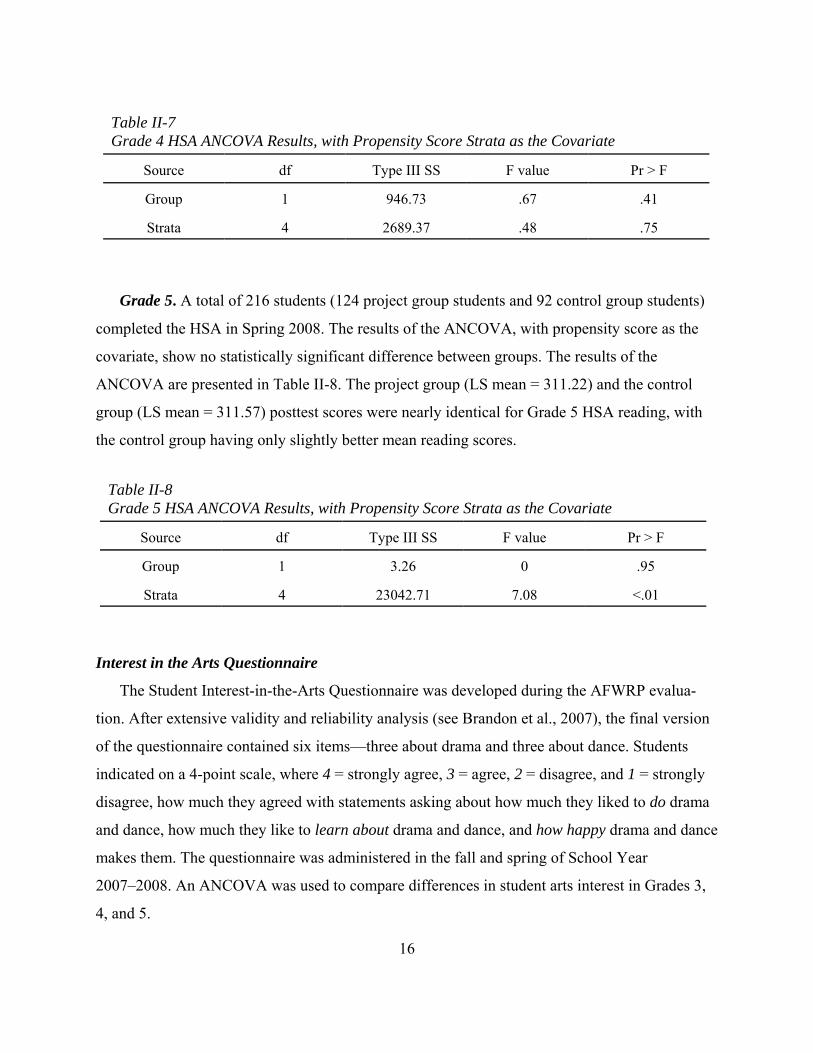
Grade 5. A total of 216 students (124 project group students and 92 control group students)
completed the HSA in Spring 2008. The results of the ANCOVA, with propensity score as the
covariate, show no statistically significant difference between groups. The results of the
ANCOVA are presented in Table II-8. The project group (LS mean = 311.22) and the control
group (LS mean = 311.57) posttest scores were nearly identical for Grade 5 HSA reading, with
the control group having only slightly better mean reading scores.
Interest in the Arts Questionnaire
The Student Interest-in-the-Arts Questionnaire was developed during the AFWRP evalua-
tion. After extensive validity and reliability analysis (see Brandon et al., 2007), the final version
of the questionnaire contained six items—three about drama and three about dance. Students
indicated on a 4-point scale, where 4 = strongly agree, 3 = agree, 2 = disagree, and 1 = strongly
disagree, how much they agreed with statements asking about how much they liked to do drama
and dance, how much they like to learn about drama and dance, and how happy drama and dance
makes them. The questionnaire was administered in the fall and spring of School Year
2007–2008. An ANCOVA was used to compare differences in student arts interest in Grades 3,
4, and 5.
Table II-7Grade 4 HSA ANCOVA Results, with Propensity Score Strata as the Covariate
Source df Type III SS F value Pr > F
Group 1 946.73 .67 .41
Strata 4 2689.37 .48 .75
Table II-8Grade 5 HSA ANCOVA Results, with Propensity Score Strata as the Covariate
Source df Type III SS F value Pr > F
Group 1 3.26 0 .95
Strata 4 23042.71 7.08 <.01
17
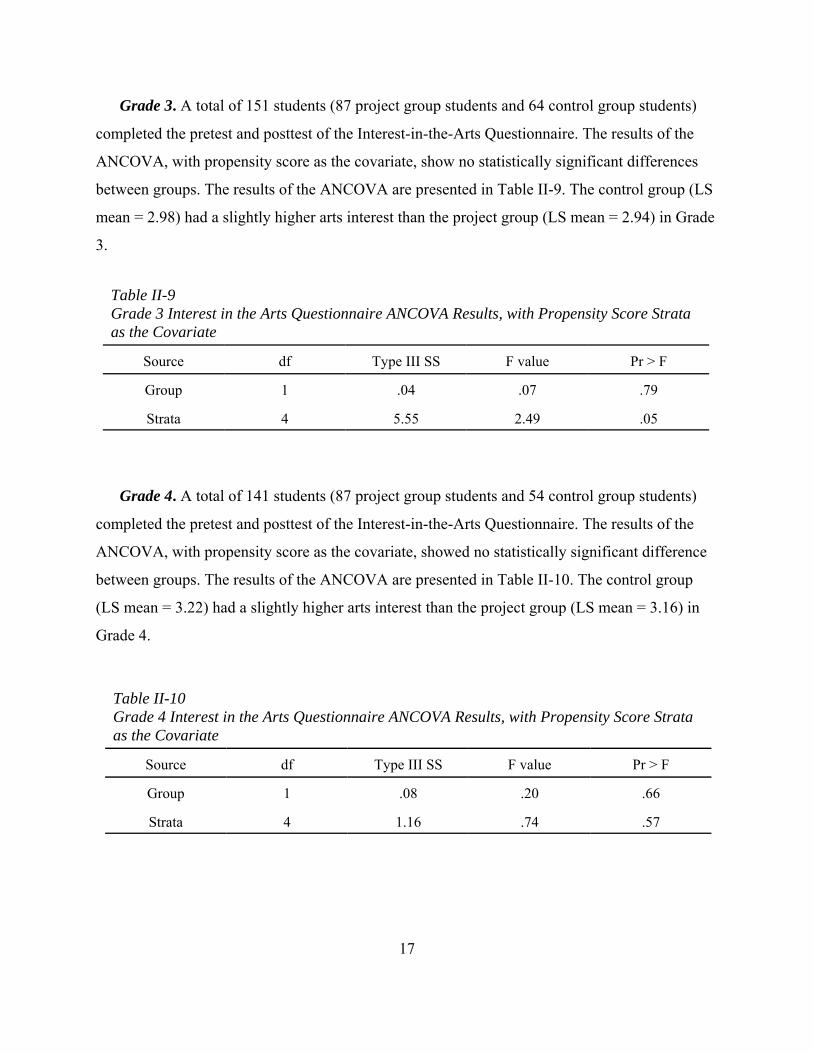
Grade 3. A total of 151 students (87 project group students and 64 control group students)
completed the pretest and posttest of the Interest-in-the-Arts Questionnaire. The results of the
ANCOVA, with propensity score as the covariate, show no statistically significant differences
between groups. The results of the ANCOVA are presented in Table II-9. The control group (LS
mean = 2.98) had a slightly higher arts interest than the project group (LS mean = 2.94) in Grade
3.
Grade 4. A total of 141 students (87 project group students and 54 control group students)
completed the pretest and posttest of the Interest-in-the-Arts Questionnaire. The results of the
ANCOVA, with propensity score as the covariate, showed no statistically significant difference
between groups. The results of the ANCOVA are presented in Table II-10. The control group
(LS mean = 3.22) had a slightly higher arts interest than the project group (LS mean = 3.16) in
Grade 4.
Table II-9Grade 3 Interest in the Arts Questionnaire ANCOVA Results, with Propensity Score Strataas the Covariate
Source df Type III SS F value Pr > F
Group 1 .04 .07 .79
Strata 4 5.55 2.49 .05
Table II-10Grade 4 Interest in the Arts Questionnaire ANCOVA Results, with Propensity Score Strataas the Covariate
Source df Type III SS F value Pr > F
Group 1 .08 .20 .66
Strata 4 1.16 .74 .57

18
Grade 5. A total of 150 students (90 project group students and 60 control group students)
completed the pretest and posttest of the Interest-in-the-Arts Questionnaire. The results of the
ANCOVA, with propensity score as the covariate, show no statistically significant difference
between groups. The results of the ANCOVA are presented in Table II-11. The project group
(LS mean = 2.91) had a slightly higher arts interest than the control group (LS mean = 2.74) in
Grade 5.
Teachers’ Attitudes and Opinions about the Project
Teacher Attitude Toward Teaching with the Arts Survey
We assessed the project and control group teachers’ attitudes toward using the arts with a
slightly modified version of the Teaching with the Arts Survey (Oreck, 2001; 2004). Validity
and reliability analyses were conducted for this instrument during the AFWRP evaluation
(Brandon et al., 2007). The teacher attitude questionnaire was administered in the fall and spring
of School Year 2007–2008. An analysis of covariance (ANCOVA), with pretest scores as the
covariate, was conducted to determine if there was any statistically significant difference
between project and control group teachers. The 13-item questionnaire had teachers indicate on a
6-point scale, where 6 = strongly agree and 1 = strongly disagree, how much they agreed with
the items. The survey items were about the importance of using the arts to teach, self-efficacy
and self-image about using the arts, support for using the arts, and constraints when using the
arts.
A total of 20 teachers (13 project group teachers and 7 control group teachers) completed the
pretest and posttest Attitude Toward Teaching with the Arts Survey. Results from the ANCOVA,
using pretest as the covariate, show no statistically significant difference between groups. The
project group teachers had slightly higher means (LS mean = 4.04) than the control group
teachers (LS mean = 3.93) . In Table II-12, we present the ANCOVA results.
Table II-11Grade 5 Interest in the Arts Questionnaire ANCOVA Results, with Propensity Score Strataas the Covariate
Source df Type III SS F value Pr > F
Group 1 .71 1.26 .26
Strata 4 3.23 1.44 .22
19
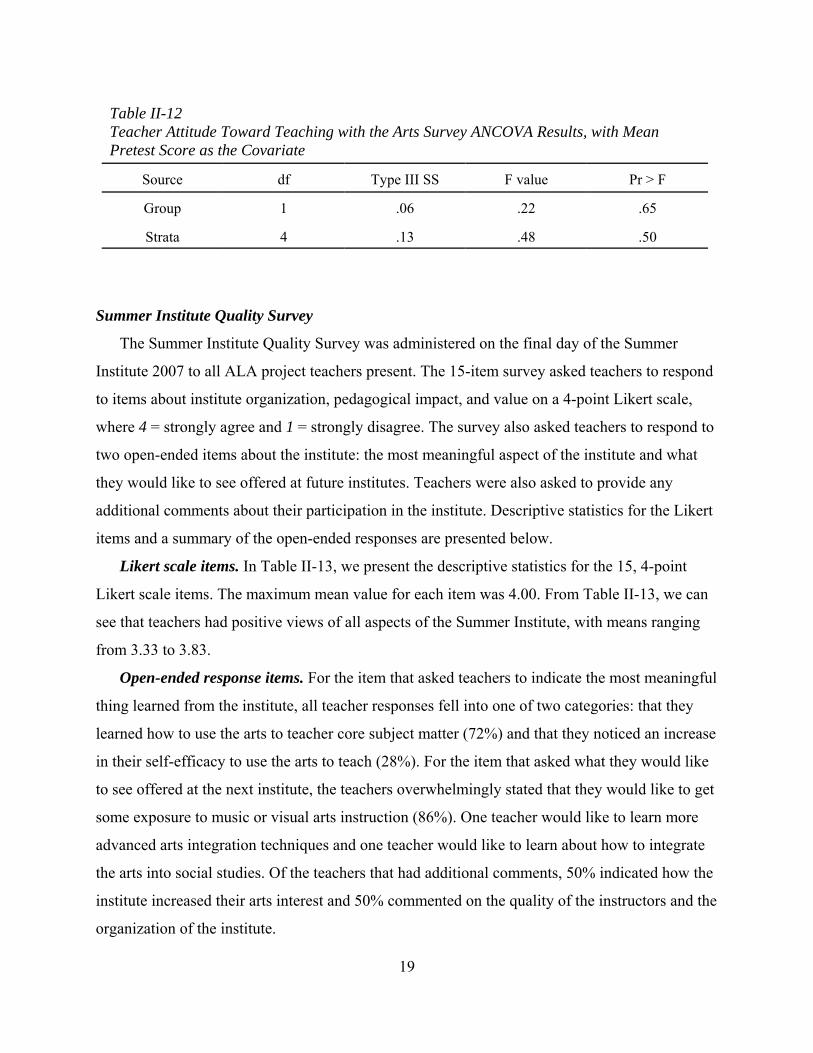
Summer Institute Quality Survey
The Summer Institute Quality Survey was administered on the final day of the Summer
Institute 2007 to all ALA project teachers present. The 15-item survey asked teachers to respond
to items about institute organization, pedagogical impact, and value on a 4-point Likert scale,
where 4 = strongly agree and 1 = strongly disagree. The survey also asked teachers to respond to
two open-ended items about the institute: the most meaningful aspect of the institute and what
they would like to see offered at future institutes. Teachers were also asked to provide any
additional comments about their participation in the institute. Descriptive statistics for the Likert
items and a summary of the open-ended responses are presented below.
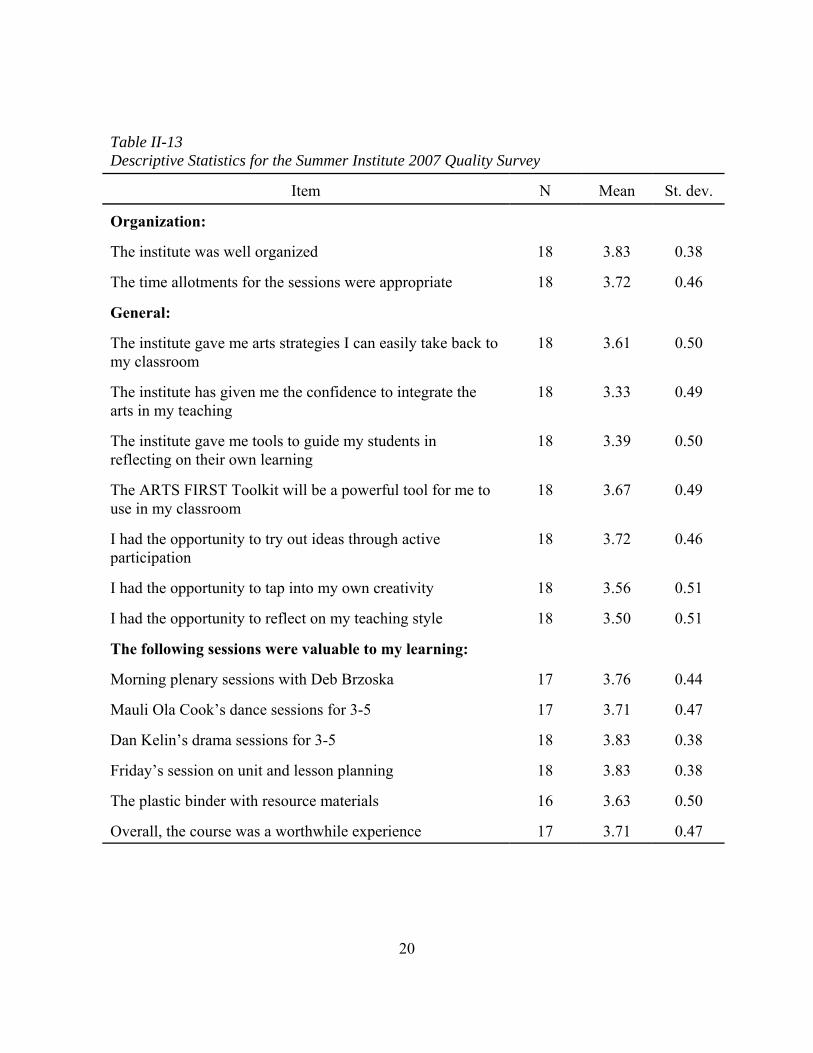
Likert scale items. In Table II-13, we present the descriptive statistics for the 15, 4-point
Likert scale items. The maximum mean value for each item was 4.00. From Table II-13, we can
see that teachers had positive views of all aspects of the Summer Institute, with means ranging
from 3.33 to 3.83.
Open-ended response items. For the item that asked teachers to indicate the most meaningful
thing learned from the institute, all teacher responses fell into one of two categories: that they
learned how to use the arts to teacher core subject matter (72%) and that they noticed an increase
in their self-efficacy to use the arts to teach (28%). For the item that asked what they would like
to see offered at the next institute, the teachers overwhelmingly stated that they would like to get
some exposure to music or visual arts instruction (86%). One teacher would like to learn more
advanced arts integration techniques and one teacher would like to learn about how to integrate
the arts into social studies. Of the teachers that had additional comments, 50% indicated how the
institute increased their arts interest and 50% commented on the quality of the instructors and the
organization of the institute.
Table II-12Teacher Attitude Toward Teaching with the Arts Survey ANCOVA Results, with MeanPretest Score as the Covariate
Source df Type III SS F value Pr > F
Group 1 .06 .22 .65
Strata 4 .13 .48 .50
20
Table II-13Descriptive Statistics for the Summer Institute 2007 Quality Survey
Item N Mean St. dev.
Organization:
The institute was well organized 18 3.83 0.38
The time allotments for the sessions were appropriate 18 3.72 0.46
General:
The institute gave me arts strategies I can easily take back tomy classroom
18 3.61 0.50
The institute has given me the confidence to integrate thearts in my teaching
18 3.33 0.49
The institute gave me tools to guide my students inreflecting on their own learning
18 3.39 0.50
The ARTS FIRST Toolkit will be a powerful tool for me touse in my classroom
18 3.67 0.49
I had the opportunity to try out ideas through activeparticipation
18 3.72 0.46
I had the opportunity to tap into my own creativity 18 3.56 0.51
I had the opportunity to reflect on my teaching style 18 3.50 0.51
The following sessions were valuable to my learning:
Morning plenary sessions with Deb Brzoska 17 3.76 0.44
Mauli Ola Cook’s dance sessions for 3-5 17 3.71 0.47
Dan Kelin’s drama sessions for 3-5 18 3.83 0.38
Friday’s session on unit and lesson planning 18 3.83 0.38
The plastic binder with resource materials 16 3.63 0.50
Overall, the course was a worthwhile experience 17 3.71 0.47

21
Teacher Focus Groups
Project teachers participated in grade-level focus groups at the end of the Fall semester in SY
2007–2008. The purpose of the focus groups was to provide the project with both formative and
summative evaluation information. Teachers were asked to provide their opinions and attitudes
about (a) the professional development activities (full-day professional development workshops
and in-class mentoring sessions), (b) factors that affected their use of the strategies, and (c) the
challenges and benefits of using the arts strategies. The teachers were also asked to indicate any
unintended consequences as a result of the project activities and other contextual variables that
might affect project outcomes. The focus groups were audio-recorded and transcribed for content
analysis. A summary of the major themes isolated from the teachers’ responses about their
attitudes and opinions about project activities are presented below.
Opinions about the professional development activities. In response to the question about
the effectiveness of the professional development (PD) activities, teachers had an overall
positive view. They indicated that the progression between the summer institute, full-day
workshops, and in-class mentoring helped to reinforce and remind them of what they learned
previously and that the inter-school discussions helped generate ideas about how to effectively
use the arts strategies. The teachers overwhelmingly indicated that the in-class mentoring was
the most useful component of the project because it allowed them to work on fine-tuning their
use of the arts strategies and reminded them about the arts strategy process that was learned in
the full-day workshops and summer institute. For example, three teachers said,
The small things, tiny details, that make the tableau or snapshot that much better, are kindalost [in the workshops and institute]. So the small interaction, when the mentor comes in tovisit, is so much nicer because she brings up tiny little things.
It’s easier, not so much what they do, but it’s easier to see them do a lesson. Like when thementor comes in and to have them do something to see how it’s done and then try to do it. Idon’t think without the mentor coming in, I don’t think I would fully realize what we learnedand even how to do it correctly because there is such a time lapse. I think it’s really helpful.They are great models. I feel comfortable starting off with just doing it in the first place.Doing the snapshots, doing the cueuing, the management, but then now it’s taking it to thenext level. You know like asking questions to challenge the kids, to revise, to whatever.They’re excellent.
22
I think that’s the critical part of this whole process because I remember when they came intomy classroom for the first time and she was helping me with the tableau and just like thelittle things, just the management of it, it’s so simple but yet you don’t think of it when youare just new to it and you don’t have all of the tools under your belt. So just like remindingme about having them in neutral. They really stick to the criteria so that’s been really helpful.They’re very non threatening and accommodating. For us, our mentor has been really good.
The teachers also indicated that they would like to have additional lesson planning time with the
mentors.
Factors that affect the use of the arts strategies. The primary teacher response to the
question about the factors that affected the use of the arts strategies was the time involved with
using the strategies, particularly the time to prepare the lessons. This included designing a lesson
that was appropriate for arts integration and arranging the classroom so the students could do the
arts strategies. Teachers also indicated that curriculum constraints and class size influenced
which strategies were used and when.
Effects of using the arts strategies. For the question about the effects of using the strategies,
the responses were about the effects on the students as well as the effects on the teachers.
Teachers indicated that the strategies did enhance student learning; for example, one teacher said
I think it helps the kids a lot. Normally you get double vocabulary words and then there aredifferent strategies, look at the definition. You kind of just say what words are around andyou use the context clues. But by having them actually role play it and act it out, somehow itindents in their mind, so I’m noticing that they are using words that we’ve done snapshotswith a lot more in their writing or even when they are talking than they normally would have.
Teachers also indicated that the strategies helped with addressing different types of learning
styles
I think too with the physical, the kinesthetic learners, they kind of attach their vocabularywords to their motions so it helps them remember the vocabulary. It’s just a lot of vocabularywords.
I think for me, my social studies class, I have a SPED student who has a great time with it forvocabulary words because he can’t read.. Then I ask him what the vocabulary word is, if hethinks back to a snapshot, he always the first one who says, “I know what it means because Idid this for my snapshot.” And for him it works because you need that kinesthetics, you haveto have that. If not, he won’t remember it. But when he does it himself, he says, “I rememberI did this, and it meant that.” For him it really works.

23
Teachers also pointed out that the strategies were a powerful way to enhance classroom
community.
I noticed as we keep doing the tableaux, they are working better when they are working on atableau as opposed to working on a group project. So they can’t work together on groupprojects because they just don’t know what it is but with tableaux they communicate easieras far as, “Okay, yea I’ll do it, that’s good!” They’ll compliment each other more on goodideas and “Let’s try this.” “Let’s try it my way, then your way, and then we’ll see which onefeels better.” So they seem to do better in that sense. So community as far as them workingtogether as a group is a lot better than it was in the beginning of the year. On the written reflection, one of the students in my class put, “Thank you for teaching ussnapshot and tableaux. Now we can spend a lot of time getting to know my classmates andmy teachers. We have so much fun.” I guess they see it as active learning.
Some of the responses about the effects of the project on the teachers suggested how it positively
affected them. For example, one teacher’s response showed how it helped increase her willing-
ness to take risks in her teaching.
I guess for myself, I never was a drama person and I’m still not that comfortable with it. Andthis project showed me that for myself as a teacher if I put myself out there and I just showthe kids that I’m willing to try and do it then my kids who are really shy will do it. I thinkthat when they just learn and when they realize how silly I am being and I might not be thebest at it and you can at least try. That’s probably the biggest thing that I learned through thisproject. Not only in this class but you should always kinda put yourself out of your comfortzone and put yourself out there so the kids can see and you’re kinda transparent in that senseso it’s helping them be more confident.
Another teacher indicated that it was through the teacher community of using the strategies that
helped her reflect on her own teaching of the strategies.
I have to say it was initially uncomfortable but when you hear the other teachers say they areso excited about it and they tell you what they do and how they applied it how it enhancedthe kid’s learning that helped me. The sessions we had in the beginning, we actually had todo it ourselves hands on. So that wasn’t good because for some of us its not the mostcomfortable thing. So for me it was resistance and feeling uncomfortable and that transferredinto my teaching. But when you talk to others and hear about what they are doing it helpedmotivate me. Because I can hear what they are doing, I can reflect more on me.. “I gotta dothis, I gotta do that.” You can stick together how they are doing their strategies because theteaching professionals, the teaching artists, they know what works. They have a total beliefand that has influenced me.
Teachers’ Use of the Arts Strategies Survey
The Teachers’ Use of the Arts Strategies Survey was administered at the end of the Spring

24
2008 semester. The survey had two parts: (a) one part in which the teachers indicated how often
and for how much time they used the arts strategies over the course of the school year, about
how confident they were with the accuracy of their estimates, and about how difficult it was to
estimate their use of the arts strategies; and (b) one part that included four 4-point Likert scale
items about the extent to which the strategies helped teachers improve their teaching, about how
much the use of the strategies helped students reading comprehension learning, and about the
overall perceived value and gratification of using and learning about the arts strategies. The
results of the second part of the survey, addressing the evaluation topic about teachers’ opinions
about the project and attitudes toward the project, is presented below.
In Table II-14, we present the descriptive statistics for the six items related to the teachers’
attitudes and opinions about the use of the arts. Items 3–8 used a 4-point Likert scale. Items 3
and 4 response anchors were 1 = very little, 2 = somewhat, 3 = quite a bit, and 4 = very much.
Item 5 response anchors were 1 = not very valuable, 2 = somewhat valuable, 3 = rather valuable,
and 4 = very valuable. Item 6 response anchors were 1 = not very gratified, 2 = somewhat
gratified, 3 = rather gratified, and 4 = very gratified. Item 7 responses anchors were 1 = very
easy, 2 = fairly easy, 3 = fairly difficult, and 4 = very difficult. Item 8 response anchors were 1 =
not very confident, 2 = somewhat confident, 3 = rather confident, and 4 = very confident.
Table II-14Descriptive Statistics for Items 3–8 on the Teacher Use of the Arts Survey
Item N Mean St. dev.
3. Overall, to what extent did the strategies help you teach studentsbetter?
14 2.64 0.63
4. Overall, to what extent did the strategies help student learning? 14 2.57 0.65
5. Overall, how valuable are the arts strategies for teaching? 13 2.92 0.76
6. Overall, to what extent are you gratified that you learned thestrategies?
13 3.08 0.76
7. How difficult or easy was it on this questionnaire to estimatehow often you used the strategies?
13 2.38 0.87
8. How confident are you in the accuracy of your estimates on thisquestionnaire of how often you used the strategies?
13 2.77 0.83
25
The results indicate that teachers thought that the project activities were somewhat to quite a
bit effective in helping them teach students better (mean = 2.64). Teachers also indicated that the
project activities were somewhat to quite a bit effective in helping students’ learning (mean =
2.57). Teachers indicated that the arts strategies were rather valuable for the purpose of teaching
(mean = 2.92). Teachers were also rather gratified with having learned the arts strategies (mean
= 3.08). Teachers indicated that it was fairly easy to indicate their estimated use of the strategies
on the survey (mean = 2.38) and between somewhat and rather confident about the accuracy of
their estimates about how much they indicated that they used the strategies on the survey.
Frequency and Quality of Implementation of Arts Strategies
Weekly Teacher Log
A weekly teacher log was administered over a 28-week period (Fall 2007 to Spring 2008) to
determine the extent to which teachers used the six ALA arts strategies on a regular basis.
Teachers were sent a link to the online log each Friday and were sent follow-up reminders the
following week. Teachers were asked to indicated how many times they used the arts strategies,
for how long they used the arts strategies, and for what purpose the arts strategies were used
(e.g., reading, social studies, etc.). A summary of the teachers frequency, duration, and purpose
of use of the arts strategies is presented below.
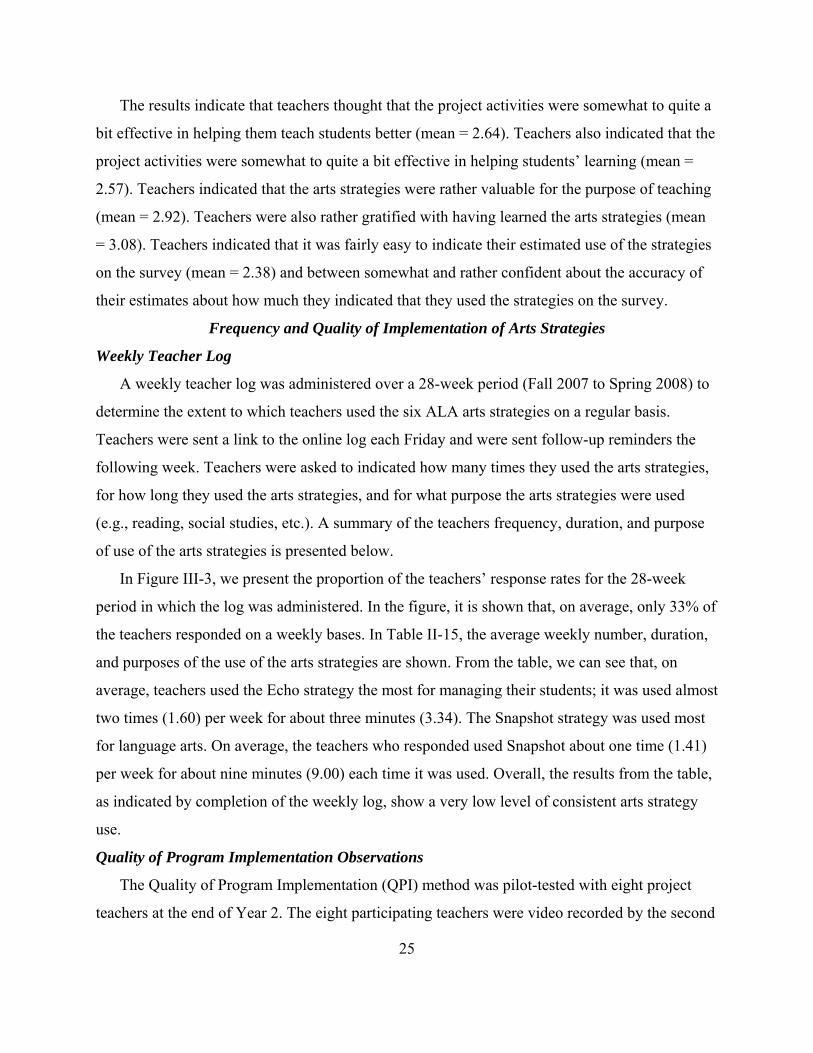
In Figure III-3, we present the proportion of the teachers’ response rates for the 28-week
period in which the log was administered. In the figure, it is shown that, on average, only 33% of
the teachers responded on a weekly bases. In Table II-15, the average weekly number, duration,
and purposes of the use of the arts strategies are shown. From the table, we can see that, on
average, teachers used the Echo strategy the most for managing their students; it was used almost
two times (1.60) per week for about three minutes (3.34). The Snapshot strategy was used most
for language arts. On average, the teachers who responded used Snapshot about one time (1.41)
per week for about nine minutes (9.00) each time it was used. Overall, the results from the table,
as indicated by completion of the weekly log, show a very low level of consistent arts strategy
use.
Quality of Program Implementation Observations
The Quality of Program Implementation (QPI) method was pilot-tested with eight project
teachers at the end of Year 2. The eight participating teachers were video recorded by the second

26
0
0.1
0.2
0.3
0.4
0.5
0.6
0.7
0.8
0.9
1
1 2 3 4 5 6 7 8 9 10 11 12 13 14 15 16 17 18 19 20 21 22 23 24 25 26 27 28
Week
Figure II-3. Proportion of teachers’ responses to the ALA weekly log over a 28-week period.
Table II-15Average Number, Duration, and Purpose for Responding Teachers’ Use of the ALA ArtsStrategies Over a 28-Week Period
Strategy
Purpose
ManagementLanguage
artsOther subject
areaFine arts Total average
No. Time No. Time No. Time No. Time No. Time
Domino .11 .38 .11 1.64 .11 1.46 . . .11 1.16
Echo 1.60 3.34 .28 1.05 .04 .16 1.17 3.25 .77 1.95
Mirror .13 .52 .12 .64 .02 .11 .44 .69 .18 .49
Snapshot .01 .04 1.41 9.00 .05 .87 . . .49 3.30
Tableau . . .38 5.83 .01 .36 . . .20 3.09
Expressive Dance .01 .03 .31 3.61 .04 .39 .32 1.46 .17 1.37
Total average 1.86 4.30 2.18 18.14 0.23 2.79 3.23 9.00 1.60 9.47

27
author of this report for documentation purposes and observed and rated on the six quality
criteria by one or two of the project developers and artist mentors as they implemented their
integrated lesson. The six quality criteria are presented in Table III-16. The development of the
QPI method began during the last year of the AFWRP (see Brandon et al., 2007) and was further
modified and refined during Year 2 of the ALA project.
The QPI method was designed to provide both formative and summative evaluation to the
teacher and project developers and contained three primary processes. First, two art experts
observed and rated the teachers on each of the six criteria using a 5-point rating scale, where 5 =
high quality and 1 = low quality. During this rating process the raters were required to rate the
teachers using the scale and provide notes about why a teacher was rated a certain way for each
of the criteria. Second, the raters met with the teacher after the lesson had been completed for a
teacher reflection-feedback session. During the teacher reflection session the teacher had the
opportunity to provide his or her interpretation about the integrated lesson by responding to
questions from the raters. These included how the lesson was received by the students, whether
goal of the lesson was achieved, challenges encountered while doing the lesson, and if anything
Table II-16Six Quality Criteria Used in the Assessment of Teachers Quality of ProgramImplementation
1. The teacher communicates to the students the connection between the strategy and the lesson objectives.
2. The teacher communicates to the students clear instructions of what they are expected to do. (Where andhow to begin and end in the strategy and what is required of them during each step, a review of the strategy,key components of the strategy.)
3. The teacher prompts students to explore creatively (e.g., “Consider another level,” “Use another part ofyour body;” “Do it slower and bigger next time,” “Do something you haven’t done before”).
4. The teacher prompts students to describe what they observe other students doing (e.g., “What kind ofshapes do you see?”, “What do you notice about the movement?”).
5. The teacher prompts students to interpret what they think is being expressed (e.g., “How do you think thecharacter is feeling now?”, “How is his body/expression communicating this?”).
6. The teacher prompts students to articulate their understanding of the lesson objective (e.g., “What wordscan you use to describe the character’s feelings?”, “What do you think will happen next?”, “Why?”).

28
could have been done differently. The raters also provided feedback about what they noticed
were strengths of the lesson as well as areas in which the teacher could improve. During the
teacher reflection session that the teacher was provided with formative feedback for improve-
ment. The project developers were also provided with formative feedback based upon the
teachers perceptions of the lesson and, based on their observations of the teachers implementa-
tion, if anything might be changed in the project to better prepare teachers to use the strategies
and improve their quality of implementation. Finally, the raters met for a rater reflection-
reconciliation session at which time they compared their ratings, discussed their notes, and came
to consensus about the final ratings for each of the criteria. This final process was intended to be
both a chance for the raters to gain additional formative feedback about the process as well as
provide a summative quality of implementation index that can be correlated with other project
outcomes. During the pilot-test of the method there were instances in which only one rater was
available for the observations. We used this as an opportunity to check the reliability of the
criteria by providing a second rater with a DVD copy of the lesson to rate on their own. Results
from the pilot-test are presented below.
The pilot test result for the Quality of Program Implementation (QPI) observations indicated
good consensus and consistency reliability for the six criteria for which the teachers were
assessed. Four out of the eight pilot test teachers were observed by two raters and the other four
were observed by one rater, with an additional rater providing ratings from viewing a DVD of
the in-class lesson.
The consensus estimates, which show the extent to which observers are able to come to
agreement about how to apply the various levels of a criterion to the observed behaviors
(Stemler, 2004), was .22 (less than 1/4 of a scale point difference across criteria)—an indication
of good consensus. The consensus between the one rater and the rater who viewed the DVDs
also shows fairly good reliability at .5 (an average of ½ scale point difference across the criteria).
Consistency, which is the extent that each judge is consistent in classifying the behavior
according to his or her own definition of the criteria (Stemler, 2004), was also very good for both
the two in-class observers and between the one in-class observer and the rater who viewed the
DVDs. The average correlations across the six criteria were .95 and .88, respectively.
The major component of the QPI observation method was to provide formative evaluation

29
feedback to the teachers and the project developers (raters). The findings from the pilot test
suggest that the formative teacher evaluation component was successful in (a) isolating the
teachers’ understanding of the criteria and the lesson’s objectives, (b) providing a chance for the
teachers to reflect on their lesson and identify areas that need improvement and that were strong,
and (c) allowing observers to provide their interpretation of the lesson and provide systematic
feedback to the teacher by using the criteria list. Review of the results also suggest that the
project developers were provided with valuable formative feedback; the observers (a) reflected
about how to best to provide feedback to the teachers in general as well as individualized needs
of the teachers, (b) began to internalize criteria and what they look liked when they were
implemented and being judged, and (c) identified weaknesses in their training (e.g., making the
connections between the art form and the content area objective) and how it can be improved.
Finally, the instrument was also successful in providing a summative evaluation index that could
be used to correlate with other project outcomes when it is fully implemented in Year 3. This
was supported by how the two in-class observers were able to reconcile differences in their
ratings of the criteria to provide a final summative quality of implementation index for each
teacher they observed.
Teachers Use of the Arts Strategies Survey
As described previously the Teachers’ Use of the Arts Survey was administered to all project
school teachers at the end of the Spring 2008 semester. The part of the survey that asked teachers
to indicate how often and for how long they used the arts strategies was for the evaluators to (a)
collect alternative data about the teachers frequency of arts strategy implementation, (b) correlate
the results of the survey with the results on the weekly teacher log, and (c) decide if the
correlation between the weekly log and the survey results was strong enough to warrant only
using a final survey to assess frequency of implementation rather than the somewhat laborious
task of completing a weekly log.
In Table II-17, we present the descriptive statistics for the two items related to the teachers’
use of the arts strategies. The first item on the survey asked teachers to indicate on a 5-point
scale, where 1 = none of the time, 2 = not very often, 3 = sometimes, 4 = often, and 5 = fre-
quently if not always, how often they used the six arts strategies. A mean score of 5.00 was the
maximum value for this item. The second item asked teachers to indicate how many times a

30
week they used the arts strategies. Teachers could respond to 0, 1, 2, 3, 4, 5, or more than 5 times
per week. The maximum mean value for this item was 6.00. The results shown in Table II-14
indicate that the Snapshot strategy was the most used strategies and that teachers indicated that
on average it was used often (mean = 4.00) and that it was used almost three times per week
(mean = 2.43).
The correlation between the results of the weekly teacher log and use survey was conducted
to determine the extent to which the two measures are related. A correlation coefficient of .76
was found between the two instruments, which suggests a strong positive relationship (Cohen,
1988). However, the disparity between the estimates suggests that the log might be a somewhat
under-reported measure of use and the survey might be a somewhat inflated estimate of use.
Furthermore, the high mean values for the item that asked teachers to indicate how often the
strategies were used suggests that the teachers’ perceived that using the strategies one to two
times per week is using the strategies often.
Table II-17Descriptive Statistics for Items 1 and 2 on the Teacher Use of the Arts Survey
Item N Mean St. dev.
1. In general, how often did you use:
Domino 14 2.29 0.61
Echo 14 3.14 0.86
Mirror 14 2.36 0.74
Snapshot 14 4.00 0.88
Tableau 14 3.64 0.93
Expressive Dance 14 2.64 0.93
2. How many times a week did you use:
Domino 14 0.79 0.89
Echo 14 2.07 1.90
Mirror 14 0.86 0.77
Snapshot 14 2.43 1.40
Tableau 14 1.93 1.27
Expressive Dance 14 1.00 1.11
31
Student Opinions about and Exposure to the Arts Strategies
Student Focus Groups
Grade-level student focus groups were conducted at the two participating project schools at
the end of the Fall 2007 semester to identify student opinions about the project. The focus groups
were audio recorded and transcribed for analysis. A summary of the student focus groups results
is presented below.
Overall, the student responses indicated that the purpose of the project was to teach them
about the art strategies. The groups of students were most familiar with the strategies snapshot
and tableau, as indicated by their ability to define how each of the strategies work. For example,
“It’s exciting because you get to act out certain words and it’s different levels like tall, medium,
and short.” The students that were interviewed had an overwhelming positive view about their
work with the strategies, for example, “It’s fun because if you do a snapshot, you can come to
the front and show everybody,” “It’s awesome, it’s fun.” In general, students also indicated that
the use of the strategies was to help them with aspects of reading comprehension. For example,
“figuring out parts of the story.” Interestingly, the students thought that the best part of using the
strategies was being able to work in a group and to get to know each other better. Similarly,
several indicated that they noticed some students who didn’t want to participate at first were
more likely to participate as they used the strategies more.
Student Exposure to the Arts Survey
The Student Exposure to the Arts Survey was administered at the end of the Spring 2008
semester. The survey was designed to determine how much project students (a) thought they
were exposed to the ALA art strategies, (b) liked doing the ALA art strategies, and (c) thought
that the ALA art strategies helped them to understand reading better. The results of the survey
were compared with teachers’ responses on the weekly log, the teacher use survey, and the
teacher focus group comments to determine the extent to which the teachers’ perceptions of use
and impact of the arts strategies were congruent with the students’ perceptions of use and impact
of the arts strategies.
The Student Exposure to the Arts Survey was completed by 302 Grade 3–5 students at the
project schools. The survey asked students to respond to three sets of items about three strategies
(snapshot, tableau, and expressive dance) that are designed to teach core subject matter: (a) how

32
much they did the arts strategy, (b) how much they liked doing the arts strategy, and (c) how
much they thought the arts strategy helped then understand reading. The proportion of student
responses for the three sections are shown in Table II-18. The results shown in Table II-18
indicate that the majority of students don’t know how often the strategies were used. Of the
students that did know, the majority thought that the strategies were used about once a week. For
the item that asked the students how much they liked to do the strategies, 81% (calculated by
summing the proportion of responses for the anchors “I liked it a lot” and “I liked it OK,” 39 +
.42 = .81 from Table II-18) indicated that they liked doing snapshot to some extent , 78% liked
doing tableau to some extent, and 64% liked doing expressive dance to some extent. For the item
that asked students to indicate how much the strategies helped them understand reading, 77%
indicated that snapshot helped to some extent, 75% indicated that tableau helped to some extent,
and 57% indicated that expressive dance helped to some extent.
Table II-18Proportion of Student Responses on the Student Exposure to the Arts Survey
Item Response option
How much have you done...More than
once a weekAbout once a
weekLess than
once a weekDon’t know
1. ...Snapshot? .18 .25 .17 .40
2. ...Tableau? .12 .31 .24 .33
3. ...Expressive Dance? .11 .26 .20 .43
How much have you liked to do... I like it a lot I like it OK I don’t like it Don’t know
1. ...Snapshot? .39 .42 .06 .13
2. ...Tableau? .44 .34 .07 .15
3. ...Expressive Dance? .34 .30 .09 .27
How much has [enter strategy]helped you understand reading?
A lot Some Not at all Don’t know
1.Snapshot? .30 .47 .08 .14
2. Tableau? .35 .40 .06 .19
3. Expressive Dance? .19 .38 .14 .29

33
Unintended Consequences and Other Contextual Variables
The principal interviews and teacher focus groups were used to determine in any unintended
consequences resulted from the project activities.
Principal Interviews
Each of the project school principals were interviewed at the end of the Spring 2008 semester
to get their opinions about the project activities, and to determine if any contextual issues existed
at their respective schools that would help with the interpretation of the results. The principal
interviews were audio recorded and transcribed for analysis and a summary of their responses is
presented below.
The two project principals indicated that the reading programs were consistent across grades,
both used general Basel readers. The principals also indicated that, besides the Hawaiiana
program, most arts learning occurred at the teacher level. One principal indicated that the major
contextual issue that might have affected his school was the high level of students mobility in
and out of the school — “about a 30-40%”—due to the large number of military students
attending his school. Both principals were supportive of the program; however, one principal
was more concerned about the effects that the project had on HSA scores, whereas the other was
much more open to a long-term commitment of seeing the effects of the project on teacher
pedagogical practices.
Teacher Focus Groups
In response to the question about any unintended consequences that were a result of the
project activities, teachers referred to the enhanced classroom community as being unexpected
positive aspect of the project. Some also indicated that they did not foresee the amount of effort
that would be needed to integrate the arts into core subject matter. Several of the teachers also
indicated that they were not aware of their continued responsibilities in the project after the first
year—they did not think they would be expected to continue in the summer institute and full-day
workshops.
Teachers were also asked about their use of the weekly log to track their use of the arts
strategies during the focus group discussions. Overall, teachers indicated that they forgot to use
the log on a consistent bases and that they thought the results were an under-representation of
their actual strategy use. Furthermore, even when reminded to do the log, they also indicated that

34
they may have forgot about using an arts strategy during the week and did not accurately respond
on the log. However, teachers did comment that the weekly reminder about the log was a
motivating factor to keep them using the arts strategies.
35
CHAPTER IIIDISCUSSION
In this section we summarize the results collected during the second year of the evaluation of
the ALA research project (the first year of project implementation). The purposes of the second
year were to collect baseline data and provide formative evaluation information to the program
developers so that they might improve project activities in Years 3 and 4. The project was at
mid-stage during its second year, and strong effects were not expected. Therefore, any interpreta-
tions we make here are considered tentative and should not be construed as firm conclusions
about the effectiveness, either positive or negative, of the project.
Student Outcomes
Stanford Achievement Test 10th Edition (SAT10) and Hawai#i State Assessment (HSA)
The results show that the control group slightly outperformed the project group on the
reading comprehension section of the SAT10 in Grades 3 and 5 but the differences between the
groups were not statistically significant. The Grade 4 results show a statistically significant
difference between groups in favor of the control group. The results on the HSA show no
statistically significant differences between groups for Grades 3–5. These preliminary findings
suggest that the project has not had an effect on student reading achievement, as measured by the
SAT10 and the HSA, during the first year of project implementation. However, the results from
the teacher focus groups, teacher surveys, and student focus groups provide evidence that student
learning did occur.
There are questions about the extent to which the SAT10 and HSA are sensitive enough
measures to detect changes in student reading achievement that occur from project activities.
That is, learning may have occurred but might not have been reflected in the students’ standard-
ized test scores. The evaluators have begun discussions with project developers about future
research that might examine the effects of extensive implementation with immediate pre-post
measures—a method that might be more sensitive to identifying changes in student academic
achievement resulting from arts strategy use.
Interest in the Arts Questionnaire
The results of the Student Interest in the Arts Questionnaire show no statistically significant
difference between groups for Grades 3–5. The control group shows a slightly higher mean score

36
for arts interest than the project group in Grades 3 and 4, and the project group shows a slightly
higher mean score for arts interest in Grade 5.
As is the case for the SAT10 and HSA results, because this is the first year of implementa-
tion, little can be said about the effects of the project on students’ arts interest. Our previous
evaluation studies of the effects of using the arts in instruction (Brandon, Lawton, and Krohn-
Ching 2004, 2005, 2007) suggested that student affect measures, such as measuring student arts
interest, might not be appropriately measured until students reach Grade 5—an age at which
affect measures show more variability across students. We will continue to monitor student
scores on this instrument to determine if this instrument is a valid measure of students arts
interest in the lower elementary grade levels. Ultimately, we may have to focus more on the
qualitative results gathered from the student and teacher focus groups to determine if changes in
students interest in the arts occurs as a result their participation in the project.
Teachers Attitudes and Opinions About the Project
Overall, the Year 2 project group teachers reported highly positive opinions about their
participation in the project, an interpretation supported by their high ratings of the PD activities,
the rather high value they placed on using the arts to teach, and their rather high level of
gratification with having learned to use the arts to teach. Project group teachers show slightly
higher mean scores on the attitudes toward teaching with the arts survey than the control group
teachers, albeit not at a statistically significant level. The results from the teacher focus groups
and from the open-ended comments about the PD suggests that the project group teachers’
confidence and comfort level with using the arts is increasing as a result of the project activities;
we may find that as they use the arts strategies more and are exposed to more PD, their attitudes
toward using the arts to teach might continue to show a positive increase.
The project teachers’ comments suggest that the in-class mentoring component of the project
was the most valuable aspect of the PD in helping them to use the arts strategies. The teachers
indicated that the summer institute and full-day workshops were also valuable, that these
components provided a foundation for learning how to teach with the arts, and that the in-class
mentoring component built upon the knowledge gained in the summer institute and full-day
workshops by focusing on the smaller details of using the arts strategies. The results also suggest
that teachers feel that more mentor interaction, such as additional planning time with the mentors

37
and more in-class modeling by the mentors, might further enhance their practice of using the arts
strategies.
The project teachers indicated that the use of the strategies positively affected their teaching,
had a positive affect on their students’ learning, and provided a positive alternative to address the
different learning styles of the students. The teacher comments also suggest that their use of the
arts in their teaching practice created a stronger sense of classroom community, an effect that
several saw as an unintended consequence of the project. Several teachers felt that the strategies
affected their willingness to take risks in their teaching approaches and that the interaction and
collaboration with the other teachers in the project helped them reflect on how to improve their
teaching using the arts strategies.
Frequency and Quality of Implementation of Arts Strategies
The instruments used to examine the frequency of implementation of the project in the
classroom show somewhat conflicting results. The weekly teacher log results indicate that the
teachers are not using the arts strategies very often, but the results from the end of the year
teacher questionnaire suggest that the teachers are using them on a more consistent basis.
However, the consistency between how the teachers responded to each of the measures was quite
high, suggesting that the log might be an under-representation of how much the arts strategies
were used and the use survey might be an over-estimation on their weekly use of the arts
strategies. The teacher focus groups suggest that the teachers’ actual use is perhaps more than
what was found from the log results but less than what was found on the survey results. The
teachers’ responses indicate that they sometimes forgot to log when they used strategies and that
they did not have the time or were constrained by the curriculum to use the arts strategies as
much as they would have liked. The teachers’ focus groups results also suggests that the teachers
may not have sufficient comfort and fluency to transition smoothly between traditional teaching
methods and using the arts strategies, which may have also affect the frequency of use. The
results from the student survey asking about their exposure to the arts supports our interpretation
that teachers were perhaps using the strategies more than reported on the log but not as much as
they reported on the end of the year survey—a level that is still lower than desirable. This level
of arts strategy use might also shed light on why the effects on student achievement and arts
interest are not as positive as might be expected if the strategies were used more consistently and
38
for longer periods of time.
The results from both the log and the survey show that the teachers used the strategy
Snapshot the most often and that it was mostly used for teaching vocabulary. The results show
that the teachers used the Echo strategy the most often, when compared to other strategies (e.g.,
Domino and Mirroring) that are intended to be used as general classroom management methods,
such as transitioning students between classroom activities and getting students focused. The
high use of the strategy Snapshot, compared to other strategies indented to affect student
academic learning (e.g., Tableau and Expressive Dance), reflects that it is an easier strategy to
use and doesn’t require much preparation time—one aspect that was indicated by teachers as
influencing their use of the arts strategies.
The Quality of Program Implementation method, which was pilot-tested in Year 2, showed
good reliability as a way to assess the quality in which the teachers are using the arts strategies.
Full implementation of the method will begin in Year 3 of the project. Results from this method
will be used to correlate with other project outcomes and give us more confidence in our
interpretation of the effects of the project on student and teacher outcomes.
Student Opinions about and Exposure to the Arts Strategies
Overall, the results from the student focus groups and student exposure questionnaire suggest
that students enjoyed their participation in the arts activities. The students indicated that the
activities are exciting, have helped with their confidence, and have provided an opportunity to
get to know their classmates more—that is, creating a sense of classroom community.
For the students that responded to the exposure survey about how much they used the arts
strategies, results show that close to two-thirds did not know how often they use the different art
strategies. This may be interpreted in two ways: (a) The teachers are not using the strategies at a
high enough level for students to estimate how much the arts strategies are being used, or (b) the
students simply did not know what the different strategies are called. The first interpretation is
probably more likely, as the students that participated in focus groups were relatively accurate in
their definitions of the different arts strategies. A majority of the students indicated that they
liked to do the different arts strategies to some extent and that the use of the arts strategies has
helped them better understand reading to some extent. The finding that most students’ believe
that the strategies has helped them better understand reading suggests that if the teachers use the

39
arts strategies more, they would be more likely to see effects on the student achievement
measures.
Unintended Consequences and Other Contextual Variables
The results from the principal interviews suggest that the variable that might have the biggest
affect on the project findings is the number of students leaving and entering one of the project
schools. As the project proceeds, we will examine the extent that this affects project outcomes.
As mentioned previously, the teacher focus groups results show that the use of the arts
strategies in creating a sense of classroom community was a positive unintended consequence.
The teachers indicated that they were not aware that they would be required to attend additional
summer institutes and professional development activities after their first year in the project,
which may have been a result of miscommunication between the project developers and the
teachers at the beginning of the project. However, a review of documents that were provided to
the teachers show that this information was outlined for the teachers. It may have been that the
teachers failed to revisit the documents that outlined what would be required of them throughout
the project periods; therefore, the project developers might consider providing additional
reminders at regular internals to remind the teachers of their responsibilities and involvement in
the project.
Summary
The results indicate that the project was successful in creating a sense of classroom commu-
nity by actively engaging students in the learning process through the use of the arts strategies.
The student outcome findings suggest that either the arts strategies are not being used enough to
affect students reading achievement and arts interest or that the measures are not sensitive
enough to measure changes as a result of the strategy use. The evaluation results also suggest
that greater exposure to the mentors for the purpose of planning lessons and providing teacher
feedback might increase the teachers use of the strategies. Further, teachers should be regularly
reminded that the strategies need to be used on a more consistent bases, that is, more than one
time a week, to see student achievement gains.
40
REFERENCES
Bonwell, C. C., & Eison, J. A. (1991). Active learning: creating excitement in the classroom.
ASHE-ERIC Higher Education Report No. 1. Washington, D.C.: The George Washington
University, School of Education and Human Development.
Brandon, P. R., Lawton, B., & Krohn-Ching, V. (2004). Evaluation of the first year of the ARTS
FIRST Windward Research Project. Honolulu: University of Hawai‘i at Mānoa, Curriculum
Research & Development Group, Program Research and Evaluation Office.
Brandon, P. R., Lawton, B., & Krohn-Ching, V. (2005). Evaluation of the second year of the
ARTS FIRST Windward Research Project. Honolulu: University of Hawai‘i at Mānoa,
Curriculum Research & Development Group, Program Research and Evaluation Office.
Brandon, P. R., Lawton, B., & Krohn-Ching, V. (2007). Evaluation of the final year of the ARTS
FIRST Windward Research Project. Honolulu: University of Hawai‘i at Mānoa, Curriculum
Research & Development Group, Program Research and Evaluation Office.
Brandon, P. R., Lawton, B., & Krohn-Ching, V. (In-press). The Methods, Findings, Strengths,
and Weaknesses of the ARTS FIRST Windward Research Project Evaluation. Monograph
published by the U.S. Department of Education’s Arts Education Model Development and
Dissemination Grant Program. Washington DC.
Chickering, A., & Gamson, Z. (1987). Seven principles of good practice in undergraduate
education. AAHE Bulletin, 39, 3-7.
Cohen, J. (1988). Statistical power analysis for the behavioral sciences (2nd ed.). Hillsdale, NJ:
Erlbaum.
Elashoff, J. D. (1969). Analysis of covariance: A delicate Instrument. American Educational
Research Journal, 6, 383–401.
Guskey, T.R. (2000). Evaluating professional development. Thousand Oaks, Calif.: Corwin
Press.
Hawai‘i Alliance for Arts Education. (2003). ARTS FIRST essential arts toolkit for K–5
classroom teacher: Hawai‘i fine arts grade level guide. Honolulu: Author.
Hawai‘i Arts Alliance. (2007). An essential arts toolkit for K–5 classroom teacher: Hawai‘i fine
arts grade level guide (2nd ed.). Honolulu: Author.
Lowman, J. (1984). Mastering the techniques of teaching. San Francisco: Jossey-Bass.
41
Luellen, J. K., W. R. Shadish, and M. H. Clark. (2005). Propensity scores: An introduction and
experimental test. Evaluation Review, 29, 530–58.
Root-Bernstein, R. S., & Root-Bernstein, M. M. (1999). Sparks of genius: The 13 thinking tools
of the world's most creative people. Boston: Houghton Mifflin.
Rosenbaum, P. R., & D. B. Rubin. (1984). Reducing bias in observational studies using subclas-
sification on the propensity score. Journal of the American Statistical Association, 79,
516–24.
Shadish, W.R., Cook, T.D., & Campbell, D.T. (2002). Experimental and Quasi-Experimental
Designs for Generalized Causal Inference. Boston: Houghton-Mifflin.
Stemler, Steven E. (2004). A comparison of consensus, consistency, and measurement ap-
proaches to estimating interrater reliability. Practical Assessment, Research & Evaluation,
9(4). Retrieved January 19, 2009 from http://PAREonline.net/getvn.asp?v=9&n=4.

This report was prepared to meet the requirements of a U. S. Department of Education Model Development andDissemination Grant (No. U351D060016) to the Hawai‘i Arts Alliance (HAA) to implement and conduct researchon the Arts and Literacy for All project. The grant project is a collaboration between HAA and Curriculum Research& Development Group (CRDG), University of Hawai‘i at Mānoa, with HAA implementing the program and CRDGconducting the research and evaluation activities under a Memorandum of Agreement with HAA. Paul Brandon,Ph.D., was the research Principal Investigator and Brian Lawton, M.Ed., was the Project Manager. The interpreta-tions expressed in the report are solely the authors’.


![[Curriculum development] Roles of Technology in Curriculum Development](https://static.fdocuments.net/doc/165x107/55b5717fbb61ebb7508b47fd/curriculum-development-roles-of-technology-in-curriculum-development.jpg)