CPS MOG SNMP, Alarms, and Clearing Procedures … MOG SNMP, Alarms, and Clearing Procedures Guide,...
86
CPS MOG SNMP, Alarms, and Clearing Procedures Guide, Release 13.1.0 First Published: 2017-08-18 Last Modified: 2017-08-18 Americas Headquarters Cisco Systems, Inc. 170 West Tasman Drive San Jose, CA 95134-1706 USA http://www.cisco.com Tel: 408 526-4000 800 553-NETS (6387) Fax: 408 527-0883
Transcript of CPS MOG SNMP, Alarms, and Clearing Procedures … MOG SNMP, Alarms, and Clearing Procedures Guide,...
CPS MOG SNMP, Alarms, and Clearing Procedures Guide, Release13.1.0First Published: 2017-08-18
Last Modified: 2017-08-18
Americas HeadquartersCisco Systems, Inc.170 West Tasman DriveSan Jose, CA 95134-1706USAhttp://www.cisco.comTel: 408 526-4000 800 553-NETS (6387)Fax: 408 527-0883

THE SPECIFICATIONS AND INFORMATION REGARDING THE PRODUCTS IN THIS MANUAL ARE SUBJECT TO CHANGE WITHOUT NOTICE. ALL STATEMENTS,INFORMATION, AND RECOMMENDATIONS IN THIS MANUAL ARE BELIEVED TO BE ACCURATE BUT ARE PRESENTED WITHOUT WARRANTY OF ANY KIND,EXPRESS OR IMPLIED. USERS MUST TAKE FULL RESPONSIBILITY FOR THEIR APPLICATION OF ANY PRODUCTS.
THE SOFTWARE LICENSE AND LIMITEDWARRANTY FOR THE ACCOMPANYING PRODUCT ARE SET FORTH IN THE INFORMATION PACKET THAT SHIPPED WITHTHE PRODUCT AND ARE INCORPORATED HEREIN BY THIS REFERENCE. IF YOU ARE UNABLE TO LOCATE THE SOFTWARE LICENSE OR LIMITED WARRANTY,CONTACT YOUR CISCO REPRESENTATIVE FOR A COPY.
The Cisco implementation of TCP header compression is an adaptation of a program developed by the University of California, Berkeley (UCB) as part of UCB's public domain versionof the UNIX operating system. All rights reserved. Copyright © 1981, Regents of the University of California.
NOTWITHSTANDINGANYOTHERWARRANTYHEREIN, ALL DOCUMENT FILES AND SOFTWARE OF THESE SUPPLIERS ARE PROVIDED “AS IS"WITH ALL FAULTS.CISCO AND THE ABOVE-NAMED SUPPLIERS DISCLAIM ALL WARRANTIES, EXPRESSED OR IMPLIED, INCLUDING, WITHOUT LIMITATION, THOSE OFMERCHANTABILITY, FITNESS FORA PARTICULAR PURPOSEANDNONINFRINGEMENTORARISING FROMACOURSEOFDEALING, USAGE, OR TRADE PRACTICE.
IN NO EVENT SHALL CISCO OR ITS SUPPLIERS BE LIABLE FOR ANY INDIRECT, SPECIAL, CONSEQUENTIAL, OR INCIDENTAL DAMAGES, INCLUDING, WITHOUTLIMITATION, LOST PROFITS OR LOSS OR DAMAGE TO DATA ARISING OUT OF THE USE OR INABILITY TO USE THIS MANUAL, EVEN IF CISCO OR ITS SUPPLIERSHAVE BEEN ADVISED OF THE POSSIBILITY OF SUCH DAMAGES.
Any Internet Protocol (IP) addresses and phone numbers used in this document are not intended to be actual addresses and phone numbers. Any examples, command display output, networktopology diagrams, and other figures included in the document are shown for illustrative purposes only. Any use of actual IP addresses or phone numbers in illustrative content is unintentionaland coincidental.
Cisco and the Cisco logo are trademarks or registered trademarks of Cisco and/or its affiliates in the U.S. and other countries. To view a list of Cisco trademarks, go to this URL: https://www.cisco.com/go/trademarks. Third-party trademarks mentioned are the property of their respective owners. The use of the word partner does not imply a partnershiprelationship between Cisco and any other company. (1721R)
© 2017 Cisco Systems, Inc. All rights reserved.

C O N T E N T S
P r e f a c e Preface v
About this Guide v
Additional Support v
Conventions (all documentation) vi
Obtaining Documentation and Submitting a Service Request vii
C H A P T E R 1 Monitoring and Alert Notification 1
Architectural Overview 1
Technical Architecture 2
Protocols and Query Endpoints 2
SNMP Object Identifier and Management Information Base 3
SNMP Data and Notifications 4
Facility 5
Severity 6
Categorization 6
Emergency Severity Note 7
SNMP System and Application KPIs 7
SNMP System KPIs 7
Details of SNMP System KPIs 8
SNMP Application KPIs 8
Summary of SNMP Application KPIs 9
Details of Supported KPIs 10
Threshold based KPI Alarms 11
Notifications and Alerting (Traps) 11
Component Notifications 12
Configure Low Memory Threshold 17
Configure High CPU Usage Alarm Thresholds and Interval Cycle 17
CPS MOG SNMP, Alarms, and Clearing Procedures Guide, Release 13.1.0 iii

Application Notifications 18
Configuration to Generate Invalid License Trap 30
Unknown Application Events 31
Configuration and Usage 32
Configuration for SNMP Gets and Walks 32
Configuration for Notifications (traps) 32
Cluster Manager KPI and SNMP Configuration 33
Install NET-SNMP 33
SNMPD Configuration 34
Validation and Testing 40
Component Statistics 41
Application KPI 41
Alarm Notifications/Traps 42
Testing Individual Traps 42
Troubleshooting 43
C H A P T E R 2 Clearing Procedures 45
Component Notifications 45
Application Notifications 49
CPS MOG SNMP, Alarms, and Clearing Procedures Guide, Release 13.1.0iv
Contents

Preface
• About this Guide, page v
• Additional Support, page v
• Conventions (all documentation), page vi
• Obtaining Documentation and Submitting a Service Request, page vii
About this GuideWelcome to Cisco Policy Suite/Mobile Orchestration Gateway SNMP, Alarms and Clearing ProceduresGuide.
This document describes operations, maintenance, and troubleshooting activities for the Cisco Policy Suite(CPS) and the Mobile Orchestration Gateway (MOG). This document assists system administrators andnetwork engineers to operate and monitor the Cisco Policy Server.
This document assumes a general understanding of network architecture, configuration, and operations.Instructions for installation and use of CPS/MOG and related equipment assume that the reader has experiencewith electronics and electrical appliance installation.
Additional SupportFor further documentation and support:
• Contact your Cisco Systems, Inc. technical representative.
• Call the Cisco Systems, Inc. technical support number.
•Write to Cisco Systems, Inc. at [email protected].
• Refer to support matrix at https://www.cisco.com/c/en/us/support/index.html and to other documentsrelated to Cisco Policy Suite.
CPS MOG SNMP, Alarms, and Clearing Procedures Guide, Release 13.1.0 v

Conventions (all documentation)This document uses the following conventions.
IndicationConventions
Commands and keywords and user-entered textappear in bold font.
bold font
Document titles, new or emphasized terms, andarguments for which you supply values are in italicfont.
italic font
Elements in square brackets are optional.[ ]
Required alternative keywords are grouped in bracesand separated by vertical bars.
{x | y | z }
Optional alternative keywords are grouped in bracketsand separated by vertical bars.
[ x | y | z ]
A nonquoted set of characters. Do not use quotationmarks around the string or the string will include thequotation marks.
string
Terminal sessions and information the system displaysappear in courier font.
courier font
Nonprinting characters such as passwords are in anglebrackets.
< >
Default responses to system prompts are in squarebrackets.
[ ]
An exclamation point (!) or a pound sign (#) at thebeginning of a line of code indicates a comment line.
!, #
Means reader take note. Notes contain helpful suggestions or references to material not covered in themanual.
Note
Means reader be careful. In this situation, you might perform an action that could result in equipmentdamage or loss of data.
Caution
CPS MOG SNMP, Alarms, and Clearing Procedures Guide, Release 13.1.0vi
PrefaceConventions (all documentation)

IMPORTANT SAFETY INSTRUCTIONS.
Means danger. You are in a situation that could cause bodily injury. Before you work on any equipment,be aware of the hazards involved with electrical circuitry and be familiar with standard practices forpreventing accidents. Use the statement number provided at the end of each warning to locate its translationin the translated safety warnings that accompanied this device.
SAVE THESE INSTRUCTIONS
Warning
Provided for additional information and to comply with regulatory and customer requirements.Warning
Obtaining Documentation and Submitting a Service RequestFor information on obtaining documentation, using the Cisco Bug Search Tool (BST), submitting a servicerequest, and gathering additional information, see What's New in Cisco Product Documentation.
To receive new and revised Cisco technical content directly to your desktop, you can subscribe to the What'sNew in Cisco Product Documentation RSS feed. RSS feeds are a free service.
CPS MOG SNMP, Alarms, and Clearing Procedures Guide, Release 13.1.0 vii
PrefaceObtaining Documentation and Submitting a Service Request

CPS MOG SNMP, Alarms, and Clearing Procedures Guide, Release 13.1.0viii
PrefaceObtaining Documentation and Submitting a Service Request

C H A P T E R 1Monitoring and Alert Notification
• Architectural Overview, page 1
• Technical Architecture, page 2
• SNMP System and Application KPIs, page 7
• Notifications and Alerting (Traps), page 11
• Configuration and Usage, page 32
• Troubleshooting, page 43
Architectural OverviewACisco Policy Suite (CPS) deployment comprises multiple virtual machines (VMs) deployed for scaling andHigh Availability (HA) purposes. All VMs present in the system should have an IP address which is a routableIP to the NetworkManagement System (NMS). The NMS canmonitor each VM using this routable IP address.
The IP addresses do not need to be routable if the NMS has an interface on the same internal network asthe CPS VMs.
Note
MOG is an additional software component contained in Policy Suite and utilizes the same architecture.
During runtime any number of VMs can be added to the system and the NMS can monitor them using theirroutable IP address which makes the system more scalable. The notification alerting from the entire systemderives from a single point.
CPS MOG SNMP, Alarms, and Clearing Procedures Guide, Release 13.1.0 1

When CPS is deployed in a High Availability (HA) alerting endpoints are deployed as HA as well as shownin the following illustration.
Figure 1: HA Deployment
Technical ArchitectureCisco Policy Suite is deployed as a distributed virtual appliance. The standard architecture uses hypervisorvirtualization. Multiple physical hardware host components run Hypervisors and each host runs several virtualmachines butMobile OrchestrationGateway is hardware independent.Within each virtual machine one-to-manyinternal CPS components can run. CPS monitoring and alert notification infrastructure simplifies the virtualphysical and redundant aspects of the architecture.
Protocols and Query EndpointsThe CPS monitoring and alert notification infrastructure provides a simple standards-based interface fornetwork administrators and NMS (Network Management System). SNMP is the underlying protocol for allmonitoring and alert notifications. Standard SNMP gets and notifications (traps) are used throughout theinfrastructure.
At any point of time only one version of SNMP (either SNMPv2 or SNMPv3) will work. By default SNMPv3is disabled. For information on configuring SNMPv3 refer to the CPS Installation Guide for VMware or tothe CPS Installation Guide for OpenStack for this release.
CPS MOG SNMP, Alarms, and Clearing Procedures Guide, Release 13.1.02
Monitoring and Alert NotificationTechnical Architecture

The following illustration shows the aggregation and mapping on the SNMP endpoint (Policy Director (LB)).
Figure 2: SNMP Endpoint
SNMP Object Identifier and Management Information BaseCisco has a registered private enterprise Object Identifier (OID) of 26878. This OID is the base from whichall aggregated CPS metrics are exposed at the SNMP endpoint. The Cisco OID is fully specified and madehuman-readable through a set of Cisco Management Information Base (MIB-II) files.
The current MIBs are defined as follows:
Table 1: MIBs
PurposeMIB Filename
Defines the main structure including structures andcodes.
BROADHOP-MIB.mib
Defines the retrievable statistics and KPI.CISCO-QNS-MIB.mib
Defines Notifications/Traps available.BROADHOP-NOTIFICATION-MIB.mib
CPS MOG SNMP, Alarms, and Clearing Procedures Guide, Release 13.1.0 3
Monitoring and Alert NotificationSNMP Object Identifier and Management Information Base

A graphical overview of the CPS OID and MIB structure is shown in the next figure.
Figure 3: SNMP Notifications
Note that in the above illustration the entire tree is not shown.
SNMP Data and NotificationsThe Monitoring and Alert Notification infrastructure provides standard SNMP get and getnext access to theCPS system. This provides access to targeted metrics to trend and view Key Performance Indicators (KPIs).Metrics available through this part of the infrastructure are as general as component load and as specific astransactions processed per second.
SNMP Notifications in the form of traps (one-way) are also provided by the infrastructure. CPS notificationsdo not require acknowledgments. These provide both proactive alerts that predetermined thresholds have beenpassed (for example a disk is nearing capacity or CPU load is too high) and reactive alerting when systemcomponents fail or are in a degraded state (for example a process died or network connectivity outage hasoccurred).
Notifications and traps are categorized by a methodology similar to UNIX System Logging (syslog) with bothSeverity and Facility markers. All event notifications (traps) contain these items
• Facility
• Severity
CPS MOG SNMP, Alarms, and Clearing Procedures Guide, Release 13.1.04
Monitoring and Alert NotificationSNMP Data and Notifications

• Source (device name)
• Device time
These objects enable Network Operations Center (NOC) staff to identify where the issue lies the Facility(system layer) and the Severity (importance) of the reported issue.
For more information on CPS statistics, refer to CPS Statistics chapter in CPS Operations Guide for thisrelease. For more information on CPS logging, refer to Logging chapter in CPS Troubleshooting Guidefor this release.
Note
FacilityThe generic syslog facility has the following definitions.
Facility defines a system layer starting with physical hardware and progressing to a process running in aparticular application.
Note
Table 2: Syslog Facility
DescriptionFacilityNumber
Physical Hardware – Servers SANNIC Switch and so on.
Hardware0
Connectivity in the OSI (TCP/IP)model.
Networking1
VMware ESXi (or other)Virtualization
Virtualization2
Linux Microsoft Windows and soon.
Operating System3
Apache httpd load balancer CPSCisco sessionmgr and so on.
Application4
Particular httpd process CPSqns01_A and so on.
Process5
There may be overlaps in the Facility value as well as gaps if a particular SNMP agent does not have full viewinto an issue. The Facility reported is always shown as viewed from the reporting SNMP agent.
CPS MOG SNMP, Alarms, and Clearing Procedures Guide, Release 13.1.0 5
Monitoring and Alert NotificationSNMP Data and Notifications

SeverityIn addition to Facility each notification has a Severity measure. The defined severities are directly fromUNIXsyslog and defined as follows:
Table 3: Severity Levels
DescriptionSeverityNumber
System is unusable.Emergency0
Actionmust be taken immediately.Alert1
Critical conditions.Critical2
Error conditions.Error3
Warning conditions.Warning4
Normal but significant condition.Notice5
Informational message.Info6
Lower level debug messages.Debug7
Indicates no severity.None8
The occurred condition has beencleared.
Clear9
For the purposes of the CPS Monitoring and Alert Notifications system, Severity levels of Notice Info andDebug are usually not used.
Warning conditions are often used for proactive threshold monitoring (for example Disk usage or CPU Load)which requires some action on the part of administrators but not immediately.
Conversely, Emergency severity indicates that some major component of the system has failed and that eithercore policy processing session management or major system functionality is impacted.
CategorizationCombinations of Facility and Severity create many possibilities of notifications (traps) that might be sent.However some combinations are more likely than others. The following table lists some Facility and Severitycategorizations.
CPS MOG SNMP, Alarms, and Clearing Procedures Guide, Release 13.1.06
Monitoring and Alert NotificationCategorization

Table 4: Severity Categorization
PossibilityCategorizationFacility.Severity
Possible but in an HAconfiguration very unlikely.
A single part of an application hasdramatically failed.
Process.Emergency
NAA hardware component has sent adebug message.
Hardware.Debug
Possible as a recoverable kernelfault (on a vNIC for instance).
An Operating System (kernel orresource level) fault has occurred.
Operating System.Alert
Unlikely but possible (loadbalancers failing for instance).
An entire application componenthas failed.
Application.Emergency
It is not possible to quantify every Facility and Severity combination. However greater experience with CPSleads to better diagnostics. The CPS Monitoring and Alert Notification infrastructure provides a baseline forevent definition and notification by an experienced engineer.
Emergency Severity NoteCaution Emergency severities are very important! As a general principle CPS does not throw anEmergency-severity trap unless the system becomes inaccessible or unusable in some way. An unusablesystem is rare but might occur if multiple failures occur in the operating system virtualization networking orhardware facilities.
SNMP System and Application KPIsMany CPS and MOG system statistics and Key Performance Indicators (KPI) are available via SNMP getsandwalks. Both system device level information and application level information is available. This informationis documented in the CISCO-QNS-MIB. A summary of the information available is provided in the followingsections.
SNMP System KPIsIn this table the system KPI information is provided.
CPS MOG SNMP, Alarms, and Clearing Procedures Guide, Release 13.1.0 7
Monitoring and Alert NotificationEmergency Severity Note

Table 5: SNMP System KPIs
InformationComponent
CpuUser
CpuSystem
CpuIdle
LoadAverage1
LoadAverage5
LoadAverage15
MemoryTotal
MemoryAvailable
SwapTotal
SwapAvailable
LB01/LB02
PCRFClient01/PCRFClient02
SessionMgr01/SessionMgr02
QNS01/QNS02/QNS03/QNS04
Except for an AIO (All-In-One) deployment all components or devices are VMs.Note
Details of SNMP System KPIsThe following information is available and is listed per component. The root of these KPIs is.1.3.6.1.4.1.26878.200.3.2.70. MIB documentation provides units of measure.+--ciscoProductsQNSComponents70 (70) |+--ciscoProductsQNSComponentsSystemStats (1) |
+-- -R-- Integer32 componentCpuUser(1) |+-- -R-- Integer32 componentCpuSystem(2) |+-- -R-- Integer32 componentCpuIdle(3) |+-- -R-- Integer32 componentLoadAverage1(4) |+-- -R-- Integer32 componentLoadAverage5(5) |+-- -R-- Integer32 componentLoadAverage15(6) |+-- -R-- Integer32 componentMemoryTotal(7) |+-- -R-- Integer32 componentMemoryAvailable(8) |+-- -R-- Integer32 componentSwapTotal(9) |+-- -R-- Integer32 componentSwapAvailable(10) |
SNMP Application KPIsCurrent version Key Performance Indicators (KPI) information is available at the OID root of:
.1.3.6.1.4.1.26878.200.3.3.70
This corresponds to an MIB of:.iso.identified-organization.dod.internet.private.enterprise
CPS MOG SNMP, Alarms, and Clearing Procedures Guide, Release 13.1.08
Monitoring and Alert NotificationDetails of SNMP System KPIs

.broadhop
.broadhopProducts
.ciscoProductsQNS
.ciscoProductsQNSConsolidatedKPIVersion
.ciscoProductsQNSKPI70
Summary of SNMP Application KPIsThe following application KPIs are available for monitoring on each node using SNMPGet andWalk utilities:
Table 6: SNMP Application KPIs - Summary
InformationComponent
PCRFProxyExternalCurrentSessions: It is the totalnumber of active sessions (open connections) whichare connected to lbvip01:8443 from external system(lbvip01 has public IP address). It is an active sessioncounter (not cumulative) and as such there is no limiton active sessions.
PCRFProxyInternalCurrentSessions: It is the totalnumber of active sessions (open connections) whichare connected to lbvip02:8080 (lbvip02 has privateIP address) from internal VMs such as Policy Server(QNS), sessionmgr, OAM (pcrfclient) and so on. Itis an active session counter (not cumulative) and assuch there is no limit on active sessions.
Policy Director (lb01/lb02)
----------OAM (pcrfclient01/pcrfclient02)
----------Session Manager (sessionmgr01/sessionmgr02)
CPS MOG SNMP, Alarms, and Clearing Procedures Guide, Release 13.1.0 9
Monitoring and Alert NotificationSummary of SNMP Application KPIs

InformationComponent
PolicyCount: It is the total number of processedpolicymessages by an individual Policy Server (QNS)VM. There is no limit on policy message processing.
QueueSize: The number of entries in the processingqueue. The default queue size is 500, and isconfigurable in Policy Builder. You can also see thenumber of dropped messages in the statistics files.There is a separate queue for each Policy Server(QNS) VM.
FailedEnqueueCount: Each Policy Server (QNS)VMmaintains a queuewhere it keeps policymessagesto be processed in last-in-first-out order. This counterwill be incremented when Policy Server (QNS)process fails to add policy message into policymessage processing queue.
ErrorCount: It is the total number of policymessages which got error while processing by anindividual Policy Server (QNS) VM.
AggregateSessionCount: This is the consolidatedactive subscriber sessions in CPS. Themaximum limitof sessions will be based on installed license. It isonly active session count not cumulative count.AggregateSessionCount is the consolidated activesubscriber sessions in CPS andkpiLBPCRFProxyInternalCurrentSessions is the openconnection to lbvip02:8080.
FreeMemory
Policy Server (qns01/qns02/qns03/qns04)
Details of Supported KPIsThe following information is available and is supported in current release. MIB documentation provides unitsof measure.+--ciscoProductsQNSKPILB(11)| || +-- -R-- String kpiLBPCRFProxyExternalCurrentSessions(1)| | Textual Convention DisplayString| | Size 0..255| +-- -R-- String kpiLBPCRFProxyInternalCurrentSessions(2)| Textual Convention DisplayString| Size 0..255
+--ciscoProductsQNSKPISessionMgr(14)+--ciscoProductsQNSKPIQNS(15)| || +-- -R-- Integer32 kpiQNSPolicyCount(20)| +-- -R-- Integer32 kpiQNSQueueSize(21)| +-- -R-- Integer32 kpiQNSFailedEnqueueCount(22)| +-- -R-- Integer32 kpiQNSErrorCount(23)
CPS MOG SNMP, Alarms, and Clearing Procedures Guide, Release 13.1.010
Monitoring and Alert NotificationDetails of Supported KPIs

| +-- -R-- Integer32 kpiQNSAggregateSessionCount(24)| +-- -R-- Integer32 kpiQNSFreeMemory(25)
Threshold based KPI AlarmsCPS can generate SNMP alarms for KPIs after they have reached threshold values. The threshold values areconfigured in the /etc/broadhop/kpi_threshold.conf file. The kpi_threshold.confconfiguration file contains all the KPI configurations and must be configured to generate the KPI traps. Theconfiguration file must be present on all VMs.
Events generated by the KPI script are locally logged in pcrfclient01/02 in the/var/log/broadhop/kpi-alarm.log file. The following table defines the configuration parameters:
Table 7: KPI Configuration Parameters
DescriptionParameter
Log levels are as follows:
• 1: DEBUG
• 2: INFO
• 3: WARN
• 4: ERROR
for example, GV_LOG_LEVEL= logging.INFO
GV_LOG_LEVEL
Log file path and log file name.
For example,GV_LOG_FILE="/var/log/broadhop/kpi-alarm.log
GV_LOG_FILE
Number of log files to preserve.
For example, GV_LOG_FILES=5
GV_LOG_FILES
Log file size.
For example, GV_LOG_SIZE=10 * 1024 * 1024#10MB
GV_LOG_SIZE
Statistics collected during last 300 seconds.GV_STATS_INTERVAL=300
Traps generated are logged in the /var/log/snmp/trap file on the active Policy Director (LB).
Notifications and Alerting (Traps)The CPS/MOGMonitoring andAlert Notification framework provides the following SNMP notification traps(one-way). Traps are either proactive or reactive. Proactive traps are alerts based on system events or changes
CPS MOG SNMP, Alarms, and Clearing Procedures Guide, Release 13.1.0 11
Monitoring and Alert NotificationThreshold based KPI Alarms

that require attention (for example, Disk is filling up). Reactive traps are alerts that an event has alreadyoccurred (for example, an application process failed).
For example, if a threshold is crossed snmpd throws a trap to LBVIP on the internal network on port 162. Onthe Policy Director (load balancer) the snmptrapd process is listening on port 162. When snmptrapd sees trapon 162 it logs it in the file /var/log/snmp/trap and throws it again on corporate_nms_ip on port 162.This corporate NMS IP is set inside /etc/hosts file on LB01 and LB02.
Component NotificationsComponents are devices that make up the CPS system. These are systems level traps. They are generatedwhen some predefined thresholds are crossed. User can define these thresholds in/etc/snmp/snmpd.conf.For example, for disk full, low memory etc. The snmpd process runs on all VMs. When the process is started,it applies the configuration from /etc/snmp/snmpd.conf file. In order to apply changes to snmpd.conffile, snmpd needs to be restarted by executing the following commands:
monit stop snmpd
monit start snmpd
Component notifications are defined in the BROADHOP-NOTIFICATION-MIB as follows:broadhopQNSComponentNotification NOTIFICATION-TYPEOBJECTS { broadhopComponentName,broadhopComponentTime,broadhopComponentNotificationName,broadhopNotificationFacility,broadhopNotificationSeverity,broadhopComponentAdditionalInfo }
STATUS currentDESCRIPTION "Trap from any QNS component - i.e. device.
"::= { broadhopProductsQNSNotifications 1 }
CPS MOG SNMP, Alarms, and Clearing Procedures Guide, Release 13.1.012
Monitoring and Alert NotificationComponent Notifications

Table 8: Component Notifications
FeatureSeverityNotification Name
ComponentwarningDiskFull
Message Text: <diskPath>: less than <n>% free (= $USED_SPACE%)
Description: Current disk usage has passed a designated threshold. By default,this threshold is set to 10% of total disk space allocated for the partition. Thisthreshold is defined in /etc/snmp/snmpd.conf on each VM.
This situation could be a sign of logs or database files growing large.
For new deployments, this alarm is generated for following file systems indifferent VMs:
• For HA System:
◦pcrfclient/lb: /
◦sessionmgr: /, /var/data/session.1
◦qns: /
• For AIO System:
◦/
For upgrades from 7.x system, this alarm is generated for following file systemsin different VMs:
• For HA System:
◦pcrf/lb: /, /var, /boot
◦sessionmgr: /, /home, /boot, /data, /var/data/session.1
◦qns: /, /home, /var, /boot
• For AIO System:
◦/
◦/boot
Componentclear
CPS MOG SNMP, Alarms, and Clearing Procedures Guide, Release 13.1.0 13
Monitoring and Alert NotificationComponent Notifications

FeatureSeverityNotification Name
Message Text: <diskPath>: clear
Description: The disk usage has recovered from the designated threshold.
For new deployments, this alarm is generated for following file systems indifferent VMs:
• For HA System:
◦pcrfclient/lb: /
◦sessionmgr: /, /var/data/session.1
◦qns: /
• For AIO System:
◦/
For upgrades from 7.x system, this alarm is generated for following file systemsin different VMs:
• For HA System:
◦pcrf/lb: /, /var, /boot
◦sessionmgr: /, /home, /boot, /data, /var/data/session.1
◦qns: /, /home, /var, /boot
• For AIO System:
◦/
◦/boot
Operating SystemwarningLowSwap
Message Text: Running out of swap space ($FreeAvailableSwap)
Description: Current swap usage has passed a designated threshold. This is awarning.
Operating Systemclear
Message Text: Swap space recovered
Description: Current swap usage has recovered a designated threshold.
CPS MOG SNMP, Alarms, and Clearing Procedures Guide, Release 13.1.014
Monitoring and Alert NotificationComponent Notifications

FeatureSeverityNotification Name
Componentwarning (1 minute)
warning (5 minute)
alert (15 minutes)
HighLoad
Message Text:
1 min Load Average too high (= n.nn)
5 min Load Average too high (= n.nn)
15 min Load Average too high (=n.nn)
Description: The load average of the system has exceeded the configuredthreshold for a period of 1/5/15 minutes.
The default threshold value is 1.5 * Number of vCPUs (allocated to VM) foreach time period as defined in /etc/snmp/snmpd.conf file.
The value must be integer.
Componentclear
Message Text:
Load-1 High load recovered
Load-5 High load recovered
Load-15 High load recovered
Description: The load average has recovered from more than configuredthreshold.
Operating SystemalertLinkDown
Message Text: IF-MIB::linkDown <Interface Name>
Description: Not able to connect or ping to the interface. This alarm getsgenerated for all physical interface attached to the system.
Operating SystemclearLinkUp
Message Text: IF-MIB::linkUp <Interface Name>
Description: Able to ping or connect to interface. This alarm gets generated forall physical interface attached to the system.
Operating SystemcriticalLow Memory Alert
Message Text: Current Available Free Memory (total free memory) is less thanthreshold (Threshold memory) on $HOSTNAME
Description: The amount of free memory on the VM has dropped below thedefault threshold of 10% (as a percentage of total memory). To change the defaultthreshold, see Configure Low Memory Threshold, on page 17.
CPS MOG SNMP, Alarms, and Clearing Procedures Guide, Release 13.1.0 15
Monitoring and Alert NotificationComponent Notifications

FeatureSeverityNotification Name
Operating SystemclearLow Memory Clear
Message Text: Current Available Free Memory (total free memory) is greaterthan threshold (Threshold memory) on $HOSTNAME
Description: Low memory alert has been cleared.
ComponentcriticalProcessDown
Message Text: ${PROCESS_NAME} process is down
For example, corosync process is down
Description: This alarm is generated when the corosync process is stopped orfails. The corosync process manages the virtual IPs between the CPS loadbalancers in HA and GR deployments.
ComponentclearProcessUp
Message Text: ${PROCESS_NAME} process is up
For example, corosync process is up
Description:The alarm is cleared whenever the corosync process that was downis brought back up.
ComponentcriticalHIGH CPU USAGEAlert
Message Text: CPU Usage is higher than threshold on`hostname`.Threshold=$Threshold%,Current_LOAD=$Current%
Description: This trap is generated whenever CPU usage on any VM is detectedto be higher than the alert threshold value. The system monitors the CPU usageat a specific instant (every 60 second by default), and not over a period of timelike for the HighLoad Alert. To change the default threshold or the interval atwhich the CPU usage is checked, see Configure High CPU Usage AlarmThresholds and Interval Cycle, on page 17
ComponentclearHIGH CPU USAGEClear
Message Text: CPU Usage is below than lower threshold value on`hostname`.Threshold=$Threshold%,Current_LOAD=$Current%
Description: This trap is generated whenever CPU usage on any VM is lowerthan the clear threshold value. It is generated only when High CPU Usage Alertwas generated earlier for the VM.
Each Component Notification contains:
• Name of the Notification being thrown (broadhopComponentNotificationName)
• Name of the device throwing the notification (broadhopComponentName)
CPS MOG SNMP, Alarms, and Clearing Procedures Guide, Release 13.1.016
Monitoring and Alert NotificationComponent Notifications

• Time the notification was generated (broadhopComponentTime)
• Facility or which layer the notification came from (broadhopNotificationFacility)
• Severity of the notification (broadhopNotificationSeverity)
• Additional information about the notification, which might be a bit of log or other information.
Component Notifications that CPS generates are shown in the following list. Any component in the CPSsystem may generate these notifications.
Configure Low Memory ThresholdBy default the LowMemory Alert is generated when the available memory of any CPS VM drops below 10%of the Total Memory. To change the default threshold:
Step 1 Modify the following parameter in the Configuration worksheet of the CPS Deployment template spreadsheet.The CPS Deployment template can be found on the Cluster Manager VM:
/var/qps/install/current/scripts/deployer/templates/QPS_deployment_config_template.xlsm
• free_memory_per_alert: Enter a value (0.0-1.0) for the alert threshold. The system will generate an Alert trapwhenever the available memory falls below this percentage of total memory for any given VM. Default 0.10 (10%free of the total memory).
• free_memory_per_clear: Enter a value (0.0-1.0) for the clear threshold. The system will generate a low memoryclear trap whenever available memory for any given VM is more than 30% of total memory. Default 0.3 (30% ofthe total memory).
Step 2 Follow the steps in the Update the VM Configuration without Re-deploying VMs section of the CPS Installation Guidefor VMware to push the new settings out to all CPS VMs.
Configure High CPU Usage Alarm Thresholds and Interval CycleTo change the default threshold values and interval cycle for the High CPU Usage traps and apply the newvalues to all CPS VMs:
Step 1 Modify the following parameters in the Configuration worksheet of the CPS Deployment template spreadsheet.The CPS Deployment template can be found on the Cluster Manager VM:
/var/qps/install/current/scripts/deployer/templates/QPS_deployment_config_template.xlsm
The alert threshold must be set higher than the clear threshold.Note
• cpu_usage_alert_threshold: Enter an integer (0-100) for the alert threshold value. The systemwill generate an Alerttrap whenever the CPU usage is higher than this value. Default 80.
CPS MOG SNMP, Alarms, and Clearing Procedures Guide, Release 13.1.0 17
Monitoring and Alert NotificationComponent Notifications

• cpu_usage_clear_threshold: Enter an integer (0-100) for the clear threshold value. The systemwill generate a Cleartrap whenever the CPU usage is lower than this value and alert trap already generated. Default 40.
• cpu_usage_trap_interval_cycle: Enter an integer value to be used as an interval period to execute the CPU usagetrap script. The interval value in seconds is calculated by multiplying 5 with the given value.
The default cpu_usage_trap_interval_cycle value is 12 which means the script will get executed every 60 seconds.
Step 2 Follow the steps in the Update the VM Configuration without Re-deploying VMs section of the CPS Installation Guidefor VMware to push the new settings out to all CPS VMs.
Application NotificationsApplications are running processes on a component device that make up the CPS/MOG system. These areapplication level traps. CPS/MOG processes (starting with word java when we run "ps -ef") and some scripts(for GR traps) generates these traps.
Application notifications are defined in the BROADHOP-NOTIFICATION-MIB as follows:broadhopQNSComponentNotification NOTIFICATION-TYPEOBJECTS { broadhopComponentName,broadhopComponentTime,broadhopComponentNotificationName,broadhopNotificationFacility,broadhopNotificationSeverity,broadhopComponentAdditionalInfo }
STATUS currentDESCRIPTION "Notification Trap from any QNS component - i.e. runtime"::= { broadhopProductsQNSNotifications 2 }
Each Application Notification contains:
• Name of the Notification being thrown (broadhopComponentNotificationName)
• Name of the device throwing the notification (broadhopComponentName)
• Time the notification was generated (broadhopComponentTime)
• Facility or which layer the notification came from (broadhopNotificationFacility)
• Severity of the notification (broadhopNotificationSeverity)
• Additional information about the notification, which might be a bit of log or other information.
Currently, third site arbiter supports only Arbiter Down and Arbiter Up traps.Important
Application Notifications that CPS generates are shown in the following list. Any component in the CPSsystem may generate these notifications.
CPS MOG SNMP, Alarms, and Clearing Procedures Guide, Release 13.1.018
Monitoring and Alert NotificationApplication Notifications

Table 9: Application Notifications
FeatureMessage TextSeverityNotification Name
ApplicationMemcached server is in error
OR some exception generatedmessage.
%s is the exception that occurred.
Error
Critical
MemcachedConnectError
Generated if attempting to connect to or write to the memcached servercauses an exception.
ApplicationMemcached server is operational.Clear
Generated if successfully connect to or write to the memcached server.
ApplicationFeature %s is unable to start. Error%s
AlertApplicationStartError
Generated if an installed feature cannot start.
Applicationbefore Feature %s is RunningClear
Generated if an installed feature successfully started.
ApplicationSession Count License Usage at:xxx%, threshold is:xxx%
Critical, Error,
Minor,Warning
(Configurable)
LicenseUsage Threshold Exceeded
The number of sessions on the system has exceeded the configuredthreshold of sessions allowed by the current license.
The threshold value and alarm severity of this alarm is configurable inPolicy Builder: Click Fault List in the navigation pane, then create anew fault list or edit the existing fault list. By default, the threshold isset to 90%.
ApplicationSession Count License Usage at:xxx%, exceeding threshold:xxx%
Clear
The number of sessions on the system is below the configured thresholdof sessions allowed by the current license.
CPS MOG SNMP, Alarms, and Clearing Procedures Guide, Release 13.1.0 19
Monitoring and Alert NotificationApplication Notifications

FeatureMessage TextSeverityNotification Name
ApplicationSession creation is not allowedCriticalLicensedSessionCreation
A predefined threshold of sessions covered by licensing has been passed.This is a warning and should be reported. License limits may need tobe increased soon. This message can be generated by an invalid license,but the AdditionalInfo portion of the notification shows root cause.
ApplicationSession creation is allowedClear
The number of sessions are below the predefined threshold of sessionscovered by licensing.
Application"core license is Invalid. No CoreLicense found. Please install corelicense"
EmergencyInvalidLicense
The system license currently installed is not valid. This prevents systemoperation until resolved. This is possible if no license is installed or ifthe current license does not have core feature in it.
Applicationxxx license is Invalid %sEmergency
This alarm is generated when feature license is not installed for aparticular feature. For example, if RADIUS feature is installed and thelicense for the same is not installed, then this alarm is generated.
Applicationxxx is Expired %sCritical
License has expired.
Applicationxxx license will Expire Soon %sError
License is going to expire soon.
Applicationxxx has exceeded the allowedparameters%s
Critical
License has exceeded the allowed parameters.
Applicationxxx is nearing the allowedparameters %s
Error
Radius AAA proxy server is reachable.
Applicationlicense is ValidClear
License is valid.
CPS MOG SNMP, Alarms, and Clearing Procedures Guide, Release 13.1.020
Monitoring and Alert NotificationApplication Notifications

FeatureMessage TextSeverityNotification Name
Application“Last policy configuration failedwith the following message:xxx”
ErrorPolicyConfiguration
A change to system policy structure has failed. The AdditionalInfoportion of the notification contains more information. The systemtypically remains in a proper state and continues core operations. Eithermake note of this message or investigate more fully.
Application“Last policy configuration wassuccessful”
Clear
A change to system policy structure has passed.
Application“Policies not configured”EmergencyPoliciesNotConfigured
The policy engine cannot find any policies to apply while starting up.This may occur on a new system, but requires immediate resolution forany system services to operate.
Application“Policies successfully configured”Clear
The policy engine has successfully configured all the policies whilestarting up.
Application3001: Host $HOST Realm:$REALM is down
ErrorDiameterPeerDown
Diameter peer is down.
Application3001: Host $HOST Realm:$REALM is back up
Clear
Diameter peer is up.
Application3002:Realm: $REALM all peersare down
CriticalDiameterAllPeersDown
All Diameter peer connections configured in a given realm are DOWN(i.e. connection lost). The alarm identifies which realm is down. Thealarm is cleared when at least one of the peers in that realm is available.
Application3002:Realm: $REALM peers areup
Clear
The Diameter peer connections configured in a given realm are up.
CPS MOG SNMP, Alarms, and Clearing Procedures Guide, Release 13.1.0 21
Monitoring and Alert NotificationApplication Notifications

FeatureMessage TextSeverityNotification Name
Application3004:Error starting diameter stack:<stack uri>. Reason: <errormessage>
CriticalDiameterStackNotStarted
This alarm is generated when Diameter stack cannot start on a particularpolicy director (load balancer) due to some configuration issues.
Application3004:Stack <stack uri> is running.Clear
The Diameter stack has started successfully.
Application“Failed ping on XXX”ErrorRadiusServer Down
Radius AAA proxy server is unreachable.
Application“Successfully pinged %s in %msms”
ClearRadiusServer Up
Radius AAA proxy server is reachable.
ApplicationHA Failover done from %s to %sof
${SET_NAME}-SET
$Loop
CriticalHA Failover
The primary role of the replica set has been failed over to anothermember.
ApplicationGeo Failover done from %s to %sof
${SET_NAME}-SET
$Loop
CriticalGR Failover
The primary role of the replica set has been failed over to anothermember.
ApplicationAll replicas of${SET_NAME}-SET$Loop aredown
CriticalAll DB Member of replica setDown
Not able to connect to any member of the replica set.
ApplicationAll replicas of${SET_NAME}-SET$Loop areup
ClearAll DB Member of replica set Up
Able to connect to all members of the replica set.
CPS MOG SNMP, Alarms, and Clearing Procedures Guide, Release 13.1.022
Monitoring and Alert NotificationApplication Notifications

FeatureMessage TextSeverityNotification Name
ApplicationUnable to find primary memberfor Replica-set${SET_NAME}-SET$Loop
CriticalNo Primary DB Member Found
Unable to find primary member for the replica-set.
Applicationfound primary member forReplica-set${SET_NAME}-SET$Loop
ClearPrimary DB Member Found
Found primary member for the replica-set.
Application%machinename: DB Member%member_ip:%port of SET $SETis down
CriticalDB Member Down
A secondary member of the replica set is down.
Application%machinename: DB Member%member_ip:%port of SET $SETis up
ClearDB Member Up
A secondary member of the replica set has come back up.
ApplicationArbiter%member_ip:%mem_port(%mem_hostname) of SET $SETis down
CriticalArbiter Down
The arbiter member of the replica set is not reachable.
ApplicationArbiter%member_ip:%mem_port(%mem_hostname) of SET $SETis up
ClearArbiter Up
The arbiter member of the replica set is functional.
ApplicationResync is needed for secondarymember
$setRepl:$SET_NAME:
$DB_MEMBER
CriticalDB resync is needed
Generatedwhenever amanual resynchronization of a database is requiredto recover from a failure.
CPS MOG SNMP, Alarms, and Clearing Procedures Guide, Release 13.1.0 23
Monitoring and Alert NotificationApplication Notifications

FeatureMessage TextSeverityNotification Name
ApplicationResync is not needed for secondarymember
$setRepl:$SET_NAME:
$DB_MEMBER
ClearDB resync is not needed
Generated whenever a database changes to 'Good' state from 'Resyncis needed' state, it indicates that the database's resynchronization hascompleted.
ApplicationConfig Server%member_ip:%mem_port(%mem_hostname) of SET $SETis down
CriticalConfig Server Down
The configuration server for the replica set is unreachable. Not validfor non-sharded replica sets.
ApplicationConfig Server%member_ip:%mem_port(%mem_hostname) of SET $SETis up
ClearConfig Server Up
The configuration server for the replica set is reachable. Not valid fornon-sharded replica sets.
Applicationunable to connect %member_ip(%member) VM. It is notreachable.
CriticalVM Down
The administrator is not able to ping the VM.
ApplicationConnected %member_ip(%member) VM. It is reachable.
ClearVM Up
The administrator is able to ping the VM.
Application%machinename: %server serveron %vm vm is down
CriticalQNS Process Down
Policy Server (QNS) java process is down.
Application%machinename: %server serveron %vm vm is up
ClearQNS Process Up
Policy Server (QNS) java process is up.
CPS MOG SNMP, Alarms, and Clearing Procedures Guide, Release 13.1.024
Monitoring and Alert NotificationApplication Notifications

FeatureMessage TextSeverityNotification Name
Applicationroot user logged in on %hostnameterminal %terminal from machine%from_system at %time
InfoAdmin User Logged in
root user logged in on %hostname terminal.
ApplicationUsing Developer mode(100session limit).
To use a license file, remove
-Dcom.broadhop.developer.
mode from /etc/broadhop/qns.conf
ErrorDeveloperMode
Generated if developer mode is configured in qns.conf file.
ApplicationRemoved-
Dcom.broadhop.developer.
mode from /etc/broadhop/qns.conf
Clear
Generated if developer mode is removed in qns.conf file.
ApplicationZMQ Connection Down fortcp://%s:%d
ErrorZeroMQConnectionError
Internal services cannot connect to a required Java ZeroMQ queue.Although retry logic and recovery is available, and core system functionsshould continue, investigate and remedy the root cause.
ApplicationZMQ Connection Up fortcp://%s:%d
Clear
Internal services can connect to a required Java ZeroMQ queue.
Application%INTERFACE: unable to connect(lbvip01/lbvip02). Not reachable
AlertVirtualInterface Down
Not able to ping the virtual Interface. This alarm gets generated forlbvip01, lbvip02.
Application%INTERFACE: (lbvip01/lbvip02)is up
ClearVirtualInterface Up
Successfully ping the virtual Interface. This alarm gets generated forlbvip01, lbvip02.
CPS MOG SNMP, Alarms, and Clearing Procedures Guide, Release 13.1.0 25
Monitoring and Alert NotificationApplication Notifications

FeatureMessage TextSeverityNotification Name
Application1201:LDAP connection downErrorLDAPAllPeersDown
All LDAP peers are down.
Application1201:LDAP connection upClear
LDAP connection is up.
Application1202:<IP Address of the LDAPserver>:LDAP connection down
ErrorLDAPPeerDown
LDAP peer identified by the IP address is down.
Application1202:<IP Address of the LDAPserver>:LDAP connection up
Clear
LDAP peer identified by the IP address is up.
ApplicationPercentage of LDAP retriescompared to total LDAP Queriesexceeded to <%threshold> on<qnsXX> VM.
CriticalPercentage of LDAP retrythreshold Exceeded
This alarm indication is generated for LDAP search queries when LDAPretries compared to total LDAP queries exceeds 10% on qnsXX VM.
Default Threshold: 10%
The LDAP server Retry Count parameter must be set to a valuegreater than 1 for this alarm to be generated. In Policy Buildernavigate to Plugin Configuration > LDAP Configuration >LDAP Server Configuration > Retry Count.
Note
ApplicationPercentage of LDAP retriescompared to total LDAP Queriesnormal to <%threshold> on<qnsXX> VM.
ClearPercentage of LDAP retrythreshold Normal
This clear indication is generated for LDAP search queries when LDAPretries copmared to total LDAP queries is normal or has fallen belowthe threshold value (10%) on qnsXX VM.
ApplicationLDAP Requests as percentage ofCCR-I dropped to <%threshold>on qnsXX VM.
CriticalLDAP Requests as percentage ofCCR-I Dropped
This alarm indication is generated for LDAP operations when LDAPrequests as percentage of CCR-I (Gx messages) drops below 25% onqnsXX VM.
Default Threshold: 25%
CPS MOG SNMP, Alarms, and Clearing Procedures Guide, Release 13.1.026
Monitoring and Alert NotificationApplication Notifications

FeatureMessage TextSeverityNotification Name
ApplicationLDAP Requests as percentage ofCCR-I normal to <%threshold> onqnsXX VM.
ClearLDAP Requests as percentage ofCCR-I Normal
This clear indication is generated for LDAP operations when LDAPrequests as a percentage of CCR-I messages is normal or above the 25%threshold on qnsXX VM.
ApplicationLDAP Requests dropped to<threshold value> on lbXX VM.
CriticalLDAP Request Dropped
This alarm indication is generated for LDAP operations when LDAPrequests drop below 0 on lbXX VM.
Default Threshold: 0
ApplicationLDAP Requests normal to<threshold value> on lbXX VM.
ClearLDAP Requests Normal
This clear indication is generated for LDAP operations when LDAPrequests are normal (above 0) on lbXX VM.
ApplicationLDAP Query Result dropped to<threshold value> on qnsXXVM.
CriticalLDAP Query Result Dropped
This alarm indication is generated when LDAP Query Result goes to 0on qnsXX VM.
Default Threshold: 0
ApplicationLDAP Query Result normal to<threshold value> on qnsXXVM.
ClearLDAP Query Result Normal
This clear indication is generated when LDAPQuery Result goes above0 (above the threshold value) on qnsXX VM.
ApplicationGx Message <Gx message Type>dropped to <%threshold> on<qnsXX> VM.
CriticalGx Message processing Dropped
This alarm indication is generated for Gx Message CCR-I, CCR-U andCCR-Twhen processing of messages drops below 95% on qnsXXVM.
The 95% refers to the percentage of responses to the requests within a60 second period of time.
For example, in 60 sec if you receive 100 requests and send 95 responsesthen your percentage would be 95%.
Default threshold: 95%
CPS MOG SNMP, Alarms, and Clearing Procedures Guide, Release 13.1.0 27
Monitoring and Alert NotificationApplication Notifications

FeatureMessage TextSeverityNotification Name
ApplicationGx Message <Gx message Type>normal to <%threshold> on<qnsXX> VM.
ClearGx Message processing Normal
This clear indication is generated for Gx Message CCR-I, CCR-U andCCR-T when processing of messages is equal or above 95% on qnsXXVM.
ApplicationGx averageMessage <GxmessageType> processing dropped to<threshold value>ms on<qnsXX>VM.
CriticalGx Average Message processingDropped
This alarm indication is generated for Gx Message CCR-I, CCR-U andCCR-T when average message processing is above 20ms on qnsXXVM.
Default Threshold: 20ms
ApplicationGx averageMessage <GxmessageType> processing normal to<threshold value>ms on<qnsXX>VM.
ClearGx Average Message processingNormal
This clear indication is generated for Gx Message CCR-I, CCR-U andCCR-T when average message processing is equal or below 20ms onqnsXX VM.
Application<VMName>:5002: <VMName>:All SMSC servers not reachable
CriticalAll SMSC server
connections are down
None of the SMSC servers configured are reachable. This Critical Alarmgets generated when the SMSC Server endpoints are not available tosubmit SMS messages thereby blocking SMS from being sent fromCPS.
Application<VMName>:5002: <VMName>:At least one SMSC server isreachable
ClearAtleast one SMSC
server connection is up
This alarm (Clear) gets generated when at least one configured SMSCendpoint server is reachable after a state where none were reachablefrom the mconfigured list of server endpoints.
CPS MOG SNMP, Alarms, and Clearing Procedures Guide, Release 13.1.028
Monitoring and Alert NotificationApplication Notifications

FeatureMessage TextSeverityNotification Name
Application<VMName>:5001:<SMSCServerAddress>:<SMSC Port>: SMSCServer not reachable
ErrorSMSC server
connection down
SMSC Server is not reachable. This alarm gets generated when any oneof the configured active SMSC server endpoints is not reachable andCPS will not be able to deliver a SMS via that SMSC server.
Application<VMName>:5001:<SMSCServerAddress>:<SMSC Port>: SMSCServer reachable
ClearSMSC server
connection up
This alarm (Clear) gets generated when an earlier unreachable SMSCendpoint is now reachable.
Application<VMName>:5004: <VMName>:All Email Servers not reachable
CriticalAll Email Servers
not reachable
No email server is reachable. This alarm (Critical) gets generated whenall configured Email Server Endpoints are not reachable, blockinge-mails from being sent from CPS.
Application<VMName>:5004: <VMName>:At least one Email server isreachable
ClearAt least one Email
server is reachable
At least one email server is reachable.
Application<VM Name>:5003:<Mail ServerAddress>:<SMTP Port>: EmailServer not reachable
ErrorEmail Server
not reachable
Email server is not reachable. This alarm gets generated when any ofthe configured Email Server Endpoints are not reachable. CPS will notbe able to use the server to send e-mails.
Application<VM Name>:5003:<Mail ServerAddress>:<SMTP Port>: EmailServer reachable
ClearEmail Server
reachable
Email server is reachable. This alarm (Clear) gets generated when anearlier unreachable Email server endpoint is now reachable.
CPS MOG SNMP, Alarms, and Clearing Procedures Guide, Release 13.1.0 29
Monitoring and Alert NotificationApplication Notifications

All the above mentioned Notification names except the following are supported for MOG:Note
• RadiusServerDown/Up
• LdapAllPeersDown
• LdapPeerDown
• Percentage of LDAP retry threshold Exceeded/Normal
• LDAP Requests as percentage of CCR-I Dropped/Normal
• LDAP Request Dropped/Normal
• LDAP Query Result Dropped/Normal
• Gx Message processing Dropped/Normal
• Gx Average Message processing Dropped/Normal
• All SMSC server connections are down
• Atleast one SMSC server connection is up
• SMSC server connection up/down
• All Email servers not reachable
• At least one Email server is reachable
• Email server is reachable
• Email server is not reachable
Configuration to Generate Invalid License Trap
If you change a previously installed valid license and make it invalid, the system will not generate anytrap. As system is not monitoring the license files, instead it checks the license entries present in admindatabase. If the database entries are correct, system will not generate any trap.
Note
Step 1 To generate invalid license trap we need to configure the following parameter in /etc/broadhop/qns.conf file.-Dcom.cisco.enforcementfree.mode=false
When com.cisco.enforcementfree.mode is configured as false in addition to license has not been verifiedyet/license is invalid/has exceeded the allowed parameters following traps will be generated:
Note
• is Expired
• will expire soon
• is nearing the allowed parameters
The traps will be generated only when license expiry date is set in license file.
CPS MOG SNMP, Alarms, and Clearing Procedures Guide, Release 13.1.030
Monitoring and Alert NotificationApplication Notifications

Step 2 After adding the above entry in qns.conf file execute copytoall.sh to synchronize the configuration changes to allVMs in the CPS cluster:copytoall.sh /etc/broadhop/qns.conf /etc/broadhop/qns.conf
Step 3 After modifying the configuration file to make the changes permanent for future use (when any VM is redeployed orrestarted) rebuild etc.tar.gz./var/qps/install/current/scripts/build/build_etc.sh
Step 4 Restart the CPS service./var/qps/bin/control/restartall.sh
Unknown Application EventsAll of the alarms generated by different VMs are received by the Policy Director (load balancer) VMs.
On the Policy Director VMs a script called application_trapv1_convert processes the received alarms andgenerates the new alarm based on the received information and sends it to the external NMS. Unknown alarmscan come when application_trapv1_convert is not able to process the received alarm. In this case it willgenerate one of the below seven unknown alarms.
Table 10: Unknown Application Events
FacilitySeverityName
—NoneApplicationEvent
—NoneDBEvent
—NoneFailoverEvent
—NoneProcessEvent
—NoneVMEvent
ApplicationNoneNone
NoneNoneUnKnown
Any unknown alarms should get reported to engineering team to take necessary action against it. Providethe alarm log (/var/log/snmp/trap) from the active Policy Director (load balancer) VMs with theticket number.
Note
CPS MOG SNMP, Alarms, and Clearing Procedures Guide, Release 13.1.0 31
Monitoring and Alert NotificationApplication Notifications

Configuration and UsageAll access to system statistics and KPIs should be collected via SNMP gets and walks from the routable IPof the VM. NMS sends the snmpwalk or snmpget request to the routable IP of the VM and gets the response.NMS should know the routable IP addresses of all the VMs available in the setup. System Notifications aresourced from lbvip01.
User can also configure snmpRouteLan: parameter which contains the value of a VLAN name which can beused to access the KPIs value provided by SNMP. For more information on the parameter, refer to the CPSInstallation Guide for VMware or in the CPS Installation Guide for OpenStack.
Configuration for SNMP Gets and WalksBy default, SNMPv3 gets and walks can be performed against the routable/public IP addresses of the VMswith the default read-only community string of "broadhop" using standard UDP port 161.
If you want to use SNMPv2 as gets and walks, you need to change the snmpv3_enable to FALSE.
For more information on SNMP related parameters, refer to general configuration section in theCPS InstallationGuide for VMware or in the CPS Installation Guide for OpenStack for this release.
Configuration for Notifications (traps)Notifications are logged locally on the Policy Director (load balancer) VMs in the /var/log/snmp/trapfile as well as forwarded to the NMS destination defined during the installation of CPS.
By default traps are sent to the NMS using the SNMPv2 community string of "broadhop". The standard SNMPUDP trap port of 162 is also used. Both of these values may be changed to accommodate the upstream NMS.
If SNMPv3 is enabled, Component Notifications will be sent to NMS via SNMPv3. ApplicationNotifications will be send via SNMPv2.
Note
To change the trap community string for SNMPv2:
1 Configure the snmp_trap_community in Configuration excel sheet on the Cluster Manager VM. For moreinformation, refer to the Cisco Policy Suite Installation Guide for VMware for this release. For example:snmp_trap_community cisco
2 Execute the following command to import csv files into the Cluster Manager VM:/var/qps/install/current/scripts/import/import_deploy.sh
This script converts the data to JSON format and outputs it to/var/qps/config/deploy/import/json/.
3 Execute reinit.sh script to apply the changes to all VMs in the network./var/qps/install/current/scripts/upgrade/reinit.sh
To change the destination trap port from 162:
CPS MOG SNMP, Alarms, and Clearing Procedures Guide, Release 13.1.032
Monitoring and Alert NotificationConfiguration and Usage

1 To make this change the /etc/snmp/snmptrapd.conf file needs to be modified on both lb01 andlb02. In these files append a colon and the destination port to each line containing corporate_nms_ip.There are a total of 12 lines in each file.For example if the NMS destination port were 1162, the line:
traphandle DISMAN-EVENT-MIBmteTriggerFired
/etc/snmp/scripts/component_trap_convert corporate_nms_ip
becomes
traphandle DISMAN-EVENT-MIBmteTriggerFired
/etc/snmp/scripts/component_trap_convert corporate_nms_ip1162
2 After these changes, save the file and restart the snmptrapd service to enable changes. Run monit restart
snmptrapd from both Policy Director VMs.
Cluster Manager KPI and SNMP ConfigurationThis section describes the steps to enable SNMP traps and KPI monitoring of the Cluster Manager so that thecustomer NMS can monitor the following KPIs:
• Memory usage
• Disk usage
• CPU
• Disk IO
KPIs are reported and recorded on the pcrfclient in the /var/broadhop/stats file.
SNMP traps are forwarded to lb01/lb02 and lb01/lb02 forwards the traps to the configured NMS servers inthe system.
The following traps are supported for Cluster Manager:
• DiskFull
• HighLoad
• Interface Up/Down
• Swap Usage
Install NET-SNMPTo install NET-SNMP perform the following steps:
Step 1 On the Cluster Manager VM, execute the following command to install NET-SNMP package:yum install --assumeyes --disablerepo=QPS-Repository --enablerepo=QPS-local net-snmp
Step 2 To enable run levels for SNMP, execute the following command:chkconfig --level 2345 snmpd on
CPS MOG SNMP, Alarms, and Clearing Procedures Guide, Release 13.1.0 33
Monitoring and Alert NotificationCluster Manager KPI and SNMP Configuration

SNMPD Configuration
The SNMP configuration mentioned in the following sections is not supported for third site arbiter.
If firewall is configured on Cluster Manager VM, then check if it contains entries for 161 and162 ports.
If the entries for 161 and 162 ports are not there, execute the following command:
iptables -A INPUT -i eth0 -p udp -m multiport --ports 161,162 -m comment --comment "100
allow snmp access" -j ACCEPT
Check whether IPv6 tables is running and 161 and 162 ports are not there. If the ports are not displayed,then execute the following command:
ip6tables -A INPUT -i eth0 -p udp -m multiport --ports 161,162 -m comment --comment
"100-6 allow snmp access" -j ACCEPT
Note
For SNMPv2
1 Add the following content to /etc/snmp/snmpd.conf file on the Cluster Manager:
com2sec local localhost <snmp_trap_community>com2sec6 local localhost <snmp_trap_community>rocommunity <snmp_ro_community>rocommunity6 <snmp_ro_community>group MyRWGroup v1 localgroup MyRWGroup v2c localview all included .1 80access MyRWGroup "" any noauth exact all all nonesyslocation Unknown (edit /etc/snmp/snmpd.conf)syscontact Root (configure /etc/snmp/snmp.local.conf)master agentsagentAddress udp:161,udp6:161
trapcommunity <snmp_trap_community>agentSecName memerouser meme
# Send all traps upstream - Don't change this password or it breaks the framework.# v1 and v2 traps _could_ be sent for all but only need v2 trap.trap2sink lbvip02 <snmp_trap_community>
############ Local Stats#ignoreDisk /procignoreDisk /proc/sys/fs/binfmt_miscignoreDisk /var/lib/nfs/rpc_pipefsignoreDisk /dev/shmignoreDisk /dev/ptsdisk / 10%
swap 102400
load 6 6 6
CPS MOG SNMP, Alarms, and Clearing Procedures Guide, Release 13.1.034
Monitoring and Alert NotificationCluster Manager KPI and SNMP Configuration

#linkUpDownNotifications yes
notificationEvent linkUpTrap linkUp ifIndex ifAdminStatus ifOperStatusnotificationEvent linkDownTrap linkDown ifIndex ifAdminStatus ifOperStatus
monitor -S -u meme -r 60 -e linkUpTrap -o ifDescr "Generate linkUp" ifOperStatus != 2monitor -u meme -r 60 -e linkDownTrap -o ifDescr "Generate linkDown" ifOperStatus == 2
# Note: alert!=0, clear==0 and messages must be unique or snmpd errors.monitor -u meme -r 60 -o dskPath -o dskErrorMsg "DiskFullAlert" dskErrorFlag != 0monitor -S -u meme -r 60 -o dskPath -o dskErrorMsg "DiskFullClear" dskErrorFlag == 0monitor -u meme -r 60 -o memErrorName -o memSwapErrorMsg "LowSwapAlert" memSwapError !=0monitor -S -u meme -r 60 -o memErrorName -o memSwapErrorMsg "LowSwapClear" memSwapError== 0monitor -u meme -r 60 -o laNames -o laErrMessage "HighLoadAlert" laErrorFlag != 0monitor -S -u meme -r 60 -o laNames -o laErrMessage "HighLoadClear" laErrorFlag == 0
############ BROADHOP-QNS-MIB Proxy Configuration############ proxy -v <version> -c <community> <local_host> <map_to> <map_from>## NOTE: Most values are listed twice. This is to cover the snmp get requirement# for scalar values. Snmp get for scalar values (ie. not a table) is# required to return for both x.y OID and .x.y.0 OID values. This only# effects <map_to> values.
############ System Stats#
## LB## User, System and Idle CPU (UCD-SNMP-MIB ss)
proxy -v 2c -c <snmp_ro_community> localhost .1.3.6.1.4.1.26878.200.3.2.70.1.1.0.1.3.6.1.4.1.2021.11.9.0proxy -v 2c -c <snmp_ro_community> localhost .1.3.6.1.4.1.26878.200.3.2.70.1.2.0.1.3.6.1.4.1.2021.11.10.0proxy -v 2c -c <snmp_ro_community> localhost .1.3.6.1.4.1.26878.200.3.2.70.1.3.0.1.3.6.1.4.1.2021.11.11.0proxy -v 2c -c <snmp_ro_community> localhost .1.3.6.1.4.1.26878.200.3.2.70.1.1.1.3.6.1.4.1.2021.11.9.0proxy -v 2c -c <snmp_ro_community> localhost .1.3.6.1.4.1.26878.200.3.2.70.1.2.1.3.6.1.4.1.2021.11.10.0proxy -v 2c -c <snmp_ro_community> localhost .1.3.6.1.4.1.26878.200.3.2.70.1.3.1.3.6.1.4.1.2021.11.11.0# 1, 5 and 15 Minute Load Averages (UCD-SNMP-MIB la)proxy -v 2c -c <snmp_ro_community> localhost .1.3.6.1.4.1.26878.200.3.2.70.1.4.1.3.6.1.4.1.2021.10.1.5.1proxy -v 2c -c <snmp_ro_community> localhost .1.3.6.1.4.1.26878.200.3.2.70.1.5.1.3.6.1.4.1.2021.10.1.5.2proxy -v 2c -c <snmp_ro_community> localhost .1.3.6.1.4.1.26878.200.3.2.70.1.6.1.3.6.1.4.1.2021.10.1.5.3proxy -v 2c -c <snmp_ro_community> localhost .1.3.6.1.4.1.26878.200.3.2.70.1.4.0.1.3.6.1.4.1.2021.10.1.5.1proxy -v 2c -c <snmp_ro_community> localhost .1.3.6.1.4.1.26878.200.3.2.70.1.5.0.1.3.6.1.4.1.2021.10.1.5.2proxy -v 2c -c <snmp_ro_community> localhost .1.3.6.1.4.1.26878.200.3.2.70.1.6.0.1.3.6.1.4.1.2021.10.1.5.3# Memory Total, Memory Available, Swap Total, Swap Available (UCD-SNMP-MIB mem)proxy -v 2c -c <snmp_ro_community> localhost .1.3.6.1.4.1.26878.200.3.2.70.1.7.1.3.6.1.4.1.2021.4.5.0proxy -v 2c -c <snmp_ro_community> localhost .1.3.6.1.4.1.26878.200.3.2.70.1.8.1.3.6.1.4.1.2021.4.6.0
CPS MOG SNMP, Alarms, and Clearing Procedures Guide, Release 13.1.0 35
Monitoring and Alert NotificationCluster Manager KPI and SNMP Configuration

proxy -v 2c -c <snmp_ro_community> localhost .1.3.6.1.4.1.26878.200.3.2.70.1.9.1.3.6.1.4.1.2021.4.3.0proxy -v 2c -c <snmp_ro_community> localhost .1.3.6.1.4.1.26878.200.3.2.70.1.10.1.3.6.1.4.1.2021.4.4.0proxy -v 2c -c <snmp_ro_community> localhost .1.3.6.1.4.1.26878.200.3.2.70.1.7.0.1.3.6.1.4.1.2021.4.5.0proxy -v 2c -c <snmp_ro_community> localhost .1.3.6.1.4.1.26878.200.3.2.70.1.8.0.1.3.6.1.4.1.2021.4.6.0proxy -v 2c -c <snmp_ro_community> localhost .1.3.6.1.4.1.26878.200.3.2.70.1.9.0.1.3.6.1.4.1.2021.4.3.0proxy -v 2c -c <snmp_ro_community> localhost .1.3.6.1.4.1.26878.200.3.2.70.1.10.0.1.3.6.1.4.1.2021.4.4.0
2 Replace the string in <tag> with the actual value. You can check the snmpd.conf from other VMs toget the values for tags. For example, /etc/snmp/snmpd.conf file on lb01.
3 You can also update the configuration parameter such as load 6 6 6 to some other value based on numberof vCPUs present on Cluster Manager.
Formula is 1.5 * no_of_vCPUs. Consider only the integer value from the output.Note
Here is an sample snmpd.conf file configuration:
com2sec local localhost cisco123com2sec6 local localhost cisco123rocommunity cisco_rorocommunity6 cisco_rogroup MyRWGroup v1 localgroup MyRWGroup v2c localview all included .1 80access MyRWGroup "" any noauth exact all all nonesyslocation Unknown (edit /etc/snmp/snmpd.conf)syscontact Root (configure /etc/snmp/snmp.local.conf)master agentxagentAddress udp:161,udp6:161
trapcommunity cisco123agentSecName memerouser meme
# Send all traps upstream - Don't change this password or it breaks the framework.# v1 and v2 traps _could_ be sent for all but only need v2 trap.trap2sink lbvip02 cisco123
############ Local Stats#ignoreDisk /procignoreDisk /proc/sys/fs/binfmt_miscignoreDisk /var/lib/nfs/rpc_pipefsignoreDisk /dev/shmignoreDisk /dev/ptsdisk / 90%
swap 102400
load 6 6 6#linkUpDownNotifications yes
notificationEvent linkUpTrap linkUp ifIndex ifAdminStatus ifOperStatusnotificationEvent linkDownTrap linkDown ifIndex ifAdminStatus ifOperStatus
monitor -S -u meme -r 60 -e linkUpTrap -o ifDescr "Generate linkUp" ifOperStatus != 2monitor -u meme -r 60 -e linkDownTrap -o ifDescr "Generate linkDown" ifOperStatus == 2
CPS MOG SNMP, Alarms, and Clearing Procedures Guide, Release 13.1.036
Monitoring and Alert NotificationCluster Manager KPI and SNMP Configuration

# Note: alert!=0, clear==0 and messages must be unique or snmpd errors.monitor -u meme -r 60 -o dskPath -o dskErrorMsg "DiskFullAlert" dskErrorFlag != 0monitor -S -u meme -r 60 -o dskPath -o dskErrorMsg "DiskFullClear" dskErrorFlag == 0monitor -u meme -r 60 -o memErrorName -o memSwapErrorMsg "LowSwapAlert" memSwapError !=0monitor -S -u meme -r 60 -o memErrorName -o memSwapErrorMsg "LowSwapClear" memSwapError== 0monitor -u meme -r 60 -o laNames -o laErrMessage "HighLoadAlert" laErrorFlag != 0monitor -S -u meme -r 60 -o laNames -o laErrMessage "HighLoadClear" laErrorFlag == 0
############ BROADHOP-QNS-MIB Proxy Configuration############ proxy -v <version> -c <community> <local_host> <map_to> <map_from>## NOTE: Most values are listed twice. This is to cover the snmp get requirement# for scalar values. Snmp get for scalar values (ie. not a table) is# required to return for both x.y OID and .x.y.0 OID values. This only# effects <map_to> values.
############ System Stats#
## User, System and Idle CPU (UCD-SNMP-MIB ss)
proxy -v 2c -c cisco_ro localhost .1.3.6.1.4.1.26878.200.3.2.70.1.1.0.1.3.6.1.4.1.2021.11.9.0proxy -v 2c -c cisco_ro localhost .1.3.6.1.4.1.26878.200.3.2.70.1.2.0.1.3.6.1.4.1.2021.11.10.0proxy -v 2c -c cisco_ro localhost .1.3.6.1.4.1.26878.200.3.2.70.1.3.0.1.3.6.1.4.1.2021.11.11.0proxy -v 2c -c cisco_ro localhost .1.3.6.1.4.1.26878.200.3.2.70.1.1.1.3.6.1.4.1.2021.11.9.0proxy -v 2c -c cisco_ro localhost .1.3.6.1.4.1.26878.200.3.2.70.1.2.1.3.6.1.4.1.2021.11.10.0proxy -v 2c -c cisco_ro localhost .1.3.6.1.4.1.26878.200.3.2.70.1.3.1.3.6.1.4.1.2021.11.11.0# 1, 5 and 15 Minute Load Averages (UCD-SNMP-MIB la)proxy -v 2c -c cisco_ro localhost .1.3.6.1.4.1.26878.200.3.2.70.1.4.1.3.6.1.4.1.2021.10.1.5.1proxy -v 2c -c cisco_ro localhost .1.3.6.1.4.1.26878.200.3.2.70.1.5.1.3.6.1.4.1.2021.10.1.5.2proxy -v 2c -c cisco_ro localhost .1.3.6.1.4.1.26878.200.3.2.70.1.6.1.3.6.1.4.1.2021.10.1.5.3proxy -v 2c -c cisco_ro localhost .1.3.6.1.4.1.26878.200.3.2.70.1.4.0.1.3.6.1.4.1.2021.10.1.5.1proxy -v 2c -c cisco_ro localhost .1.3.6.1.4.1.26878.200.3.2.70.1.5.0.1.3.6.1.4.1.2021.10.1.5.2proxy -v 2c -c cisco_ro localhost .1.3.6.1.4.1.26878.200.3.2.70.1.6.0.1.3.6.1.4.1.2021.10.1.5.3# Memory Total, Memory Available, Swap Total, Swap Available (UCD-SNMP-MIB mem)proxy -v 2c -c cisco_ro localhost .1.3.6.1.4.1.26878.200.3.2.70.1.7.1.3.6.1.4.1.2021.4.5.0proxy -v 2c -c cisco_ro localhost .1.3.6.1.4.1.26878.200.3.2.70.1.8.1.3.6.1.4.1.2021.4.6.0proxy -v 2c -c cisco_ro localhost .1.3.6.1.4.1.26878.200.3.2.70.1.9.1.3.6.1.4.1.2021.4.3.0proxy -v 2c -c cisco_ro localhost .1.3.6.1.4.1.26878.200.3.2.70.1.10.1.3.6.1.4.1.2021.4.4.0proxy -v 2c -c cisco_ro localhost .1.3.6.1.4.1.26878.200.3.2.70.1.7.0.1.3.6.1.4.1.2021.4.5.0proxy -v 2c -c cisco_ro localhost .1.3.6.1.4.1.26878.200.3.2.70.1.8.0.1.3.6.1.4.1.2021.4.6.0proxy -v 2c -c cisco_ro localhost .1.3.6.1.4.1.26878.200.3.2.70.1.9.0.1.3.6.1.4.1.2021.4.3.0
CPS MOG SNMP, Alarms, and Clearing Procedures Guide, Release 13.1.0 37
Monitoring and Alert NotificationCluster Manager KPI and SNMP Configuration

proxy -v 2c -c cisco_ro localhost .1.3.6.1.4.1.26878.200.3.2.70.1.10.0.1.3.6.1.4.1.2021.4.4.0
4 After updating the snmpd.conf file, execute the following commands from Cluster Manager.mkdir /etc/snmp/mibs;scp root@qns01:/etc/snmp/mibs/* /etc/snmp/mibsscp root@qns01:/etc/sysconfig/snmpd /etc/sysconfig/snmpdscp root@qns01:/etc/logrotate.d/snmpd /etc/logrotate.d/snmpdscp root@qns01:/etc/monit.d/snmpd /etc/monit.d/service monit restart
For SNMPv3
1 Add the following content to /etc/snmp/snmpd.conf file.rouser cisco_snmpv3rouser cisco_snmpv3_trapcom2sec local localhost cisco_snmpv3group MyRWGroup usm localgroup MyRWGroup usm cisco_snmpv3view all included .1 80access MyRWGroup "" any noauth exact all all nonesyslocation Unknown (edit /etc/snmp/snmpd.conf)syscontact Root (configure /etc/snmp/snmp.local.conf)master agentxagentSecName cisco_snmpv3_traptrapsess -v 3 -u cisco_snmpv3_trap -a SHA -m 0xf8798c43bd2f058a14ffde26f037fbc5d44f434e-x AES -m0xf8798c43bd2f058a14ffde26f037fbc5d44f434e -l authPriv lbvip02############ Local Stats#ignoreDisk /procignoreDisk /proc/sys/fs/binfmt_miscignoreDisk /var/lib/nfs/rpc_pipefsignoreDisk /dev/shmignoreDisk /dev/ptsdisk / 10%disk /var 10%disk /boot 10%swap 102400#load = 1.5 * vCPUs (allocated to VM)load 9 9 9#linkUpDownNotifications yesnotificationEvent linkUpTrap linkUp ifIndex ifAdminStatus ifOperStatusnotificationEvent linkDownTrap linkDown ifIndex ifAdminStatus ifOperStatusmonitor -S -u cisco_snmpv3_trap -r 60 -e linkUpTrap -o ifDescr "Generate linkUp"ifOperStatus !=2monitor -u cisco_snmpv3_trap -r 60 -e linkDownTrap -o ifDescr "Generate linkDown"ifOperStatus ==2# Note: alert!=0, clear==0 and messages must be unique or snmpd errors.monitor -u cisco_snmpv3_trap -r 60 -o dskPath -o dskErrorMsg "DiskFullAlert" dskErrorFlag!= 0monitor -S -u cisco_snmpv3_trap -r 60 -o dskPath -o dskErrorMsg "DiskFullClear"dskErrorFlag == 0monitor -u cisco_snmpv3_trap -r 60 -o memErrorName -o memSwapErrorMsg "LowSwapAlert"memSwapError!= 0monitor -S -u cisco_snmpv3_trap -r 60 -o memErrorName -o memSwapErrorMsg "LowSwapClear"memSwapError == 0monitor -u cisco_snmpv3_trap -r 60 -o laNames -o laErrMessage "HighLoadAlert" laErrorFlag!= 0monitor -S -u cisco_snmpv3_trap -r 60 -o laNames -o laErrMessage "HighLoadClear"laErrorFlag == 0monitor -u cisco_snmpv3_trap -r 60 -o memAvailReal -o memTotalReal "LowMemoryAlert"memAvailReal<1633390monitor -S -u cisco_snmpv3_trap -r 60 -o memAvailReal -o memTotalReal "LowMemoryClear"memAvailReal>= 1633390
CPS MOG SNMP, Alarms, and Clearing Procedures Guide, Release 13.1.038
Monitoring and Alert NotificationCluster Manager KPI and SNMP Configuration

############ System Stats## User, System and Idle CPU (UCD-SNMP-MIB ss)proxy -e 0x0102030405060708 -v 3 -u cisco_snmpv3 -a SHA -m0x7a64eefbf13e918c77b41fada0b55cf8338d6cc8 -x AES -m 0x7a64eefbf13e918c77b41fada0b55cf8-l authPrivlocalhost .1.3.6.1.4.1.26878.200.3.2.70.1.1.0 .1.3.6.1.4.1.2021.11.9.0proxy -e 0x0102030405060708 -v 3 -u cisco_snmpv3 -a SHA -m0x7a64eefbf13e918c77b41fada0b55cf8338d6cc8 -x AES -m 0x7a64eefbf13e918c77b41fada0b55cf8-l authPrivlocalhost .1.3.6.1.4.1.26878.200.3.2.70.1.2.0 .1.3.6.1.4.1.2021.11.10.0proxy -e 0x0102030405060708 -v 3 -u cisco_snmpv3 -a SHA -m0x7a64eefbf13e918c77b41fada0b55cf8338d6cc8 -x AES -m 0x7a64eefbf13e918c77b41fada0b55cf8-l authPrivlocalhost .1.3.6.1.4.1.26878.200.3.2.70.1.3.0 .1.3.6.1.4.1.2021.11.11.0proxy -e 0x0102030405060708 -v 3 -u cisco_snmpv3 -a SHA -m0x7a64eefbf13e918c77b41fada0b55cf8338d6cc8 -x AES -m 0x7a64eefbf13e918c77b41fada0b55cf8-l authPrivlocalhost .1.3.6.1.4.1.26878.200.3.2.70.1.1 .1.3.6.1.4.1.2021.11.9.0proxy -e 0x0102030405060708 -v 3 -u cisco_snmpv3 -a SHA -m0x7a64eefbf13e918c77b41fada0b55cf8338d6cc8 -x AES -m 0x7a64eefbf13e918c77b41fada0b55cf8-l authPrivlocalhost .1.3.6.1.4.1.26878.200.3.2.70.1.2 .1.3.6.1.4.1.2021.11.10.0proxy -e 0x0102030405060708 -v 3 -u cisco_snmpv3 -a SHA -m0x7a64eefbf13e918c77b41fada0b55cf8338d6cc8 -x AES -m 0x7a64eefbf13e918c77b41fada0b55cf8-l authPrivlocalhost .1.3.6.1.4.1.26878.200.3.2.70.1.3 .1.3.6.1.4.1.2021.11.11.0# 1, 5 and 15 Minute Load Averages (UCD-SNMP-MIB la)proxy -e 0x0102030405060708 -v 3 -u cisco_snmpv3 -a SHA -m0x7a64eefbf13e918c77b41fada0b55cf8338d6cc8 -x AES -m 0x7a64eefbf13e918c77b41fada0b55cf8-l authPrivlocalhost .1.3.6.1.4.1.26878.200.3.2.70.1.4 .1.3.6.1.4.1.2021.10.1.5.1proxy -e 0x0102030405060708 -v 3 -u cisco_snmpv3 -a SHA -m0x7a64eefbf13e918c77b41fada0b55cf8338d6cc8 -x AES -m 0x7a64eefbf13e918c77b41fada0b55cf8-l authPrivlocalhost .1.3.6.1.4.1.26878.200.3.2.70.1.5 .1.3.6.1.4.1.2021.10.1.5.2proxy -e 0x0102030405060708 -v 3 -u cisco_snmpv3 -a SHA -m0x7a64eefbf13e918c77b41fada0b55cf8338d6cc8 -x AES -m 0x7a64eefbf13e918c77b41fada0b55cf8-l authPrivlocalhost .1.3.6.1.4.1.26878.200.3.2.70.1.6 .1.3.6.1.4.1.2021.10.1.5.3proxy -e 0x0102030405060708 -v 3 -u cisco_snmpv3 -a SHA -m0x7a64eefbf13e918c77b41fada0b55cf8338d6cc8 -x AES -m 0x7a64eefbf13e918c77b41fada0b55cf8-l authPrivlocalhost .1.3.6.1.4.1.26878.200.3.2.70.1.4.0 .1.3.6.1.4.1.2021.10.1.5.1proxy -e 0x0102030405060708 -v 3 -u cisco_snmpv3 -a SHA -m0x7a64eefbf13e918c77b41fada0b55cf8338d6cc8 -x AES -m 0x7a64eefbf13e918c77b41fada0b55cf8-l authPrivlocalhost .1.3.6.1.4.1.26878.200.3.2.70.1.5.0 .1.3.6.1.4.1.2021.10.1.5.2proxy -e 0x0102030405060708 -v 3 -u cisco_snmpv3 -a SHA -m0x7a64eefbf13e918c77b41fada0b55cf8338d6cc8 -x AES -m 0x7a64eefbf13e918c77b41fada0b55cf8-l authPrivlocalhost .1.3.6.1.4.1.26878.200.3.2.70.1.6.0 .1.3.6.1.4.1.2021.10.1.5.3# Memory Total, Memory Available, Swap Total, Swap Available (UCD-SNMP-MIB mem)proxy -e 0x0102030405060708 -v 3 -u cisco_snmpv3 -a SHA -m0x7a64eefbf13e918c77b41fada0b55cf8338d6cc8 -x AES -m 0x7a64eefbf13e918c77b41fada0b55cf8-l authPrivlocalhost .1.3.6.1.4.1.26878.200.3.2.70.1.7 .1.3.6.1.4.1.2021.4.5.0proxy -e 0x0102030405060708 -v 3 -u cisco_snmpv3 -a SHA -m0x7a64eefbf13e918c77b41fada0b55cf8338d6cc8 -x AES -m 0x7a64eefbf13e918c77b41fada0b55cf8-l authPrivlocalhost .1.3.6.1.4.1.26878.200.3.2.70.1.8 .1.3.6.1.4.1.2021.4.6.0proxy -e 0x0102030405060708 -v 3 -u cisco_snmpv3 -a SHA -m0x7a64eefbf13e918c77b41fada0b55cf8338d6cc8 -x AES -m 0x7a64eefbf13e918c77b41fada0b55cf8-l authPrivlocalhost .1.3.6.1.4.1.26878.200.3.2.70.1.9 .1.3.6.1.4.1.2021.4.3.0proxy -e 0x0102030405060708 -v 3 -u cisco_snmpv3 -a SHA -m0x7a64eefbf13e918c77b41fada0b55cf8338d6cc8 -x AES -m 0x7a64eefbf13e918c77b41fada0b55cf8-l authPrivlocalhost .1.3.6.1.4.1.26878.200.3.2.70.1.10 .1.3.6.1.4.1.2021.4.4.0proxy -e 0x0102030405060708 -v 3 -u cisco_snmpv3 -a SHA -m0x7a64eefbf13e918c77b41fada0b55cf8338d6cc8 -x AES -m 0x7a64eefbf13e918c77b41fada0b55cf8
CPS MOG SNMP, Alarms, and Clearing Procedures Guide, Release 13.1.0 39
Monitoring and Alert NotificationCluster Manager KPI and SNMP Configuration

-l authPrivlocalhost .1.3.6.1.4.1.26878.200.3.2.70.1.7.0 .1.3.6.1.4.1.2021.4.5.0proxy -e 0x0102030405060708 -v 3 -u cisco_snmpv3 -a SHA -m0x7a64eefbf13e918c77b41fada0b55cf8338d6cc8 -x AES -m 0x7a64eefbf13e918c77b41fada0b55cf8-l authPrivlocalhost .1.3.6.1.4.1.26878.200.3.2.70.1.8.0 .1.3.6.1.4.1.2021.4.6.0proxy -e 0x0102030405060708 -v 3 -u cisco_snmpv3 -a SHA -m0x7a64eefbf13e918c77b41fada0b55cf8338d6cc8 -x AES -m 0x7a64eefbf13e918c77b41fada0b55cf8-l authPrivlocalhost .1.3.6.1.4.1.26878.200.3.2.70.1.9.0 .1.3.6.1.4.1.2021.4.3.0proxy -e 0x0102030405060708 -v 3 -u cisco_snmpv3 -a SHA -m0x7a64eefbf13e918c77b41fada0b55cf8338d6cc8 -x AES -m 0x7a64eefbf13e918c77b41fada0b55cf8-l authPrivlocalhost .1.3.6.1.4.1.26878.200.3.2.70.1.10.0 .1.3.6.1.4.1.2021.4.4.0
For snmptrap, puppet executes the script /var/broadhop/initialize_snmpv3_trap.sh. The script/var/broadhop/initialize_snmpv3_trap.sh is starting and stopping snmptrapd twice.[root@lb01 broadhop]# ./initialize_snmpv3_trap.shStopping monit: [ OK ]Stopping snmpd: [ OK ]Stopping snmptrapd: [ OK ]Starting snmptrapd: [ OK ]Stopping snmptrapd: [ OK ]Starting snmptrapd: [ OK ]Starting snmpd: [ OK ]Starting monit: Starting Monit 5.17.1 daemon with http interface at [localhost]:2812[ OK ][root@lb01 broadhop]#
Note
2 Replace the string in <tag> with the actual value. You can check the snmpd.conf from other VMs toget the values for tags. For example, /etc/snmp/snmpd.conf file on lb01.
3 You can also update the configuration parameter such as load 6 6 6 to some other value based on numberof vCPUs present on Cluster Manager.
Formula is 1.5 * no_of_vCPUs. Consider only the integer value from the output.Note
Here is an sample snmpd.conf file configuration:
4 After updating the snmpd.conf file, execute the following commands from Cluster Manager.mkdir /etc/snmp/mibs;scp root@qns01:/etc/snmp/mibs/* /etc/snmp/mibsscp root@qns01:/etc/sysconfig/snmpd /etc/sysconfig/snmpdscp root@qns01:/etc/logrotate.d/snmpd /etc/logrotate.d/snmpdscp root@qns01:/etc/monit.d/snmpd /etc/monit.d/service monit restart
Validation and TestingThis section describes the commands for validation and testing of the CPS SNMP infrastructure. You can usethese commands to validate and test your system during setting up or configuring the system. Our examplesuseMIB values because they aremore descriptive but youmay use equivalent OID values if you like particularlywhen configuring an NMS.
The examples here use Net-SNMP snmpget snmpwalk and snmptrap programs. Detailed configuration of thisapplication is outside the scope of this document but the examples assume that the three Cisco MIBs areinstalled in the locations described on theman page of snmpcmd (typically the/etc/snmp/mibs directories).
CPS MOG SNMP, Alarms, and Clearing Procedures Guide, Release 13.1.040
Monitoring and Alert NotificationValidation and Testing

Run all tests from a client with network access to the Management Network or from lb01 lb02 (which arealso on the Management Network).
Component StatisticsComponent statistics can be obtained on a per statistic basis with snmpget. For example, to get the currentavailable memory on pcrfclient01, use the following commands:
For SNMPv2snmpget -v 2c -c broadhop -M /etc/snmp/mibs:/usr/share/snmp/mibs -m+BROADHOP-MIB:CISCO-QNS-MIBpcrfclient01 .1.3.6.1.4.1.26878.200.3.2.70.1.8
An example of the output from this command is:CISCO-QNS-MIB::componentMemoryAvailable = INTEGER: 4551356
Interpreting this output means that 4551356 MB of memory are available on this component machine.
All available component statistics in an MIB node can be “walked” via the snmpwalk command. This is verysimilar to snmpget as above. For example, to see all statistics on lb01 use the command:snmpwalk -v 2c -c broadhop -M /etc/snmp/mibs:/usr/share/snmp/mibs -m+BROADHOP-MIB:CISCO-QNS-MIBlb01 .1.3.6.1.4.1.26878.200.3.2.70
An example of the output from this command is:CISCO-QNS-MIB::componentCpuUser = INTEGER: 34CISCO-QNS-MIB::componentCpuUser.0 = INTEGER: 34CISCO-QNS-MIB::componentCpuSystem = INTEGER: 3CISCO-QNS-MIB::componentCpuSystem.0 = INTEGER: 3CISCO-QNS-MIB::componentCpuIdle = INTEGER: 61CISCO-QNS-MIB::componentCpuIdle.0 = INTEGER: 61CISCO-QNS-MIB::componentLoadAverage1 = INTEGER: 102CISCO-QNS-MIB::componentLoadAverage1.0 = INTEGER: 102CISCO-QNS-MIB::componentLoadAverage5 = INTEGER: 101CISCO-QNS-MIB::componentLoadAverage5.0 = INTEGER: 101CISCO-QNS-MIB::componentLoadAverage15 = INTEGER: 109CISCO-QNS-MIB::componentLoadAverage15.0 = INTEGER: 109CISCO-QNS-MIB::componentMemoryTotal = INTEGER: 12198308CISCO-QNS-MIB::componentMemoryTotal.0 = INTEGER: 12198308CISCO-QNS-MIB::componentMemoryAvailable = INTEGER: 4518292CISCO-QNS-MIB::componentMemoryAvailable.0 = INTEGER: 4518292CISCO-QNS-MIB::componentSwapTotal = INTEGER: 0CISCO-QNS-MIB::componentSwapTotal.0 = INTEGER: 0CISCO-QNS-MIB::componentSwapAvailable = INTEGER: 0CISCO-QNS-MIB::componentSwapAvailable.0 = INTEGER: 0
For SNMPv3snmpwalk -e 0x0102030405060708 -v 3 -u cisco_snmpv3 -a SHA -A Cisco-12345 -x AES -XCisco-12345 -lauthPriv -M /etc/snmp/mibs:/usr/share/snmp/mibs -m +BROADHOP-MIB:CISCO-QNS-MIB pcrfclient01.1.3.6.1.4.1.26878.200.3.2.70.1snmpget -e 0x0102030405060708 -v 3 -u cisco_snmpv3 -a SHA -A Cisco-12345 -x AES -X Cisco-12345-lauthPriv -M /etc/snmp/mibs:/usr/share/snmp/mibs -m +BROADHOP-MIB:CISCO-QNS-MIB pcrfclient01.1.3.6.1.4.1.26878.200.3.2.70.1.2.0
Application KPIApplication KPI can be obtained on a per statistic basis with snmpget in a manner much like obtainingComponent Statistics. As an example to get the aggregate number of sessions currently active on qns01 usethe following commands:
CPS MOG SNMP, Alarms, and Clearing Procedures Guide, Release 13.1.0 41
Monitoring and Alert NotificationValidation and Testing

For SNMPv2snmpget -v 2c -c broadhop -M /etc/snmp/mibs:/usr/share/mibs -m +BROADHOP-MIB:CISCO-QNS-MIBqns01.1.3.6.1.4.1.26878.200.3.3.70.15.24
An example of the output from this command would be:iso.3.6.1.4.1.26878.200.3.3.70.15.24 = STRING: "0"
Interpreting this output means that 0 sessions are active on qns01.
Similarly, all available KPI in an MIB node can be “walked” via the snmpwalk command. This is very similarto snmpget as above. As an example, to see all statistics on qns01, use the following command:snmpwalk -v 2c -c broadhop -M /etc/snmp/mibs:/usr/share/mibs -m +BROADHOP-MIB:CISCO-QNS-MIBqns01.1.3.6.1.4.1.26878.200.3.3.70.15
An example of the output from this command would be:iso.3.6.1.4.1.26878.200.3.3.70.15.20 = STRING: "0"iso.3.6.1.4.1.26878.200.3.3.70.15.20.0 = STRING: "0"iso.3.6.1.4.1.26878.200.3.3.70.15.21 = STRING: "0"iso.3.6.1.4.1.26878.200.3.3.70.15.21.0 = STRING: "0"iso.3.6.1.4.1.26878.200.3.3.70.15.22 = STRING: "0"iso.3.6.1.4.1.26878.200.3.3.70.15.22.0 = STRING: "0"iso.3.6.1.4.1.26878.200.3.3.70.15.23 = STRING: "0"iso.3.6.1.4.1.26878.200.3.3.70.15.23.0 = STRING: "0"iso.3.6.1.4.1.26878.200.3.3.70.15.24 = STRING: "0"iso.3.6.1.4.1.26878.200.3.3.70.15.24.0 = STRING: "0"iso.3.6.1.4.1.26878.200.3.3.70.15.25 = STRING: "1434914488"iso.3.6.1.4.1.26878.200.3.3.70.15.25.0 = STRING: "1434914488"
For SNMPv3snmpwalk -e 0x0102030405060708 -v 3 -u cisco_snmpv3 -a SHA -A Cisco-12345 -x AES -XCisco-12345 -lauthPriv -M /etc/snmp/mibs:/usr/share/mibs -m +BROADHOP-MIB:CISCO-QNS-MIB qns01.1.3.6.1.4.1.26878.200.3.3.70snmpget -e 0x0102030405060708 -v 3 -u cisco_snmpv3 -a SHA -A Cisco-12345 -x AES -X Cisco-12345-lauthPriv -M /etc/snmp/mibs:/usr/share/mibs -m +BROADHOP-MIB:CISCO-QNS-MIB qns01.1.3.6.1.4.1.26878.200.3.3.70.15.25.0
Alarm Notifications/TrapsTesting and validating alarms notifications requires slightly more skill than testing SNMP gets and walks.Recall that the overall architecture is that all components and applications in the CPS system are configuredto send notifications to lb01 or lb02 via lbvip02, the Internal Network IP.
These systems log the notification locally in /var/log/snmp/trap and then “re-throw” the notificationto the destination configured by corporate_nms_ip. Two testing and troubleshootingmethods can be performed:confirming notifications are being sent properly from system components to lb01 or lb02, and confirmingthat notifications can be sent upstream to the NMS.
Testing Individual TrapsChapter 1 in the CPS Troubleshooting Guide includes procedures to test each CPS trap individually.
CPS MOG SNMP, Alarms, and Clearing Procedures Guide, Release 13.1.042
Monitoring and Alert NotificationValidation and Testing

Troubleshooting
For information about troubleshooting SNMP notifications and traps, refer to Cisco Policy SuiteTroubleshooting Guide.
Note
CPS MOG SNMP, Alarms, and Clearing Procedures Guide, Release 13.1.0 43
Monitoring and Alert NotificationTroubleshooting

CPS MOG SNMP, Alarms, and Clearing Procedures Guide, Release 13.1.044
Monitoring and Alert NotificationTroubleshooting

C H A P T E R 2Clearing Procedures
• Component Notifications, page 45
• Application Notifications, page 49
Component NotificationsThe following table provides the information related to clearing procedures for component notifications:
Table 11: Component Notifications - Clearing Procedures
Clearing ProcedureNotification Name
1 Login to VM on which the alarm has generated.
2 Check the disk space for the file system on whichalarm has generated.
df -k
3 Check what all files are using large disk space onfile system and delete some unnecessary files tomake free space on disk so that the alarm getscleared.
4 After removing some files if the size of disk isstill more than the configured threshold value andyou are not able to remove any more files thenconsider the option of adding more disk to theVM(s) or contact your Cisco technicalrepresentative to look into the issue.
DiskFull
CPS MOG SNMP, Alarms, and Clearing Procedures Guide, Release 13.1.0 45
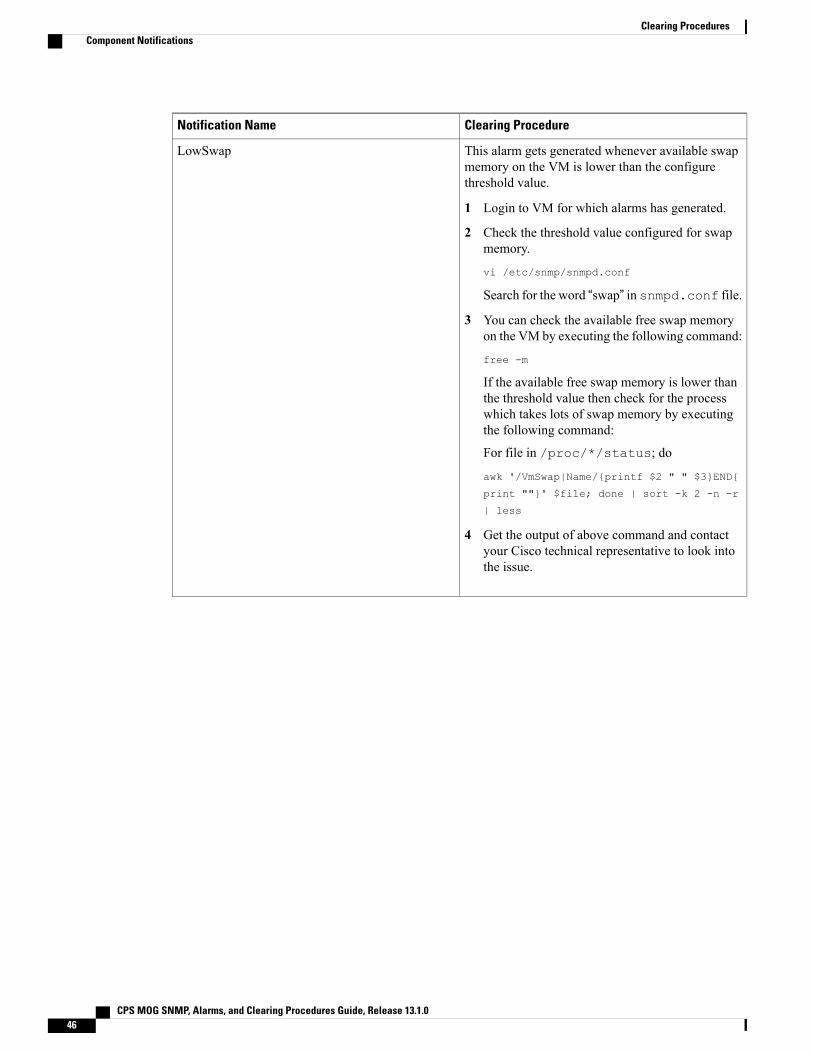
Clearing ProcedureNotification Name
This alarm gets generated whenever available swapmemory on the VM is lower than the configurethreshold value.
1 Login to VM for which alarms has generated.
2 Check the threshold value configured for swapmemory.
vi /etc/snmp/snmpd.conf
Search for the word “swap” in snmpd.conf file.
3 You can check the available free swap memoryon the VM by executing the following command:
free -m
If the available free swap memory is lower thanthe threshold value then check for the processwhich takes lots of swap memory by executingthe following command:
For file in /proc/*/status; do
awk '/VmSwap|Name/{printf $2 " " $3}END{
print ""}' $file; done | sort -k 2 -n -r
| less
4 Get the output of above command and contactyour Cisco technical representative to look intothe issue.
LowSwap
CPS MOG SNMP, Alarms, and Clearing Procedures Guide, Release 13.1.046
Clearing ProceduresComponent Notifications
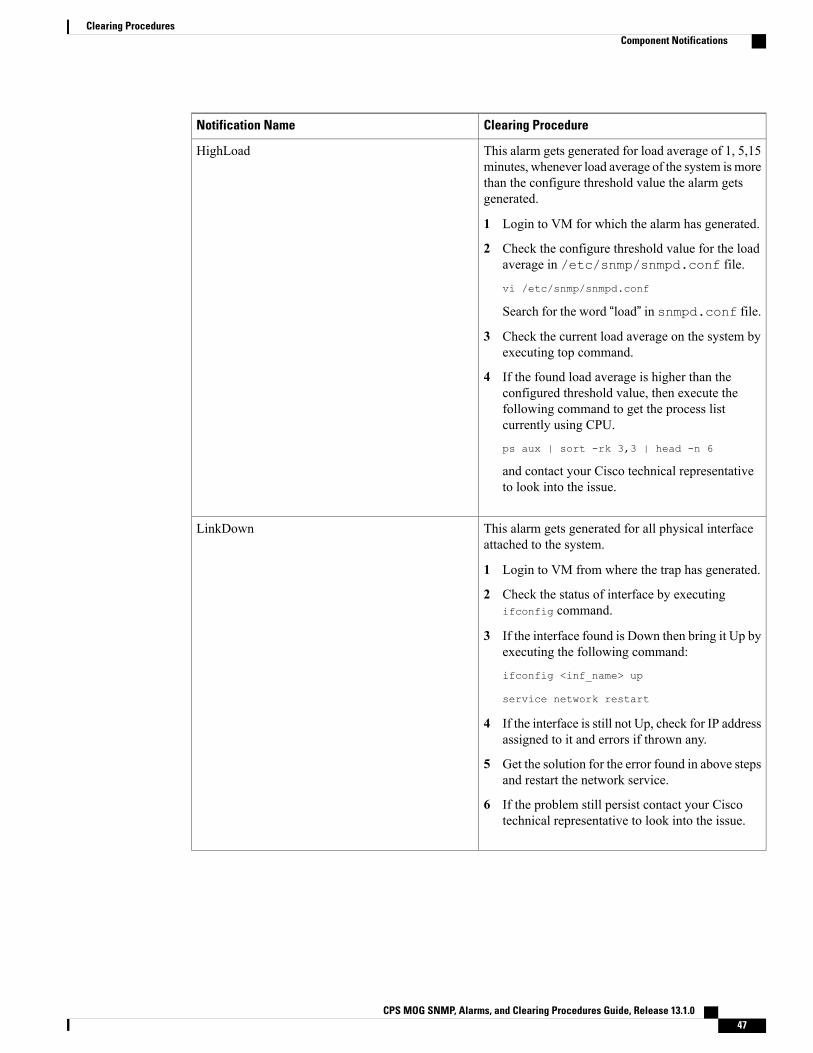
Clearing ProcedureNotification Name
This alarm gets generated for load average of 1, 5,15minutes, whenever load average of the system is morethan the configure threshold value the alarm getsgenerated.
1 Login to VM for which the alarm has generated.
2 Check the configure threshold value for the loadaverage in /etc/snmp/snmpd.conf file.
vi /etc/snmp/snmpd.conf
Search for the word “load” in snmpd.conf file.
3 Check the current load average on the system byexecuting top command.
4 If the found load average is higher than theconfigured threshold value, then execute thefollowing command to get the process listcurrently using CPU.
ps aux | sort -rk 3,3 | head -n 6
and contact your Cisco technical representativeto look into the issue.
HighLoad
This alarm gets generated for all physical interfaceattached to the system.
1 Login to VM from where the trap has generated.
2 Check the status of interface by executingifconfig command.
3 If the interface found is Down then bring it Up byexecuting the following command:
ifconfig <inf_name> up
service network restart
4 If the interface is still not Up, check for IP addressassigned to it and errors if thrown any.
5 Get the solution for the error found in above stepsand restart the network service.
6 If the problem still persist contact your Ciscotechnical representative to look into the issue.
LinkDown
CPS MOG SNMP, Alarms, and Clearing Procedures Guide, Release 13.1.0 47
Clearing ProceduresComponent Notifications

Clearing ProcedureNotification Name
This alarm gets generated whenever allocated RAMon the VM is higher than the configure higherthreshold value.
1 Login to VM for which alarms has generated.
2 Check the higher and lower threshold valueconfigured for memory:
vi /etc/facter/facts.d/qps_facts.txt
Search for the following text:
• free_mem_per_alert
• free_mem_per_clear
3 You can check the available free memory on theVM by executing the following command:
free -m
If the available free memory is lower than theclear threshold value then check for the processwhich takes lots of memory in top commandoutput.
4 Get the output of the following command:
ps -eo pmem,pcpu,vsize,pid,cmd | sort -k
1 -nr | head -5
and contact your Cisco technical representativeto look into the issue.
LowMemory
This alarm is generated when the corosync processis stopped or fails.
1 Login to the Policy Director (load balancer) VMfrom which the alarm has generated.
2 Check the status of corosync process by executingthe following command:
service corosync status
3 If status is Down then start the process byexecuting the following command:
service corosync start
ProcessDown
CPS MOG SNMP, Alarms, and Clearing Procedures Guide, Release 13.1.048
Clearing ProceduresComponent Notifications

Clearing ProcedureNotification Name
This trap is generated whenever CPU usage on theVM is more than the higher threshold value.
1 Login to VM for which the trap has generated.
2 Check the higher and lower threshold valueconfigured for CPU.
vi /etc/facter/facts.d/qps_facts.txt
Search for the following text:
• cpu_usage_alert_threshold
• cpu_usage_clear_threshold
3 The CPU usage is calculated as a sum of 9thcolumn value of top command output/no. of vCPUpresent on the VM.
If the CPU usage is more than the clear thresholdvalue then check for the process which takes lotsof CPU cycle from the top command output.
4 Get the output of the following command:
ps aux | sort -rk 3,3 | head -n 6
and contact your Cisco technical representativeto look into the issue.
HIGH CPU USAGE Alert
Application NotificationsThe following section provides the information related to clearing procedures for application notifications:
License
• LMGRD related:
◦License Usage Threshold Exceeded: This alarm is generated when the current number of sessionusage exceeds the License Usage Threshold Percentage value configured in the Policy Builderunder Reference Data > Fault List. CPS Alarm/Trap message contains the following key words:
"InterfaceID=" this keyword indicates the threshold value.
"severity=" this keyword indicates severity associated to the threshold. The severity value includes:
• CRITICAL
• MAJOR
• MINOR
•WARNING
CPS MOG SNMP, Alarms, and Clearing Procedures Guide, Release 13.1.0 49
Clearing ProceduresApplication Notifications

Alarm Code: 1111 - LICENSE_THRESHOLD
Table 12: License Usage Threshold Exceeded
Corrective ActionPossible Cause
Option 1: Purchase a license file having largerlicensed session number.
Option 2: Adjust License Usage ThresholdPercentage value configured in Policy Builder.
The current number of session usage exceedsthe License Usage Threshold Percentagevalue.
◦LicenseSessionCreation: This alarm is generated when CPS does not allow new CPS session tobe created.
Alarm Code: 1104 - ERROR_SESSION_CREATION
Table 13: LicenseSessionCreation
Corrective ActionPossible Cause
Clear 'DeveloperMode' flag to annotate thefollowing to make sure the consistency:
1 Remove the following line from the/etc/broadhop/qns.conf file:
-Dcom.broadhop.developer.mode=true.
2 Purchase and use a license file.
3 Restart the Policy Server (QNS) process.
CPS is running in Developer mode and thecurrent number of session usage is > 100.
1 Add CPS "CORE" license to/etc/broadhop/license/features.propertiesfile.
2 Purchase a license containing CPS "CORE".
3 Purchase a license containing CPS "CORE"and larger licensed session count.
4 Make sure that the license.lic filecontains valid CPS "CORE" expiry date.
CPS "CORE" license related error:
• CPS "CORE" is NOT licensed:MOBILE_CORE, FIXED_CORE orSP_CORE license is NOT found.
• CPS "CORE" is licensed but the licensedsession count is not set.
• CPS "CORE" license date already expired.
• Current session count is >= CPS "CORE"licensed session count.
◦InvalidLicense: This alarm is generated when CPS license has an error. The error could be anyof the followings:
1 Core license related: CPS "Core" license error.
2 Feature license related: CPS "Feature" license error.
CPS MOG SNMP, Alarms, and Clearing Procedures Guide, Release 13.1.050
Clearing ProceduresApplication Notifications

CPS Alarm/Trap message format:
"InterfaceID=" keyword indicates the license name.
"license_state=" keywork indicates license state.
CPS defined license sate includes:
• UNVERIFIED
• INVALID
• EXPIRED
• EXPIRE_WARN
• RATE_LIMITED
• RATE_LIMIT_WARN
Alarm Code: 1110 - ERROR_LICENSE
CPS MOG SNMP, Alarms, and Clearing Procedures Guide, Release 13.1.0 51
Clearing ProceduresApplication Notifications

Table 14: InvalidLicense
Corrective ActionPossible Cause
If the message contains "InterfaceID=core", thiserror is related to CPS "CORE". Take thecorrective action based on the "license_state="in the message:
• license_state=INVALID":CPS "CORE" is NOT licensed:MOBILE_CORE, FIXED_CORE orSP_CORE license is NOT found.
Corrective action: Make sure CPS"CORE" is specified infeatures.properties file and islicensed as contained in .lic file.
CPS "CORE" is licensed but the licensedsession count is not set.
Corrective action: Make sure CPS"CORE" has valid licensed session countin .lic file.
• license_state="RATE_LIMITED":
Current number of session usage is > CPS"CORE" licensed session count.
Corrective action: Purchase a largerlicensed session count in .lic file.
• license_state="EXPIRED":CPS "CORE" license date already expired.
Corrective action: Make sure that CPS"CORE" expiry date has not expired in.lic file.
• license_state="RATE_LIMIT_WARN":
Current number of session usage isapproaching the maximum allowed limit.
Corrective action: Purchase a largerlicensed session count in .lic file.
• license_state="EXPIRE_WARN":CPS "CORE" licensewill expire at: CORElicense expiry date.
Corrective action: Make sure CPS"CORE" expiry date is not approachingthe defined expiry interval - 30 days in.lic file.
CPS "CORE" license related error:
• license_state="INVALID": CPS "CORE"is NOT licensed: MOBILE_CORE,FIXED_CORE or SP_CORE license isNOT found. CPS "CORE" is licensed butthe licensed session count is not set.
• license_state="EXPIRED": CPS "CORE"license date already expired.
• license_state="RATE_LIMITED":Current number of session usage is > CPS"CORE" licensed session count.
• license_state="RATE_LIMIT_WARN":Current number of session usage isapproaching the maximum allowed. Thedefined maximum ratio is 80% of thelicensed count.
• license_state="EXPIRE_WARN": CPS"CORE" license will expire at CPSEXPIRY DATE. The defined expire datewarning interval is 30 days from theexpiration date.
CPS MOG SNMP, Alarms, and Clearing Procedures Guide, Release 13.1.052
Clearing ProceduresApplication Notifications

Corrective ActionPossible Cause
The message "InterfaceID=" indicate whichCPS "feature"has license related error:
• license_state="INVALID":CPS FeatureLicenseManager does notprovide a name OR CPS feature is notlicensed.
Corrective action: Make sure CPS"Feature" is specified infeatures.properties file and islicensed as contained in .lic file.
• license_state="EXPIRED":CPS feature license date already expired.
Corrective action: Make sure that CPS"Feature" expiry date has not expired in.lic file
• license_state="RATE_LIMITED":
Current number of session usage is > CPS"CORE" licensed session count.
Corrective action: Create a larger CPS"CORE" licensed session count in .licfile.
• license_state="EXPIRE_WARN":CPS feature license will expire at: featurelicense expiry date. CPS defined expirydate warning interval is 30 days from theexpiration date.
Corrective action: Make sure CPS"Feature" expiry date is not approachingthe CPS defined expiry interval - 30 daysin .lic file.
CPS "feature" license related error:
• license_state="INVALID": CPSFeatureLicenseManager does not providea name Or CPS feature is not licensed.
• license_state="EXPIRED": CPS featurelicense date already expired.
• license_state="RATE_LIMITED": Featurecurrent number of session usage is > CPS"CORE" licensed session count.
• license_state="EXPIRE_WARN": CPSfeature license will expire at: featurelicense expiry date. CPS defined expiredate warning interval is 30 days from theexpiration date.
◦DeveloperMode: This alarm is generated when CPS is running in DeveloperMode. CPS keepsreminding the user that system is running in Developer Mode and instructs on how to clear theDeveloper Mode. CPS is running in Deveoper Mode, number of concurrent session is limited to100.
Alarm/Trap message: Using Developer mode (100 session limit). To use a license file, remove-Dcom.broadhop.developer.mode from /etc/broadhop/qns.conf file.
Alarm Code: 1105 - ERROR_DEVELOPER_MODE
CPS MOG SNMP, Alarms, and Clearing Procedures Guide, Release 13.1.0 53
Clearing ProceduresApplication Notifications

Table 15: DeveloperMode
Corrective ActionPossible Cause
Clear 'DeveloperMode' flag to annotate thefollowing to make sure the consistency:
1 Remove the following line from the/etc/broadhop/qns.conf file:
-Dcom.broadhop.developer.mode=true.
2 Purchase and use a license file.
3 Restart the Policy Server (QNS) process.
4 Within 5 minutes of interval, verify thegenerated alarm on NMS server and/var/log/snmp/trap of active PolicyDirector (load balancer).
CPS is running in Developer mode and currentnumber of session usage is <= 100.
• Smart Licensing related:
• License Usage Threshold Exceeded: This alarm is generated when the current number of sessionusage exceeds the License Usage Threshold Percentage value configured in the Policy Builderunder Reference Data > Fault List. CPS Alarm/Trap message contains the following key words:
"InterfaceID=" this keyword indicates the threshold value.
"severity=" this keywod indicates severity associated to the threshold. The severity value includes:
• CRITICAL
• MAJOR
• MINOR
•WARNING
Alarm Code: 1111 - LICENSE_THRESHOLD
Table 16: License Usage Threshold Exceeded
Corrective ActionPossible Cause
Option 1: Purchase more license session count.
Option 2: Adjust License Usage ThresholdPercentage value configured in Policy Builder.
The current number of session usage exceedsthe License Usage Threshold Percentagevalue.
• LicenseSessionCreation: This alarm is generated when CPS does not allow new CPS session tobe created.
Alarm Code: 1104 - ERROR_SESSION_CREATION
CPS MOG SNMP, Alarms, and Clearing Procedures Guide, Release 13.1.054
Clearing ProceduresApplication Notifications

Table 17: LicenseSessionCreation
Corrective ActionPossible Cause
1 Add CPS "CORE" license to/etc/broadhop/license_sl_conf/features.propertiesfile.
2 Purchase licenses as CPS evaluation 90 daysperiod timeout already.
• CPS "CORE" is not defined infeatures.properties file.
• CPS license 90 days evaluation periodtimeout.
• InvalidLicense: This alarm is generated when CPS license status is not VALID. The error couldbe any of the followings:
1 Core license related: CPS "Core" license error.
2 Feature license related: CPS "Feature" license error.
CPS Alarm/Trap message format:
"InterfaceID=" keyword indicates the license name.
"license_state=" keywork indicates license state.
CPS defined license sate includes:
• UNVERIFIED
• INVALID
• RATE_LIMITED (OutOfCompliance)
• EVAL_EXPIRED
Alarm Code: 1110 - ERROR_LICENSE
CPS MOG SNMP, Alarms, and Clearing Procedures Guide, Release 13.1.0 55
Clearing ProceduresApplication Notifications

Table 18: InvalidLicense
Corrective ActionPossible Cause
If the message contains "InterfaceID=core", thiserror is related to CPS "CORE". Take thecorrective action based on the "license_state="in the message:
• license_state=INVALID":CPS "CORE" is NOT licensed:MOBILE_CORE, FIXED_CORE orSP_CORE license is NOT found.
Corrective action: Make sure CPS"CORE" is specified infeatures.properties file and islicensed as contained in .lic file.
CPS "CORE" is licensed but the licensedsession count is not set.
Corrective action: Make sure CPS"CORE" has valid licensed session countin .lic file.
• OutOfCompliance -license_state="RATE_LIMITED":
CPS current number of session usage is >CPS "CORE" licensed session count.
Corrective action: Purchase a largerlicensed session count in .lic file.
• license_state="EVAL_EXPIRED":CPS 90 days evaluation period timeoutalready.
Corrective action: Purchase licenses as 90days evaluation period has finished.
CPS "CORE" license related error:
• license_state="INVALID": CPS "CORE"is NOT licensed: MOBILE_CORE,FIXED_CORE or SP_CORE license isNOT found. CPS "CORE" is licensed butthe licensed session count is not set.
• OutOfCompliance -license_state="RATE_LIMITED": CPScurrent number of session usage is > CPS"CORE" licensed session count.
CPS MOG SNMP, Alarms, and Clearing Procedures Guide, Release 13.1.056
Clearing ProceduresApplication Notifications

Corrective ActionPossible Cause
The message "InterfaceID=" indicate whichCPS "feature"has license related error:
• license_state="INVALID":CPS FeatureLicenseManager does notprovide a name or CPS feature is notlicensed.
Corrective action: Make sure CPS"Feature" is specified infeatures.properties file and islicensed as contained in .lic file.
• OutOfCompliance -license_state="RATE_LIMITED":
CPS feature current number of sessionusage is > CPS "CORE" licensed sessioncount.
Corrective action: Purchase more licenseto support the required sessions.
CPS "feature" license related error:
• license_state="INVALID": CPSFeatureLicenseManager does not providea name or CPS feature is not licensed.
• OutOfCompliance -license_state="RATE_LIMITED": CPSfeature current number of session usageis > CPS "CORE" licensed session count.
• DeveloperMode: This alarm is generated when CPS is running in DeveloperMode. CPS keepsreminding the user that system is running in Developer Mode and instructs on how to clear theDeveloper Mode. CPS is running in Deveoper Mode, number of concurrent session is limited to100.
Alarm/Trap message: Using Developer mode (100 session limit). To use a license file, remove-Dcom.broadhop.developer.mode from /etc/broadhop/qns.conf file.
Alarm Code: 1105 - ERROR_DEVELOPER_MODE
Table 19: DeveloperMode
Corrective ActionPossible Cause
Clear 'DeveloperMode' flag to annotate thefollowing to make sure the consistency:
1 Remove the following line from the/etc/broadhop/qns.conf file:
-Dcom.broadhop.developer.mode=true.
2 Restart the Policy Server (QNS) process.
3 Within 5 minutes of interval, verify thegenerated alarm on NMS server and/var/log/snmp/trap of active PolicyDirector (load balancer).
CPS allows new session to be created. CPS isrunning in DeveloperMode and CPS currentsession usage is <= 100.
Message: Using Developer mode (100 sessionlimit). To use a license file, remove-Dcom.broadhop.developer.mode from/etc/broadhop/qns.conf file.
CPS MOG SNMP, Alarms, and Clearing Procedures Guide, Release 13.1.0 57
Clearing ProceduresApplication Notifications

Other Alarms
• PoliciesNotConfigured: The alarm is generated when the policy engine cannot find any policies toapply while starting up. This may occur on a new system, but requires immediate resolution for anysystem services to operate.
Alarm Code: 1001
This alarm is generated when server is started or when Publish operation is performed. As indicated bythe down status, policy configurations contains error - PB Configurations converted CPS Rules arefailed. Message contains the error detail.
Table 20: PoliciesNotConfigured - 1001
Corrective ActionPossible Cause
Corrective action needs to be taken as per the logmessage and corresponding configuration errorneeds to be corrected as mentioned in the logs.
This event is raised when exception occurs whileconverting policies to policy rules.
Message: 1001 Policies not configured.
Log file is logged with errormessage Exception stack trace islogged
Alarm Code: 1002
This alarm is generated when diagnostics.sh runs which provides last success/failure policies message.
The corresponding notification appears when Policy Builder configurations converted CPS rules arefailed during validation against "validation-rules".
Corrective action needs to be taken as per the log message and diagnostic result. Correspondingconfiguration error needs to be corrected as mentioned in the logs and diagnostic result.
Table 21: PoliciesNotConfigured - 1002
Corrective ActionPossible Cause
Make sure that policy engine is initialized.This event is raised when policy engine is notinitialized.
Message: Last policy configuration failed with themessage: Policy engine is notinitialized
Log file is logged with the warning message:Policy engine is not initialized
CPS MOG SNMP, Alarms, and Clearing Procedures Guide, Release 13.1.058
Clearing ProceduresApplication Notifications

Corrective ActionPossible Cause
To add policy root object in Policies.This event occurs when non policy root objectexists.
Message: Last policy configuration failed with themessage: Policy XMI file containsnon policy root object
Log file is logged with the error message: PolicyXML file contains non policy rootobject.
To add configures in Policies tab.This event occurs when policy does not contain aroot blueprint.
Message: Last policy configuration failed with themessage: Policy Builderconfigurations does not have anyPolicies configured under PoliciesTab.
Log file is logged with the error message: Policydoes not contain a root blueprint.Please add one under the policiestab.
Make sure that the blueprints are installed.The event occurs when configured blueprint ismissing.
Message: Last policy configuration failed with themessage: There is a configuredblueprint <configuredBlueprintId>for which the original blueprintis not found<originalBluePrintId>. You aremissing software on your serverthat is installed in PolicyBuilder.
Log file is logged with the error message: Thereis a configured blueprint<configuredBlueprintId> for whichthe original blueprint is notfound <originalBluePrintId>. Youare missing software on yourserver that is installed in PolicyBuilder.
CPS MOG SNMP, Alarms, and Clearing Procedures Guide, Release 13.1.0 59
Clearing ProceduresApplication Notifications

Corrective ActionPossible Cause
Correct policy configuration based on theexception.
This event occurs when error was detected whileconverting Policy Builder configuration to CPSRrules when the server restarts or when Publishhappens.
Message: Last policy configuration failed with themessage: exception stack trace.
Log file is logged with the error message:Exception stack trace is logged.
• RadiusServerDown: This alarm is generated when RADIUS AAA proxy server is unreachable. Themessage in the alarm would be Failed Ping on XXX in %ms ms.
Alarm Code: 4001 - RADIUS_SERVER_DOWN
Table 22: RadiusServerDown
Corrective ActionPossible Cause
Check the network connectivity between CPS andAAA server. It should be reachable from bothsides.
There could be network issue between CPS andAAA server.
Set the correct port number in AAA proxy settingin PB.
The port number configured on Radius AAAproxysetting could be incorrect.
Make sure the application on AAA is listening onthe port configured in PB.
The application on AAA server might not belistening on the port configured in PB.
• DiameterPeerDown: Diameter peer is down.Alarm Code: 3001 - DIAMETER_PEER_DOWN
Table 23: DiameterPeerDown
Corrective ActionPossible Cause
Check the status of the Diameter Peer, and if founddown, troubleshoot the peer to return it to service.
In case of a down alarm being generated but noclear alarm being generated, there could be apossibility of the peer actually being down.
Check the status of the Diameter Peer, and if foundUP, check the network connectivity between CPSand the Diameter Peer. It should be reachable fromboth sides.
In case of a down alarm being generated but noclear alarm being generated, there could be apossibility of a network connectivity issue.
CPS MOG SNMP, Alarms, and Clearing Procedures Guide, Release 13.1.060
Clearing ProceduresApplication Notifications

Corrective ActionPossible Cause
Check the network connectivity between CPS andthe Diameter Peer for intermittent issues andtroubleshoot the network connection.
In case of a down alarm getting generatedintermittently followed by a clear alarm, therecould be a possibility of an intermittent networkconnectivity issue.
1 Verify the changes recently made in PB bytaking the SVN diff.
2 Review all PB configurations related to theDiameter Peer (port number, realm, and so on)for any incorrect data and errors.
3 Make sure that the application on DiameterPeer is listening on the port configured in PB.
In case of an alarm raised after any recent PBconfiguration change, there may be a possibilityof the PB configurations related to the DiameterPeer being accidently not configured correctly.
• DiameterAllPeersDown: All diameter peer connections configured in a given realm are DOWN(connection lost). The alarm identifies which realm is down. The alarm is cleared when at least one ofthe peers in that realm is available.
Alarm Code: 3002 - DIAMETER_ALL_PEERS_DOWN
Table 24: DiameterAllPeersDown
Corrective ActionPossible Cause
Check the status of each Diameter Peer, and iffound down, troubleshoot each peer to return it toservice.
In case of a down alarm being generated but noclear alarm being generated, there could be apossibility of all the peer actually being down.
Check the status of the each Diameter Peer, and iffound up, check the network connectivity betweenCPS and each Diameter Peer. It should bereachable from each side.
In case of a down alarm being generated but noclear alarm being generated, there could be apossibility of a network connectivity issue.
Check the network connectivity between CPS andthe Diameter Peers for intermittent issues andtroubleshoot the network connection.
In case of a down alarm getting generatedintermittently followed by a clear alarm, therecould be a possibility of an intermittent networkconnectivity issue.
CPS MOG SNMP, Alarms, and Clearing Procedures Guide, Release 13.1.0 61
Clearing ProceduresApplication Notifications

Corrective ActionPossible Cause
1 Verify the changes recently made in PB bytaking the SVN diff.
2 Review all PB configurations related to eachpeer (port number, realm, and so on) for anyincorrect data and errors.
3 Make sure that the application on eachDiameter Peer is listening on the portconfigured in PB.
In case of an alarm raised after any recent PBconfiguration change, there may be a possibilityof the PB configurations related to the DiameterPeers being incorrect.
• DiameterStackNotStarted: This alarm is generated when Diameter stack cannot start on a particularpolicy director (load balancer) due to some configuration issues.
Alarm Code: 3004 - DIAMETER_STACK_NOT_STARTED
Table 25: DiameterStackNotStarted
Corrective ActionPossible Cause
Check the Policy Builder configuration.Specifically check for local endpoints configurationunder Diameter stack.
1 Verify localhost name defined is matching theactual hostname of the policy director (loadbalancer) VMs.
2 Verify instance number given matches with thepolicy director instance running on the policydirector (load balancer) VM.
3 Verify all the policy director (load balancer)VMs are added in local endpoint configuration.
In case of a down alarm being generated but noclear alarm being generated, Diameter stack is notconfigured properly or some configuration ismissing.
1 Verify the changes recently made in PB bytaking the SVN diff.
2 Review all PB configurations related to theDiameter Stack (local hostname, advertise fqdn,and so on) for any incorrect data and errors.
3 Make sure that the application is listening onthe port configured in PB in CPS.
In case of an alarm raised after a recent PBconfiguration change, there may be a possibilitythat the PB configurations related to the DiameterStack has been accidently misconfigured.
CPS MOG SNMP, Alarms, and Clearing Procedures Guide, Release 13.1.062
Clearing ProceduresApplication Notifications

• SMSC server connection down: SMSC Server is not reachable. This alarm gets generated when anyone of the configured active SMSC server endpoints is not reachable and CPS will not be able to delivera SMS via that SMSC server.
Alarm Code: 5001 - SMSC_SERVER_CONNECTION_STATUS
Table 26: SMSC server connection down
Corrective ActionPossible Cause
Check the status of the SMSC Server, and if founddown, troubleshoot the server to return it to service.
In case of a down alarm being generated but noclear alarm being generated, there could be apossibility of the SMSC Server actually beingdown.
Check the status of the SMSC Server, and if foundup, check the network connectivity between CPSand the Server. It should be reachable from bothsides.
In case of a down alarm being generated but noclear alarm being generated, there could be apossibility of a network connectivity issue.
Check the network connectivity between CPS andthe SMSC Server for intermittent issues andtroubleshoot the network connection.
In case of a down alarm getting generatedintermittently followed by a clear alarm, therecould be a possibility of an intermittent networkconnectivity issue.
1 Verify the changes recently made in PB bytaking the SVN diff.
2 Review all PB configurations related to SMSCServer (port number, realm, and so on) for anyincorrect data and errors.
3 Make sure that the application on SMSCServeris listening on the port configured in PB.
In case of an alarm raised after any recent PBconfiguration change, there may be a possibilityof the PB configurations related to the SMSCServer being incorrect.
• All SMSC server connections are down: None of the SMSC servers configured are reachable. ThisCritical Alarm gets generated when the SMSCServer endpoints are not available to submit SMSmessagesthereby blocking SMS from being sent from CPS.
Alarm Code: 5002 - ALL_SMSC_SERVER_CONNECTION_STATUS
Table 27: All SMSC server connections are down
Corrective ActionPossible Cause
Check the status of each SMSC Server, and iffound down, troubleshoot the servers to returnthem to service.
In case of a down alarm being generated but noclear alarm being generated, there could be apossibility of all the SMSC Servers actually beingdown.
CPS MOG SNMP, Alarms, and Clearing Procedures Guide, Release 13.1.0 63
Clearing ProceduresApplication Notifications

Corrective ActionPossible Cause
Check the status of each SMSC Server, and iffound up, check the network connectivity betweenCPS and each SMSCServer. It should be reachablefrom each side.
In case of a down alarm being generated but noclear alarm being generated, there could be apossibility of a network connectivity issue.
Check the network connectivity between CPS andthe SMSC Servers for intermittent issues andtroubleshoot the network connection.
In case of a down alarm getting generatedintermittently followed by a clear alarm, therecould be a possibility of an intermittent networkconnectivity issue.
1 Verify the changes recently made in PB bytaking the SVN diff.
2 Review all PB configurations related to SMSCServers (port number, realm, and so on) for anyincorrect data and errors.
3 Make sure that the application on each SMSCServer is listening on the respective portconfigured in PB.
In case of an alarm raised after any recent PBconfiguration change, there may be a possibilityof the PB configurations related to the SMSCServers being incorrect.
• Email Server not reachable: Email server is not reachable. This alarm (Major) gets generated whenany of the configured Email Server Endpoints are not reachable. CPS will not be able to use the serverto send emails.
Alarm Code: 5003 - EMAIL_SERVER_STATUS
Table 28: Email server is not reachable
Corrective ActionPossible Cause
Check the status of the Email Server, and if founddown, troubleshoot the server to return it to service.
In case of a down alarm being generated but noclear alarm being generated, there could be apossibility of the Email Server actually beingdown.
Check the status of Email Server, and if found up,check the network connectivity between CPS andthe Email Server. It should be reachable from bothsides.
In case of a down alarm being generated but noclear alarm being generated, there could be apossibility of a network connectivity issue.
Check the network connectivity between CPS andthe Email Server for intermittent issues andtroubleshoot the network connection.
In case of a down alarm getting generatedintermittently followed by a clear alarm, therecould be a possibility of an intermittent networkconnectivity issue.
CPS MOG SNMP, Alarms, and Clearing Procedures Guide, Release 13.1.064
Clearing ProceduresApplication Notifications

Corrective ActionPossible Cause
1 Verify the changes recently made in PB bytaking the SVN diff.
2 Review all PB configurations related to EmailServer (port number, realm, and so on) for anyincorrect data and errors.
3 Make sure that the application on Email Serveris listening on the port configured in PB.
In case of an alarm raised after any recent PBconfiguration change, there may be a possibilityof the PB configurations related to the EmailServer being incorrect.
• All Email servers not reachable: No email server is reachable. This alarm (Critical) gets generatedwhen all configured Email Server Endpoints are not reachable, blocking emails from being sent fromCPS.
Alarm Code: 5004 - ALL_EMAIL_SERVER_STATUS
Table 29: All Email servers not reachable
Corrective ActionPossible Cause
Check the status of each Email Server, and if founddown, troubleshoot the server to return it to service.
In case of a down alarm being generated but noclear alarm being generated, there could be apossibility of all the Email Servers actually beingdown.
Check the status of the each Email Server, and iffound up, check the network connectivity betweenCPS and each Email Server. It should be reachablefrom each side.
In case of a down alarm being generated but noclear alarm being generated, there could be apossibility of a network connectivity issue.
Check the network connectivity between CPS andthe Email Servers for intermittent issues andtroubleshoot the network connection.
In case of a down alarm getting generatedintermittently followed by a clear alarm, therecould be a possibility of an intermittent networkconnectivity issue.
1 Verify the changes recently made in PB bytaking the SVN diff.
2 Review all PB configurations related to EmailServers (port number, realm, and so on) for anyincorrect data and errors.
3 Make sure that the application on each EmailServer is listening on the respective portconfigured in Policy Builder.
In case of an alarm raised after any recent PBconfiguration change, there may be a possibilityof the PB configurations related to the EmailServers being incorrect.
CPS MOG SNMP, Alarms, and Clearing Procedures Guide, Release 13.1.0 65
Clearing ProceduresApplication Notifications

•MemcachedConnectError: This alarm is generated if attempting to connect to or write to thememcachedserver causes an exception.
Alarm Code: 1102 - MEMCACHED_CONNECT_ERROR
Table 30: MemcachedConnectError
Corrective ActionPossible Cause
Check the memcached process on lbvip02. If theprocess is stopped, start the process using thecommand monit start memcached assuming themonit service is already started.
The memcached process is down on lbvip02.
Check for connectivity issues from Policy Server(QNS) to lbvip02 using ping/telnet command. Ifthe network connectivity issue is found, fix theconnectivity.
The Policy Server VMs fail to reach/connect tolbvip02 or lbvip02:11211.
1 Check the parameter-DmemcacheClientTimeout inqns.conf file.If the parameter is not present, the defaulttimeout is 50 ms. So if the application pause is>= 50 ms, this issue can be seen. The pausecan be monitored in service-qns-x.logfile. The error should subside in the nextdiagnostics run if it was due to application GCpause.
2 Check for network delays for RTT from PolicyServer to lbvip02.
The test operation to check memcached servertimed out. This can happen if the memcachedserver is slow to respond/network delays OR if theapplication pauses due to GC. If the error is dueto application pause due to GC, it will mostly getresolved when the next diagnostics is run.
Check the exception message and if an exceptionis caused, during that time only, the diagnosticsfor memcached should pass in the next run. Checkif the memcached process is up on lbvip02. Alsocheck for network connectivity issues.
The test operation to check memcached serverhealth failed with exception.
• ZeroMQConnectionError: Internal services cannot connect to a required Java ZeroMQqueue. Althoughretry logic and recovery is available, and core system functions should continue, investigate and remedythe root cause.
Alarm Code: 3501 - ZEROMQ_CONNECTION_ERROR
CPS MOG SNMP, Alarms, and Clearing Procedures Guide, Release 13.1.066
Clearing ProceduresApplication Notifications

Table 31: ZeroMQConnectionError
Corrective ActionPossible Cause
1 Login to the IP mentioned in the alarm andcheck if the Policy Server (QNS) process is upon that VM. If it is not up, start the process.
2 Login to the IP mentioned in the alarm andcheck if the port mentioned in the alarm islistening using the netstat command).
netstat -apn | grep <port>
If not, check the Policy Server logs for anyerrors.
3 Check if the VMwhich raised the alarm is ableto connect to the mentioned socket using thetelnet command.
telnet <ip> <port>
If it is a network issue, fix it.
Internal services cannot connect to a required JavaZeroMQ queue. Although retry logic and recoveryis available, and core system functions shouldcontinue, investigate and remedy the root cause.
• LdapAllPeersDown: All LDAP peers are down.Alarm Code: 1201 - LDAP_ALL_PEERS_DOWN
Table 32: LdapAllPeersDown
Corrective ActionPossible Cause
Check if the external LDAP servers are up and ifthe LDAP server processes are up. If not, bring theservers and the respective server processes up.
All LDAP servers are down.
Check the connectivity from Policy Director (LB)to LDAP server. Check (using ping/telnet) if LDAPserver is reachable from Policy Director (LB) VM.If not, fix the connectivity issues.
Connectivity issues from the LB to LDAP servers.
• LdapPeerDown: LDAP peer identified by the IP address is down.Alarm Code: 1202 - LDAP_PEER_DOWN
CPS MOG SNMP, Alarms, and Clearing Procedures Guide, Release 13.1.0 67
Clearing ProceduresApplication Notifications

Table 33: LdapPeerDown
Corrective ActionPossible Cause
Check if the mentioned external LDAP server isup and if the LDAP server process is up on thatserver. If not, bring the server and the serverprocesses up.
Thementioned LDAP server in the alarmmessageis down.
Check the connectivity from Policy Director (LB)to mentioned LDAP server. Check (usingping/telnet) if LDAP server is reachable fromPolicy Director (LB) VM. If not, fix theconnectivity issues.
Connectivity issues from the Policy Director (LB)to the mentioned LDAP server address in thealarm.
• ApplicationStartError: This alarm is generated if an installed feature cannot start.
Alarm Code: 1103
Table 34: ApplicationStartError
Corrective ActionPossible Cause
1 Check which images are installed on whichCPS hosts by reading/var/qps/images/image-map.
2 Check which features are part of which imagesby reading/etc/broadhop/<image-name>/featuresfile.
A feature which cannot start must bein at least one of images.
Note
3 Check if feature which cannot start has its jarin compressed image archive of all imagesfound in above steps.
4 If jar is missing contact Cisco support forrequired feature. If jar is present, collect logsfrom /var/log/broadhop on VM wherefeature cannot start for further analysis.
This alarm is generated if installed feature cannotstart.
• VirtualInterface Down: This alarm is generated when the internal Policy Director (LB) VIP virtualinterface does not respond to a ping.
Alarm Code: 7405
CPS MOG SNMP, Alarms, and Clearing Procedures Guide, Release 13.1.068
Clearing ProceduresApplication Notifications

Table 35: VirtualInterface Down
Corrective ActionPossible Cause
No action is required since the alarm is clearedautomatically as long as a working Policy Director(LB) node gets the VIP address.
This alarm is generated when the internal PolicyDirector (LB) VIP virtual interface does notrespond to a ping. Corosync detects this andmovesthe VIP interface to another Policy Director (LB).The alarm then clears when the other node takesover and a ViritualInterface Up trap is sent.
1 Run diagnostics.sh on Cluster Manager asroot user to check for any failures on the PolicyDirector (LB) nodes..
2 Make sure that both policy director nodes arerunning. If problems are noted, refer to CPSTroubleshooting Guide for further stepsrequired to restore policy director node functionproblem.
3 After all the policy directors are up, if the trapstill does not clear, restart corosync on allpolicy directors using the monit restart
corosync command.
This alarm is generated when the internal PolicyDirector (LB) VIP virtual interface does notrespond to a ping and selection of a new VIP hostsfails.
• VM Down: This alarm is generated when the administrator is not able to ping the VM.
Alarm Code: 7401
Table 36: VM Down
Corrective ActionPossible Cause
1 Run diagnostics.sh on Cluster Manager asroot user to check for any failures.
2 For all VMs with FAIL, refer to CPSTroubleshooting Guide for further stepsrequired to restore the VM function.
This alarm is generated when a VM listed in the/etc/hosts does not respond to a ping.
• No Primary DB Member Found: This alarm is generated when the system is unable to find primarymember for the replica-set.
Alarm Code: 7101
CPS MOG SNMP, Alarms, and Clearing Procedures Guide, Release 13.1.0 69
Clearing ProceduresApplication Notifications

Table 37: No Primary DB Member Found
Corrective ActionPossible Cause
1 Login to pcrfclient01/02 VM and verify thereplica-set status
diagnostics.sh --get_replica_status
2 If the member is not running start the mongoprocess on each sessionmgr/arbiter VM
For example, e.g/etc/init.d/sessionmgr-port start
Change the port number (port)according to your deployment.
Note
3 Verify the mongo process, if the process doesnot come UP then verify the mongo logs forfurther debugging log.
For example, /var/log/mongodb-port.logChange the port number (port)according to your deployment.
Note
This alarm is generated during mongo failover orwhen majority of replica-set members are notavailable.
• Arbiter Down: This alarm is generated when the arbiter member of the replica-set is not reachable.
Alarm Code: 7103
CPS MOG SNMP, Alarms, and Clearing Procedures Guide, Release 13.1.070
Clearing ProceduresApplication Notifications

Table 38: Arbiter Down
Corrective ActionPossible Cause
1 Login to pcrfclient01/02 VM and verify thereplica-set status
diagnostics.sh --get_replica_status
2 Login to arbiter VM for which the alarm hasgenerated.
3 Check the status of mongo port for which alarmhas generated.
For example, ps –ef | grep 27720
4 If the member is not running, start the mongoprocess.
For example, /etc/init.d/sessionmgr-27720start
5 Verify the mongo process, if the process doesnot come UP then verify the mongo logs forfurther debugging log.
For example, /var/log/mongodb-port.logChange the port number (port)according to your deployment.
Note
This alarm is generate in the event of abrupt failureof arbiter VM and does not come up due to someunspecified reason (In HA - arbiter VM ispcrfclient01/02 and for GR - third site or based ondeployment model).
• Config Server Down: This alarm is generated when the configuration server for the replica-set isunreachable. This alarm is not valid for non-sharded replica-sets.
Alarm Code: 7104
CPS MOG SNMP, Alarms, and Clearing Procedures Guide, Release 13.1.0 71
Clearing ProceduresApplication Notifications

Table 39: Config Server Down
Corrective ActionPossible Cause
1 Login to pcrfclient01/02 VM and verify theshard health status
diagnostics.sh --get_shard_health
<dbname>
2 Check the status of mongo port for which alarmhas generated.
For example, ps –ef | grep 27720
3 If the member is not running, start the mongoprocess.
For example, /etc/init.d/sessionmgr-27720start
4 Verify the mongo process, if the process doesnot come UP then verify the mongo logs forfurther debugging log.
For example, /var/log/mongodb-port.logChange the port number (port)according to your deployment.
Note
This alarm is generated in the event of abruptfailure of configServer VM (whenmongo shardingis enabled) and does not come up due to someunspecified reasons.
• All DB Member of replica set Down: This alarm is generated when the system is not able to connectto any member of the replica-set.
Alarm Code: 7105
CPS MOG SNMP, Alarms, and Clearing Procedures Guide, Release 13.1.072
Clearing ProceduresApplication Notifications

Table 40: All DB Member of replica set Down
Corrective ActionPossible Cause
1 Login to pcrfclient01/02 VM and verify thereplica-set status
diagnostics.sh --get_replica_status
2 If the member is not running start the mongoprocess on each sessionmgr/arbiter VM
For example, e.g/etc/init.d/sessionmgr-port start
Change the port number (port)according to your deployment.
Note
3 Verify the mongo process, if the process doesnot come UP then verify the mongo logs forfurther debugging log.
For example, /var/log/mongodb-port.logChange the port number (port)according to your deployment.
Note
This alarm is generated in the event of abruptfailure of all sessionmgr VMs and does not comeup due to some unspecified reason or all membersare down.
• DB resync is needed: This alarm is generated whenever a manual resynchronization of a database isrequired to recover from a failure.
Alarm Code: 7106
Table 41: DB resync is needed
Corrective ActionPossible Cause
1 Login to pcrfclient01/02 VM and verify thereplica-set status
diagnostics.sh --get_replica_status
2 Check which member is in recovering/fatal orstartup2 state.
3 Login to that sessionmgr VM and check formongo logs.
Refer to CPS Troubleshooting Guide forrecover procedure.
This alarm is generated whenever a secondarymember of replica-set of mongo database does notrecover automatically after failure. For example,if sessionmgr VM is down for longer time and afterrecovery the secondary member does not recover.
• QNS Process Down: This alarm is generated when Policy Server (QNS) java process is down.
Alarm Code: 7301
CPS MOG SNMP, Alarms, and Clearing Procedures Guide, Release 13.1.0 73
Clearing ProceduresApplication Notifications

Table 42: QNS Process Down
Corrective ActionPossible Cause
1 Run diagnostics.sh on Cluster Manager asroot user to check for any failures..
2 OnVMwhere qns is down, run monit summary
to check if "monit" is monitoring policy server(QNS) process.
3 Analyze logs in /var/log/broadhopdirectory for exceptions and errors.
This alarm is generated if Policy Server (QNS)process on one of the CPS VMs is down.
• GxMessage processing Dropped: This alarm is generated for GxMessage CCR-I, CCR-U andCCR-Twhen processing of messages drops below 95% on qnsXX VM.
Alarm Code: 7302
Table 43: Gx Message processing Dropped
Corrective ActionPossible Cause
1 Login via Grafana dashboard and check for anyGx message processing trend.
2 Check CPU utilization on all the Policy Server(QNS) VMs via grafana dashboard.
3 Login to pcrfclient01/02 VM and check themongo database health.
diagnostics.sh --get_replica_status
4 Check for any unusual exceptions inconsolidated policy server (qns) and mongologs.
1 Gx traffic to the CPS system is beyond systemcapacity.
2 CPU utilization is very high on qnsXX VM.
3 Mongo database performance is not optimal.
• Gx Average Message processing Dropped: This alarm is generated for Gx Message CCR-I, CCR-Uand CCR-T when average message processing is above 20ms on qnsXX VM.
Alarm Code: 7303
CPS MOG SNMP, Alarms, and Clearing Procedures Guide, Release 13.1.074
Clearing ProceduresApplication Notifications

Table 44: Average Gx Message processing Dropped
Corrective ActionPossible Cause
1 Login via Grafana dashboard and check for anyGx message processing trend.
2 Check CPU utilization on all the Policy Server(QNS) VMs via grafana dashboard.
3 Login to pcrfclient01/02 VM and check themongo database health.
diagnostics.sh --get_replica_status
4 Check for any unusual exceptions inconsolidated policy server (qns) and mongologs.
1 Gx traffic to the CPS system is beyond systemcapacity.
2 CPU utilization is very high on qnsXX VM.
3 Mongo database performance is not optimal.
• Percentage of LDAP retry threshold Exceeded: This alarm is generated for LDAP search querieswhen LDAP retries compared to total LDAP queries exceeds 10% on qnsXX VM.
Alarm Code: 7304
Table 45: Percentage of LDAP retry threshold Exceeded
Corrective ActionPossible Cause
1 Check connectivity betweenCPS and all LDAPservers configured in Policy Builder.
2 Check latency between CPS to all LDAPservers and LDAP server response time shouldbe normal.
3 Restore connectivity if any LDAP server isdown.
Multiple LDAP servers are configured and LDAPservers are down.
• LDAP Requests as percentage of CCR-I Dropped: This alarm is generated for LDAP operationswhen LDAP requests as percentage of CCR-I (Gx messages) drops below 25% on qnsXX VM.
Alarm Code: 7305
CPS MOG SNMP, Alarms, and Clearing Procedures Guide, Release 13.1.0 75
Clearing ProceduresApplication Notifications

Table 46: LDAP Requests as percentage of CCR-I Dropped
Corrective ActionPossible Cause
1 Check connectivity betweenCPS and all LDAPservers configured in Policy Builder.
2 Check latency between CPS to all LDAPservers and LDAP server response time shouldbe normal.
3 Check policy server (qns) logs on policydirector (lb) VM for which alarm has beengenerated.
1 Gx traffic to the CPS system is beyond systemcapacity.
2 CPU utilization is very high on qnsXX VM.
3 Mongo database performance is not optimal.
• LDAPQuery Result Dropped: This alarm is generated when LDAP Query Result goes to 0 on qnsXXVM.
Alarm Code: 7306
Table 47: LDAP Query Result Dropped
Corrective ActionPossible Cause
1 Check connectivity betweenCPS and all LDAPservers configured in Policy Builder.
2 Check latency between CPS to all LDAPservers and LDAP server response time shouldbe normal.
3 Restore connectivity if any LDAP server isdown.
Multiple LDAP servers are configured and LDAPservers are down.
• LDAP Request Dropped: This alarm is generated for LDAP operations when LDAP requests dropbelow 0 on lbXX VM.
Alarm Code: 7307
CPS MOG SNMP, Alarms, and Clearing Procedures Guide, Release 13.1.076
Clearing ProceduresApplication Notifications

Table 48: LDAP Request Dropped
Corrective ActionPossible Cause
1 Check connectivity betweenCPS and all LDAPservers configured in Policy Builder.
2 Check latency between CPS to all LDAPservers and LDAP server response time shouldbe normal.
3 Check policy server (qns) logs on policydirector (lb) VM for which alarm has beengenerated.
Gx traffic to the CPS system is increased beyondsystem capacity.
CPS MOG SNMP, Alarms, and Clearing Procedures Guide, Release 13.1.0 77
Clearing ProceduresApplication Notifications

CPS MOG SNMP, Alarms, and Clearing Procedures Guide, Release 13.1.078
Clearing ProceduresApplication Notifications