CPGE Surfactant-Based Enhanced Oil recovery Processes and Foam Mobility Control Task 4: Simulation...
49
CPGE Surfactant-Based Enhanced Oil recovery Processes and Foam Mobility Control Task 4: Simulation of Field-Scale Processes Center for Petroleum and Geosystems Engineering The University of Texas at Austin Austin, Texas • June 4, 2005 Mojdeh Delshad Gary Pope Glen Anderson Hourshad Mohammadi Nariman Fathi
-
Upload
augustine-brooks -
Category
Documents
-
view
216 -
download
0
Transcript of CPGE Surfactant-Based Enhanced Oil recovery Processes and Foam Mobility Control Task 4: Simulation...
CPGE
Surfactant-Based Enhanced Oil recovery Processes and Foam Mobility Control
Task 4: Simulation of Field-Scale Processes
Center for Petroleum and Geosystems EngineeringThe University of Texas at Austin
Austin, Texas • June 4, 2005
Mojdeh Delshad Gary Pope
Glen Anderson Hourshad Mohammadi
Nariman Fathi

CPGE
Objectives
• Design and optimize a surfactant flood for
Midland Farm oil reservoir
• Study the effect of wettability on the performance
of surfactant flood
• Literature survey on effect of wettability on
petrophysical properties
• Develop and implement a procedure to model
wettability alteration

CPGE
Base Case Midland Farms Simulation
• Matching Water Injection Rate
- Permeability Field
- Relative Permeability Curves
- Waterflood Injection Rate
• Design Parameters
• Base Case Results
- Production Rates
- Cumulative Oil Recovery
- Production History
- Oil Saturation Profiles
- Surfactant Concentration Profiles
- Residual Oil Saturation Profiles
• Sensitivity Analysis

CPGE
Permeability Field
Stochastic Permeability Field
Vdp=0.75
x = y = 20 ft
z = 4 ft

CPGE
Relative Permeability Curves
Corey Type Parameters
0
0.1
0.2
0.3
0.4
0.5
0.6
0.7
0.8
0.9
1
0 0.1 0.2 0.3 0.4 0.5 0.6 0.7 0.8 0.9 1
Sw
krj
Water
Oil
krwo = 0.4
kroo = 0.6
nw = 2
no = 2
Swr = 0.29
Sor = 0.33

CPGE
Water Injection Rate and Phase Cut during Waterflood
0
100
200
300
400
500
600
700
800
900
1000
1100
1200
1300
1400
1500
1600
0 1 2 3 4 5 6 7
Years Injected
Wat
er In
ject
ion
Rat
e d
uri
ng
W
ater
flo
od
(b
bl/d
ay)
0
0.1
0.2
0.3
0.4
0.5
0.6
0.7
0.8
0.9
1
Wat
er P
has
e C
ut
at P
rod
uce
r
RatePhase Cut

CPGE
Design Parameters
Grid 11x11x5 WF Endpoint Mobility Ratio 4.76Dimensions (20 acre well spacing per prod) 660x660x30 Dykstra-Parsons Coefficient 0.75Depth to Pay 4700 ft x- and y-direction Correlation Length 20Water Density 62.43 lb/ft3 z-direction Correlation Length 4
Oil Density 54.33 lb/ft3Water Flood to get to 98% Water Cut 1.8 PV
Water Viscosity 0.7 cp Initial Salinity 1.026 meq/mL
Oil Viscosity 5 cp Surfactant Adsorption 0.3 mg/g
Initial Pressure 1975 psi Polymer Adsorption 10 g/g
Reservoir Temperature 103 oF Surfactant Slug (2 vol %) 0.25 PV
Arithmetic Mean Permeability 80 md Polymer Concentration in Slug 1000 ppm
Geometric Mean Permeability 31.2 md Slug Salinity 0.445 meq/mL
kx/ky 1 Polymer Drive 2 PV
kx/kz 0.1 Polymer Concentration in Drive 1000 ppm
Porosity 0.16 Drive Salinity 0.34 meq/mL
Water/Oil IFT 20 dynes/cmInjection Pressure 2500 psiProducing Pressure 300 psiSkin -3

CPGE
DL-DOE-119: 1.5%N67-7POS,0.5%C2024, 4% SBA, 1% Na2CO3 0.125% Alcomer 60RD w./ MF2 Crude @ 38C
02468
101214161820222426283032
0.0 0.2 0.4 0.6 0.8 1.0 1.2 1.4 1.6 1.8 2.0 2.2 2.4 2.6
NaCl concentration (wt%)
So
lub
liza
tio
n R
ati
o (
cc
/cc
) . Oil Sol. Ratio after 1 Day
Water Sol. Ratio after 1 Day
UTCHEM Oil
UTCHEM Water
CPGE
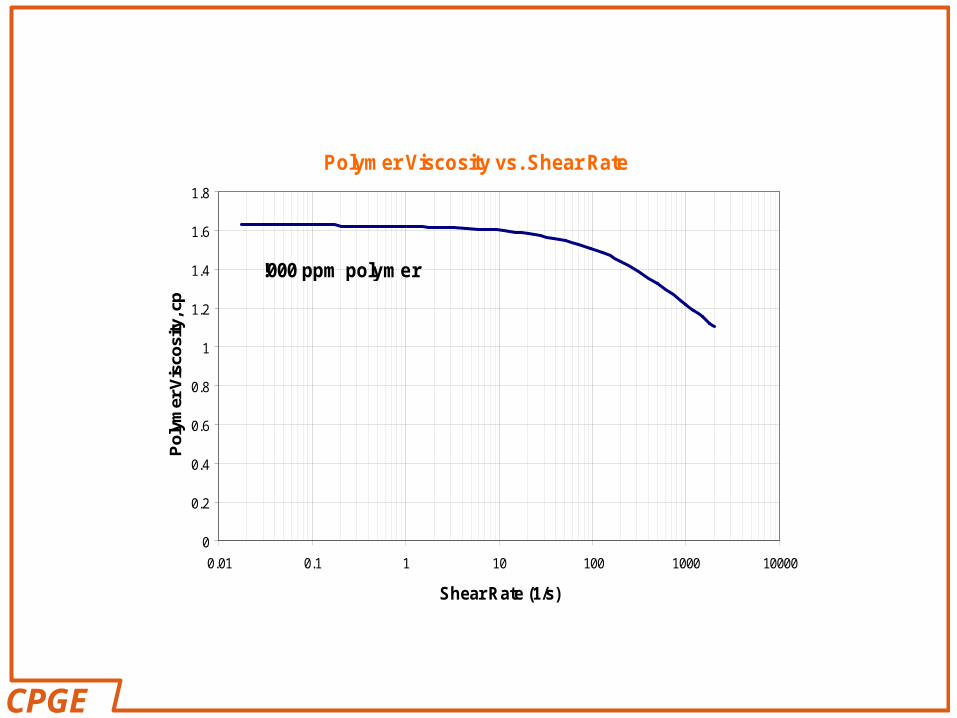
Polymer Viscosity vs. Shear Rate
0
0.2
0.4
0.6
0.8
1
1.2
1.4
1.6
1.8
0.01 0.1 1 10 100 1000 10000
Shear Rate (1/s)
Po
lym
er V
isco
sity
, cp
!000 ppm polymer

CPGE
Chemical Flood Production Rates (1 PV Polymer Drive)
0
200
400
600
800
1000
1200
1400
0 1 2 3 4 5 6 7 8 9
Time, Years
Wat
er P
rod
uct
ion
rat
e, B
bls
/d
0
20
40
60
80
100
120
140
160
180
Oil
Pro
du
ctio
n R
ate,
Bb
ls/d
ay

CPGE
Chemical Flood Oil Recovery(1 PV Polymer Drive)
0%
10%
20%
30%
40%
50%
60%
70%
80%
90%
100%
0 1 2 3 4 5 6 7 8 9
Time, Years
Incr
emen
tal
Oil
Pro
du
ced
, %
RO
IP

CPGE
Produced Phase Cuts during Chemical Flood(1 PV Polymer Drive)
0
0.1
0.2
0.3
0.4
0.5
0.6
0.7
0.8
0.9
1
0 0.1 0.2 0.3 0.4 0.5 0.6 0.7 0.8 0.9 1 1.1 1.2 1.3
Pore Volumes Injected
Pro
du
ced
Ph
ase
Cu
ts(v
olu
me
frac
tio
n)
WaterOilMicroemulsion

CPGE
Produced Chemical Concentrations(1 PV Polymer Drive)
0
0.005
0.01
0.015
0.02
0.025
0.03
0.035
0.04
0 0.2 0.4 0.6 0.8 1 1.2 1.4
Pore Volumes Injected
Pro
du
ced
Su
rfac
tan
t C
on
cen
trat
ion
(v
olu
me
frac
tio
n)
0
0.01
0.02
0.03
0.04
0.05
0.06
0.07
0.08
0.09
0.1
Pro
du
ced
Po
lym
er C
on
cen
trat
ion
(w
eig
ht
frac
tio
n)
SurfactantPolymer

CPGE
Oil Saturation During Chemical Flooding 0.2 PV 0.75 PV
1.25 PV

CPGE
Surfactant Concentration
0.2 PV 0.75 PV
1.25 PV

CPGE
Reservoir and Fluid Properties
LxWxH 660x660x30 ft
Grid Blocks 11x11x5
Depth to Pay 4700 ft
Initial Pressure 1975 psi
Reservoir Temperature 103 oF
Average Permeability 80 md
Porosity 0.16
Water Compressibility 3x10⁻⁶ psi-1
Oil Compressibility 1x10⁻⁵ psi-1
Water Density 62.43 lb/ft3
Oil Density 54.33 lb/ft3
Water Viscosity 0.7 cp
Oil Viscosity 5 cp
Water/Oil IFT 20 dynes/cm
Constant Injection Rate 250 bbl/day
Constant Production Pressure 300 psi

CPGE
Effect of Wettability on Sor
0
0.05
0.1
0.15
0.2
0.25
0.3
0.35
0.4
0.45
-1 -0.75 -0.5 -0.25 0 0.25 0.5 0.75 1Iw
So
r
Jadhunandan and Morrow, 1991Owolabi and Watson, 1993
Chen et al, 2004

CPGE
CDC for Berea Sandstone (Amaefule 1982)
0
0.05
0.1
0.15
0.2
0.25
0.3
0.35
0.4
0.45
0.5
1.0E-07 1.0E-06 1.0E-05 1.0E-04 1.0E-03 1.0E-02 1.0E-01 1.0E+00
Capillary Number
Res
idu
al P
has
e S
atu
rati
on
(F
rac.
of
PV
)
OilWater
Oil Ncc
Water Ncc

CPGE
CDC in Berea Sandstone (Mohanty 1983)
0.00
0.10
0.20
0.30
0.40
0.50
0.60
1.0E-07 1.0E-06 1.0E-05 1.0E-04 1.0E-03 1.0E-02 1.0E-01 1.0E+00
Capillary Number
Res
idu
al O
il S
atu
rati
on
(F
rac.
of
PV
)
Oil WetWater WetMixed Wet

CPGE
CDC in Carbonates (Kamath 2001)
0
0.1
0.2
0.3
0.4
0.5
0.6
0.7
0.8
0.9
1
1.00E-09 1.00E-08 1.00E-07 1.00E-06 1.00E-05 1.00E-04 1.00E-03 1.00E-02
Capillary Number
Res
idu
al O
il S
atu
rati
on
(F
rac.
of
PV
) Iw = -0.25Iw = -0.19Iw = -0.04

CPGE
Permeability Distribution
md

CPGE
Effect of Wettability on Relative Permeability
0
0.1
0.2
0.3
0.4
0.5
0.6
0.7
0.8
0.9
1
0 0.1 0.2 0.3 0.4 0.5 0.6 0.7 0.8 0.9 1
Water Saturation (Frac. of PV)
Re
lati
ve
Perm
ea
bil
ity
(Fra
c. o
f A
bs
. P
erm
.)
Case #1Case #4
Case #2 and #3

CPGE
Effect of Wettability on Capillary Pressure
-15.000
-10.000
-5.000
0.000
5.000
10.000
15.000
0 0.1 0.2 0.3 0.4 0.5 0.6 0.7 0.8 0.9 1
Water Saturation (Frac. of PV)
Cap
illar
y P
ress
ure
(p
si)
Case #1
Case #4
Case #2 and #3

CPGE
Effect of Wettability on Waterflood Recovery
0
10
20
30
40
50
60
70
0 0.25 0.5 0.75 1 1.25 1.5 1.75 2 2.25 2.5 2.75 3 3.25 3.5
Pore Volumes of Waterflood
Cu
mu
lati
ve
Oil
Re
co
ve
ry (
%O
OIP
)
Case #1
Case #2
Case #3
Case #4
CPGE
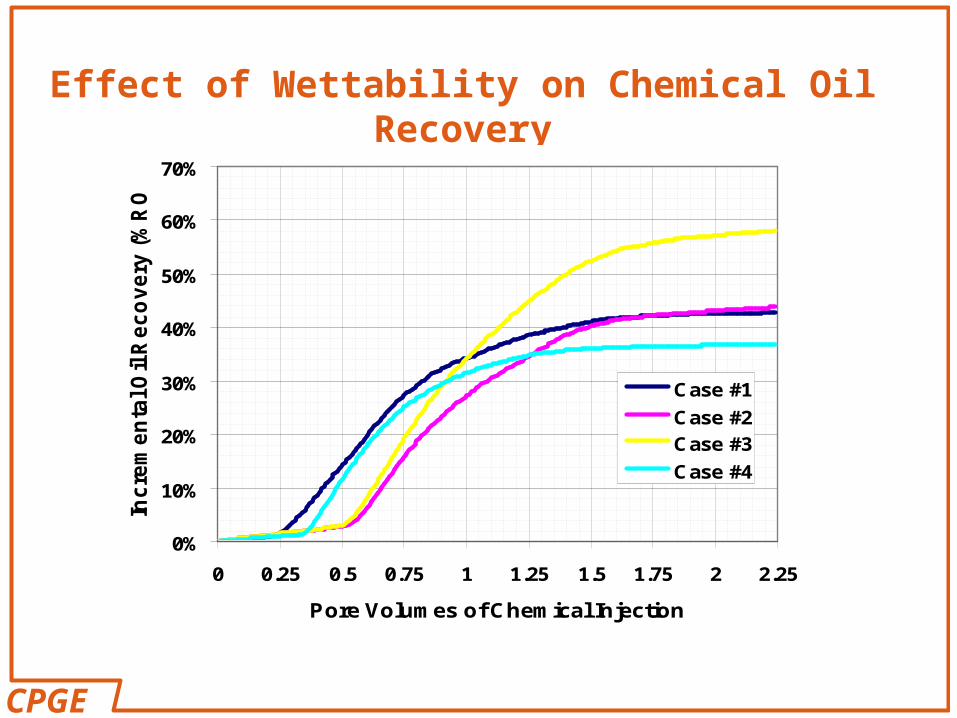
Effect of Wettability on Chemical Oil Recovery
0%
10%
20%
30%
40%
50%
60%
70%
0 0.25 0.5 0.75 1 1.25 1.5 1.75 2 2.25
Pore Volumes of Chemical Injection
Inc
rem
en
tal O
il R
ec
ov
ery
(%
RO
IP)
Case #1
Case #2
Case #3
Case #4

CPGE
Effect of Wettability on Reservoir Pressure
0
1000
2000
3000
4000
5000
6000
7000
0 0.25 0.5 0.75 1 1.25 1.5 1.75 2 2.25
Pore Volumes of Chemical Injection
Av
era
ge
Re
se
rvo
ir P
res
su
re (
ps
i)
Case #1
Case #2
Case #3
Case #4

CPGE
Effect of Wettability on Oil Production Rate
0
50
100
150
200
250
300
350
0 0.25 0.5 0.75 1 1.25 1.5 1.75 2 2.25
Pore Volumes of Chemical Injection
Oil P
rod
uc
tio
n R
ate
(S
TB
/D) Case #1
Case #2
Case #3
Case #4

CPGE
Oil Saturation during Waterflood (Waterwet Case)
0.2 PV
0.9 PV

CPGE
Oil Saturation during Waterflood (Mixedwet Case)
1.0 PV
3.5 PV

CPGE
Oil Saturation during Waterflood (Oilwet Case)
0.3 PV
1.9 PV

CPGE
Oil Saturation during Surfactant Flood (Waterwet Case)
0.25 PV
0.75 PV
2.25 PV

CPGE
Oil Saturation during Surfactant Flood (Mixedwet Case)
0.25 PV
0.75 PV
2.25 PV

CPGE
Oil Saturation during Surfactant Flood (Oilwet Case)
0.25 PV
0.75 PV
2.25 PV

CPGE
Surfactant concentration at 0.75 PV
Waterwet Mixedwet
Oilwet

CPGE
Final Oil Saturation
Waterwet Mixedwet
Oilwet

CPGE
Wettability Alteration
Wettability Index vs. surfactant properties
Residual saturation
Relative Permeability
Capillary pressure
Capillary desaturation

CPGE
Model 1: Wettability Effect Only
Read the table of water and relative permeabilities vs. water saturation for the in-situ wettability i.e mixed-wet
Read the table of water-oil capillary pressure vs. water saturation for the in-situ wettability
Read another set of tables for the altered wettability i.e water-wet
Check the gridblock value of surfactant concentration at each time step
Switch the tables if the surfactant concentration is above an input tolerance

CPGE
Model 2: Effect of Wettability and Mobilization
Relative permeability curves for oil and
water at two extreme wettability conditions
Capillary pressure curves for two extreme
strongly water-wet and strongly oil-wet
Capillary desaturation curves for each
phase at the two extreme conditions of
wettability

CPGE
Model 2 - Linear Interpolation
Strongly water-Wet
Relative permeability at low
IFT
Capillary desaturation curves
Relative permeability at high
IFT
Strongly Oil-Wet
Relative permeability at low
IFT
Capillary desaturation curves
Relative permeability at high
IFT
wwrjk
owrjk
CPGE
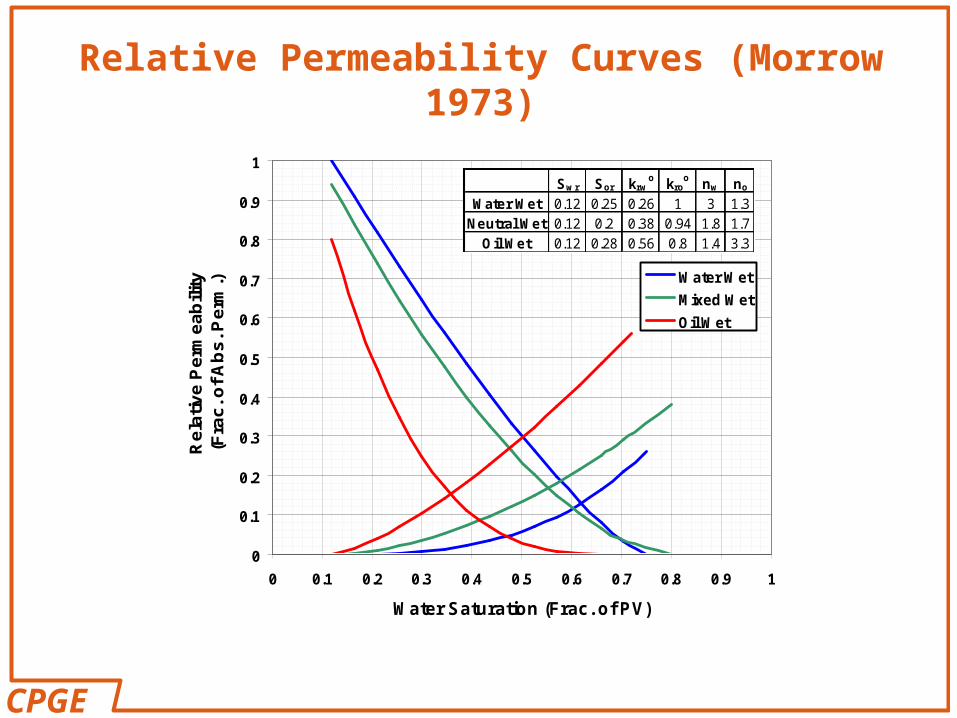
Relative Permeability Curves (Morrow 1973)
0
0.1
0.2
0.3
0.4
0.5
0.6
0.7
0.8
0.9
1
0 0.1 0.2 0.3 0.4 0.5 0.6 0.7 0.8 0.9 1
Water Saturation (Frac. of PV)
Re
lati
ve
Pe
rme
ab
ility
(F
rac
. of
Ab
s. P
erm
.) Water Wet
Mixed Wet
Oil Wet
Sw r Sor krwo kro
o nw no
Water Wet 0.12 0.25 0.26 1 3 1.3Neutral Wet 0.12 0.2 0.38 0.94 1.8 1.7
Oil Wet 0.12 0.28 0.56 0.8 1.4 3.3

CPGE
High NC Relative Permeability
Calculate relative permeability endpoints
Calculate relative permeability exponent
lowhighlow orj
orjhigh
r'jlow
r'j
r'jlow
r'jorj
orj kk*
SS
SSkk
lowj
highjhigh
r'jlow
r'j
r'jlow
r'jlowjj nn*
SS
SSnn

CPGE
Model 2 - Linear Interpolation
wwrkF1ow
rkFmwrk
F = constant
surfC
adssurfC
F Or
Or Develop new relationship based on lab. data

CPGE
Model 3: Under Development!
• Determine the Wettability Index in each gridblock and each time step based on surfactant property
• Compute residual saturations as a function of Wettability Index Amott-Harvey Wettability Index versus Residual Fluid
Saturation
0
0.2
0.4
0.6
0.8
1
-1 -0.75 -0.5 -0.25 0 0.25 0.5 0.75 1
Ammot-Harvey Wettability Index
No
rmalized
Resid
ual
Flu
id S
atu
rati
on

CPGE
Sor vs Wettability Correlation
0
0.05
0.1
0.15
0.2
0.25
0.3
0.35
0.4
0.45
-1 -0.5 0 0.5 1Iw
So
r
Berea - Jadhunandan and Morrow, 1991
0
0.05
0.1
0.15
0.2
0.25
0.3
0.35
0.4
-1 -0.5 0 0.5 1Iw
So
r
Berea - Chen et al. 2004
0
0.05
0.1
0.15
0.2
0.25
0.3
0.35
0.4
-1 -0.8 -0.6 -0.4 -0.2 0 0.2 0.4 0.6 0.8 1 1.2Iw
So
r
Portland Chalk - Graue

CPGE
Sor vs. Wettability Index for Berea Core
0
0.1
0.2
0.3
0.4
0.5
-1 -0.5 0 0.5 1Iw
So
r
Jadhunandan and Morrow, 1991Owolabi and Watson, 1993Chen et al, 2004

CPGE
Normalized Residual Oil Saturation vs.
Wettability Index (All Data)
0
0.1
0.2
0.3
0.4
0.5
0.6
0.7
0.8
0.9
1
-1 -0.5 0 0.5 1Iw
No
rma
lize
d S
or

CPGE
Wettability and CDC
0
0.1
0.2
0.3
0.4
1.E-07 1.E-05 1.E-03 1.E-01
Capillary Number
So
r
Lab
Model
Indiana Limestone (Abrams)
0
0.1
0.2
0.3
0.4
0.5
1.E-07 1.E-06 1.E-05 1.E-04 1.E-03 1.E-02 1.E-01 1.E+00
Capillary Number
Res
idu
al S
atu
rati
on
Data - Oil
Model -Oil
Data- Water
Model -Water
Berea Sandstone (Gupta)
L
PwkcN
cj
jrcjrwjrcjr NT1
SSSS
Capillary Number
CPGE
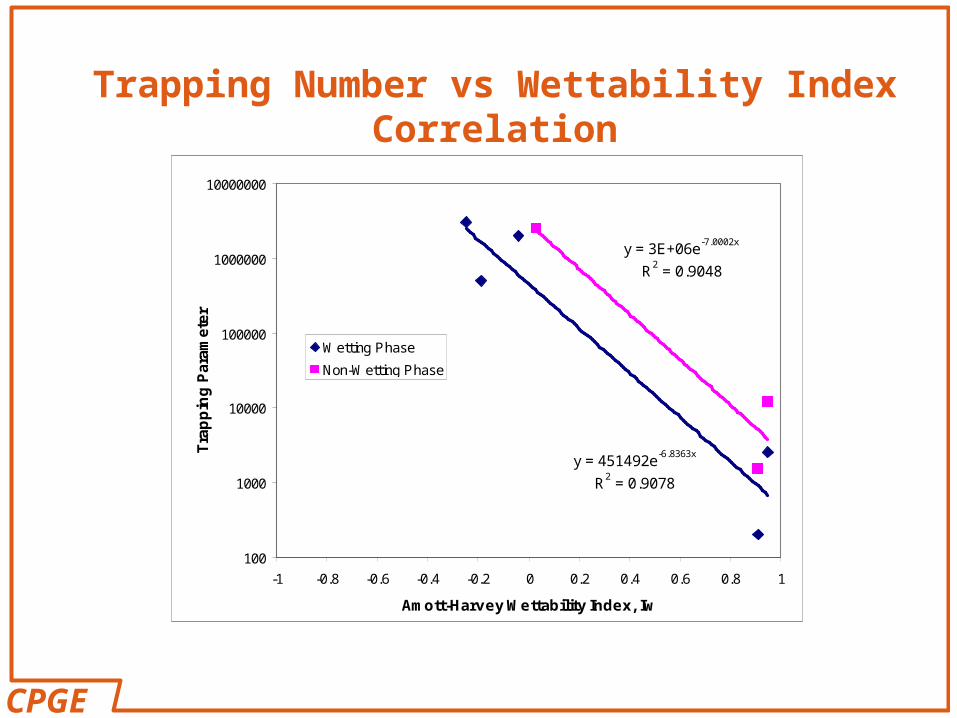
Trapping Number vs Wettability Index Correlation
y = 451492e-6.8363x
R2 = 0.9078
y = 3E+06e-7.0002x
R2 = 0.9048
100
1000
10000
100000
1000000
10000000
-1 -0.8 -0.6 -0.4 -0.2 0 0.2 0.4 0.6 0.8 1
Amott-Harvey Wettability Index, Iw
Tra
pp
ing
Pa
ram
ete
r
Wetting Phase
Non-Wetting Phase

CPGE
Computation Procedure
• Establish relative permeability, capillary pressure, and capillary desaturation curves for initial and altered wettability conditions
• Determine the change in Wettability Index (IW) in the presence of surfactant
• Develop a correlation between residual saturation and IW
• Develop a correlation between trapping number and IW
• Compute high capillary number relative permeability for altered wettability