CPA Congress 2014 Andrew Barr MLA Deputy Chief Minister Treasurer Minister for Economic Development...
14
-
Upload
agatha-williams -
Category
Documents
-
view
221 -
download
0
Transcript of CPA Congress 2014 Andrew Barr MLA Deputy Chief Minister Treasurer Minister for Economic Development...

CPA Congress 2014
Andrew Barr MLADeputy Chief Minister
Treasurer Minister for Economic Development
Minister for Tourism & EventsMinister for Housing

Growth, Diversification and Jobs

Competitive strengths and priorities
• ACT exported $1.27 billion of services in 2013 calendar year.
• ACT has 1.6% of Australia’s population, but 2.3% of its service exports.
• ACT’s service exports have averaged 7.3% annual growth over the last decade.
• Exports include:
• $624 million in travel exports (incl. Business- and education-related travel)
• $299 million in government goods and services
• $265 million in business services (incl. R&D services)

Competitive strengths and priorities• Defence and security
• Department of Defence spends $1 billion p.a. directly in ACT and procures further $15 billion p.a. throughout Australia, generally by Canberra-based decision makers.
• Digital economy and e-government
• World class innovators and digital infrastructure along with major institutions such as NICTA and ANU. Approx. 25% of government expenditure on R&D in this arena occurs in Canberra.
• Health and Sports Science
• World-class health system servicing a population of 800,000. Home to AIS, John Curtin School of Medical Research and University of Canberra Sports Hub.

Competitive strengths and priorities• Innovation and higher education
• More than 35,000 university students, including more than 10,000 international students across five university campuses.
• Space, satellite and spatial sciences
• Trailblazing observatories and facilities such as the Advanced Instrumentation and Technology Centre and Canberra Deep Space Communication Complex including the largest antenna in the Southern Hemisphere.
• Tourism infrastructure
• High yielding business travel market, above national average occupancy rates, high average takings and a strategic approach to growing regional tourism growth.

CBR Innovation Network and Invest Canberra
• Supporting ACT trade and investment activities in Singapore, Hong Kong, China and USA.
• Generated 100 leads in first year with around 20 currently being case managed.
• Linking businesses and entrepreneurs to accelerate innovation and growth to maximise wealth creation
• Independent not-for-profit company with ANU, CSIRO, NICTA, UC and UNSW (Canberra) as foundation members and financial contributors.

The right business environment
• Single level of government to deal with – combined state and municipal functions
• Strong ongoing regulatory reform agenda. E.g.:
• Extending maximum terms for business licences
• Simplifying fee structures
• Streamlining government procurement processes
• Highest payroll tax threshold in Australia
• Fairer, simpler and more efficient tax regime

Taxation reformMaking taxes fairer, simpler and more efficient
• Abolishing duty on insurance• Phasing out Conveyance Duty• Abolished commercial Land Tax• Increasing Payroll Tax thresholds• Abolished duty on short-term
leases• Abolished duty on transfer of sub-
leases
Replace revenue through…
• Increased General Rates • Commercial• Residential, with
enhanced concessions

Actual Actual Actual Actual Actual Actual Actual Actual Actual Actual Est Est Est Est Est03-04 04-05 05-06 06-07 07-08 08-09 09-10 10-11 11-12 12-13 13-14 14-15 15-16 16-17 17-18
0
100,000
200,000
300,000
400,000
500,000
600,000
700,000
Actual Expenditure Estimated Expenditure Capital Provision
Capital Works Expenditure Program
Source: ACT 2014-15 Budget Papers

Capital Metro: $1 billion economic benefit

Note: The Net Operating Balance is presented on an Australian Accounting Standards (AAS) basis up until 2005 06 and reflects the Annual Consolidated Financial Statements. From 2006-07, the Net Operating Balance is presented on a Headline ‑basis, the ACT’s key fiscal indicator. This indicator is a representation of the AAS Net Operating Balance from transactions adjusted for the investment return differential on superannuation investments.
Historical Net Operating Balance Analysis20
01-0
2
2002
-03
2003
-04
2004
-05
2005
-06
2006
-07
2007
-08
2008
-09
2009
-10
2010
-11
2011
-12
2012
-13
2013
-14
2014
-15
2015
-16
2016
-17
2017
-18
-400
-300
-200
-100
0
100
200
300
400Actual Estimate
$ m
illio
ns
C’wlth contractionGFC
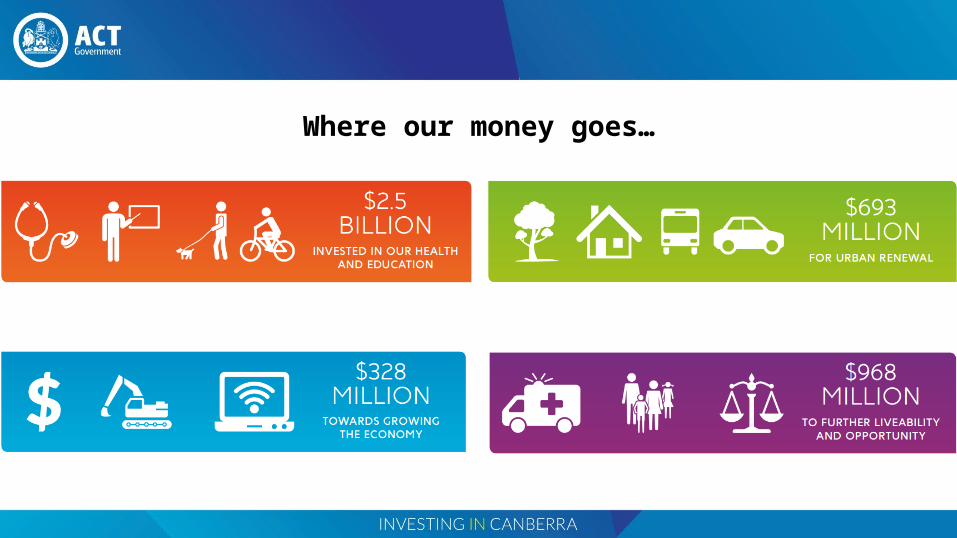
Where our money goes…