Cowry market review for 2015 and outlook for 2016
89
Cowry Asset Management Limited Page 1 Report Date:, Jan 2016 Cowry Research Review of 2015 & Outlook for 2016
-
Upload
tobi-ajayi -
Category
Economy & Finance
-
view
310 -
download
0
Transcript of Cowry market review for 2015 and outlook for 2016

Cowry Asset Management Limited Page 1
����
����
Report Date:, Jan 2016
Cowry Research
Review of 2015 & Outlook for 2016

2015 Review & Outlook for 20162015 Review & Outlook for 20162015 Review & Outlook for 20162015 Review & Outlook for 2016 ��
Cowry Asset Management Limited Page 2
Table�of�Contents�
Executive�Summary� � � � � � � � 3�
Global�Economy� � � � � � � � 4�
Nigerian�Real�Sector�Update�� � � � � � � 9�
External�Sector�Update� � � � � � � 27�
Government�Sector�Update� � � � � � � 33�
Monetary�Sector�Update� � � � � � � 36�
Money�Market�Review�� � � � � � � 37�
Foreign�Exchange�Market�Review� � � � � � 44�
Bond�Market�Review� � � � � � � � 48�
Equities�Market�Review� � � � � � � 54�
Political�Review� � � � � � � � 70�
Outlook�for�2016� � � � � � � � 83�
����
����
����
����

2015 Review & Outlook for 20162015 Review & Outlook for 20162015 Review & Outlook for 20162015 Review & Outlook for 2016 ��
Cowry Asset Management Limited Page 3
Executive�SummaryExecutive�SummaryExecutive�SummaryExecutive�Summary����
� In� the�October� 2015�World� Economic�Outlook� (WEO)�Update,� global� growth�
projection� for� 2015�was� revised� lower� to� 3.1%�(0.2ppt� below� forecast� in� the�
July�2015�and�0.3ppt�lower�than�forecast�in�2014).�The�lower�growth�forecast�
was�mainly�on� the�back�of�weaker�prospects�for�some� large�emerging�market�
economies�and�crude�oil�exporting�countries.�
� The� year� 2015� was� largely� sluggish� for� Nigerian� economy� as� it� recorded�
declining�growth�rates� in�the�first�two�quarters.�As�the�general�elections�took�
centre� stage,� implementation� of� the� N4.35� trillion� 2015� appropriation� Act,�
which�was�85.8%�skewed�towards�recurrent�expenditure,�took�the�back�seat�
� Inflation� remained� in� single� digits� throughout� 2015,� howbeit,� above� the�
monetary�authority’s� inflation�target�of�between�6%�and�9%.�The� increase� in�
general� price� level� during� the� year�was� partly� due� to� structural� effects.� As� a�
result,�annual�change�in�headline�inflation�rose�from�8.2%�in�January�to�9.4%�
in�November.�
� Despite� the� initial� enthusiasm� that� ushered� in� the� new�political� dispensation,�
the�NSE�All�Share�Index�declined�by�17.35%�to�28,642.25�points�while�market�
capitalization� fell� to�N9.85� trillion,�a�14.24%�drop.�The�precipitous�decline� in�
oil� prices� coupled� with� capital� restrictions� as� a� policy� response� by� the� apex�
bank,�triggered�massive�outflows�of�foreign�capital.�
� The� monetary� authorities� seemed� poised� to� retain� its� fight� against� dollar�
demand�in�the�face�of�diminishing�supply�of�the�greenback.�However,�without�
any�strong�source�of�dollar�supply�in�sight,�we�think�that�the�CBN�will�soon�hit�
its� limit� in� curtailing�dollar�demand� in�an� import�dependent�economy.�Hence�
we�expect�a�sustained�upside�pressure�on�the�foreign�exchange�rate.�
�
�

2015 Review & Outlook for 20162015 Review & Outlook for 20162015 Review & Outlook for 20162015 Review & Outlook for 2016 ��
Cowry Asset Management Limited Page 4
Global�Economy��Global�Economy��Global�Economy��Global�Economy������
The�global�economy�in�the�year�2015�showed�much�resilience�amid�decline�in�the�
price� of� crude� oil� and� other� commodities.� Thus,� there� were� mixed� fortunes�
amongst� the� different� economic� regions.� Extensive� crude� oil� production�
particularly�from�the�United�States�of�America�and�Iran’s�resumed�oil�production�
resulted�in�sustained�supply�overhang�which�crashed�global�crude�oil�prices�and�
resulted� in� little�margins�for�crude�oil�producers.�According�to�the� International�
Monetary� Fund� (IMF),� commodity� exporting� countries� witnessed� sharp�
depreciations�of�their�currencies,�in�part,�due�to�lower�export�earnings�as�a�result�
of�decline�in�commodity�prices.�On�the�contrary,�advanced�economies�benefited�
from�lower�input�(commodity)�prices.�
In� the� October� 2015� World� Economic� Outlook� (WEO)� Update,� global� growth�
projection�for�2015�was�revised�lower�to�3.1%�(0.2ppt�below�forecast�in�the�July�
2015�and�0.3ppt� lower� than� forecast� in�2014).�The� lower�growth� forecast�was�
mainly� on� the� back� of� weaker� prospects� for� some� large� emerging� market�
economies�and�crude�oil�exporting�countries.�

2015 Review & Outlook for 20162015 Review & Outlook for 20162015 Review & Outlook for 20162015 Review & Outlook for 2016 ��
Cowry Asset Management Limited Page 5
�
In�emerging�economies,�China’s�Gross�Domestic�Product�growth�slowed�to�6.9%�
in�Q3�2015�(from�7.2%�in�Q3�2014)�while�Brazil’s�GDP�declined�by�4.5%�(weaker�
than�-1.1%�in�Q3�2014).�In�advanced�economies,�United�States�GDP�grew�year-
on-year� by�2.2%� in� the� third�quarter�of�2015,� (slower� than�2.9%� in�Q3�2014)�
while�United�Kingdom’s�GDP�growth�slowed�to�2.3%�in�Q3�2015�(from�2.9%�in�
Q3� 2014).� However,� the� Eurozone� GDP� growth� rate� increased� to� 1.6%� (from�
0.8%�in�Q3�2014).�
However,�global�economic�activity�remained�on�the�expansionary�path�(above�50�
points)� throughout� 2015� –� the� J.P.� Morgan� Global� All-Industry� Output� Index�
posted�53.7�in�November�2015�(higher�than�52.3�registered�in�December�2014).�
This�followed� improvements� in�the�sub� indices�such�as�New�orders� index�which�
posted� 53.6� in� November� 2015� (higher� than� 52.0� in� December� 2014)� and�
Employment�Index�which�further�expanded�to�51.7�(from�51.2).�
�
�
7.40%6.90%
4.30%
2.84%2.30% 2.20%
1.80% 1.60% 1.60%1%
-4.50%
-6.00%
-4.00%
-2.00%
0.00%
2.00%
4.00%
6.00%
8.00%
10.00%
Y-o-Y�GDP�Growth�Rates
Q3�2014 Q3�2015

2015 Review & Outlook for 20162015 Review & Outlook for 20162015 Review & Outlook for 20162015 Review & Outlook for 2016 ��
Cowry Asset Management Limited Page 6
�
�
�
�
�
�
�
�
�
�
�
�
�
�
�
Global�Stock�Exchanges�Record�Mixed�Performance�
Year-to-date�performance�of�major�stock�exchanges�were�mixed�–�the�U.S.�stock�
exchanges,� Dow� Jones� Industrial� Average� mellowed� by� 1.67%� to� 17,524.91�
points�while� Standard� and� Poor’s� 500� Index�moderated� by� 0.75%� to� 2,043.41�
points.�However,�Germany’s�XETRA�DAX�Index�firmed�up�by�6.58%�to�10,450.38�
points�while�France’s�CAC�40�Index�gained�8%�to�close�at�4,614.40�points.�
�
�
�
�
�
�
�
�
Source:�Markit,�Cowry�Research�
47
48
49
50
51
52
53
54
55
56
JPMorgan�Global�All-Industry�Sub�Indices�
Output New�Orders Input�Prices
Output�Charges Backlogs
50.5
51
51.5
52
52.5
53
53.5
JP�Morgan�All-Industry�Employment�Index

2015 Review & Outlook for 20162015 Review & Outlook for 20162015 Review & Outlook for 20162015 Review & Outlook for 2016 ��
Cowry Asset Management Limited Page 7
�
�
�
�
�
�
Primary�Commodity�Prices�Soften�From�Supply�Glut�
�
�
�
�
�
�
�
Market� value� of� primary� commodities� plunged� year-to-date� by� 25.23%� as� at�
November� 2015� mainly� on� the� back� of� weakened� crude� oil� prices� as� global�
supply�outpaced�demand.�Price�of�base�metals�tanked�by�26.63%�as�copper�fell�
by� 25.54%� to� USD4,799.90/MT.���� Opec’s� reference� basket� price� plunged� by�
25.13%� to� USD38.13� as� at� November� amid� slower� demand� from� China,�
technology�assisted�boost�in�U.S.�shale�oil�and�news�of�imminent�resumed�supply�
from�Iran�following�the�lifting�U.S.�oil�embargo�in�October,�amongst�others.�
Similarly,�agricultural�commodity�prices�softened�by�15.92%�-�wheat�prices�were�
pummeled� by� 41.51%� to� USD157.70/MT;� coffee� (Robusta)� prices� fell� by�
14.40%�to�88.60cts/lb;�rice�prices�declined�by�12.80%�to�USD358.40/MT;�while�
palm�oil�shed�19.42%�to�USD503.20/MT.�
�
�
�
�
2015�Performance�of�Global�Stock�Exchanges�
INDEX� 15-Dec-15� 31-Dec-14� YTD�%�Change� Difference�
DJIA���� 17,524.91�� 17,823.07�� -1.67�� -298.16��
S&P�500���� 2,043.41�� 2,058.90�� -0.75�� -15.49��
FTSE�100���� 6,017.79�� 6,566.09�� -8.35�� -548.30��
XETRA�DAX���� 10,450.38�� 9,805.55�� 6.58�� 644.83��
CAC�40���� 4,614.40�� 4,272.75�� 8.00�� 341.65��
Nikkei�225���� 18,565.90�� 17,450.77�� 6.39�� 1,115.13��
Hang�Seng���� 21,274.37�� 23,605.04�� -9.87�� -2,330.67��
JSE�SA�ASI���� 48,428.77�� 49,770.60�� -2.70�� -1,341.83��
NSE�ASI���� 26,950.76�� 34,657.15�� -22.24�� -7,706.39��
Source:�Financial�Times,�Cowry�Research�

2015 Review & Outlook for 20162015 Review & Outlook for 20162015 Review & Outlook for 20162015 Review & Outlook for 2016 ��
Cowry Asset Management Limited Page 8
�
�
�
�
�
�
�
�
�
�
�
�
�
�
�
�
�
�
�
�
�
�
�
�
�
�
�
�
�
Global�Commodity�Prices�
�30-Nov-15� 31-Dec-14� YTD�%∆�
Some�Agricultural�Commodities�
Wheat�(USD/MT)� 157.70�� 269.60�� -41.51��
Rice�(USD/MT)� 358.40�� 411.00�� -12.80��
Palm�oil�(USD/MT)� 503.20�� 624.50�� -19.42��
Groundnuts�(USD/MT)� 1,730.50�� 1,995.10�� -13.26��
Sugar-�Free�Market�(cts/lb)� 14.90�� 15.00�� -0.67��
Coffee�-�Robusta�(cts/lb)� 88.60�� 103.50�� -14.40��
Cocoa�Beans�(USD/MT)� 3,360.80�� 2,946.90�� 14.05��
� � � �
Some�Base�Metals� � � �Copper�(USD/MT)� 4,799.90�� 6,446.50�� -25.54��
Aluminium�(USD/MT)� 1,467.90�� 1,909.50�� -23.13��
Source:�IMF,�Cowry�Research
Source:�Opec,�Cowry�Research
$30.00
$35.00
$40.00
$45.00
$50.00
$55.00
$60.00
$65.00
Jun
-15
Jun
-15
Jun
-15
Jun
-15
Jun
-15
Jun
-15
Jul-
15Ju
l-15
Jul-
15Ju
l-15
Jul-
15Ju
l-15
Jul-
15A
ug
-15
Au
g-1
5A
ug
-15
Au
g-1
5A
ug
-15
Au
g-1
5Sep
-15
Sep
-15
Sep
-15
Sep
-15
Sep
-15
Sep
-15
Oct
-15
Oct
-15
Oct
-15
Oct
-15
Oct
-15
Oct
-15
No
v-1
5N
ov-1
5N
ov-1
5N
ov-1
5N
ov-1
5N
ov-1
5D
ec-1
5D
ec-1
5
Daily�Crude�Oil�Basket�Price�(US$)
Source:�Opec,�Cowry�Research
29,000
29,500
30,000
30,500
31,000
31,500
32,000
Opec�Crude�Oil�Production�mbpd
In�March,�crude�oil�production�increased�by�
2.84%�following�increased�production�from�
Saudi�Arabia�and�Iraq.�
A�further�1.02%�increase�was�recorded�in�June�
as�Iraq�and�Nigeria�boosted�crude�oil�output.�

2015 Review & Outlook for 20162015 Review & Outlook for 20162015 Review & Outlook for 20162015 Review & Outlook for 2016 ��
Cowry Asset Management Limited Page 9
Nigerian�Nigerian�Nigerian�Nigerian�Real�Real�Real�Real�Sector�UpdateSector�UpdateSector�UpdateSector�Update����
The�year�2015�was�largely�sluggish�for�Nigerian�economy�as�it�recorded�declining�
growth�rates�in�the�first�two�quarters.�As�the�general�elections�took�centre�stage,�
implementation�of� the�N4.35� trillion�2015�appropriation�Act,�which�was�85.8%�
skewed�towards�recurrent�expenditure,�took�the�back�seat.�Growth�in�real�gross�
domestic� product� slowed� in� the� first,� second� quarters� of� 2015� to� 3.96%� and�
2.35%�respectively�as�the�mining�and�manufacturing�sectors�recorded�declines�in�
output.��
Early�in�the�year,�Standard�&�Poor’s�downgraded�Nigeria's�rating�from�BB-�to�B+,�
attributing� the� downgrade� to� lower� global� crude� oil� prices� and� heightened�
political� risks.� However,� the� global� credit� rating� agency� gave� a� stable� outlook�
noting� the� country’s� more� diversified� economy� with� the� services� sector�
accounting�for�half�of�GDP.�On�the�other�hand,�Fitch�Ratings�cut�Nigeria’s�credit�
rating�outlook� to�negative,� also�citing� falling�oil�prices�and� rising�political� risks�
amid�tightly�contested�presidential�and�legislative�elections.�It�however�affirmed�
Nigeria’s�BB-�rating.�
During�the�first�two�quarters,� the�petroleum�sector�was�particularly�afflicted�by�
incessant� pipeline� vandalisation� and� crude� oil� theft� which� resulted� in� several�
production�setbacks�of�oil�and�gas�multinationals�and�consequently,�reduced�oil�
and� gas� output.� The� manufacturing� sector� on� the� other� hand� was� mostly� in�
contraction� territory� as� it� witness� weakened� demand� partly� as� a� result� of�
insecurity� in� the� northeastern� part� of� the� country� which� partly� resulted� in�
reduced�sales.�The�sector�was�also�challenged�by�irregular�power�supply�and�high�
interest�rates�and.�
However,� following� the� successful� change� in� government� from� the� Peoples�
Democratic�Party�(PDP)�to�the�All�Progressives�Congress�(APC),�real�GDP�growth�

2015 Review & Outlook for 20162015 Review & Outlook for 20162015 Review & Outlook for 20162015 Review & Outlook for 2016 ��
Cowry Asset Management Limited Page 10
picked� up� with� the� economy� posting� 2.84%� in� the� third� quarter� as� crude� oil�
production�levels�increased�year-on-year�as�a�result�of�fresh�efforts�by�the�new�
President� Muhammadu� Buhari-led� administration� to� decisively� curb� crude� oil�
theft�in�the�oil�and�gas�sector.�
Nevertheless,� challenges� to� the� current� government� remained� the� dwindling�
international� crude� oil� prices�which� resulted� in� lower� oil� dollar� revenues�which�
constitute� a� very� significant� part� of� the� country’s� fiscal� plans.� In� the� near�
absence�of�economic�momentum�and�the�sustained�decline�in�foreign�exchange�
reserves,� the� local� currency� continued� to� depreciate� in� value� against� the� U.S.�
greenback.�
Given� erosion� of� foreign� exchange� reserves,� the� position� of� the� monetary�
authority�to�sustain�an�official�exchange�rate�and�prohibition�of�forty�two�import�
items� from� access� to� forex� led� to� the� phased� exit� of� Nigeria’s� fixed� income�
instruments� from� the� JP� Morgan� Emerging� Markets� Government� Bond� Index�
(GBI-EM)� –� first� by� the� end� of� September� and� then� by� the� end� of� October.�
Consequently,� performance� of� forex-dependent� economic� activities� was�
negatively� impacted.�The�growth� rates�and�contribution�of� trading�activities� to�
total�GDP�also�waned�in�all�three�quarters,�particularly�hit�by�forex�rationing�and�
scarcity�challenges.�
In�December,�nevertheless,�international�credit�rating�agency,�Moody’s,�affirmed�
Nigeria's� Ba3� Federal� Government� issuer� rating� with� a� stable� outlook.� The�
affirmation�was�based�on� the� strength�of� the�government�balance� sheet�partly�
due� to� the� low�general� government� debt� profile,� estimated� at� 14%� of�GDP� in�
2015� (against� a� Ba-rated� countries’� median� of� 45%� of� GDP)� and� a� mostly�
concessional�external�debt�of�only�2.2%�of�GDP.�This�is�in�addition�to�Nigeria's�
robust� medium-term� real� GDP� growth� prospects� and� expectations� of� political�
stability�and�institutional�growth.�

2015 Review & Outlook for 20162015 Review & Outlook for 20162015 Review & Outlook for 20162015 Review & Outlook for 2016 ��
Cowry Asset Management Limited Page 11
Manufacturing�Activities�in�Neutral�Territory�
In�the�eleven�months�to�November�2015,�manufacturing�activities�were�generally�
neutral� on� the� average� (PMI� averaged� 50.0� in� eleven� months� to� November�
2015).�This�was�in�spite�of�expansion�in�production�level�and�new�orders�indexed�
at�55.4�and�52.9�respectively�as�at�November�2015.�The�drag�on�manufacturing�
activities� came� by� way� of� weakened� consumer� demand� as� suggested� by�
contraction� in� backlogs� of�work�which� averaged� 46.0� in� the� eleven�months� to�
November� 2015.� The� manufacturing� sector� also� witnessed� contraction� in�
employment�level�which�averaged�47.9�in�the�eleven�months�to�November�2015.�
�Source:�Central�Bank�of�Nigeria,�Cowry�Research�
�
�
�
�
�
�
�
40.0�
42.0�
44.0�
46.0�
48.0�
50.0�
52.0�
54.0�
56.0�
58.0�
60.0�
CBN�Manufacturing�Sector�PMI
PMI Production�level New�Orders Employment Backlogs

2015 Review & Outlook for 20162015 Review & Outlook for 20162015 Review & Outlook for 20162015 Review & Outlook for 2016 ��
Cowry Asset Management Limited Page 12
Non-Manufacturing�Activities�on�Expansionary�Path�
The� non-manufacturing� sector� was� better� on� the� average� as� it� witnessed�
expansion� in� activities� during� the� eleven� months� to� November� 2015� (PMI�
averaged� 51.0� in� the� eleven� months� to� November� 2015).� The� sector� saw�
expansion�in�business�activity,�indexed�at�52.9�as�at�November�2015�while�the�
volume� of� new� orders� increased� as� well,� index� posted� 52.6� as� at� November�
2015.� However,� the� sector� was� also� affected� by� general� contraction� in�
employment� level� and� backlogs� of� work� which� indexed� 45.5� and� 46.0�
respectively�as�at�November�2015.�
�
�Source:�Central�Bank�of�Nigeria,�Cowry�Research�
�
�
�
�
40.0�
42.0�
44.0�
46.0�
48.0�
50.0�
52.0�
54.0�
56.0�
58.0�
60.0�
CBN�Non-Manufacturing�Sector�PMI
PMI Business�Activity New�Orders Employment Backlogs

2015 Review & Outlook for 20162015 Review & Outlook for 20162015 Review & Outlook for 20162015 Review & Outlook for 2016 ��
Cowry Asset Management Limited Page 13
Nigeria’s�Economic�Output�
In� 2015,� Nigeria’s� economy� evidently� began� to� falter� amid� intense� political�
activities.� Over� a� period� of� twelve� months,� Nigeria’s� real� GDP� plunged� from�
6.54%�in�Q2�2014�to�2.35%�in�Q2�2015,�the�lowest�recorded�in�recent�times.�
�
�
�
� �
�
�
�
�
�
In� comparison� with� other� sub-Saharan� African� countries,� Nigeria’s� economy�
was�one�of�the�least�performing�between�Q3�2014�and�Q3�2015,�next�to�South�
Africa’s�which�eased�from�1.3%�in�Q2�2015�to�1%�in�Q3�2013.�In�Q3�2015,�the�
slowdown�in�South�Africa’s�economy�resulted�from�slower�growths�registered�in�
its�finance,�real�estate�and�business�services�sectors;�amid�political�uncertainty.�
However,�Uganda’s�economy�was�the�fastest�growing,�followed�by�Namibia’s.�
�
�Source:�National�Bureau�of�Statistics,�Cowry�Research�
6.23%5.94%
3.96%
2.35%
2.84%
0.00%
1.00%
2.00%
3.00%
4.00%
5.00%
6.00%
7.00%
Q3�2014 Q4�2014 Q1�2015 Q2�2015 Q3�2015
Rebased�Quarterly�GDP�Growth�Rates

2015 Review & Outlook for 20162015 Review & Outlook for 20162015 Review & Outlook for 20162015 Review & Outlook for 2016 ��
Cowry Asset Management Limited Page 14
�Source:�Trading�Economics,�Cowry�Research�
�
�
�Source:�Trading�Economics,�Cowry�Research�
�
�
5.90%
4.90%
3.50%
2.84%
1%
0.00%
1.00%
2.00%
3.00%
4.00%
5.00%
6.00%
7.00%
Mozambique Uganda Namibia Nigeria South�Africa
Sub-Saharan�African�Countries�Q3�2015�GDP�Growth�Rates
-2.00%
0.00%
2.00%
4.00%
6.00%
8.00%
10.00%
12.00%
Q3�2014 Q4�2014 Q1�2015 Q2�2015 Q3�2015
Sub-Saharan�African�Countries�Real�GDP�Growth�Trends
Mozambique Uganda Namibia Nigeria South�Africa

2015 Review & Outlook for 20162015 Review & Outlook for 20162015 Review & Outlook for 20162015 Review & Outlook for 2016 ��
Cowry Asset Management Limited Page 15
Highlights�of�Q3�2015�GDP�
� In�Q3�2015,�Nigeria’s�nominal�Gross�Domestic�Product,�(GDP�at�current�prices)�was�
estimated�at�N24.31�trillion,�or�N17.98�trillion����in�real�terms.�This�was�higher�than�
Q3�2014�nominal�GDP�estimated�at�N22.93�trillion�or�N17.48�trillion�in�real�terms.�
The�real�Gross�Domestic�Product�(GDP)�grew�by�2.84%�(lower�than�6.23%�in�Q3�
2014).�
�
� The�oil�sector�grew,�in�real�terms,�by�1.06%�in�Q3�2015�compared�to�3.60%�decline�
recorded�in�Q3�2014.�On�the�other�hand,�the�non-oil�sector�grew�by�3.05%�in�Q3�
2014�(weaker�than�7.51%�growth�recorded�Q3�2014).�
�
� The� agricultural� sector� remained� the� largest� contributor� to� real�GDP� in�Q3�2015�
with�26.79%�or�N4.82�tillion�(of�which�crop�production�accounted�for�91.84%�or�
N4.42�trillion).�This�was�slightly�higher�than�26.63%�contribution�in�Q3�2014.�The�
industry�also�grew�by�3.46%�in�Q3�2014�(howbeit,�lower�than�4.47%�in�Q3�2014).�
�
� Trade� was� the� second� largest� contributor� to� real� GDP� in� Q3� 2015,� contributing�
16.24%�or�N2.92�trillion�of�real�GDP�in� the�Q3�2014�(higher�than�16.00%�in�Q3�
2014).�The�sector�also�grew�by�4.40%�in�Q3�2015�(lower�than�6.81%�in�Q3�2014).�
The� slower� growth� partly� resulted� from� the� overall� lull� in� economic� activities�
coupled�with�increased�depreciation�of�the�local�currency�relative�to�the�U.S.�dollar.�
�
� The� mining� and� quarrying� industry� (of� which� crude� petroleum� and� natural� gas�
constituted�98.69%)�contributed�10.40%�or�N1.87�trillion�to�total�real�GDP�in�Q3�
2015.�This�was� lower� than�10.58%�contribution� in�Q3�2014.�The� sector�grew�by�
1.13%�in�Q3�2015�(better�than�-3.43%�in�Q3�2014).�The�growth�in�the�oil�sector�
reflected�increased�crude�oil�production�to�2.17�million�barrels�per�day�in�Q3�2015�
(from�2.05�mbd)�according�to�preliminary�data.�

2015 Review & Outlook for 20162015 Review & Outlook for 20162015 Review & Outlook for 20162015 Review & Outlook for 2016 ��
Cowry Asset Management Limited Page 16
�
�
�
�
�
�
�
�
�
�
�
�
�
�
Breakdown�of�Q3�2015�Real�Economic�Output�at�2010�Constant�Prices����
Major�Sectors�Q3�2015�Contribution�
to�Real�GDP�(%)����Q3�2015����
Growth�Rate�(%)����Q3�2014�Contribution�
to�Real�GDP�(%)����
Agriculture� 26.79�� 3.46�� 21.12��
Trade� 16.24�� 4.40�� 17.22��
Mining�&�Quarrying� 10.40�� 1.13�� 9.95��
Information�and�Communication� 9.80�� 5.27�� 12.25��
Manufacturing� 9.40�� -1.75�� 9.55��
Real�Estate� 7.57�� 2.06�� 7.83��
Construction� 3.22�� -0.11�� 4.50��
Professional,�Scientific�&�Technical�Services�
3.70�� 5.38�� 3.56��
Financial�Services� 2.76�� 6.57�� 3.35��
Public�Administration� 2.14�� -12.78�� 2.55��
Other�Economic�Activities� 7.97�� �� 8.12��
Q3�2014�Real�GDP��
2.84� �
Source:�National�Bureau�of�Statistics,�Cowry�Research�
Comments:�
*Amounts�in�2010�constant�basic�prices�

2015 Review & Outlook for 20162015 Review & Outlook for 20162015 Review & Outlook for 20162015 Review & Outlook for 2016 ��
Cowry Asset Management Limited Page 17
�
�
�
�
�
�
�
�
�
�
�
�
����
�������Source:�National�Bureau�of�Statistics,�Cowry�Research�
27%
16%
11%10%
9%
27%
Big�Five�Contributors�to�Q3�2015�Real�GDP
Agriculture
Trade
Mining�&�Quarrying
Inform�&�Comm
Manufacturing
Others
�
��Source:�National�Bureau�of�Statistics,�Cowry�Research�
6.57�
5.38� 5.27�4.40�
3.46�
2.06�1.13�
-0.11�
-1.75�
-12.78�-15.00�
-10.00�
-5.00�
0.00�
5.00�
10.00�
Q3�2015��Real�GDP�Growth�Hierarchy�(%)
Q2�2015 Q3�2015

2015 Review & Outlook for 20162015 Review & Outlook for 20162015 Review & Outlook for 20162015 Review & Outlook for 2016 ��
Cowry Asset Management Limited Page 18
Nigeria’s�National�Disposable�Income�Grows�4.54%�in�Q2�2015�
National�Disposable�Income�at�2010�purchasers'�value�increased�year-on-year�by�
4.54%�to�N16.13�trillion�in�Q2�2015.�The�increase�in�NDI�resulted�from�a�2.30%�
growth� in�domestic�factor� income�to�N15.36�trillion�of�which�operating�surplus�
of�businesses�rose�y-o-y�by�6.78%�to�N11.20�trillion�which�more�than�offset�an�
8.11%�y-o-y�decline�in�compensation�to�employees�to�N4.15�trillion.�Also,�other�
current� transfers� from� the� rest� of� the� world� increased� y-o-y� by� 17.96%� to�
N978.11� billion.� On� the� expenditure� side,� final� consumption� expenditure� of�
household� increased� y-o-y� by� 11.66%� to� N10.83� trillion� while� general�
government� final� consumption� expenditure� declined� y-o-y� by� 14.83%� to�
N936.59�billion.�
�
�
�
�
�
�
�
�
�
�
�
National�Disposable�Income�And�its�Appropriation�at�2010�Purchasers'�Value�(N�Million)� Q2�2015� Q2�2014� %�Change�
Compensation�of�Employees� 4,155,791.36�� 4,522,399.54�� -8.11%�
Operating�Surplus� 11,205,178.54�� 10,493,370.83�� 6.78%�
Domestic�Factor�Income� 15,360,969.90�� 15,015,770.37�� 2.30%�
Compensation�of�Employees�from�the�Rest�of�the�World�(Net)� 10,460.10�� 7,812.09�� 33.90%�
Property�and�Entrepreneurial�Income�from�the�Rest�of�the�World�(Net)� -377,152.13�� -586,629.34�� -35.71%�
Net�Taxes�on�Products� 159,711.97�� 164,744.67�� -3.05%�
National�Income�at�Market�Prices� 15,153,989.84�� 14,601,697.79�� 3.78%�
Other�Current�Transfers�from�the�Rest�of�the�World�(Net)� 978,113.60�� 829,204.19�� 17.96%�
National�Disposable�Income� 16,132,103.44�� 15,430,901.98�� 4.54%�
General�Government�Final�Consumption�Expenditure� 936,591.46�� 1,099,713.47�� -14.83%�
Final�Consumption�Expenditure�of�Household� 10,833,036.02�� 9,701,864.58�� 11.66%�
Final�Consumption�Expenditure�of�Non-Profit�Institutions�Serving�Household� 48,949.24�� 41,804.37�� 17.09%�
Saving� 4,313,526.72�� 4,587,519.55�� -5.97%�
Appropriation�of�Disposable�Income� 16,132,103.44�� 15,430,901.97�� 4.54%�
Changes�in�Inventories� 149,411.36�� 146,214.53�� 2.19%�
Gross�Fixed�Capital�Formation� 3,015,594.20�� 2,805,531.46�� 7.49%�
Total�Investments� 3,165,005.56�� 2,951,745.99�� 7.22%�
Consumption�of�Fixed�Capital� 959,108.79�� 934,002.04�� 2.69%�
Domestic�Absorption� 14,024,473.49�� 12,861,126.37�� 9.05%�
�Source:�National�Bureau�of�Statistics,�Cowry�Research

2015 Review & Outlook for 20162015 Review & Outlook for 20162015 Review & Outlook for 20162015 Review & Outlook for 2016 ��
Cowry Asset Management Limited Page 19
Also� in� the� review� period,� domestic� absorption� (comprising� domestic�
consumption� and� investment)� increased� y-o-y� by� 9.05%� to� N14.02� trillion.�
Savings� fell� by� 5.97%� to� N4.31� trillion� (following� increased� consumption�
activities)� while� investments� (comprising� changes� in� inventories� and� net� fixed�
capital�formation)�increased�by�9.32%�to�N2.21�trillion.�
�
Current�Account�Balance�Remains�in�Surplus�
Nigeria�remained�a�net� lender�to�the�rest�of�the�world�as�the�excess�of�savings�
over� investments� resulted� in� a� Current� Account� Balance� (CAB)� surplus,� which�
howbeit,� declined� y-o-y� by� 17.98%� to� N2.11� trillion.� CAB� as� a� percentage� of�
GDP�improved�to�12.80%�in�the�review�quarter�(from�9.72%�in�Q1�2015).�
�
�
�
�
�
�
�
�
�
�
�
�
�Source:�National�Bureau�of�Statistics,�Cowry�Research�
-
2.00
4.00
6.00
8.00
10.00
12.00
14.00
16.00
18.00
20.00
Q2 2014 Q3 2014 Q4 2014 Q1 2015 Q2 2015
nT
rill
ion
s
Consumption, Income, Investments, Savings & CAB
Domestic Absorption National Disposable Income
Total Investments Savings
Current Account Balance

2015 Review & Outlook for 20162015 Review & Outlook for 20162015 Review & Outlook for 20162015 Review & Outlook for 2016 ��
Cowry Asset Management Limited Page 20
Nigeria’s�Inflation�Grows�on�Structural�Defects�
Inflation� remained� in� single� digits� throughout� 2015,� howbeit,� above� the�
monetary� authority’s� inflation� target� of� between� 6%� and� 9%.� The� increase� in�
general� price� level� during� the� year� was� partly� due� to� structural� effects.� As� a�
result,�annual�change�in�headline�inflation�rose�from�8.2%�in�January�to�9.4%�in�
November.�
Structural� effects� resulted� from� scarcity� of� Premium�Motor� Sprit� (PMS)� which�
had� a� knock-on� effect� on� transportation� of� persons� and� goods� across� the�
country.�The�pump�price�of�PMS�in�the�country�has�risen�year-on-year�by�7.87%�
to�an�average�of�N115.35�a�litre.�
Similarly� imported� food� inflation� increased�y-o-y� to�10.83%� in�November� from�
8.4%� registered� in� January.� This�was� amid� enforcement� of� the� ban� on� foreign�
exchange� sales� to� importers� of� prohibited� food� produce� and� significant�
devaluation� in� the� alternative� foreign� exchange� markets.� The� increase� in�
imported� food� inflation� was� in� spite� of� a� 13.9%� decline� in� global� agricultural�
prices�between�January�and�November.�
�

2015 Review & Outlook for 20162015 Review & Outlook for 20162015 Review & Outlook for 20162015 Review & Outlook for 2016 ��
Cowry Asset Management Limited Page 21
�Source:�Nigerian�Bureau�of�Statistics,�Cowry�Research�
�
�
�
Annual�Inflation�in�Sub-Saharan�Countries�
In�Malawi,�consumer�prices�increased�to�24.6%�in�November�2015�from�21.2%�in�
January�2015,�climbing�higher�than�the�fiscal�year’s�target�of�15%,�amid�rising�
food� prices,� prolonged�weakness� of� the�Malawian� kwacha� relative� to� the� U.S.�
greenback�as�well�as�a�lack�of�capacity�of�the�economy�to�meet�local�demand�for�
goods.�
Similarly,�Zambia’s�headline� inflation�rose� to�19.5%�in�November�from�7.7%�in�
January�as�its�local�currency,�the�Zambian�kwacha,�also�depreciated�against�the�
U.S.� dollar� as� Africa’s� second� largest� producer� of� copper� was� challenged� by�
falling� prices� in� the� global� commodities� market� –� global� metal� prices� have�
plunged�between�January�and�November.�
9.29.4 9.4 9.5
9.810.04 10.05 10.13 10.17 10.13
10.32
6.0
6.5
7.0
7.5
8.0
8.5
9.0
9.5
10.0
10.5
11.0
Jan-15 Feb-15 Mar-15 Apr-15 May-15 Jun-15 Jul-15 Aug-15 Sep-15 Oct-15 Nov-15
2015�Inflation�Rates�Trend
All�Items�Inflation Core�Inflation Food�Inflation

2015 Review & Outlook for 20162015 Review & Outlook for 20162015 Review & Outlook for 20162015 Review & Outlook for 2016 ��
Cowry Asset Management Limited Page 22
In�Ghana� inflation� rate�was�one�of� the�highest� in� sub-Saharan�Africa,� rising� to�
17.6%�in�November�from�16.4%�in�January.�Ghana’s�inflation�risk�remained�high�
on� the� back� of� lower� commodities� prices� and� a� fiscal� crisis� which� resulted� in�
depreciation� of� the� cedi� against� the� US� Dollar,� ultimately� leading� to� imported�
inflation.�
�
�
�Source:�Trading�Economics,�Cowry�Research�
�
�
�
�
�
�
�
�
24.60%
19.50%
17.60%
13.29%
9.40% 9.10%
7.50%6.60% 6.27%
4.80% 4.80%
2.90% 2.30%1.50%
0.00%
5.00%
10.00%
15.00%
20.00%
25.00%
30.00%
Nov�2015�Inflation�Rates�of�Some�Sub-Saharan�Africa�Countries

2015 Review & Outlook for 20162015 Review & Outlook for 20162015 Review & Outlook for 20162015 Review & Outlook for 2016 ��
Cowry Asset Management Limited Page 23
Nigeria’s�Unemployment�Worsens�
National�Bureau�of�Statistics� (NBS)� reported� that�Nigeria’s�unemployment� rate�
increased� for� the� fourth� consecutive� quarter,� to� 9.9%� in�Q3�2015� (from�7.5%�
registered� in� Q3� 2014).� However,� the� underemployment� rate� decreased� to�
17.4%� in� Q3� 2015� (from� 19.0%� in� Q4� 2014).� The� improvement� in�
underemployment�was�partly�due�to�resumption�of�planting�season.�
Total�new�jobs�increased�y-o-y�by�36.02%�to�475,180�in�Q3�2015�on�the�back�of�
116.35%� growth� in� new� informal� jobs� to� 428,690.� Also,� labour� productivity�
increased� quarter-on-quarter� by� 5.14%� to� N768.42� per� hour� per� quarter� (or�
USD3.90�phpq)�from�N730.85�phpq�(or�USD3.71�phpq).�
�
�Source:�Nigerian�Bureau�of�Statistics,�Cowry�Research�
�
�
7.50%8.20%
9.90%
16.60%
18.30%17.40%
0.00%
2.00%
4.00%
6.00%
8.00%
10.00%
12.00%
14.00%
16.00%
18.00%
20.00%
Q1�2015 Q2�2015 Q3�2015
Nigeria's�Unemployment�Trends
Unemployment�Rate Underemployment�Rate

2015 Review & Outlook for 20162015 Review & Outlook for 20162015 Review & Outlook for 20162015 Review & Outlook for 2016 ��
Cowry Asset Management Limited Page 24
�Source:�Trading�Economics,�Cowry�Research�
�
�
There� was� a� growing� trend� in� unemployment� amongst� the� countries� which�
released� their� most� recent� jobless� numbers� towards� the� end� of� 2015.� South�
Africa’s� unemployment� rate� ranked� the� highest� in� comparison� to� other� sub-
Saharan� African� countries� at� 25.5%� in� Q3� 2015� (higher� than� 25%� in� the�
preceding� quarter);� Senegal’s� unemployment� rate� increased� to� 13.4%� as� at�
December�2015�(higher�than�12%�posted�in�the�preceding�year);�which�Nigeria’s�
unemployment�rate�ranked�the� least�at�9.9%�as�at�Q3�2015�(higher�than�8.2%�
recorded�in�the�preceding�quarter).�
�
�
�
�
25.50%
13.40%
9.90%
0.00%
5.00%
10.00%
15.00%
20.00%
25.00%
30.00%
South�Africa Senegal Nigeria
SSA�Sep/Dec�2015�Unemployment�Rates

2015 Review & Outlook for 20162015 Review & Outlook for 20162015 Review & Outlook for 20162015 Review & Outlook for 2016 ��
Cowry Asset Management Limited Page 25
Nigeria’s�Debt�Profile�in�2015�
In� the� period� under� review,� Nigeria’s� debt� profile� increased� amid� increased�
borrowing� activities� of� both� federal� government� and� sub� nationals.� Nigeria’s�
indebtedness� increased� year-on-year� by� 16.16%� to� N12.12� trillion� as� at� June�
2015� following� a� 13.14%� y-o-y� increase� in� federal� government� debt� stock� to�
N8.39� trillion�and�an�8.94%�y-o-y� increase� in� the� level�of� indebtedness�of� the�
various� state� governments� to� N1.69� trillion.� There� was� also� a� 39.14%� y-o-y�
increase� in� external� debt� stock� to� N2.03� trillion� from� both� multilaterals� and�
bilateral�parties�
�
�
�
�
�
�
�
�
Composition�of�multilateral�loans�to�total�external�debt�stock�shrank�to�70.11%�
as�at�June�2015�from�71.82%�as�at�June�2014�as�contribution�of�Bilateral�loans�
increased�to�15.35%�as�at�June�2015�from�12.17%�as�at�June�2014.�
�
�
�
�June�2015�(N’Millions)� June�2014�(N’Millions)� %�Change�
External�Debt�Stock�(FGN�+�States)� 2,031,897.80� 1,460,297.92� 39.14%�
Domestic�Debt�Stock�(FGN�Only)� 8,396,591.57� 7,421,097.30� 13.14%�
Domestic�Debt�of�States� 1,690,360.09� 1,551,650.13� 8.94%�
Total�Total�Total�Total����� 12,118,849.4512,118,849.4512,118,849.4512,118,849.45���� 10,433,045.3510,433,045.3510,433,045.3510,433,045.35���� 16.16%16.16%16.16%16.16%����
� � � �%age�of�External�Debt�to�Grand�Total� 16.77%� 14.00%�
�%age�of�Domestic�Debt�to�Grand�Total� 82.23%� 86.00%�
�
� � � �Real�GDP�as�at�June� 32,513,943.29� 31,523,301.80� 3.14%�
Total�Debt�Stock�to�GDP� 37.27%� 33.10%��
Source:�DMO,�Cowry�Research

2015 Review & Outlook for 20162015 Review & Outlook for 20162015 Review & Outlook for 20162015 Review & Outlook for 2016 ��
Cowry Asset Management Limited Page 26
�
�
�
�
�
�
�
�
�
�
�
�
�
�
�
�
�
�
�
�
�
�
Meanwhile,� a� part� of� the� significant� change� in� total� debt� stock� in� the� review�
period�resulted�from�other�economic�flows,�specifically,�an�18.01%�depreciation�
in� the� value� of� the� Naira� against� the� U.S.� dollar� from� an� average� of�
N155.73/USD�as�at�June�2014�to�N189.93/USD�as�at�June�2015.�Consequently,�
public� sector� outstanding� debt-to-GDP� ratio� increased� to� 37.27%� as� at� June�
2015�from�33.10%�as�at�June�2014.�
�
�
Nigeria's�External�Debt�Stock�(Million�USD)� June-15� June-14� %�Change�
MULTILATERAL�� � �
World�Bank�Group� ����������������������������������6,186.25�� ������������������������5,864.34�� 5.49%�
African�Development�Bank�Group� �������������������������������������946.53�� ���������������������������748.24�� 26.50%�
Others� �������������������������������������100.08�� ���������������������������117.87�� -15.09%�
� � � �Sub-Total� ����������������������������������7,232.86�� ���������������������������������6,730.45�� 7.46%�
%age�of�Grand�Total� 70.11%� 71.82%��
� � � �BILATERAL�
� � �China�(Exim�Bank�of�China)� ����������������������������������1,388.87�� ������������������������1,031.84�� 34.60%�
France�(AFD)� �������������������������������������140.25�� ���������������������������108.95�� 28.73%�
Japan�(JICA)� ����������������������������������������43.10�� ����������������������������������-����
India�(Exim�Bank�of�India)� �����������������������������������������������-��� ����������������������������������-����
Germany�(KfW)� ����������������������������������������11.73�� ����������������������������������-����
� � � �Sub-Total� ����������������������������������1,583.95�� ���������������������������������1,140.79�� 38.85%�
%age�of�Grand�Total� 15.35%� 12.17%��
� � � �COMMERCIAL�
� � �Eurobonds� ����������������������������������1,500.00�� ���������������������������������1,500.00�� 0.00%�
%age�of�Grand�Total� 14.54%� 16.01%��
� � � �GRAND�TOTAL� �������������������������������10,316.81�� ���������������������������������9,371.24�� 10.09%�Source:�DMO,�Cowry�Research

2015 Review & Outlook for 20162015 Review & Outlook for 20162015 Review & Outlook for 20162015 Review & Outlook for 2016 ��
Cowry Asset Management Limited Page 27
External�SectorExternal�SectorExternal�SectorExternal�Sector����UpdateUpdateUpdateUpdate��������
Nigeria’s�Foreign�Exchange�Reserves�on�the�Decline�
As�a�major�commodity�exporter,�Nigeria’s�balance�sheet�suffered�similar�fate�as�
with� other� commodities� exporting� countries� owing� to� general� decline� in� global�
commodities� prices� amid� supply� glut.� Nigeria’s� foreign� exchange� reserves�
declined� year-to-date� by� 14.52%� to� USD29.46� billion� as� at� Tuesday,� 15�
December�2015�following�a�declines�in�international�crude�oil�prices;�suboptimal�
crude�oil�production�volumes;�and�persistent�high�demand�for�foreign�exchange�
by�end�users.�
On�average,�Nigeria’s�crude�oil�production�fell�by�1.84%�to�1,884�barrels�per�day�
in�the�eleven�months�to�November�2015�relative�to�the�corresponding�period�of�
2014.�
�
�
Source:�Central�Bank�of�Nigeria,�Opec,�Cowry�Research�
$30.00�
$35.00�
$40.00�
$45.00�
$50.00�
$55.00�
$60.00�
$65.00�
$70.00�
$28.50�
$29.50�
$30.50�
$31.50�
$32.50�
$33.50�
$34.50�
$35.50�
External�Reserves�vs�Opec's�Reference�Basket�Price
Foreign�Reserves Opec

2015 Review & Outlook for 20162015 Review & Outlook for 20162015 Review & Outlook for 20162015 Review & Outlook for 2016 ��
Cowry Asset Management Limited Page 28
�Source:�Opec,�Cowry�Research�
�
�Various� measures� by� the� monetary� authority� to� ameliorate� the� downward�
trend� in� the� reserves,� without� appreciable� replenishment� via� foreign� inflows,�
had�only�so�much�as�kept�it�from�eroding�dramatically�while�the�local�currency,�
Nigerian� Naira,� continued� to� depreciation� in� value� against� major� world�
currencies.�
�
Source:�Central�Bank�of�Nigeria,�Cowry�Research�
1,650
1,700
1,750
1,800
1,850
1,900
1,950
2,000
2,050
Nigeria's�Crude�Oil�Production�('000�BPD)
2014�Estimates 2015�Estimates
180
200
220
240
260
280
300
320
Jan-15 Feb-15 Mar-15 Apr-15 May-15 Jun-15 Jul-15 Aug-15 Sep-15 Oct-15 Nov-15
Naira�Depreciates�against�Major�Currencies
IFEM�NGN/USD BDC�NGN/USD NGN/GBP NGN/EUR

2015 Review & Outlook for 20162015 Review & Outlook for 20162015 Review & Outlook for 20162015 Review & Outlook for 2016 ��
Cowry Asset Management Limited Page 29
�
�
�
�
�
�
�
�
�
�
�
�
�
�
�
�
�
�
�
Foreign�Trade�Balance�In�Deficit�
In� the� ten� months� to� October� 2015,� Nigeria� recorded� a� balance� of� trade� deficit� against� a� trade�
surplus� recorded� in� the�corresponding�period�of� the�preceding�year.�This� resulted� from�a�46.05%�
decrease�in�exports�to�USD38.85�billion,�accompanied�by�an�18.76%�drop�in�imports�to�USD43.79�
billion�as�at�October�2015.�Consequently,�total�trade�fell�by�34.37%�to�USD82.64�billion.�
Nigeria’s�Foreign�Trade�Summary�(USD�Millions)�� � �
�10�Months�to�Oct�2015� 10�Months�to�Oct�2014� %�Change�
Exports�(FOB)� 38,847.36� 72,006.61� -46.05%�
Imports�(CIF)� 43,794.08� 53,909.29� -18.76%�
Total�Trade� 82,641.44� 125,915.90� -34.37%�
Balance�of�Trade� -4,946.72� 18,097.29� -127.33%�Source:�Central�Bank�of�Nigeria,�Cowry�Research�
�
�
Capital�Importation�Slows�
In� the� ten� months� to� October� 2015,� Nigeria� recorded� a� 29.27%� year-on-year� decline� in� foreign�
direct� investments� to� USD1.39� billion.� The� resulted� from� a� 38.32%� fall� in� foreign� equity� direct�
investments� to� USD1.39� billion� amid� policy� uncertainty� from� the� fiscal� authorities.� Also,� foreign�
portfolio� investments�plunged�by�62.22%�to�USD5.25�billion�as�at�October�2015,�mainly�due�to�a�
64.54%� decline� in� foreign� equity� portfolio� investment� to� USD4.06� billion� amid� a� controversial�
exchange�rate�control�policy�from�the�monetary�authority.�
Nigeria’s�Capital�Importation�(USD�Millions)����� � �
�10�Months�to�Oct�2015� 10�Months�to�Oct�2014� %�Change�
Foreign�Direct�Investment� 1,398.54� 1,977.40� -29.27%�
Portfolio�Investment� 5,246.98� 13,886.41� -62.22%�
Source:�Central�Bank�of�Nigeria,�Cowry�Research�

2015 Review & Outlook for 20162015 Review & Outlook for 20162015 Review & Outlook for 20162015 Review & Outlook for 2016 ��
Cowry Asset Management Limited Page 30
�
�
�
�
�
�
�
�
�
�
�
�
�
�
�
�
�
�
�
Foreign�Trade�Statistics�2015�vs�2014�
� �
Source:�CBN,�Cowry�Research�
Source:�CBN,�Cowry�Research�
0.00
1.00
2.00
3.00
4.00
5.00
6.00
7.00
8.00
9.00
10.00
USD�Billions
Lower�and�Declining�Exports�in�2015
2014�Exports�(FOB) 2015�Exports�(FOB)
0.00
1.00
2.00
3.00
4.00
5.00
6.00
7.00
8.00
9.00
USD�Billions
Lower�Imports�in�2015
2014�Imports�(FOB) 2015�Imports�(FOB)
0.00
2.00
4.00
6.00
8.00
10.00
12.00
14.00
16.00
USD�Billions
Lower�and�Declining�Total�Trades�in�2015
2014�Total�Trade 2015�Total�Trade
-3.00
-2.00
-1.00
0.00
1.00
2.00
3.00
4.00
USD�Billions
Trade�Deficits�Dominates�2015
2014�Balance�of�Trade 2015�Balance�of�Trade

2015 Review & Outlook for 20162015 Review & Outlook for 20162015 Review & Outlook for 20162015 Review & Outlook for 2016 ��
Cowry Asset Management Limited Page 31
�
�
�
�
�
�
�
�
�
�
�
�
�
�
�
�
�
�
�
Chart�Analysis�of�Capital�Imports�by�Investment�Type�in�2015�vs�2014�
�
�
Source:�CBN,�Cowry�Research�
Source:�CBN,�Cowry�Research�
0.00
50.00
100.00
150.00
200.00
250.00
300.00
350.00
400.00
450.00
500.00
Jan Feb Mar Apr May Jun Jul Aug Sep Oct Nov Dec
USD��Millions
Foreign�Direct�Investments
2014�Foreign�Direct�Investment 2015�Foreign�Direct�Investment
0.00
500.00
1,000.00
1,500.00
2,000.00
2,500.00
Jan Feb Mar Apr May Jun Jul Aug Sep Oct Nov Dec
USD��Millions
Foreign�Portfolio�Investments
2014�Portfolio�Investment 2015�Portfolio�Investment
11%
72%
17%
2014�%age�Capital�Importation�by�Investment�Type
FDI FPI Others
17%
62%
21%
2015�%age�Capital�Importation�by�Investment�Type
FDI FPI Others

2015 Review & Outlook for 20162015 Review & Outlook for 20162015 Review & Outlook for 20162015 Review & Outlook for 2016 ��
Cowry Asset Management Limited Page 32
�
�
�
�
�
�
�
�
�
�
�
�
�
�
�
�
�
�
�
Capital�Imports�by�Nature�of�Business�in�2015�vs�2014�
�
Source:�CBN,�Cowry�Research�
Source:�CBN,�Cowry�Research�
0.00
2,000.00
4,000.00
6,000.00
8,000.00
10,000.00
12,000.00
14,000.00
16,000.00
USD�M
illions
2014�%age�Capital�Importation�by�Nature�of�Business
0.00
1,000.00
2,000.00
3,000.00
4,000.00
5,000.00
6,000.00
USD�M
illions
2015�%age�Capital�Importation�by�Nature�of�Business
66%
13%
5%
5%5%
6%
2014�%age�Capital�Importation�by�Nature�of�Business
SHARES FINANCING TELECOMMUNICATION
BANKING MANUFACTURING Others
60%11%
10%
9%
4%6%
2015�%age�Capital�Importation�by�Nature�of�Business
SHARES TELECOMMUNICATION FINANCING
BANKING MANUFACTURING Others

2015 Review & Outlook for 20162015 Review & Outlook for 20162015 Review & Outlook for 20162015 Review & Outlook for 2016 ��
Cowry Asset Management Limited Page 33
����Government�Sector�UpdateGovernment�Sector�UpdateGovernment�Sector�UpdateGovernment�Sector�Update�
The� public� sector� saw� decline� in� revenues� amid� general� decline� in� economic�
activities� and� as� attention� shifted� to� electioneering.� Gross� Federation� Account�
Revenue�in�the�first�nine�months�to�September�2015�decreased�y-o-y�by�32.02%�
to�N5.36�trillion�relative� to�gross�amount� in�the�corresponding�period�of�2014.�
Decline� in�gross� revenue�was�driven�by�43.70%�y-o-y�plunge� in�oil� revenue� to�
N2.99� trillion� as� crude� oil/gas� sales� plummeted� by� 56.18%� to�N685.78� billion�
while�PPT/Royalties�declined�by�47%�to�N1.39�trillion.�On�the�other�hand,�non-
oil� revenue� fell� y-o-y� by� 7.74%� to� N2.37� trillion� as� Companies� Income� Tax� &�
Other�Taxes�declined�by�25.37%�to�N749.97�billion.�
�
�
�
�
�
�
�
�
�
�
�
�
�
���Source:�Central�Bank�of�Nigeria;�Cowry�Research�
5,365.62�
2,999.24�
2,366.39�
0.00�
1,000.00�
2,000.00�
3,000.00�
4,000.00�
5,000.00�
6,000.00�
7,000.00�
8,000.00�
9,000.00�
Fed-collected�revenue�(Gross)
Oil�Revenue Non-Oil�Revenue
Breakdown�of�Gross�Federation�Account�Revenue�(N�billion)
9�Months�to�2014 9�Months�to�2015

2015 Review & Outlook for 20162015 Review & Outlook for 20162015 Review & Outlook for 20162015 Review & Outlook for 2016 ��
Cowry Asset Management Limited Page 34
�
�
�
�
�
�
�
�
�
�
�
�
Federal�Government�Fiscal�Operations�
The� Federal� Government’s� fiscal� operations� during� the� first� nine� months� to�
September�resulted�in�deficit�balance�of�N450.90�billion,�albeit,�33.27%�less�than�
N675.70� billion� recorded� in� the� corresponding� period� of� 2014.� This� followed� a�
16.68%�y-o-y� decrease� in� retained� revenue� to� N2.33� trillion,� accompanied� by� a�
19.90%� y-o-y� decrease� in� expenditure� to� N2.78� trillion.� In� the� review� period,�
recurrent� expenditure� accounted� for� 84%� of� total� spends� (higher� than� 74%� in�
2014)�while�capex�got�only�6%�(lower�than�8%�in�2014).�
�
Components�of�Gross�Oil�Revenue�(N�billion)� �� �� ��
�� 9�Months�to�2015� 9�Months�to�2014� %�Change�
Oil�Revenue� 2,999.24�� 5,327.50�� -43.70%�
Crude�oil/Gas�Sales� 685.78�� 1,565.03�� -56.18%�
PPT/Royalties� 1,393.72�� 2,629.67�� -47.00%�
Others� 919.74�� 1,132.80�� -18.81%�
� � � �
� � � �
Components�of�Gross�Non-Oil�Revenue�(N�billion)� �� �� ��
�� 9�Months�to�2015� 9�Months�to�2014� %�Change�
Non-Oil�Revenue� 2,366.39�� 2,564.39�� -7.72%�
Value-Added�Tax�(VAT)� 600.95�� 601.34�� -0.06%�
Companies�Income�Tax�&�Other�Taxes� 749.97�� 1,004.92�� -25.37%�
Customs�&�Excise�Duties� 404.50�� 409.44�� -1.21%�
Others� 610.97�� 548.69�� 11.35%�
Source:�Central�Bank�of�Nigeria;�Cowry�Research�

2015 Review & Outlook for 20162015 Review & Outlook for 20162015 Review & Outlook for 20162015 Review & Outlook for 2016 ��
Cowry Asset Management Limited Page 35
�
����
����
����
����
����
����
����
����
����
����
����
����
����
����
����
���Source:�Central�Bank�of�Nigeria;�Cowry�Research�
����Breakdown�of�Federal�Government�Expenditure�(N�Billion)�
��� �Source:�Central�Bank�of�Nigeria;�Cowry�Research�
2,332.40�
2,783.30�
-450.90�-1,000.00�
-500.00�
0.00�
500.00�
1,000.00�
1,500.00�
2,000.00�
2,500.00�
3,000.00�
3,500.00�
4,000.00�
Retained�Revenue Expenditure Overall�Balance
Federal�Government�Fiscal�Operations�(N�billion)
9�Months�to�2014 9�Months�to�2015
74%
18%
8%
9�Months�to�2014
Recurrent Capital Transfers
84%
10%
6%
9�Months�to�2015
Recurrent Capital Transfers

2015 Review & Outlook for 20162015 Review & Outlook for 20162015 Review & Outlook for 20162015 Review & Outlook for 2016 ��
Cowry Asset Management Limited Page 36
Monetary�Sector�UpdateMonetary�Sector�UpdateMonetary�Sector�UpdateMonetary�Sector�Update����
Total�money� supply,�M2,� in� the� economy� increased� year-to-date� by� 9.11%� to�
N18.37� trillion� in� November� as� Net� Domestic� Assets� declined� by� 3.70%� to�
N13.08�trillion�and�Net�Foreign�Assets�fell�by�28.14%�to�N5.29�trillion.�Increase�
in� M2� followed� a� 7.76%� growth� in� quasi� money� (near� money� financial�
instruments)� to�N11.39� trillion�over� the� same�period.� In� the� same�vein,�narrow�
money,�M1,�increased�by�11.39%�to�N6.98�trillion�as�demand�deposits�increased�
by�16.73%�to�N5.72�trillion�which�more�than�offset�a�7.76%�decline�in�currency�
outside� banks� to� N1.26� trillion.� Meanwhile,� reserve� money� fell� by� 5.45%� to�
N5.64�trillion.�On�the�asset�side�of�the�banking�system�balance�sheet,�credit�to�
the� private� sector� increased� by� 3.08%� to� N18.71� trillion� as� credit� to� the�
government�fell�by�187.43%�to�N1.76�trillion.�
�
�
�
�
�
�
�
�
�
�
Monetary�Survey� Date� Value� YTD�%�∆�
Currency�outside�banks�(Ntrn)� Nov,�2015� 1.26� -7.76�
Bank�reserves�(Ntrn)� Nov,�2015� 4.01� -3.85�
Currency�in�circulation�(Ntrn)� Nov,�2015� 1.63� -9.16�
Reserve�money�(Ntrn)� Nov,�2015� 5.64� -5.45�
Demand�deposits�(Ntrn)� Nov,�2015� 5.72� 16.73�
M1�Money�(Ntrn)� Nov,�2015� 6.98� 11.39�
Quasi�money�(Ntrn)� Nov,�2015� 11.39� 7.76�
M2�Money�(Ntrn)� Nov,�2015� 18.37� 9.11�
Monetary�Policy�Rate�(%)� Nov,�2015� 11%� -15.38�
Credit�to�the�Government�(Ntrn)� Nov,�2015� 1.76� -187.43�
Credit�To�the�Private�Sector�(Ntrn)� Nov,�2015� 18.71� 3.08�
Net�Domestic�Credit�(Ntrn)� Nov,�2015� 20.47� 26.92�
Net�Foreign�Assets�(Ntrn)� Nov,�2015� 5.29� -28.14�Source:�Central�Bank�of�Nigeria,�Cowry�Research

2015 Review & Outlook for 20162015 Review & Outlook for 20162015 Review & Outlook for 20162015 Review & Outlook for 2016 ��
Cowry Asset Management Limited Page 37
Money�Market�ReviewMoney�Market�ReviewMoney�Market�ReviewMoney�Market�Review����
Monetary�Authority�Relax�Policies�to�Egg�Economic�Growth�
In�the�year�under�review,�the�interbank�money�market�witnessed�greater�boost�in�
financial�system�liquidity�in�comparison�to�the�corresponding�period�of�2014.�This�
was�against�the�backdrop�of� less�withdrawal�via�auctions� in�both�primary�market�
and�open�market�operations�which�made�up� for�decline� in� inflows� through�both�
market�segments.�
In�the�eleven�months�to�November�2015,�the�banking�system�also�recorded�lower�
disbursements� from� Federation� Accounts� Allocation� Committee� (FAAC)� into� the�
accounts� of� the� three� tiers� of� governments� –� a� 22.46%�year-on-year� decline� to�
N5.43�trillion.�
Monetary� policies� which� were� initially� tightened� in� order� to� curb� inflationary�
pressures� from� increased� political� spending� activities� and� high� foreign� exchange�
demand,� amongst� others,� were� eventually� loosened� up,� partly� due� to� the�
expediency� of� egging� economic� growth� amid� high� foreign� exchange� rates� in� a�
highly�import-dependent�economy.�The�Monetary�Policy�Rate�(MPR)�was�reduced�
from�13%�to�11%�(with�an�asymmetric�corridor�+2�and�-7%�around� the�MPR�as�
against�a�previously�symmetric�corridor�of�±2%).�Net�Open�Position�was�increased�
to�0.5%�from�0.1%.��
In� May,� the� Monetary� Policy� Committee� (MPC)� harmonized� the� Cash� Reserve�
Ratio� (CRR)� on� public� and� private� sector� deposits� at� 31.0%� (from�public� sector�
deposits� CRR� of� 75%� and� private� sector� deposits� CRR� of� 20%)� but� was�
subsequently� reduced� to� 25%� in� September� and,� eventually,� 20%� in�November.�
Liquidity�Ratio�was�unchanged�at�30%.�
�

2015 Review & Outlook for 20162015 Review & Outlook for 20162015 Review & Outlook for 20162015 Review & Outlook for 2016 ��
Cowry Asset Management Limited Page 38
Decreased�Open�Market�Operations�Activities�in�2015�
As�at�December�15,�2015,�Central�Bank�of�Nigeria�sold�less�treasury�bills�in�its�bi-
monthly� auctions� at� the� primary� market� in� 2015� relative� to� the� corresponding�
period� of� the� preceding� year.� In� the� review� period,� CBN� sold� a� total� of� N3.58�
trillion,�a�6.34%�year-on-year�decrease�compared�to�N3.82�trillion�in�2014.��
There� were� also� relatively� less� matured� treasury� bills� which� fell� by� 26.04%� to�
N8.69� trillion� via� both� primary� market� and� OMO.� Consequently,� the� Interbank�
money�market� recorded� net� inflows� amounting� to�N1.29� trillion,� 94.77%�higher�
N664.02�billion�net�inflows�in�2014.�Also,�average�marginal�rates�of�the�182-day�
and� 364-day� tenors� were� relatively� higher� in� the� review� period� than� in� the�
corresponding�period�of�2014�amid�increased�political�and�economic�risks.�
�
�
�
�
�
�
�
�
�
�
�
Marginal�Rates�of�Treasury�Bills�in�2015�and�2014�
Source:�Central�Bank�of�Nigeria,�Cowry�Research�
0
2
4
6
8
10
12
14
16
18
91-day 182-day 364-day 2014�Inflation�(YoY)
0
2
4
6
8
10
12
14
16
18
91-day 182-day 364-day 2015�Inflation�(YoY)

2015 Review & Outlook for 20162015 Review & Outlook for 20162015 Review & Outlook for 20162015 Review & Outlook for 2016 ��
Cowry Asset Management Limited Page 39
�
�
�
�
�
�
�
�
�
�
�
�
�
�
�
�
�
�
Central�Bank�2015�Monetary�Operations����
2015�� 2014�
(N�‘million)� (N�‘million)� %�Change�
System�Injections� ��
Primary�Market� 3,850,932.82�� 5,063,008.71�� -23.94%��
Open�Market�Operations� 4,843,184.83�� 6,692,593.19�� -27.63%��
Total�Inflows� 8,694,117.65�� 11,755,601.90�� -26.04%��
�� �� �� ��
System�Withdrawals��
�
Primary�Market�Auctions� 3,580,844.72�� 3,823,375.52�� -6.34%��
Open�Market�Operations� 3,819,952.45�� 7,268,202.40�� -47.44%��
Total�Outflows� 7,400,797.18�� 11,091,577.92�� -33.28%��
� ��
�Net�System�Inflows� 1,293,320.47�� 664,023.99�� 94.77%��Source:�Central�Bank�Nigeria,�Cowry�Research�
�
FAAC�Disbursements�in�2015����
����2015� 2014� �
�(N�‘million)� (N�‘million)� %�Change�
January� 580.4� 581.5� -0.19%�
February� 500.10� 629.12� -20.51%�
March� 522.05� 641.29� -18.59%�
April� 435.06� 641.38� -32.17%�
May� 388.34� 634.72� -38.82%�
June� 359.37� 683.3� -47.41%�
July� 923.88� 755.95� 22.21%�
August� 521.27� 630.30� -17.30%�
September� 442.61� 611.70� -27.64%�
October� 389.9� 603.59� -35.40%�
November� 369.88� 593.34� -37.66%�
December� NA*� 628.77� �
Total� 5,432.86� 7,634.96� �Source:�Cowry�Research�
*Not�Available�as�at�report�time�
�

2015 Review & Outlook for 20162015 Review & Outlook for 20162015 Review & Outlook for 20162015 Review & Outlook for 2016 ��
Cowry Asset Management Limited Page 40
Spiked�Movements�in�Interbank�Rates�on�TSA�and�CRR�Adjustments�
The� implementation� of� Treasury� Single� Account� (TSA)� coupled� with� the� prior�
adoption�and�subsequent�adjustments�of�CRR�mechanisms�exerted�pressure�on�
liquidity� in� the� interbank�money�market� resulted� in� the� spike� in� lending� rates,�
particularly�for�overnight�funds�which�got�to�93.12%.�On�the�average,�overnight�
funds� rate� and� 3� months� NIBOR� rose� to� 15.06%� and� 15.77%,� higher� than�
12.55%�and�13.43%�in�2014.�
�
Nigerian�Interbank�Offer�Rates�in�2015�vs�2014����
�Overnight�NIBOR���� 3�Months�NIBOR����
��������
Overnight�NIBOR���� 3�Months�NIBOR����
2015�Low� 0.85%� 10.43%��
H1�2014�Low� 9.50%� 11.17%�
2015�High� 93.12%� 22.26%��
H1�2014�High� 65.79%� 18.79%�
2015�Average� 15.06%� 15.77%��
H1�2014�Average� 12.55%� 13.43%�
Source:�Financial�Markets�Dealers�Quotation;�Cowry�Research�
�
�
�
�
�
�
�
�
�
NIBOR�movement�in�2015�vs�2014�(in�%ages)�
� � �Source:�Financial�Markets�Dealers�Quotation;�Cowry�Research
10
20
30
40
50
60
70
Overnight�NIBOR 3�MTHS�NIBOR
0�
10�
20�
30�
40�
50�
60�
70�
80�
90�
100�
Overnight�NIBOR 3�MTHS�NIBOR

2015 Review & Outlook for 20162015 Review & Outlook for 20162015 Review & Outlook for 20162015 Review & Outlook for 2016 ��
Cowry Asset Management Limited Page 41
Lenders�Shun�Investments�via�Standard�Deposit�Facility�
In� the� review� period,� deposit� money� banks’� investments� via� standard� deposit�
facility�declined�on�account�of�restriction�of�remunerable�daily�placements�with�
the�apex�bank� to�N7.5�billion�per�bank;�consequently;�standard�deposit� facility�
decreased�by�63.80%�to�N21.54�trillion.�On�the�other�hand,�the�DMOs�accessed�
more� loans� from� the� apex� bank� as� standard� lending� facility� rose� 123.63%� to�
N6.71�trillion.��
�
Transactions�with�Apex�Bank�(N�Million)�
�2015� 2014� %�Change�
Standard�Lending�Facility� 6,713,521.71� �����3,002,031.19�� 123.63%�
Standard�Deposit�Facility� 21,542,233.42� ���59,513,559.18�� -63.80%�
Source:�Central�Bank�of�Nigeria,�Cowry�Research�
�
�
Lower�Real�Returns�in�2015…�
Against�the�backdrop�of�relatively�high�CRR�regime�in�the�first�nine�months�to�
September,� commercial� banks� increased� interest� rates� on� their� term� deposit�
between�May� and� September� in� order� to� attract� more� funds� from� the� private�
sector.�However,�as�CRR�was�reduced�to�20%�in�September,�interest�rates�began�
to� fall� from� October.� In� addition,� relatively� inflation� rate� in� the� review� year�
resulted� in� lower� real� returns� to� depositors� in� 2014.� Real� returns� in� 2015�
averaged�0.06%�compared�to�1.37%�in�2014.��
In�the�eleven�months�to�November,�Savings�deposit�rate�averaged�3.61%�in�the�
review�period�(higher�than�3.36%�in�2014);� interest� rates�on�1�month�deposits�

2015 Review & Outlook for 20162015 Review & Outlook for 20162015 Review & Outlook for 20162015 Review & Outlook for 2016 ��
Cowry Asset Management Limited Page 42
averaged�8.58%�in�2015�(higher�than�8.32%�in�2014)�while�interest�rates�on�12�
months�deposits�averaged�9.02%�in�2015�(higher�than�9.11%�in�2014).�
�
�
�
�
�
�
�
�
�
�
�
�
�
�
�
�
�
�
�
�
�Source:�Central�Bank�of�Nigeria,�Cowry�Research�
-5
-4
-3
-2
-1
0
1
2
3
Jan Feb Mar Apr May Jun Jul Aug Sept Oct Nov Dec
Real�Returns�on�12�Months�Deposits
2015�Real�Returns 2014�Real�Returns
Real� returns� on� 12� months� deposits� with�
commercial�banks�turned�negative�in�April,�
May,�October�and�November�of�2015�amid�
increased�inflation�rates�
Source:�Central�Bank�of�Nigeria,�Cowry�Research�� � � � � � ������������
2
3
4
5
6
7
8
9
10
11
2014�Interest�Rates�vs�Inflation�Rates�(%ages)
1�Month�Deposit�Rate 12�Months�Deposit�Rate
Savings�Deposit�Rate Inflation
2
3
4
5
6
7
8
9
10
11
12
2015�Interest�Rates�vs�Inflation�Rates�(%ages)
1�Month�Deposit�Rate 12�Months�Deposit�Rate
Savings�Deposit�Rate Inflation

2015 Review & Outlook for 20162015 Review & Outlook for 20162015 Review & Outlook for 20162015 Review & Outlook for 2016 ��
Cowry Asset Management Limited Page 43
�
GAP�between�Prime�Lending�Rates�and�Maximum�Lending�Rates�Widens�
In�the�review�period,�maximum�lending�rates�to�borrowers� increased� in�tandem�
with�the�increase�in�interest�rates�on�deposits.�Prime�lending�rates�also�increased�
compared�to�rates� in� the�corresponding�period�of�2014.�On�average,�maximum�
lending� rate� was� 26.69%� in� 2015� (higher� than� 25.73%� in� 2014)� while� prime�
lending� rate� in� the� review� period� was� 16.84%� (lower� than� 16.61%� in� 2014).�
Consequently,�the�gap�between�prime�lending�rates�and�maximum�lending�rates�
widened�further.�
�
�
�
�
�
�
�
����
�
�
�
Source:�Central�Bank�of�Nigeria,�Cowry�Research� � � � � � �
14
16
18
20
22
24
26
28
Jan Feb Mar Apr May June Jul Aug Sep Oct Nov
Prime�Lending�Rates�vs�Maximum�Lending�Rates
2015�Prime�Lending�Rate 2015�Maximum�Lending�Rate
2014�Prime�Lending�Rate 2014�Maximum�Lending�Rate

2015 Review & Outlook for 20162015 Review & Outlook for 20162015 Review & Outlook for 20162015 Review & Outlook for 2016 ��
Cowry Asset Management Limited Page 44
ForeignForeignForeignForeign����ExchangeExchangeExchangeExchange����MarketMarketMarketMarket����ReviewReviewReviewReview����
Spread�between�Official�and�Alternative�Market�Segment�Widen…�
In�furtherance�to�the�apex�bank’s�strategic�priority�aimed�at�achieving�exchange�
rate� stability,� the� bank� continued� to� enforce� strict� capital� controls,� which� are�
central�to�its�foreign�exchange�management�strategy�as�the�apex�bank�grapples�
with�dwindling�external�reserves�and�declining�oil�prices.�The�central�bank�largely�
employed� unconventional� policies� aimed� at� curbing� rent� seeking� activities.�
However,�this�led�to�a�further�widening�of�the�spread�between�official�rates�and�
parallel�market�rates.�In�addition,�a�USD�sale�via�the�RDAS�window�was�annulled�
while�a�‘clearing�rate’�of�N197/USD�was�instituted.�This�act�represented�a�tacit�
devaluation�of� the�Naira�by� the�apex�bank.�Also,�dollar� sales� to� lenders�at� the�
interbank� foreign� exchange� market� was� changed� to� an� order� driven� system�
(known� as� the� order� based� two�way� quote� system)� as� against� the� OTC� quote�
driven�system.��
�
�
Source:�Central�Bank�of�Nigeria,�Cowry�Research�
�
USD�150.00
USD�170.00
USD�190.00
USD�210.00
USD�230.00
USD�250.00
USD�270.00
USD�290.00
rdas Parallel

2015 Review & Outlook for 20162015 Review & Outlook for 20162015 Review & Outlook for 20162015 Review & Outlook for 2016 ��
Cowry Asset Management Limited Page 45
Major�CBN�Interventions�in�the�year�under�review�
Measures�adopted�by�the�apex�bank�to�conserve�the�foreign�exchange�reserves,�
check� speculative�activities� in� the� foreign�exchange�market� as�well� as�enhance�
availability�of�foreign�currency�to�genuine�end�users�include:�
� In� January,� banks� were� required� to� utilize� funds� purchased� from� the�
autonomous/interbank�foreign�exchange�market�within�72�hours�from�the�
value�date,� failing�which� such� funds�must�be� returned� to� the�CBN�at� the�
Bank’s�purchase�rate.�
� In�order�to�curb�speculative�demand�in�the�market,�the�apex�bank�directed�
that�both�RDAS�and�interbank�funds�be�used�strictly�for�funding�of�Letters�
of�Credit,�Bills�of�Collection�and�other�invisible�transactions.�The�CBN�also�
directed� that� these� funds� could� no� longer� be� sold� to� BDCs� and� other�
authorized�dealers.�
� To� improve� trading� liquidity,� Net� Foreign� Exchange� Trading� Position�
(NFETP)� was� reviewed� upward� from� 0.1%� to� 0.5%.� The� NFETP� is� the�
percentage� of� shareholders’� funds� unimpaired� by� losses� at� the� close� of�
trading�each�day.�Also,�weekly�forex�cash�sales�to�Bureaux�De�Change�was�
reviewed�upward�from�USD15,000�to�USD30,000.�
� The�RDAS/WDAS�foreign�exchange�window�at�the�CBN�was�annulled�and�
all�demand� for� foreign�exchange�was�channelled� to� the� interbank� foreign�
exchange� market� tied� to� a� clearing� rate� of� N199/USD.� This� was� a� tacit�
devaluation�of�the�Naira�as�USD�was�previously�sold�at�N168/USD�+/-5,�at�
the�RDAS�auction.�
� Trading� in� the� interbank�market� was� changed� to� an� order� driven� system�
(order� based� two� way� quote� system)� as� against� the� OTC� quote� driven�
system�which�is�standard�global�practice.��

2015 Review & Outlook for 20162015 Review & Outlook for 20162015 Review & Outlook for 20162015 Review & Outlook for 2016 ��
Cowry Asset Management Limited Page 46
� All� authorized� dealers� required� to� repatriate� export� proceeds� into� the�
export�proceeds�domiciliary�accounts�of�the�respective�exporters’�accounts�
within�90�days�(for�oil�exports)�and�180�days�(for�non-oil�exports),�failing�
which�the�collecting�bank�will�be�liable�to�a�fine�of�10%�of�the�FOB�value�
of�the�transaction.�
� In� March,� Central� Bank� set� the� price� at� which� banks� could� access� U.S.�
Dollars�from�oil�companies�at�not�more�than�N2�spread�to�its�clearing�rate.�
Banks�were�also�barred� from� reselling�oil� company�dollars�except� the� sale�
was�backed�by�a�customer�order.�
� In� furtherance� of� CBN’s� efforts� to� reduce� the� demand� for� forex� and�
manage�the�country’s�foreign�reserves,�the�apex�bank,�in�April,�announced�
the� downward� review� of� the� existing� limit� on� the� usage� of� Naira�
denominated� debit/credit� cards� used� for� overseas� transactions.�
Consequently,�the�annual�transaction�limit�was�reduced�to�USD50,000�from�
USD150,000,� while� the� daily� transaction� limit� was� reviewed� to� USD300�
from�the�previous�USD500.�
� In� June,� the� CBN� prohibited� importers� of� certain� items� from� accessing�
foreign� exchange� market.� The� affected� items� include� staples,� textiles,�
plastics,� steel-based� products,� wood-based� products� and� financial�
instruments� such� as� Eurobonds,� foreign� currency� bonds� and� shares.� The�
measure,� according� to� the� apex� bank,� was� expected� to� help� conserve�
foreign�reserves.�
� CBN� introduced� 20%� charge� on� dollar� cash� deposits� by� Deposit� Money�
Banks� (DMB).� Consequently,� some� DMBs� discouraged� public� dollar� cash�
deposits� by� raising� the� charge� for� such� deposits� to� 25%� of� deposited�
amount�while�others�discouraged�dollar�deposits�all�together.�
� In�the�month�of�November,�the�CBN�began�enforcing�the�use�of�the�Bank�
Verification�Number�for�authenticating�foreign�exchange�transactions.�

2015 Review & Outlook for 20162015 Review & Outlook for 20162015 Review & Outlook for 20162015 Review & Outlook for 2016 ��
Cowry Asset Management Limited Page 47
� In� December� of� 2015,� Deposit� Money� Banks� banned� the� use� of� Naira�
denominated�debit�cards�overseas�effective�January�2016.�
�
�
The�Local�Currency�Weakens�at�Local�Forex�Markets�
As� a� direct� impact� of� CBN� policies,� the� Naira� depreciated� by� 17.26%� to�
N196.95/USD�at� the�official� segment�of� the� foreign�exchange�market� in� the�
year�under�review.�Similarly,�the�Naira�lost�6.99%�year-to-date�to�N199.1/USD�
at� the� interbank�market.�The� local� currency�also� suffered�massive�declines�at�
the�alternative�market�segments-� the�Naira� lost�39.84%�to�N265/USD�at� the�
Bureau� De� Change� segment� while� it� slid� by� 38.74%� at� the� parallel� market�
segment�to�N270/USD.�
�
�
USD/Naira�Foreign�Exchange�Rates�� �� ��
Foreign�Exchange�Markets� 2015�Close� 2014�Close� 2015�YTD�%∆� 2014�YTD�%∆�
USD/Naira�Pair�� � � �
RDAS/Clearing�Rate� 197� 168� 17.26�� 7.90��
Interbank�Market� 199.1� 186.1� 6.99�� 16.28��
Bureau�De�Change� 265� 189.50� 39.84�� 10.82��
Parallel�Market� 270� 191.00� 41.36�� 10.40��
Source:�Central�Bank�of�Nigeria;�Financial�Markets�Dealers�Quotation,�Cowry�Research�
�
�

2015 Review & Outlook for 20162015 Review & Outlook for 20162015 Review & Outlook for 20162015 Review & Outlook for 2016 ��
Cowry Asset Management Limited Page 48
Bond�Market�ReviewBond�Market�ReviewBond�Market�ReviewBond�Market�Review����
The�local�debt�market�remains�robust�and�resilient�
The�Nigerian� bond�market� grew� in� the� domestic� debt� segment� as� against� the�
market� for� international� debt� which� saw� declines� in� issues� in� sovereign� and�
corporate� debt� issuance� in� 2015.� The� face� value� of� the� Nigerian� local�
denominated�debt�market�grew�by�28.6%�to�N6.9�trillion�(from�N5.37�trillion�in�
2014).� This� was� driven� by� the� face� value� for� FGN� Naira� denominated� bonds�
which�grew�by�24%�to�N5.93�trillion.�The�rise�in�the�value�of�FGN�bonds�was�due�
to� the� recent� conversion� of� state� loans� into� the� 20-year� FGN� 12.1493%� JUL�
2034�bond�at�a� transaction�yield�of�14.83%.�The�outstanding�value�of�the�20-
year� FGN�12.1493%�JUL�2034�bond� jumped�by� 504%� to�N1.075� trillion� from�
N178�billion�in�the�preceding�year.�
�
FGN�Bond�Outstanding�Value�2014��������
(N�Billions)�Outstanding�Value�2015��������
(N�Billions)�5-Year,�4.00�23-APR-2015�
�����������������������������535� ������������������������������������������0�
5-Year,�15.10�27-APR-2017�
���������������������������������452.80�� ���������������������������������480.13��
5-Year,�15.54�13-FEB-2020�
������������������������������������������-���� ���������������������������������451.93��
10-Year,�14.20�14-MAR-2024�
���������������������������������414.68�� ���������������������������������719.99��
20-Year,�12.1493�18-JUL-2034�
���������������������������������178.00�� ������������������������������1,075.92��
Source:�Financial�Markets�Dealers�Quotation,�Cowry�Research�
�
�
�
�

2015 Review & Outlook for 20162015 Review & Outlook for 20162015 Review & Outlook for 20162015 Review & Outlook for 2016 ��
Cowry Asset Management Limited Page 49
The�Local�Primary�Market�
Demand� for� FGN� Bonds� Remained� Strong� Despite� the� Exit� of�
Foreign�Interests�
The�Central� Bank� issued� bonds�worth�N788.72� billion� on� the� primary�market�
for�Federal�Government�bonds.�This� is� a�15.8%�decline� in�debt� issued� in� the�
preceding�year�amid�the�redemption�of�the�5-year,�4%�FGN�APR�2015�bonds�
issued� in�April�2010.�All� the� issued�bonds�were�re-openings�except�for�the�5-
year,�15.54%�FEB�2020�debt�which�was�first� issued� in�April�2015.�The�bonds�
offered�recorded�a�total�subscription�of�N1.75�trillion,�an�over�subscription�of�
122%�in�total.�
�
FGN�Bond� Amount�Allotted����
Amount�Subscribed���� %Subscription����
5-Year,�4.00�23-APR-2015� -� -� �5-Year,�15.10�27-APR-2017� 58,000� 116,750� 101.29��
5-Year,�15.54�13-FEB-2020� ���������������������������288,000.00��
���������������������������663,700.00��
130.45��
10-Year,�14.20�14-MAR-2024� ����������������������������225,220.00��
����������������������������529,135.00��
134.94��
12-Year�18-JUL-2034� ���������������������������217,500.00��
����������������������������442,386.00��
103.40��
� ���������������������������788,720.00��
������������������������������������1,751,971.00��
122.13��
Source:�Debt�Management�Office,�Cowry�Research�
�
�
�
�
�

2015 Review & Outlook for 20162015 Review & Outlook for 20162015 Review & Outlook for 20162015 Review & Outlook for 2016 ��
Cowry Asset Management Limited Page 50
State�Government�Bond�Market�Remained�Robust…�
Debt� issued� by� sub-national� entities� this� year� increased� by� 190%� to� N54.13�
billion�as�against�N18.68�billion�in�the�previous�year.�The�bonds�were�issued�by�
Oyo,�Benue,�Plateau,�Kogi,�Cross-river� state�and�Zamfara� state�governments.�
The�details�can�be�found�in�the�table�below:��
State�Govt�Bond� Issue�Date� Coupon� Outstanding�Value��(N’Bn)�
Maturity�Date�
7-Year,�16.50�OYO�16-FEB-2022� 17-Feb-15� 16.50� 4.61� 16-Feb-22�7-Year,�16.50�BENUE�27-FEB-2022� 27-Feb-15� 16.50� 4.75� 27-Feb-22�7-Year,�17.50�PLATEAU�30-MAR-2022� 30-Mar-15� 17.50� 27.10� 30-Mar-22�7-Year,�17.00�KOGI�II�31-MAR-2022� 01-Apr-15� 17.00� 3.00� 31-Mar-22�7-Year,�17.00�CROSS�RIVER�27-MAY-2022� 27-May-15� 17.00� 7.68� 27-May-
22�7-Year,�17.00�ZAMFARA�19-MAY-2022� 19-May-15� 17.00� 7.00� 19-May-
22�Total� � � 54.13� �Source:�Financial�Markets�Dealers�Quotation,�Cowry�Research�
�
As�at�December�2015,�the�total�value�of�outstanding�sub-national�bonds�stood�
at�N474.72�billion,�a�marginal�0.78%�increase�from�the�previous�year.�Meanwhile�
against� the� backdrop� of� steep� decline� in� revenue,� bank� loans� to� states� were�
authorised�for�restructuring�into�Federal�Government�bonds.�Twenty�three�states�
participated�in�this�process�in�two�phases;�eleven�states�were�involved�in�the�first�
phase� and� the� sum� of� N322.788� billion� was� converted� into� 20-year� Federal�
Government�bonds�effective�August�17,�2015.�Twelve�states�participated�in�the�
second�phase�with�loans�to�the�tune�of�N252.728�billion�were�restructured.�The�
total� restructured� amount� for� the� twenty� three� states� amounted� to� N575.516�
billion.�
�
�

2015 Review & Outlook for 20162015 Review & Outlook for 20162015 Review & Outlook for 20162015 Review & Outlook for 2016 ��
Cowry Asset Management Limited Page 51
Corporate�Bonds�
The�bond�market�remained�a�veritable�source�of�funding�for�corporate�entities�as�
new� debt� issued� by� corporate� entities� were� worth� N47.94� billion,� although,� a�
59.6%� decline� (from� N76.54� billion)� with� respect� to� new� issues� in� 2014.� The�
corporate�entities�that�raised�fund�from�the�bond�market�include�Fidelity�Bank,�
Transcorp�and�the�Nigerian�Mortgage�Refinancing�Company.�
Corporate�Naira�Bonds� Issue�Date� Coupon�Outstanding�Value(N’Bn)�
Maturity�Date�
16.48�FIDELITY�13-MAY-2022� 13-May-15� 16.48� 30.00� 13-May-22�
16.00�TRANSCORP�26-OCT-2022� 26-Oct-15� 16.00� 10.00� 26-Oct-22�
14.90�NMRC�29-JUL-2030� 29-Jul-15� 14.90� 7.94� 29-Jul-30�
Total� � � 47.94� �
Source:�Financial�Markets�Dealers�Quotation,�Cowry�Research�
�
�
The� face� value� of� total� debt� issued� by� corporate� entities� jumped� by� 307%� to�
N507.55�billion.�Local�Corporates�have� shied� away� from� the� international� debt�
market� as� the� face� value� for� corporate� Eurobonds� fell� by� 23.3%� to� USD3.65�
billion.� No� corporate� Eurobond� was� issued� in� 2015� given� that� about� USD1.8�
billion�was�raised�via�the�international�market�in�2014.�
�
The�OTC�Bond�Market�Activities�Remained�Strong…�
FGN�bonds�proved� investor� favorite�as�appetite� for� local�debt� remained� strong�
amid� phased� removal� of� Nigerian� bonds� from� the� JP� Morgan� GBI-Emerging�

2015 Review & Outlook for 20162015 Review & Outlook for 20162015 Review & Outlook for 20162015 Review & Outlook for 2016 ��
Cowry Asset Management Limited Page 52
Markets� Index� (included� in�October�2012)�and� the�Barclays�Capitals’�Emerging�
Markets-�Local�Currency�Bond�Index�(included�in�March�2013).�Tracked�indices�
suggest� robust� demand� as� investors� sought� alternatives� to� the� bearish�
performance� of� the� equities� market.� As� at� December� 15,� 2015,� the� 20-year,�
10.00%� FGN� JUL� 2030� bond� advanced� by� N29.79� (yield� fell� to� 10.95%� from�
14.75%).�The�10-year,�16.39%�FGN�JAN�2022�paper�gained�N17.89�(yield�fell�
to�10.84%�from�15.25%);�the�7-year,�16.00%�FGN�JUN�2019�note�strengthened�
by� N14.59� (yield� decreased� to� 9.83%� from� 15.27%);� the� 5-year� 15.10%� FGN�
APR�2017�bond�rose�by�N8.34�(yield�slid�to�7.85%�from�15.17%)�while�the�3-
year,�13.05%�FGN�AUG�2016�bond� jumped�by�N6.65�(yield�slumped�to�5.96%�
from�13.45%).�
On�the�international�debt�market,�amid�steady�declines�in�crude-oil�prices�as�well�
as�external�reserves,�investors�sold�off�their�holdings�of�FGN�dollar�denominated�
debt.�The�6.75%�FGN�JAN�2021�note� lost�USD�9.29�(yield� increased�to�8.32%�
from�6.12%)�while�the�5.13%�FGN�JUL�2018�debt�decreased�by�USD�3.86�(yield�
rose� to� 6.81%� from�5.02%).� Similarly,� the� 6.38%�FGN� JUL�2023�bond� fell� by�
USD�10.49�(yield�increased�to�8.44%�from�6.48%).�
�
�
�
�
�
�
�

2015 Review & Outlook for 20162015 Review & Outlook for 20162015 Review & Outlook for 20162015 Review & Outlook for 2016 ��
Cowry Asset Management Limited Page 53
Bond�Summary��
�
Source:�Financial�Markets�Dealers�Quotation,�Cowry�Research�
�
�
The�Federal�government�still� remains� the� largest�borrower�on� the� local�market,�
while� it� has� also� provided� the� opportunity� to� restructure� short-term� loans� into�
long�term�debt�for�state�governments.�
�
�
�
�
�
�
FGN�Bonds�,�5,936
State�bonds�,�465
Corp�Bonds�,�508
Agency�Bond,�2Sukuk,�10
Supranational�Bond,�25
Face�Values�of�Local�Outstanding�Bonds�in�2015�(N�Billion)

2015 Review & Outlook for 20162015 Review & Outlook for 20162015 Review & Outlook for 20162015 Review & Outlook for 2016 ��
Cowry Asset Management Limited Page 54
Equities�Market�ReviewEquities�Market�ReviewEquities�Market�ReviewEquities�Market�Review����
�
In� the� year� 2015,� the� Nigerian� bourse� lost� 17.35%�Year-on-Year� compared� to�
the�47%�return�delivered� in�FY�2014�as�the�best�performing�equities�market� in�
Africa.� Despite� the� initial� enthusiasm� that� ushered� in� the� new� political�
dispensation,�the�NSE�All�Share� Index�declined�by�17.35%�to�28,642.25�points�
while�market�capitalization�fell�to�N9.85�trillion,�a�14.24%�drop.�The�precipitous�
decline�in�oil�prices�coupled�with�capital�restrictions�as�a�policy�response�by�the�
apex�bank,�triggered�massive�outflows�of�foreign�capital.�
�
mparative�Performances� FY�2015� FY�2014� FY�2013� FY�2012�
NSE�All�Share�Index�(%)� (17.35)� 2.79�� 47.19� 35.45�
Market�Capitalisation�(%)� (14.24)�� 6.06�� 47.38� 37.38�
�Source:�Nigerian�Stock�Exchange,�Cowry�Research�
�
�
��
�

2015 Review & Outlook for 20162015 Review & Outlook for 20162015 Review & Outlook for 20162015 Review & Outlook for 2016 ��
Cowry Asset Management Limited Page 55
�
Source:�Nigerian�Stock�Exchange;�Cowry�Research�
�
Decline�in�Investments�Reflecting�Political�Realities…�
Following�the�postponement�of�the�general�elections�from�14�February�2015�to�
28�March�2015,�the�negative�performance�of�equities�market�performance�in�the�
first� quarter� was� reflected� by� month-on-month� increase� in� Foreign� Portfolio�
Investment�(FPI)�outflows�by�59.73%�to�N81.60�billion� in�February�while�retail�
investors�participation� in�the� local�bourse�remained� low-key�–�foreign�portfolio�
investments� accounted� for� 72.1%� of� total� investments� in� February.� With�
increased� domestic� participation� which� rose� to� 44.27%� of� investments� (from�
27.39%� in� the� previous� month),� as� well� as� a� steep� 35.78%� decline� in� FPI�
outflows,�the�market�began�a�steady�and�consistent�rise.�
Following� successful� conduct� of� the� elections,� the� equities�market� rallied-� the�
NSE� All� Share� Index� reached� a� year� high� of� 35,728.12� points� while� market�
capitalization�went�past�the�N12�trillion�mark�on�April�2,�2015.�This�was�due�to�a�
significant�rise�in�domestic�participation�coupled�with�a�rebound�in�post�election�
FPI�inflows.�Domestic�investment�increased�by�26.33%�to�N102.91�billion�which�
8,000.00�
8,500.00�
9,000.00�
9,500.00�
10,000.00�
10,500.00�
11,000.00�
11,500.00�
12,000.00�
12,500.00�
26,000.00�
29,000.00�
32,000.00�
35,000.00�
Billion�Naira
2016�Local�Bourse�Performance
Market�Capitalization�(Bn�N) NSE�ASI

2015 Review & Outlook for 20162015 Review & Outlook for 20162015 Review & Outlook for 20162015 Review & Outlook for 2016 ��
Cowry Asset Management Limited Page 56
formed� about� half� of� the� total� transactions� in� the� bourse� (49.75%),�while�FPI�
inflows�rose�by�8%.�
As� the� incoming� government� failed� to� clearly� articulate� its� policy� direction,�
investors� adopted� a� ‘wait� and� see’� approach� as� seen� in� the� weak� domestic�
transactions� in� June� and� a� slight� rise� in� FPI� inflows.� However,� poor� half-year�
earnings�result�aggravated�sell-offs�in�Q3�2015.�Exchange�rate�losses,�high�input�
costs�and�increased�costs�of�lending�were�reasons�for�most�of�the�disappointing�
results.�Furthermore,� in� response� to� the� sharp� fall� in� crude-oil�prices,� the�apex�
bank� instituted� strict� capital� controls� aimed� at� managing� depleting� reserves�
rather� than�devaluing� the�Naira.�This�action�has� led� to�massive� sell-offs� in� the�
equities�markets�as�‘hot�money’�left�the�financial�system�in�vast�sums�as�foreign�
participation�in�the�market�declined�while�domestic�investment�switched�to�fixed�
income�securities.�
�
�Source:�Nigerian�Stock�Exchange;�Cowry�Research�
�
�
0
20
40
60
80
100
120
Jan Feb Mar Apr May Jun Jul Aug Sep Oct Nov
Foreign�Portfolio�Investments�in�2015�(N�billion)
FPI�inflows FPI�Outflows Domestic�Spending
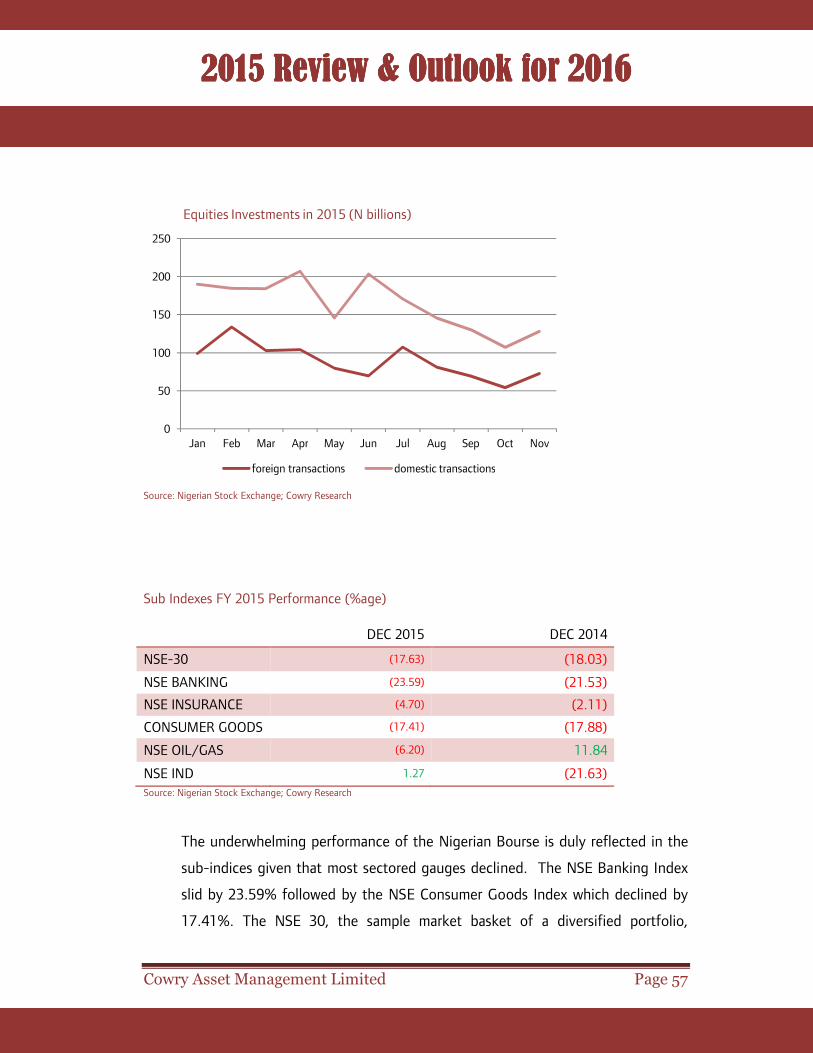
2015 Review & Outlook for 20162015 Review & Outlook for 20162015 Review & Outlook for 20162015 Review & Outlook for 2016 ��
Cowry Asset Management Limited Page 57
�Source:�Nigerian�Stock�Exchange;�Cowry�Research��
�
�
Sub�Indexes�FY�2015�Performance�(%age)�
� DEC�2015� DEC�2014�
NSE-30� (17.63)� (18.03)�
NSE�BANKING� (23.59)� (21.53)�
NSE�INSURANCE� (4.70)� (2.11)�
CONSUMER�GOODS� (17.41)� (17.88)�
NSE�OIL/GAS� (6.20)� 11.84�
NSE�IND� 1.27�� (21.63)�
Source:�Nigerian�Stock�Exchange;�Cowry�Research�
The�underwhelming�performance�of�the�Nigerian�Bourse�is�duly�reflected�in�the�
sub-indices�given�that�most�sectored�gauges�declined.��The�NSE�Banking�Index�
slid�by�23.59%�followed�by�the�NSE�Consumer�Goods� Index�which�declined�by�
17.41%.� The� NSE� 30,� the� sample� market� basket� of� a� diversified� portfolio,�
0
50
100
150
200
250
Jan Feb Mar Apr May Jun Jul Aug Sep Oct Nov
Equities�Investments�in�2015�(N�billions)
foreign�transactions domestic�transactions

2015 Review & Outlook for 20162015 Review & Outlook for 20162015 Review & Outlook for 20162015 Review & Outlook for 2016 ��
Cowry Asset Management Limited Page 58
declined�by�17.63%,�however,�the�only�bright�spot�was�the�NSE�Industrial�Index,�
which�rose�by�a�marginal�1.27%.��
Investment�Levels�and�Activities��
����FY�2015� FY�2014� %�Change�
Total�Deals� 1,034,280� 1,195,639� (13.50)�
Total�Volume� 104,627,785,996� 101,604,015,590� 2.98��
Total�Value� 1,079,221,079,245� 1,322,225,732,815.06� (18.38)�
No�of�Trading�Days� 247� 250� (1.20)�
Average�Deals� 3,859� 4,782� (19.30)�
Average�Volume� 390,402,187� 432,437,542� (9.72)�
Average�Value� 4,026,944,326� 4,111,651,216.86� (2.06)�
�
There�was�a�general�decline�in�investment�activity�at�the�Nigerian�bourse�in�year�
under� review� with� respect� to� the� previous� year.� Total� deals� and� Naira�
transactions�declined�respectively�by�13.50%�and�18.38%�respectively,�however�
traded� volumes� rose� by� 2.98%� to� 104.63� billion.� Financial� services� stocks�
remained�investors’�favourite�as�about�half�of�Naira�votes�were�spent�on�financial�
services�equities.��
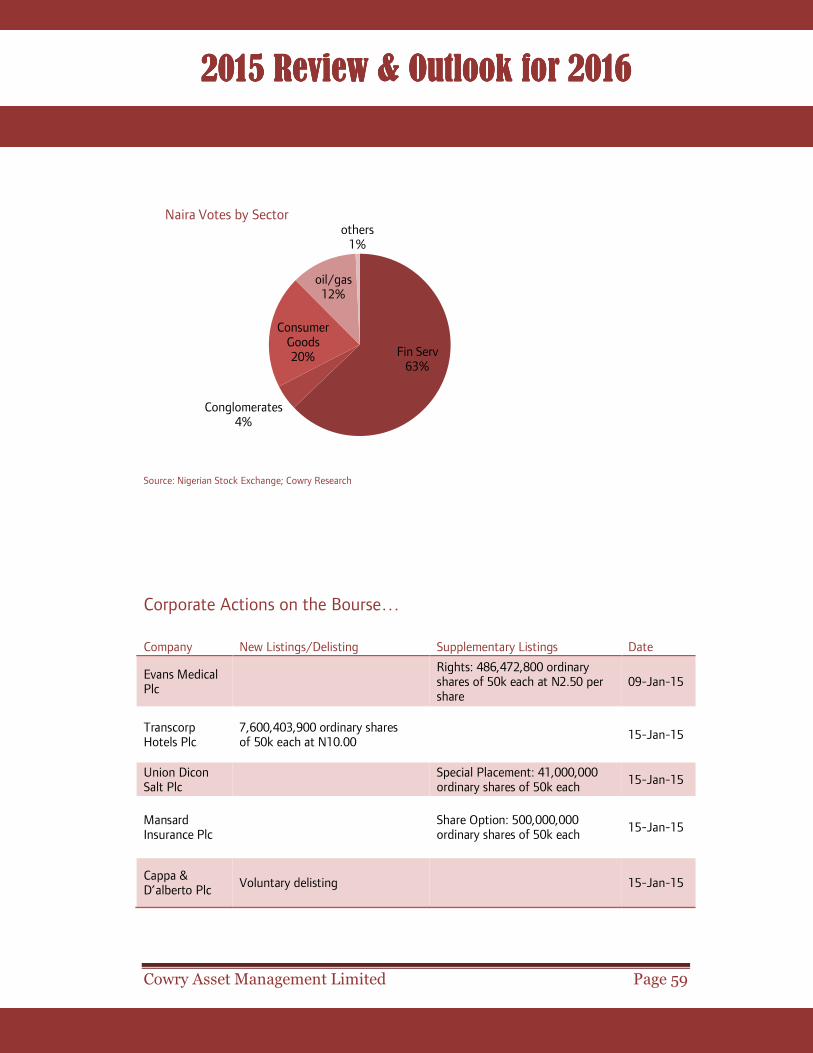
2015 Review & Outlook for 20162015 Review & Outlook for 20162015 Review & Outlook for 20162015 Review & Outlook for 2016 ��
Cowry Asset Management Limited Page 59
�Source:�Nigerian�Stock�Exchange;�Cowry�Research��
�
�
Corporate�Actions�on�the�Bourse…�
Company� New�Listings/Delisting� Supplementary�Listings� Date�
Evans�Medical�Plc�
Rights:�486,472,800�ordinary�shares�of�50k�each�at�N2.50�per�share�
09-Jan-15�
Transcorp�Hotels�Plc�
7,600,403,900�ordinary�shares�of�50k�each�at�N10.00�
15-Jan-15�
Union�Dicon�Salt�Plc�
Special�Placement:�41,000,000�ordinary�shares�of�50k�each�
15-Jan-15�
Mansard�Insurance�Plc�
Share�Option:�500,000,000�ordinary�shares�of�50k�each��
15-Jan-15�
Cappa�&�D’alberto�Plc�
Voluntary�delisting�
15-Jan-15�
Fin�Serv63%
Conglomerates4%
Consumer�Goods20%
oil/gas12%
others1%
Naira�Votes�by�Sector

2015 Review & Outlook for 20162015 Review & Outlook for 20162015 Review & Outlook for 20162015 Review & Outlook for 2016 ��
Cowry Asset Management Limited Page 60
Sterling�Bank�Plc�
Special�Placement:�7,197,604,531�ordinary�shares�of�50k�each�
06-Feb-15�
Lafarge�Africa�Plc�
Consolidation�of�Lafarge�Africa’s�Assets:�1,402,575,984�shares�
27-Mar-15�
Forte�Oil�Plc� Bonus�Shares:�217,080,184�ordinary�shares�of�50k�each�added��
02-Apr-15�
Nigerian�Breweries�Plc�
Allotment�of�shares�to�minority�members�of�Consolidated�Breweries�in�the�Nigerian�Breweries�merger:�366,396,456�shares�
02-Apr-15�
AIICO�Insurance�Plc�
Share�Restructuring:�Cancellation�of�1,870,000,000�ordinary�shares�Nigerian�Breweries�merger:�366,396,456�shares�
02-Apr-15�
Glaxo-Smithkline�Plc�
Bonus�Shares:�239,175,298�Ordinary�Shares�of�50�Kobo�each�added�
22-May-15�
NAHCO�Aviance�Plc�
Bonus�Issue:�147,656,250�Ordinary�Shares�of�50�Kobo�each�
22-May-15�
VitaFoam�Plc� Bonus�Shares:�163,800,000�Ordinary�Shares�of�50�Kobo�each�added�
22-May-15�
Skye�Bank�Plc� Bonus�Issue:�660,966,734��Ordinary�Shares�of�50�Kobo�each�
22-May-15�
PharmaDeko�Plc�
Rights�Issue:�116,819,694���Ordinary�Shares�of�50�Kobo�each�at�N1.85�per�share�
22-May-15�
Champion�Breweries�Plc�
Special�Placement:�629,496,464�Ordinary�Shares�of�50�Kobo�each�
22-May-15�
PharmaDeko�Plc�
Special�Placement:�482,754�Ordinary�Shares�of�50�Kobo�each�
03-Jun-15�
International�Breweries�Plc�
Bonus�Shares:�31,722,850�Ordinary�Shares�of�50�Kobo�each�
19-Jun-15�
McNichols�Consolidated�Plc�
Conversion�of�Preference�Shares�to�Ordinary�Shares:�16,114,665�Ordinary�Shares�of�50�Kobo�each�
27-Jun-15�
ETI���1.250m�OS�of�USD0.025�each�at�N15.47�per�share��
� 16-Jul-15�
UBA�Plc� �Rights�Issue:�3,298,138,756�OS�of�50K�at�N3.50��
24-Jul-15�
Academy�Press�Plc�
Scrip�Issue:�1�for�5,�100,800,000�units�added.�
3-Aug-15�
Access�Bank�Plc�
Rights�Issue:�6,045,052,723�ordinary�shares�of�50K�(1�for�3)��
28-Aug-15�

2015 Review & Outlook for 20162015 Review & Outlook for 20162015 Review & Outlook for 20162015 Review & Outlook for 2016 ��
Cowry Asset Management Limited Page 61
Seplat�Petroleum�
Ordinary�shares�of�10,134,248�units�which�arose�from�a�Long-Term�Incentive�Scheme.�
� 5-Nov-15�
Standard�Alliance�Insurance�Plc�
�Convertible�Preference�Shares:�3,500,000,000�shares�of�50K�each�
27-Nov-15�
Source:�Nigerian�Stock�Exchange;�Cowry�Research�
�
Mergers�and�Acquisitions�in�2015.�
The�following�transactions�were�executed�in�the�year�2015.��
� Mansard� Insurance� acquired� 60%� of� Penman� Pensions� Limited.� The�
acquisition� extended� its� subsidiaries� to� four� (4),� having� already� made�
significant� inroads� into� Asset� Management,� Health� Insurance� and�
Property� segments� through� its� wholly� owned� subsidiaries� (Mansard�
Investments�Limited�and�Mansard�Health�Limited)�as�well�as�its�majority�
holding�in�the�property�joint�ventures,�APD�Ltd.�
� Oando� Plc� entered� into� a� definitive� agreement� with� HV� Investments� II�
B.V.,� a� joint� venture� owned� by� a� fund� advised� by� Helios� Investment�
Partners�and�The�Vitol�Group,� to�acquire�51%�of� the�voting� rights�and�
60%� of� the� economic� rights� in� Oando’s� downstream� businesses,� for�
USD461.3� million,� which� will� be� funded� by� a� cash� consideration� of�
USD276� million� from� HVI� and� USD184.5� million� in� preference� shares�
issued�to�Oando�Plc.�The�Oando�downstream�businesses�primarily�consist�
of:� Oando� Marketing� Plc,� Oando� Supply� &� Trading� Limited,� Oando�

2015 Review & Outlook for 20162015 Review & Outlook for 20162015 Review & Outlook for 20162015 Review & Outlook for 2016 ��
Cowry Asset Management Limited Page 62
Trading� Limited� (Bermuda),� Apapa� SPM� Limited� and� Ebony� Oil� &� Gas�
Limited.�
� Similarly� the� Nigerian� Cement� Holdings� B.V.� (NCH),� a� 50%� affiliate� of�
Large� Africa� Plc� completed� the� acquisition� of� the� second� and� final�
tranche� of� 15%� of� equity� interest� of� Flour� Mills� of� Nigeria� Cement�
Industries�in�UNICEM,�bringing�their�ownership�to�100%�of�UNICEM�and�
consequently� Lafarge� Africa� Plc� now� owns� 50%� of� the� equity� of�
UNICEM.��
�
�
Market�Developments�in�2015�
NSE�Introduces�Pension�Index��
The�Nigerian� Stock� Exchange� introduced� the�Pension� Index.� The� Index� values,�
which� provided� data� from� 2013� with� December� 31,� 2012� as� base� year� was�
exposed�to�the�investing�public�on�Thursday,�July�2,�2015.��The�creation�of�the�
NSE�Pension�Index�is�expected�to�encourage�the�development�of�other�products�
such�as�Exchange�Traded�Products�(ETP’s)�and�Index�Futures.��Also,�the�Index,�
provide� a� tracking� mechanism� for� PFAs,� CPFA� and� others� that� follow� the�
PENCOM�guidelines.��It�can�act�as�a�benchmark�for�measuring�performance�and�
reporting�performance�to�RSA�Holders.��
�
�
�
�

2015 Review & Outlook for 20162015 Review & Outlook for 20162015 Review & Outlook for 20162015 Review & Outlook for 2016 ��
Cowry Asset Management Limited Page 63
�
Top�20�Gainers�in�FY�2015�
Listed�Companies� TICKER�Price�as�@�31�DEC�2015�
Price�as�@�31�Dec�2014�
%�Change�
Unity�Bank�Plc� UNITYBNK� 0.50�� 1.12�� 124.00��
Beta�Glass�Company�Plc� BETAGLAS� 27.78�� 53.45�� 92.40��
Goldlink�Insurance�Plc� GOLDINSURE� 0.53�� 0.93�� 75.47��
Forte�Oil�Plc� FO� 227.90�� 330.00�� 44.80��
University�Press�Plc� UPL� 4.22�� 6.00�� 42.18��
Law�Union�and�Rock�Insurance�PLC� LAWUNION� 0.50�� 0.71�� 42.00��
Nigerian�Police�Force�Microfinance�Bank�Plc�
NPFMCRFBK� 0.80�� 1.10�� 37.50��
Presco�Nigeria�Plc� PRESCO� 24.50�� 33.00�� 34.69��
Vitafoam�Plc� VITAFOAM� 4.03�� 5.41�� 34.24��
Airline�Services�and�Logistic�Plc� AIRSERVICE� 1.70�� 2.21�� 30.00��
Cutix�Plc� CUTIX� 1.30�� 1.66�� 27.69��
Unilever�Nigeria�Plc� UNILEVER� 35.80�� 43.25�� 20.81��
Lafarge�Africa�Plc� WAPCO� 80.50�� 96.80�� 20.25��
The�Okomu�Oil-Palm�Company� OKOMUOIL� 25.35�� 30.30�� 19.53��
NASCON�Allied�Industries�Plc� NASCON� 6.22�� 7.15�� 14.95��
Ashaka�Cement�Plc� ASHAKACEM� 21.90�� 25.00�� 14.16��
Neimeth�Pharmaceuticals�Plc� NEIMETH� 0.78�� 0.89�� 14.10��
Custodian�and�Allied�Insurance� CUSTODYINS� 3.62�� 4.10�� 13.26��
AIICO�Insurance�Plc� AIICO� 0.81�� 0.91�� 12.35��
Berger�Paints�Plc� BERGER� 9.00�� 10.00�� 11.11��
Source:�Nigerian�Stock�Exchange;�Cowry�Research��
�
�
�

2015 Review & Outlook for 20162015 Review & Outlook for 20162015 Review & Outlook for 20162015 Review & Outlook for 2016 ��
Cowry Asset Management Limited Page 64
�
Bottom�20�losers�in�FY�2015� �
Listed�Companies� TICKER�Price�as�@�
31�DEC�2015�Price�as�@�
31�Dec�2014�%�Change�
Evans�Medical�Plc� EVANSMED� 2.28�� 0.50�� (78.07)�
Tiger�Branded�Consumer�Goods�Plc� TIGERBRANDS� 4.55�� 1.13�� (75.16)�
Oando�Plc� OANDO� 16.11�� 5.90�� (63.38)�
Diamond�Bank�Plc� DIAMONDBNK� 5.58�� 2.30�� (58.78)�
Cadbury�Nigeria�Plc� CADBURY� 40.00�� 17.15�� (57.13)�
Academy�Press�Plc� ACADEMY� 1.18�� 0.55�� (53.39)�
Transnational�Corporation�of�Nigeria�Plc� TRANSCORP� 3.25�� 1.52�� (53.23)�
AG�Leventis�Nigeria�Plc� AGLEVENT� 1.31�� 0.62�� (52.67)�
Northern�Nigeria�Flour�Mills�Plc� NNFM� 18.05�� 8.55�� (52.63)�
Champion�Breweries�Plc� CHAMPION� 6.98�� 3.37�� (51.72)�
�Learn�Africa�Plc� LEARNAFRCA� 1.35�� 0.71�� (47.41)�
Flour�Mills�of�Nigeria�Plc� FLOURMILL� 39.20�� 20.80�� (46.94)�
The�Seplat�Development�Company�Plc� SEPLAT� 371.01�� 203.00�� (45.28)�
FBN�Holdings�Plc� FBNH� 8.80�� 5.13�� (41.70)�
Livestock�Feeds�Plc� LIVESTOCK� 2.28�� 1.33�� (41.67)�
Honeywell�Flour�Mills�Plc� HONYFLOUR� 3.46�� 2.05�� (40.75)�
Skye�Bank�Plc� SKYEBANK� 2.66�� 1.58�� (40.60)�
May�and�Baker�Nig.�Plc� MAYBAKER� 1.58�� 0.96�� (39.24)�
UAC�of�Nigeria�Plc� UACN� 34.00�� 20.75�� (38.97)�
Stanbic�IBTC�Holdings�Plc� STANBIC� 27.00�� 16.53�� (38.78)�
Source:�Nigerian�Stock�Exchange;�Cowry�Research�����
���
�
�

2015 Review & Outlook for 20162015 Review & Outlook for 20162015 Review & Outlook for 20162015 Review & Outlook for 2016 ��
Cowry Asset Management Limited Page 65
2015�Dividends�and�Bonuses�
Company� Dividend� Bonus�Closure�of�Register�
AGM�Date�Payment�Date�
Nigerian�Breweries�Plc�
N3.50� Nil��5th�-�11th�March�2015�
13th�May�2015� 14th�May�2015�
Forte�Oil�Plc� N2.50� 1�for�5�1st�–�7th�April�2015��
15th�April�2015�
22nd�April�2015�
Nestle�Nigeria�
N17.50� Nil��27th�April�2015�
11th�May�2015� 12th�May�2015�
Greif�Nigeria�Plc�
60�kobo� Nil�25th�-�27th�March�2015�
28th�April�2015�
5th�May�2015�
Guaranty�Bank�Plc�
N1.50�(final)�� Nil��17th�March�2015�
31st�March�2015�
31st�March�2015�
Zenith�Bank�Plc�
N1.75� Nil�16th�-�20th�March�2015�
26th�March�2015�
27th�March�2015�
Neimeth�� Nil�� Nil��18th�–�20th�March�2015�
24th�March�2015�
N/A�
Africa�Prudential�Registrars�
35�kobo� Nil��18th�–�20th�March�2015�
8th�April�2015�10th�April�2015�
United�Capital�Plc�
20�kobo� Nil��23rd�–�27th�March�2015�
16th�April�2015�
20th�April�2015�
Lafarge�Africa�Plc�
N3.60� Nil��27th�April�–�1st�May�2015�
22nd�May�2015�
25th�May�2015�
Access�Bank�35�kobo�(final)�
Nil��24th�April�2015�
7th�May�2015� 7th�May�2015�
Transcorp�Hotels�
37�kobo� Nil��30th�March�2015�
15th�April�2015�
17th�April�2015�
PZ�Cussons�Nigeria�(interim)�
20�kobo� Nil��30th�March�2015�
N/A� 7th�April�2015�
FCMB�Group�Plc�
25�kobo� Nil��30th�March�2015�
23rd�April�2015�
24th�April�2015�
Julius�Berger�Nigeria�Plc�
N2.70� Nil�� 1st�June�2015�17th�June�2015�
18th�June�2015�
Mobil�Oil�Plc� N6.60� Nil��29th�April�2015�
28th�May�2015� 4th�June�2015�
Livestock�Feeds�Plc�
10�kobo� Nil�� 28th�May�2015�17th�June�2015�
18th�June�2015�
Sterling�Bank�Plc�
6�kobo� Nil��13th�April�2015�
30th�April�2015�
30th�April�2015�
United�Bank�for�Africa�Plc�
10�kobo� Nil��7th�–�9th�April��2015�
24th�April�2015�
27th�April�2015�
Unilever�� 10�kobo� Nil��13th�April�2015�
12th�May�2015� 15th�May�2015�

2015 Review & Outlook for 20162015 Review & Outlook for 20162015 Review & Outlook for 20162015 Review & Outlook for 2016 ��
Cowry Asset Management Limited Page 66
NAHCO� 20�kobo� 1�for�10�18th�–�22nd�May�2015�
11th�June�2015�
11th�June�2015�
Fidson�� 15�kobo�� Nil�� �� �� ��Dangote�Cement�
N6.00� Nil��20th�April�2015�
29th�April�2015�
30th�April�2015�
Total�Oil�Nigeria��
N9.00� Nil��20th�April�2015�
10th�June�2015�
12th�June�2015�
Trans-Nationwide�Express�
10�kobo� Nil�� 13th�July�2015� 23rd�July�2015�7th�August�2015�
McNichols�� 4�kobo� 1�for�10� 17th�July�2015� 23rd�July�2015� 27th�July�2015�
Cadbury�� 65�kobo� Nil��11th�–�15th�May�2015�
10th�June�2015�
11th�June�2015�
Infinity�Trust�Mortgage�Bank�
3�kobo� Nil��17th�April�2015�
14th�May�2015� 15th�May�2015�
Glaxo�SmithKline�
75�kobo� 1�for�4� 14th�May�2015�11th�June�2015�
12th�June�2015�
Caverton�� 10�kobo� Nil��23rd�April�2015�
6th�May�2015� 6th�May�2015�
Berger�Paints� 75�kobo� Nil�15th�–�17th�June�2015�
21st�July�2015� 23rd�July�2015�
Fidelity�Bank� 18�kobo� Nil��20th�–�24th�April�2015�
7th�May�2015� 7th�May�2015�
Custodian�and�Allied�
12�kobo� Nil��13th�–�17th�April�2015�
13th�May�2015� 14th�May�2015�
Diamond�Bank�
10�kobo� Nil��16th�–�17th�April�2015�
30th�April�2015�
4th�May�2015�
CAP� 85�kobo� Nil��1st�–�5th�June�2015�
18th�June�2015�
19th�June�2015�
MRS�Oil� 88�kobo� Nil��13th�–�17th�July�2015�
5th�August�2015�
6th�August�2015�
CCNN� 35�kobo� Nil��20th�–�24th�July�2015�
13th�August�2015�
18th�August�2015�
Okomu�� 25�kobo� Nil��18th�–�22nd�May�2015�
24th�June�2015�
29th�June�2015�
Learn�Africa� 12�kobo� Nil��11th�–�15th�May�2015�
4th�June�2015� 5th�June�2015�
Ashaka�Cement�
45�kobo� Nil��21st�April�2015�
5th�May�2015� 6th�May�2015�
Beta�Glass� 62�kobo� Nil��15th�June�2015�
9th�July�2015� 10th�July�2015�
BOC�Gases� 10�kobo� Nil�� 15th�May�2015�11th�June�2015�
15th�June�2015�
Stanbic�IBTC�Holdings�
15�kobo� Nil��14th�April�2015�
3rd�June�2015� 5th�June�2015�

2015 Review & Outlook for 20162015 Review & Outlook for 20162015 Review & Outlook for 20162015 Review & Outlook for 2016 ��
Cowry Asset Management Limited Page 67
Chams�� 2�kobo� Nil��20th�April�2015�
29th�April�2015�
11th�May�2015�
UACN� 175�kobo� Nil��6th�–�10th�July�2015�
23rd�September�2015�
24th�September�2015�
FBN�Holdings�
10�kobo�� 1�for�10� 4th�May�2015� 21st�May�2015� 25th�May�2015�
Transcorp�� 6�kobo� Nil��22nd�April�2015�
8th�May�2015� 11th�May�2015�
UACN�Prop.�Development��
50�kobo� Nil��10th�–�14th�August�2015�
1st�September�2015�
2nd�September�2015�
Seplat�Petroleum�
$0.09�dollar/naira�exchange�rate�as�at�21�May�2015�
Nil��22nd�May�2015�
2nd�June�2015�10th�June�2015�
May�&�Baker� 5�kobo� Nil��20th�–�24th�April�2015�
28th�May�2015� 8th�June�2015�
Aluminium�Extrusion�
8.5�kobo� Nil��26th�June�–�10th�July�
10th�July�2015� 13th�July�2015�
Dangote�Sugar�
40�kobo� Nil��28th�–�30th�April�2015�
22nd�May�2015�
22nd�May�2015�(25th�May�2015�for�those�without�e-mandate)�
ETI� Nil�� 1�for�15� 22nd�July�2015�19th�June�2015�
N/A�
Cornerstone�Insurance�
2�kobo� Nil��6th�–�10th�July�2015�
21st�July�2015� 25th�July�2015�
Vitafoam�� 30�kobo� 1�for�5�20th�–�22nd�May�2015�
4th�June�2015� 9th�June�2015�
Continental�Reinsurance��
11�kobo� Nil��20th�–�24th�July�2015�
30th�July�2015� 31st�July�2015�
NPF�Microfinance�Bank�
15�kobo� Nil��1st�–�5th�June�2015�
23rd�July�2015� 24th�July�2015�
Smart�Products��
25�kobo� Nil��3rd�–�10th�July�2015�
30th�July�2015�11th�August�2015�
eTranzact�International�
5�kobo� Nil��22nd�–�26th�June�2015�
23rd�July�2015�6th�August�2015�
National�Salt� 50�kobo� Nil��25th�–�26th�May�2015�
10th�June�2015�
12th�June�2015�
Skye�Bank� Nil�� 1�for�20� 21st�May�2015� 8th�June�2015� N/A�International�Breweries�
25�kobo� Nil��20th�–�25th�July�2015�
10th�August�2015�
11th�August�2015�

2015 Review & Outlook for 20162015 Review & Outlook for 20162015 Review & Outlook for 20162015 Review & Outlook for 2016 ��
Cowry Asset Management Limited Page 68
Airline�Services�&�Logistics�
15�kobo� Nil��15th�–�19th�June�2015�
2nd�July�2015� 3rd�July�2015�
C�&�I�Leasing� 8�kobo� Nil��15th�–�19th�June�2015�
25th�June�2015�
7th�July�2015�
Presco�� 100�kobo� Nil��6th�–�8th�July�2015�
22nd�July�2015� 27th�July�2015�
Niger�Insurance�
3.5�kobo� Nil�13th�–�17th�July�2015�
22nd�July�2015� 29th�July�2015�
NEM�Insurance�
6�kobo� Nil��6th�–�10th�July�2015�
29th�July�2015� 31st�July�2015�
Academy�Press�
Nil�� 1�for�5�3rd�–�7th�August�2015�
17th�September�2015�
N/A�
Seven�Up�Bottling�Co.�
275�kobo� Nil��13th�–�17th�July�2015�
22nd�September�2015�
29th�September�2015�
Stanbic�IBTC�(Interim)�
90�kobo� Nil�� 31st�July�2015�6th�August�2015�(EGM)��
28th�August�2015�
Royal�Exchange�
2�kobo� Nil��13th�–�17th�July�2015�
30th�July�2015�3rd�August�2015�
Courteville�(Interim)�
4�kobo� Nil��10th�August�2015�
N/A�31st�August�2015�
Honeywell�Flour�Mills�
5�kobo� Nil��14th�–�18th�September�2015�
29th�September�2015�
30th�September�2015�
Red�Star�Express�
35�kobo� Nil��5th�–�7th�August�2015�
3rd�September�2015�
14th�September�2015�
Africa�Prudential�(Interim)�
17�kobo� Nil��19th�–�24th�August�2015�
N/A�31st�August�2015�
Northern�Nigeria�Flour�Mills�
30�kobo� Nil��10th�-�14th�August�2015�
8th�September�2015�
14th�September�2015�
Consolidated�Hallmark�(Interim)�
2�kobo� Nil��10th�–�14th�August�2015�
N/A�27st�August�2015�
Flour�Mills�of�Nigeria��
210�kobo� Nil��10th�–�14th�August�2015�
9th�September�2015�
14th�September�2015�
Triple�Gee� 4�kobo� Nil��25th�–�30th�September�2015�
15th�October�2015�
19th�October�2015�
AXA�Mansard�(Interim)�
3�kobo� Nil��14th�October�2015�
N/A�26th�October�2015�

2015 Review & Outlook for 20162015 Review & Outlook for 20162015 Review & Outlook for 20162015 Review & Outlook for 2016 ��
Cowry Asset Management Limited Page 69
Custodian�&�Allied�(Interim)�
6�kobo� Nil��17th�–�21st�August�2015��
N/A�15th�September�2015�
SCOA�Nigeria� 7.5�kobo� Nil��25th�–�28th�August�2015�
17th�September�2015�
24th�September�2015�
Cutix�� 12�kobo� Nil��19th�–�23rd�October�2015�
30th�October�2015�
19th�November�2015�
Zenith�Bank�(Interim)�
25�kobo� Nil��24th�August�2015�
N/A�28th�August�2015�
Guaranty�Trust�Bank�(Interim)�
25�kobo� Nil��8th�September�2015�
N/A�21st�September�2015�
Access�Bank�(Interim)�
25�kobo� Nil��3rd�September�2015�
N/A�10th�September�2015�
University�Press�
20�kobo� Nil��1st�-�4th�September�2015�
30th�September�2015�
2nd�October�2015�
PZ�Cussons� 61�kobo� Nil��14th�–�18th�September�2015�
29th�September�2015�
30th�September�2015�
Nigerian�Enamelware�
45�Kobo� Nil��7th�–�11th�September�2015�
29th�September�2015�
2nd�October�2015�
United�Bank�for�Africa�(Interim)�
20�Kobo� Nil��10th�–�11th�September�2015�
N/A�16th�September�2015�
Guinness�Nigeria��
320�Kobo� Nil��12th�October�2015�
26th�November�2015�
27th�November�2015�
Conoil�� 100�Kobo� Nil��28th�Sept�–�2nd�Oct�2015�
23rd�October�2015�
2nd�November�2015�
Source:�Nigerian�Stock�Exchange;�Cowry�Research��
�
�
�
�

2015 Review & Outlook for 20162015 Review & Outlook for 20162015 Review & Outlook for 20162015 Review & Outlook for 2016 ��
Cowry Asset Management Limited Page 70
Political�ReviewPolitical�ReviewPolitical�ReviewPolitical�Review����
In� the� period� under� review,� major� political� highlights� include� the� successful�
transition�to�a�new�government,�the�fight�against�insurgency�and�corruption,�and�
political�appointments� into�public�offices�as�the�new�administration�settles� into�
power.� Indeed,� the� year� 2015� was� politically� charged� with� a� lot� of� political�
intrigues� and� manoeuvres.� Furthermore,� based� on� its� electoral� campaign�
promises,� the�President�Muhammadu�Buhari’s� administration� clearly� has,� as� its�
core�mandate,�improving�the�country’s�fortunes�in�terms�of�social�security,�anti-
corruption�crusade�and�revamping�a�weakened�economy.��
�
�
A�Successful�Interparty�Transition…�
The�shift�in�Nigeria’s�political�landscape�was�largely�peaceful,�albeit,�not�without�
tremors.� Nigeria’s� general� elections� of� March� 28� 2015,� was� viewed� as� largely�
peaceful� despite� limited� incidents� of� election� violence� in� some� parts� of� the�
country.� The� heavy� deployment� of� security� throughout� the� country� helped�
forestall� violence.� Following� the� peaceful� conduct� of� the� general� elections,�
Retired�General�Muhammadu�Buhari�of�the�All�Progressives�Congress�(APC),�was�
elected� as� Nigeria’s� President� having� pulled� 15.42� million� votes� to� defeat�
incumbent�President�Goodluck�Ebele�Jonathan�of�the�Peoples�Democratic�Party�
(PDP)� who� garnered� 12.85� million� votes.� In� addition,� President� Muhammadu�
Buhari�won�in�21�states�and�received�25%�of�the�total�votes�cast�in�26�states�and�
the�Federal�Capital�Territory�(FCT)�while�Jonathan�won�in�15�states�and�the�FCT�
and� received� 25%� of� the� votes� in� 25� states� and� the� FCT.� However,� in� a�
statesman-like� manner� uncommon� of� African� leaders,� President� Jonathan�
congratulated�the�General�even�ahead�of�the�announcement�of�the�Final�results.�

2015 Review & Outlook for 20162015 Review & Outlook for 20162015 Review & Outlook for 20162015 Review & Outlook for 2016 ��
Cowry Asset Management Limited Page 71
�
APC�wins�more�territories�Gubernatorial�Elections�
The� April� 11� gubernatorial� elections� were� conducted� in� a� relatively� peaceful�
atmosphere,�howbeit,�with�some�flash�points�of�violence�in�the�Rivers�and�Akwa�
Ibom� States.� In� line� with� our� expectations,� the� APC� won� the� gubernatorial�
election� in�most�states� (nineteen�out�of� twenty�nine� states�where�election�was�
conducted)�having�recorded�victory�in�almost�all�the�South�West,�all�North�East�
and�North�West�states,�while�most�South�South�and�South�East�states�remained�
with� the� ruling� PDP.� Elections� in� two� states,� Imo� and� Abia,� were� inconclusive�
while�the�Taraba�State�elections�were�cancelled�–�all�bordering�on�alleged�high�
incidence�of�election�malpractices.�
�
National�Assembly�Leadership�Politics…�
Following� APC’s� dominance� of� the� political� space� in� both� the� Presidency� and�
Federal� House� of� Assembly,� the� political� equation� even� within� the� Party� was�
reset� in� the� outcome�of� the� elections� into� leadership� positions� in� the�National�
Assembly.� The� emergence� of� Senator� Bukola� Saraki� of� the� APC� as� Senate�
President� and� Honourable� Yakubu� Dogara� as� Speaker� of� the� House� of�
Representatives�was�mainly�due�to�the�support�of�Senators�from�the�opposition�
PDP.�Consequently,�PDP�seemed�to�have�gotten�its�grove�back�drawing�from�the�
critical� role� it�played� in� the�emergence�of� leadership�of�the�National�Assembly.�
Their�support�for�the�victors,�themselves�former�members�of�PDP,�paved�the�way�
for�Senator� Ike�Ekweremadu’s�re-emergence�as�Deputy�Senate�President.�It�will�
be�recalled�that�the�APC�was�formed�from�the�coalition�between�several�political�
parties� which� include:� Action� Congress� of� Nigeria,� Congress� for� Progressive�
Change,�All�Nigeria� Peoples� Party,� a� faction� of�All� Progressives�Grand�Alliance�

2015 Review & Outlook for 20162015 Review & Outlook for 20162015 Review & Outlook for 20162015 Review & Outlook for 2016 ��
Cowry Asset Management Limited Page 72
and�much�later,�the�New�Peoples�Democratic�Party�(made�up�of�defecting�PDP�
governors).�
�
Rift�between�APC�Senate�Caucuses�and�Leadership�Widened…�
APC’s� internal� crises� widened� and� dissatisfaction� within� the� party� played� out�
following� the� nominations� of� principal� officers� at� the� Senate� by� the� Party’s�
Senate� caucuses� against� the�wishes� of� the� APC� leadership.�On� the� day� of� the�
leadership� nominations,� Senate� President,� Bukola� Saraki,� read� the� nomination�
letters�of�the�various�caucuses�which�endorsed�Senator�Ali�Ndume�(North-East)�
as� the�Majority�Leader,�Senator�Bala� Ibn�Na’Allah� (North-West)�as� the�Deputy�
Majority�Leader�and�Senator�Francis�Alimikhena�(South-South)�as�Deputy�Chief�
Whip.�However,� the� position� of� Chief�Whip� allotted� to� the� South-West� caucus�
remained� vacant� as� the� Senate� President� refused� to� entertain� the� nomination�
letter� from� APC’s� national� leader,� Chief� John� Odigie-Oyegun,� to� which� the�
South-West�caucus�deferred.�It�was�quite�obvious�that�efforts�at�mending�fences�
in�the�APC,�caused�by�the�rebalancing�of�the�political�equation�within�the�Party,�
was�a�tall�order�as�the�crises�remained�largely�a�dispute�between�vested�interests.�
In� July,� The� Senate� also� announced� Senator� Emmanuel� Bwacha,� representing�
Taraba�Central� as� the�Deputy�Minority� Leader� just� as� it� named� senators� Philip�
Aduda,� representing� the� Federal� Capital� Territory,� FCT,� and� Biodun� Olujimi,�
representing� Ekiti� South,� as� Minority� Whip� and� Deputy� Minority� Whip�
respectively.�
�
�
�

2015 Review & Outlook for 20162015 Review & Outlook for 20162015 Review & Outlook for 20162015 Review & Outlook for 2016 ��
Cowry Asset Management Limited Page 73
Relative�Calm�Returns�to�Lower�Chamber…�
In�July,�the�long�drawn�squabble�within�the�lower�arm�of�the�National�Assembly�
occurring� side� by� side� with� that� of� the� Senate� ameliorated� as� Hon� Femi�
Gbajabiamila� emerged� as� the�minority� leader� despite� initial� strong� oppositions.�
The� peace� pact�was� brokered� by� President�Muhammadu�Buhari�who�met�with�
the�Representatives�on�July�27.�Speaker�Dogara�also�announced� the� names�of�
other� principal� officers� as� follows:��Buba� Jibrin� (North-Central)� as� the� deputy�
house� leader,�Alhassan�Ado�Doguwa�(North-West)�as�the�chief�whip,�and�Pally�
Iriase� (South-South)� deputy� chief� whip.� For� the� minority� party,� Leo� Ogor�
(South-South)�emerged�as�the�minority�leader;�Chukwuma�Onyema�(South-East)�
as�the�deputy�minority�leader;�Yakubu�Umar�Barde�(North-West)�as�the�minority�
whip;� and�Binta�Bello� (North-East)� as� the� deputy�minority�whip.� Similarly,� the�
Senate,� named� immediate� past� governor� of� Akwa� Ibom� State� and� Senator�
representing�Akwa�Ibom�North�West,�Godswill�Akpabio�as�the�Minority�Leader.�
�
Senate�President,�Dr.�Bukola�Saraki�Battles�for�Political�Life…�
The�turf�battle�within�the�All�Progressives�Congress�(APC)�resumed�in�September�
as� forces� opposed� to� the� emergence� of�Dr.� Bukola� Saraki� as� Senate�President�
ensured�that�he�was�docked�by�the�Code�of�Conduct�Tribunal�(CCT)�on�charges�
of�false�asset�declaration.�The�embattled�Senator�was�ordered�to�appear�before�
the� CCT� on� a� 13-count� criminal� charge� that� bordered� on� corruption,� false�
declaration� of� assets,� and� illegal� operation� of� a� foreign� bank� account�while� in�
office�as�former�governor�of�Kwara�State.�Dr.�Saraki’s�current�travails�is�coming�
on�the�heels�of�the�arrest�and�investigation�of�his�wife,�Oluwatoyin�Saraki,�by�the�
Economic� and� Financial� Crimes� Commission� (EFCC)� on� fraud� related� charges�

2015 Review & Outlook for 20162015 Review & Outlook for 20162015 Review & Outlook for 20162015 Review & Outlook for 2016 ��
Cowry Asset Management Limited Page 74
shortly�after�he�emerged�as�Senate�President.�However,�Dr.�Saraki�pleaded�“not�
guilty”�to�the�charges�and�was�released�on�bail�with�commencement�of�his�trial�
scheduled� for�October�21,�2015.�Eventually,� the�embattled�Senator�breathed�a�
sigh� of� relief� as� the� Supreme� Court� ordered� the� suspension� of� his� trial� at� the�
Code�of�Conduct�Tribunal�where�he�faces�a�13-count�corruption�charge,�pending�
the�conclusion�of�an�appeal�the�Senator�brought�before�the�highest�court.�
�
National�Assembly�Gets�Standing�Committees�
In� November,� Senate� President,� Bukola� Saraki� named� sixty-five� standing�
committees� of� the� Senate� –� eight� more� than� his� predecessor,� Senator� David�
Mark.�The�All�Progressives�Congress�(APC)�Senators�got�the�majority�forty-one�
chairmanship� positions� while� the� opposition� Peoples� Democratic� Party� (PDP)�
Senators� got� twenty-four� chairmanship� slots� in� a� Senate� that� comprises� sixty�
APC� Senators� and� forty-nine�PDP�Senators.� Thus,� in� the� current� arrangement,�
the�ruling�party�got�more�than�proportionate�number�of�chairmanship�positions�
than�the�opposition�party.�Howbeit,�against�the�backdrop�of� internal�squabbles�
in� the� ruling� party� as� well� as� unbroken� ties� across� party� lines,� it� appeared� as�
though�opposition�was� handed� a� good�number� of� key� positions.� Same� can� be�
said�of�the�House�of�Representatives�which�also�named�its�committee�chairmen�
very�recently.�
�
President�Buhari�Swears�in�New�Ministers�to�Drive�His�Agenda…�
In� November,� President� Muhammadu� Buhari,� after� almost� 6�months� of� delay,�
finally�swore�in�his�new�cabinet�of�ministers�into�office�and�reduced�the�number�

2015 Review & Outlook for 20162015 Review & Outlook for 20162015 Review & Outlook for 20162015 Review & Outlook for 2016 ��
Cowry Asset Management Limited Page 75
of� federal� ministries� to� twenty� five� from� thirty� six.� The� President� had� earlier�
appointed� eighteen� new�permanent� secretaries,� some�of�whom� came� from� the�
private� sector,� while� retiring� seventeen� others.� Members� of� his� substantive�
cabinet�of�ministers�and�their�respective�portfolios�include:�Senator�Udoma�Udo�
Udoma�(Budget�and�National�Planning),�Babatunde�Fashola�(Power,�Works�and�
Housing),� Dr.� Okechukwu� Enelamah� (Trade,� Industry� and� Investment),� Kemi�
Adeosun� (Finance);� Ibe� Kachikwu� (Petroleum� Resources),� Kayode� Fayemi�
(Mining);�and�Audu�Ogbeh�(Agriculture�and�Rural�Development).�Others�include:�
Rotimi� Amaechi� (Transportation),� Chris� Ngige� (Labour� and� Employment),� Lai�
Mohammed�(Information),�Muhammadu�Bello�(Federal�Capital�Territory),�Adamu�
Adamu� (Education),� Abubakar� Malami� (Justice),� Amina� Mohammed�
(Environment),� Adbulrahman� Dambazau� (Interior),� Suleiman� Adamu� (Water�
Resources),� Solomon� Dalong� (Youth� and� Sports),� Usani� Uguru� (Niger� Delta),�
Osagie� Ehanire� (Health),� Aisha� Alhassan� (Women� Affairs),� Adebay� Shittu�
(Communication),�Geoffrey�Onyema� (Foreign�Affairs),�Ogbonaya�Onu� (Science�
and�Technology)�and�Dan�Ali�(Defence).�
�
Nigeria’s�War�on�Terror�Assumes�International�Dimension�
Nigeria’s� war� against� terror� assumed� international� dimension� as� Boko�Haram’s�
leader,� Abubakar� Shekau,� allied� with� international� terror� group,� Islamic� State�
group� in�Syria� and� Iraq� (ISIS)�with� the�hope� to� attract� support� from� ISIS� in� its�
own� struggle� to� create� an� Islamic� caliphate� in� Nigeria.� This� was� part� of� its�
response� to� the� recapture� of�major� towns� in� the� North� East,� especially� Bama,�
Buni�Yadi,�etc�by�members�of�Nigerian�armed�forces�and� its�allies�–�Cameroon,�
Chad�and�Niger.�
�

2015 Review & Outlook for 20162015 Review & Outlook for 20162015 Review & Outlook for 20162015 Review & Outlook for 2016 ��
Cowry Asset Management Limited Page 76
Boko�Haram�Proves�It�Is�Not�Yet�Defeated�
The� Islamic� insurgents’� resilience�was�proven�as� they�executed�guerrilla�attacks�
on�communities�in�Northern�Nigeria,�particularly�in�the�North-East.�Boko�Haram�
also� launched� cross� border� attacks,� killing� scores� of� people� in� neighbouring�
countries,�Chad�and�Niger�Republics�in�retaliation�to�their�alliance�with�Nigeria.�
In� response,� Chad’s� military� authorities� claimed� that� they� conducted� reprisal�
attacks� against� the� militant� group� in� Nigerian� territory,� a� claim� which� their�
Nigerian�counterparts�dismissed.�Despite�being�a�predominantly�Muslim�country,�
Chad�banned�the�wearing�of�the�full�Muslim�veil�even�in�the�ongoing�Ramadan�
season�–�warning�that�"no�drop�of�Chadian�blood�spilled�will�go�unpunished".�
The� resurgence�of�Boko�Haram� further�necessitated� the� relocation�of�Nigeria’s�
Military�Command�and�Control�Centre�(MCCC)�from�Abuja�to�Maiduguri,�Borno�
State� with� the� expectation� that� the� war� on� terror� would� be� more� effectively�
executed.�Also,� the�Multi-National� Joint�Task�Force� (MNJTF)�was�expected� to�
be�deployed�at�the�Lake�Chad�Basin�in�July�so�as�to�add�more�teeth�to�the�fight�
against� terror.� However,� the� Lake� Chad� Basin� Commission� MNJTF� was� not�
functional�as�at�report�time.�
�
Emboldened�Boko�Haram�Spreads�Terror�to�North-Western�Nigeria�
In� an� apparent� expansion� of� the� theatre� of� war,� the� Islamic� militants,� Boko�
Haram,� attacked� Zaria,� Kano� and� Jos� in� the� North� West� and� North� Central�
regions�of�the�country�in�July.�This�was�despite�their�intensified�attacks�in�North�
East,� with� suicide� bombers� reported� to� have� detonated� bombs� in� Borno� and�
Adamawa� states.� Meanwhile,� there� were� reports� that� the� emboldened� terror�
group� offered� to� free� more� than� 200� young� women� and� girls� kidnapped� in�

2015 Review & Outlook for 20162015 Review & Outlook for 20162015 Review & Outlook for 20162015 Review & Outlook for 2016 ��
Cowry Asset Management Limited Page 77
Chibok,�in�April�2014,�in�exchange�for�the�release�of�militant�leaders�held�by�the�
Nigerian�authorities.�
� �
FG�Admits�Lack�of�Intelligence�on�the�Chibok�Girls�
In� a�media� chat� on�December� 30,� 2015,� President�Muhammadu� Buhari� expressed� his�
position� on� some� critical� issues.� These� included� alleged� flouting� of� court� orders�with�
regards� to� the� continued�detention�of� the� leader�of� the� Indigenous�People�of�Biafra,�
IPOB,� Nnamdi� Kanu,� the� integrity� of� all� 36� ministers,� war� against� corruption,�
implementation�of�the�N5,000�monthly�transfer�to�vulnerable�Nigerians,�the�kidnapped�
Chibok�girls,�devaluation�of�the�naira�and�the�fate�of�the�Islamic�cleric,�Sheikh�Ibraheem�
El-Zakzaky.�On� the� Chibok� girls,� he� affirmed� the� fact� that� his� administration� did� not�
have� any� concrete� information�of� their�whereabouts�but� are�willing� to�negotiate�with�
genuine�leaders�of�the�Boko�Haram�sect.�In�his�words,�“The�question�of�Chibok�girls� is�
on�our�minds�all�the�time.�But�we�do�not�have�any�information�on�where�they�are.�I�am�
honest�with� you,� I� don’t� know�whether�Chibok�girls� are� alive.”� “We�are� looking� for� a�
credible� Boko�Haram� leadership� that�will� convince� us� that� Chibok� girls� are� alive.� Our�
priority�is�on�orphaned�IDPs�to�get�them�back�to�schools,�resettle�them�and�giving�them�
hope.”��
�
President�Buhari�Replaces�Service�Chiefs�to�Prosecute�War�on�Terror�
In� line�with� public� expectations� and� part� of� his� response� to� the� resurgence� of�
terror�bombings�across�the�entire�North,�President�Muhammadu�Buhari,�in�July,�
sacked�the�services�chiefs�who�he�inherited�from�the�previous�administration.�In�
their�stead,�he�appointed�Major�General�T.Y.�Buratai�(Chief�of�Army�Staff),�Major�
General� Abayomi� Gabriel� Olonishakin� (Chief� of� Defence� Staff),� Rear� Admiral�

2015 Review & Outlook for 20162015 Review & Outlook for 20162015 Review & Outlook for 20162015 Review & Outlook for 2016 ��
Cowry Asset Management Limited Page 78
Ibok-Ete� Ekwe� Ibas� (Chief� of�Naval� Staff),� Air� Vice�Marshal� Sadique�Abubakar�
(Chief� of� Air� Staff),� and� Air� Vice� Marshal� Monday� Riku� Morgan� (Chief� of�
Defence� Intelligence).� In� addition,� President� Buhari� replaced� the� National�
Security�Adviser,�Colonel�Sambo�Dasuki� (retd.)�who�was�also�appointed�by� the�
former�regime�with�Major�General�Babagana�Monguno�(retired).�
�
President�Buhari�Criticizes�U.S.�Leahy�Law�as�Boko�Haram�Reclaims�
Territories…�
During� a� four-day� visit� to� the� United� States� in� July,� President� Muhammadu�
Buhari�partly�attributed�the�escalation�of�the�insurgency�crisis�in�Nigeria�to�lack�
of� cooperation� from� the� host� country,� stating� that� the� U.S.� Leahy� Law�
unwittingly� aided� and� abetted� terrorism� in� Nigeria,� particularly� during� the�
previous� administration.� Occurring� simultaneously,� the� dreaded�militant� group,�
Boko�Haram,�continued�to�pursue�their�destructive�cause�as�they�launched�bomb�
attacks�at�two�bus�stations�in�Gombe,�north-east�Nigeria,�resulting�in�the�deaths�
of�about�fifty�people.�The�terrorists�also�conducted�suicide�attacks,�through�two�
teenage� females�who�posed�as�beggars,� in�Maroua,�northern�Cameroon,�which�
left�eleven�people�dead.�
�
Federal�Government�Moves�to�Strengthen�Security�
The� Federal� Government� announced� plans� to� recruit� additional� 10,000� police�
officers,� by� engaging� the� unemployed� youth,� in� order� to� arrest� the� trend� of�
kidnappings� and� other� social� vices.� The� President� Buhari� also� stated�
government’s� intention� to� establish� a� functional� Federal� Anti-Terrorism�Multi-

2015 Review & Outlook for 20162015 Review & Outlook for 20162015 Review & Outlook for 20162015 Review & Outlook for 2016 ��
Cowry Asset Management Limited Page 79
Agency� Task� Force� that� will� more� effectively� address� future� insurgencies� in� a�
sustainable�manner.�More� so,� he� ordered� the� Inspector� General� of� Police,�Mr.�
Solomon�Arase,�to�prune�down�the�number�of�policemen�serving�as�orderlies�to�
dignitaries,� to� enable� the� said� personnel� perform� their� regular� statutory� police�
functions.�
�
Nigerian-Iranian�Relations�Threatened�on�Killing�of�Shiite�Faithful…�
In�December,�violence�erupted�between�members�of�the�Shiite�Islamic�adherents�
belonging� to� the� Islamic�Movement� of�Nigeria�and�Nigerian�army�personnel� in�
Zaria,�Kaduna�State,�resulting�in�the�deaths�of�several�Shiite�faithful.�The�Army�
alleged�that�the�Shiite�followers�attempted�to�assassinate�Nigeria’s�Chief�of�Army�
Staff,� Tukur� Buratai,� accusing� the� sect� of� barricading� the� roads� with� bonfires,�
heavy�stones�and�tyres�and�pelting�the�military�convoy�with�dangerous�objects.�
Rumor� that� the� leader�of� the�Movement,�Sheikh� Ibraheem�El-Zakzaky,�and�his�
wife�were�killed�was�refuted�by�the�Army�who�claimed�that�the�two�were�safe�but�
in� its� custody.� The� sect’s� spokesperson� on� their� part� described� the� claims� of�
attempted�assassination�of�the�COAS�as�a�blatant�lie,�insisting�its�procession�was�
peaceful.�
The�clashes�and�resulting�deaths�sparked�worldwide�outrage�and�are�threatening�
the� relations� between� Nigeria� and� Islamic� Republic� of� Iran� who� are� the�
custodians� of� the� Shiite� faith.� The� Nigerian� Senate� consequently� set� up� an�
inquiry�into�the�deaths�of�civilians�during�the�clash.�
�

2015 Review & Outlook for 20162015 Review & Outlook for 20162015 Review & Outlook for 20162015 Review & Outlook for 2016 ��
Cowry Asset Management Limited Page 80
Pro-Biafra/Military� Clashes� Increase� Social� and� Political� tension� in�
South�East�Zone�
The�lingering�political�unrest�in�the�South�East�of�Nigeria�worsened�as�hundreds�
of� pro-Biafran� secessionists� took� to� the� streets,� bringing� the� city� of� Onitsha,�
Anambra�State,�to�a�halt.�The�protests�bordered�on�the�continued�detention�of�
Mr.� Nnamdi� Kanu,� a�major� proponent� for� a� breakaway� Republic� of� Biafra� and�
director� of� banned� Radio� Biafra� who� was� arrested� in� October� and� still� in�
detention�despite�a�court�order�to�free�him.�The�Federal�High�Court�in�Abuja�had�
earlier� ordered� the� release� of� Radio� Biafra� director� and� Indigenous� People� of�
Biafra�(IPOB)�leader,�Nnamdi�Kanu,�after�being�kept�in�custody�for�eighty�days�
by� the� state� security� service� (DSS)� on� charges� of� criminal� conspiracy� and�
belonging� to� an� unlawful� organization.�However,� the� actions� of� the� protesters�
including�blockage� of� the�Onitsha�end�of�River�Niger�Bridge�on�December�01,�
2015� and� their� defiance� of� police� orders� led� to� clashes�with� the� Joint�Military�
Task�Force�(comprising�the�army,�navy,�police�and�civil�defense�personnel),�and�
resulted�in�deaths�of�nine�people�and�injuries�to�eighteen�others.�
�
Federal�Government�Files�Fresh�Charges�against�IPOB�leader�
The� federal� government� further� violated� its� avowed�policy� on� rule� of� law� as� it�
disregarded� the� Federal� High� Court� ruling� which� ordered� the� Department� of�
State� Service� (DSS)� to� release� the� Director� of� Radio� Biafra� and� leader� of� the�
Indigenous�People� of� Biafra� (IPOB),�Mr.�Nnamdi�Kanu,�who�had� long� been� in�
detention� on� charges� of� criminal� conspiracy� and� belonging� to� an� unlawful�
organization.�Instead,�the�Government�filed�a�fresh�six-count�charge�against�the�
detainee�and�two�others,�Messrs�Benjamin�Madubugwu�and�David�Nwawuisi,�as�

2015 Review & Outlook for 20162015 Review & Outlook for 20162015 Review & Outlook for 20162015 Review & Outlook for 2016 ��
Cowry Asset Management Limited Page 81
confirmed�by� Kanu's� counsel,�Mr.� Vincent�Obeta.� Part� of� the� charges� include:�
intention� to� levy� war� against� Nigeria� and� preparations� for� the� states� in� the�
South-east� geopolitical� zone,� South-south� geopolitical� zone,� the� Igala�
community� of� Kogi� State� and� the� Idoma/Igede� community� of� Benue� State� to�
secede�from�the�Federal�Republic�of�Nigeria�and�form�themselves�into�a�Republic�
of�Biafra.�
�
Presidency�Commences�Probe�into�Government�Agencies…�
In� August,� efforts� by� the� Presidency� to� recover� mismanaged� government�
resources� shifted� to� several� key� government� agencies.� The� National� Economic�
Council’s�Mr.�Adams�Oshiomhole-led�Ad-hoc�Committee�on�the�Management�of�
Excess� Crude� Account� Proceeds� and� Accruals� into� the� Federation� Account�
commenced� its�probe� into� the�management�of� the� federation�accounts� by� the�
preceding� administration.� The� probe� was� expected� to� look� into� financial�
activities� of� the� Nigerian� National� Petroleum� Corporation� (NNPC),� Nigeria�
Customs�Service,�Central�bank�of�Nigeria,� and� the�Nigeria� Extractive� Industries�
Transparency� Initiative� (NEITI)� among� others.� Also� in� the� month,� President�
Buhari� approved� the� appointment� of� former� Executive� Vice-Chairman� and�
General� Counsel� of� Exxon-Mobil� (Africa),� Dr.� Emmanuel� Ibe� Kachikwu,� as� the�
Group�Managing�Director�of�the�NNPC�to�replace�Dr.�Joseph�Dawha.�Following�
his�appointment,�the�new�GMD�retired�eight�Group�Executive�Directors�(GEDs),�
an�action�which� is�expected� to� apply� to� other� senior�management� staff�of� the�
highly�mismanaged�petroleum�corporation.�
�
�

2015 Review & Outlook for 20162015 Review & Outlook for 20162015 Review & Outlook for 20162015 Review & Outlook for 2016 ��
Cowry Asset Management Limited Page 82
Cloud�Thickens�from�Corruption�Probe…�
The�political� space�was�also�engulfed� in�anxiety�as� the�President�Muhammadu�
Buhari’s�corruption�probe�plan�gathered�momentum.�In�August,�while�addressing�
the� National� Peace� Committee� led� by� a� former� military� Head� of� State,� Gen.�
Abdulsalami� Abubakar,� President� Buhari� said� “Those� who� have� stolen� the�
national� wealth� will� be� in� court� in� a�matter� of� weeks� and�Nigerians� will� know�
those� who� have� short-changed� them”.�Meanwhile,� although� details� were� kept�
out� of� the� public� knowledge,� it� was� highly� speculated� that� the� visit� of� the�
immediate�past�President,�Dr.�Goodluck�Jonathan�to�President�Buhari�may�have�
been�triggered�by�apprehension�over�the�lurking�probe.�
�
USD2�Billion�Arms�Procurement�Scandal�Implicates�Top�Shots…�
In� December,� the� Federal� Government,� through� the� Economic� and� Financial�
Crimes� Commission� (EFCC),� commenced� prosecution� of� erstwhile� public� office�
holders� that� served� in� the� previous� administration� on� allegation� of� fraud� in� a�
USD2�billion�arms�procurement.�The�suspects� include:�former�National�Security�
Adviser,�Colonel�Sambo�Dasuki� (retd);� former�Finance�Director� in� the�office�of�
the�NSA,� Shuaibu� Salisu,� former�Minister� of� State� for� Finance,� Bashir� Yuguda;�
former� Sokoto� State� Governor,� Attahiru� Bafarawa;� and� founder� and� Chairman�
Emeritus� of� Daar� Communications� Plc� and� Daar� Investment� and� Holdings�
Limited,�High�Chief�Raymond�Dokpesi.�Meanwhile,�embattled�National�Security�
Adviser,�NSA,�Sambo�Dasuki,�was�eventually�granted�bail�by�a�High�Court�of�the�
Federal�Capital�Territory,�Abuja,�along�with�his�co-accused.�
�

2015 Review & Outlook for 20162015 Review & Outlook for 20162015 Review & Outlook for 20162015 Review & Outlook for 2016 ��
Cowry Asset Management Limited Page 83
Outlook�forOutlook�forOutlook�forOutlook�for����2012012012016666����
�
Fiscal�Outlook�
The�policy�thrust�of�the�proposed�Federal�Government�budget�for�the�year�2016�
is�hinged�on�inclusive�growth�and�job�creation�across�the�board.�Specifically,�it�is�
expected�to� increase�by�35.26%�to�N6.08�trillion.�The� increase� in�the�spending�
plan� is� mainly� meant� to� prioritise� infrastructural� development� as� capital�
expenditure� is� expected� to� increase� by� 163.1%� to� N1.85� trillion.� Recurrent�
expenditure� (non-debt),� on� the� other� hand,� is� expected� to� grow� by� 1.65%� to�
N2.65�trillion.�
Total�revenue�is�projected�at�N3.82�trillion�(higher�than�N3.6�trillion�planned�for�
2015).�The� revenue�projection�was�predicated�on�crude�oil�price�benchmark�of�
USD38�per�barrel�(from�USD65�per�barrel�benchmarked� in�2015),�an�estimated�
crude� oil� output� of� 2.2� million� barrels� per� day� (from� 2.28mbpd� projected� for�
2015)�and�an�exchange�rate�of�N198/USD.�Also,�contribution�of�value�added�tax�
(VAT)� in� 2016� is� expected� to� rise� marginally� to� N67.7� billion� in� 2016� (from�
N67.5�billion�projected�in�2015).�
The�resulting�budget�deficit�is�expected�to�amount�to�N2.22�trillion�(or�2.16%�of�
Gross� Domestic� Product),� 148.8%� higher� than� the� deficit� of� N0.81� trillion� in�
2015�(excluding�supplementary�budget�of�N0.57�trillion).�The�deficit�is�expected�
to�be�partly� financed�by�domestic�borrowing�amounting� to�deficit�N984�billion�
and�foreign�borrowing�of�amounting�to�N900�billion.�
Specifically,� Nigeria’s� revenue� base� remains� highly� skewed� to� the� oil� and� gas�
sector�that�is�currently�experiencing�supply�surplus�with�its�attendant�price�crash.�
The�threats�of�currently�soft�crude�oil�prices�and�suboptimal�crude�oil�production�
amid�global�crude�oil�supply�glut�pose�strong�downside�risk�to�realization�of�the�

2015 Review & Outlook for 20162015 Review & Outlook for 20162015 Review & Outlook for 20162015 Review & Outlook for 2016 ��
Cowry Asset Management Limited Page 84
revenue�projections.�We�therefore�anticipate�innovative�financing�solutions�such�
as� Public� Private� Partnerships� in� order� to� make� up� for� the� likely� shortfall� in�
resources.�
�
�
�
�
�
�
�
�
�
�
�
�
�
�
�
�
�
�
2016�Key�Budget�Estimates� 2016� 2015� Change��
Appropriation�Bill� 6,077,680,000,000� 4,493,363,957,158� 35.26%�
Supplementary� 0� 574,532,726,857��
Projected�Revenue� 3,860,000,000,000� 3,602,000,000,000� 7.2%�
Appropriation�Bill�+�Supplementary� 6,077,680,000,000� 5,067,896,684,015� 19.9%�
Statutory�Transfers� 351,370,000,000� 375,616,000,000� -6.5%�
Debt�Service� 1,475,320,000,000� 953,620,000,000� 54.7%�
������Domestic�Debts� 1,307,400,000,000� 882,605,000,000� 48.1%�
������Foreign�Debts� 54,480,000,000� 59,010,000,000� -7.7%�
������Sinking�Fund�To�Retire�Maturing�Loans� 113,440,000,000� 12,005,000,000� 844.9%�
Total�Recurrent�(Non-Debt)� 2,648,600,000,000� 2,607,132,491,708� 1.6%�
Subsidy�Re-investment� 0� 21,030,000,000��
Capital�Expenditure� 1,845,540,000,000� 701,415,465,449� 163.1%�
������Less:�Capital�Expenditure�in�Statutory�Transfers� 157,150,000,000� 144,420,000,000� 8.8%�
������Less:�Interest�on�Capitalised�Loans� 86,000,000,000� 0���
Capital�Expenditure�as�%�of�total�expenditure�� 30.37%� 13.84%��
Budget�Deficit�(N’tn)�� 2,217,680,000,000� 891,363,957,158� 148.8%�
Deficit�as�percentage�of�GDP� 2.16%� 0.79%��
Daily�Crude�Oil�Production�(M/Barrels)�� 2.28� 2.28��
Crude�Oil�Bench�Mark�($)�� 38� 65� -41.5%�
Domestic�Borrowing� 984,000,000,000� 570,000,000,000� 72.6%��Source:�Budget�Office�of�the�Federation;�Cowry�Research�

2015 Review & Outlook for 20162015 Review & Outlook for 20162015 Review & Outlook for 20162015 Review & Outlook for 2016 ��
Cowry Asset Management Limited Page 85
The�Oil�&�Gas�Industry�Outlook�
Prospect�for�the�Nigerian�Oil�and�Gas�industry�remains�uncertain.�Firstly,�there�is�
the� likelihood�of� a� full� deregulation� of� petrol� pump�price� as� suggested� by� the�
paltry�N65�billion�provision�for�fuel�subsidy�in�2016.�Two�scenarios�are�expected.�
The�first�and�the�most�likely�is�the�possibility�of�a�continued�downward�spiral�in�
the� international� price� of� crude� oil� to� below�USD�20� as� predicted� by� IMF� and�
partly� buoyed� by� the� expected� resumption� of� crude� oil� supply� from� Iran�
following�the� lifting�of� its�suspension�by�the�United�States�of�America�and�the�
European� Union.� This� will� by� extension� reduce� the� landing� cost� of� petroleum�
products� significantly� below� current� local� pump� price� thereby� technically�
terminating�fuel�subsidy�without�any� increase� in� local�pump�price.�Already,� the�
Nigerian� government� has� responded� to� the� lower� landing� cost� through� the�
downward� review� in� pump� price� of� petrol� from� N187� to� N186.50� for� private�
marketers� and�N186� for� the�Nigerian�National� Petroleum�Corporation� (NNPC).�
This� scenario� will� ensure� uninterrupted� supply� of� petroleum� products� thereby�
boosting�the�activities�and�income�generation�of�the�downstream�sub-sector.��
The� second� scenario� anticipates� the� remote� possibility� of� an� upbeat� in� the�
international� price�of� crude�oil�which�will�mount�upside�pressure�on�petroleum�
products�importation�costs�and�consequently�on�pump�price�cum�petrol�subsidy.�
This�is�expected�to�create�initial�upheavals�and�supply�disruptions�as�petroleum�
marketers�remain�skeptical�on�the�possibility�of�getting�subsidy�refund�from�the�
Federal� Government.� By� implication,� the� downstream� industry� turnover� is�
expected�to�shrink.��
However,� we� expect� an� improvement� in� the� capacity� utilization� of� the� local�
Petroleum�Refineries�and�a�consequent�increase�in�refined�products�supply.�This�
will� reduce� the� amount� of� importation� and� the� requirement� for� petrol� subsidy�
provisions.���

2015 Review & Outlook for 20162015 Review & Outlook for 20162015 Review & Outlook for 20162015 Review & Outlook for 2016 ��
Cowry Asset Management Limited Page 86
Lastly,�the�upstream�subsector�would�remain�unattractive�to�investors�as�long�as�
the�international�crude�oil�price�remains�low.�We�therefore�expect�the�number�of�
operational� upstream� oil� rigs� to� continue� to� decline� as� the� international� oil�
companies�continue�to�divest�their�holdings�in�the�Nigerian�oil�wells.�
�
Inflation�Outlook�
In� line�with�our�expectations� for�2015�as� contained� in�our�2014�Cowry�Market�
Review�and�Outlook�for�2015,�inflation�remained�within�the�single�digit� region,�
occasioned�by�the�largely�conractionary�monetary�and�fiscal�measures�witnessed�
in� 2015.� However,� following� increased� spending� activities� expectations� from�
implementation� of� the� 2016� budget,� inflationary� pressure� is� likely� to� be�
sustained.�We�also�anticipate�that�expected�increase�in�spending�on�construction�
activities� and� infrastructure� development,� will� likely� stimulate� private� sector�
demand,�particularly� from�labour.�Cost�push� inflationary�pressures�are�also�very�
likely� given� the� continued� upside� pressure� on� foreign� exchange� rates.� Lastly,�
seasonal�increase�in�food�price�during�planting�season�will�likely�increase�upside�
risk� of� inflation.� Consequently,� we� expect� inflation� rate� to� break� through� the�
10%�mark.�
�
Interest�Rate�Outlook�
Towards�the�end�of�2015,�the�monetary�authority�began�to�relax�its�policy�stance�
in� a� bid� to� stimulate� economic� activities� in� the� face� of� relatively� high� foreign�
exchange� rates,� dwindling� external� reserves� and� low� productive� base.� For� the�
early� part� of� 2016,�we� expect� the� trend� to� continue� in� tandem�with� the� fiscal�
authority’s� position� in� favour� of� lower� cost� of� funds.� However,� the� increased�
inflation�outlook�may�necessitate�upward�adjustment�of�the�benchmark�interest�

2015 Review & Outlook for 20162015 Review & Outlook for 20162015 Review & Outlook for 20162015 Review & Outlook for 2016 ��
Cowry Asset Management Limited Page 87
rate� towards� the� third� quarter� in� 2016,� thus� incentivizing� fixed� income�
investments�towards�to�end�of�the�2016�fiscal�year.�
�
Foreign�Exchange�Outlook�
The�determination�shown�by�the�present�administration�to�keep�the�official�rate�
at�N199/USD�is�laudable�but�somewhat�unconventional�and�unsustainable.�The�
monetary�authorities�seemed�poised�to�retain�its�fight�against�dollar�demand�in�
the� face�of�diminishing� supply�of� the�greenback.�However,�without�any� strong�
source�of�dollar�supply� in�sight,�we�think�that� the�CBN�will�soon�hit� its� limit� in�
curtailing�dollar�demand� in�an� import�dependent�economy.�Hence�we�expect�a�
sustained�upside�pressure�on�the�foreign�exchange�rate.�
�
�
Bond�Market�Outlook�
Fixed� income� as� an� investment� outlet� is� expected� to� improve� in� 2016.� The�
Federal� Government� has� indicated� interest� in� borrowing� to� fund� the� 2016�
budget�from�the�local�and�international�markets.�Consequently,�increased�public�
sector� borrowing� may� lead� to� crowding� out� of� the� private� sector� given� the�
expanded� size� of� planned� Governments� expenditure� in� 2016.� However,� the�
bearish�outlook�on�short-term�oil�prices�has�remained�a�risk�factor�that�may�force�
the� federal� government� to� compensate� investors� with� higher� marginal� rates.�
Hence,� bond� yields� are� expected� to� remain� in� the� double� digit� region� despite�
contracted� money� market� rates.� This� again� might� create� a� rent� seeking�
opportunity�for�the�deposit�money�banks.�State�government�bonds�are�likely�to�
shrink�in�size�as�they�battle�recurrent�expenditure�due�to�high�wage�bill.�

2015 Review & Outlook for 20162015 Review & Outlook for 20162015 Review & Outlook for 20162015 Review & Outlook for 2016 ��
Cowry Asset Management Limited Page 88
�
Equities�Market�Outlook�
In� the� equities� market,� companies’� fundamentals� are� expected� to� weaken�
particularly� on� increased� operational� cost� coming� from�higher� import� costs� for�
manufacturers,� lower� earnings� potentials� for� the� Banking� and�Oil� sectors,� and�
deteriorating� banking� assets.� This� in� addition� to� the� increased� risk� profile� in�
terms� of� dollar� liquidity� amid� dwindling� external� reserves� will� remain� major�
disincentive�to�foreign�portfolio�capital�inflows.�Moreso,�the�robust�bond�market�
outlook� remains� a� veritable� investment� alternative� to� fund� managers.� We�
therefore�expect�an�overall�bearish�market�outlook.��
�
�
�
�
�
�
�
�
�
�

2015 Review & Outlook for 20162015 Review & Outlook for 20162015 Review & Outlook for 20162015 Review & Outlook for 2016 ��
Cowry Asset Management Limited Page 89
�
�
�
Disclaimer�
This�report�is�produced�by�the�Research�DeskResearch�DeskResearch�DeskResearch�Desk�of�Cowry�Asset�Management�Limited�(COWRY)�
as� a� guideline� for� Clients� that� intend� to� invest� in� securities� on� the� basis� of� their� own�
investment� decision� without� relying� completely� on� the� information� contained� herein.� The�
opinion�contained�herein�is�for�information�purposes�only�and�does�not�constitute�any�offer�or�
solicitation�to�enter�into�any�trading�transaction.�While�care�has�been�taken�in�preparing�this�
document,�no�responsibility�or�liability�whatsoever�is�accepted�by�any�member�of�COWRY�for�
errors,� omission� of� facts,� and� any� direct� or� consequential� loss� arising� from� the� use� of� this�
report�or�its�contents.
�
For�further�enquiries,�please�contact:��
Cowry Asset Management Limited,
�
Phone: +234-1-2715008-9
+234-1-2716614-5
E-mail: [email protected],
Other branches in Abuja, Port-Harcourt &
Onitsha
URL: www.cowryasset.com
Plot 1319, Karimu Kotun Street,
Off Sanusi Fafunwa,
Victoria Island,
Lagos.�