Cow-Calf Producer Preferences for Voluntary Traceability ...
25
Cow-Calf Producer Preferences for Voluntary Traceability Systems Lee L. Schulz and Glynn T. Tonsor 1 (Original submitted March 2009, revision received August 2009, accepted October 2009.) Abstract This article identifies preferences of US cow-calf producers for voluntary trace- ability systems to better identify the potential success of alternative voluntary traceability systems. Results suggest that notable heterogeneity exists between cow-calf producers in their preferences and the welfare effects of mandating traceability adoption. Producers are sensitive to price, managing entity and information requirements. We provide forecasts of voluntary participation rates under different price premium and discount scenarios that producers may face. This analysis has policy implications as success of voluntary traceability systems hinges critically upon cow-calf producer preferences. Keywords: Animal traceability; cattle producer; cow-calf; National Animal Iden- tification System; voluntary traceability. JEL classifications: Q12, Q18, R38. The National Animal Identification System (NAIS) is an information system con- sisting of premises registration, animal identification and animal tracing, that helps producers and animal health officials respond quickly and effectively to animal dis- ease events in the USA (USDA-APHIS, 2008a). Producers who choose to partici- pate in NAIS become part of a national animal disease response network, where all three of the NAIS components are used together to provide a streamlined system of information (USDA-APHIS, 2007). In order for NAIS to be most effective and provide a full traceable history of animal movements, premises registration, animal identification and animal tracing are needed for the cow-calf sector. Initial deadlines for full implementation and compliance of NAIS have elapsed with participation rates for the establishment of individual premises identification and individual 1 Lee L. Schulz is a Graduate Research Assistant in the Department of Agricultural Eco- nomics, Kansas State University, 342 Waters Hall, Manhattan, KS 66506, USA. E-mail: [email protected] for correspondence. Glynn T. Tonsor is an Assistant Professor in the Department of Agricultural, Food, and Resource Economics, Michigan State University. The authors acknowledge, without implication, BEEF Magazine for providing the mailing list for our survey, and two anonymous reviewers and the editors for comments on earlier versions of this paper. Journal of Agricultural Economics, Vol. 61, No. 1, 2010, 138–162 doi: 10.1111/j.1477-9552.2009.00226.x Ó 2009 The Authors. Journal compilation Ó 2009 The Agricultural Economics Society.
Transcript of Cow-Calf Producer Preferences for Voluntary Traceability ...

Cow-Calf Producer Preferences forVoluntary Traceability Systems
Lee L. Schulz and Glynn T. Tonsor1
(Original submitted March 2009, revision received August 2009, acceptedOctober 2009.)
Abstract
This article identifies preferences of US cow-calf producers for voluntary trace-ability systems to better identify the potential success of alternative voluntarytraceability systems. Results suggest that notable heterogeneity exists betweencow-calf producers in their preferences and the welfare effects of mandatingtraceability adoption. Producers are sensitive to price, managing entity andinformation requirements. We provide forecasts of voluntary participation ratesunder different price premium and discount scenarios that producers may face.This analysis has policy implications as success of voluntary traceability systemshinges critically upon cow-calf producer preferences.
Keywords: Animal traceability; cattle producer; cow-calf; National Animal Iden-tification System; voluntary traceability.
JEL classifications: Q12, Q18, R38.
The National Animal Identification System (NAIS) is an information system con-sisting of premises registration, animal identification and animal tracing, that helpsproducers and animal health officials respond quickly and effectively to animal dis-ease events in the USA (USDA-APHIS, 2008a). Producers who choose to partici-pate in NAIS become part of a national animal disease response network, where allthree of the NAIS components are used together to provide a streamlined system ofinformation (USDA-APHIS, 2007). In order for NAIS to be most effective andprovide a full traceable history of animal movements, premises registration, animalidentification and animal tracing are needed for the cow-calf sector. Initial deadlinesfor full implementation and compliance of NAIS have elapsed with participationrates for the establishment of individual premises identification and individual
1 Lee L. Schulz is a Graduate Research Assistant in the Department of Agricultural Eco-nomics, Kansas State University, 342 Waters Hall, Manhattan, KS 66506, USA. E-mail:[email protected] for correspondence. Glynn T. Tonsor is an Assistant Professor in
the Department of Agricultural, Food, and Resource Economics, Michigan State University.The authors acknowledge, without implication, BEEF Magazine for providing the mailing listfor our survey, and two anonymous reviewers and the editors for comments on earlierversions of this paper.
Journal of Agricultural Economics, Vol. 61, No. 1, 2010, 138–162doi: 10.1111/j.1477-9552.2009.00226.x
� 2009 The Authors. Journal compilation � 2009 The Agricultural Economics Society.

animal identification below expectation (USDA-APHIS, 2008a). USDA estimatesshow that only 35% of producers register their premises, which is the minimalrequirement for participation in NAIS (USDA-APHIS, 2009). This creates a criticalneed we aim to meet in this article in identifying producer preferences and deter-mining how traceability systems could be designed and promoted to improvevoluntary participation rate.2
Any voluntary system hinges critically on the preferences of potentially partici-pating parties. As cow-calf producers are the foundation of the beef supplychain, their preferences in the design of an individual animal traceability systemare critical (Schulz and Tonsor, 2008). According to Souza Monteiro andCaswell (2004), ‘four patterns of adoption are evident in the major producingand trading countries: adoption of mandatory systems in response to consumerconcerns (EU and Japan), imposition of mandatory traceability to maintain orenhance export shares (Australia, Brazil, and Argentina), industry managedmandatory programs for animal identification (Canada), and voluntary systems(United States)’ (p. 7). Furthermore, in case studies of beef firms employingtraceability located in France, Holland, Germany, Norway and Scotland, Buhr(2003) states, ‘When case participants were asked why they adopted traceability,the first response in every case was, ‘‘Consumers demanded to know where theirfood came from and how it was produced’’’ (p. 14). Surprisingly, very little researchhas examined preferences of US cow-calf producers regarding traceability systems.This is a substantial gap from a public policy standpoint. For example, NAIS has astated goal of improving the USA’s disease response capabilities, limiting the spreadof diseases, minimising animal losses and economic impacts, protecting producers’livelihoods and maintaining market access (USDA-APHIS, 2008b). However, theeffectiveness of NAIS in its current form is dependent upon voluntary participationof livestock producers.Golan et al. (2004) report the existence of several beef traceability systems in the
USA, although current traceability systems have been mainly private and marketdriven. ‘There are currently no mandatory beef traceability systems in the U.S.’(Souza Monteiro and Caswell, 2004, p. 20). As a result, differences exist betweentraceability systems developed by private firms and those mandated or influencedby public authorities (Souza Monteiro and Caswell, 2004). Moreover, the USA maybe lagging behind other countries in adoption of livestock traceability systems,thereby, decreasing its competitiveness in the global beef market (Tonsor and Sch-roeder, 2006). This can be attributed to the low adoption of traceability systems bythe cow-calf sector, as efficient and effective traceability systems allow for traceback to the point of origin.The primary objective of this article was to examine cow-calf producer prefer-
ences for voluntary traceability systems. Our analysis involves evaluating how sensi-tive producer preferences are to premiums and discounts, the entity in charge ofdata maintenance and the amount of information required for producer participa-tion. Identification of cow-calf producer preferences allows forecasting voluntaryparticipation rates under different scenarios producers may face. Producer welfareeffects of imposing mandatory traceability are also provided. This study is the first
2 Throughout this analysis we use the term ‘traceability’ to refer to live animal traceability,rather than meat traceability.
139Cow-Calf Producer Preferences for Voluntary Traceability Systems
� 2009 The Authors. Journal compilation � 2009 The Agricultural Economics Society.
known evaluation aimed at improving understanding of how design of an individualanimal traceability system impacts voluntary participation by producers and of thecorresponding welfare effects.The remainder of the article is organised as follows. First, a review of previous
research is presented to highlight the need for further analysis. The next sectionshows the methods used for producer-level data collection, the layout of the concep-tual random utility model, and discussion of estimated multinomial logit and latentclass models (LCMs). Producers’ willingness-to-change (WTC) traceability systemattributes, forecasts of alternative traceability system participation and producerwelfare effects are then examined. The final sections provide a discussion of implica-tions and conclusions.
1. Previous Research
The NAIS was initiated to enhance previous disease programmes through the estab-lishment of standards that could be used for all state and federal disease pro-grammes in the USA. The focus of NAIS is on animals that enter commerce, thatis, those animals that move from their farm and ranch to markets and ⁄or locationswhere they co-mingle with animals from other premises (Cattle Network, 2008).According to Murphy et al. (2009), ‘NAIS was originally designed as a mandatoryprogram, but due to strong opposition, the USDA changed directions and pub-lished a revised ‘‘User Guide’’ in November 2006, which stated that NAIS wouldbecome a voluntary program at the federal level’ (USDA-APHIS, 2007, p. 3). TheNAIS is the broadest and most comprehensive effort ever launched in the USA toenhance the ability to quickly identify and contact animal premises, promote animalidentification and develop animal movement and tracing capabilities (Schroederet al., 2009).Several studies have compared current traceability systems that exist in the global
beef market. According to Murphy et al. (2008), ‘North America recognizes thatsystems that can protect the integrity of national livestock populations, as well asstrengthen consumer and export market confidence in meat products are becomingprerequisites to international trade’ (p. 284). For example, Murphy et al. (2009)state ‘the existence of the Canadian Cattle Identification Agency (CCIA) sends avery clear message to the world that Canada takes identification and traceability ofits animals very seriously’ (p. 8). Tonsor and Schroeder (2006) argue that the USbeef industry lags behind Australia in animal traceability. Along these same lines,Smith et al. (2005) reported that the USA is ‘lagging behind many countries indeveloping traceability systems for food in general and especially for livestock, andtheir products’ (p. 174). Souza Monteiro and Caswell (2004) present evidence thatEU, Japan, Australia, Brazil, Argentina and Canada lead the USA in beef traceabil-ity systems. Bailey (2007) demonstrates the USA has a weaker beef traceabilitysystem than Uruguay, Argentina, the European Union and Australia. Collectively,these studies suggest that traceability adoption in the USA is falling behind otherleading beef-producing countries. Although there exists a significant body of litera-ture comparing traceability systems and identifying shortcomings, better identifica-tion of the potential success of alternative voluntary traceability systems that couldexist in the beef industry is needed.Past research has sought to analyse consumers’ preferences towards voluntary
traceability (Dickinson and Bailey, 2002; Dickinson et al., 2003). This work has
140 Lee L. Schulz and Glynn T. Tonsor
� 2009 The Authors. Journal compilation � 2009 The Agricultural Economics Society.

primarily been done through experiments where consumers bid on products that arelabelled with differing levels of traceability. The key point to take from these analy-ses was that traceability, while receiving positive bids, was the least valued of thethree individual characteristics presented to consumers (i.e. animal welfare, foodsafety and traceability). Dickinson et al. (2003) suggested that traceability should bebundled with other characteristics that could be verified with traceability when foodproducts were marketed with these characteristics.In response to beef safety issues ‘the EU has developed a system for identifica-
tion and registration of cattle and a compulsory traceability and labeling systemthat allow the flow of product information throughout the supply chain’ (Graciaand Zeballos, 2005, p. 45).3 Gracia and Zeballos (2005) evaluated whether thebeef supply agents recognised benefits from the implementation of the traceabilitysystem. Perceptions of the new traceability regime were mostly consistent amongstconsumers and retailers. Consumers and retailers commented that the new manda-tory traceability programme led to higher beef prices and is unnecessary becausethe quality and safety of beef was already adequate before the system was devel-oped; whereas consumers believed the new system increased consumer safety per-ceptions and confidence and retailers believed benefits were accrued by consumers,retailers and the rest of the players in the beef supply chain (Gracia and Zeballos,2005).There has been little research on producers’ preferences concerning voluntary
traceability. This is especially important when attempting to implement individualanimal traceability and maximise participation rates of these systems as the viewsof these producers will most certainly impact the success or failure of theseefforts. A few recent economic studies have addressed beef industry perceptionsregarding traceability. Buhr (2003) focused on the economics of information sys-tems by investigating six European organisations, two of which involved the beefsupply chain, employing traceability programmes.4 Participants of this study,‘report that traceability often has internal production benefits from improvedinformation and control of production even though traceability has generally beencouched as a supply chain management issue driven by consumer demand’ (Buhr,2003, p. 17).The only known economic study examining beef industry perceptions and prefer-
ence in the USA is Bailey and Slade (2004) who conducted a survey to measure thelevel of support among a small sample of state veterinarians and producer grouprepresentatives. They examined how support for a specific animal identification pro-posal (US Animal Identification Plan, USAIP) varied based on concerns about ani-mal health and the perceived costs and benefits accrued to different levels of themarketing chain. The study found that ‘over 90% of state cattle producer associa-tion respondents indicated support for a national cattle identification program;whereas only 41% indicated that they supported the USAIP’ (Bailey and Slade,
3 Since 1 January 2002, the label contains information on the animal’s origin, in particularwhere the animal was born, fattened, and slaughtered’ (Gracia and Zeballos, 2005, p. 45).4 The two participating entities from the beef supply chain were Scase-Intentia ⁄Gilde, a lamb,pork and beef supply chain in Norway; and Scotbeef, a beef production system in Scotland.The traceability systems employed by these entities extended from the feed manufacturingprocess through retail (Buhr, 2003).
141Cow-Calf Producer Preferences for Voluntary Traceability Systems
� 2009 The Authors. Journal compilation � 2009 The Agricultural Economics Society.

2004, p. 13). The lack of confidence in initial programmes, as indicated by the 41%in favour of the USAIP, documents the need for determining the most importantattributes of voluntary traceability systems to aid in design and promotion of amore acceptable traceability system.This article reports on the results of random utility multinomial logit and latent
class logit models that examine producers’ preferences for alternative traceabilitysystems, using a national sample of producers characterised by preference hetero-geneity. Incorporating and understanding preference heterogeneity provides valuableinformation on the distributional effects of traceability policy alternatives and betterexplains the current situation of partial (±30%) NAIS participation (USDA,2008a). Accordingly, this study will be beneficial in future management of NAIS,and related animal traceability systems, as it provides insights into why producersparticipate in voluntary traceability systems and estimates producer welfare effectsassociated with mandating traceability.
2. Methods
As producer-level data are not publically available, collection of primary data wasnecessary. We developed a survey for US cow-calf producers to complete whichprovided us with the producer-level data necessary to estimate the logit models. Thesurvey was designed to obtain information from US cow-calf producers regardingdemographics, production practices, perceptions regarding traceability and potentialbeef traceability systems.5 Questions regarding producer’s age, years raising beefcattle, estimated annual pretax income, NAIS premises registrations, marketingmethods and number beef cows that calved were asked to better understand thecharacteristics of the cow-calf producers and their operations. More in-depth ques-tions concerning cow-calf producers’ perceptions of important issues and concernsto the US beef industry when designing a national, individual animal traceabilitysystem were then asked to capture the most important issues and concerns of cow-calf producers. A choice experiment (CE) was utilised to simulate real-life situationsin which cow-calf producers choose between alternative traceability systems.A total of 2000 (1998 effective) surveys were mailed to cow-calf producers
(selected on an nth name basis by BEEF Magazine) throughout the USA. BEEFMagazine was used as its mailing list provided us the most extensive candidate sam-ple available. Moreover, producer magazines have been used in other projects seek-ing producer-level survey data (Davis and Gillespie, 2007). The surveys were firstreviewed by beef industry representatives and animal science faculty and updated toreflect their suggestions prior to mailing. A $1 bill was included in the survey topotentially increase participation and response (Gregory, 2008). Post cards remind-ing producers to complete the survey were sent two weeks after the initial mailingwith an Internet link to a survey being made available.Summary statistics of survey respondents and their operations are provided in
Table 1. The respondent pool provided 609 useable surveys (30.48% effectiveresponse rate).6 Our sample has 41% (weighted data) indicating they have registered
5The survey instrument is available in Schulz (2008).6Michigan respondents (5) were not included in the final dataset because of the mandatorynature of the state’s individual, beef traceability system.
142 Lee L. Schulz and Glynn T. Tonsor
� 2009 The Authors. Journal compilation � 2009 The Agricultural Economics Society.
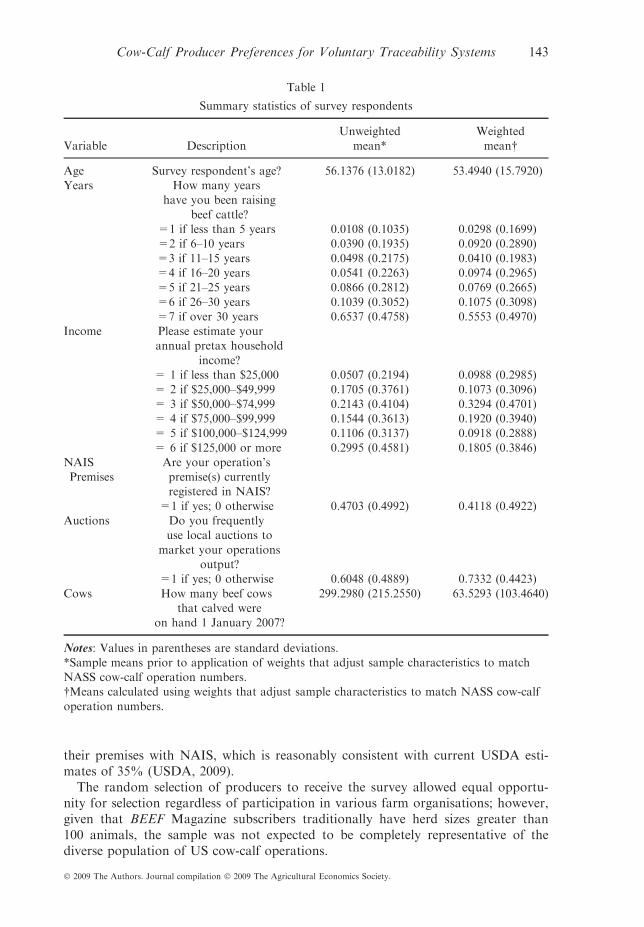
their premises with NAIS, which is reasonably consistent with current USDA esti-mates of 35% (USDA, 2009).The random selection of producers to receive the survey allowed equal opportu-
nity for selection regardless of participation in various farm organisations; however,given that BEEF Magazine subscribers traditionally have herd sizes greater than100 animals, the sample was not expected to be completely representative of thediverse population of US cow-calf operations.
Table 1
Summary statistics of survey respondents
Variable DescriptionUnweighted
mean*Weightedmean�
Age Survey respondent’s age? 56.1376 (13.0182) 53.4940 (15.7920)Years How many years
have you been raising
beef cattle?=1 if less than 5 years 0.0108 (0.1035) 0.0298 (0.1699)=2 if 6–10 years 0.0390 (0.1935) 0.0920 (0.2890)
=3 if 11–15 years 0.0498 (0.2175) 0.0410 (0.1983)=4 if 16–20 years 0.0541 (0.2263) 0.0974 (0.2965)=5 if 21–25 years 0.0866 (0.2812) 0.0769 (0.2665)
=6 if 26–30 years 0.1039 (0.3052) 0.1075 (0.3098)=7 if over 30 years 0.6537 (0.4758) 0.5553 (0.4970)
Income Please estimate yourannual pretax household
income?= 1 if less than $25,000 0.0507 (0.2194) 0.0988 (0.2985)= 2 if $25,000–$49,999 0.1705 (0.3761) 0.1073 (0.3096)
= 3 if $50,000–$74,999 0.2143 (0.4104) 0.3294 (0.4701)= 4 if $75,000–$99,999 0.1544 (0.3613) 0.1920 (0.3940)= 5 if $100,000–$124,999 0.1106 (0.3137) 0.0918 (0.2888)
= 6 if $125,000 or more 0.2995 (0.4581) 0.1805 (0.3846)NAISPremises
Are your operation’spremise(s) currentlyregistered in NAIS?
=1 if yes; 0 otherwise 0.4703 (0.4992) 0.4118 (0.4922)Auctions Do you frequently
use local auctions to
market your operationsoutput?
=1 if yes; 0 otherwise 0.6048 (0.4889) 0.7332 (0.4423)
Cows How many beef cowsthat calved were
on hand 1 January 2007?
299.2980 (215.2550) 63.5293 (103.4640)
Notes: Values in parentheses are standard deviations.*Sample means prior to application of weights that adjust sample characteristics to matchNASS cow-calf operation numbers.�Means calculated using weights that adjust sample characteristics to match NASS cow-calf
operation numbers.
143Cow-Calf Producer Preferences for Voluntary Traceability Systems
� 2009 The Authors. Journal compilation � 2009 The Agricultural Economics Society.

As expected, cow-calf operations within our sample were larger than the generalUS cow-calf operation numbers as reported by the National Agriculture StatisticsService (NASS). To correct for the differences in the sample and the population,poststratification weights were created based on 2007 beef cows that calved peroperation data from NASS. We chose this variable because beef cows that calvedper operation are likely to be highly related to producers’ demographics and pro-duction practices. Following Lusk and Rozan (2008) to create weights, we placedeach respondent into one of five operation size categories.7 Weights were created bydividing the frequency of US cow-calf operations in each of the five size categories(as reported by NASS) by the fraction of cow-calf operations in the survey samplethat fell in each of the five categories. To illustrate the effect of the weights onresults, Table 1 reports weighted and unweighted means and standard deviations ofproducer’ demographics and other variables used in the analysis. Once weights wereapplied to the data, the mean beef cows per operation match those of the US herdsizes. As the weighted statistics are more reflective of the actual population andcorrected imbalances in sampling ratios from the general population to the sample,all results reported in the remaining analysis utilise the derived weights.The survey contained a CE in which producers made choices between traceability
systems with varying levels of premiums or discounts, managing entities and infor-mation required (e.g. age verification, production practice information, perfor-mance ⁄genetic information and health records). Each respondent completed a CEdesigned to best resemble current and potential traceability systems within the beefindustry while avoiding being overly complex for respondents (Norwood et al.,2006). Here, the primary purpose of the CE is to help determine producers’ WTC,accept premiums or discounts, to voluntarily participate in a given traceability sys-tem. In other words, producers were asked how much they would need to be com-pensated in order to participate in a system with differing levels of participationrequirements.Choice experiments permit multiple attributes to be evaluated, thereby allowing
researchers to estimate trade-offs between different alternatives (Lusk et al., 2003).An orthogonal fractional design (Kuhfeld et al., 1994) was used to select scenariosin which premiums ⁄discounts are uncorrelated, and which allowed for identificationof own-price and alternative specific effects. This process also allowed the CE to beof reasonable size for survey participants. Furthermore, following the lead of Ton-sor et al. (2005), the CE was divided into blocks to ease respondent fatigue.In this CE, cow-calf producers were presented with a set of four different choice
scenarios, each of which involved choosing a preferred alternative from three differ-ent traceability systems.8 The three traceability systems included: (i) NAIS Trace-ability; (ii) Advanced Traceability and (iii) No Traceability (see Appendix fordescriptions). As recommended by Adamowicz et al. (1998), a no-choice option waspresented to participants because this is an obvious option currently available toproducers. Moreover, inclusion of a no participation scenario allows us to examinewelfare effects of mandating traceability.
7 Beef cows per operation categories included 1–49, 50–99, 100–499, 500–999 and 1,000+.8The total number of scenarios in the CE was 20 which were blocked into five groups of fourscenarios.
144 Lee L. Schulz and Glynn T. Tonsor
� 2009 The Authors. Journal compilation � 2009 The Agricultural Economics Society.

The attributes included in the CE design were: (i) premium or discount per ani-mal sold; (ii) managing entity and (iii) additional information required by AdvancedTraceability participation (Appendix presents the complete set of CE instructionsand attribute definitions). An example choice scenario included in the CE is shownin Table 2.The CEs were hypothetical; however, our instructions specifically stated,
‘Research studies have found people to overstate their willingness to participate (oraccept discounts) in hypothetical situations. It is important that you make yourselection as if you were actually facing these choices’. This cheap talk script wasincluded before the scenarios, and has been shown to reduce hypothetical bias inCE research (Cummings and Taylor, 1999; Lusk, 2003).The additional information requirements for Advanced Traceability participation
were purposely not overly specific as doing so would have limited the scope of thisstudy (e.g. required valuation of fewer attributes and ⁄or levels) and reduced theapplicability of certain practices to particular producers. However, we do acknow-ledge that different perceptions of producers in the requirements of these traceabil-ity system attributes probably affected their willingness to participate. As such, allof our conclusions are strictly based upon producer responses to the informationprovided to them. More work is needed to evaluate issues such as preferences foralternative methods of providing age verification or different levels of performanceinformation.
2.1. Choice modelling: Multinomial logit and latent class specifications9
Data obtained through CEs has traditionally been analysed using multinomial logit(MNL) models (e.g. Lusk et al., 2003). Multinomial logits estimate producer ran-dom utility (Adamowicz et al., 1998; Lusk et al., 2003) which can be characterisedby equation (1):
Ujt ¼ vjt þ ejt ð1Þ
where Ujt is the utility associated with alternative j in choice scenario t, vjt is the sys-tematic, observable component of utility determined by attributes and their valuesand ejt, is a random, unobservable component of logit models, independently andidentically distributed over all alternatives and choice situations. A producer will
Table 2
Scenario example
Attribute NAIS traceability Advanced traceability No traceability
Premium ⁄discount ($ per head) $0.00 $7.50 )$15.00Managing entity Government Private-IndustryAdditional Information Performance ⁄ geneticsI choose… h h h
9We also considered a random parameters logit model (Alfnes, 2004; Tonsor et al., 2005).Results were quantitatively similar and are not presented for brevity but are available uponrequest.
145Cow-Calf Producer Preferences for Voluntary Traceability Systems
� 2009 The Authors. Journal compilation � 2009 The Agricultural Economics Society.

choose alternative j if Uj ‡ Uk for all j „ k. So, the probability that alternative jwill be chosen is equal to the probability that the utility gained from its choice isgreater than or equal to the utilities of choosing another alternative in the choiceset. However, as these utilities contain a stochastic component, researchers can onlydescribe the probability of producers choosing alternative j as (Adamowicz et al.,1998; Boxall and Adamowicz, 2002):
Probfj choseng ¼ probfvj þ ej � vk þ ek; j 6¼ k 8j 2 Cg ð2Þ
where C is the choice set of all possible alternatives. Assuming the random errors inequation (1) are independently and identically distributed across the j alternativesand N individuals with a type I extreme value distribution, Adamowicz et al.(1998), Boxall and Adamowicz (2002) and Lusk et al. (2003) have shown that theprobability of a producer choosing alternative j becomes:
Probfj choseng ¼ elbXiPk2C elbXk
ð3Þ
where l is a scale parameter, which is inversely related to the variance of the errorterm and b is a vector of parameters. According to Lusk et al. (2003) the scaleparameter, l, is typically assumed equal to one because it is unidentifiable withinany particular dataset. Assuming the systematic utility component vj is linear in theparameters and follows the generalised regression specification leads to:
vj ¼ b1xj1 þ b2xj2 þ � � � þ bnxjn ð4Þ
where xjn is the nth attribute value for alternative j and bn is a vector of preferenceparameters associated with the nth attribute of the jth alternative.Multinomial logit models assume that all respondents share the same coefficients
for a given attribute. That is, all respondents are assumed to have the same prefer-ences for attributes, an assumption which may be unrealistic if producers’ prefer-ences are in fact heterogeneous.A latent classification strategy assumes that producers can be separated into dif-
ferent classes such that producers within each class have homogeneous preferencesbut that preferences vary across producers from alternative classes (Boxall andAdamowicz, 2002). Thus, this process groups producers with relatively homoge-neous preferences based on similarities in their utility functions.Boxall and Adamowicz (2002) describe the latent class approach as assuming the
existence of s segments in a population where individual n belongs to segment s(s = 1,…, s). The LCM estimates a utility function unique to each producer seg-ment, which can be expressed:
vnijs ¼ bsXni þ enijs: ð5Þ
In this expression the utility parameters are now segment specific. The probabilityof a producer choosing alternative j is:
Probfj chosenjsg ¼ elsbsXiPk2C elsbsXk
ð6Þ
where the bs and ls are segment-specific utility and scale parameters, respectively.
146 Lee L. Schulz and Glynn T. Tonsor
� 2009 The Authors. Journal compilation � 2009 The Agricultural Economics Society.

2.2. Willingness to change
Individual coefficients estimated in random utility models have little interpretivevalue. However, in each model relative combinations of select coefficients provideeconomically meaningful insights into producer preferences. Accordingly, we followNahuelhual et al. (2004) and Rigby and Burton (2005) to identify how willing pro-ducers are to change traceability system attributes. In particular, the willingness ofproducers to change is calculated for each non-price traceability system attribute atthe means of each model’s explanatory variables. These calculations are generallygiven by.
Mean WTC ¼ MU
MUI
����mean independent variables
ð7Þ
where MU is the mean marginal utility of traceability systems and system attributesand MUI is the marginal utility of income (proxied in our calculations with the pre-mium or discount coefficient). Here, we use the term WTC to generally captureboth willingness to pay (WTP) and willingness to accept (WTA) terms more com-mon in the literature. We do this as our inclusion of a premium ⁄discount variablemakes calculation of both WTP and WTA estimates feasible and important. Inshort, WTP identifies the premium producers would pay to obtain a preferred attri-bute, whereas WTA identifies how much producers would accept as discounts tomaintain their selection of a preferred attribute. Both WTP and WTA are calcu-lated by equation (7).To determine if the estimated average WTC estimates in each model are statisti-
cally different from zero, a Krinsky and Robb (1986) bootstrapping procedure wasemployed to develop confidence intervals on the WTC estimates. Bockstael andStrand (1987) have emphasised that the parameter estimates used to calculate wel-fare measures are themselves random variables; thus, the Krinsky–Robb techniqueused here to develop confidence intervals for the WTC measure accounts for thevariability associated with all the estimated coefficients and is based directly on thelogit specification for the choices of respondents. The Krinsky and Robb approachuses the information on the distribution of b̂ contained in the variance–covariancematrix to approximate the distribution of WTC (Park et al., 1991).
2.3. Voluntary participation forecast analysis
Utilising equations (3) and (6) we can identify the probability of a producer choos-ing a given alternative under differing premium and discount pricing schemes. Thisallows us to investigate how selections change as premiums for Advanced Traceabi-lity participation or discounts for No Traceability appear as free-market incentives.Following Alfnes (2004) and Norwood et al. (2006), we use these probabilities asmarket share estimates.
2.4. Producer welfare analysis
In contrast to allowing the market to provide incentives, it is quite possible that theregulatory environment could change causing producers to adjust their traceabilitypractices, regardless of market prices. For instance, it was originally intended that
147Cow-Calf Producer Preferences for Voluntary Traceability Systems
� 2009 The Authors. Journal compilation � 2009 The Agricultural Economics Society.

mandatory participation in NAIS was to be law (USDA, 2008a). Accordingly, aprudent question to ask is how producers would be impacted if No Traceability wasno longer an allowed option?We estimated the welfare effects producers would experience given two alternative
scenarios: (i) removal of No Traceability and (ii) removal of both No Traceabilityand Advanced Traceability from producer choice sets. The first scenario representsthe case of some level of traceability being mandated but not necessarily NAIS par-ticipation. This may reflect the USDA taking a position of cooperation with privatetraceability systems to increase overall traceability, without necessarily forcingNAIS participation. The second scenario reflects the possibility of non-NAIS trace-ability systems being viewed as either incompatible or insufficient and NAIS partici-pation being mandated. Both scenarios restrict producers’ choice sets and hencehave welfare impacts worthy of evaluation.Small and Rosen (1978) and Morey (1999) show that expected maximum utility
from making a choice from a particular choice set is given by:
CV ¼ lnX
eVj� �
þ K;
where K is Euler’s constant and Vj is as previously defined. The welfare change thatoccurs when moving from one situation given by CV0 to a situation given by CV1
is:
1=ðMarginal utility of incomeÞ � ½ðCV1Þ � ðCV0Þ�:
The welfare measure accounts for the fact that producers are currently free tochoose No Traceability and that actual choices are uncertain. These measures alsocapture producer valuations of autonomy and reflect more than simple differencesin perceived costs (Key, 2005). This calculation represents that most producerswould be willing to pay per choice occasion to face the choices in situation 1 vs.situation 0 (Lusk et al., 2006). Alternatively, this estimates the welfare impacts offorcing some traceability option (either NAIS or private) or forcing mandatoryNAIS participation.
3. Results
Estimates of the multinomial logit and LCMs are provided in Table 3. The MNLmodel is rejected in favour of the LCM model (per likelihood ratio tests) but is pre-sented as a benchmark comparison of results when assuming homogeneous prefer-ences. When assuming homogeneity, the representative producer is found to preferNo Traceability to NAIS, and NAIS to Advanced Traceability, probably reflectingthe perceived costs of the three options. However, interpretation of individual coef-ficients must be done with caution and is generally discouraged in random utilitymodels (Scarpa and DelGiudice, 2004).Following Boxall and Adamowicz (2002) for the identification of the number of
classes to be used in this analysis, we minimised the Bayesian information crite-rion (BIC), which leads to the three-class model. Inclusion of demographics in theLCM allows for further examination of the types of producers valuing NAIS,Advanced Traceability and No Traceability options differently. Producers with pre-mises registered in NAIS are more likely to be in class 1 (47% of producers) andprefer Advanced Traceability to NAIS and NAIS to No Traceability. Producers
148 Lee L. Schulz and Glynn T. Tonsor
� 2009 The Authors. Journal compilation � 2009 The Agricultural Economics Society.

Table
3
Model
estimates
Parameter
MNL
LCM
–three-class
model
Class
1:Premises
Registered
Class
2:Premises
NotRegistered
Class
3:Auction
Users
Utility
functioncoefficients
Premium
⁄Discount
0.0514***(0.0002)
0.0984***(0.0004)
0.0473***(0.0011)
0.7007***(0.0032)
NoTraceability
0.6974***(0.0049)
)0.3202***(0.0074)
4.9593***(0.0232)
0.9927***(0.0215)
AdvancedTraceability
)0.3648***(0.0047)
0.8267***(0.0044)
0.4274***(0.0237)
)12.2859***(0.0479)
Private-Industry
Managing
0.0147***(0.0025)
)0.9508***(0.0050)
0.2362***(0.0129)
0.7225***(0.0324)
Private-N
otIndustry
Managing
0.1949***(0.0025)
1.5618***(0.0078)
0.4119***(0.0126)
)2.0680***(0.0332)
ProductionPracticeInform
ation
0.9893***(0.0056)
0.9131***(0.0188)
3.5759***(0.0164)
4.4320***(1.3363)
Perform
ance
⁄Genetic
Inform
ation
0.9302***(0.0054)
)2.3359***(0.0132)
4.9217***(0.0171)
10.2259***(0.0513)
HealthRecords
)1.1650***(0.0074)
1.3874***(0.0234)
)8.5218***(0.0448)
)10.1965***(1.7455)
AdvancedTraceability
·Auctions
)0.3155***(0.0038)
NoTraceability
·Auctions
)0.3030***(0.0043)
AdvancedTraceability
·NAIS
Premises
0.1982***(0.0034)
NoTraceability
·NAIS
Premises
)1.3473***(0.0041)
Class
mem
bership
coefficients
Constant
0.2329***(0.0081)
)0.1276***(0.0096)
0.0000**(0.0000)
NAIS
Premises
0.8739***(0.0080)
)0.8159**(0.0099)
0.0000**(0.0000)
Auctions
)0.4447***(0.0076)
)0.0251***(0.0093)
0.0000**(0.0000)
Latentclass
probability
0.467
0.224
0.308
Notes:ModelswereestimatedusingNLOGIT
4.0.Standard
errors
are
presentedin
parenthesis.Class
mem
bership
coefficients
are
defined
asshown
inTable
1.Log-likelihoodfunctionsfortheMNL
andLCM
modelswere
)2,283,880and
)1,550,196,respectively.***1%
,**5%
,*10%
significance
levels.
149Cow-Calf Producer Preferences for Voluntary Traceability Systems
� 2009 The Authors. Journal compilation � 2009 The Agricultural Economics Society.
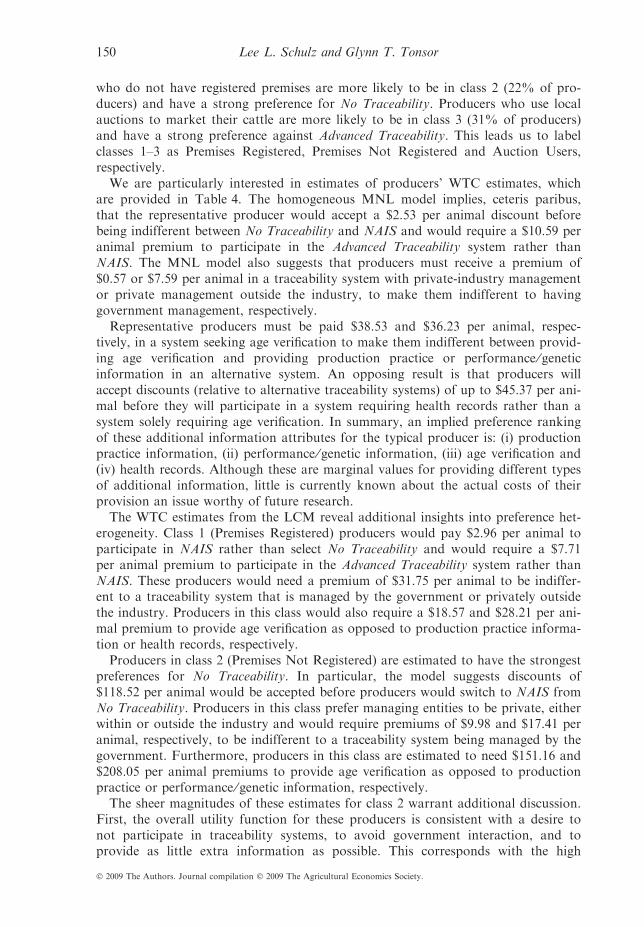
who do not have registered premises are more likely to be in class 2 (22% of pro-ducers) and have a strong preference for No Traceability. Producers who use localauctions to market their cattle are more likely to be in class 3 (31% of producers)and have a strong preference against Advanced Traceability. This leads us to labelclasses 1–3 as Premises Registered, Premises Not Registered and Auction Users,respectively.We are particularly interested in estimates of producers’ WTC estimates, which
are provided in Table 4. The homogeneous MNL model implies, ceteris paribus,that the representative producer would accept a $2.53 per animal discount beforebeing indifferent between No Traceability and NAIS and would require a $10.59 peranimal premium to participate in the Advanced Traceability system rather thanNAIS. The MNL model also suggests that producers must receive a premium of$0.57 or $7.59 per animal in a traceability system with private-industry managementor private management outside the industry, to make them indifferent to havinggovernment management, respectively.Representative producers must be paid $38.53 and $36.23 per animal, respec-
tively, in a system seeking age verification to make them indifferent between provid-ing age verification and providing production practice or performance ⁄geneticinformation in an alternative system. An opposing result is that producers willaccept discounts (relative to alternative traceability systems) of up to $45.37 per ani-mal before they will participate in a system requiring health records rather than asystem solely requiring age verification. In summary, an implied preference rankingof these additional information attributes for the typical producer is: (i) productionpractice information, (ii) performance ⁄genetic information, (iii) age verification and(iv) health records. Although these are marginal values for providing different typesof additional information, little is currently known about the actual costs of theirprovision an issue worthy of future research.The WTC estimates from the LCM reveal additional insights into preference het-
erogeneity. Class 1 (Premises Registered) producers would pay $2.96 per animal toparticipate in NAIS rather than select No Traceability and would require a $7.71per animal premium to participate in the Advanced Traceability system rather thanNAIS. These producers would need a premium of $31.75 per animal to be indiffer-ent to a traceability system that is managed by the government or privately outsidethe industry. Producers in this class would also require a $18.57 and $28.21 per ani-mal premium to provide age verification as opposed to production practice informa-tion or health records, respectively.Producers in class 2 (Premises Not Registered) are estimated to have the strongest
preferences for No Traceability. In particular, the model suggests discounts of$118.52 per animal would be accepted before producers would switch to NAIS fromNo Traceability. Producers in this class prefer managing entities to be private, eitherwithin or outside the industry and would require premiums of $9.98 and $17.41 peranimal, respectively, to be indifferent to a traceability system being managed by thegovernment. Furthermore, producers in this class are estimated to need $151.16 and$208.05 per animal premiums to provide age verification as opposed to productionpractice or performance ⁄genetic information, respectively.The sheer magnitudes of these estimates for class 2 warrant additional discussion.
First, the overall utility function for these producers is consistent with a desire tonot participate in traceability systems, to avoid government interaction, and toprovide as little extra information as possible. This corresponds with the high
150 Lee L. Schulz and Glynn T. Tonsor
� 2009 The Authors. Journal compilation � 2009 The Agricultural Economics Society.

Table
4
Producerwillingness-to-changeestimates
MNL
LCM
–three-class
model
Class
1:Premises
Registered
Class
2:Premises
NotRegistered
Class
3:Auction
Users
NoTraceability(vs.NAIS)
2.53[2.45,2.61]
2.96[2.84,3.08]
118.52[113.91,123.66]
)0.50[)0.52,)0.50]
AdvancedTraceability(vs.NAIS)
)10.59[)10.69,)10.47]
7.71[7.58,7.84]
9.12[7.96,10.23]
)17.32[)17.46,)17.19]
Private-Industry
(vs.Government)
0.57[0.39,0.76]
)19.33[)19.59,)19.07]
9.98[8.79,11.16]
2.06[1.88,2.22]
Private-N
otIndustry
(vs.Government)
7.59[7.36,7.82]
31.75[31.31,32.15]
17.41[16.20,18.78]
)5.90[)6.09,)5.70]
ProductionPracticeInform
ation
(vs.AgeVerification)
38.53[38.10,38.96]
18.57[17.78,19.33]
151.16[145.53,157.36]
12.65[5.04,20.22]
Perform
ance
⁄Genetic
Inform
ation
(vs.AgeVerification)
36.23[35.75,36.73]
)47.49[)48.18,)46.91]
208.05[198.47,218.45]
29.19[28.83,29.40]
HealthRecords
(vs.AgeVerification)
)45.37[)45.94,)44.77]
28.21[27.27,29.29]
)360.24[)375.82,)345.92]
)29.11[)38.87,)18.72]
Notes:Estim
atesare
$per
anim
alandsimulated95%
confidence
intervals(identified
using1,000Krinsky–Robbsimulations)
are
presentedin
brackets.Please
referto
section2.2
forthediscussionregardingwillingnessto
change.
151Cow-Calf Producer Preferences for Voluntary Traceability Systems
� 2009 The Authors. Journal compilation � 2009 The Agricultural Economics Society.

probability of these producers not having their premises currently registered withUSDA (Table 3). These inferences may also reflect ‘protest responses’.10 For instance,Boyle (2003) suggests respondents may provide protest answers in a strategic movehoping to change the provision of the good in question. In our context, producersin class 2 may be exaggerating their preferences with the goal of influencing policythey believe may be informed by this research. Although unable to identify the par-ticular reasons underlying the magnitudes stated by these producers, we are confi-dent that these producers strongly dislike the idea of traceability participation ingeneral, and cooperation with government entities in particular.The third set of producers (Auction Users) are estimated to have the strongest
preferences for not adopting Advanced Traceability. In particular, the model sug-gests premiums of $17.32 per animal would be necessary before producers wouldswitch from NAIS to Advanced Traceability. Conversely, these producers are ratherindifferent between NAIS and No Traceability participation ($0.50 per animal dif-ference). These producers prefer the managing entity to be private and within theindustry and would require a premium of $2.06 per animal to be indifferent betweenprivate-industry and government management. Producers in this class would require$12.65 and $29.19 per animal premiums to provide age verification as opposed toproduction practice or performance ⁄genetic information, respectively. Given a pre-mium of $29.11 per animal, these producers would be indifferent to providinghealth records or age verification.In summary, cow-calf producers are notably heterogeneous in the preferences for
traceability systems and their WTA discounts to sustain participation in their pre-ferred traceability programs. To assess the implications of these producer prefer-ences on the industry at the national level, we now turn to examining their impacton likely participation rates in different traceability systems as well as the producerwelfare impacts of alternative policy scenarios.
3.1. Forecasts of voluntary participation rates
Premise registration, the foundation of NAIS, was originally targeted for 100%compliance by 2009, but the USDA conceded that due to the voluntary nature ofNAIS the original targets were unattainable (USDA, 2007). USDA (2008a) cur-rently has goals for NAIS participation of 35% and 60% of the 2008 calf crop byOctober 2009 and October 2010, respectively. Without mandating, producers will beslower to adopt and fewer will adopt identification and tracing technology (Schroe-der et al., 2009). Thus, the long-term goals of NAIS participation are probablyunattainable, as slow and small adoption rates make it difficult, especially for smal-ler firms in industry, to know what direction to head in terms of adding or not add-ing animal identification and recording services (Schroeder et al., 2009).To assess the viability of these goals, we first identify the forecasts implied by our
models at the mean of all variables. Second, we consider varying the premium forAdvanced systems and the discount for choosing No Traceability to examine howtraceability choices vary given alternative free-market price incentives in the currentlegislative environment of voluntary traceability.
10 There is an extensive literature on ‘protest responses’ in contingent valuation and CE appli-cations. A solid review is provided by Meyerhoff and Liebe (2008) for interested readers.
152 Lee L. Schulz and Glynn T. Tonsor
� 2009 The Authors. Journal compilation � 2009 The Agricultural Economics Society.

The MNL model is again presented as a benchmark comparison of forecast, asan example of homogeneous producer preferences. Using MNL estimates and hold-ing all traceability attributes at their mean values (Figure 1) producers are 26.2%likely to participate in NAIS, 17.2% likely to participate in Advanced Traceabilityand 56.6% likely to choose No Traceability. It should be noted that this estimate of26.2% NAIS participation is rather consistent with current USDA statistics(USDA, 2008a). The LCM estimates provide forecasts for distinct producer classes.Producers in classes 1–3 are 21.2%, 0.4% and 90.4% likely to participate in NAIS,respectively, and 21.7%, 98.9% and 9.6% likely to choose No Traceability(Figure 1).To assess how producers may update their traceability choices in a market char-
acterised by different price incentives, we also examined increasing premiums inAdvanced systems and discounts for choosing No Traceability. Figure 2 shows thatthe MNL model implies a $27 per animal premium for Advanced Traceability par-ticipation in order to reach a goal of 60% traceability participation (either in NAISor Advanced).11 On the other hand, Figure 3 shows that a $16 per animal discountfor not participating in any traceability system would achieve the 60% goal.Utilising the LCM estimates and varying the premium for Advanced Traceability
participation, Figure 4 shows that producers in class 1 would already have 75%participation in NAIS or an Advanced system with no premium at all; producers inclass 2 would require a premium of $116 per animal for participating in anAdvanced system before 60% would be identified, whereas producers in class 3already have 90% participation in NAIS or an Advanced system with no premiumat all.Varying the discount for non-participation in any traceability system (Figure 5)
shows that producers in class 1 would have 73% participation in NAIS or anAdvanced system with no discounts; producers in class 2 would need to be dis-counted $106 per animal for non-participation before 60% would be identified,whereas producers in class 3 would only require discounts of $0.10 per animalbefore the goal of 60% identified.
0%MNL
26.2
%17
.2%
56.6
%
21.2
%57
.1%
21.7
%
0.4%
0.0% 9.
6%
0.7%
98.9%
NAIS
Advanced traceability
No traceability
90.4%
Class 1“Premisesregistered”
Class 2“Premises
notregistered”
Class 3“Auctionusers”
10%20%
Par
tici
pat
ion
30%40%50%60%70%80%90%
100%
Figure 1. Mean participation rates of producers
11Here, we assume, particularly under voluntary NAIS regulation, that participation in eitherNAIS or Advanced Traceability systems would appease the USDA goal.
153Cow-Calf Producer Preferences for Voluntary Traceability Systems
� 2009 The Authors. Journal compilation � 2009 The Agricultural Economics Society.

Collectively, this suggests voluntary participation in traceability programmesdeemed undesirable to the representative cow-calf producer may be accomplishedby markets offering premiums for participation or penalties for non-participants.Our analysis also suggests that producers in classes 1 and 3 have preferences gener-ally consistent with USDA’s goals, whereas producers in class 2 are likely tostrongly resist efforts to meet USDA’s current traceability goals.
3.2. Producer welfare effects
Producer welfare effects were estimated reflecting the amount necessary to make aproducer equally well-off in two alternative situations that cow-calf producers mayface in future. More specifically, situations in which producers face all three trace-ability options (i.e. NAIS, Advanced and No Traceability) vs. situations in which theNo Traceability option is removed or both No Traceability and Advanced Traceabi-lity are removed were considered. The latter case would be a situation of mandatoryNAIS Traceability. These remain realistic possibilities, making them valid scenariosto consider.Welfare estimates utilising the MNL model (Table 5) suggests removal of the No
Traceability option results in an estimated welfare loss of $9.82 per animal for therepresentative producer, whereas imposing mandatory NAIS generates a welfare
0%
0 10 20 30 40 50
Discount ($/Animal) for no traceability
60 70 80 90 100
NAIS
Advanced traceability
No traceability
10%
Par
tici
pat
ion
20%
30%
40%
50%
60%
70%
80%
90%
100%
Figure 3. Participation rate vs. market discounts (MNL estimates)
0%0 10 20 30 40 50 60 70 80 90 100
NAIS
Advanced traceability
No traceability
10%20%30%40%
Par
tici
pat
ion
Premium ($/Animal) for advanced traceability
50%60%70%80%90%
100%
Figure 2. Participation rate vs. market premiums (MNL estimates)
154 Lee L. Schulz and Glynn T. Tonsor
� 2009 The Authors. Journal compilation � 2009 The Agricultural Economics Society.

loss of $20.57 per animal. Utilising the LCM model (Table 5), the welfare estimateswere calculated for three distinct producer classes. Producers in class 1 would expe-rience a welfare loss of $2.32 per animal if the No Traceability option was removedand face a welfare loss of $19.10 per animal if NAIS was the only option available.Class 2 producers are far more negatively impacted by reduced choice sets. Theseproducers face a welfare loss of $89.89 per animal for the removal of No Traceab-ility and a welfare loss of $118.82 per animal for a situation in which only manda-tory NAIS is available.12 Class 3 producers would have a welfare loss of $0.76 peranimal if the No Traceability option was removed or if the No Traceability andAdvanced Traceability options were both removed.Comparison of welfare effect estimates across the two models shows notable dif-
ferences. The segmentation of the LCM reveals varying degrees of the welfareeffects, as producers in class 1 experience relatively small impacts when only losing
0%
0 10 20 30 40 50 60 70 80 90 100
0 10 20 30 40 50 60 70 80 90 100
0 10 20 30 40 50 60 70 80 90 100
NAIS
AdvancedtraceabilityNo traceability
NAIS
AdvancedtraceabilityNo traceability
NAIS
AdvancedtraceabilityNo traceability
20%
40%
60%
80%
100%
Class 1 “Premises registered”
Class 2 “Premises not registered”
Class 3 “Auction users”
Premium ($/Animal) for advanced traceability
Premium ($/Animal) for advanced traceability
Premium ($/Animal) for advanced traceability
Par
tici
pat
ion
0%
20%
40%
60%
80%
100%
0%
20%
40%
60%
80%
100%
Par
tici
pat
ion
Par
tici
pat
ion
Figure 4. Participation rate vs. market premiums (LCM estimates)
12As previously noted, the welfare estimates for these producers may well reflect protestbehaviour. Nonetheless, the substantial magnitude of these estimates relative to producers inother segments documents the diverse welfare impacts which would be experienced by pro-ducers with heterogeneous preferences.
155Cow-Calf Producer Preferences for Voluntary Traceability Systems
� 2009 The Authors. Journal compilation � 2009 The Agricultural Economics Society.

the No Traceability option, but experience notably larger effects once both the Noand Advanced Traceability options are removed. Within class 3, producers’ welfareeffects are relatively small in both situations. Conversely, producers within class 2
Class 1 “Premises registered”
Class 2 “Premises not registered”
Class 3 “Auction users”
Par
tici
pat
ion
Discount ($/Animal) for no traceability
100%80%60%40%20%
0%
Par
tici
pat
ion
100%80%60%40%20%
0%
Par
tici
pat
ion
100%80%60%40%20%
0%
0
–10
–20
–30
–40
–50
–60
–70
–80
–90
–100
Discount ($/Animal) for no traceability
0
–10
–20
–30
–40
–50
–60
–70
–80
–90
–100
Discount ($/Animal) for no traceability
0
–10
–20
–30
–40
–50
–60
–70
–80
–90
–100
NAIS
AdvancedtraceabilityNo traceability
NAISAdvancedtraceabilityNo traceability
NAIS
AdvancedtraceabilityNo traceability
Figure 5. Participation rate vs. market discounts (LCM estimates)
Table 5
Welfare effects estimates
MNL
LCM – three-class model
Class 1: PremisesRegistered
Class 2: PremisesNot Registered
Class 3: AuctionUsers
Removal ofNo Traceability
Option
)9.82[)9.89, )9.72]
)2.32[)2.34, )2.30]
)89.89[)93.46, )86.66]
)0.76[)0.77, )0.75]
MandatoryNAIS
Traceability
)20.57[)20.76, )20.40]
)19.10[)19.29, )18.91]
)118.82[)123.98, )114.19]
)0.76[)0.77, )0.75]
Notes: Estimates are $ per animal. Values in brackets are 95% confidence intervals, identifiedusing 1,000 Krinsky–Robb simulations.
156 Lee L. Schulz and Glynn T. Tonsor
� 2009 The Authors. Journal compilation � 2009 The Agricultural Economics Society.

experience relatively large welfare effects for both situations that exceed those ofthe other two LCM classes and those suggested by the MNL. Collectively, theseresults provide further evidence for the importance of model specification andconsideration of producer preference heterogeneity. Moreover, these estimates areconsistent with the mixed success that USDA has had to date in obtaining volun-tary participation in NAIS.
4. Implications
The results and associated inferences regarding producer preferences provide animproved understanding of how traceability systems should be designed and pro-moted in order to improve voluntary participation rates. To summarise the implica-tions of the WTC findings, two specific cases that may benefit from this researchare discussed. The first case would be a scenario of developing a voluntary trace-ability system that is fairly similar to NAIS in that there are limited ‘additionalinformation pieces’ required for producer participation. The purpose of a heavilystructured (e.g. little to no variability in the trade-off between participation require-ments and per animal compensation) traceability system could be to enhance theentire industry’s ability to quickly identify and contact animal premises, promoteanimal identification and develop animal movement and tracing capabilities. Thesegoals would be consistent with those of animal health management and responseobjectives held by USDA in developing and promoting NAIS.Alternatively, more advanced systems that enable producers or firms further
down the supply chain to use traceability information could be designed as market-ing tools. For instance, a traceability system could be designed to capture the pro-duction practice information most desired by a select consumer group. Provision ofthis information would require cooperation and compensation of all players in thesupply chain, with benefits reflecting the perceived final market value of the infor-mation to consumers. For a producer this traceability information would giveadded value to the cattle they market, in exchange for their willing participation.For a retailer this traceability information provides value as consumers may bewilling to pay for these added attributes.Our results suggest that developers of a system who are primarily interested in
achieving participation rate goals (e.g. as opposed to alternative national herdhealth goals held by USDA) can expect systems with managing entities beingprivate and not within the industry to enhance participation by producers. Further-more, given that NAIS implicitly has government management, these results suggestthat producer participation may have been higher with private management. How-ever, care should be taken in this assessment as the USDA, in managing NAIS,certainly has objectives beyond simply maximising voluntary participation rates(e.g. animal herd health surveillance and response ability enhancement). Nonethe-less, the results indicate a trade-off of participation rate and managing entity doesexist for cow-calf producers.In designing a private traceability system, altering the composition of the addi-
tional information required for participation is found to significantly impact volun-tary participation. Advanced systems that only require production practiceinformation or performance ⁄genetic information, as opposed to age verification,would be supported. Producers would require significant premiums to provide ageverification as opposed to production practice information and performance ⁄genetic
157Cow-Calf Producer Preferences for Voluntary Traceability Systems
� 2009 The Authors. Journal compilation � 2009 The Agricultural Economics Society.

information. As such, the cost of requiring producers possessing these preferencesto provide age verification seem likely to outweigh the benefits of increasing the par-ticipation in many systems. Therefore, traceability system designers need to carefullyoutweigh the anticipated benefits of this age verification information (e.g. enhancedvalue of marketing verified younger animals) with the compensation that may berequired to get producers to participate. Producers have a preference for providingage verification as opposed to health records. This suggests that for systems consid-ering verification of animal health throughout the supply chain to be a higher prior-ity than age verification, target marketing may be needed.The welfare effect estimates of $89.89 and $118.82 per animal for removing the
No Traceability option and imposing mandatory traceability, respectively, may belarge enough that increasing support for traceability or mandatory traceabilitywould not be feasible in class 2 (i.e. producers who do not have registered premisesand hold a strong preference for No Traceability). Stated differently, these largeestimates suggest that these producers will probably not be willing to voluntarilyparticipate in any traceability system. A prerequisite of their participation may wellbe a market characterised by mandated traceability, either by the government of theprivate sector that simply chooses to no longer accept untraced animals. However,producers in class 2 only comprise 22% of the representative producers. Thus, it isconceivable that the USDA could increase the level of participation to 78% by tar-geting producers in classes 1 and 3. Participation in NAIS or advanced traceabilitysystems could be improved by offering relatively small premiums to producers forparticipation in traceability systems. Alternatively, discounts for non-participationby the marketplace may achieve a similar increase in participation. Nonetheless,from an animal herd health perspective, it seems optimistic to assume that ‘all ani-mals are equal’ in the need to be included in nationwide traceability systems. Thatis, having NAIS simply targeting the ‘easiest 78% of producers’ to meet enrolmentgoals may not be ideal from a national herd health and animal disease perspective.The welfare effect estimates, and associated inferences regarding implications of
producers’ realising a reduced set of voluntary system options (e.g. being forced toparticipate in either Advanced Traceability and ⁄or NAIS), provide an improvedunderstanding of how requiring traceability or imposing mandatory NAIS affectsproducers differently.
5. Conclusions
With traceability becoming ever more important within the beef industry for verifi-cation of animal health as well as marketing purposes, the need for traceability sys-tems that are attractive to producers as well as meet the goals that they weredesigned for is evident. Traceability systems that are most aligned with the prefer-ences of cow-calf producers will enjoy higher voluntary participation. Subsequently,a majority of the past research has sought to analyse consumers’ preferencestowards voluntary traceability systems; however, there has been little research onproducers’ preferences towards these same traceability systems.This article utilised models examining cow-calf producers’ preferences for trace-
ability systems and system attributes. Heterogeneity does exist between cow-calfproducers and their preferences for traceability systems. Producers were found to besensitive to price, managing entity and information requirements in comparing vol-untary traceability systems. We also found voluntary participation in traceability
158 Lee L. Schulz and Glynn T. Tonsor
� 2009 The Authors. Journal compilation � 2009 The Agricultural Economics Society.

programmes to be influenced by markets offering premiums for participation orpenalties for non-participants. Furthermore, removal of traceability options contrib-utes negatively to the economic welfare of all producers but especially those produc-ers with strong preferences to avoid governmental interaction or provision ofadditional information about their operations.This work should be beneficial to private entities interested in recruiting cow-calf
producers into advanced traceability programmes. Results should also be valuable toUSDA personnel in future resource allocations aimed at improving NAIS participa-tion rates, in examining producer welfare effects of mandatory traceability regulationsand other issues hinging on heterogeneous preferences of livestock producers. Thewelfare effects of alternative legislative adjustments provided here should be comparedin future work examining the relationship with ‘the cost of doing nothing’, such as theindustry-wide effects of not having traceability systems in place mitigating animalhealth and related risks (Tonsor and Schroeder, 2006). Such work should shed addi-tional light on the inherent public good, industry-wide consequences of relying on avoluntary adoption system aimed at highly heterogeneous producers. Future workwould be well served to examine other sectors (e.g. background or feedlot) of the cat-tle supply chain and other species (e.g. swine or poultry) at the heart of livestock trace-ability discussions in the USA. Moreover, the framework demonstrated here with UScow-calf producers could valuably be extended to livestock producers in other coun-tries facing alternative national animal identification or traceability programmes. Thatis, producers in the European Union, Canada, Australia and Brazil each face differentsituations worthy of comparable investigation.
References
Adamowicz, W., Boxall, R., Williams, M. and Louviere, J. ‘Stated preference approaches formeasuring passive use values: Choice experiments and contingent valuation’, American
Journal of Agricultural Economics, Vol. 80, (1998) pp. 64–75.Alfnes, F. ‘Stated preferences for imported and hormone-treated beef: Application of a mixedlogit model’, European Review of Agricultural Economics, Vol. 31, (2004) pp. 19–37.
Bailey, D. ‘Political economy of the U.S. cattle and beef industry: Innovation adoption and
implications for the future’, Journal of Agricultural and Resource Economics, Vol. 32,(2007) pp. 403–416.
Bailey, D. and Slade, J. ‘Factors influencing support for a national animal identification sys-
tem for cattle in the United States’, Paper presented at AAEA annual meeting, Denver,CO, 1–4 August, 2004.
Bockstael, N. E. and Strand, I. E., Jr ‘The effects of common sources of regression error on
benefit estimates’, Land Economics, Vol. 63, (1987) pp. 11–20.Boxall, P. C. and Adamowicz, W. L. ‘Understanding heterogeneous preferences in randomutility models: A latent class approach’, Environmental and Resource Economics, Vol. 23,(2002) pp. 421–446.
Boyle, K. J. ‘Contingent valuation in practice’, in P. A. Champ, K. J. Boyle and T. C. Brown(eds.) A Primer on Nonmarket Valuation (Dordrecht: Kluwer, 2003, 111–170).
Buhr, B. L. Traceability, Trade and COOL: Lessons from the EU Meat and Poultry Industry,
International Agricultural Trade Research Consortium, Pullman. Working Paper. Interna-tional Agricultural Trade Research Consortium no. 03-5, 2003. Available at http://purl.umn.edu/14577. Last accessed on 13 July 2009.
Cattle Network. Five Minutes With Dr. John Wiemers, USDA, APHIS, NAIS (2008). Avail-able at: http://www.cattlenetwork.com/content.asp?ContentId=194952. Last accessed5 February 2008.
159Cow-Calf Producer Preferences for Voluntary Traceability Systems
� 2009 The Authors. Journal compilation � 2009 The Agricultural Economics Society.

Cummings, R. G. and Taylor, L. O. ‘Unbiased value estimates for environmental goods: A
cheap talk design for the contingent valuation method’, American Economic Review, Vol.89, (1999) pp. 649–665.
Davis, C. G. and Gillespie, J. M. ‘Factors affecting the selection of business arrangements by
U.S. hog farmers’, Review of Agricultural Economics, Vol. 29, (2007) pp. 331–348.Dickinson, D. and Bailey, D. ‘Meat traceability: Are U.S. consumers willing to pay for it?’Journal of Agriculture and Resource Economics, Vol. 27, (2002) pp. 348–364.
Dickinson, D. L., Hobbs, J. E. and Bailey, D. A Comparison of U.S. and Canadian Consum-ers’ Willingness to Pay for Red-Meat Traceability, Paper presented at AAEA annual meet-ing. Montreal Canada, 27–30 July 2003.
Golan, E., Krissoff, B., Kuchler, F., Calvin, L., Nelson, K. and Price, G. Traceability in the
US Food Supply: Economic Theory and Industry Studies. ERS For. Agr. Econ. Rep. 830(Washington, DC: US Department of Agriculture, 2004).
Gracia, A. and Zeballos, G. ‘Attitudes of retailers and consumers toward the EU traceability
and labeling system for beef’, Journal of Food Distribution Research, Vol. 36, (2005)pp. 45–56.
Gregory, A. Optimal Economic Design of Mail Surveys: Influences of Response Rates and the
Impact of Responses to a Second Mailing (PhD dissertation; Kansas State University,2008).
Key, N. ‘How much do farmers value their independence?’ Agricultural Economics, Vol. 33,(2005) pp. 117–126.
Krinsky, I. and Robb, A. L. ‘On approximating the statistical properties of elasticities’,Review of Economics and Statistics, Vol. 64, (1986) pp. 715–719.
Kuhfeld, W. F., Tobias, R. D. and Garratt, M. ‘Efficient experimental design with marketing
research applications’, Journal of Marketing Research, Vol. 31, (1994) pp. 545–557.Lusk, J. ‘Effects of cheap talk on consumer willingness-to-pay for golden rice’, AmericanJournal of Agricultural Economics, Vol. 85, (2003) pp. 840–856.
Lusk, J. and Rozan, A. ‘Public policy and endogenous beliefs: The case of geneticallymodified food’, Journal of Agricultural and Resource Economics, Vol. 33, (2008)pp. 270–289.
Lusk, J., Roosen, J. and Fox, J. ‘Demand for beef from cattle administered growth hormones
or fed genetically modified corn: A comparison of consumers in France, Germany, theUnited Kingdom, and the United States’, American Journal of Agricultural Economics, Vol.85, (2003) pp. 16–29.
Lusk, J. L., Norwood, F. B. and Pruitt, J. R. ‘Consumer demand for a ban on antibioticdrug use in pork production’, American Journal of Agricultural Economics, Vol. 88, (2006)pp. 1015–1033.
Meyerhoff, J. and Liebe, U. ‘Do protest responses to a contingent valuation question and achoice experiment differ?’ Environmental Resource Economics, Vol. 39, (2008) pp. 433–446.
Morey, E. R. ‘TWO RUMS un CLOAKED: Nested-logit models on site choice and nested-logit models of participation and site choice’, in J. A. Herriges and C. L. Kling (ed.), Valu-
ing Recreation and the Environment (Northampton, MA: Edward Elgar, 1999, 65–120).Murphy, R. G. L., Pendell, D. L., Morris, D. L., Scaga, J. A., Belk, K. E. and Smith, G. C.‘Review: Animal identification systems in North America’, Professional Animal Scientist,
Vol. 24, (2008) pp. 277–286.Murphy, R. G. L., Pendell, D. L. and Smith, G. C. ‘Lessons from the Canadian cattle indus-try for developing the National Animal Identification System’, International Food and Agri-
business Management Review, Vol. 12, (2009) pp. 1–18.Nahuelhual, L., Loureiro, M. L. and Loomis, J. ‘Using random parameters to account forheterogeneous preferences in contingent valuation of public open space’, Journal of Agri-cultural and Resource Economics, Vol. 29, (2004) pp. 537–552.
Norwood, F. B., Winn, C., Chung, C. and Ward, C. E. ‘Designing a voluntary beef check-off’, Journal of Agricultural and Resource Economics, Vol. 31, (2006) pp. 74–92.
160 Lee L. Schulz and Glynn T. Tonsor
� 2009 The Authors. Journal compilation � 2009 The Agricultural Economics Society.

Park, T., Loomis, J. and Creel, M. ‘Confidence intervals for evaluating benefits from dichoto-
mous choice contingent valuation studies’, Land Economics, Vol. 67, (1991) pp. 64–73.Rigby, D. and Burton, M. ‘Preference heterogeneity and GM food in the UK’, EuropeanReview of Agricultural Economics, Vol. 32, (2005) pp. 269–288.
Scarpa, R. and DelGiudice, T. ‘Market segmentation via mixed logit: Extra virgin olive oil inurban Italy’, Journal of Agricultural and Food Industrial Organization, Vol. 2, (2004) pp. 1–18.
Schroeder, T. C., Blasi, D. A., Brester, G. W., Crosby, C., Dhuyvetter, K. C., Freeborn, J.,Pendell, D. L., Smith, G. C., Stroade, J. and Tonsor, G. T. Benefit Cost Analysis of theNational Animal Identification System (2009). Report for US Department of Agriculture,Animal and Plant Health Inspection available at: http://animalid.aphis.usda.gov/nais/
naislibrary/documents/plans_reports/Benefit_Cost_Analysis_NAIS.pdf. Last accessed on 20May 2009.
Schulz, L. L. Cow-Calf Producer Preferences for Voluntary Traceability Systems and System
Attributes (MS Thesis: Michigan State University, 2008).Schulz, L. L. and Tonsor, G. T. ‘ID feedback’, BEEF Magazine, Vol. August, (2008) pp. 52–54.
Small, K. A. and Rosen, H. S. ‘Applied welfare economics with discrete choice models’, Eco-nometricia, Vol. 49, (1978) pp. 43–46.
Smith, G. C., Tatum, J. D., Belk, K. E., Scanga, J. A., Grandin, T. and Sofos, J. N. ‘Trace-ability from a U.S. perspective’, Meat Science, Vol. 71, (2005) pp. 174–193.
Souza Monteiro, D. M. and Caswell, J. A. The Economics of Implementing Traceability inBeef Supply Chains: Trends in Major Producing and Trading Countries (Amherst, MA:WP-06 Department of Resource Economics, University of Massachusetts, June 2004).
Tonsor, G. T. and Schroeder, T. C. ‘Livestock identification: Lessons for the U.S. beef indus-try from the Australian system’, Journal of International Food and Agribusiness Marketing,Vol. 18, (2006) pp. 103–118.
Tonsor, G. T., Schroeder, T. C., Fox, J. A. and Biere, A. ‘European preferences for beefsteak attributes’, Journal of Agricultural and Resource Economics, Vol. 30, (2005) pp. 367–380.
US Department of Agriculture, Animal and Plant Health Inspection Service. National Animal
Identification System (NAIS) – A User Guide and Additional Information Resources (Wash-ington, DC: USDA, December 2007).
US Department of Agriculture, Animal and Plant Health Inspection Service. A Business Plan
to Advance Animal Disease Traceability (Washington, DC: USDA, September 2008a).US Department of Agriculture, Animal and Plant Health Inspection Service. USDA’s 840Animal Identification Solution Offers Producers One Number with Many Uses (Washington,
DC: USDA, December 2008b).US Department of Agriculture, Animal and Plant Health Inspection Service. Premise Regis-tration Update (2009). Statistics available at: http://animalid.aphis.usda.gov/nais/premises_id/update.shtml. Last accessed 17 July 2009.
Appendix: Instructions and description provided to choice experiment respondents
Following are four scenarios, each containing three different options for you toselect from where two options are voluntary traceability systems you could partici-pate in. These two systems would require you to: (i) provide basic contact informa-tion on your farm ⁄premises and (ii) individually identify your livestock (prior toany sales transactions or movement to other premises) using approved radio fre-quency identification devices (RFID). The third option (No Traceability) is an alter-native where you choose not to participate in either of the two presented
161Cow-Calf Producer Preferences for Voluntary Traceability Systems
� 2009 The Authors. Journal compilation � 2009 The Agricultural Economics Society.

traceability systems. For your information in interpreting the alternative traceabilityoptions please carefully read the following descriptions:NAIS Traceability: refers to the National Animal Identification System (NAIS).
• The NAIS program consists of three components:
s Premise registration requires you to provide basic contact information.s Animal identification provides you with a uniform numbering system for identi-
fying your animals and linking them to a birthplace ⁄premises of origin.s Animal tracing allows you to choose an animal tracking database (owned and
operated by private industry groups or States) and report certain animal movementsthat might pose a significant risk of disease transmission.• USDA ensures producers that it will protect private information from disclosure.
Advanced Traceability: Same basic participation requirements as NAIS Traceabilitybut also requires additional information which may include:
• Age Verification
s Production Practice Information (e.g. growth hormones and grass-fed diets)s Performance ⁄Genetic Information
• Health Certifications ⁄Vaccinations Records
s Random verification audits would be required to further validate consistencybetween on-farm practices and information maintained within the traceabilitysystem.
The entity managing each traceability system may take one of three forms:
• Government: entity such as the USDA;• Private-Industry: entity specialises in traceability specifically for the beef industry;• Private-Not Industry: entity specialises in traceability for multiple livestock species.
In addition to differences in requirements and goals of these alternatives, theseoptions differ in terms of the premium or discount (per head sold) you would receiveby selecting that alternative. These price adjustments to the market price range fromdiscounts of up to $15 per head to premiums of up to $15 per head. Negative num-bers indicate discounts and positive numbers indicate premiums.
162 Lee L. Schulz and Glynn T. Tonsor
� 2009 The Authors. Journal compilation � 2009 The Agricultural Economics Society.