
Covrig: A Framework for the Analysis of Code, Test, and ...
12
C OVRIG: A Framework for the Analysis of Code, Test, and Coverage Evolution in Real Software Paul Marinescu, Petr Hosek, Cristian Cadar Department of Computing Imperial College London, UK {p.marinescu,p.hosek,c.cadar}@imperial.ac.uk ABSTRACT Software repositories provide rich information about the construction and evolution of software systems. While static data that can be mined directly from version control systems has been extensively studied, dynamic metrics concerning the execution of the software have received much less attention, due to the inherent difficulty of running and monitoring a large number of software versions. In this paper, we present Covrig, a flexible infrastructure that can be used to run each version of a system in isolation and collect static and dynamic software metrics, using a lightweight virtual machine environment that can be deployed on a cluster of local or cloud machines. We use Covrig to conduct an empirical study examining how code and tests co-evolve in six popular open-source systems. We report the main characteristics of software patches, analyse the evolution of program and patch coverage, assess the impact of nondeterminism on the execution of test suites, and investigate whether the coverage of code containing bugs and bug fixes is higher than average. Categories and Subject Descriptors D.2.5 [Testing and Debugging]: Monitors; D.2.7 [Distribution, Maintenance, and Enhancement]: Version control General Terms Measurement, Reliability Keywords Patch characteristics, coverage evolution, latent patch cover- age, nondeterministic coverage, bugs and fixes. 1. INTRODUCTION Software repositories provide detailed information about the design and evolution of software systems. While there is a large body of work on mining software repositories—including a dedicated conference on the topic, the Working Conference on Mining Software Repositories (MSR)—past work has focused almost exclusively on static metrics (i.e. requiring no program execution). We suspect that the main reason behind the scarcity of studies focusing on dynamic metrics lies in the difficulty of running multiple software versions, 1 especially since doing so involves evolving dependencies and unstable (including non-compilable) versions. For example, prior work [41] cites the manual effort and the long time needed to run different revisions as the reason for reporting dynamic measurements for only a small number of versions. While static metrics can provide useful insights into the construction and evolution of software, there are many soft- ware engineering aspects which require information about software executions. For example, the research community has invested a lot of effort in designing techniques for im- proving the testing of software patches, ranging from test suite prioritisation and selection algorithms [11, 30, 35] to program analysis techniques for test case generation and bug finding [1, 2, 20, 21, 27, 28, 36, 40] to methods for surviving errors introduced by patches at runtime [14]. Many of these techniques depend on the existence of a manual test suite, sometimes requiring the availability of a test exercising the patch [24, 37], sometimes making assumptions about the stability of program coverage or external behaviour over time [14, 29], other times using it as a starting point for exploration [10, 16, 22, 39], and often times employing it as a baseline for comparison [3, 6, 9, 26]. However, despite the key role that test suites play in software testing, it is surprising how few empirical studies one can find in the research literature regarding the co-evolution of test suites and code and their impact on the execution of real systems. In this paper, we present Covrig 2 —an infrastructure for mining software repositories, which makes it easy to extract both static and dynamic metrics. Covrig makes use of lightweight virtual machine technology to run each version of a software application in isolation, on a large number of local or cloud machines. We use Covrig to conduct an empirical study examining how programs evolve in terms of code, tests and coverage. More precisely, we have analysed the evolution of six popular software systems with a rich development history over a combined period of twelve years, with the goal of answering the following research questions: 1 In this paper, we use the terms version and revision interchangeably. 2 The name emphasises one of the core aspects of the framework, its ability to measure coverage. Covrig also means bagel in Romanian. Permission to make digital or hard copies of all or part of this work for personal or classroom use is granted without fee provided that copies are not made or distributed for profit or commercial advantage and that copies bear this notice and the full citation on the first page. Copyrights for components of this work owned by others than ACM must be honored. Abstracting with credit is permitted. To copy otherwise, or republish, to post on servers or to redistribute to lists, requires prior specific permission and/or a fee. Request permissions from [email protected]. Copyright is held by the author/owner(s). Publication rights licensed to ACM. ISSTA’14, July 21–25, 2014, San Jose, CA, USA ACM 978-1-4503-2645-2/14/07 http://dx.doi.org/10.1145/2610384.2610419 C o nsi s ten t*C o mp l e te *W e l l D oc u m e nt e d * E a sy t o Reu s e * * Eva l uat e d * I SS T A * A rtifa ct * AEC 93
Transcript of Covrig: A Framework for the Analysis of Code, Test, and ...
COVRIG: A Framework for the Analysisof Code, Test, and Coverage Evolution
in Real Software
Paul Marinescu, Petr Hosek, Cristian CadarDepartment of Computing
Imperial College London, UK{p.marinescu,p.hosek,c.cadar}@imperial.ac.uk
ABSTRACTSoftware repositories provide rich information about theconstruction and evolution of software systems. While staticdata that can be mined directly from version control systemshas been extensively studied, dynamic metrics concerning theexecution of the software have received much less attention,due to the inherent difficulty of running and monitoring alarge number of software versions.In this paper, we present Covrig, a flexible infrastructure
that can be used to run each version of a system in isolationand collect static and dynamic software metrics, using alightweight virtual machine environment that can be deployedon a cluster of local or cloud machines.We use Covrig to conduct an empirical study examining
how code and tests co-evolve in six popular open-sourcesystems. We report the main characteristics of softwarepatches, analyse the evolution of program and patch coverage,assess the impact of nondeterminism on the execution oftest suites, and investigate whether the coverage of codecontaining bugs and bug fixes is higher than average.
Categories and Subject DescriptorsD.2.5 [Testing and Debugging]: Monitors;D.2.7 [Distribution, Maintenance, and Enhancement]:Version control
General TermsMeasurement, Reliability
KeywordsPatch characteristics, coverage evolution, latent patch cover-age, nondeterministic coverage, bugs and fixes.
1. INTRODUCTIONSoftware repositories provide detailed information about
the design and evolution of software systems. While there is a
Permission to make digital or hard copies of all or part of this work forpersonal or classroom use is granted without fee provided that copies arenot made or distributed for profit or commercial advantage and that copiesbear this notice and the full citation on the first page. To copy otherwise, torepublish, to post on servers or to redistribute to lists, requires prior specificpermission and/or a fee.ISSTA ’14, July 21-25, 2014, San Jose, CA, USACopyright 2014 ACM 978-1-4503-2645-2/14/07 ...$15.00.
large body of work on mining software repositories—includinga dedicated conference on the topic, the Working Conferenceon Mining Software Repositories (MSR)—past work hasfocused almost exclusively on static metrics (i.e. requiringno program execution). We suspect that the main reasonbehind the scarcity of studies focusing on dynamic metricslies in the difficulty of running multiple software versions,1
especially since doing so involves evolving dependencies andunstable (including non-compilable) versions. For example,prior work [41] cites the manual effort and the long timeneeded to run different revisions as the reason for reportingdynamic measurements for only a small number of versions.While static metrics can provide useful insights into the
construction and evolution of software, there are many soft-ware engineering aspects which require information aboutsoftware executions. For example, the research communityhas invested a lot of effort in designing techniques for im-proving the testing of software patches, ranging from testsuite prioritisation and selection algorithms [11, 30, 35] toprogram analysis techniques for test case generation and bugfinding [1, 2, 20, 21, 27, 28, 36, 40] to methods for survivingerrors introduced by patches at runtime [14]. Many of thesetechniques depend on the existence of a manual test suite,sometimes requiring the availability of a test exercising thepatch [24, 37], sometimes making assumptions about thestability of program coverage or external behaviour overtime [14, 29], other times using it as a starting point forexploration [10, 16, 22, 39], and often times employing itas a baseline for comparison [3, 6, 9, 26]. However, despitethe key role that test suites play in software testing, it issurprising how few empirical studies one can find in theresearch literature regarding the co-evolution of test suitesand code and their impact on the execution of real systems.In this paper, we present Covrig2—an infrastructure for
mining software repositories, which makes it easy to extractboth static and dynamic metrics. Covrig makes use oflightweight virtual machine technology to run each versionof a software application in isolation, on a large numberof local or cloud machines. We use Covrig to conduct anempirical study examining how programs evolve in terms ofcode, tests and coverage. More precisely, we have analysedthe evolution of six popular software systems with a richdevelopment history over a combined period of twelve years,with the goal of answering the following research questions:
1In this paper, we use the terms version and revision interchangeably.2The name emphasises one of the core aspects of the framework, itsability to measure coverage. Covrig also means bagel in Romanian.
Permission to make digital or hard copies of all or part of this work for personal orclassroom use is granted without fee provided that copies are not made or distributedfor profit or commercial advantage and that copies bear this notice and the full citationon the first page. Copyrights for components of this work owned by others than ACMmust be honored. Abstracting with credit is permitted. To copy otherwise, or republish,to post on servers or to redistribute to lists, requires prior specific permission and/or afee. Request permissions from [email protected] is held by the author/owner(s). Publication rights licensed to ACM.
ISSTA’14, July 21–25, 2014, San Jose, CA, USAACM 978-1-4503-2645-2/14/07http://dx.doi.org/10.1145/2610384.2610419
Consist
ent *Complete *
Well D
ocumented*Easyt
oR
euse* *
Evaluated
*ISSTA*Ar
tifact *AEC
93
RQ1: Do executable and test code evolve in sync?Are coding and testing continuous, closely linkedactivities? Or do periods of intense developmentalternate with periods of testing?
RQ2: How many patches touch only code, only tests,none, or both? Are most code patches accompaniedby a new or modified test case? How many patchesmodify neither executable code nor tests?
RQ3: What is the distribution of patch sizes? Howspread out is each patch through the code? Aremost patches small? How many different parts of thecode does a patch touch? What is the median numberof lines, hunks and files affected by a patch?
RQ4: Is test suite execution deterministic? Do testsfail nondeterministically? Does running the test suitemultiple times cover different lines of code?
RQ5: How does the overall code coverage evolve?Is it stable over time? Does the overall coverageincrease steadily over time, or does it remain con-stant? Are there revisions that significantly increaseor decrease coverage?
RQ6: What is the distribution of patch coverageacross revisions? What fraction of a patch is cov-ered by the regression test suite? Does patch coveragedepend on the size of the patch?
RQ7: What fraction of patch code is tested within afew revisions after it is added, i.e. what is thelatent patch coverage? Are tests exercising recentpatches added shortly after the patch was submitted?If so, how significant is this latent patch coverage?
RQ8: Are bug fixes better covered than other typesof patches? Are most fixes thoroughly exercised bythe regression suite? How many fixes are entirelyexecuted?
RQ9: Is the coverage of buggy code less than aver-age? Is code that contains bugs exercised less thanother changes? Is coverage a reasonable indicator ofcode quality?
Overall, the main contributions of this paper are:
(1) A software repository mining infrastructure called Cov-rig, which can be used to run software versions in isolation,using a lightweight virtual machine environment that can bedeployed on a private or public cloud.
(2) An analysis of the evolution of the execution of codeand test suites in six popular open-source software systemsover a combined period of twelve years. In particular, webelieve this is the first study that reports patch coverage andcoverage nondeterminism over a large number of programversions.
(3) A list of both theoretical and practical aspects relatedto mining dynamic information from software repositories,including revision granularity, non-compilable versions, andnondeterministic execution.
The rest of this paper is structured as follows. We firstdescribe the Covrig infrastructure in Section 2, and thenpresent our empirical study, structured around the researchquestions introduced above, in Section 3. We discuss relatedwork in Section 4 and conclude in Section 5.
DockerContainersC
onfig
urat
ion
Bug Data
Line Mapping
Git
PostProcessing Results
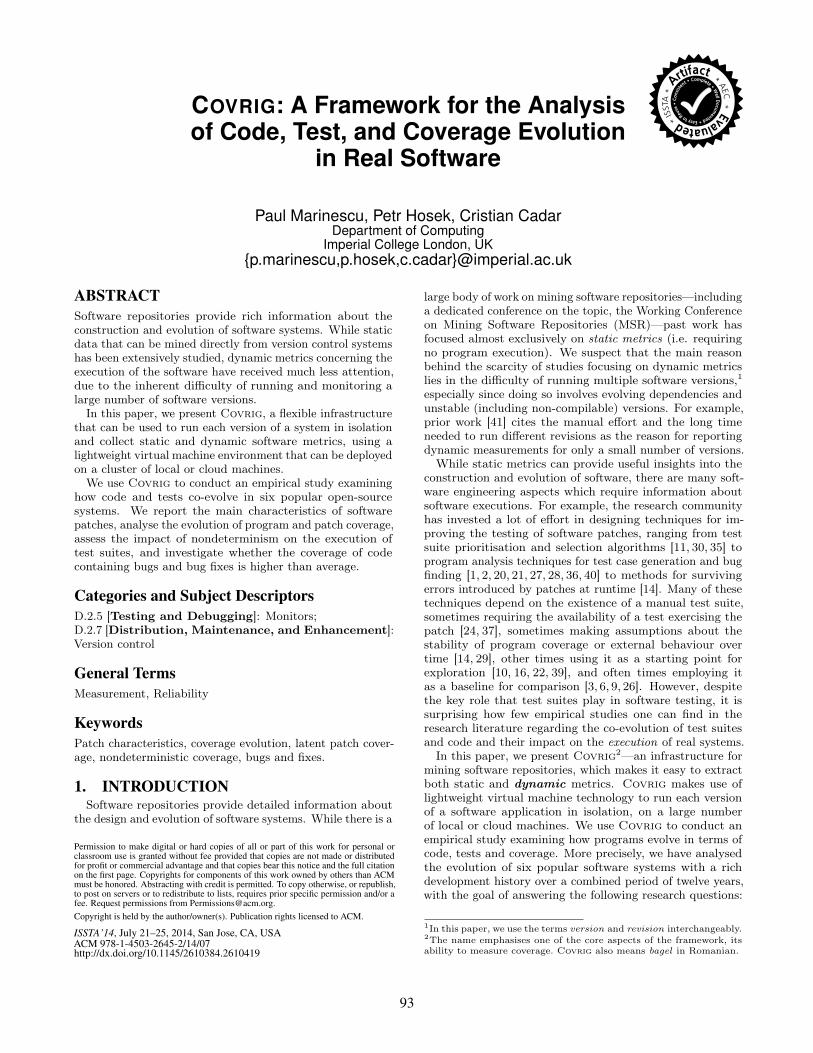
Figure 1: Covrig infrastructure.
2. COVRIG INFRASTRUCTUREThe overall architecture of the Covrig infrastructure is
depicted in Figure 1. It contains a generic driver whichiterates through all the revisions in a given range and invokesroutines specific to each system to compile, run, and collectstatistics of interest.Lightweight software containers. Covrig employs
software containers [33], an operating system-level virtu-alisation mechanism that provides the ability to run multipleisolated virtual Linux systems (“containers”) atop a singlehost OS. When launched, Covrig starts by loading theselected range of revisions from the project’s Git repository,and for each revision starts a new software container. Theuse of containers offers increased isolation and reproducibilityguarantees by providing a consistent environment in whichto run each software revision and ensuring that different revi-sions do not interfere with each other, e.g. by inadvertentlyleaving behind lock files or not properly freeing up resources.The choice of lightweight OS-level virtualisation rather
than more traditional virtual machines (e.g. KVM3 or Xen4)reduces the performance penalty associated with spawningand tearing down VMs, operations performed for each revi-sion analysed. To get a sense of this difference, we comparedan LXC5 container, which required under a second for theseoperations, with a Xen VM, which needed over a minute.In our implementation, we use Docker6 to create and
manage the lower-level LXC containers, and deploy them onmultiple local or cloud machines. Each container is used toconfigure, compile and test one program revision, as well ascollect the metrics of interest, such as code size and coverage.The containers are remotely controlled through SSH usingthe Fabric7 framework.Configuration file. Covrig has a modular architecture,
which makes it possible to analyse new systems with modesteffort. A potential user of our infrastructure only needs toprovide a Python configuration file describing the system.A minimal file provides the name of the system, its Gitrepository location, a method to compile the system, e.g.install dependencies and run the appropriate make command,and a method to run the regression tests, e.g. run the maketest command. Finally, the configuration file can also specifyan end revision and a specific number of revisions to analyse.For accurate test suite size measurements, the files or folderswhich make up the test suite can also be indicated.
3http://www.linux-kvm.org/4http://www.xenproject.org/5http://linuxcontainers.org/6https://www.docker.io/7http://fabfile.org/
94
For each revision, Covrig collects several static and dy-namic metrics. The static metrics are obtained either directlyfrom the version control system (e.g. the number of lines oftest code) or after compiling each revision (e.g. the numberof executable lines of code). The dynamic metrics requirerunning the regression tests (e.g. the overall line coverage orthe regression test success status). Further information andgraphs—including the ones presented in our empirical study—are automatically derived in the post-processing stage fromthese primary metrics using a set of scripts.Bug data. One possible application of Covrig is finding
useful data about software bugs and correlating them withthe static and dynamic metrics collected. For our study, wemined bug data from both software repositories and, whereavailable, bug tracking systems. We automatically obtained alist of candidate bug-fixing revisions by iterating through thelist of commits and checking the commit message for wordssuch as fix, bug or issue, followed by a number representingthe bug identifier. For example, a typical Memcached bug fixcommit message looks like "Issue 224 - check retval of mainevent loop". The regular expression that we used to identifythese commits is similar to the ones used in prior work [12]:(?:bug|issue|fix|resolve|close)\s*\#?\s?(\d+)
Where possible, we confirmed that the bug identifier isvalid by querying the associated bug tracking system. Wefurther manually checked all reported revisions and confirmedthat they included no false positives. While it is impossibleto quantify the false negative rate without a knowledgeabledeveloper manually checking all the revisions in a repository,we believe that the automatically obtained bug fixes createa representative subset of the fixes in the repository.Line mapping. The ability to track how lines move and
change across revisions is the cornerstone of many high-level software evolution analyses. A line mapping algorithmimproves over the traditional diff algorithm by tracking themovement of individual lines rather than hunks. Conceptu-ally, line mapping is a function which takes two revisions,r1 and r2, and a program location described by a pair (filename 1, line number 1) associated with r1. The output is apair (file name 2, line number 2) identifying the correspond-ing location in r2.Our implementation of the line mapping algorithm is simi-
lar to the algorithms described in previous work [4,17,32,38].It makes use of the Levenshtein edit distance [19] to track lineedits, and tf–idf [34] and cosine similarity [31] to track linemovements. It also uses the Hungarian algorithm [18] to findthe optimal matching of lines across versions. Compared toprevious work, our implementation can also improve precisionby using coverage information to filter non-executable lines.In our study, we used line mapping to determine whether
patches are tested within the next few revisions after theywere created (§3.4).Cloud deployment. To enable large-scale data collection
and processing, we deployed Covrig to our private cloud.We have built our system around a standard set of tools:Packer8 for building custom Docker-enabled machine images,Vagrant9 for controlling and provisioning the virtual machinesbased on these images, a Docker registry for serving Covrig’sDocker containers and a fabfile for orchestrating the entirecluster. The same set of tools and scripts can be used todeploy Covrig to different private or public clouds.
8http://www.packer.io/9http://www.vagrantup.com/
Table 1: Summary of applications used in our study.ELOC represents the number of executable lines ofcode and TLOC the number of lines in test files inthe last revision analysed.
Code TestsApp Lang. ELOC Lang. TLOCBinutils C 27,029 DejaGnu 5,186Git C 79,760 C/shell 108,464Lighttpd C 23,884 Python 2,440Memcached C 4,426 C/Perl 4,605Redis C 18,203 Tcl 7,589ØMQ C++ 7,276 C++ 3,460
3. EMPIRICAL STUDYWe used the Covrig infrastructure to understand the
evolution of six popular open-source applications writtenin C/C++, over a combined period of twelve years. Ourempirical study has been successfully validated by the ISSTAartifact evaluation committee, and found to exceed expecta-tions. The six evaluated applications are:GNU Binutils10 is a set of utilities for inspecting andmodifying object files, libraries and binary programs. Weselected for analysis the twelve utilities from the binutilsfolder (addr2line, ar, cxxfilt, elfedit, nm, objcopy, objdump,ranlib, readelf, size, strings and strip), which are standarduser-level programs under many UNIX distributions.Git11 is one the most popular distributed version controlsystems used by the open-source developer community.Lighttpd12 is a lightweight web server used by several high-traffic websites such as Wikipedia and YouTube. We exam-ined version 2, which is the latest development branch.Memcached13 is a general-purpose distributed memorycaching system used by several popular sites such as Craigslist,Digg and Twitter.Redis14 is a popular key-value data store used by manywell-known services such as GitHub and Flickr.ØMQ15 is a high-performance asynchronous messaging mid-dleware library used by a number of organisations such asLos Alamos Labs, NASA and CERN.The six applications are representative for C/C++ open-
source code: GNU Binutils are user-level utilities, Git is aversion control system, Lighttpd, Memcached and Redis areserver applications, while ØMQ is a library. All applicationsinclude a regression test suite.Basic characteristics. Table 1 shows some basic charac-teristics of these systems: the language in which the codeand tests are written, the number of executable lines of code(ELOC) and the number of lines of test code (TLOC) in thelast revision analysed. To accurately measure the number ofELOC, we leveraged the information stored by the compilerin gcov graph files, while to measure the number of TLOCwe did a simple line count of the test files (using cloc, orwc -l when cloc cannot detect the file types).
10http://www.gnu.org/software/binutils/11http://git-scm.com/12http://redmine.lighttpd.net/projects/lighttpd2/13http://memcached.org/14http://redis.io/15http://zeromq.org/
95

The code size for these applications varies from only 4,426ELOC for Memcached to 79,760 ELOC for Git. The testcode is written in a variety of languages and ranges from2,440 lines of Python code for Lighttpd to 108,464 linesof C and shell code for Git. The test code is 36% largerthan the application code in the case of Git, approximatelyas large as the application code for Memcached, around40% of the application code for Redis and ØMQ, and onlyaround 10% and 19% of the application code for Lighttpdand Binutils respectively. Running the test suite on the lastversion takes only a few seconds for Binutils, Lighttpd, andØMQ, 110 seconds for Memcached, 315 seconds for Redis,and 30 minutes for Git, using a four-core Intel Xeon E3-1280machine with 16 GB of RAM.The version control system used by all these applications
is Git. Four of these projects—Git, Memcached, Redis, andØMQ—are hosted on the GitHub16 online project site. Theother two—Binutils and Lighttpd—use their own Git hosting.Selection of revisions. Our goal was to select a compara-
ble number of revisions across applications. The methodologywas to start from the current version at the day of ourexperiments, and select an equal number of previous revisionsfor all systems. We only counted revisions which modifyexecutable code, tests or both because this is what ouranalyses look at. We decided to select 250 such revisionsfrom each system because some systems had non-trivialdependency issues further back than this, which preventedus from properly compiling or running them. We still hadto install the correct dependencies where appropriate, e.g.downgrade libev for older versions of Lighttpd and libeventfor Memcached.Note that not all revisions compile, either due to devel-
opment errors or portability issues (e.g. system header filesdiffering across OS distributions). Redis has the largestnumber of such transient compilation errors—38. The pre-vailing reasons are missing #include directives, e.g. unistd.hfor the sleep function, and compiler warnings subsequentlytreated as errors. The missing #include directives most likelyslipped past the developers because on some systems otherheaders cause the missing ones to be indirectly included. Thecompiler warnings were generated because newer compilerversions, such as the one that we used, are more pedan-tic. Other reasons include forgotten files and even missingsemicolons.We decided to fix the errors which had not likely been
seen at the time a particular revision was created, for ex-ample by adding the compile flag -Wno-error in Binutils sothat warnings do not terminate the build process. In allsituations when we could not compile a revision, we rolledover the changes to the next revisions until we found onewhere compilation was successful. Revisions which do notsuccessfully compile are not counted towards the 250 limit.Another important decision concerns the granularity of the
revisions being considered. Modern decentralised softwarerepositories based on version control systems such as Git donot have a linear structure and the development history is adirected acyclic graph rather than a simple chain. Differentdevelopment styles generate different development histories;for example, Git, Redis and ØMQ exhibit a large amountof branching and merging while the other three systemshave a mostly linear history. Our decision was to focus onthe main branch, and treat each merge into it as a single
16https://github.com/
Table 2: Revisions used in our study. OK: codecompiles and tests complete successfully, TF: sometests fail, TO: tests time out, CF: compilation fails,Time: the number of months analysed.
OK+TF+TO=250App OK TF TO CF TimeBinutils 240 10 0 25 35moGit 249 0 1 0 5moLighttpd 145 105 0 13 36moMemcached 206 43 1 5 47moRedis 211 38 1 38 6moØMQ 171 79 0 11 17mo
revision. In other words, we considered each feature brancha single indivisible unit. Our motivation for this decisionwas twofold: first, development branches are often spawnedby individual developers in order to work on a certain issueand are often “private” until they are merged into the mainbranch. As a result, sub-revisions in such branches are oftenunusable or even non-compilable, reflecting work-in-progress.Second, the main branch is generally the one tracked bymost users, therefore analysing revisions at this level isa good match in terms of understanding what problemsare seen in the field. This being said, there are certainlydevelopment styles and/or research questions that wouldrequire tracking additional branches; however, we believethat for our benchmarks and research questions this level ofgranularity provides meaningful answers.Table 2 summarises the revisions that we selected: they
are grouped into those that compile and pass all the tests(OK ), compile but fail some tests (TF ), and compile buttime out while running the test suite (TO). The time limitthat we enforced was empirically selected for each systemsuch that it is large enough to allow a correct revision tocomplete all tests. As shown in the table, timeouts were arare occurrence, with at most one occurrence per application.Table 2 also shows the development time span considered,
which ranges from only 5-6 months for Git and Redis, whichhad a fast-paced development during this period, to almost4 years for Memcached. The age of the projects at the firstversion that we analysed ranges from a little over 2 years forLighttpd (version 2), to 11 years for Binutils.Setup. All the programs analysed were compiled to record
coverage information. In addition, we disabled compileroptimisations, which generally interact poorly with coveragemeasurements. For this we used existing build targets andconfiguration options if available, otherwise we configuredthe application with the flags CFLAGS=’-O0 -coverage’ andLDFLAGS=-coverage. All code from the system headers, i.e./usr/include/ was excluded from the results.
Each revision was run in a virtualised environment based onthe 64-bit version of Ubuntu 12.10 (12.04.3 for Git) runninginside an LXC container. To take advantage of the inherentparallelism of this approach, the containers were spawned inone of 28 long-running Xen VMs, each with a 4 Ghz CPU,6 GB of RAM, and 20 GB of storage, running a 64-bit versionof Ubuntu 12.04.3.The following subsections present the main findings of our
analysis. They first reiterate and then examine in detail ourtarget research questions (RQs).
96
25000 25200 25400 25600 25800 26000 26200 26400 26600 26800 27000 27200
ELO
CBinutils
76500
77000
77500
78000
78500
79000
79500
80000
ELO
C
Git
19000 19500 20000 20500 21000 21500 22000 22500 23000 23500 24000
ELO
C
Lighttpd
3000
3200
3400
3600
3800
4000
4200
4400
4600
ELO
C
Memcached
16800
17000
17200
17400
17600
17800
18000
18200
18400EL
OC
Redis
5000
5500
6000
6500
7000
7500
ELO
C
ØMQ
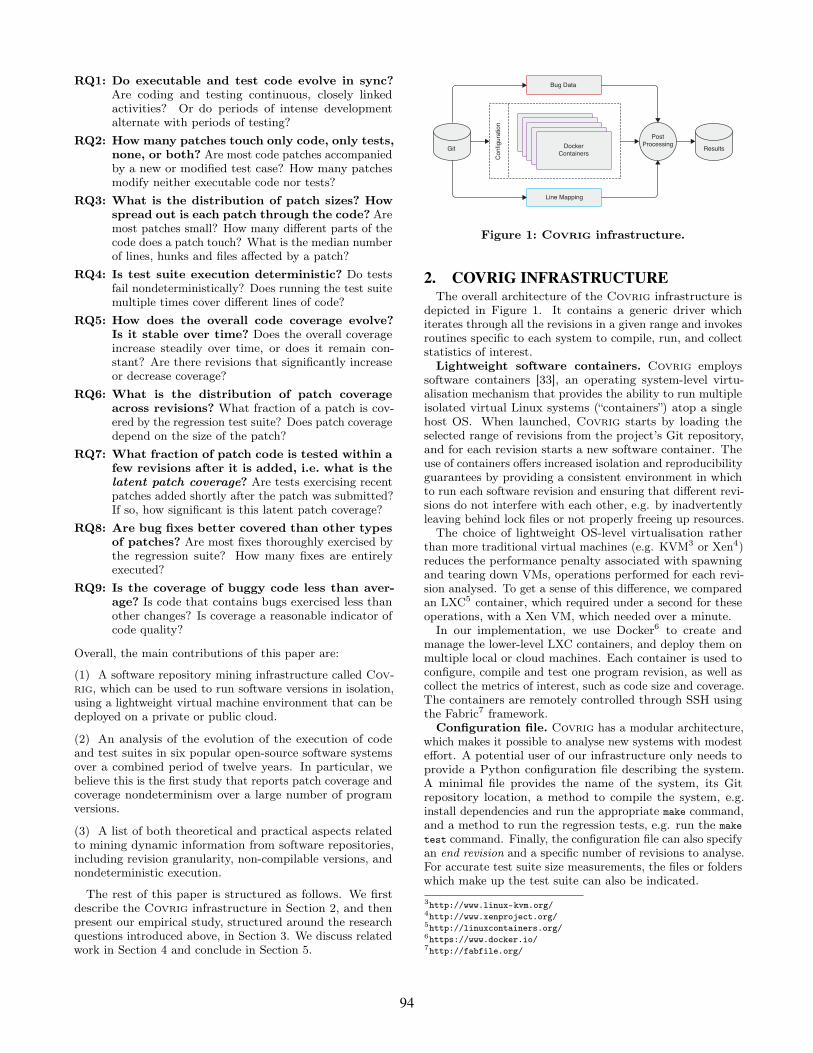
Figure 2: Evolution of executable lines of code.
3.1 Code and Test Evolution
RQ1: Do executable and test code evolve in sync?
Figure 2 shows the evolution of each system in terms ofELOC. As discussed above, we measured the number ofELOC in each revision by using the information stored ingcov graph files. This eliminates all lines which were notcompiled, such as those targeting architectures different fromour machine. One of the main reasons for which we havedecided to measure ELOC rather than other similar metricsis that they can be easily related to the dynamic metrics,such as patch coverage, presented in Sections 3.3 and 3.4.As evident from Figure 2, all six systems grow over time,
with periods of intense development that increase the ELOCsignificantly, alternating with periods of code tuning andtesting, where the code size increases at a slower pace. It isinteresting to note that there are also several revisions wherethe number of ELOC decreases (e.g. in ØMQ): upon manualinspection, we noticed that they relate to refactorings suchas using macros or removing duplicate code.The total number of ELOC added or modified varies be-
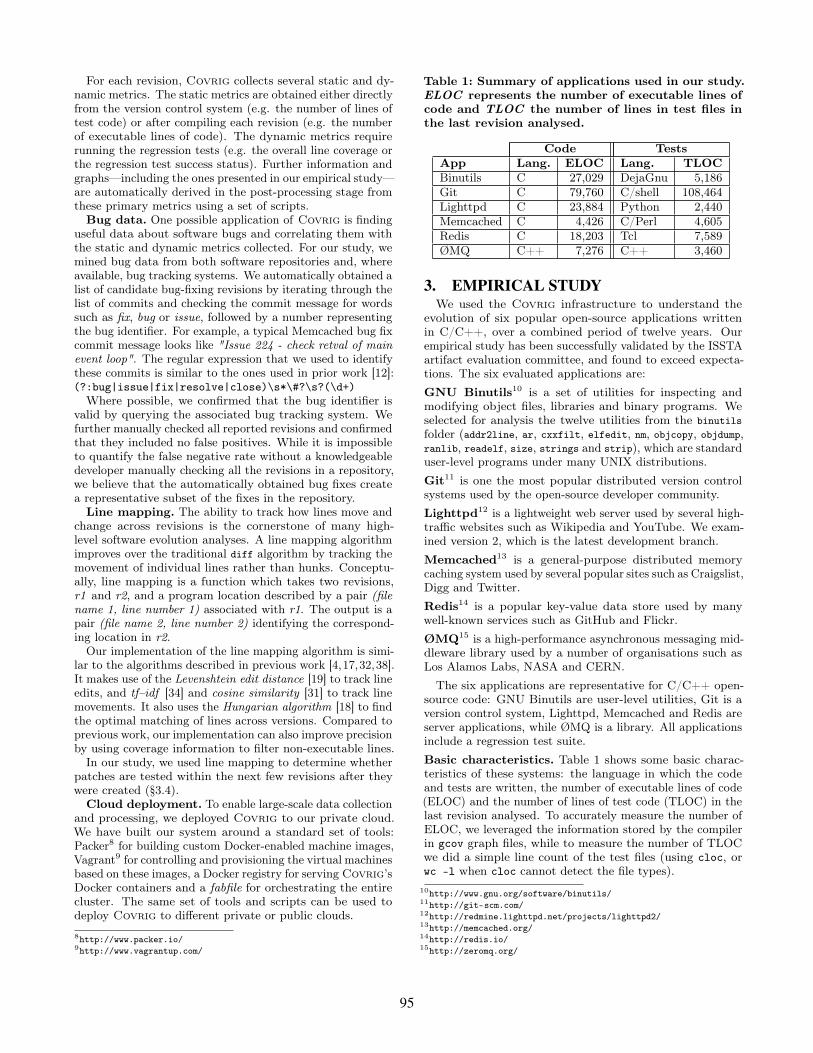
tween 2,296 for Redis and 10,834 for Lighttpd, while theend-to-end difference in ELOC varies between 1,257 forMemcached and 4,466 for Lighttpd.Figure 3 presents the evolution of the size of the test
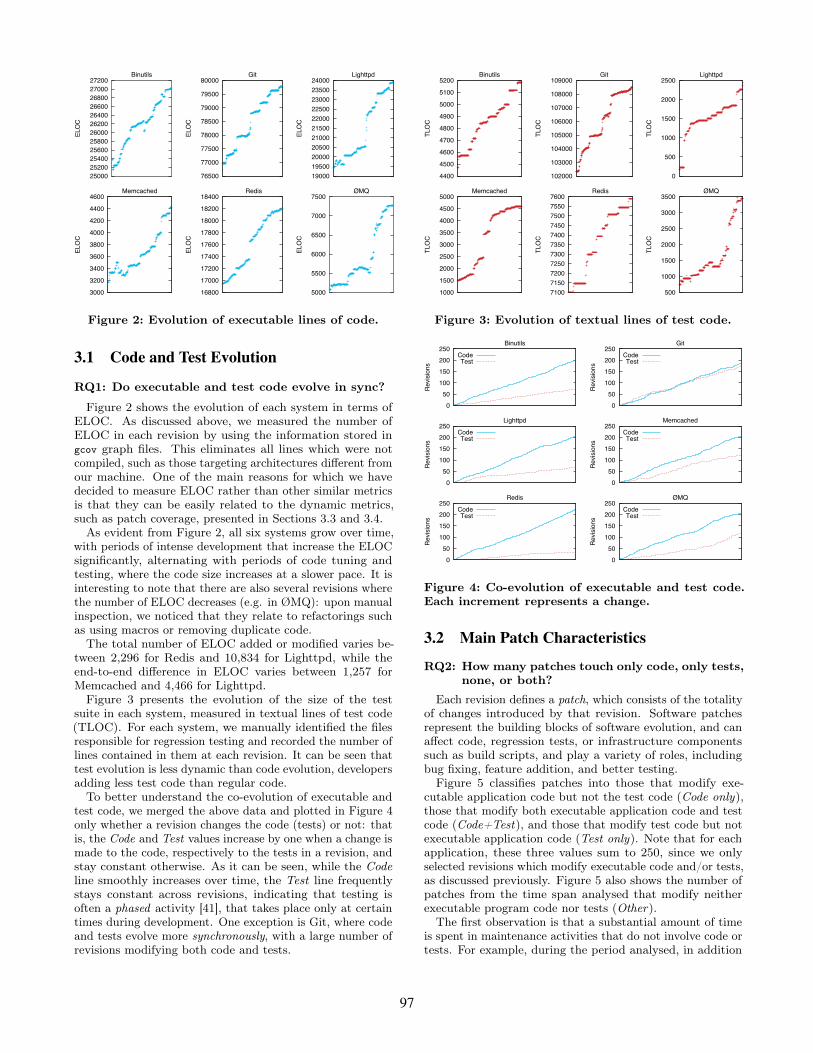
suite in each system, measured in textual lines of test code(TLOC). For each system, we manually identified the filesresponsible for regression testing and recorded the number oflines contained in them at each revision. It can be seen thattest evolution is less dynamic than code evolution, developersadding less test code than regular code.To better understand the co-evolution of executable and
test code, we merged the above data and plotted in Figure 4only whether a revision changes the code (tests) or not: thatis, the Code and Test values increase by one when a change ismade to the code, respectively to the tests in a revision, andstay constant otherwise. As it can be seen, while the Codeline smoothly increases over time, the Test line frequentlystays constant across revisions, indicating that testing isoften a phased activity [41], that takes place only at certaintimes during development. One exception is Git, where codeand tests evolve more synchronously, with a large number ofrevisions modifying both code and tests.
4400
4500
4600
4700
4800
4900
5000
5100
5200
TLO
C
Binutils
102000
103000
104000
105000
106000
107000
108000
109000
TLO
C
Git
0
500
1000
1500
2000
2500
TLO
C
Lighttpd
1000
1500
2000
2500
3000
3500
4000
4500
5000
TLO
C
Memcached
7100 7150 7200 7250 7300 7350 7400 7450 7500 7550 7600
TLO
C
Redis
500
1000
1500
2000
2500
3000
3500
TLO
C
ØMQ
Figure 3: Evolution of textual lines of test code.
0 50
100 150 200 250
Rev
isio
ns
Binutils
CodeTest
0 50
100 150 200 250
Rev
isio
ns
Git
CodeTest
0 50
100 150 200 250
Rev
isio
nsLighttpd
CodeTest
0 50
100 150 200 250
Rev
isio
ns
Memcached
CodeTest
0 50
100 150 200 250
Rev
isio
ns
Redis
CodeTest
0 50
100 150 200 250
Rev
isio
ns
ØMQ
CodeTest
Figure 4: Co-evolution of executable and test code.Each increment represents a change.
3.2 Main Patch Characteristics
RQ2: How many patches touch only code, only tests,none, or both?
Each revision defines a patch, which consists of the totalityof changes introduced by that revision. Software patchesrepresent the building blocks of software evolution, and canaffect code, regression tests, or infrastructure componentssuch as build scripts, and play a variety of roles, includingbug fixing, feature addition, and better testing.Figure 5 classifies patches into those that modify exe-
cutable application code but not the test code (Code only),those that modify both executable application code and testcode (Code+Test), and those that modify test code but notexecutable application code (Test only). Note that for eachapplication, these three values sum to 250, since we onlyselected revisions which modify executable code and/or tests,as discussed previously. Figure 5 also shows the number ofpatches from the time span analysed that modify neitherexecutable program code nor tests (Other).The first observation is that a substantial amount of time
is spent in maintenance activities that do not involve code ortests. For example, during the period analysed, in addition
97

0
50
100
150
200
250
300
350
400
450
500
Binutils Git Lighttpd Memcached Redis ØMQ
Code onlyCode+TestTest onlyOther
Figure 5: Breakdown of patches by type: affectingexecutable application code but not test code, af-fecting both, affecting only test code, and neither.
to the 250 target patches, there were around 120 additionalsuch patches in Binutils, Memcached and ØMQ, and 204 inGit. Note that some of these patches may modify code thatis excluded during preprocessing on our machine, but mostcases involved changes to build scripts, documentation, andother similar software artefacts.From the 250 patches selected for each application, the
majority only modify code, with a relatively small numberof patches (73 in Git, and under 52 for the others) touchingonly tests. The number of revisions that modify both codeand tests can offer some indication of the development styleused: at one end of the spectrum there is Redis, with onlyone such patch, suggesting that coding and testing are quiteseparate activities; at the other end there is Git, with 100such patches, suggesting a development discipline in whichcode changes are frequently accompanied by a test case.
RQ3: What is the distribution of patch sizes? Howspread out is each patch through the code?
The size of a patch and the number of locations thatit affects can provide useful guidance for longitudinal test-ing techniques. The Lines column in Table 3 providesinformation about the size of the executable code patchesanalysed in each system, measured in ELOC. Note that ourmeasurements ignore changes in the amount of whitespace,e.g. whitespace at the end of the line, because our targetprogramming languages, C and C++, are insensitive to suchmodifications. Most patches are small, with the mediannumber of ELOC ranging from 4 to 7.To understand the degree to which patches are spread
out through the code, we also recorded the number of areasin the code—hunks in Git terminology—and the numberof files containing executable code which suffered changes.More formally, a hunk groups together all the lines added ormodified in a patch which are at a distance smaller than thecontext size. We used the default unified diff format with acontext size of three lines when computing the hunks.17 TheHunks column in Table 3 shows that the median number ofhunks varies between 2 and 4.
17See http://www.gnu.org/software/diffutils/manual/html_node/ formore details.
Table 3: The median number of executable lines,hunks from executable files, and executable files in apatch. Only data from patches which add or modifyexecutable code is considered.
App Lines Hunks FilesBinutils 5 2 1Git 7 3 1Lighttpd 6 3 1Memcached 6 3 1Redis 4 2 1ØMQ 7 4 2
Table 4: Number of revisions where the test suitenondeterministically succeeds/fails, and the maxi-mum, median and average number of lines whichare nondeterministically executed in a revision.
Nondet. Nondet. ELOCApp. Result Max Median AverageBinutils 0 0 0 0Git 1 23 13 11.80Lighttpd 1 37 10 13.01Memcached 21 22 8.5 7.55Redis 16 71 23 30.98ØMQ 32 47 27 19.52
Finally, the median number of files modified by a patch isonly 1 for all benchmarks with the exception of ØMQ, forwhich it is 2. The fraction of patches that modify a singlefile is, in increasing order, 48.7% for ØMQ, 58.7% for Git,65.1% for Lighttpd, 66.6% for Memcached, 84.9% for Redis,and 88.5% for Binutils.
3.3 Overall Code Coverage
RQ4: Is test suite execution deterministic?
As a large part of our study focuses on coverage metrics,we first investigate whether code coverage is deterministic,i.e. whether the regression test suite in a given revisionachieves the same coverage every time it is executed. As weshow, nondeterminism has implications in the reproducibilityof test results—including the ones that we report—and thefault detection capability of the tests.We measured the overall coverage achieved by the re-
gression test suite using gcov. Interestingly, we found thatall the programs from our experiments except Binutils arenondeterministic, obtaining slightly different coverage in eachrun of the test suite. Therefore, we first quantified thisnondeterminism by running the test suite five times for eachrevision and measuring how many revisions obtained mixedresults, i.e. one run reported success while another reportedfailure. We were surprised to see a fair number of revisionsdisplaying this behaviour, as listed in Table 4 under thecolumn Nondet Result.We further counted for each pair of runs the number of lines
whose coverage status differs. We used a 0/1 metric, i.e. weonly considered a difference when one of the five runs neverexecutes a line and another one executes it. We only did thisfor revisions in which the test suite completes successfully toavoid spurious results that would occur if we compare a runwhich completed with one that was prematurely terminated
98
0
20
40
60
80
100C
over
age
Binutils
Line covBranch cov
0
20
40
60
80
100
Cov
erag
e
Git
Line covBranch cov
0
20
40
60
80
100
Cov
erag
e
Lighttpd
Line covBranch cov
0
20
40
60
80
100
Cov
erag
e
Memcached
Line covBranch cov
0
20
40
60
80
100C
over
age
Redis
Line covBranch cov
0
20
40
60
80
100
Cov
erag
e
ØMQ
Line covBranch cov
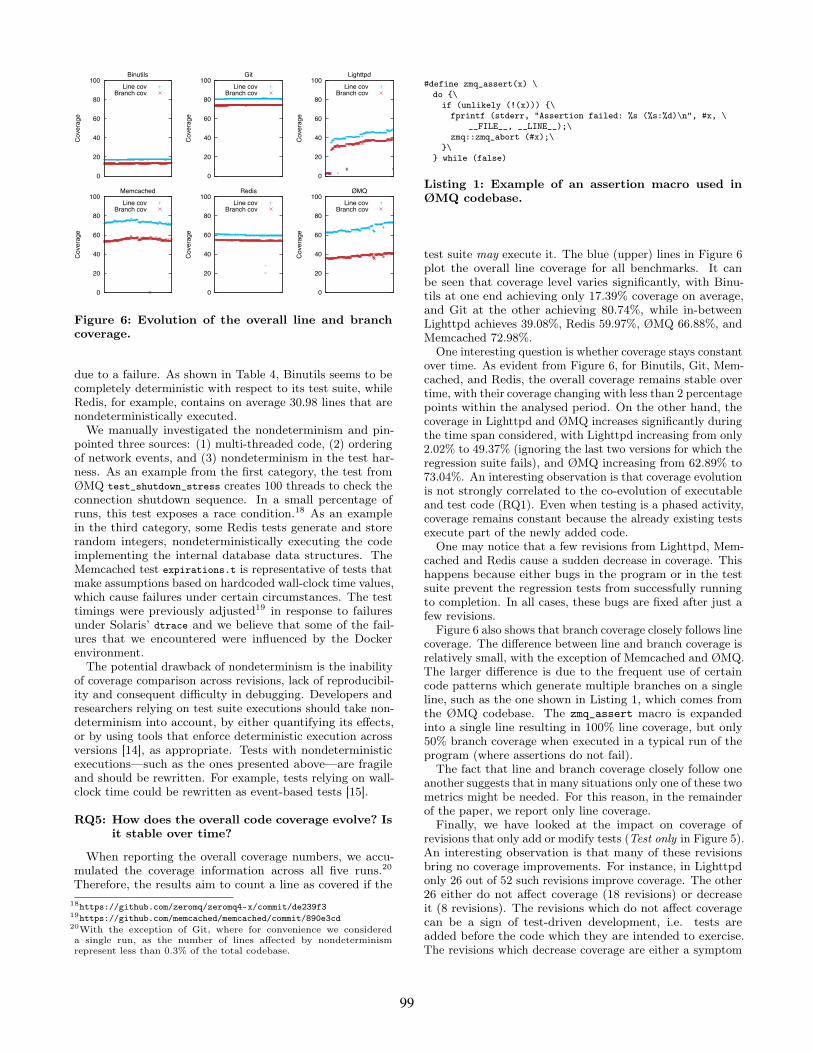
Figure 6: Evolution of the overall line and branchcoverage.
due to a failure. As shown in Table 4, Binutils seems to becompletely deterministic with respect to its test suite, whileRedis, for example, contains on average 30.98 lines that arenondeterministically executed.We manually investigated the nondeterminism and pin-
pointed three sources: (1) multi-threaded code, (2) orderingof network events, and (3) nondeterminism in the test har-ness. As an example from the first category, the test fromØMQ test_shutdown_stress creates 100 threads to check theconnection shutdown sequence. In a small percentage ofruns, this test exposes a race condition.18 As an examplein the third category, some Redis tests generate and storerandom integers, nondeterministically executing the codeimplementing the internal database data structures. TheMemcached test expirations.t is representative of tests thatmake assumptions based on hardcoded wall-clock time values,which cause failures under certain circumstances. The testtimings were previously adjusted19 in response to failuresunder Solaris’ dtrace and we believe that some of the fail-ures that we encountered were influenced by the Dockerenvironment.The potential drawback of nondeterminism is the inability
of coverage comparison across revisions, lack of reproducibil-ity and consequent difficulty in debugging. Developers andresearchers relying on test suite executions should take non-determinism into account, by either quantifying its effects,or by using tools that enforce deterministic execution acrossversions [14], as appropriate. Tests with nondeterministicexecutions—such as the ones presented above—are fragileand should be rewritten. For example, tests relying on wall-clock time could be rewritten as event-based tests [15].
RQ5: How does the overall code coverage evolve? Isit stable over time?
When reporting the overall coverage numbers, we accu-mulated the coverage information across all five runs.20
Therefore, the results aim to count a line as covered if the18https://github.com/zeromq/zeromq4-x/commit/de239f319https://github.com/memcached/memcached/commit/890e3cd20With the exception of Git, where for convenience we considereda single run, as the number of lines affected by nondeterminismrepresent less than 0.3% of the total codebase.
#define zmq_assert(x) \do {\if (unlikely (!(x))) {\fprintf (stderr, "Assertion failed: %s (%s:%d)\n", #x, \
__FILE__, __LINE__);\zmq::zmq_abort (#x);\
}\} while (false)
Listing 1: Example of an assertion macro used inØMQ codebase.
test suite may execute it. The blue (upper) lines in Figure 6plot the overall line coverage for all benchmarks. It canbe seen that coverage level varies significantly, with Binu-tils at one end achieving only 17.39% coverage on average,and Git at the other achieving 80.74%, while in-betweenLighttpd achieves 39.08%, Redis 59.97%, ØMQ 66.88%, andMemcached 72.98%.One interesting question is whether coverage stays constant
over time. As evident from Figure 6, for Binutils, Git, Mem-cached, and Redis, the overall coverage remains stable overtime, with their coverage changing with less than 2 percentagepoints within the analysed period. On the other hand, thecoverage in Lighttpd and ØMQ increases significantly duringthe time span considered, with Lighttpd increasing from only2.02% to 49.37% (ignoring the last two versions for which theregression suite fails), and ØMQ increasing from 62.89% to73.04%. An interesting observation is that coverage evolutionis not strongly correlated to the co-evolution of executableand test code (RQ1). Even when testing is a phased activity,coverage remains constant because the already existing testsexecute part of the newly added code.One may notice that a few revisions from Lighttpd, Mem-
cached and Redis cause a sudden decrease in coverage. Thishappens because either bugs in the program or in the testsuite prevent the regression tests from successfully runningto completion. In all cases, these bugs are fixed after just afew revisions.Figure 6 also shows that branch coverage closely follows line
coverage. The difference between line and branch coverage isrelatively small, with the exception of Memcached and ØMQ.The larger difference is due to the frequent use of certaincode patterns which generate multiple branches on a singleline, such as the one shown in Listing 1, which comes fromthe ØMQ codebase. The zmq_assert macro is expandedinto a single line resulting in 100% line coverage, but only50% branch coverage when executed in a typical run of theprogram (where assertions do not fail).The fact that line and branch coverage closely follow one
another suggests that in many situations only one of these twometrics might be needed. For this reason, in the remainderof the paper, we report only line coverage.Finally, we have looked at the impact on coverage of
revisions that only add or modify tests (Test only in Figure 5).An interesting observation is that many of these revisionsbring no coverage improvements. For instance, in Lighttpdonly 26 out of 52 such revisions improve coverage. The other26 either do not affect coverage (18 revisions) or decreaseit (8 revisions). The revisions which do not affect coveragecan be a sign of test-driven development, i.e. tests areadded before the code which they are intended to exercise.The revisions which decrease coverage are either a symptom
99
0
20
40
60
80
100
Binutils Git Lighttpd Memcached Redis ØMQ
[0%, 25%](25%, 50%](50%, 75%](75%, 100%]
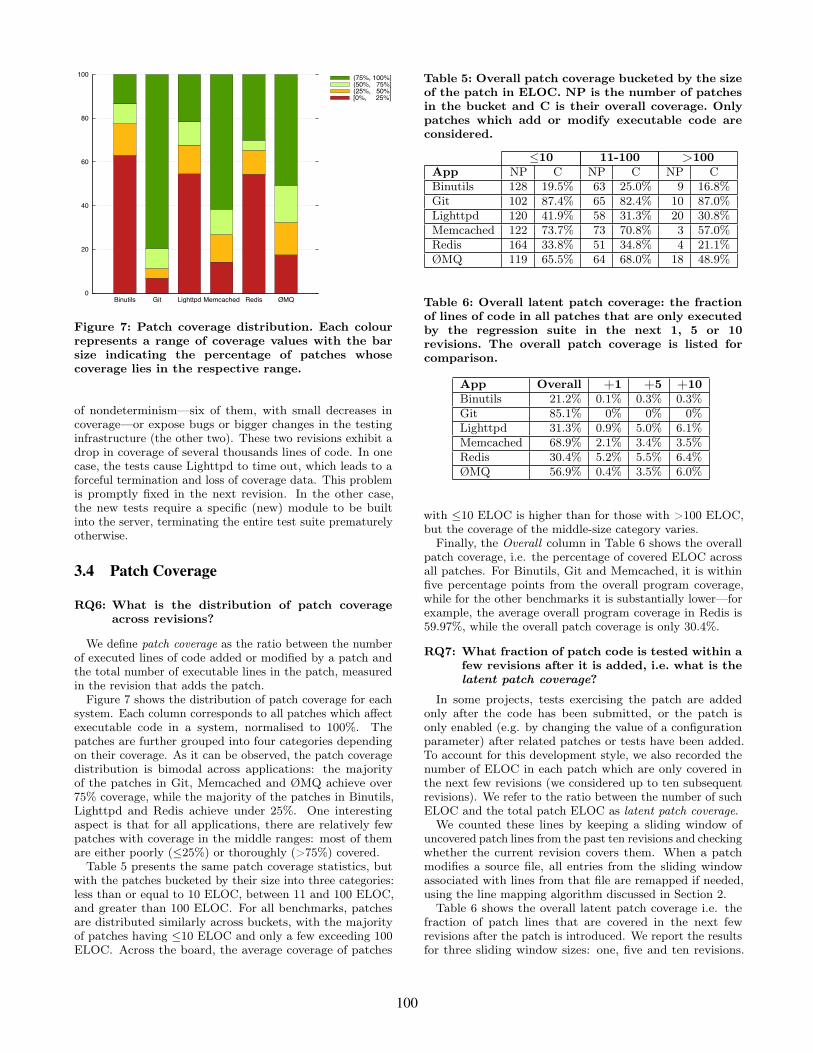
Figure 7: Patch coverage distribution. Each colourrepresents a range of coverage values with the barsize indicating the percentage of patches whosecoverage lies in the respective range.
of nondeterminism—six of them, with small decreases incoverage—or expose bugs or bigger changes in the testinginfrastructure (the other two). These two revisions exhibit adrop in coverage of several thousands lines of code. In onecase, the tests cause Lighttpd to time out, which leads to aforceful termination and loss of coverage data. This problemis promptly fixed in the next revision. In the other case,the new tests require a specific (new) module to be builtinto the server, terminating the entire test suite prematurelyotherwise.
3.4 Patch Coverage
RQ6: What is the distribution of patch coverageacross revisions?
We define patch coverage as the ratio between the numberof executed lines of code added or modified by a patch andthe total number of executable lines in the patch, measuredin the revision that adds the patch.Figure 7 shows the distribution of patch coverage for each
system. Each column corresponds to all patches which affectexecutable code in a system, normalised to 100%. Thepatches are further grouped into four categories dependingon their coverage. As it can be observed, the patch coveragedistribution is bimodal across applications: the majorityof the patches in Git, Memcached and ØMQ achieve over75% coverage, while the majority of the patches in Binutils,Lighttpd and Redis achieve under 25%. One interestingaspect is that for all applications, there are relatively fewpatches with coverage in the middle ranges: most of themare either poorly (≤25%) or thoroughly (>75%) covered.Table 5 presents the same patch coverage statistics, but
with the patches bucketed by their size into three categories:less than or equal to 10 ELOC, between 11 and 100 ELOC,and greater than 100 ELOC. For all benchmarks, patchesare distributed similarly across buckets, with the majorityof patches having ≤10 ELOC and only a few exceeding 100ELOC. Across the board, the average coverage of patches
Table 5: Overall patch coverage bucketed by the sizeof the patch in ELOC. NP is the number of patchesin the bucket and C is their overall coverage. Onlypatches which add or modify executable code areconsidered.
≤10 11-100 >100App NP C NP C NP CBinutils 128 19.5% 63 25.0% 9 16.8%Git 102 87.4% 65 82.4% 10 87.0%Lighttpd 120 41.9% 58 31.3% 20 30.8%Memcached 122 73.7% 73 70.8% 3 57.0%Redis 164 33.8% 51 34.8% 4 21.1%ØMQ 119 65.5% 64 68.0% 18 48.9%
Table 6: Overall latent patch coverage: the fractionof lines of code in all patches that are only executedby the regression suite in the next 1, 5 or 10revisions. The overall patch coverage is listed forcomparison.
App Overall +1 +5 +10Binutils 21.2% 0.1% 0.3% 0.3%Git 85.1% 0% 0% 0%Lighttpd 31.3% 0.9% 5.0% 6.1%Memcached 68.9% 2.1% 3.4% 3.5%Redis 30.4% 5.2% 5.5% 6.4%ØMQ 56.9% 0.4% 3.5% 6.0%
with ≤10 ELOC is higher than for those with >100 ELOC,but the coverage of the middle-size category varies.Finally, the Overall column in Table 6 shows the overall
patch coverage, i.e. the percentage of covered ELOC acrossall patches. For Binutils, Git and Memcached, it is withinfive percentage points from the overall program coverage,while for the other benchmarks it is substantially lower—forexample, the average overall program coverage in Redis is59.97%, while the overall patch coverage is only 30.4%.
RQ7: What fraction of patch code is tested within afew revisions after it is added, i.e. what is thelatent patch coverage?
In some projects, tests exercising the patch are addedonly after the code has been submitted, or the patch isonly enabled (e.g. by changing the value of a configurationparameter) after related patches or tests have been added.To account for this development style, we also recorded thenumber of ELOC in each patch which are only covered inthe next few revisions (we considered up to ten subsequentrevisions). We refer to the ratio between the number of suchELOC and the total patch ELOC as latent patch coverage.We counted these lines by keeping a sliding window of
uncovered patch lines from the past ten revisions and checkingwhether the current revision covers them. When a patchmodifies a source file, all entries from the sliding windowassociated with lines from that file are remapped if needed,using the line mapping algorithm discussed in Section 2.Table 6 shows the overall latent patch coverage i.e. the
fraction of patch lines that are covered in the next fewrevisions after the patch is introduced. We report the resultsfor three sliding window sizes: one, five and ten revisions.
100
Table 7: The median coverage and the number ofrevisions achieving 100% coverage for the revisionscontaining bug fixes. The overall metrics are in-cluded for comparison.
Coverage (med) Fully CoveredApp Overall Fix Overall FixMemcached 89.0% 100% 45.4% 58.5%Redis 0% 94.1% 25.5% 50.0%ØMQ 76.0% 55.4% 33.3% 31.8%
The latent patch coverage is significantly smaller comparedto the overall patch coverage, accounting for at most 6.4%in Redis, where, as previously pointed out, the developersalmost never add code and tests in the same revision.As conjectured, we found two main causes of latent patch
coverage: tests being added only after the patch was written(this was the case in Lighttpd, where 12 revisions whichonly add tests cover an additional 74 ELOC) and patch codebeing enabled later on. In fact, the majority of latent patchcoverage in Lighttpd—337 lines—is obtained by 6 revisionswhich change no test files. Upon manual inspection, we foundthat the code involved was initially unused, and only laterrevisions added calls to it.Latent patch coverage is important to consider in various
coverage analyses. The delay of several revisions until obtain-ing the patch coverage can be an artefact of the developmentmethodology, in which case it should be assimilated into thenormal patch coverage. Furthermore, our results show thatin most of the systems analysed, latent patch coverage issmall but non-negligible.
3.5 Bug Analysis
RQ8: Are bug fixes better covered than other typesof patches?
RQ9: Is the coverage of buggy code less than aver-age?
To answer these RQs, we collected bug data according tothe methodology presented in Section 2 and we limited ouranalysis to the three systems which lend themselves to auto-matic identification of bug fixes based on commit messages:Memcached, Redis and ØMQ. The other three systemsuse non-specific commit messages for bug fixes, requiringan extensive manual analysis or more complex algorithmssuch as machine learning and natural language processingto understand the contents of a specific revision [25]. Weignored revisions which do not affect executable files, such asfixes to the build infrastructure or the documentation andthen manually confirmed that the remaining revisions areindeed bug fixes [13] and further removed fixes which do notadd or modify executable lines. We thus obtained 41 fixes inMemcached and 22 fixes each in Redis and ØMQ.We measured the patch coverage of these revisions and
report the median values in Table 7, together with the corre-sponding overall metric for comparison. For both Memcachedand Redis, the coverage for fixes is higher than that for othertypes of patches. For Redis, the median value jumps from0% to 94.1%, while for Memcached the difference is lesspronounced. On the other hand, the fixes in ØMQ are
covered less than on average. The fraction of fixes whichhave 100% coverage follows the same trend.To try to understand whether buggy code is less thoroughly
tested than the rest of the code, we started from the observa-tion that bug-fixing revisions are usually only addressing thebug, without touching unrelated code. Because of this, wecan identify the code responsible for the bugs by lookingat the code which is removed or modified by bug-fixingrevisions and compute its coverage in the revision beforethe fix. The overall coverage for this code is 72.7% forMemcached—roughly the same as the overall patch coverage,65.2% for Redis—much larger than the overall patch coverage,and 35.8% for ØMQ—significantly lower.While these numbers cannot be used to infer the correlation
between the level of coverage and the occurrence of bugs—the sample is too small, and the bugs collected are biasedby the way they are reported—they suggest the limitationsof line coverage as a testing metric, with bugs even beingintroduced by patches with a high coverage. Therefore,even for well-tested code, tools which thoroughly check eachprogram statement for bugs using techniques such as symbolicexecution can be useful in practice—for instance, our toolZESTI [22] was specifically designed to enhance existingregression tests to check for corner-case scenarios.
3.6 Threats to ValidityThe main threat to validity in our study regards the
generalisation of our results. The patterns we have observedin our data may not generalise to other systems, or even toother development periods for the same systems. However,we regard the selected systems to be representative for open-source C/C++ code, and the analysis period was chosen inan unbiased way, starting with the current version at thetime of our experiments.Errors in the software underlying our framework could
have interfered with our experiments. Both Docker and LXCwere under development and not recommended for use inproduction systems at the time of our study. Furthermore,in case of some applications, we have observed test failurescaused by the AuFS21 filesystem used by Docker. However,we have thoroughly investigated these failures and we believethey did not affect the results presented in our study.Given the large quantity of data that we collected from
a large number of software revisions, errors in our scriptscannot be excluded. However, we have thoroughly checkedour results and scripts, and we are making our frameworkand data available for further validation.
4. RELATED WORKDespite the significant role that coverage information plays
in software testing, there are relatively few empirical studieson this topic. We discuss some representative studies below.Early work on this topic was done by Elbaum et al. [8],
who have analysed how the overall program coverage changeswhen software evolves, using a controlled experiment involv-ing the space program, and seven versions of the Bash shell.One of the key findings of this study was that even smallchanges in the code can lead to large differences in programcoverage, relative to a given test suite. This is a differentfinding from previous work, such as that by Rosenblumand Weyuker [29], which has found that coverage remains
21http://aufs.sourceforge.net/
101

stable over time for the KornShell benchmark. In this paper,we have looked at a related question, of whether overallcoverage remains stable over time, taking into considerationthe changes to the evolving test suite as well.Zaidman et al. [41] have examined the co-evolution of
code and tests on two open-source and one industrial Javaapplications. The study looks at the evolution of programcoverage over time, but only computes coverage for the majorand minor releases of each system, providing around ten datapoints for each system. By looking at the co-evolution ofcode and tests, the analysis can infer the development styleemployed by each project: one key finding is that code andtests co-evolve either synchronously, as when agile methodsare used; or phased, with periods of intense coding followedby periods of intense testing. For our benchmarks, we haveobserved both development styles.To the best of our knowledge, this is the first paper that
specifically looks at how well patches are covered over alarge number of program versions. Our prior work on testingsoftware patches [23] reported the aggregate patch coverageachieved by regression test suites, but the focus was onevaluating the patch testing technique proposed.There is a rich literature on predicting software bugs by
mining software repositories [12, 13]; however, prior workhas focused almost exclusively on static metrics, while inthis work we propose using dynamic metrics such as patchcoverage to aid the task.Our ongoing effort is to develop Covrig into a flexible
platform for mining static and dynamic metrics from softwarerepositories. In terms of similar infrastructure efforts, SIR [7]is a well-known repository for software testing research,which offers a variety of programs written in several differentlanguages, together with test suites, bug data, and scripts.SIR also provides multiple versions for the same application,but typically less than a dozen. Furthermore, SIR does notinclude any support for running versions in isolation. Ideally,the mechanisms provided by Covrig would be integratedwith the rich data in SIR to enable more types of analysesat the intersection of software testing and evolution.While SIR contains mostly artificially-generated faults,
iBUGS [5] provides a semi-automated approach for extractingbenchmarks with real bugs from project histories, using anapproach based on commit messages and regression tests.iBUGS’ idea of using the regression tests as a semi-automaticbug confirmation mechanism could be borrowed by Covrigwhenever fixes are accompanied by tests, reducing the manualeffort needed to apply it to new projects.
5. CONCLUSIONDespite the important role that regression test suites play
in software testing, there are surprisingly few empiricalstudies that report how they co-evolve with the applicationcode, and the coverage level that they achieve. Our empiricalstudy on six popular open-source applications, spanning acombined period of twelve years, aims to contribute to thisknowledge base. To the best of our knowledge, the numberof revisions executed in the context of this study—1,500—issignificantly larger than in prior work, and this is also thefirst study that specifically examines patch coverage.Our experience has revealed two main types of challenges
for conducting similar or larger studies that involve running alarge number of program revisions. The first category relatesto the inherent difficulty of running revisions:
1. Decentralised repositories have non-linear histories, soeven defining what a revision is can be difficult, andshould be done with respect to the research questionsbeing answered. In our case, we chose a granularity atthe level of commits and merges to the main branch.
2. Older revisions have undocumented dependencies onspecific compiler versions, libraries, and tools. We foundit critical to run each revision in a separate virtualisedenvironment as provided by Covrig, to make it easy toinstall the right dependencies, or adjust build scripts.
3. Some revisions do not compile. This may be due toerrors introduced during development and fixed later,or due to incompatible dependencies. The executioninfrastructure has to be flexible in tolerating such cases,and one needs a methodology for dealing with non-compilable revisions. In our case, we have skipped overthe non-compilable revisions and incorporated theirchanges into the next compilable one.
4. The execution of the regression test suite is oftennondeterministic—the test suite may nondeterministi-cally fail and some lines may be nondeterministicallyexecuted. Studies monitoring program execution needto take nondeterminism into account.
The second category of challenges relates to reproducibilityand performance. To address these challenges, we havedesigned and implemented Covrig, a flexible framework thatensures reproducibility through the use of software containerstechnology. Performance has two different aspects: at thelevel of an individual revision, we have found it essential to usea form of operating system-level virtualisation (in our case,LXC and Docker), in order to minimise the time and spaceoverhead typically associated with hardware virtualisation.Across revisions, we found it necessary to provide the abilityof running our set of revisions on multiple local and cloudmachines. For example, running the Git regression suite tookin our case 26 machine days (250 revisions × 30 min/revision× 5 runs), which would have been too expensive if we used asingle machine, especially since we also had to repeat someruns during our experimentation.We are making Covrig available to the wider research
community, together with our demonstrative empirical studyand experimental data, hoping it will encourage furtherstudies examining both static and dynamic metrics relatedto the evolution of real systems. The project webpage canbe found at http://srg.doc.ic.ac.uk/projects/covrig.
6. ACKNOWLEDGEMENTSWe thank our anonymous reviewers for their construc-
tive comments, and Oscar Soria Dustmann and HristinaPalikareva for their careful proofreading of the text. Thisresearch has been generously supported by EPSRC through aDTA studentship, an Early-Career Fellowship and the grantEP/J00636X/1, and by Google through a PhD fellowship.
102

7. REFERENCES[1] D. Babić, L. Martignoni, S. McCamant, and D. Song.
Statically-directed dynamic automated test generation.In Proc. of the International Symposium on SoftwareTesting and Analysis (ISSTA’11), July 2011.
[2] M. Böhme, B. C. d. S. Oliveira, and A. Roychoudhury.Regression tests to expose change interaction errors. InProc. of the joint meeting of the European SoftwareEngineering Conference and the ACM Symposium onthe Foundations of Software Engineering(ESEC/FSE’13), Aug. 2013.
[3] C. Cadar, D. Dunbar, and D. Engler. KLEE:Unassisted and automatic generation of high-coveragetests for complex systems programs. In Proc. of the 8thUSENIX Symposium on Operating Systems Design andImplementation (OSDI’08), Dec. 2008.
[4] G. Canfora, L. Cerulo, and M. Di Penta. Identifyingchanged source code lines from version repositories. InProc. of the 4th International Workshop on MiningSoftware Repositories (MSR’07), May 2007.
[5] V. Dallmeier and T. Zimmermann. Extraction of buglocalization benchmarks from history. In Proc. of the22nd IEEE International Conference on AutomatedSoftware Engineering (ASE’07), Nov. 2007.
[6] H. Dan and R. Hierons. Semantic mutation analysis offloating-point comparison. In Proc. of the IEEEInternational Conference on Software Testing,Verification, and Validation (ICST’12), Apr. 2012.
[7] H. Do, S. Elbaum, and G. Rothermel. Supportingcontrolled experimentation with testing techniques: Aninfrastructure and its potential impact. EmpiricalSoftware Engineering (EMSE), 10(4):405–435, Oct.2005.
[8] S. Elbaum, D. Gable, and G. Rothermel. The impactof software evolution on code coverage information. InProc. of the IEEE International Conference onSoftware Maintenance (ICSM’01), Nov. 2001.
[9] G. Fraser and A. Zeller. Mutation-driven generation ofunit tests and oracles. IEEE Transactions on SoftwareEngineering (TSE), 38(2):278–292, 2012.
[10] P. Godefroid, M. Y. Levin, and D. A. Molnar.Automated whitebox fuzz testing. In Proc. of the 15thNetwork and Distributed System Security Symposium(NDSS’08), Feb. 2008.
[11] M. J. Harrold, C. Unwersity, R. Gupta, and M. L.Soffa. A methodology for controlling the size of a testsuite. ACM Transactions on Software EngineeringMethodology (TOSEM), 2:270–285, 1993.
[12] K. Herzig, S. Just, A. Rau, and A. Zeller. Predictingdefects using change genealogies. In Proc. of the 24thInternational Symposium on Software ReliabilityEngineering (ISSRE’13), Nov. 2013.
[13] K. Herzig, S. Just, and A. Zeller. It’s not a bug, it’s afeature: How misclassification impacts bug prediction.In Proc. of the 35th International Conference onSoftware Engineering (ICSE’13), May 2013.
[14] P. Hosek and C. Cadar. Safe software updates viamulti-version execution. In Proc. of the 35thInternational Conference on Software Engineering(ICSE’13), May 2013.
[15] V. Jagannath, M. Gligoric, D. Jin, Q. Luo, G. Rosu,and D. Marinov. Improved multithreaded unit testing.
In Proc. of the joint meeting of the European SoftwareEngineering Conference and the ACM Symposium onthe Foundations of Software Engineering(ESEC/FSE’11), Sept. 2011.
[16] P. Joshi, K. Sen, and M. Shlimovich. Predictive testing:amplifying the effectiveness of software testing. In Proc.of the joint meeting of the European SoftwareEngineering Conference and the ACM Symposium onthe Foundations of Software Engineering(ESEC/FSE’07), Sept. 2007.
[17] S. Kim, T. Zimmermann, K. Pan, and E. J. J.Whitehead. Automatic identification ofbug-introducing changes. In Proc. of the 21st IEEEInternational Conference on Automated SoftwareEngineering (ASE’06), Sept. 2006.
[18] H. W. Kuhn. The hungarian method for theassignment problem. Naval Research LogisticsQuarterly, 2:83–97, 1955.
[19] V. I. Levenshtein. Binary codes capable of correctingdeletions, insertions and reversals. In Soviet physicsdoklady, volume 10, page 707, 1966.
[20] K.-K. Ma, Y. P. Khoo, J. S. Foster, and M. Hicks.Directed symbolic execution. In Proc. of the 18thInternational Static Analysis Symposium (SAS’11),Sept. 2011.
[21] P. D. Marinescu and C. Cadar. High-coverage symbolicpatch testing. In Proc. of the 19th International SPINWorkshop on Model Checking of Software (SPIN’12),July 2012.
[22] P. D. Marinescu and C. Cadar. make test-zesti: Asymbolic execution solution for improving regressiontesting. In Proc. of the 34th International Conferenceon Software Engineering (ICSE’12), June 2012.
[23] P. D. Marinescu and C. Cadar. KATCH:High-coverage testing of software patches. In Proc. ofthe joint meeting of the European Software EngineeringConference and the ACM Symposium on theFoundations of Software Engineering (ESEC/FSE’13),Aug. 2013.
[24] M. Maurer and D. Brumley. TACHYON: Tandemexecution for efficient live patch testing. In Proc. of the21st USENIX Security Symposium (USENIXSecurity’12), Aug. 2012.
[25] A. Murgia, G. Concas, M. Marchesi, and R. Tonelli. Amachine learning approach for text categorization offixing-issue commits on CVS. In Proc. of the 4thInternational Symposium on Empirical SoftwareEngineering and Measurement (ESEM’10), Sept. 2010.
[26] C. Pacheco, S. K. Lahiri, and T. Ball. Finding errorsin .NET with feedback-directed random testing. InProc. of the International Symposium on SoftwareTesting and Analysis (ISSTA’08), July 2008.
[27] S. Person, M. B. Dwyer, S. Elbaum, and C. S.Pasareanu. Differential symbolic execution. In Proc. ofthe ACM Symposium on the Foundations of SoftwareEngineering (FSE’08), Nov. 2008.
[28] S. Person, G. Yang, N. Rungta, and S. Khurshid.Directed incremental symbolic execution. In Proc. ofthe Conference on Programing Language Design andImplementation (PLDI’11), June 2011.
[29] D. Rosenblum and E. Weyuker. Using coverageinformation to predict the cost-effectiveness of
103
regression testing strategies. IEEE Transactions onSoftware Engineering (TSE), 23(3):146–156, 1997.
[30] G. Rothermel and M. J. Harrold. Analyzing regressiontest selection techniques. IEEE Transactions onSoftware Engineering (TSE), 22, 1996.
[31] A. Singhal. Modern information retrieval: a briefoverview. Bulletin of the IEEE Computer SocietyTechnical Committee on Data Engineering, 24:35–43,2001.
[32] J. Śliwerski, T. Zimmermann, and A. Zeller. When dochanges induce fixes? In Proc. of the 2005International Workshop on Mining SoftwareRepositories (MSR’05), May 2005.
[33] S. Soltesz, H. Pötzl, M. E. Fiuczynski, A. Bavier, andL. Peterson. Container-based operating systemvirtualization: A scalable, high-performance alternativeto hypervisors. In Proc. of the 2nd EuropeanConference on Computer Systems (EuroSys’07), Mar.2007.
[34] K. Sparck Jones. Document retrieval systems. chapterA Statistical Interpretation of Term Specificity and ItsApplication in Retrieval, pages 132–142. 1988.
[35] A. Srivastava and J. Thiagarajan. Effectivelyprioritizing tests in development environment. In Proc.of the International Symposium on Software Testingand Analysis (ISSTA’02), July 2002.
[36] K. Taneja, T. Xie, N. Tillmann, and J. de Halleux.
eXpress: guided path exploration for efficient regressiontest generation. In Proc. of the InternationalSymposium on Software Testing and Analysis(ISSTA’11), July 2011.
[37] J. Tucek, W. Xiong, and Y. Zhou. Efficient onlinevalidation with delta execution. In Proc. of the 14thInternational Conference on Architectural Support forProgramming Languages and Operating Systems(ASPLOS’09), Mar. 2009.
[38] C. Williams and J. Spacco. SZZ revisited: Verifyingwhen changes induce fixes. In Proc. of the 2008International Workshop on Defects in Large SoftwareSystems (DEFECTS’08), July 2008.
[39] Z. Xu, Y. Kim, M. Kim, G. Rothermel, and M. B.Cohen. Directed test suite augmentation: techniquesand tradeoffs. In Proc. of the ACM Symposium on theFoundations of Software Engineering (FSE’10), Nov.2010.
[40] Z. Xu and G. Rothermel. Directed test suiteaugmentation. In Proc. of the 16th Asia-PacificSoftware Engineering Conference (ASPEC’09), Dec.2009.
[41] A. Zaidman, B. V. Rompaey, A. van Deursen, andS. Demeyer. Studying the co-evolution of productionand test code in open source and industrial developertest processes through repository mining. EmpiricalSoftware Engineering (EMSE), 16(3):325–364, 2011.
104


