COVID-19 Weekly Trend Insights
28
COVID-19 Weekly Trend Insights Compiled on 12/18/2020
Transcript of COVID-19 Weekly Trend Insights

COVID-19 Weekly Trend InsightsCompiled on 12/18/2020

Confidential
Executive Summary
2
• Given the recent launch of the Pfizer coronavirus vaccine , which was first distributed on December 14th, Symphony is monitoring vaccine NDC and CPT codes to provide clients with a first-look at the national roll-out efforts. We anticipate script activity for the latest vaccines to report in the coming weeks.
• Slide 5 and 6 provide a timeline of recent events in vaccine roll-out including: dosing, availability, logistics and cost for both Pfizer and Modernaproducts.
• Since our last COVID-19 insights report on November 20th, global cases have increased by approximately 9.09 million or 14%. • Overall cases in the U.S. have increased by 22% or 3.11 million since the last report. All states within the top 10 observed double digit growth in
confirmed cases. California, Ohio, and Pennsylvania witnessed case spikes of over 30% from our last report.
• Use of telemedicine has been on the rise since mid-November, corresponding to the spike in COVID-19 cases. Neoplasms and disease of the blood currently have the highest relative increase in use of telemedicine.
• All elective therapy trends are reporting -1% down from the previous insights report. Overall growth in elective therapy markets have been stagnant through-out the pandemic.
• As of week ending 12/11/2020, total prescription volumes remain -7% below prior year trends. The bulk of the decline is driven by fewer new prescriptions through November/December, a stark contrast to the recent upticks in COVID-19 diagnoses.
• Lower retail store activity in particular continues to drive overall national trends as we near the end of 2020.
COVID-19 News
& Latest Trends
Patient Monitoring Highlights
General Health Checks
• Amongst the Covid-19 diagnosed patients, 54% of the diagnosed patients are 50 years or older, the median age is 52. • 17% of the diagnosed patients had at least one record of inpatient care for their diagnosis. Amongst the most common locations of care for
Covid-19 diagnosed patients over most recent 4-week time period of Nov 15- Dec 12 patients seen in inpatient hospital setting are almost 20 years older than patients seen through outpatient, office, and telehealth.
• In the most recent 2-week period, Cleveland, Chicago, Philadelphia, Ann Arbor and Sioux Falls were the top cities with high Covid-19 diagnosed patients at ER or inpatient hospital settings. Miami, Cleveland, Minneapolis, Fort Wayne, and Grand Rapids were the top 5 citieswith high Covid-19 diagnosed patients at outpatient settings.
• Over the most recent 4-week period of Nov 15- Dec 12, Azithromycin and dexamethasone, continue to be most common treatments.

Confidential
Executive Summary
3
• COVID-19: Current Events & Latest Trends – Slide 4-9− COVID-19 Vaccine Update – Slide 5-6
• COVID-19 Patient Monitoring – Slide 10-19• General Market Pulse: Slide 26-35
− Telemedicine & Care Delivery Trends− National / Channel Summaries− Select Elective Therapy Monitoring – Slide 20-28
General Health Checks

COVID-19: Current Events
Confidential 4
COVID-19: Current Events & Latest Trends

There will be more than 6 million doses of Moderna vaccines shipped to over 3,200 sites (compared to Pfizer’s 636 sites).
Moderna's vaccine can be kept at about minus-20 degrees Celsius, or the temperature of a home freezer. Moderna's vaccine can also be kept in a refrigerator for 30 days
before it expires.
Moderna's vaccine distribution is being coordinated by McKesson, one of the largest medical supply distributors.
December 18th:
FDA approval is anticipated for the Emergency Use Authorization (EUA) of Moderna’s vaccine.
The vaccines will be administered in an order established by state and local authorities. Vaccine advisers to the CDC recommended that health care workers and residents of
long-term care facilities be first in line for any coronavirus vaccines that get emergency approval.
The 636 distribution sites are mainly large hospitals and other facilities able to meet the ultra-cold storage requirements. Within three weeks, vaccines should be delivered to all
vaccination sites identified by states, such as local pharmacies.
Pfizer will ship its vaccine using UPS and FedEx as its main distributors. In a key distribution challenge, the vaccine, co-developed with BioNTech, must be stored and
shipped at ultra-low temperatures — about 94 degrees below zero. Pfizer has developed a “cold chain” of shipping containers that use dry ice and GPS-enabled sensors which
will allow the company to track each shipment and ensure it stays cold.
December 14th:
The first shipments left Pfizer’s manufacturing plant in Kalamazoo, Michigan, by truck and then flown to regional hubs around the country.
COVID-19 VACCINES LAUNCH: PFIZER/BIONTECH vs. MODERNA
Sources:https://news.yahoo.com/us-allows-emergency-covid-19-023031066.htmlhttps://news.yahoo.com/many-doses-state-receive-152141112.htmlhttps://news.yahoo.com/side-effects-covid-19-vaccine-110035061.htmlhttps://www.cnn.com/2020/12/17/health/moderna-vaccine-what-we-know/index.html

Confidential 6
• DOSING: The Pfizer/BioNTech and the Moderna vaccines both require two doses, given 21 and 28 days apart, respectively.
− Pfizer's vaccine is administered as two, 30-microgram doses
− Moderna’s vaccine is administered as two, 100-microgram doses
• Each dose will report as a new fill (the 2nd dose will not be captured as a refill).
• Since the vaccines differ in composition, storage, and time between the two doses, experts say people must take the same vaccine for both doses.
• LOGISTICS: Differences in storage requirements suggest that Pfizer's vaccine may be used more for major institutions with established infrastructure like hospitals, while Moderna's may be more useful to smaller facilities like local chains or pharmacies.
• Medical distributor McKesson and pharmacy chains, including CVS and Walgreens, are involved in the initial rollout and vaccinations at nursing homes and assisted living centers.
COVID-19 VACCINES LAUNCH: PFIZER/BIONTECH vs. MODERNATRENDS TO WATCH
Sources:https://news.yahoo.com/us-allows-emergency-covid-19-023031066.htmlhttps://news.yahoo.com/many-doses-state-receive-152141112.htmlhttps://news.yahoo.com/side-effects-covid-19-vaccine-110035061.htmlhttps://www.cnn.com/2020/12/17/health/moderna-vaccine-what-we-know/index.html
• AVAILABILITY: The White House did not lock in an additional 100M doses of the Pfizer vaccine for delivery in Q2 2021 so additional Pfizer orders will be unavailable until some time after. As a result, Pfizer trends may dip after the initial round of vaccines are administered.
• The White House administration did purchase 100M doses of Moderna’s vaccine on top of the original order and contends there is now enough in the pipeline for all Americans to be vaccinated by Q2 2021.
• COST: Both vaccines are already funded through federal support of manufacturing and distribution. According to the CDC, vaccine doses purchased with U.S. taxpayer dollars will be given to the American people at no cost. However, vaccine providers will be able to charge administration fees for giving or administering the shot. Vaccine providers can get this fee reimbursed by the patient’s public or private insurance company or, for uninsured patients, by the Health Resources and Services Administration’s Provider Relief Fund.
DOSING & LOGISTICS
AVAILABILITY & COST
Confidential 7
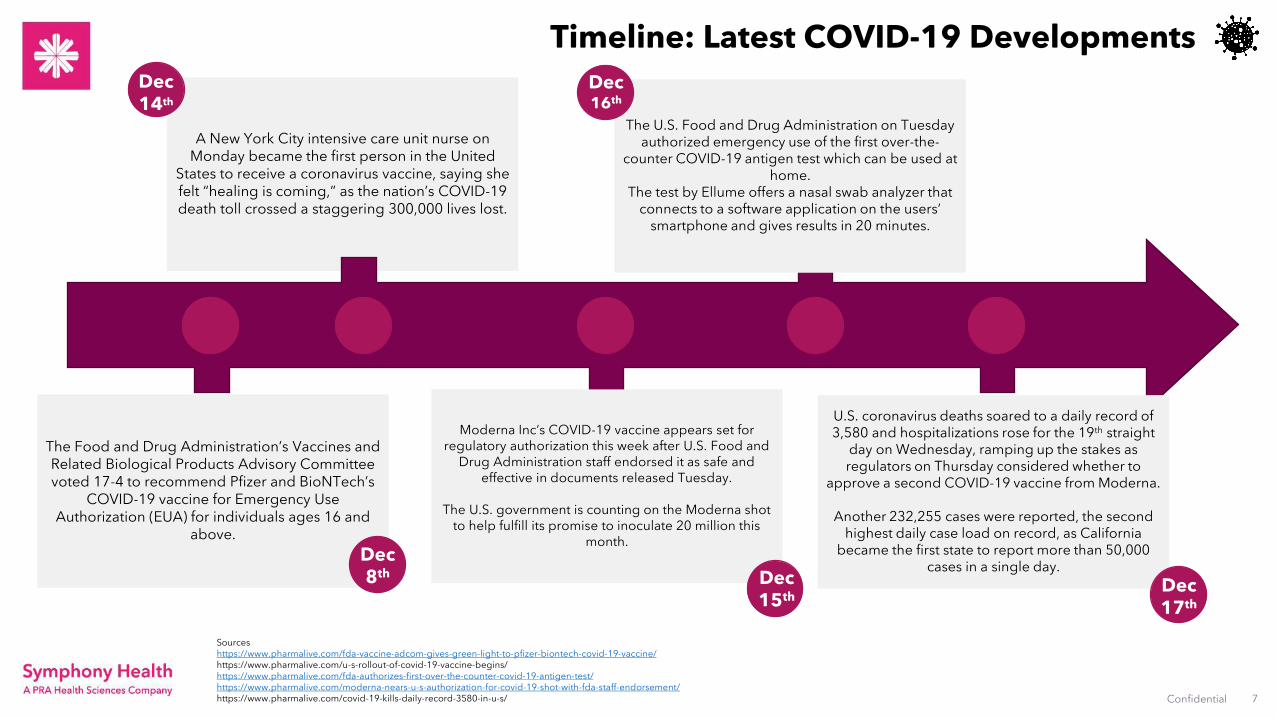
Timeline: Latest COVID-19 Developments
A New York City intensive care unit nurse on Monday became the first person in the United
States to receive a coronavirus vaccine, saying she felt “healing is coming,” as the nation’s COVID-19 death toll crossed a staggering 300,000 lives lost.
The Food and Drug Administration’s Vaccines and Related Biological Products Advisory Committee voted 17-4 to recommend Pfizer and BioNTech’s
COVID-19 vaccine for Emergency Use Authorization (EUA) for individuals ages 16 and
above.
Moderna Inc’s COVID-19 vaccine appears set for regulatory authorization this week after U.S. Food and
Drug Administration staff endorsed it as safe and effective in documents released Tuesday.
The U.S. government is counting on the Moderna shot to help fulfill its promise to inoculate 20 million this
month.
The U.S. Food and Drug Administration on Tuesday authorized emergency use of the first over-the-
counter COVID-19 antigen test which can be used at home.
The test by Ellume offers a nasal swab analyzer that connects to a software application on the users’
smartphone and gives results in 20 minutes.
U.S. coronavirus deaths soared to a daily record of 3,580 and hospitalizations rose for the 19th straight
day on Wednesday, ramping up the stakes as regulators on Thursday considered whether to
approve a second COVID-19 vaccine from Moderna.
Another 232,255 cases were reported, the second highest daily case load on record, as California
became the first state to report more than 50,000 cases in a single day.
Dec 8th
Dec 16th
Dec 15th
Dec 17th
Sourceshttps://www.pharmalive.com/fda-vaccine-adcom-gives-green-light-to-pfizer-biontech-covid-19-vaccine/https://www.pharmalive.com/u-s-rollout-of-covid-19-vaccine-begins/https://www.pharmalive.com/fda-authorizes-first-over-the-counter-covid-19-antigen-test/https://www.pharmalive.com/moderna-nears-u-s-authorization-for-covid-19-shot-with-fda-staff-endorsement/https://www.pharmalive.com/covid-19-kills-daily-record-3580-in-u-s/
Dec 14th
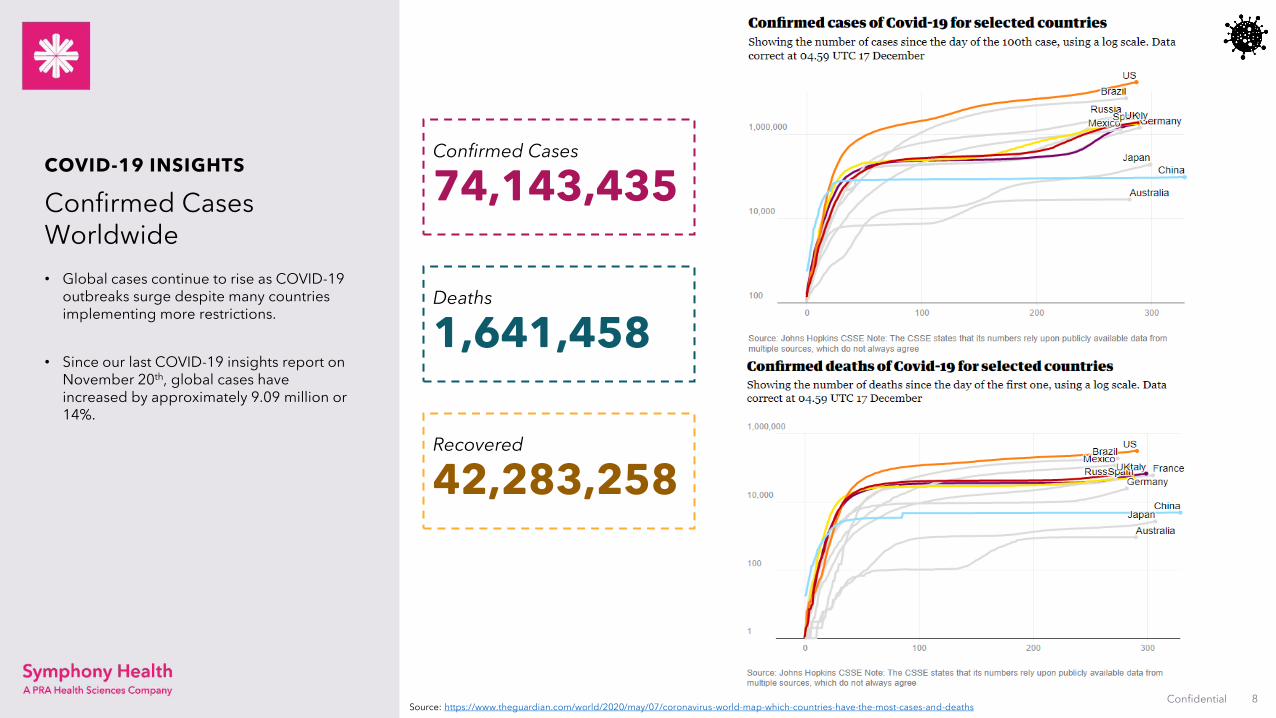
• Global cases continue to rise as COVID-19 outbreaks surge despite many countries implementing more restrictions.
• Since our last COVID-19 insights report on November 20th, global cases have increased by approximately 9.09 million or 14%.
Confidential 8Source: https://www.theguardian.com/world/2020/may/07/coronavirus-world-map-which-countries-have-the-most-cases-and-deaths
Confirmed Cases Worldwide
COVID-19 INSIGHTSConfirmed Cases
74,143,435
Deaths
1,641,458
Recovered
42,283,258
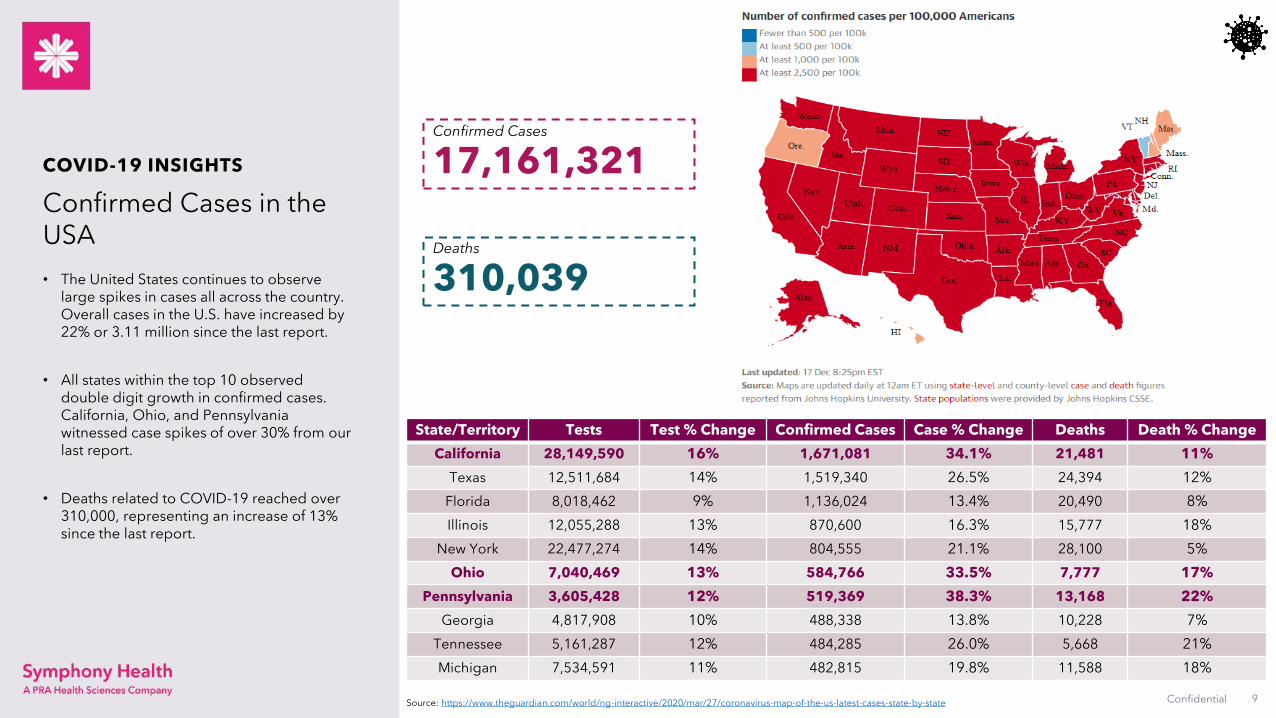
Confirmed Cases in the USA
Confidential 9
COVID-19 INSIGHTS
Source: https://www.theguardian.com/world/ng-interactive/2020/mar/27/coronavirus-map-of-the-us-latest-cases-state-by-state
• The United States continues to observe large spikes in cases all across the country. Overall cases in the U.S. have increased by 22% or 3.11 million since the last report.
• All states within the top 10 observed double digit growth in confirmed cases. California, Ohio, and Pennsylvania witnessed case spikes of over 30% from our last report.
• Deaths related to COVID-19 reached over 310,000, representing an increase of 13% since the last report.
Confirmed Cases
17,161,321
Deaths
310,039
State/Territory Tests Test % Change Confirmed Cases Case % Change Deaths Death % ChangeCalifornia 28,149,590 16% 1,671,081 34.1% 21,481 11%
Texas 12,511,684 14% 1,519,340 26.5% 24,394 12%Florida 8,018,462 9% 1,136,024 13.4% 20,490 8%Illinois 12,055,288 13% 870,600 16.3% 15,777 18%
New York 22,477,274 14% 804,555 21.1% 28,100 5%Ohio 7,040,469 13% 584,766 33.5% 7,777 17%
Pennsylvania 3,605,428 12% 519,369 38.3% 13,168 22%Georgia 4,817,908 10% 488,338 13.8% 10,228 7%
Tennessee 5,161,287 12% 484,285 26.0% 5,668 21%Michigan 7,534,591 11% 482,815 19.8% 11,588 18%

COVID-19 Patient Monitoring:Demographics & Treatments
Confidential 10
COVID-19: Overview of PRA Real World Data

Through patient activity observed for diagnosis, testing, exposure or symptoms of Covid-19 infection, PRA is tracking about 25.9 million patients overall and 2.77 million diagnosed patients in its US real world data during the time period Feb 2 to Dec 10, 2020. Patients could be reported in multiple status categories based on claims captured and mapped to status
PRA US patient longitudinally linked medical and hospital claims data, raw patient volumes
PRA US Patient Real World Data COVID-19 Infection Trends
18-Jul 25-Jul 1-Aug 8-Aug 15-Aug 22-Aug 29-Aug 5-Sep 12-Sep 19-Sep 26-Sep 3-Oct 10-Oct 17-Oct 24-Oct 31-Oct 7-Nov 14-Nov 21-Nov 28-Nov 5-Dec 12-Dec
100,991 92,738 84,211 74,015 65,628 58,864 55,484 53,328 45,623 49,933 51,360 57,256 67,059 73,784 82,240 95,693 130,460 157,406 161,579 134,495 114,696 87,496
TOTAL DIAGNOSED PATIENT VOULMES BY WEEK ENDING DATE
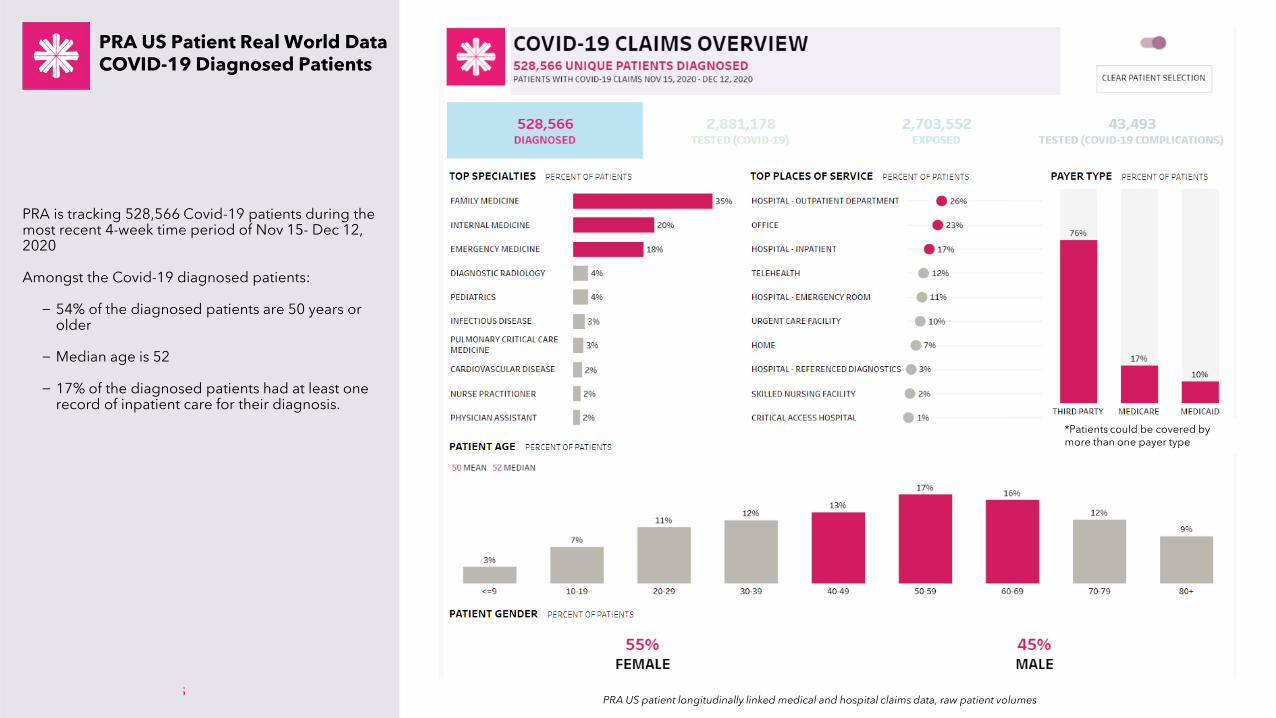
PRA is tracking 528,566 Covid-19 patients during the most recent 4-week time period of Nov 15- Dec 12, 2020
Amongst the Covid-19 diagnosed patients:
− 54% of the diagnosed patients are 50 years or older
− Median age is 52
− 17% of the diagnosed patients had at least one record of inpatient care for their diagnosis.
PRA US patient longitudinally linked medical and hospital claims data, raw patient volumes
PRA US Patient Real World Data COVID-19 Diagnosed Patients
*Patients could be covered by more than one payer type
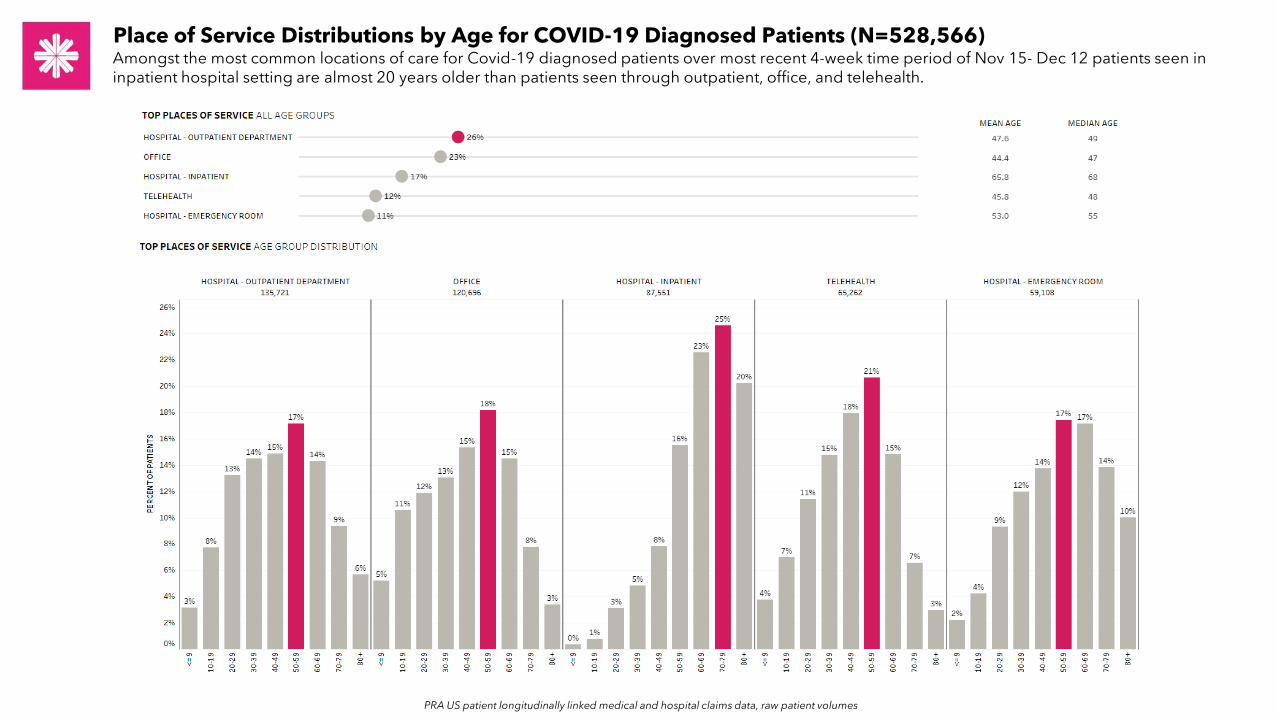
Place of Service Distributions by Age for COVID-19 Diagnosed Patients (N=528,566)Amongst the most common locations of care for Covid-19 diagnosed patients over most recent 4-week time period of Nov 15- Dec 12 patients seen in inpatient hospital setting are almost 20 years older than patients seen through outpatient, office, and telehealth.
PRA US patient longitudinally linked medical and hospital claims data, raw patient volumes
14Confidential
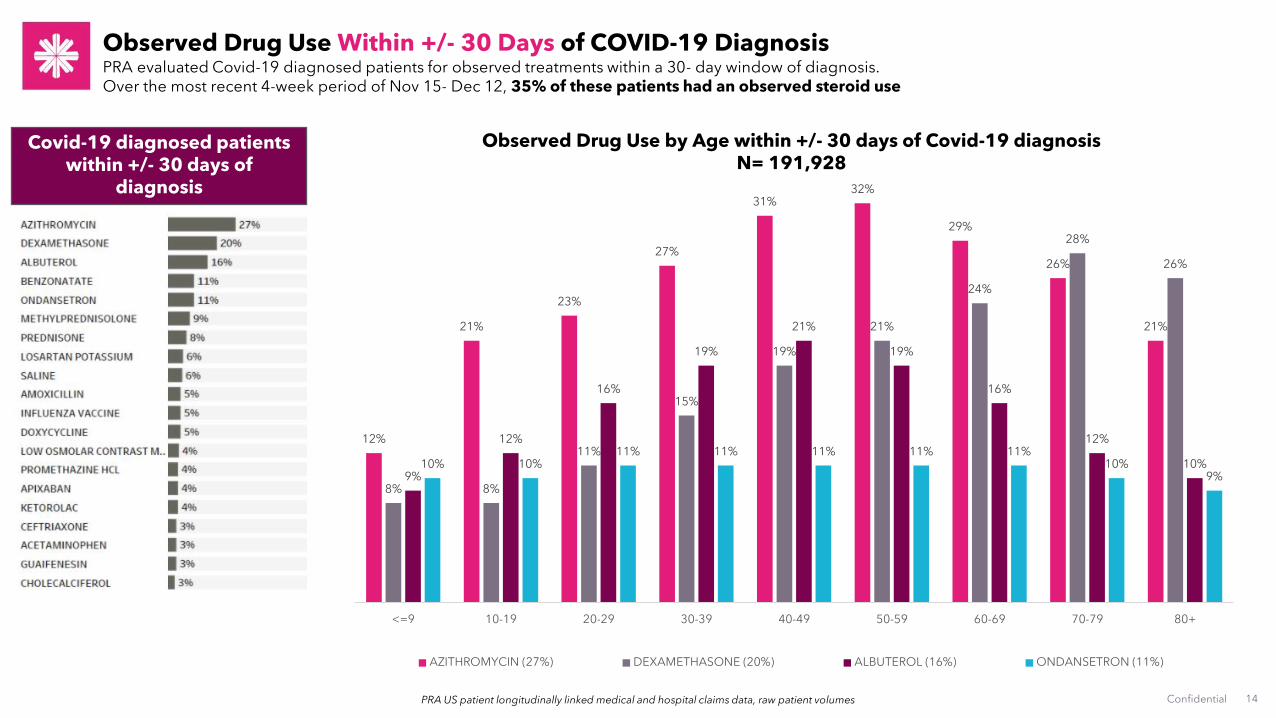
Observed Drug Use Within +/- 30 Days of COVID-19 Diagnosis PRA evaluated Covid-19 diagnosed patients for observed treatments within a 30- day window of diagnosis.Over the most recent 4-week period of Nov 15- Dec 12, 35% of these patients had an observed steroid use
PRA US patient longitudinally linked medical and hospital claims data, raw patient volumes
Covid-19 diagnosed patients within +/- 30 days of
diagnosis
Observed Drug Use by Age within +/- 30 days of Covid-19 diagnosisN= 191,928
12%
21%
23%
27%
31%32%
29%
26%
21%
8% 8%
11%
15%
19%
21%
24%
28%
26%
9%
12%
16%
19%
21%
19%
16%
12%
10%10% 10%11% 11% 11% 11% 11%
10%9%
<=9 10-19 20-29 30-39 40-49 50-59 60-69 70-79 80+
AZITHROMYCIN (27%) DEXAMETHASONE (20%) ALBUTEROL (16%) ONDANSETRON (11%)
15Confidential
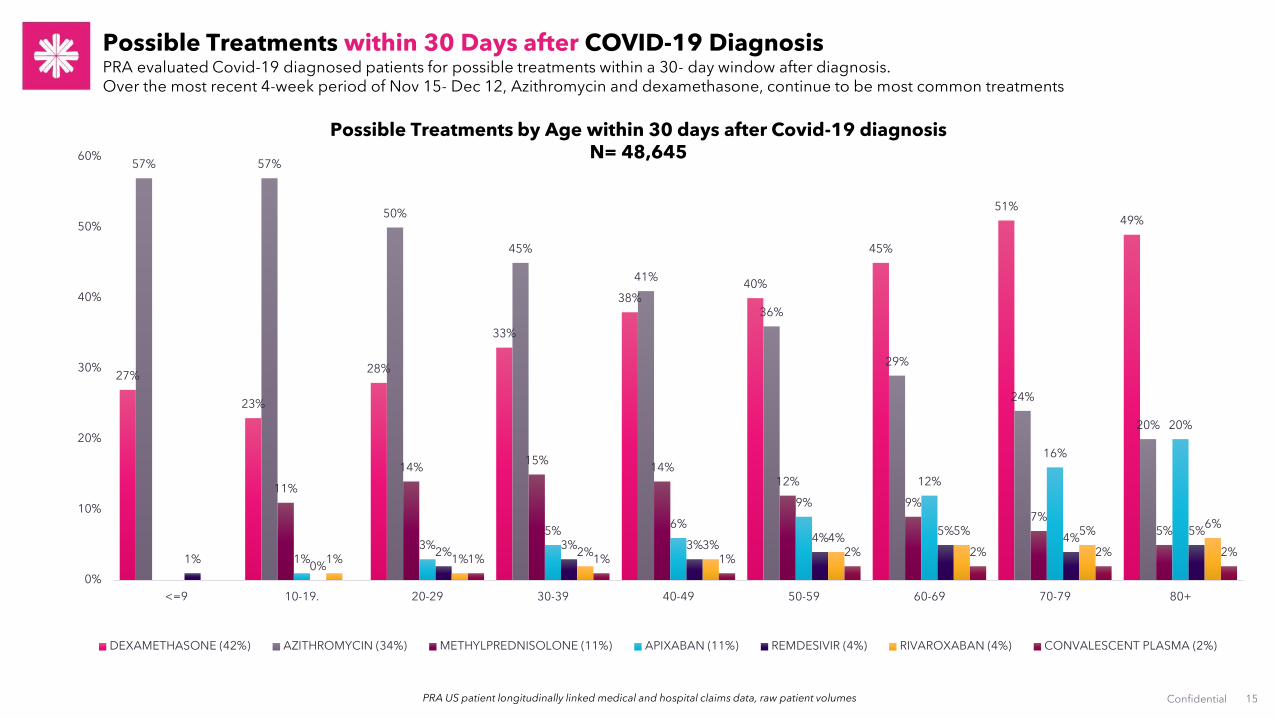
Possible Treatments within 30 Days after COVID-19 Diagnosis PRA evaluated Covid-19 diagnosed patients for possible treatments within a 30- day window after diagnosis.Over the most recent 4-week period of Nov 15- Dec 12, Azithromycin and dexamethasone, continue to be most common treatments
PRA US patient longitudinally linked medical and hospital claims data, raw patient volumes
Possible Treatments by Age within 30 days after Covid-19 diagnosisN= 48,645
27%
23%
28%
33%
38%40%
45%
51%49%
57% 57%
50%
45%
41%
36%
29%
24%
20%
11%
14% 15% 14%12%
9%7%
5%
1%3%
5% 6%
9%
12%
16%
20%
1% 0%2% 3% 3% 4% 5% 4% 5%
1% 1% 2% 3% 4% 5% 5% 6%
1% 1% 1% 2% 2% 2% 2%
0%
10%
20%
30%
40%
50%
60%
<=9 10-19. 20-29 30-39 40-49 50-59 60-69 70-79 80+
DEXAMETHASONE (42%) AZITHROMYCIN (34%) METHYLPREDNISOLONE (11%) APIXABAN (11%) REMDESIVIR (4%) RIVAROXABAN (4%) CONVALESCENT PLASMA (2%)
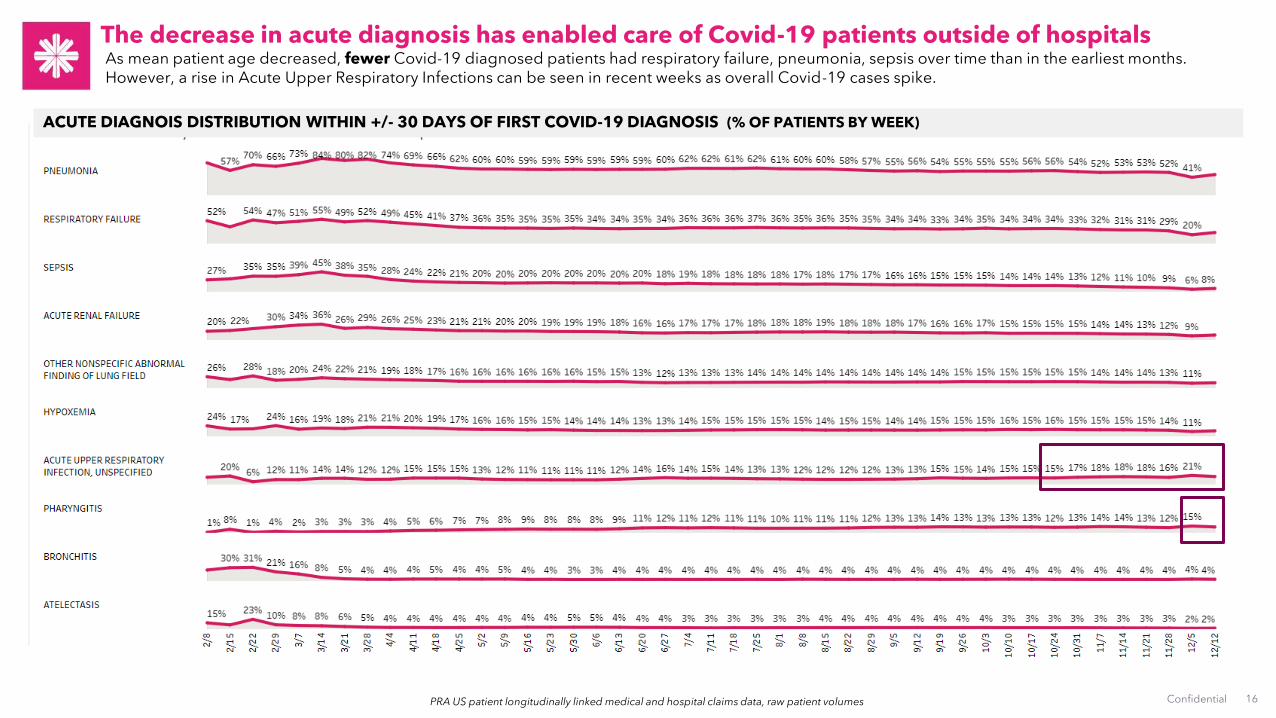
Confidential 16
The decrease in acute diagnosis has enabled care of Covid-19 patients outside of hospitals As mean patient age decreased, fewer Covid-19 diagnosed patients had respiratory failure, pneumonia, sepsis over time than in the earliest months. However, a rise in Acute Upper Respiratory Infections can be seen in recent weeks as overall Covid-19 cases spike.
ACUTE DIAGNOIS DISTRIBUTION WITHIN +/- 30 DAYS OF FIRST COVID-19 DIAGNOSIS (% OF PATIENTS BY WEEK)
PRA US patient longitudinally linked medical and hospital claims data, raw patient volumes

ER and Inpatient Hospital- Top 50 CitiesPRA is tracking patients diagnosed with Covid-19 at Emergency Room and Inpatient Hospital settings to identified cities with high patient volume of severe cases. In the most recent 2-week period, Cleveland, Chicago, Philadelphia, Ann Arbor and Sioux Falls were the top cities with high Covid-19 diagnosed patients at ER or inpatient hospital settings.
PRA US patient longitudinally linked medical and hospital claims data, raw patient volumes
Top 10 cities are highlighted in pink

Outpatient- Top 50 CitiesPRA is tracking patients diagnosed with Covid-19 at Outpatient settings to identify cities with high patient volume of Covid-19 cases. In the most recent 2-week period, Miami, Cleveland, Minneapolis, Fort Wayne, and Grand Rapids were the top 5 cities with high Covid-19 diagnosed patients at outpatient settings.
PRA US patient longitudinally linked medical and hospital claims data, raw patient volumes
Top 10 cities are highlighted in pink
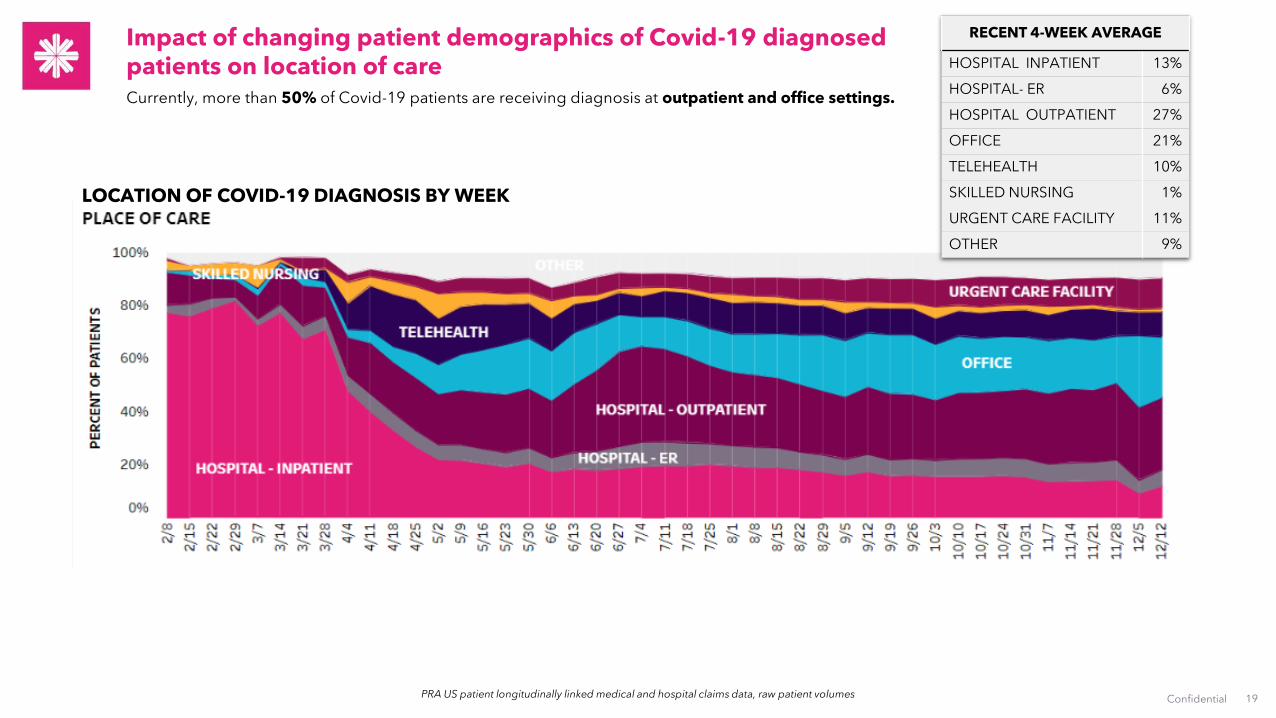
Confidential 19PRA US patient longitudinally linked medical and hospital claims data, raw patient volumes
Impact of changing patient demographics of Covid-19 diagnosed patients on location of care Currently, more than 50% of Covid-19 patients are receiving diagnosis at outpatient and office settings.
LOCATION OF COVID-19 DIAGNOSIS BY WEEK
RECENT 4-WEEK AVERAGE
HOSPITAL INPATIENT 13%
HOSPITAL- ER 6%
HOSPITAL OUTPATIENT 27%
OFFICE 21%
TELEHEALTH 10%
SKILLED NURSING 1%
URGENT CARE FACILITY 11%
OTHER 9%

General Market Pulse
Confidential 20
Care Delivery Trends: Telemedicine & Office Visits
National / Channel Summaries & Elective Therapy Monitoring

0
50
100
150
200
250
300
CERTAIN INFECTIOUS AND PARASITIC DISEASES
DISEASES OF THE BLOOD AND BLOOD-FORMING ORGANS AND CERTAIN DISORDERS INVOLVING THE IMMUNE MECHANISM
DISEASES OF THE CIRCULATORY SYSTEM
DISEASES OF THE DIGESTIVE SYSTEM
DISEASES OF THE GENITOURINARY SYSTEM
DISEASES OF THE NERVOUS SYSTEM
DISEASES OF THE RESPIRATORY SYSTEM
ENDOCRINE, NUTRITIONAL AND METABOLIC DISEASES
MENTAL AND BEHAVIORAL DISORDERS
NEOPLASMS
PREGNANCY, CHILDBIRTH AND THE PUERPERIUM
Confidential 21
Index = Current Week divided by the 12 Week Rolling Average (from the same time period in 2019)
Inde
x
• Use of telemedicine has been on the rise since mid-November, corresponding to the spike in COVID-19 cases.
• Neoplasms and disease of the blood currently have the highest relative increase in use of telemedicine.
• All diagnosis groups are down over 50% from their peak in the week of May 1, but still many times their 2019 levels.
• Respiratory, genitourinary and infectious/parasitic diseases initially spiked, but have since returned to pre-COVID levels.
Telemedicine Visits:Diagnosis
• An index of 1 means the current week has the same number of claims as the 12 week rolling average from 2019 (100% of 2019 volume).• An index of 5 means there are 5 times as many claims in the current week as in the 12 week rolling average from 2019 (500% of 2019 volume).• An index of 0.5 means the current week had 50% fewer claims than the 12 week rolling average from 2019 (50% of 2019 volume).
Telemedicine Visits by Diagnosis

0
0.2
0.4
0.6
0.8
1
1.2
1.4
1.6
CERTAIN INFECTIOUS AND PARASITIC DISEASES
DISEASES OF THE BLOOD AND BLOOD-FORMING ORGANS AND CERTAIN DISORDERS INVOLVING THE IMMUNE MECHANISM
DISEASES OF THE CIRCULATORY SYSTEM
DISEASES OF THE DIGESTIVE SYSTEM
DISEASES OF THE GENITOURINARY SYSTEM
DISEASES OF THE NERVOUS SYSTEM
DISEASES OF THE RESPIRATORY SYSTEM
ENDOCRINE, NUTRITIONAL AND METABOLIC DISEASES
MENTAL AND BEHAVIORAL DISORDERS
NEOPLASMS
PREGNANCY, CHILDBIRTH AND THE PUERPERIUM
Confidential 22
Inde
x
• As of the week of December, office visits for all diagnosis groups except nervous system, infection/parasitic diseases, mental/behavioral health and diseases of the respiratory are at or above 2019 levels.
• Visits for pregnancy and childbirth were the least affected diagnosis group.
• Diseases of the respiratory system and mental and behavioral health -which bottomed out during the week of April 17 - have improved but still remain below 2019 levels (down 64% and 32% respectively).
Office Visits:Diagnosis
Index = Current Week divided by the 12 Week Rolling Average (from the same time period in 2019)
• An index of 1 means the current week has the same number of claims as the 12 week rolling average from 2019 (100% of 2019 volume).• An index of 5 means there are 5 times as many claims in the current week as in the 12 week rolling average from 2019 (500% of 2019 volume).• An index of 0.5 means the current week had 50% fewer claims than the 12 week rolling average from 2019 (50% of 2019 volume).
Office Visits by Diagnosis

Confidential 23
• Since mid-November, there has been a slight uptick in the use of telemedicine for most specialties.
• Use of telemedicine by all specialties remain at least 20 times their 2019 levels.
• Cardiologists remain the highest among specialties tracked for telemedicine usage.
Telemedicine Visits:Specialty
Index = Current Week divided by the 12 Week Rolling Average (from the same time period in 2019)
Inde
x
• An index of 1 means the current week has the same number of claims as the 12 week rolling average from 2019 (100% of 2019 volume).• An index of 5 means there are 5 times as many claims in the current week as in the 12 week rolling average from 2019 (500% of 2019 volume).• An index of 0.5 means the current week had 50% fewer claims than the 12 week rolling average from 2019 (50% of 2019 volume).
0
50
100
150
200
250
300
350
400
20
20-0
2-0
7
20
20-0
2-1
4
20
20-0
2-2
1
20
20-0
2-2
8
20
20-0
3-0
6
20
20-0
3-1
3
20
20-0
3-2
0
20
20-0
3-2
7
20
20-0
4-0
3
20
20-0
4-1
0
20
20-0
4-1
7
20
20-0
4-2
4
20
20-0
5-0
1
20
20-0
5-0
8
20
20-0
5-1
5
20
20-0
5-2
2
20
20-0
5-2
9
20
20-0
6-0
5
20
20-0
6-1
2
20
20-0
6-1
9
20
20-0
6-2
6
20
20-0
7-0
3
20
20-0
7-1
0
20
20-0
7-1
7
20
20-0
7-2
4
20
20-0
7-3
1
20
20-0
8-0
7
20
20-0
8-1
4
20
20-0
8-2
1
20
20-0
8-2
8
20
20-0
9-0
4
20
20-0
9-1
1
20
20-0
9-1
8
20
20-0
9-2
5
20
20-1
0-0
2
20
20-1
0-0
9
20
20-1
0-1
6
20
20-1
0-2
3
20
20-1
0-3
0
20
20-1
1-0
6
20
20-1
1-1
3
20
20-1
1-2
0
20
20-1
1-2
7
20
20-1
2-0
4
20
20-1
2-1
1
CARDIOVASCULAR DISEASES
FAMILY GENERAL PRACTICE
GENERAL PREVENTIVE MEDICINE
INTERNAL MEDICINE
NEUROLOGY
NURSE PRACTITIONER
OBSTETRICS AND GYNECOLOGY
ONCOLOGY MEDICAL
PEDIATRICS
PSYCHIATRY
Telemedicine Visits by Specialty

Confidential 24
• Psychiatry office visits remain down by more than 60% and visits to pediatricians are down 35% compared to 2019 levels. Both have shown little or no signs of improvement since August.
• Office visits for all other specialties are at least 85% of 2019 levels while oncology, obstetrics and gynecology, and cardiologists are above 2019 levels.
Inde
x
Office Visits:Specialty
Index = Current Week divided by the 12 Week Rolling Average (from the same time period in 2019)
• An index of 1 means the current week has the same number of claims as the 12 week rolling average from 2019 (100% of 2019 volume).• An index of 5 means there are 5 times as many claims in the current week as in the 12 week rolling average from 2019 (500% of 2019 volume).• An index of 0.5 means the current week had 50% fewer claims than the 12 week rolling average from 2019 (50% of 2019 volume).
0
0.2
0.4
0.6
0.8
1
1.2
1.4
1.6
20
20-0
2-0
7
20
20-0
2-1
4
20
20-0
2-2
1
20
20-0
2-2
82
020
-03
-06
20
20-0
3-1
32
020
-03
-20
20
20-0
3-2
72
020
-04
-03
20
20-0
4-1
0
20
20-0
4-1
72
020
-04
-24
20
20-0
5-0
1
20
20-0
5-0
8
20
20-0
5-1
52
020
-05
-22
20
20-0
5-2
9
20
20-0
6-0
5
20
20-0
6-1
22
020
-06
-19
20
20-0
6-2
6
20
20-0
7-0
3
20
20-0
7-1
0
20
20-0
7-1
72
020
-07
-24
20
20-0
7-3
12
020
-08
-07
20
20-0
8-1
4
20
20-0
8-2
1
20
20-0
8-2
82
020
-09
-04
20
20-0
9-1
1
20
20-0
9-1
82
020
-09
-25
20
20-1
0-0
2
20
20-1
0-0
9
20
20-1
0-1
62
020
-10
-23
20
20-1
0-3
02
020
-11
-06
20
20-1
1-1
32
020
-11
-20
20
20-1
1-2
72
020
-12
-04
20
20-1
2-1
1
CARDIOVASCULAR DISEASES
FAMILY GENERAL PRACTICE
GENERAL PREVENTIVE MEDICINE
INTERNAL MEDICINE
NEUROLOGY
NURSE PRACTITIONER
OBSTETRICS AND GYNECOLOGY
ONCOLOGY MEDICAL
PEDIATRICS
PSYCHIATRY
Office Visits by Specialty
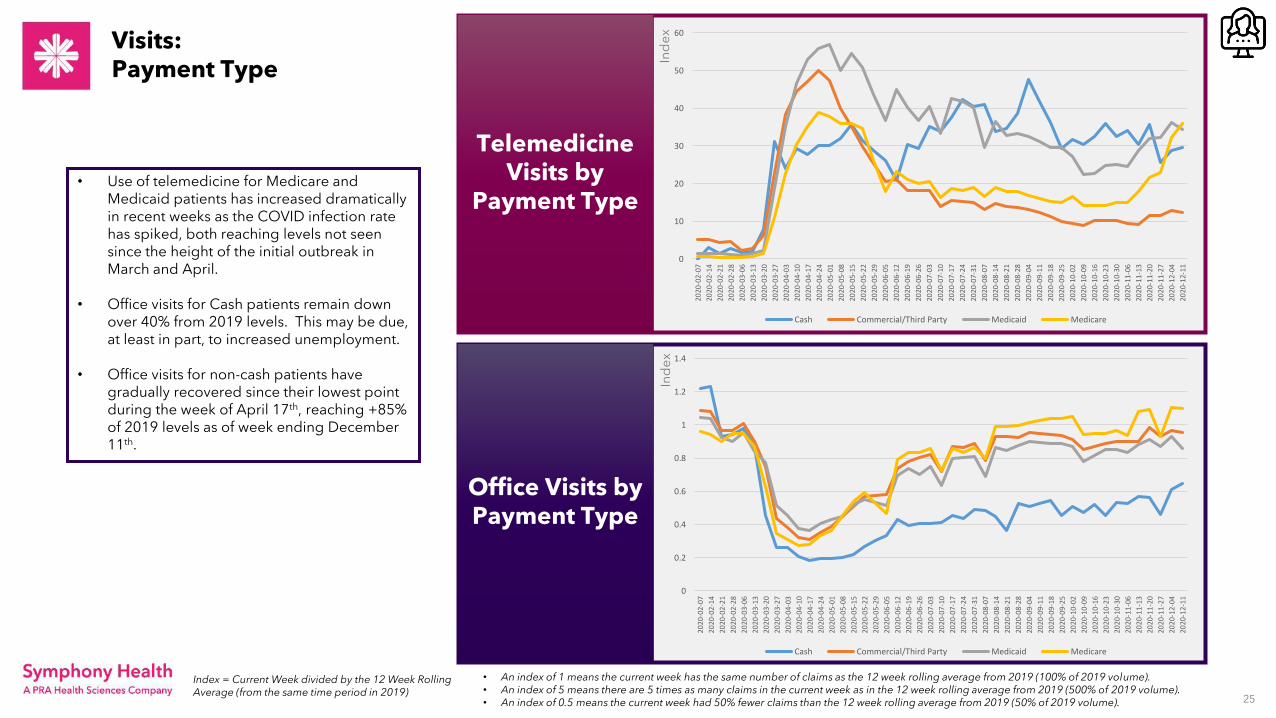
25
Visits:Payment Type
• Use of telemedicine for Medicare and Medicaid patients has increased dramatically in recent weeks as the COVID infection rate has spiked, both reaching levels not seen since the height of the initial outbreak in March and April.
• Office visits for Cash patients remain down over 40% from 2019 levels. This may be due, at least in part, to increased unemployment.
• Office visits for non-cash patients have gradually recovered since their lowest point during the week of April 17th, reaching +85% of 2019 levels as of week ending December 11th.
Inde
xIn
dex
Telemedicine Visits by
Payment Type
Office Visits by Payment Type
Index = Current Week divided by the 12 Week Rolling Average (from the same time period in 2019)
• An index of 1 means the current week has the same number of claims as the 12 week rolling average from 2019 (100% of 2019 volume).• An index of 5 means there are 5 times as many claims in the current week as in the 12 week rolling average from 2019 (500% of 2019 volume).• An index of 0.5 means the current week had 50% fewer claims than the 12 week rolling average from 2019 (50% of 2019 volume).
0
10
20
30
40
50
60
2020
-02-
07
2020
-02-
14
2020
-02-
21
2020
-02-
28
2020
-03-
06
2020
-03-
13
2020
-03-
20
2020
-03-
27
2020
-04-
03
2020
-04-
10
2020
-04-
17
2020
-04-
24
2020
-05-
01
2020
-05-
08
2020
-05-
15
2020
-05-
22
2020
-05-
29
2020
-06-
05
2020
-06-
12
2020
-06-
19
2020
-06-
26
2020
-07-
03
2020
-07-
10
2020
-07-
17
2020
-07-
24
2020
-07-
31
2020
-08-
07
2020
-08-
14
2020
-08-
21
2020
-08-
28
2020
-09-
04
2020
-09-
11
2020
-09-
18
2020
-09-
25
2020
-10-
02
2020
-10-
09
2020
-10-
16
2020
-10-
23
2020
-10-
30
2020
-11-
06
2020
-11-
13
2020
-11-
20
2020
-11-
27
2020
-12-
04
2020
-12-
11
Cash Commercial/Third Party Medicaid Medicare
0
0.2
0.4
0.6
0.8
1
1.2
1.4
2020
-02-
07
2020
-02-
14
2020
-02-
21
2020
-02-
28
2020
-03-
06
2020
-03-
13
2020
-03-
20
2020
-03-
27
2020
-04-
03
2020
-04-
10
2020
-04-
17
2020
-04-
24
2020
-05-
01
2020
-05-
08
2020
-05-
15
2020
-05-
22
2020
-05-
29
2020
-06-
05
2020
-06-
12
2020
-06-
19
2020
-06-
26
2020
-07-
03
2020
-07-
10
2020
-07-
17
2020
-07-
24
2020
-07-
31
2020
-08-
07
2020
-08-
14
2020
-08-
21
2020
-08-
28
2020
-09-
04
2020
-09-
11
2020
-09-
18
2020
-09-
25
2020
-10-
02
2020
-10-
09
2020
-10-
16
2020
-10-
23
2020
-10-
30
2020
-11-
06
2020
-11-
13
2020
-11-
20
2020
-11-
27
2020
-12-
04
2020
-12-
11
Cash Commercial/Third Party Medicaid Medicare

Confidential 26
Data Week 50: December 11th, 2020Projected Retail, Unprojected Mail Order, Projected LTC, All Other NRx/TRx Counts
NATIONAL TRENDS: As of week ending 12/11/2020, total prescription volumes remain -7% below prior year trends. The bulk of the decline is driven by fewer new prescriptions through November/December, a stark contrast to the recent upticks in COVID-19 diagnoses.
National TrendsCurrent vs. Prior Year (TRx)
Q3 2020 NRx/TRx % CHANGE COMPARED TO PRIOR YEAR
1st Peak Pandemic Period:
Late March to Early June
Pandemic Resurgence:Late October
To-Date

Confidential 27
NATIONAL TRENDS: Lower retail store activity in particular continues to drive overall national trends as we near the end of 2020.
Data Week 50: December 11th, 2020Projected Retail TRx CountsUnprojected Mail Order TRx Counts
Mail Order Weekly TRxRetail Weekly TRx
March 20th: Peak Week of
COVID-19 Response

Confidential 28
-8% below prior year
-6% below prior year
-1% below prior year
-13% below prior year
-13% below prior year
ELECTIVE THERAPIES: All elective therapy trends are reporting -1% down from the previous insights report. Overall growth in elective therapy markets have been stagnant through-out the pandemic.
Data Week 50: December 11th, 2020Projected Retail, Unprojected Mail Order, Projected LTC, All Other TRx Counts