COVID-19 Special Report No. 5: addressing the growing ...
24
15 July 2020 Contents No.5 COVID-19 Special Report Addressing the growing impact of COVID-19 with a view to reactivation with equality: new projections A. A synchronized global crisis 1 1 The cut-off date for the information used to prepare this report is 30 June 2020, unless otherwise indicated. The global economy will undergo the deepest recession since the Second World War and per capita gross domestic product (GDP) will shrink in 90% of countries, with unprecedented synchronization. 2 Global GDP will contract by 5.2% in 2020. Developed economies are expected to shrink by 7% and emerging economies by 1.6% (see figure 1). The gradual lifting of health restrictions and the implementation of expansionary policies have induced a slow and uncertain recovery, first in China and later in the United States and the eurozone. However, projections for the year as a whole have deteriorated since the beginning of April. For the first time in decades, Chinese authorities have not set an annual growth target, and forecasts for the economy’s expansion stand at just 1.0%, its lowest rate in more than 40 years. The Federal Reserve projects that United States GDP will contract by 6.5%, while the European Central Bank (ECB) foresees an 8.7% fall in the eurozone. 2 For an analysis of the synchronized nature of the present crisis, see World Bank (2020). A. A synchronized global crisis ........................ 1 B. Decoupling financial dynamics from the drop in activity ............................. 5 C. New projections of growth, unemployment, poverty and inequality ................................ 8 D. Fiscal and monetary policies to address the crisis ..................................................... 12 E. Four lines of action.................................... 20 Bibliography ................................................... 24
Transcript of COVID-19 Special Report No. 5: addressing the growing ...
15 July 2020
Contents
No.5COVID-19Special Report
Addressing the growing impact of COVID-19 with a view to reactivation with equality: new projectionsA. A synchronized global crisis1
1 The cut-off date for the information used to prepare this report is 30 June 2020, unless otherwise indicated.
The global economy will undergo the deepest recession since the Second World War and per capita gross domestic product (GDP) will shrink in 90% of countries, with unprecedented synchronization.2
� Global GDP will contract by 5.2% in 2020. Developed economies are expected to shrink by 7% and emerging economies by 1.6% (see figure 1).
� The gradual lifting of health restrictions and the implementation of expansionary policies have induced a slow and uncertain recovery, first in China and later in the United States and the eurozone.
� However, projections for the year as a whole have deteriorated since the beginning of April. For the first time in decades, Chinese authorities have not set an annual growth target, and forecasts for the economy’s expansion stand at just 1.0%, its lowest rate in more than 40 years. The Federal Reserve projects that United States GDP will contract by 6.5%, while the European Central Bank (ECB) foresees an 8.7% fall in the eurozone.
2 For an analysis of the synchronized nature of the present crisis, see World Bank (2020).
A. A synchronized global crisis ........................1
B. Decoupling financial dynamics from the drop in activity ............................. 5
C. New projections of growth, unemployment, poverty and inequality ................................ 8
D. Fiscal and monetary policies to address the crisis ..................................................... 12
E. Four lines of action.................................... 20
Bibliography ................................................... 24

COVID-19
2
Figure 1 | Selected regions and countries: GDP growth rates for 2018 and 2019, and projections for 2020 (Percentages)
3.12.3 2.9
0.8 1.41.9
4.56.3 6.6 6.8
3.1
0.9
3.22.4 1.6 2.3
0.7 1.4 1.53.5
5.9 6.1
4.1 3.4
-0.2
2.2
-5.2
-7.0 -6.5 -6.1
-8.5 -8.7
-1.6
0.5 1.0
-3.2 -3.3-4.2
-3.2
-15
-10
-5
0
5
10
Wor
ld
Deve
lope
dec
onom
ies
Unite
d St
ates
Jap
an
Uni
ted
King
dom
Eur
ozon
e
Emer
ging
and
deve
lopi
ngec
onom
ies
Eas
t Asi
aan
d th
e Pa
cific
Chi
na
Indi
aa
Em
ergi
ngec
onom
ies
of E
urop
e
Mid
dle
East
and
Nor
th A
frica
Sub
-Sah
aran
Afric
a
202020192018
Source: Economic Commission for Latin America and the Caribbean (ECLAC), on the basis of World Bank, Global Economic Monitor (GEM) [online database] https://datacatalog.worldbank.org/dataset/global-economic-monitor [accessed on: June 2020]; Organization for Economic Cooperation and Development (OECD), OECD Economic Outlook, Paris, OECD Publishing, June 2020: European Central Bank (ECB), “Eurosystem staff macroeconomic projections”, June 2020 [online] https://www.ecb.europa.eu/pub/projections/html/index.en.html; and United Nations, World Economic Situation and Prospects as of mid-2020, New York, 2020.
a The figures for India cover the fiscal year, which begins in April and ends in March the following year.
The pandemic has led to a collapse in world trade in goods
� The confinement measures caused manufacturing output to fall sharply, first in China and subsequently in the major global trade hubs, such as the United States and Germany.3
� For 2020, the volume of global trade in goods could plunge by between 13% and 32% (see figure 2). The disruption of production in countries that participate in global value chains was a crucial factor in the deterioration of trade in intermediate goods, which was compounded by a widespread weakening of demand for consumer and investment goods as a result of confinement and the economic crisis.
Figure 2 | Year-on-year change in the volume of global goods trade (Percentages)
7.18.9
5.9
0.8
-12.8
13.9
4.71.4 2.3 2.7 1.9 1.4
4.9 3.4
-0.4
-40
-30
-20
-10
0
10
20
2005
2006
2007
2008
2009
2010
2011
2012
2013
2014
2015
2016
2017
2018
2019
2020
Projection for 2020:between -13% and -32%
Source: Economic Commission for Latin America and the Caribbean (ECLAC), on the basis of Netherlands Bureau of Economic Policy Analysis (CPB), World Trade Monitor [online database] https://www.cpb.nl/en/worldtrademonitor; World Trade Organization (WTO), “Trade forecast press conference”, 8 April 2020 [online] https://www.wto.org/english/news_e/spra_e/spra303_e.htm.
Note: The figures are calculated on the basis of a seasonally adjusted index.
3 These three countries account for around 34% of global manufacturing exports (United Nations, 2020).

COVID-19
3
� Goods exports from Latin America and Caribbean, equivalent to 20% of GDP, go primarily to the United States (8.5% of GDP), China (2.2%) and the European Union (1.9%). With falling global growth and declining consumption and investment in these trading partners, external demand is set to slacken significantly in the region.
The hard blow to the global service trade, in particular tourism, is hurting the economies of Central America and the Caribbean
� The current crisis has taken an unusually heavy toll on international trade in services, unlike past crises that affected trade in goods more severely (Ariu, 2016).
� While the sharp contraction in economic activity and world trade in goods has translated into lower demand for business, transport, insurance and other services, tourism has been the hardest hit, given the particular nature of this crisis.
� In the first four months of 2020, tourism tumbled by 44% globally. For the year overall, tourism could plummet by between 60% and 80%, the worst since the series began in 1950.4
� All the subregions of Latin America and the Caribbean have seen a drop in demand for tourism services. In the first four months of 2020, international tourist arrivals were down by 35% in South America, 39% in the Caribbean and 35% in Central America in comparison with the year-earlier period (UNWTO, 2020b). This has had a deleterious effect on the economies of Central America and the Caribbean small island developing States, where tourism is a major driver of economic activity and employment (see figure 3).
Figure 3 | Latin America and the Caribbean: contribution of the tourism economy to GDP and employment, 2019a (Percentages)
0 20 40 60 80 100
BahamasAntigua and Barbuda
Saint LuciaGrenada
BelizeDominicaJamaica
BarbadosSaint Vincent and the Grenadines
Saint Kitts and NevisUruguay
Dominican Rep.MexicoPanama
Costa RicaHonduras
El SalvadorCuba
NicaraguaChile
Venezuela (Bol. Rep. of)Peru
ArgentinaHaiti
Trinidad and TobagoBrazil
GuatemalaBolivia (Plur. State of)
EcuadorColombia
GuyanaParaguaySuriname
GDP
Employment
Source: Economic Commission for Latin America and the Caribbean (ECLAC), on the basis of data from the World Travel and Tourism Council (WITC).a The World Travel and Tourism Council defines the tourism economy as including the direct contribution (direct impact on the GDP of the food, lodging,
entertainment, recreation and transport sectors, and other services related to travel and tourism), the indirect contribution (investment in and public spending on tourism, and the internal supply chain’s impact on other sectors) and the induced contribution (impact of the income earned directly and indirectly that is spent on the local economy).
4 The figures refer to international tourist arrivals. See UNWTO (2020a).

COVID-19
4
International commodity prices will fall in 2020, negatively affecting South America’s terms of trade
� As the pandemic broke out, commodity prices fell sharply. However, prices began to pick up in mid-April and rose even more in May and early June, reflecting the incipient recovery of economic activity in China, the United States and Europe.
� Although prices are likely to continue trending upward if recovery takes hold (albeit slowly), for 2020 on average they will be lower than in 2019.
� In the case of energy products, prices are expected to drop by 39.3% compared to the 2019 average, while mineral and metal prices will fall by 6.1%, and agricultural and livestock product prices will be down by almost 6% (see table 1).
Table 1 | Projected rates of change in commodity prices for 2020(Percentages)
Projected rate of change for 2020 Total for all commodities -18.5Energy -39.3Oil -40.2Petroleum products -42.7Natural gas -30.7Coal -21.8
Minerals and metals -6.1Other minerals and metals -16.2Copper -12.6Gold 15.9Iron -9.5Aluminium -14.8Nickel -17.7Tin -14.5
Agriculture and livestock -5.9Soybean oil -7.8Bananas 11.2Beef -5.1Soybeans -9.3Coffee -9.2Sugar -11.4Fishmeal -5.1Maize -5.5Shrimps and crustaceans 4.3
Source: Economic Commission for Latin America and the Caribbean (ECLAC), on the basis of data from Bloomberg, The Economist Intelligence Unit, Buenos Aires Grain Exchange, Chilean Copper Commission (COCHILCO) and Agrarian Research and Policy Office of Chile (ODEPA).
� In Latin America and the Caribbean, net exports of commodities and natural-resource-based manufactures amount to 4.5% of GDP. Owing to its specialization in the production and export of this type of goods, the South American subregion will be the hardest hit by lower prices.
� Given the worsening economic outlook for the region’s main trading partners and the projected fall in export prices on the back of lower commodity prices, the Economic Commission for Latin America and the Caribbean (ECLAC) has revised downward its projections for the region’s export performance.
� The value of the region’s exports could fall by as much as 23%, with an 11% drop in prices and a 12% decline in volume, essentially owing to a sharper contraction in global demand.
Weaker economic activity and rising unemployment in the primary destination countries of migrants from Latin America and the Caribbean will reduce remittance inflows, mainly affecting the region’s poorest countries
� Unemployment rates are expected to rise in the main economies of origin of these flows —the United States in the case of Mexico, Central America and the Caribbean, and Europe in the case of South America. The eurozone will see an increase in the unemployment rate from 7.6% in 2019 to 9.8% in 2020, while in the United States it is projected to jump from 3.9% to 9.3% over the same period (Federal Reserve Board of Governors, 2020; ECB, 2020). The economies of the region itself, which are the second largest source of remittances for several countries, will also be hit by severe job losses.

COVID-19
5
� As a result, the cumulative inflow of remittances to May in the region’s main recipient economies has declined by 7% on average, compared with the same period in 2019.5
� Several of the region’s poorest countries will be hardest hit by the drop in remittances. This is particularly true in the case of Haiti, where remittances represent some 33% of GDP, and El Salvador and Honduras, where they account for 20% of GDP (see figure 4).
Figure 4 | Latin America and the Caribbean: family remittance flows and per capita GDP, 2018(Percentages of GDP and dollars at current prices)
HTI
SLV
HND
JAM
GTM
NIC
DMA
GUY
DOMVCT
BLZ
GRD
BOL
ECU
KNA
LCA
BRB
COL
PRY
ATG
PER
CRI
PAN
TTOURY
BRA
ARG
CHL
SUR
0
2 000
4 000
6 000
8 000
10 000
12 000
14 000
16 000
18 000
20 000
0 5 10 15 20 25 30 35
Per c
apita
GDP
in d
olla
rs a
t cur
rent
pric
es
Remittances as a percentage of GDP
MEX
Source: Economic Commission for Latin America and the Caribbean (ECLAC), on the basis of World Bank, World Development Indicators (WDI) [online database] http://datatopics.worldbank.org/world-development-indicators/.
B. Decoupling financial dynamics from the drop in activity
� The sharp deterioration in global financial conditions began to be reversed from late March, thanks to a series of policy actions taken by the world’s major central banks and governments. However, there is a disconnect between this trend and that of the real economy, which is moving towards a steep contraction and growing economic uncertainty. In this regard, a new round of increased risk aversion and deteriorating financial conditions cannot be ruled out, which emerging markets would have to confront from an even more vulnerable situation.
� In early 2020, as the coronavirus disease (COVID-19) outbreak began to spread to an increasing number of countries and was subsequently declared a pandemic by the World Health Organization (WHO), international financial conditions deteriorated sharply, which in many cases was worse than that of the 2008–2009 global financial crisis.
� Financial volatility, as measured by the VIX index, rose to record levels in March, there were massive capital outflows from emerging markets, sovereign risk levels increased, particularly in emerging markets, and most currencies depreciated sharply against the United States dollar. Likewise, stock markets around the world plummeted, as a result of concerns about the economic effects of the pandemic and its impact on companies’ financial health. The sovereign bond yields of countries considered safe havens for investors in search of security reached all-time lows, and the indicators of dollar funding costs reflected the sharp increase in demand for the United States currency.
� The fact that financial markets have been so severely affected by the consequences of the pandemic is also a product of the financial vulnerabilities that had been building up for a long time.
5 Some countries have seen even sharper reductions in remittances, such as Peru (38%), Paraguay (25%), the Plurinational State of Bolivia (14%) and El Salvador (12%). The exception to this trend is Mexico, where favourable exchange rates contributed to a cumulative 13% increase in remittances in the year to April relative to the same period in 2019.

COVID-19COVID-19
6
� The volume of debt has been growing faster than global income and has reached historic highs. In the fourth quarter of 2019, the global debt stock exceeded US$ 255 trillion, more than 322% of global GDP (IIF, 2020).
� The increase in debt was accompanied by laxer borrowing requirements and a greater appetite for risk among investors seeking higher returns. Much of the debt accumulated since the global financial crisis has been in the non-financial corporate sector, where the disruption of supply chains and reduced global growth has led to poorer performances and greater difficulty in repaying the debt.
� Since the second half of March, a series of policy actions have been implemented by the world’s major central banks and governments, leading to an improvement in global financial conditions.
� In addition to reducing its policy rate by 1.5 percentage points so far this year (down to 0.0%–0.25%), on 23 March the United States Federal Reserve announced that its quantitative easing measures would be open-ended, with bond purchases “in the amounts needed”, and also made dollar liquidity swap lines available to a number of major central banks worldwide. ECB announced the launch of a new quantitative easing programme, the pandemic emergency purchase programme (PEPP), with an overall envelope of 750 billion euros, which was increased in June to 1.35 trillion euros to purchase financial assets, equivalent to 11% of GDP of the eurozone.
� Capital outflows from emerging economies have been reversed and, since April, net portfolio inflows have been observed (see figure 5).
Figure 5 | Non-resident portfolio flows to emerging markets, June 2017–June 2020(Billions of dollars)
42.248.5
72.6
28.2
-5.2
19.19.0
-3.9
29.2
51.843.4 51.7
24.6
-19.4
42.3
54.0
-82.9
18.611.5
-85
-70
-55
-40
-25
-10
5
20
35
50
65
80
Jun
Jul
Aug
Oct
NovSep
Dec
Jan
Feb
Apr
May Ju
l
Aug
Oct
Nov
Mar
Jun
Sep
Dec
Mar
Jun
Sep
Dec
Mar
Jun
2017 2018 2019 2020
Total
Tensions in Turkey and Saudi Arabia
Trade tensions and global slowdown
Elections in France
Federal Reserve rate cut Federal Reserve
rate cuts
Signing of phase 1 of the trade agreement between
the United States and China, and unveiling of China’s fiscal stimulus
Global stimulus packages, reopening of some economies and advances in the
treatment of COVID-19
Political crisis in the United States
Tensions between the United States and the Democratic People’s
Republic of Korea
Stock market sell-off in February
Risk of escalating trade tensions betweenthe United States
and China
Spread of COVID-19 and fears of a global recession
United States government shutdown, sluggish global growth and massive stock
sell-off in December
Fixed income Variable income
Jan
Feb
Apr
May Jan
Feb
Apr
MayJu
l
Aug
Oct
Nov
Source: Central Reserve Bank of Peru, on the basis of data from the Institute of International Finance (IIF).Note: Data for June 2020 refer to the estimated value up to 9 June 2020.
� In the case of the Financial Stress Index, an indicator of international financial conditions, the increase was reversed, and, by the end of June, it was close to pre-pandemic levels. This improvement in financial conditions occurred in both emerging and developed markets, after peaking around 23 March, the day the Federal Reserve announced unlimited quantitative easing (see figure 6).
� In Latin America, as in the other emerging economies, there was a sudden stop in capital flows during the first months of 2020, which was later reversed.
� Capital outflows during the first months of the year were higher than during the global financial crisis of 2008–2009 (see figure 7). The levels at which flows stabilized after the financial crisis were much lower than those recorded at the beginning of that crisis. In contrast, in the current crisis, the resurgence in flows to the region occurred rapidly from April and early May, a trend that has continued until mid-June.

COVID-19
7
COVID-19
Figure 6 | United States, other developed economies and emerging economies: financial stress index
-5.0
-2.5
0
2.5
5.0
7.5
10.0
United States
Other developed economies
Emerging economies
Financial Stress Index
2019 2020
Jan
Feb
Apr
May Ju
l
Aug
Oct
Nov
Mar
Jun
Jan
Feb
Apr
May Ju
l
Mar
Jun
Sep
Dec
Source: Economic Commission for Latin America and the Caribbean (ECLAC), on the basis of Office of Financial Research (OFR), “OFR Financial Stress Index” [online] https://www.financialresearch.gov/financial-stress-index/ [accessed on: 17 June 2020].
Figure 7 | Latin America: financial flows to the region according to the capital flows indicator of the Economic Commission for Latin America and the Caribbean (ECLAC) (Index=100 at the start of the episode, t=0)
50
60
70
80
90
100
110
0 10 20 30 40 50 60 70 80 90 100
110
120
130
140
150
160
170
180
190
200
210
220
230
240
250
260
270
280
290
300
310
320
330
340
350
360
370
Number of days since the beginning of each episode (t=0)
Global financial crisis (8 September 2008)
Taper tantrum (22 May 2013)a
China’s stock market crash (26 July 2015)
Surge in COVID-19 cases (24 February 2020)
Source: Economic Commission for Latin America and the Caribbean (ECLAC), on the basis of Bloomberg data and methodology.a The term “taper tantrum” was coined in mid-2013 to refer to the period of financial turmoil after markets were taken by surprise by the Federal
Reserve’s announcement that it would start winding down asset purchases under the quantitative easing programme early and overreacted by selling off financial assets and currencies, especially those of emerging countries.
� This result is consistent with the general improvement seen in global financial markets, which was also reflected in an increase in the region’s participation in international debt markets.
� Between late March and June 2020, several countries issued bonds in international markets against a backdrop of growing financing needs to deal with the pandemic, together with better financial conditions that allowed them to access credit markets on more favourable terms. In the particular case of governments, 10 sovereign issues have been recorded up to the end of June (see table 2).

COVID-19
8
Table 2 | Latin America (selected countries): sovereign bond issues in international markets, end March–end June 2020
Date Country Amount (millions of dollars)
Rate (percentages)
Excess demand (number of times)
26 March 2020 Panama 2 500 4.50 3.00
16 April 2020 Peru 3 000 2.70 8.00
22 April 2020 Mexico 6 000 5.00 4.75
23 April 2020 Paraguay 1 000 4.95 7.00
6 May 2020 Chile 2 000 2.50 5.85
15 May 2020 Guatemala 1 200 5.80 6.75
1 June 2020 Colombia 2 500 3.80 5.30
3 June 2020 Brazil 3 500 3.64 5.15
20 June 2020 Honduras 600 5.60 -
24 June 2020 Uruguaya 2 000 - -
Source: Economic Commission for Latin America and the Caribbean (ECLAC).a Covers three different types of operations: a local currency issue, a dollar issue and a bond buyback.
Investors have taken heart from the tentative recovery of some indicators of economies that have begun to gradually reopen, as well as from the expected impact of the massive fiscal and monetary support policies implemented
� However, if new COVID-19 outbreaks forced governments to reimpose containment measures and the recession lasted longer than expected, this could lead to a new risk-off phase, with the ensuing negative effects on emerging markets. Moreover, those markets would be in an even more vulnerable situation, as higher levels of debt could become unmanageable for some companies and even governments in a context of further downturns in activity.
C. New projections of growth, unemployment, poverty and inequality
Since April, when ECLAC published its latest projections of the region’s dynamics for 2020, both the external and the internal shocks have intensified
� Economic activity around the world is falling more than expected in April and, with it, the negative external impacts on the region are increasing.
� In addition, Latin America and the Caribbean is now at the epicentre of the pandemic, and while some governments have begun to ease containment measures, others have had to maintain or even tighten them given the persistent increase in new daily cases of the disease.
The uneven spread of the pandemic has had a disparate impact on national and sector activities
� The largest impact is being felt in services such as tourism, aviation, lodging, restaurants, entertainment and commerce, with the exception of supermarkets, pharmacies and others declared essential by each country.
� Non-essential product industries also face problems arising from lockdown measures requiring the suspension of their activities. Businesses’ income has declined significantly, making access to credit difficult and in many cases leading to definitive closure. In some countries, construction has also been hit hard by the stoppage of works and the great uncertainty surrounding the implementation of new projects.
� At the country level, Uruguay began in June to reopen shopping malls and to gradually allow students to return to school, as it flattened the curve of infection. In Paraguay, the pandemic has also been brought under control, with no deaths recorded in the past month, which has prompted the authorities to initiate a “smart lockdown”, with the opening of restaurants and gyms and the
COVID-19
9
loosening of restrictions on movement. Similar situations exist in Caribbean countries such as the Bahamas, Barbados, Belize, Cuba, Jamaica, and Trinidad and Tobago.
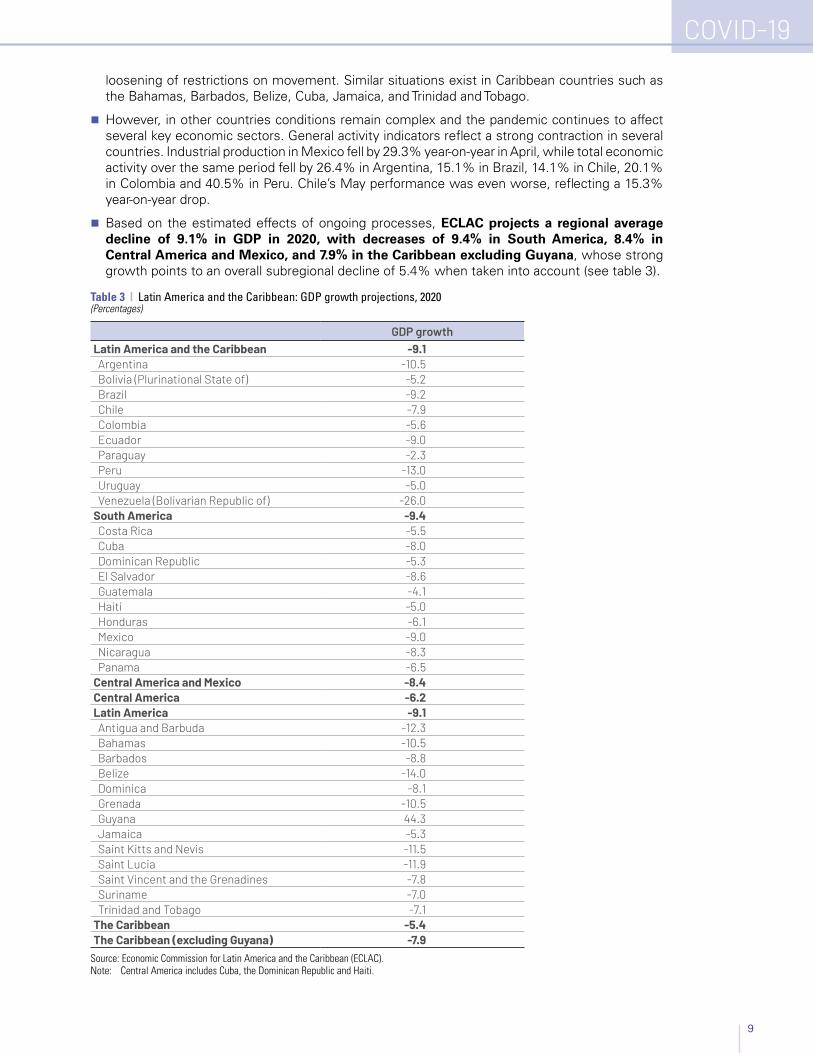
� However, in other countries conditions remain complex and the pandemic continues to affect several key economic sectors. General activity indicators reflect a strong contraction in several countries. Industrial production in Mexico fell by 29.3% year-on-year in April, while total economic activity over the same period fell by 26.4% in Argentina, 15.1% in Brazil, 14.1% in Chile, 20.1% in Colombia and 40.5% in Peru. Chile’s May performance was even worse, reflecting a 15.3% year-on-year drop.
� Based on the estimated effects of ongoing processes, ECLAC projects a regional average decline of 9.1% in GDP in 2020, with decreases of 9.4% in South America, 8.4% in Central America and Mexico, and 7.9% in the Caribbean excluding Guyana, whose strong growth points to an overall subregional decline of 5.4% when taken into account (see table 3).
Table 3 | Latin America and the Caribbean: GDP growth projections, 2020 (Percentages)
GDP growthLatin America and the Caribbean -9.1Argentina -10.5Bolivia (Plurinational State of) -5.2Brazil -9.2Chile -7.9Colombia -5.6Ecuador -9.0Paraguay -2.3Peru -13.0Uruguay -5.0Venezuela (Bolivarian Republic of) -26.0
South America -9.4Costa Rica -5.5Cuba -8.0Dominican Republic -5.3El Salvador -8.6Guatemala -4.1Haiti -5.0Honduras -6.1Mexico -9.0Nicaragua -8.3Panama -6.5
Central America and Mexico -8.4Central America -6.2Latin America -9.1Antigua and Barbuda -12.3Bahamas -10.5Barbados -8.8Belize -14.0Dominica -8.1Grenada -10.5Guyana 44.3Jamaica -5.3Saint Kitts and Nevis -11.5Saint Lucia -11.9Saint Vincent and the Grenadines -7.8Suriname -7.0Trinidad and Tobago -7.1
The Caribbean -5.4The Caribbean (excluding Guyana) -7.9
Source: Economic Commission for Latin America and the Caribbean (ECLAC).Note: Central America includes Cuba, the Dominican Republic and Haiti.

COVID-19COVID-19
10
A lost decade: the decline in economic activity will mean that, by the end of 2020, per capita GDP in Latin America and the Caribbean will be similar to the level seen in 2010
� The sharp contraction in 2020 will result in a 9.9% fall in regional per capita GDP. After almost stalling in 2014–2019 (when average annual growth was only 0.1%), this decrease in per capita GDP implies a 10-year setback: the level seen in 2020 will be similar to that of 2010 (see figure 8).
Figure 8 | Latin America and the Caribbean: per capita GDP, 1990–2020a
(Index: 1990=100)
90
110
130
150
170
190
210
230
1990 1992 1994 1996 1998 2000 2002 2004 2006 2008 2010
2010
2012 2014 2016 2018 2020
Source: Economic Commission for Latin America and the Caribbean (ECLAC), on the basis of official figures. a Projected value for 2020.
Estimates of the main labour market indicators and of poverty rates and levels must be revised in light of the deterioration of economic projections
� Given that employment indicators in the first four months of the year already show a deterioration in working conditions and taking into account the new GDP projections, the regional unemployment rate is estimated at around 13.5% by the end of 2020, representing an upward revision (2 percentage points) of the forecast presented in April 2020, and an increase of 5.4 percentage points on the figure recorded in 2019 (8.1%).
� With the new estimate, the number of unemployed is expected to amount to 44.1 million, an increase of 18 million from the 2019 level (26.1 million unemployed).
� These figures are significantly worse than those seen during the global financial crisis, when the region’s unemployment rate rose from 6.7% in 2008 to 7.3% in 2009 (0.6 percentage points).
� With respect to labour markets, informal workers are very vulnerable to the effects of the pandemic given the high rate of labour informality in the region. Similarly, the increase in unemployment rates, particularly in commerce and tourism, has a heavy impact on women, who typically record higher unemployment rates than men.
The downward revision of growth prospects and the resulting increase in unemployment will result in further deterioration of poverty and extreme poverty projections6
� ECLAC estimates that the number of people living in poverty will grow by 45.4 million in 2020, bringing the total number living in poverty from 185.5 million in 2019 to 230.9 million in 2020, representing 37.3% of the Latin American population. Within this group, the number of people living in extreme poverty is expected to increase by 28.5 million, from 67.7 million in 2019 to 96.2 million in 2020, equivalent to 15.5% of the total population.
6 The projected decline in household income is based on the assumption that the figure is similar, on average, to the reduction in per capita GDP described above. The impact on household income is not evenly distributed. It is assumed that workers face a greater risk of job loss and a decrease in their labour income if they work in the sectors that record the sharpest contractions, if their work is characterized by low productivity (non-professional or non-technical workers, both independent workers and wage earners in establishments of up to five people) and if wages are typically low given their area of work.
COVID-19
11
COVID-19
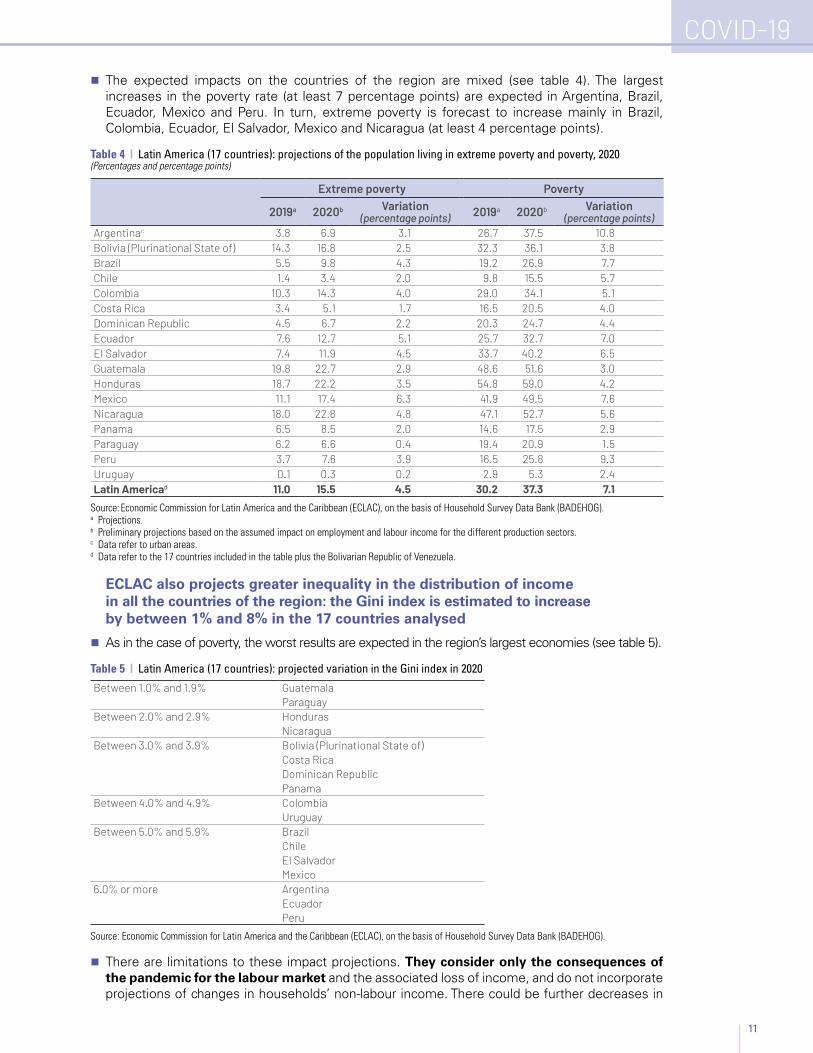
� The expected impacts on the countries of the region are mixed (see table 4). The largest increases in the poverty rate (at least 7 percentage points) are expected in Argentina, Brazil, Ecuador, Mexico and Peru. In turn, extreme poverty is forecast to increase mainly in Brazil, Colombia, Ecuador, El Salvador, Mexico and Nicaragua (at least 4 percentage points).
Table 4 | Latin America (17 countries): projections of the population living in extreme poverty and poverty, 2020 (Percentages and percentage points)
Extreme poverty Poverty
2019a 2020b Variation (percentage points) 2019a 2020b Variation
(percentage points)Argentinac 3.8 6.9 3.1 26.7 37.5 10.8Bolivia (Plurinational State of) 14.3 16.8 2.5 32.3 36.1 3.8Brazil 5.5 9.8 4.3 19.2 26.9 7.7Chile 1.4 3.4 2.0 9.8 15.5 5.7Colombia 10.3 14.3 4.0 29.0 34.1 5.1Costa Rica 3.4 5.1 1.7 16.5 20.5 4.0Dominican Republic 4.5 6.7 2.2 20.3 24.7 4.4Ecuador 7.6 12.7 5.1 25.7 32.7 7.0El Salvador 7.4 11.9 4.5 33.7 40.2 6.5Guatemala 19.8 22.7 2.9 48.6 51.6 3.0Honduras 18.7 22.2 3.5 54.8 59.0 4.2Mexico 11.1 17.4 6.3 41.9 49.5 7.6Nicaragua 18.0 22.8 4.8 47.1 52.7 5.6Panama 6.5 8.5 2.0 14.6 17.5 2.9Paraguay 6.2 6.6 0.4 19.4 20.9 1.5Peru 3.7 7.6 3.9 16.5 25.8 9.3Uruguay 0.1 0.3 0.2 2.9 5.3 2.4Latin Americad 11.0 15.5 4.5 30.2 37.3 7.1
Source: Economic Commission for Latin America and the Caribbean (ECLAC), on the basis of Household Survey Data Bank (BADEHOG).a Projections.b Preliminary projections based on the assumed impact on employment and labour income for the different production sectors. c Data refer to urban areas. d Data refer to the 17 countries included in the table plus the Bolivarian Republic of Venezuela.
ECLAC also projects greater inequality in the distribution of income in all the countries of the region: the Gini index is estimated to increase by between 1% and 8% in the 17 countries analysed
� As in the case of poverty, the worst results are expected in the region’s largest economies (see table 5).
Table 5 | Latin America (17 countries): projected variation in the Gini index in 2020
Between 1.0% and 1.9% GuatemalaParaguay
Between 2.0% and 2.9% HondurasNicaragua
Between 3.0% and 3.9% Bolivia (Plurinational State of)Costa RicaDominican RepublicPanama
Between 4.0% and 4.9% ColombiaUruguay
Between 5.0% and 5.9% BrazilChileEl SalvadorMexico
6.0% or more ArgentinaEcuadorPeru
Source: Economic Commission for Latin America and the Caribbean (ECLAC), on the basis of Household Survey Data Bank (BADEHOG).
� There are limitations to these impact projections. They consider only the consequences of the pandemic for the labour market and the associated loss of income, and do not incorporate projections of changes in households’ non-labour income. There could be further decreases in

COVID-19
12
some resources, for example, in migrant remittances. Moreover, the projections do not take into account the measures adopted by the region’s governments to transfer resources to households. It is hoped that these measures will mitigate the impact of the pandemic on living conditions, particularly for the most vulnerable households.
D. Fiscal and monetary policies to address the crisis
1. A strong fiscal policy response
The countries of the region have announced major fiscal packages to address the health emergency and mitigate its social and economic repercussions
� The announced packages constitute substantial fiscal efforts. On average, they represent 3.9% of Latin America’s GDP, although the percentages for the different countries range from 0.7% to 10% (see figure 9). The different magnitudes of these efforts depends on the characteristics of each country in terms of the structure of their economies, the available fiscal space, their ability to mobilize additional financing, the scope of existing health systems and social safety nets, and the spread of the pandemic.
� To tackle the crisis and maximize the impact of their measures, countries have combined existing social protections programmes with new fiscal efforts. In this sense, those countries that had social protection systems with wider coverage have been able to react more quickly and efficiently to contain and mitigate the social repercussions of the pandemic.
� Several countries of the region have extensive social security coverage, with more than 65% of employed persons covered in terms of pensions and health care (Argentina, Chile, Costa Rica, Uruguay), and they have been able to take advantage of that installed capacity to tackle the pandemic. The coverage of pre-pandemic social assistance programmes that provide cash transfers to families living in poverty and vulnerable conditions is also crucial to protecting the population from the consequences of the pandemic. For example, in Uruguay, the family allowances (under the Equity Plan) cover around 11% of the population at cost equivalent to 0.33% of GDP, while the Uruguay Social card covers some 12% of the population and costs the equivalent of 0.15% of GDP.
Figure 9 | Latin America (17 countries): fiscal effort of announced measures to address the COVID-19 pandemic (Percentages of GDP)
11.17.5
5.74.94.8
4.34.2
4.03.93.93.73.5
2.52.5
1.10.80.80.7
024681012
El SalvadorBrazilChile
Bolivia (Plur. State of)Peru
HondurasParaguay
HaitiArgentina
Latin America (17 countries)PanamaEcuador
ColombiaGuatemala
MexicoCosta Rica
Dominican Rep.Uruguay
4.8
0.9
6.7
0 2 4 6 8 10 12
A. Measures to mitigate the social and economic impact of the pandemic
B. New plans to reactivate the economy a
(6.8 billion soles)
(US$ 2.5 billion)
(US$ 12 billion)
Source: Economic Commission for Latin America and the Caribbean (ECLAC), on the basis of official figures.Note: The fiscal effort is calculated on the basis of expenditure measures (reallocations and exceptional expenditure), tax relief (revenue forgone) and liquidity
(government loans to the private sector, capitalization of public financial funds). State credit guarantees are not included. Corresponds to announced measures that have been approved or are in the process of being approved; therefore, discrepancies could arise with respect to eventual budget execution. Information updated on 6 July 2020.
a In the case of Chile and Paraguay, these plans include broader measures to protect the income of families, in addition to promoting economic recovery and employment creation.
COVID-19
13
� In addition, many countries have extended government credit guarantees to the private sector:
(i) Chile announced a contribution of US$ 3 billion (1.2% of GDP) to the Small Business Guarantee Fund (FOGAPE), which would allow credit guarantees to be provided up to a total of US$ 24 billion (10% of GDP).
(ii) The Central Reserve Bank of Peru has injected 60 billion soles of capital (8% of GDP) into private banks to increase lending to micro-, small and medium-sized enterprises (MSMEs), and the treasury has provided guarantees to banks for the loans extended.
(iii) In Colombia, three new lines of credit for MSMEs and self-employed workers were created in the National Guarantee Fund (FNG), for a total of 16 billion pesos (1.5% of GDP).
(iv) Paraguay and Uruguay further capitalized guarantee funds, bringing their available credit lines to 1.3% of GDP and 4.5% of GDP, respectively.
(v) In Argentina, an earmarked fund was created within the framework of the Argentine Guarantee Fund (FOGAR), which will have a budget of 30 billion pesos, increasing the available capital of FOGAR to 91.92 billion pesos (0.4% of GDP).
(vi) In Costa Rica and Honduras, the State credit guarantee lines to provide working capital to strategic economic sectors amount to 2.5% and 1.7% of GDP, respectively.
� These fiscal efforts are being undertaken in an adverse and highly uncertain macroeconomic environment. In addition to mounting public debt over the last decade, the countries are facing falls in tax revenues owing to the economic downturn and lower commodity prices caused by the pandemic, while spending needs are rising sharply because of measures to address the emergency.
� In view of the magnitude of the resources required and their emergency nature, it is important to accompany these fiscal measures with appropriate transparency and accountability instruments, to boost confidence in public management and make it more effective. Brazil, Chile, Colombia, Costa Rica, Guatemala, Honduras, Paraguay and Peru have announced the launch of transparency portals and special reports to punctually monitor the use of public resources in response to the pandemic. In addition, several high-level supervisory bodies have set up transparency portals to monitor emergency response actions.7
Fiscal efforts in the region are aligned with the need to strengthen health systems, support household incomes and protect productive capacity8
� Faced with the rapidly spreading pandemic, countries moved quickly to bolster health system capacity by hiring more staff, purchasing medical supplies, and expanding health infrastructure, among other actions. These measures were implemented through budget reallocations under health emergency laws and by increasing health budgets to meet the pressing needs of the sector. In addition, Argentina, Brazil, Chile, Mexico and the Plurinational State of Bolivia have made substantial transfers to subnational governments to support local health-care capacity. In some countries, these spending measures were complemented by temporary elimination of import tariffs on medical supplies. Colombia has also exempted goods that help control the pandemic from value added tax (VAT).
� In response to the major impact of lockdown measures on employment and household income, many countries established special grants or transfers to households. These unconditional transfers have focused on the most vulnerable strata of society. Another action that has been employed is the strengthening of conditional transfer programmes —for example, by bringing forward transfers planned for the entire year— and social protection instruments related to unemployment, aiming to increase benefits or expand their coverage by easing conditions of access. In addition, Mexico has implemented a large-scale programme offering US$ 1,000 soft loans mainly to informal workers, domestic workers, and micro- and small enterprises. Several countries have used digital technologies to facilitate delivery of this assistance.
� Special grants have been established for workers who are furloughed, for example through the Proteger Plan scheme in Costa Rica or the Employee Solidarity Assistance Fund (FASE) in the Dominican Republic, which has generally been designed for the self-employed.
� In some countries, worker-oriented measures have been accompanied by temporary reductions or deferrals of income tax payments including, in some cases, payment schemes (several interest-free instalments). Furthermore, some countries have fast-tracked income tax refunds
7 See OLACEFS (2020).8 For more details on the measures described in this section see ECLAC (2020).

COVID-19
14
for the 2019 tax year. Initiatives aimed at supporting consumption of basic necessities have also played an important role in the fiscal responses to support households.
� The crisis precipitated by the pandemic is having a disproportionate impact on women: an excessive burden of unpaid work, increased poverty and job insecurity, limited access to public services and insufficient financing for gender equality policies. Moreover, women are now on the first line of response to the health crisis and are more exposed to infection, as they account for 72.6% of those employed in the region’s health sector.
� Several countries are implementing measures in areas such as prevention of violence against women, promotion of co-responsibility for care, protection of women’s jobs and income, and access to benefits. For example, Colombia and Mexico have increased their budgets for places in safe houses and specialized shelters for women who are victims of gender-based violence.
� Fiscal response measures in the region have also focused on protecting productive capacity through financial instruments to provide companies with liquidity. Numerous credit lines have been made available, mainly for MSMEs, with preferential rates and in some cases a grace period for repayment of principal (see table 6). These loans are intended to provide quick access to working capital to cover payrolls. In Argentina, the Programme to support Competitiveness (PAC) COVID-19 credit line is intended to finance research and technological development plans. In Panama, Plan Agro Solidario also includes subsidies for buying agricultural inputs. Argentina, Brazil, Chile, Mexico, Paraguay, Peru and Uruguay have also adopted State credit guarantee instruments to facilitate enterprises’ access to the banking sector, and particularly access for MSMEs. Simultaneously, tax relief measures have been announced, focusing on tax on income and earnings, social contributions and VAT. These measures generally provide for later deadlines for tax returns, exemptions for the duration of the state of health emergency or payment facilities.
Table 6 | Latin America and the Caribbean: types of fiscal measures adopted to mitigate the social and economic impact of the pandemic
Strengthening the health system
Supporting household income
Protecting productive capacity
Tax relief - Temporary reductions in value added tax (VAT)
- Elimination of import tariffs
- Temporary reductions in VAT on basic necessities
- Income tax payment facilities
- Fast-tracked tax refunds
- Payment facilities for direct taxes or reduced rates
- Temporary VAT reductions or exemptions in strategic sectors
Public expenditure - Recruitment - Special grants for
health personnel - Purchases of medical
supplies - Investment in
infrastructure - Transfers to subnational
governments
- Unconditional special grants - Strengthening of transfer
programmes - Increases in the amount or
coverage of unemployment insurance
- Consumption subsidies - Food baskets
- Subsidies for payrolls or purchases of inputs
Government-backed liquidity support
- Soft loans - Soft loans - State credit guarantees - Capital injections
Source: Economic Commission for Latin America and the Caribbean (ECLAC).
� Women’s occupations are concentrated in sectors that have been particularly hard hit, such as services, trade and tourism. In Argentina, Costa Rica and Mexico, policies have been adopted to support the liquidity of MSMEs and informal workers, which are both areas where women are overrepresented. Measures to support the tourism sector in the Bahamas, Belize and Jamaica are pursuing the same goal. In Colombia, a trust fund has been created to promote, finance and support entrepreneurship, formalization and business strengthening for women.
With regard to the eventual phasing out of containment measures, some countries have announced that they are designing additional plans for the economic recovery phase
� In Chile, for example, a new US$ 12 billion package (4.8% of GDP) was approved, to be implemented over a period of 24 months. In addition to investment projects with an emphasis

COVID-19
15
on sustainability and climate change mitigation, measures include strengthening instruments to protect household income and expanding government-backed liquidity support for the private sector (such as government guarantees and subsidized hiring of staff). Similarly, on 19 June 2020, Peru adopted a plan to reactivate the economy and support the population through public investment; the total value of the plan is 6.814 billion soles (0.9% of GDP). Paraguay has a new economic recovery plan to mobilize around US$ 2.5 billion (6.7% of GDP) over 18 months, including extending the Pytyvõ programme until the end of 2020 (grants for self-employed workers), State restructuring, a US$ 1.372 billion investment in public work projects (3.6% of GDP), and extending financing instruments for productive sectors.
Fiscal policy must play a central role in building back better for the countries of the region, with more inclusive, egalitarian and resilient societies
� The first step is to adopt fiscal stimulus measures to foster economic recovery, investment and creation of quality jobs, as lockdown measures are gradually lifted. This will require a greater fiscal effort in the region and suitable access to financing lines.
� The fiscal effort that has already been made and that will be needed over the coming months must take into account the strengthening of medium-term fiscal sustainability. To achieve this, use must be made of all the spaces that enable higher tax collection and improve the efficiency and effectiveness of public spending. On the revenue side, combating tax evasion and avoidance is more important than ever. According to ECLAC estimates, in 2018 the region lost, on average, the equivalent of 6.1% of GDP (US$ 325 billion) to tax non-compliance. Tax expenditures, which represented 3.7% of GDP on average between 2016 and 2019, also need to be reviewed. To reduce the revenue lost through these two channels and to strengthen countries’ fiscal position, domestic efforts are needed, enhanced through international coordination and cooperation.
� Given that the crisis is having a disproportionate impact on women and on the sectors in which their occupations are concentrated, fiscal policies in response to the pandemic must incorporate a gender perspective to address the discrimination experienced by women and prevent inequality gaps from widening.
� New fiscal and social pacts must be pursued, to build back more inclusive, egalitarian and efficient societies. The pandemic has exposed shortcomings in social protection systems, relating to both the labour market and social security, and deficiencies in the limited supply of crucial, high-quality public goods and services. The region must therefore step up the transition to social welfare states that guarantee better living conditions for all.
� Fiscal policy should contribute to realization of these goals through progressive and efficient tax systems that strengthen income and wealth taxes and seize opportunities for taxation of the digital economy, of activities that damage the environment and of consumption of unhealthy products. In addition, effective and equitable public spending must be pursued, prioritizing social needs.
2. Room for expansionary monetary policy
Inflation is historically low in the region, leaving room for expansionary monetary policies
� At the end of May 2020, 24 countries in the region recorded year-on-year inflation of less than 3% (seven more countries than at the end of 2019). The number of countries with inflation below 3% in the month of May had not been so high since 2006 (see figure 10).
� With the emergence of the pandemic, and in view of the space provided by low inflation, monetary authorities have focused their efforts on preventing the collapse of economies and credit systems and on avoiding financial crisis.
� One of the first reactions of central banks was to cut monetary policy rates considerably: in some countries they are close to zero. The distancing measures, the change in expected growth and the joint efforts of the fiscal and monetary authorities led to monetary policy rates being cut considerably, to historically low levels, by the ten central banks of the region that use it as their main policy instrument. In Chile and Peru, the rates are close to zero (0.5% and 0.25%, respectively). However, in other countries, such as Mexico and Honduras, rates remain high despite recent cuts (see figure 11).

COVID-19
16
Figure 10 | Latin America and the Caribbean: number of countries with a 12-month variation in the consumer price index (CPI) of less than 3%, 2006–2020a
(Number of countries)
6
9
0
16
9
5
7
15
13
16
1817 17 17
24
0
5
10
15
20
25
2006 2007 2008 2009 2010 2011 2012 2013 2014 2015 2016 2017 2018 2019 2020
Source: Economic Commission for Latin America and the Caribbean (ECLAC), on the basis of official figures. a Data for each year are for the month of May.
Figure 11 | Latin America and the Caribbean (selected countries): monetary policy rate in countries where it is the main policy instrument, January 2016–May 2020(Percentages)
B. Chile, Costa Rica, Dominican Republic, Honduras and Mexico
A. Brazil, Colombia, Guatemala, Paraguay and Peru
0
2
4
6
8
10
12
14
16
Jan
Mar
May Ju
l
Sep
Nov
Jan
Mar
May Ju
l
Sep
Nov Jan
Mar
May Ju
l
Sep
Nov Jan
Mar
May Ju
l
Sep
Nov Jan
Mar
May Ju
l
Sep
Nov
Jan
Mar
May Ju
l
Sep
Nov Jan
Mar
May Ju
l
Sep
Nov Jan
Mar
May Jan
Mar
May
Jan
Mar
May
Jul
Sep
Nov
2016 2017 2018 2019 2020
BrazilColombia
Guatemala
ParaguayPeru
0
1
2
3
4
5
6
7
8
9
2016 2017 2018 2019 2020
ChileCosta Rica
Mexico
HondurasDominican Rep.
Source: Economic Commission for Latin America and the Caribbean (ECLAC), on the basis of official figures.

COVID-19
17
The pace of growth in monetary aggregates has accelerated considerably
� In economies where the main policy instrument is controlling the growth rates of monetary aggregates —Argentina, Haiti, the Plurinational State of Bolivia and Uruguay, the dollarized economies (Ecuador, El Salvador and Panama), and the non-Spanish-speaking Caribbean countries (with the exception of Jamaica)— efforts have been made to stimulate demand, and monetary base growth accelerated in 2019. Such efforts have become more noticeable in 2020, especially since March (see figure 12). Similar patterns have been seen in broader aggregates, such as M1 and M2.
Figure 12 | Latin America and the Caribbean (selected countries): monetary base in countries that use monetary aggregates as their main monetary policy instrument, first quarter 2018–first quarter 2020(Percentages)
Q1 Q2 Q3 Q4 Q1 Q1Q2 Q3 Q4-10
-5
0
5
10
15
20
25
30
35
40
45
2018 2019 2020
Countries with inflation targets
Countries with dollarized economiesCaribbean countries with exchange rate anchors
Caribbean countries with adjustable exchange rates
Countries with monetary aggregate management regimes
Source: Economic Commission for Latin America and the Caribbean (ECLAC), on the basis of official figures.
� While in all country groupings growth in the money base accelerated in the first quarter of 2020, it has been slower in the dollarized economies, where access to a larger amount of foreign currency is required to expand the money base —a supply which is currently quite restricted.
The lending rate has fallen due to expansionary policies, but credit to the private sector is not recovering
� In the first quarter of 2020, the lending rate fell in 13 countries by an average of 2 percentage points (the largest drop was in Argentina, where the rate fell 12.7 percentage points). In addition, in 11 countries the labour force participation rate increased during the same period, albeit only marginally (0.24 percentage points on average). The largest rise was seen in Costa Rica (1.0 percentage point).
� In general, domestic credit to the private sector has been contracting in real terms since 2019. However, this is not the case in economies where the interest rate is the main monetary policy instrument. In those countries, real credit to the private sector has grown, but at a slower pace, and has stabilized at a rate close to 5% (see figure 13).
Figure 13 | Latin America and the Caribbean (selected countries): real domestic credit to the private sector, average year-on-year rates, first quarter of 2017–first quarter of 2020(Percentages)
-100
-80
-60
-40
-20
0
20
40
60
-5
-3
-1
1
3
5
7
9
11
13
15
Q1 Q2 Q3 Q4 Q1 Q2 Q3 Q4 Q1 Q2 Q3 Q4 Q12017 2018 2019 2020
Countries with inflation targets
The Caribbean
Countries with monetary aggregate management regimes (excluding Venezuela (Bol. Rep. of))
Argentina (right scale)
Venezuela (Bol. Rep. of) (right scale)
Source: Economic Commission for Latin America and the Caribbean (ECLAC), on the basis of official figures.

COVID-19
18
Volatility on international financial markets has been mirrored in the region, where exchange rates have fluctuated considerably, leading to depreciation of 14 currencies in the first quarter of 2020
� In 2020, the volatility of the region’s currencies increased, and the turmoil created by the pandemic caused exchange rates to correct sharply. Figure 14 shows a half-yearly indicator of exchange rate volatility for 2015–2020, measured as the average daily change (in absolute terms). As shown, the indicator for the first half of 2020 is in the top 75% in 12 of the 15 countries examined and is at its highest level in 7.
Figure 14 | Latin America and the Caribbean (15 countries): nominal exchange rate volatility, average absolute daily variations, 2015–2020(Percentages)
B. Argentina, Bolivia (Plur. State of), Nicaragua, Uruguay, Costa Rica, Haiti, Honduras and Dominican Republic
First half 2015Second half 2015 First half 2016 Second half 2016 First half 2017 Second half 2017 First half 2018Second half 2018First half 2019Second half 2019First half 2020
A. Brazil, Chile, Colombia, Paraguay, Peru, Jamaica and Mexico
0
0.2
0.4
0.6
0.8
1.0
1.2
Brazil Chile Colombia Paraguay Peru Jamaica Mexico
0
0.2
0.4
0.6
0.8
1.0
1.2
1.4
Argentina Bolivia(Plur. State of)
Nicaragua Uruguay Costa Rica Haiti Honduras DominicanRep.
Source: Economic Commission for Latin America and the Caribbean (ECLAC), on the basis of official figures.
� The increased volatility resulted in 14 currencies depreciating during the first quarter of 2020, by an average of 9.2%. Nonetheless, four currencies appreciated slightly (0.4%). Considerable capital flows, a fall in stock markets, a downturn in international trade, and declines in commodity prices, remittances and tourism led to these corrections. In the second quarter, with a recovery of commodity prices and increased capital inflows to emerging economies, particularly those in the region, the situation changed: seven currencies appreciated (3.4% on average) and 11 depreciated (3.7% on average).

COVID-19
19
Although the heightened volatility in currencies was accompanied by increased exchange rate intervention and hence greater use of international reserves, reserves grew in the first five months of 2020
� From January to May 2020, reserves increased by 1.2%, but remained below their 2018 levels (see figure 15). Reserves expanded in 13 countries and contracted in another 13.9 The economies which saw their reserves decline the most were El Salvador, Guyana, Panama and Suriname, where falls exceeded 13%. The countries with the greatest accumulation of reserves were the Bahamas, Barbados, Guatemala and Paraguay, with increases of over 11%.
Figure 15 | Latin America and the Caribbean: gross international reserves, 2015–2020a
(Billions of dollars)
812
831
859
867
849
859
800
810
820
830
840
850
860
870
880
890
900
2015 2016 2017 2018 2019 2020
Source: Economic Commission for Latin America and the Caribbean (ECLAC), on the basis of official figures.a The chart was prepared on the basis of information available at 31 May 2020.
Macroprudential rules have been adjusted to promote macrofinancial stability
� Measures have been taken in the region’s economies to protect macrofinancial stability from the crisis. In general, the approach adopted by macroprudential policy supervisors has been to use all available tools, conventional or otherwise. Some of the goals pursued and the measures that have been taken in this regard are as follows:
• Increasing the stock of liquidity of the financial system. The measures adopted to achieve this aim include large cuts to monetary policy rates; relaxation of liquidity coverage ratios or temporary suspension thereof; cuts to the legal reserve rate; and creation of facilities for improved access to financing for financial institutions facing short-term liquidity shortfalls.
• Assisting financial institutions and debtors to prevent deterioration of financial institutions’ balance sheets. The measures adopted to achieve this include temporary adjustment of regulations, to alleviate the financial burden on debtors; relaxation of solvency requirements for intermediaries; streamlining of electronic payments; adjustment of the special accounting rules for financial institutions; voluntary suspension of dividend payments to shareholders by institutions; restructuring of existing lending; and increases in guarantees (public guarantees) for loans, in particular for those to small and medium-sized enterprises.
• Stabilizing the foreign exchange market. To achieve this goal, in addition to the use of international reserves, monetary authorities have turned to forward and swap markets; differentiated reserve requirements for foreign-currency deposits; and swaps and liquidity lines with the Federal Reserve System and global financial institutions, such as the International Monetary Fund (IMF).
• Injecting liquidity into treasuries, large companies and financial institutions through central banks. To achieve this aim, non-conventional measures have been adopted, including outright repurchases of public bonds held by banks, inclusion of corporate bonds in eligible collateral for all current operations, and the launch of a programme to purchase bank bonds from system participants.
9 At the date of publication of this study, the Eastern Caribbean economies had not reported their international reserves for 2020.

COVID-19
20
E. Four lines of action
1. An emergency basic income as a tool for social protection
� Broad strata of the population in the region are very vulnerable to loss of labour income. Based on the new projections of GDP contractions and rising unemployment, it is estimated that, in 2020, 491 million people (79.2% of the region’s population) will belong to the low or lower-middle income strata, with per capita incomes of up to three times the poverty line (see figure 16).
� The crisis will produce downward economic mobility. In 2020, 37.6 million people who were in the low-income non-poor strata (between 1 and 1.8 poverty lines per capita) will likely fall into poverty and 4 million into extreme poverty.
� The position of the middle strata will deteriorate sharply: 33.5 million people will slip from the middle strata (13% of all those in these sectors) into the low-income strata. In particular, 32.8 million people who were in the lower-middle strata before the pandemic will move to the lower strata. Of these, 2.1 million may fall directly into poverty or extreme poverty.
Figure 16 | Latin America (18 countries):a population by per capita income strata,b 2019 and 2020(Millions of persons)
67
118
158
125
97
28
19
0
100
200
300
400
500
600
700
2019 2020
Extremely poorPoorLow-income non-poorLower-middleIntermediate-middleUpper-middleHigh-income strata
470million
Low-income strataMiddle-income strata
96
135
148
85
25
18
112
491million
Source: Economic Commission for Latin America and the Caribbean (ECLAC), on the basis of Household Survey Data Bank (BADEHOG).a Argentina, Bolivarian Republic of Venezuela, Brazil, Chile, Colombia, Costa Rica, Dominican Republic, Ecuador, El Salvador, Guatemala, Honduras,
Mexico, Nicaragua, Panama, Paraguay, Peru, Plurinational State of Bolivia and Uruguay. Data for 2020 are projections based on a 9.1% drop in GDP and a 5.4 percentage point increase in unemployment.
b Per capita income limits for the strata expressed as multiples of the poverty lines estimated by ECLAC for the countries. “Extremely poor” refers to income equivalent to less than the extreme poverty line; “non-extreme poor”, from the extreme poverty line to less than the poverty line; “low-income non-poor”, from the poverty line to less than 1.8 times the poverty line; “lower-middle”, from 1.8 to 3 times the poverty line; “intermediate-middle”, more than 3 times the poverty line, up to 6 times the poverty line; “upper-middle”, more than 6 times the poverty line and up to 10 times the poverty line; and “high”, above 10 times the poverty line.
� The deepening of the COVID-19 crisis in May and June led several countries in the region to increase the duration, coverage and amount of non-contributory and mostly unconditional cash transfers aimed at protecting the population’s income.
� As at 3 July 2020, 30 Latin American and Caribbean countries had adopted 190 social protection measures to help households facing the greatest poverty, vulnerability and insecurity to weather the pandemic. These measures include cash transfers, transfers in kind and ensuring the provision of basic services. Cash and in-kind transfers cover about 69 million households, corresponding to 289 million people or 44% of the region’s

COVID-19
21
population. The spending projected for six months is around US$ 67.135 billion, which is about 1.3% of GDP at 2020 prices.
� In Argentina, the Emergency Family Income was initially announced as a single payment, but in June a second round of disbursements was made. Also in June, Chile enacted a new Emergency Family Income (IFE 2.0), adding three payments to the one made at the beginning of May. The amount of the benefit was higher (100,000 pesos per person, or about US$ 125) than the first round of the programme (which had been 65,000 pesos, or about US$ 80) and its coverage was extended from about 1.7 to 2.1 million households. In Colombia, Solidarity Income, the cash transfer in support of vulnerable families (mainly informal workers) not receiving assistance through other programmes, will last until December 2020.
� To shield the population from the profound socioeconomic impacts of the crisis, ECLAC has proposed that the region’s governments provide cash transfers to meet basic needs and sustain consumption, in the form of an emergency basic income consisting of a monetary transfer equivalent to the poverty line (US$ 143 at 2010 prices) for six months for the entire population living in poverty in 2020.
� The new projections indicating a larger increase in the population in poverty in 2020 will increase the costs of the emergency basic income at the regional level presented in ECLAC (2020b). However, given the extra efforts countries have been making to supply emergency cash transfers, ECLAC estimates the additional cost of the emergency basic income for six months at 2% of GDP, that is, 0.1% less than previously estimated (see figure 17).
Figure 17 | Latin America (18 countries): estimated additional cost of basic emergency income, by duration of benefita b
(Percentages of GDP)
0.3 0.6 0.9 1.30.81.3
1.31.3
0.8
2.0
3.6
5.2
0
1
2
3
4
5
6
7
8
9
3 months 6 months 9 months 12 months
Conditional cash transfers and social pensions
Emergency spendingAdditional spending
Source: Economic Commission for Latin America and the Caribbean (ECLAC).a Argentina, Bolivarian Republic of Venezuela, Brazil, Chile, Colombia, Costa Rica, Dominican Republic, Ecuador, El Salvador, Guatemala, Honduras,
Mexico, Nicaragua, Panama, Paraguay, Peru, Plurinational State of Bolivia and Uruguay.b Estimate based on a 9.1% drop in GDP and a population of 203.9 million living in poverty in 2020. The administrative costs associated with the
transfers have not been considered.
� Lastly, given the intensity and duration of the pandemic in the region, ECLAC suggests that countries consider extending the emergency basic income to 9 or 12 months in order to increase protection for the population.
2. An anti-hunger grant
� In Latin America and the Caribbean, hunger stems from poverty (particularly extreme poverty), not from a lack of food. As the extreme poverty line is determined by the cost of the basic food basket, those with income below this line do not have the resources to cover basic food costs. This means that the economic downturn projected for 2020 is likely to have a direct impact on the food security of millions.

COVID-19
22
� In view of this, ECLAC and the Food and Agriculture Organization of the United Nations (FAO) have proposed that governments should establish an anti-hunger grant as a complement to the emergency basic income for all the population in extreme poverty (ECLAC/FAO, 2020).
� The value of each grant would be equivalent to 70% of the regional extreme poverty line (US$ 67 at 2010 prices). Taking into account the changes in the projections presented in this report, the total cost of the anti-hunger grant has been re-estimated at US$ 27.1 billion, equivalent to 0.52% of regional GDP.
� Depending on each national or local situation, this can be done through cash transfers, food baskets, food vouchers or school feeding programmes. Although the responsibility for this initiative would lie with central governments, it would also require the involvement of municipalities, businesses, civil society organizations and individuals, as well as international cooperation.
3. Support for businesses and jobs at risk
� The effects of the crisis will lead to the closure of more than 2.7 million formal businesses in the region with the loss of 8.5 million jobs, not including jobs shed by firms that are able to keep operating (ECLAC, 2020c; ECLAC /FAO, 2020).
� The impacts will vary significantly by economic sector and type of company. The most affected will be microenterprises (more than 2.65 million closures) and small enterprises (almost 100,000 closures) owing to their strong presence in the sectors that will be hit hardest by the crisis, such as retail sales, hotels and restaurants.
� In response to this situation, ECLAC has proposed three sets of measures.
(i) Boost companies’ liquidity, especially smaller companies, by:
• Postponement or cancellation of tax, social security and property tax payments, or advance payment of tax refunds at least until the end of 2020.
• Suspension of payment for electricity, water, gas and telecommunications services, without fines or service cuts, until the end of 2020.
• Flexibility and improvement of credit conditions:
– Grace periods of at least one year and terms of five years or more.
– Strengthened credit operations through development banks, which are more willing to assume the risk associated with smaller companies than commercial banks.
• Expansion of the credit portfolio to the agricultural sector by 20% (US$ 5.5 billion), including by providing guarantee and insurance systems.
• A one-time grant of US$ 250 to invest in the most disadvantaged farms, for fertilizers, seeds and other inputs. This measure would encompass around 40% of total family farming in the region (around 6.8 million farms) and would cost US$ 1.7 billion.
(ii) Prevent capacity destruction by:
• Payroll co-financing differentiated by size of firm: 30% for large firms, 50% for medium firms, 60% for small firms and 80% for microenterprises. This grant would last for six months and could cost up to 2.7% of GDP.
• A cash contribution to the formal self-employed. This six-month subsidy for each self-employed worker could amount to between US$ 300 and US$ 500 depending on the situation in each country. The public resources committed at the regional level would represent 0.8% of GDP and would cover over 15 million workers.
(iii) Support large companies in strategic sectors at risk
• Although large firms may be more resilient than smaller ones, they are at real risk of losses in terms of jobs, productive capacity, technology and exports. In addition to access to credit on favourable terms and payroll co-financing, the possibility should

COVID-19
23
be considered of State involvement in recapitalizing large enterprises in strategic sectors. This support should be conditional: firms should commit to refrain from distributing profits or laying off workers for a certain period of time after receiving the co-financing or capital contribution, and to implement investment plans to accelerate the reactivation or make their operations more environmentally sustainable.
� Measures to support firms and job creation complement the emergency basic income for the entire population in poverty and the anti-hunger bonus for the population in extreme poverty. To the extent that payroll co-financing and cash support to the self-employed are effective, they will reduce unemployment and poverty, thereby lowering the total cost of the emergency basic income and the anti-hunger grant. Measures to support employment and recovery would thus be in synergy with those designed to provide an immediate response to the most critical personal and family situations.
4. Strengthening the role of international financial institutions
� The international financial community should broaden liquidity conditions to meet global financing needs.
� In this regard, special importance should be afforded to proposals that IMF make a major issue of special drawing rights (SDRs) that would increase liquidity and allow countries to cope with a drop in their international reserves. An issue in the order of US$ 500 billion would be equivalent to about US$ 40 billion in additional international reserves for the economies of the region, of which approximately US$ 2 billion would be for the Caribbean.
� A complementary measure to address global financing needs is the expansion of special low-cost, long-term lines of credit to promote the use of international financing as a mechanism to boost the development of low-income and middle-income countries.
� A necessary condition for this expansion in credit lines would be a commitment by the international community, especially the Group of 20 (G20), to capitalize the multilateral credit institutions. For example, IMF estimates that the financing needs of developing economies are at least US$ 2.5 trillion, in contrast to a lending capacity of only US$ 1 trillion.
� Another priority area of cooperation for the international financial system concerns debt relief and debt service in low-income and middle-income countries whose crisis response capacity is severely constrained high debt service burdens.
� Debt relief could be implemented through a debt-for-action climate change adaptation swap that includes the creation of a resilience fund, a debt service standstill and a change in the eligibility criteria required by international financial institutions to extend concessional financing. These actions could be complemented with the issuance of contingency bonds, especially with clauses on the effects of hurricanes; green bonds and blue bonds; and liquidity support through the issuance of special drawing rights.
� In the region, concessional financial support would be especially necessary for the countries of the Caribbean and Central America to enhance their response to the crisis and address the economic and climate vulnerabilities that affect them.
� International cooperation and financial assistance are essential to address the effects of the pandemic and to give the region the financial space to build more egalitarian and sustainable societies.

COVID-19
24
Bibliography
Ariu, A. (2016), “Why trade in services resisted the crisis”, New Perspectives on Global Economic Dynamics, 11 October [online] https://ged-project.de/trade-and-investment/why-trade-in-services-resisted-the-crisis/.
Board of Governors of the Federal Reserve System (2020), “Federal Reserve Board and Federal Open Market Committee release economic projections from the June 9-10 FOMC meeting”, Press Release, 10 June [online] https://www.federalreserve.gov/newsevents/pressreleases/monetary20200610b.htm.
ECB (European Central Bank) (2020), “Macroeconomic projections for the euro area”, 4 June [online] https://www.ecb.europa.eu/pub/projections/html/ecb.projections202006_eurosystemstaff~7628a8cf43.en.html.
ECLAC (Economic Commission for Latin America and the Caribbean) (2020a), Fiscal Panorama of Latin America and the Caribbean, 2020: fiscal policy amid the crisis arising from the coronavirus disease (COVID-19) pandemic (LC/PUB.2020/6-P), Santiago.
___(2020b), “The social challenge in times of COVID-19”, COVID-19 Special Report, No. 3, Santiago, 12 May.
___(2020c), “Sectors and businesses facing COVID-19: emergency and reactivation”, COVID-19 Special Report, No. 4, Santiago, 2 July.
ECLAC/FAO (Economic Commission for Latin America and the Caribbean/Food and Agriculture Organization of the United Nations) (2020), “Preventing the COVID-19 crisis from becoming a food crisis: Urgent measures against hunger in Latin America and the Caribbean”, COVID-19 Report, Santiago, 16 June.
EIA (Energy Information Administration) (2020), Short-Term Energy Outlook, 7 July [online] https://www.eia.gov/outlooks/steo/report/.
IIF (Institute of International Finance) (2020), “Global Debt Monitor: COVID-19 lights a fuse”, 6 April [online] https://www.iif.com/Portals/0/Files/content/Research/Global%20Debt%20Monitor_April2020.pdf.
OLACEFS (Organization of Latin American and Caribbean Supreme Audit Institutions) (2020), “Acciones Regionales COVID-19” [online] https://www.olacefs.com/covid19-accionesefs/.
United Nations (2020), World Economic Situation and Prospects as of mid-2020, New York.
UNWTO (World Tourism Organization) (2020a), “International tourist numbers could fall 60-80% in 2020, UNWTO Reports”, Press Release, 7 May [online] https://www.unwto.org/news/covid-19-international-tourist-numbers-could-fall-60-80-in-2020.
___(2020b), World Tourism Barometer. Statistical Annex, vol. 18, No. 2, May [online] https://webunwto.s3.eu-west-1.amazonaws.com/s3fs-public/2020-05/UNWTO_Barom20_02_May_Statistical_Annex_en_.pdf.
World Bank (2020a), Global Economic Prospects, June [online] https://www.bancomundial.org/es/publication/global-economic-prospects#forecasts.
___(2020b), “World Bank predicts sharpest decline of remittances in recent history”, Press Release, 22 April [online] https://www.bancomundial.org/es/news/press-release/2020/04/22/world-bank-predicts-sharpest-decline-of-remittances-in-recent-history.
WTO (World Trade Organization) (2020), “Trade forecast press conference: remarks by DG Azevêdo”, 8 April [online] https://www.wto.org/english/news_e/spra_e/spra303_e.htm.
This Special Report is the fifth in a series by the Economic Commission for Latin America and the Caribbean (ECLAC) on the evolution and impacts of the COVID-19 pandemic in Latin America and the Caribbean. The economic and social analysis it offers will be updated as the relevant information becomes available. The preparation of the Report is headed by the Executive Secretary of ECLAC, Alicia Bárcena, with the technical support of the Office of the Deputy Executive Secretary, Mario Cimoli, and the substantive divisions responsible for the topics addressed, as well as the subregional headquarters and country offices of ECLAC.
Copyright © United Nations, 2020