Coverage Stock: Manappuram Finance Ltd - Edelweiss … · Manappuram Finance Ltd. 3 Edel Invest...
28
1 Edel Invest Research The second coming CMP: INR 92 Target Price: INR 118 Edel Invest Research BUY Coverage Stock: Manappuram Finance Ltd Manappuram Finance Ltd is India’s second largest listed specialized Gold Loan NBFC with a Gold Loan AUM of INR 12383 cr and a network of 3,293 branches. The company witnessed a perfect storm in FY12-14, when gold prices fell sharply and the regulatory environment worsened, leading to a -16% CAGR in its AUM. Since FY14, gold prices have stabilized and the regulatory environment has improved. Importantly, the company possesses some unique advantages that are allowing it to grow AUM and win market share in the gold loan market, a trend we expect to sustain going forward. Therefore, we recommend a BUY rating on the stock. Superior NPA and auction math due to Manappuram’s focus on products of shorter tenures We conducted a statistical analysis of daily MCX gold prices from October 2005 till date to understand the numerical reduction in risks linked to gold prices. From our analysis, we learned that the theoretical risk of default was 42% for a 12-month loan which fell to a negligible 0.03% for a 3-month LTV loan. Manappuram’s underlying gold holdings trend shows a robust operational backbone We looked at the gold holdings trend for Manappuram and noted its ability to grow gold holdings in the face of falling gold prices. In FY14-16, Manappuram’s gold holdings grew at a CAGR of 15% even as gold prices de-grew at a CAGR of 4.7%. Manappuram has significant upside in operating leverage vs Muthoot Finance Manappuram has made significant investments to grow its branch network to 3,293 branches by FY13. Its AUM per branch of INR 3.9 cr compares well with Rs 6.3 cr for Muthoot Finance, indicating significant scope for upside for the company from an operating leverage perspective. Manappuram’s Non-Gold Loan portfolio highly synergistic Manappuram’s strategy of focusing on Microfinance, small-ticket Housing Finance for the self-employed category and Used CV Finance is highly synergistic in terms of branch network and target clientele. We also note that the AUM per branch for Ashirvad Microfinance stands at INR 2.7 cr compared to INR 6.1-13.8 cr for key listed peers, leaving considerable upside from an operating leverage perspective. Manappuram continues to win market share amid decreasing competitive intensity Since FY14, Manappuram has been gaining market share even as certain non-specialized entities seem reluctant to keep gold loan risk on their balance sheets. Manappuram has grown its market share from 6% in FY14 to 7.2% in FY16 amid diminishing competitive intensity in the Gold Loan segment. Manappuram’s branch presence gives it a distinct advantage Manappuram has 1,778 branches in Rural and Semi-Urban centres compared to 304-851 for key competitors. It has 2,239 branches in South India compared to 389-874 for key competitors. It possesses the optimal branch network to exploit the generic Gold Loan opportunity. Manappuram a beneficiary of NBFC vs Banks competition, shift from informal to formal and benign gold price outlook Specialised NBFCs continue to maintain various operational advantages over banks, and as a consequence they continue to win market share. The shift from the unorganised sector to formal lending will accelerate due to Aadhaar and Jan Dhan coverage as well as demonetisation. Furthermore, long-term outlook for gold prices remain bright given the start of a new global price cycle, which is further supported by INR depreciation vis-à-vis USD. Valuation and rating: Initiate with BUY, PT of INR 118 We use the Residual Income Model to arrive at a Price Target of INR 118 for Manappuram, reflecting a multiple of 2.2x its FY18E book value. We initiate coverage on Manappuram with a BUY rating and our PT provides 29% upside from the current level. The stock currently trades at 1.8x FY18E book value and we envisage 23-25% RoE over FY17E-19E. (INR Cr) FY15 FY16 FY17E FY18E FY19E Net Interest Income 1103 1329 1959 2382 2807 Total Income 1108 1334 1964 2387 2812 Profit After Tax 271 337 697 985 1204 Basic EPS 3.2 4.0 8.3 11.7 14.3 P/E 28.5 22.9 11.1 7.8 6.4 Book value per share 31 33 40 52 66 P/B 2.9 2.8 2.3 1.8 1.4 Return on Average Equity 11% 13% 23% 25% 24% Credit Costs 0.3% 0.3% 0.5% 0.4% 0.4% Shivaji Thapliyal Research Analyst +91 (22) 4272 2159 [email protected] Bloomberg: MGFL:IN 52-week range (INR): 107 / 26 Share in issue (Crs): 84 M cap (INR crs): 6,737 Avg. Daily Vol. BSE/NSE :(‘000): 6213 SHARE HOLDING PATTERN (%) Date: 6 th February, 2017 Promoter, 34.5 Public, 65.6 0 30 60 90 120 150 180 210 240 270 300 330 Jan-15 Mar-15 May-15 Jul-15 Sep-15 Nov-15 Jan-16 Mar-16 May-16 Jul-16 Sep-16 Nov-16 Manapuram Sensex
Transcript of Coverage Stock: Manappuram Finance Ltd - Edelweiss … · Manappuram Finance Ltd. 3 Edel Invest...
1 Edel Invest Research
The second coming CMP: INR 92 Target Price: INR 118
Edel Invest Research BUY
Coverage Stock: Manappuram Finance Ltd
Manappuram Finance Ltd is India’s second largest listed specialized Gold Loan NBFC with a Gold Loan AUM of INR 12383 cr and a network of 3,293 branches. The company witnessed a perfect storm in FY12-14, when gold prices fell sharply and the regulatory environment worsened, leading to a -16% CAGR in its AUM. Since FY14, gold prices have stabilized and the regulatory environment has improved. Importantly, the company possesses some unique advantages that are allowing it to grow AUM and win market share in the gold loan market, a trend we expect to sustain going forward. Therefore, we recommend a BUY rating on the stock.
Superior NPA and auction math due to Manappuram’s focus on products of shorter tenures We conducted a statistical analysis of daily MCX gold prices from October 2005 till date to understand the numerical reduction in risks linked to gold prices. From our analysis, we learned that the theoretical risk of default was 42% for a 12-month loan which fell to a negligible 0.03% for a 3-month LTV loan.
Manappuram’s underlying gold holdings trend shows a robust operational backbone We looked at the gold holdings trend for Manappuram and noted its ability to grow gold holdings in the face of falling gold prices. In FY14-16, Manappuram’s gold holdings grew at a CAGR of 15% even as gold prices de-grew at a CAGR of 4.7%.
Manappuram has significant upside in operating leverage vs Muthoot Finance Manappuram has made significant investments to grow its branch network to 3,293 branches by FY13. Its AUM per branch of INR 3.9 cr compares well with Rs 6.3 cr for Muthoot Finance, indicating significant scope for upside for the company from an operating leverage perspective.
Manappuram’s Non-Gold Loan portfolio highly synergistic Manappuram’s strategy of focusing on Microfinance, small-ticket Housing Finance for the self-employed category and Used CV Finance is highly synergistic in terms of branch network and target clientele. We also note that the AUM per branch for Ashirvad Microfinance stands at INR 2.7 cr compared to INR 6.1-13.8 cr for key listed peers, leaving considerable upside from an operating leverage perspective.
Manappuram continues to win market share amid decreasing competitive intensity Since FY14, Manappuram has been gaining market share even as certain non-specialized entities seem reluctant to keep gold loan risk on their balance sheets. Manappuram has grown its market share from 6% in FY14 to 7.2% in FY16 amid diminishing competitive intensity in the Gold Loan segment.
Manappuram’s branch presence gives it a distinct advantage Manappuram has 1,778 branches in Rural and Semi-Urban centres compared to 304-851 for key competitors. It has 2,239 branches in South India compared to 389-874 for key competitors. It possesses the optimal branch network to exploit the generic Gold Loan opportunity.
Manappuram a beneficiary of NBFC vs Banks competition, shift from informal to formal and benign gold price outlook Specialised NBFCs continue to maintain various operational advantages over banks, and as a consequence they continue to win market share. The shift from the unorganised sector to formal lending will accelerate due to Aadhaar and Jan Dhan coverage as well as demonetisation. Furthermore, long-term outlook for gold prices remain bright given the start of a new global price cycle, which is further supported by INR depreciation vis-à-vis USD.
Valuation and rating: Initiate with BUY, PT of INR 118 We use the Residual Income Model to arrive at a Price Target of INR 118 for Manappuram, reflecting a multiple of 2.2x its FY18E book value. We initiate coverage on Manappuram with a BUY rating and our PT provides 29% upside from the current level. The stock currently trades at 1.8x FY18E book value and we envisage 23-25% RoE over FY17E-19E.
(INR Cr) FY15 FY16 FY17E FY18E FY19E
Net Interest Income 1103 1329 1959 2382 2807
Total Income 1108 1334 1964 2387 2812
Profit After Tax 271 337 697 985 1204
Basic EPS 3.2 4.0 8.3 11.7 14.3
P/E 28.5 22.9 11.1 7.8 6.4
Book value per share 31 33 40 52 66
P/B 2.9 2.8 2.3 1.8 1.4
Return on Average Equity 11% 13% 23% 25% 24%
Credit Costs 0.3% 0.3% 0.5% 0.4% 0.4%
Shivaji Thapliyal Research Analyst +91 (22) 4272 2159 [email protected]
Bloomberg: MGFL:IN
52-week range (INR): 107 / 26
Share in issue (Crs): 84
M cap (INR crs): 6,737
Avg. Daily Vol. BSE/NSE
:(‘000): 6213
SHARE HOLDING PATTERN (%)
Date: 6th
February, 2017
Promoter, 34.5
Public, 65.6
0306090
120150180210240270300330
Jan
-15
Mar
-15
May
-15
Jul-
15
Sep
-15
No
v-1
5
Jan
-16
Mar
-16
May
-16
Jul-
16
Sep
-16
No
v-1
6
Manapuram Sensex

Manappuram Finance Ltd.
2 Edel Invest Research
I. Manappuram’s product modifications have transformed NPA and auction math Product modifications have dramatically reduced risk linked to gold price volatility
A sustained bull market in global gold prices from c.1999 to c.2012 with minimal downside volatility did not
require Manappuram to reconsider its single product structure of 12-month tenure. However, the start of a
bear market in gold post 2012 eventually prompted the company to introduce shorter-tenure loan products
of 3-month, 6-month and 9-month duration in June 2014. This has significantly reduced the risk linked to
gold price volatility.
Illustration of product modifications and its impact
Phase Before
Product Modification
After Product Modification
Product (Loan tenure) 12
Months 3
Months 6
Months 9
Months 12
Months
Value of gold borrowed against (INR) 100 100 100 100 100
Loan to Value Ratio 75% 75% 70% 65% 60%
Loan disbursed (INR) 75 75 70 65 60
Annualised Interest Rate 24% 24% 24% 24% 24%
Tenure in months 12 3 6 9 12
Simple interest (INR) 18.0 4.5 8.4 11.7 14.4
Total repayment at end of tenure (INR) 93.0 79.5 78.4 76.7 74.4
Gold drawdown that would put borrower out of money
7.0% 20.5% 21.6% 23.3% 25.6%
Time taken to auction in months 2 2 2 2 2
Simple interest over auction period (INR)
3 3 2.8 2.6 2.4
Target recoverable at auction (INR) 96.0 82.5 81.2 79.3 76.8
Auction discount (% loss on recovery) 10% 10% 10% 10% 10%
Gold drawdown that would result in loss to lender
-6.7% 8.3% 9.8% 11.9% 14.7%
Source: Company data, Edel Invest Research
Probability of default as well auction dramatically reduced
We studied an extended sample of daily MCX gold prices from October 2005 till date to examine altered
probability scenarios for Manappuram. We note that for the 12-month loan product, a 7% drawdown would
put the borrower out of money and increase the chance of a default (see illustration above). From our
sample of MCX gold prices we also find that the borrower has been out of money 42% of the time,
considering the instances of over 7% drawdowns within a 12-month period. When the period is shortened to
3-month but the drawdown threshold is retained at 7%, the borrower falls out of money a still significant
24% of the time. However, for 3-month loans with a drawdown threshold of 20.5% (applicable to the new 3-
month loan products), the borrower is out of the money only 0.03% of the time.
Furthermore, with the earlier 12-month loan product, following an instance of loan default and the
subsequent auction process, economic losses to Manappuram were a near certainty. A 6.7% appreciation in
gold prices was imperative over the loan tenure to prevent economic losses. However, with the new 3-
month loan product, a cushion of 8.3% would be available before the lender starts to incur economic losses
during the auction process.

Manappuram Finance Ltd.
3 Edel Invest Research
Manappuram sales strategy focusing on shorter-tenure products but not Muthoot Movement in advances maturity profile shows divergence between Muthoot and Manappuram
We looked at the maturity profile for the advances for Muthoot and Manappuram and note a distinct
divergence between the two specialised gold loan NBFCs.
Evolution of Maturity Profile of Advances for over FY12-16 – Manappuram vs Muthoot
Manappuram Muthoot
FY12 FY16 FY12 FY16
1 to 30/31 days (one month) 1959 3,009 2819 4,631
Over one month to 2 months 1368 2,543 5637 3,901
Over 2 months to 3 months 1059 2,999 3020 2,199
Over 3 months to 6 months 1731 685 4457 5,119
Over 6 months to 1 year 3516 867 4172 6,583
Over 1 year to 3 years 5 102 1234 1,947
Over 3 to 5 years 0 81 0 0
Over 5 years 0 19 0 0
Total 9639 10,306 21338 24,379
Source: Company data
Proportion of Advances with <=3 months Maturity – Muthoot vs Manappuram
Source: Company data
Manappuram branch personnel have actively pushed shorter-tenure products and, as of now, all incremental
gold loan products from Manappuram come with a 3-month limit for loan renewal or closure. This means
that Muthoot is keeping more gold price risk on its balance sheet than Manappuram. This is reflected, to an
extent, in the divergent GNPA Ratios of 2.2% for Muthoot and 0.9% for Manappuram as of H1FY17.
This difference in approach could be on account of Muthoot deciding to offer greater flexibility to their
customers whereas Manappuram personnel have been communicating a 3-month loan tenure limit to their
clientele. This does not seem to have impacted Manappuram’s growth in comparison to Muthoot and, in
fact, Manappuram has outpaced Muthoot, growing gold loan AUM at a CAGR of 11% over FY14-16 compared
with 6% for Muthoot. In H1FY17, this differential has further diverged with Manappuram growing 30% yoy
compared with 10% for Muthoot.
We feel that, given lower operating leverage, Muthoot will have to incrementally (compared with
Manappuram) incentivize customers to deliver AUM growth and the differentiation above is a manifestation
of the same. Furthermore, while the credit costs for Muthoot seem manageable currently, the company
remains exposed to significantly higher credit costs in the event of high gold price volatility.
54% 53% 53% 53%
44%
46%
29% 36%
60%
83%
FY12 FY13 FY14 FY15 FY16
Muthoot Manappuram

Manappuram Finance Ltd.
4 Edel Invest Research
II. Manappuram’s underlying Gold Holdings growth: Significant positive takeaways
The relationship between the performance of a Gold Loan business with gold prices is two-fold: (1) Ceteris
Paribus, loan growth is directly linked to gold prices since loans are disbursed as a percentage of gold prices
(the LTV is capped at 75%) and (2) The borrowers are more inclined to use their gold holdings as a collateral
in a scenario of rising gold prices. However, the latter relationship can be overcome by building in unique
competitive advantages in the Gold Loan business and, in this regard, Manappuram scores over Muthoot
Finance.
YOY Growth of Gold Holdings of key Gold Loan NBFCs vis-à-vis YOY Growth of Gold Prices
Source: Company data, RBI; Period averages of Gold prices used
Underlying Gold Holdings for Manappuram less dependant on gold prices
The correlation between the Gold Holdings of Manappuram and gold prices over FY12-H1FY17 (7 data
points) is 0.06, which signifies a weak relationship. The correlation between the Gold Holdings of Muthoot
and gold prices over FY12-H1FY17 is 0.61, a significantly positive relationship when compared to
Manappuram.
Underlying Gold Holdings growth stronger for Manappuram since FY14, despite gold price trend
Importantly, it is interesting to note that over FY14-16, gold prices de-grew at a CAGR of 4.7%, and yet
Manappuram and Muthoot Gold Holdings grew at a CAGR of 15% and 10%, respectively. This means that
Gold Loan NBFCs can still grow their Gold Holdings in a scenario of falling gold prices as long as the decline is
not rapid and is relatively orderly in nature. Between Manappuram and Muthoot, the higher CAGR for the
former indicates superior ability to deliver underlying growth in the face of weak gold prices.
It may be noted thatthough gold prices continued to trend lower post FY14, they have been less volatile.
Secondly, regulatory overhang eased on Gold Loan NBFCs, with the LTV cap moving from 60% to 75%.
Manappuram has displayed a better ability than Muthoot to take advantage of this improved regulatory
environment. The trend of stronger Gold Holdings growth for Manappuram continued into H1FY17, with a
growth of 15% YOY compared to 4% for Muthoot.
-40%
-20%
0%
20%
40%
60%
80%
FY05 FY06 FY07 FY08 FY09 FY10 FY11 FY12 FY13 FY14 FY15 FY16 H1FY17
Manappuram Muthoot Gold price

Manappuram Finance Ltd.
5 Edel Invest Research
III. Manappuram compares well with key rival Muthoot on operating leverage
We are comparing Manappuram with the nearest competitor Muthoot in the Gold Loan space, as this is the
only fair comparison available. Most importantly, we note that the AUM per branch for Manappuram stands
at INR 3.9 cr compared with INR 6.3 cr for Muthoot, indicating that significant upside potential prevails for
Manappuram from an operating leverage perspective.
Comparison of Manappuram with Muthoot– Q2FY17
Manappuram Finance Muthoot Finance
Loan book:
Loans book size (Rs cr) 14,486 28,308
Gold Loans as a % Total Loans 85.5% 96.8%
Funding mix:
Bank Finance 62% 42%
DCM 37% 44%
Other 1.4% 14%
Other key metrics:
AUM / branch (INR cr) 3.9 6.3
Opex to AUM 6.9% 4.8%
GNPA Ratio 0.9% 2.2%
NNPA Ratio 0.7% 1.8%
Gold Holding (T) 66 150
RoA 5.1% 4.5%
RoE 24% 20%
CAR 22% 24%
Source: Company data
It may be noted that Manappuram has already made significant investments to grow its branch network to
3,293 branches by FY13. Snce then, there has been no need to expand the branch count. We do not expect
any requirement for Manappuram to expand the branch count in the near to medium term, leaving
significant upside from operating leverage perspective.
Manappuram has already transitioned to 90-dpd recognition for NPA and its GNPA ratio still stands at a
highly respectable 0.9% at the end of Q2FY17.

Manappuram Finance Ltd.
6 Edel Invest Research
IV. Manappuram’s strategy of synergistic non-Gold Loan products well thought out
Manappuram’s strategy of growing synergistic non-Gold Loan products like Microfinance, Housing Finance
and CV Finance is well thought out, as such products can be sold to clients that are similar (from a location
and profile perspective) to the Gold Loan clients. This is particularly helpful since significant incremental
branch expansion will not be required to disburse these synergistic loan products.
The existing branch network of Manappuram has deep rural reach and therefore can cater to potential
clients of the alternate lending areas mentioned above. Microfinance falls into this category, as rural regions
remain an under-penetrated and natural target. The urban branches of Manappuram are also capable of
driving synergy given the fact that lower-income groups in urban areas are also target customers for micro
finance. While the final micro finance disbursement may ultimately be delivered at the doorstep, but
proximity to branch and personnel will make a key difference.
Small-ticket Housing Loans (primarily to self employed category) and Used CV Finance are attractive sub-
segments that can be expanded through the rural and semi-urban network of Manappuram whereas the
urban network can be used to push other sub-categories.
As of Q2FY17, the company’s Non-gold Loan businesses comprised 15% of group AUM, of which 11% is
contributed to by Microfinance and 1.5% each by Housing Finance and CV Finance. A further 0.3% is LAP and
the remaining 0.4% is other loans. Manappuram plans to take the contribution of the Non-gold Loan book to
25% of group AUM by FY18.
AUM per branch of Asirvad Microfinance vis-à-vis key listed MFIs as of Q2FY17-end
Source: Company data
Asirvad Microfinance a highly under-utilised play from operating leverage perspective
In February 2015, Manappuram Finance acquired a 85% stake in Asirvad Microfinance and subsequently
increased this stake to 90.4%. As on date, Asirvad has 704 branches and given 343 branches as of FY16, we
estimate 572 branches at the end of Q2FY17. Consequently, Asirvad’s AUM per branch stands at INR 2.7 cr,
far lower than the key listed peers. This is an indicator of the degree to which Asirvad remains under-utilised
from an operating leverage perspective when compared to its peers.
Since Manappuram has a network of 3,293 branches, we calculate Asirvad’s AUM per branch if it were to
sweat all Manappuram branches for disbursing micro finance. We note that the AUM per branch in this case
would be 0.48 (shown as Asirvad+ in the chart above), indicating that the under-utilisation is potentially huge
following the amalgamation of Asirvad with Manappuram.
0.48
2.7
6.1 6.7
11.9
13.8
0.0
2.0
4.0
6.0
8.0
10.0
12.0
14.0
16.0
Asirvad+ Asirvad Satin Credit Bharat Financial Equitas Ujjivan
(IN
R c
r)

Manappuram Finance Ltd.
7 Edel Invest Research
Asirvad a best-in-class Microfinace institution despite operating leverage issues Comparision of Asirvad metrics with key listed NBFC-MFIs
Bharat
Financial Satin Credit
Ujjivan Equitas Asirvad
Gross Loan Portfolio (Q2FY17) - INR cr 9046 4181 6486 7079 1571
Branches (Q2FY17)** 1359 681 469 596 572
Avg MFI Ticket Size* (INR) 21400 26000 22550 22166 20000
NIM (FY16) 11.3% 9.9% 12.3% 11.4% 9.5%
GNPA Ratio (Q2FY17) 0.10% 0.24% 0.17% 2.54% 0.17%
NNPA Ratio (Q2FY17) 0.04% 0.12% 0.04% 1.17% 0.07%
Cost to Income Ratio (FY16) 48% 59% 51% 53% 48%
RoA (FY16) 4.2% 2.2% 3.7% 3.1% 4.0%
RoE (FY16) 25% 22% 18% 13% 23%
Source: Company data, Edel Invest Research; *BHAF ticket size is for 1-year product; **Asirvad branches is an estimate
Asirvad Microfinance’s FY16 C/I Ratio of 48% and RoA of 4% is comparable with that of market leader Bharat
Financial Inclusion. Furthermore, like Bharat Financial and Satin Creditcare, it is not a recipient of any
category of banking licence whereas 8 out of 10 Small Finance Bank licencees and 1 of 2 Universal Bank
licencees (Bandhan Bank) were given to NBFC-MFIs. The bank licence recipients have scaled back growth
targets given the significant costs involved in building the banking franchise, reducing the competitive
intensity for the non-licensees to operate.
We note that cash availability (especially in the hinterland) will be a near-term impediment for the MFI
industry, as the disbursements are typically made in cash. However, we consider this a postponement of
economic activity that will return to normalcy once the withdrawal limits are removed and cash availability
increases in all areas. Further, we think the manifestation of political risk in Maharashtra and Uttar Pradesh
will not snowball into a systemic Andhra Pradesh-like crisis (circa 2010).

Manappuram Finance Ltd.
8 Edel Invest Research
V. Manappuram’s product strategy not yield-dilutive like Muthoot’s
We compare the key features of the gold loan product of Manappuram Finance with that of Muthoot
Finance and note that, while there are significant similarities between the two, Manappuram has not felt the
need to offer customer incentives to the extent Muthoot has. This is positive for Manappuram since it has
not adopted an yield-diutive approach in the manner Muthoot has
Comparison of product offerings – Muthoot vs Manappuram
Muthoot Finance Manappuram Finance
Minimum Interest Rate 14% 15%
Rebate on regular interest payment 2% 0.75%
Dedicated relationship manager Yes No
Security per branch 2 guards 2 guards
Maximum LTV 75% 75%
Part release allowed Yes Yes
Gold evaluation In-house In-house
Online payment Yes Yes
Insurance of Gold collateral Yes Yes
Service timings 9:30 am to 6 pm,
6 days a week 9:30 am to 6 pm,
6 days a week
Documentation Photo ID proof, Address proof Photo ID proof, Address proof
Loyalty program Yes No
Maximum loan period 12 months 3 months
Source: Company data
We note 5 key differences in the product offering of Manappuram Finance and Muthoot Finance. The two
differences of lesser significance are (1) Manappuram has refrained from having a dedicated relationship
manager like Muthoot (2) Manappuram has not felt the need to have a customer loyalty program like
Muthoot. The three differences of greater significance were (1) Maximum loan period of 3 months from
Manappuram compared with 12 months from Muthoot (2) Minimum interest rate from Manappuram
Finance is 15% for a maximum loan amount of INR 50,000 whereas Muthoot Finance offers a minimum
interest rate of 14% for a maximum loan amount of INR 1 lac. This is symtomatic of generally higher interest
rates for loan products from the Manappuram Finance stable when an apple-to-apple comparison is made
with Muthoot Finance loans. (3) Rebate of 0.75% of final annual interest charged (in the form of
reimbursement at the end of loan period) from Manappuram compared with 0.75% from Muthoot.
We stress that the difference in product offerings between Manappuram and Muthoot are symptomatic of
the latter’s eagerness, as a lending entity, to incrementally incentivize potential customers over and above
what competition (primarily Manappuram Finance) has to offer. Manappuram is currently not participating
in this ‘incentive battle’ because it has superior operating leverage from an AUM per branch perspective.
The lack of these incentives on the part of Manappuram are essentially indicative of the company not
requiring such an approach to deliver AUM growth, which the company would achieve without diluting yield.
Manappuram Finance Ltd.
9 Edel Invest Research
VI. Brand strategy: Manappuram may narrow the gap with Muthoot’s brand
Brand strategy is a key component of the overall business strategy for Gold Loan NBFCs. One aspect of
branding and advertisiing has been to change the attitude of potential clients towards gold loans themselves
such that they no longer regard it as taboo. Another aspect that goes hand in hand with this goal is to
popularize the respective company brands. To achieve these goals, Gold Loan NBFCs have used strategic
celebrity endorsements. We compare the celebrity endorsement strategies of Manappuram Finance with
Muthoot Finance and glean the following key takeaways: (1) The Muthoot Finance brand is currently the
more established brand but this gap may narrow going forward (2) Both Muthoot and Manappuram indulged
in advertising blitzes in FY10-12 focused on their respective strategies and now, largely carry out
‘maintenance advertising’ (3) Manappuram’s celebrity endorsers have a movie acting background and have
pan-Indian appeal and stable brand value (4) Muthoot’s celebrity endorsers are sportsmen that, starting out,
appeal to a North Indian audience (this may have been deliberate) (5) While Muthoot Finance’s celebrity
endorsements and other branding efforts have created good brand recall, certain event risks have fructified
contrary to what would be dersirable from their perspective.
Manappuram likely to narrow the gap with Muthoot’s brand
The customer count for Manappuram is at 19.32 lac as of FY16-end. As per Muthoot Finance’s FY16 Annual
Report, they service a higher 60 lac customers across their pan-Indian branch network. This difference
earmarks Muthoot Finance, in a sense, as the more established gold loan brand currently.
As per ‘The Brand Trust Report, India Study 2016’ conducted by TRA Research, Muthoot Finance has been
ranked India’s Most Trusted Finance-Diversified Brand. However, we think that the gap between
Manappuram and Muthoot will narrow as, among other reasons, Manappuram continues to execute its
lower-risk branding strategy with pan-Indian appeal and Muthoot’s branding strategy met with event risk
and is currently bereft of any key branding association of equivalent impact.
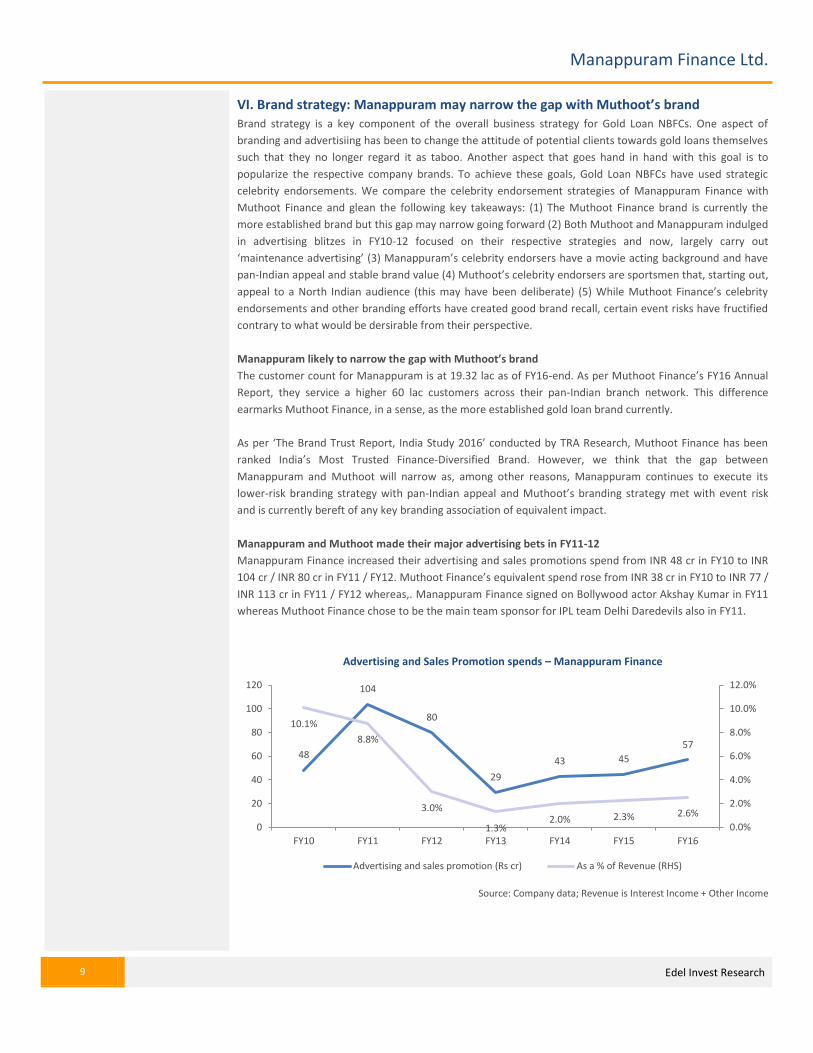
Manappuram and Muthoot made their major advertising bets in FY11-12
Manappuram Finance increased their advertising and sales promotions spend from INR 48 cr in FY10 to INR
104 cr / INR 80 cr in FY11 / FY12. Muthoot Finance’s equivalent spend rose from INR 38 cr in FY10 to INR 77 /
INR 113 cr in FY11 / FY12 whereas,. Manappuram Finance signed on Bollywood actor Akshay Kumar in FY11
whereas Muthoot Finance chose to be the main team sponsor for IPL team Delhi Daredevils also in FY11.
Advertising and Sales Promotion spends – Manappuram Finance
Source: Company data; Revenue is Interest Income + Other Income
48
104
80
29
43 45
57
10.1%
8.8%
3.0%
1.3% 2.0% 2.3% 2.6%
0.0%
2.0%
4.0%
6.0%
8.0%
10.0%
12.0%
0
20
40
60
80
100
120
FY10 FY11 FY12 FY13 FY14 FY15 FY16
Advertising and sales promotion (Rs cr) As a % of Revenue (RHS)

Manappuram Finance Ltd.
10 Edel Invest Research
Advertising and Sales Promotion spends – Muthoot Finance
Source: Company data; Revenue is Interest Income + Other Income
Manappuram’s celebrity endorsement strategy – Greater consistency, Pan-Indian
We looked at the celebrity endorsers of Manappuram Finance and conclude that their choice set provides
greater stability (free of team performance risk) and a pan-Indian reach.
List of celebrity endorsers – Manappuram Finance
Endorser Facebook Likes
Akshay Kumar 22,242,004
Mohanlal 4,131,287
Venkatesh 1,623,814
Puneeth Rajkumar 181,673
Vikram 87,280
Sachin Khedekar 7,835
Total 28,273,893
Source: Company data, Facebook
38
77
113
91 98
79 77 3.5%
3.3%
2.5%
1.7% 2.0%
1.8% 1.6%
0.0%
0.5%
1.0%
1.5%
2.0%
2.5%
3.0%
3.5%
4.0%
0
20
40
60
80
100
120
FY10 FY11 FY12 FY13 FY14 FY15 FY16
Advertising and sales promotion (Rs cr) As a % of Revenue (RHS)

Manappuram Finance Ltd.
11 Edel Invest Research
Manappuram Finance has chosen a celebrity endorsement strategy in which they have picked established
movie actors, the risk of whose respective brand values diminishing is minimal. Akshay Kumar is ranked No. 2
on the Times Celebex ranking with a November 2016 T-Score of 30. Kumar has previously been ranked No.1
in August 2016 with a T-Score of 24. Times Celebex is a ranking of Bollywood actors on the influence they
exert on Indian audiences and is based on comprehensive data including social media presence e.g.
Facebook Likes.
While Akshay Kumar’s region of influence can be considered to be North India as such and Metro areas,
Manappuram’s other celebrity endorsers weild significan influence over specific regions in India. Mohanlal
has been the pre-eminent actor of Malayali cinema and has been ranked as the most popular Keralite (across
different walks of life) in a poll conducted by CNN-IBN in 2006. Venkatesh is the leading actor of Telugu
cinema and has won 5 Nandi Awards for Best Actor Category, more than any other actor. Nandi Awards are
the highest award for excellance in Telugu cinema granted by the governments of Telengana and Andhra
Pradesh. Puneeth Rajkumar is a leading actor of Kannada cinema. Chiyan Vikram is a prominent actor of
Tamil cinema who has been decorated with a National Award and 7 Filmfare awards (South). Sachin
Khedekar is a well-known actor in Marathi cinema.
On evidence of the array of endorsers lined up by Manappuram Finance, we note that their line-up is one
that provides stability given that each is an established actor in his respective sphere of influence. Secondly,
the line-up taken together addresses the key geographies of operation for gold loan NBFCs exerting an
overall pan-Indian influence.
Muthoot’s celebrity endorsement strategy – Delhi Daredevils does not pay off, ISL a work-in-progress
The thought process behind Muthoot Finance choosing the Delhi Daredevils as their primary endorsement
vehicle could be their understanding that their next phase of incremental expansion would be in North India.
By choosing Delhi Daredevils, not only did Muthoot Finance associate themselves with a leading North Indian
sports team, they also availed a bouquet of Indian cricketers simultaneously. We note that the cricketers
who appeared in the TV advertisement for Muthoot Finance were leading Indian cricketers Virendra Sehwag,
Gautam Gambhir and Dinesh Karthik, two of whom were themselves having a North Indian background
(Sehwag is a Delhi-based cricketer of Haryanvi heritage and Gambhir is a Delhi-based batsman of Punjabi
origin).
It would be particularly complex to numerically assess the impact of the Delhi Daredevils’ association on
Muthoot Finance’s brand recall as it would not straightforward to gauge the extent of impact of Daredevils’
image as team juxtaposed with the impact of the individuals comprising the team. Nevertheless, we can get
a numerical sense of the impact by looking the popularity levels of the various endorsers on Facebook, the
world’s and India’s largest social network platform. There are 19.5 cr Facebook users in India, as of May 2016
as per statista.com and, according to Facebook, it has 6.9 cr DAU (Daily Active Users) as of March 2016,
indicating significant penetration and thereby providiing a statistically significant means of juding the
popularity of an individual / entity. Furthermore, we note that the on-field performance of the specific team
itself, Delhi Daredevils, would be a key determinant of the success of the said endorsement.

Manappuram Finance Ltd.
12 Edel Invest Research
List of celebrity endorsers – Muthoot Finance
Endorser Facebook Likes
Virendra Sehwag 13,027,563
Gautam Gambhir 6,905,392
Dinesh Karthik 87,203
Bhaichung Bhutia 55,212
Total 20,075,370
Delhi Daredevils 3,683,616
Total+ 23,758,986
Source: Company data, Facebook
We note that the Facebook Likes count that have been considered are current (as on 26th
Jan 2016) whereas
the endorsement deals were signed in FY11 but we use this data for comparison and find value in
understanding the respective endorsers’ brand value at an earlier date as well. It is evident from the
Facebook Likes count for Muthoot Finance’s celebrity endorsers that Muthoot’s bet on Delhi Daredevils
could have been potentially very positive. However, in this case, unforseen event risk fructified and Delhi
Daredevils, as a team, started to underperform in the IPL, an aspect that is considered to impact the brand
value of the team and, by extension, the individual players, at least as far as their impact on the company
(Muthoot Finance) is concerned. After finishing 3rd
among 9 team in 2012 edition of the IPL, Delhi Daredevils
were 9th
among 9 teams in 2013. Unsurprisingly, Muthoot Finance decided to discontinue their 3-year
contract prior to the IPL 2014 season. The underperformance of Delhi Daredevils continued subsequently
with the team coming in 8th
among 8 teams in 2014, 7th
among 8 teams in 2015 and 6th
among 8 teams in
2016. This may have continued to impact Muthoot Finance’s quality of brand recall for some time despite
the official disassociation with Delhi Daredevils.
In June 2016, Duff and Phelps, a valuation consulting firm owned by the Carlyle Group, released a report in
which it pointed out that Delhi Daredevils’s brand value in 2016 stood at US$ 34 million, 5th
among 6 teams
evaluated. This value remained static compared with 2015 and was far lower than leading teams Mumbai
Indians (US$ 78 million) and Kolkata Knight Riders (US$ 77 million). One key factor cited by the consultant
that would encourage continued association of sponsors would be consistent successful on-field
performances, something Delhi Daredevils failed to deliver.
In 2014, Muthoot Finance chose to become the official Fair Play Awards sponspor for the Indian Super
League (ISL), a football-based property. By doing so, Muthoot Finance removed ‘team risk’ from their brand
and bet on the sport itself. However, though football has potential for growth in India, it has a long way to go
before being comparable with cricket in terms of popularity. The Indian Super League currently has
3,576,297 Likes on Facebook compared with 18,425,836 Likes for the IPL (Indian Premier League). Duff and
Phelps have also stated, in their aforementioned report, that new leagues ISL and PKL (Pro Kabbadi League)
significantly trail the IPL in terms of generating spectator interest.

Manappuram Finance Ltd.
13 Edel Invest Research
VII. Manappuram a market share winner amid waning competitive intensity
The participants in the Gold Loan industry can be sub-divided into 5 categories. Since FY14, Specialised Gold
Loan NBFCs, i.e. NBFCs whose primary business is Gold Loans are gaining market share at the expense of the
other 4 categories. In FY15, the specialised Gold Loan NBFCs gained 190 bps market share compared to FY14.
Gold Loan industry market share trends from FY07 to FY15
FY2007 FY2012 FY2014 FY2015
Cooperative Banks 18% 6.0% 5.4% 5.3%
Private Sector Banks 16% 15% 16% 15%
Public Sector Banks 46% 36% 45% 44%
Other NBFCs 0.4% 7.0% 5.4% 5.1%
Specialised NBFCs 20% 36% 29% 31%
Source: Company data (Manappuram Finance)
Market share gains to continue in FY16 for specialised Gold Loan NBFCs
While similar data for FY16 and beyond is not available, we have reason to believe that the trend of
Specialised Gold Loan NBFCs gaining market share continues. We examined a set of key Gold Loan players
that accounted for 43% of the 2015 Gold Loan industry AUM and the trends witnessed are significant.
Movement of Gold Loan AUM (INR bn) of key players from FY15 to FY16
FY15 FY16 YOY growth
Muthoot Finance 233 243 4.2%
Manappuram Finance 92 101 9.3%
Muthoot Fincorp 65 68 5.0%
Shriram City Union 30 33 11%
IIFL 38 29 -24%
HDFC Bank 41 45 12%
South Indian Bank 25 14 -45%
Federal Bank 34 23 -31%
City Union Bank 25 20 -18%
Source: Company data
It is clear from the above table that key south-based Private Sector Banks are retreating rapidly from the
Gold Loan business at a time when the Specialised Gold Loan NBFCs are growing their AUM. The curtailed
presence of Banks from the Gold Loan business is therefore structural in nature. This reduces the
competitive intensity for the Specialised Gold Loan NBFCs. Among the Specialised Gold Loan NBFCs,
Manappuram has gained market share at the fastest pace in FY16. This divergence accelerated in H1FY17,
with Manappuram growing 30% YoY compared with 10% for Muthoot.
Apart from HDFC Bank, the Private Sector Banks in our list do not seem to possess the appetite for focusing
and growing their Gold Loan business. The Banks are not inclined to keep the risk associated with the gold
price cycle on their books.

Manappuram Finance Ltd.
14 Edel Invest Research
While PSU Banks, especially as a group, do have an extensive rural network, they lost market share in FY15
even before the NPA mess started to surface. We do not think that the PSU Banks will pose any major threat
from a market share perspective given the pending resolution of the NPA malaise and capital constraints.
Shriram City Union, one of the key non-specialised NBFCs, expanded its Gold Loan AUM in FY16. But, this was
more of an aberration since the NBFC has strategically reduced focus on its Gold Loan business, scaling down
its exposure to the business from 36% in FY12 to 14% in H1FY17. Its Gold Loan book de-grew by 13% in
H1FY17. This is yet another example of an important non-specialised Gold Loan entity withdrawing from the
segment, further reducing the competititve intensity for the imcumbents like Manappuram and Muthoot.
The Gold Loan AUM of IIFL Finance, another key non-specialised Gold Loan NBFC, de-grew by 24% in FY16.
Manappuram winning market share since FY14
Source: Company data, Edel Invest Research
Manappuram has been gaining market share since FY14. To calculate the FY16 market share, we have
conservatively assumed industry size to be INR 1400 bn (INR 1.4 lakh cr) given the significant de-growth for
several key non-specialised players. FY14 and FY15 market shares are based on industry data provided in
Manappuram’s FY16 Annual Report.
6.0%
6.8%
7.2%
FY2014 FY2015 FY2016
Manappuram Finance Ltd.
15 Edel Invest Research
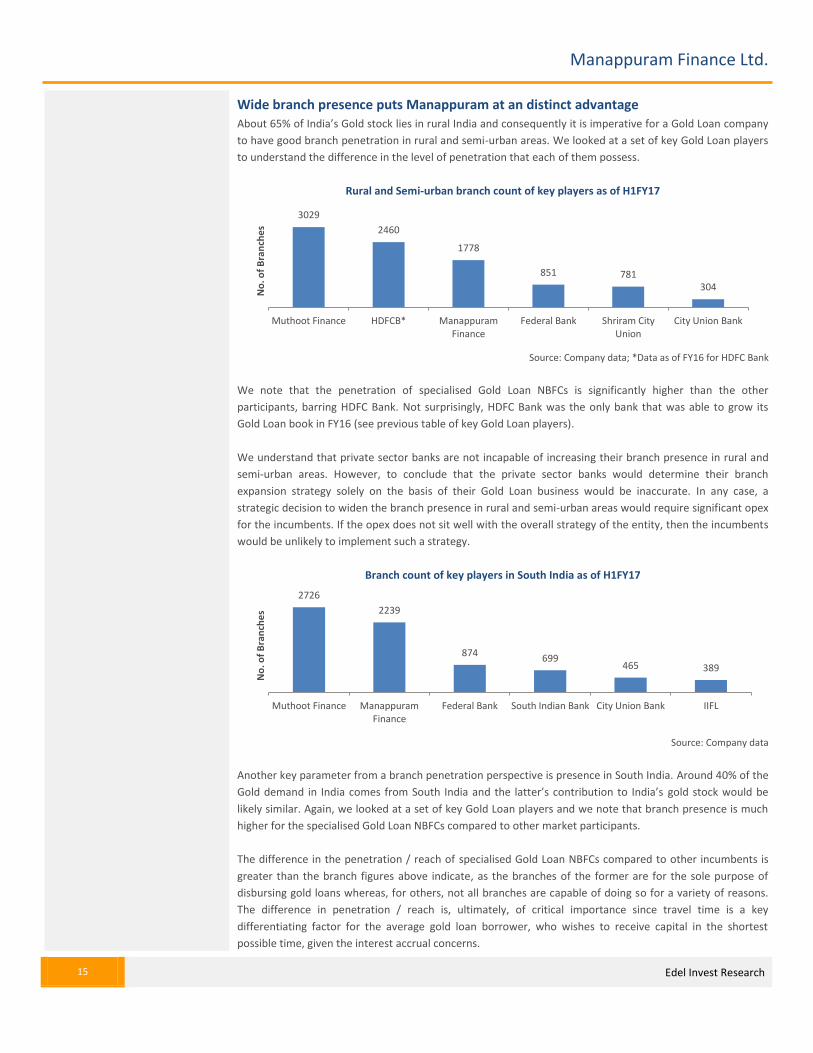
Wide branch presence puts Manappuram at an distinct advantage
About 65% of India’s Gold stock lies in rural India and consequently it is imperative for a Gold Loan company
to have good branch penetration in rural and semi-urban areas. We looked at a set of key Gold Loan players
to understand the difference in the level of penetration that each of them possess.
Rural and Semi-urban branch count of key players as of H1FY17
Source: Company data; *Data as of FY16 for HDFC Bank
We note that the penetration of specialised Gold Loan NBFCs is significantly higher than the other
participants, barring HDFC Bank. Not surprisingly, HDFC Bank was the only bank that was able to grow its
Gold Loan book in FY16 (see previous table of key Gold Loan players).
We understand that private sector banks are not incapable of increasing their branch presence in rural and
semi-urban areas. However, to conclude that the private sector banks would determine their branch
expansion strategy solely on the basis of their Gold Loan business would be inaccurate. In any case, a
strategic decision to widen the branch presence in rural and semi-urban areas would require significant opex
for the incumbents. If the opex does not sit well with the overall strategy of the entity, then the incumbents
would be unlikely to implement such a strategy.
Branch count of key players in South India as of H1FY17
Source: Company data
Another key parameter from a branch penetration perspective is presence in South India. Around 40% of the
Gold demand in India comes from South India and the latter’s contribution to India’s gold stock would be
likely similar. Again, we looked at a set of key Gold Loan players and we note that branch presence is much
higher for the specialised Gold Loan NBFCs compared to other market participants.
The difference in the penetration / reach of specialised Gold Loan NBFCs compared to other incumbents is
greater than the branch figures above indicate, as the branches of the former are for the sole purpose of
disbursing gold loans whereas, for others, not all branches are capable of doing so for a variety of reasons.
The difference in penetration / reach is, ultimately, of critical importance since travel time is a key
differentiating factor for the average gold loan borrower, who wishes to receive capital in the shortest
possible time, given the interest accrual concerns.
3029
2460
1778
851 781 304
Muthoot Finance HDFCB* Manappuram Finance
Federal Bank Shriram City Union
City Union Bank
No
. of
Bra
nch
es
2726
2239
874 699
465 389
Muthoot Finance Manappuram Finance
Federal Bank South Indian Bank City Union Bank IIFL
No
. of
Bra
nch
es

Manappuram Finance Ltd.
16 Edel Invest Research
Factors other than reach also favour NBFCs over Banks
A number of factors other than reach / penetration of specialised Gold Loan NBFCs favour them over Banks
from a customer perspective. Some of these factors include the following:
(1) Repayment terms of NBFCs are far more flexible – single bullet repayment is possible, no EMI
requirement (EMIs include principal repayment), no prepayment penalty, etc.
(2) Documentation requirements are more onerous for Banks as they stress on full KYC compliance whereas
for NBFCs, simple submission of Identity and Address proof copies are sufficient.
(3) Banks tend to offer lower LTV than NBFCs.
(4) Processing charges are higher for Banks whereas they are minimal for NBFCs.
(5) Working hours for Banks are shorter compared with NBFCs.
(6) Turnaround time for NBFCs is in the range of 10-30 min whereas for Banks, it is 1-2 hours.
The aforementioned factors, along with significantly higher reach for specialised Gold Loan NBFCs, ensure
that they remain the preferred source of gold loans for customers, despite lower interest rates from Banks
(c.12-15% compared with c.18-24% for NBFCs). Notably, the typical Gold Loan customer is not interest-rate-
sensitive given that he usually operates a small business of significantly higher RoE than the highest NBFC
interest rate.

Manappuram Finance Ltd.
17 Edel Invest Research
VIII. Shift from unorganised sector an ongoing trend: Manappuram well placed
High interest rates charged by unorganised sector exploitative and unsustainable
While the Moneylenders possess the same advantageous atttributes that the Gold Loan NBFCs possess vis-à-
vis Banks, the only minor real advantage they offer over NBFCs is a slightly higher LTV. On the other hand,
being out of the regulatory ambit, the Moneylenders charge interest rates that are very high even for a
typical Gold Loan customer. Interest rates charged by the Moneylenders are in the range of 36-60% and
remain a fundamental reason for the ongoing shift from the unorganised lenders to organised lending. The
unorganised lenders are said to control c.80% of all outstanding loans against gold and hence the shift is
particularly salutary for the specialised Gold Loan NBFCs.
High Aadhaar coverage to be driver of shift from informal lending
A key reason for the Moneylenders’ significance has been no requirement for identity proof on their part to
disburse a loan against gold. A major reason for this has been the lack of a universal identity proof for the
Indian citizens, particularly in rural India. This has undergone a sea change with the advent of Aadhar, whose
coverage of the Indian population has been particularly path breaking even in the hinterland.
As per the Press Information Bureau of the Government of India, the UIDAI generated the 100th
crore
Aadhaar on April 4, 2016. Importantly, the Aadhaar coverage is now 93% among the Indian adults as on April
4, 2016.
More than 100 crore people have Aadhaar.
73.96 crore (93%) adults in India have Aadhaar.
22.25 crore (67%) Children of age 5-18 years have Aadhaar.
2.30 crore (20%) Children of Age 0 <5 years have Aadhaar.
Every day more than 5-7 lakh people get enrolled for Aadhaar.
Aadhaar is now the largest online digital identity platform in the world.
Demonetisation and shift to “less cash” economy to incrementally hasten shift to formal lending
The Union Government’s step to demonetise high-value currency notes is an unprecedented decision. One
of the key objectives in the long run is to move to a “less cash” economy. Since the unorganised sector
disburses loans against gold exclusively in cash, this long-term objective will effectively eliminate the
unorganised sector.
Firstly, the act of demonetisation itself provides a psychological boost to non-cash transactions and fosters a
move away from cash. Secondly, the creation of an eco system to promote a “less cash” economy is well
underway with the Central Government anncoucing a raft of measures to incentivize digital payments. A
detailed description of these 11 measures is available at
http://pib.nic.in/newsite/PrintRelease.aspx?relid=155137. Thirdly, as per the Union Law and IT Minister,
measures for disincentivizing cash transactions are under consideration, but we think that the Government
will be guarded in the implementation of the latter, given the concerns regarding disruption of economic
activity.
Pradhan Mantri Jan Dhan Yojana another key driver of shift from unorganised to organised
As far as the customers of specialised Gold Loan NBFCs are concerned, both current and potential, active
usage of the formal banking system and the growing acceptance of digital payments will be key. On this
front, the Union Governemnt is ensuring that this shift from unorganised to formal will be managed
effectively via the successful implementation of the Pradhan Mantri Jan Dhan Yojana (PMJDY) to benefit the
organised lenders.

Manappuram Finance Ltd.
18 Edel Invest Research
As per the official PMJDY website, as of January 25, 2017, a total of 27.31 cr Jan Dhan bank accounts have
been opened. As per the wesbite, the salient features of the progress of PMJDY are as follows: -
RURAL accounts opened: 16.54 cr.
URBAN accounts opened: 10.77 cr.
TOTAL accounts opened: 27.31 cr.
Number of RUPAY Cards created: 21.38 cr.
Number of accounts seeded with AADHAAR: 15.98 cr.
Balance in accounts : INR 67,324.98 cr.
% of Zero-Balance Accounts: 24.47%.
The advent of Rupay Cards can be particularly beneficial for the rural users in embracing digital payments
given that their transaction costs are far lower than their private sector counterparts. The National Payments
Corporation of India, a government organisation at the forefront of the digital payments revolution in India,
states on its website that since transaction processing will happen domestically, it would lead to lower cost
of clearing and settling each transaction. According to The Hindu, citing NPCI officials, the cost of Rupay
cards is about a third of foreign payment systems.
Manappuram well placed to manage transition to a “less cash” economy
Manappuram already disburses 50% of loans through non-cash means (primarily cheque). Disbursals above
INR 1 lakh are done through cheque as a policy. Even during the recent cash crunch phase following
demonetisation, the potential to increase non-cash disbursements was significant since 70% of
Manappuram’s customers possess bank accounts, most of whom are likely to be active accounts, given their
customer profile.
Further, Manappuram has been actively promoting the concept of online gold loans, which requires only a
one-time visit to the branch for handing over of gold collateral. As of Q2FY17, online gold loans account for
5.4% of Manappuram’s gold collateral.
As the Indian economy gradually transforms into a “less cash” economy in a gradual non-disruptive manner,
Manappuram stands ready to manage this transition, whereas the unorganised sector could go out of
business if they do not embrace the change.

Manappuram Finance Ltd.
19 Edel Invest Research
IX. Generic opportunity for Gold Loan segment is still very large
Penetration of organised gold loan market is still very low
As per the World Gold Council, the Indian households possess c.20,000 tonnes of gold. According to
Manppuram, citing an empaneled independent consultant, the penetration of the organised Gold Loan
industry is 3.8% as of FY15.
Organised Gold Loan market – Historical size and penetration trend
Source: Company data (Manappuram Finance)
Given the low penetration levels, the generic opportunity for the organised gold loan players is still very
large.
Attitudinal change of Indian households towards family gold to be a key growth driver
In a FICCI study on gold commissioned by the World Gold Council in December 2014, gold was the second
choice (after bank deposits) of most respondents as the asset they would most liekly liquidate during a major
financial crisis. This is symbolic of the attitudinal change that Indian households are undergoing towards their
family gold.
Earlier, borrowing against gold was widely considered as a taboo but this view is on the decline and is set to
provide incremental supply for gold loans. Further, respondents in the FICCI study also stated that large
items of gold jewellery would be liquidated first, as they are considered ancestral jewellery to be preserved
as antique possession and are not used extensively.
It is worth mentioning that the reduction in the sentimental value of family gold also increases, ceteris
paribus the probability of default by a gold loan borrower. However, the probability of default has
dramatically reduced through product modification (discussed elsewhere in this report).
1.1% 1.5%
2.0%
2.9%
3.6% 4.0% 3.9% 3.8%
0
200
400
600
800
1000
1200
1400
1600
0.0%
0.5%
1.0%
1.5%
2.0%
2.5%
3.0%
3.5%
4.0%
4.5%
FY2007 FY2009 FY2010 FY2011 FY2012 FY2013 FY2014 FY2015
(IN
R b
n)
AUM (Rs bn) - RHS Penetration
Manappuram Finance Ltd.
20 Edel Invest Research
X. Global Gold prices: Positive long-term outlook
Recent ‘risk-love’ phase in the US not a long-term concern
The Manappuram management’s expectation of global gold price trend for FY17 is a range of 1200-1400 USD
per troy ounce. This expectation has largely held good till recently, when Donald Trump swept to victory in
the US Presidential election. Intriguingly, the generally held view prior to the US election result was that
Democratic candidate Hillary Clinton was the ‘status quo’ candidate whereas Trump was a harbinger of
uncertainty and hence a victory for the latter would be positive for gold. However, on the results day, Trump
struck a soft and concilatory note in his victory speech, which shifted focus to his expansionary economic
policies. This was perceived to be a positive for the US economy and consequentlypromoted a ‘risk-on’
sentiment, which was negative for gold prices.
However, we think that even if the ‘risk-on sentiment were to persist, gold prices would not continue the
downward trajectory. We stress that, over the longer term, gold has its own independent price cycle that is
fundamentally linked only to liquidity. The 2003-2007 global equity bull market was a secular ‘risk-on’ phase,
but gold prices rose in tandem with equities during this extended time period on the back of positive liqudity
flows.
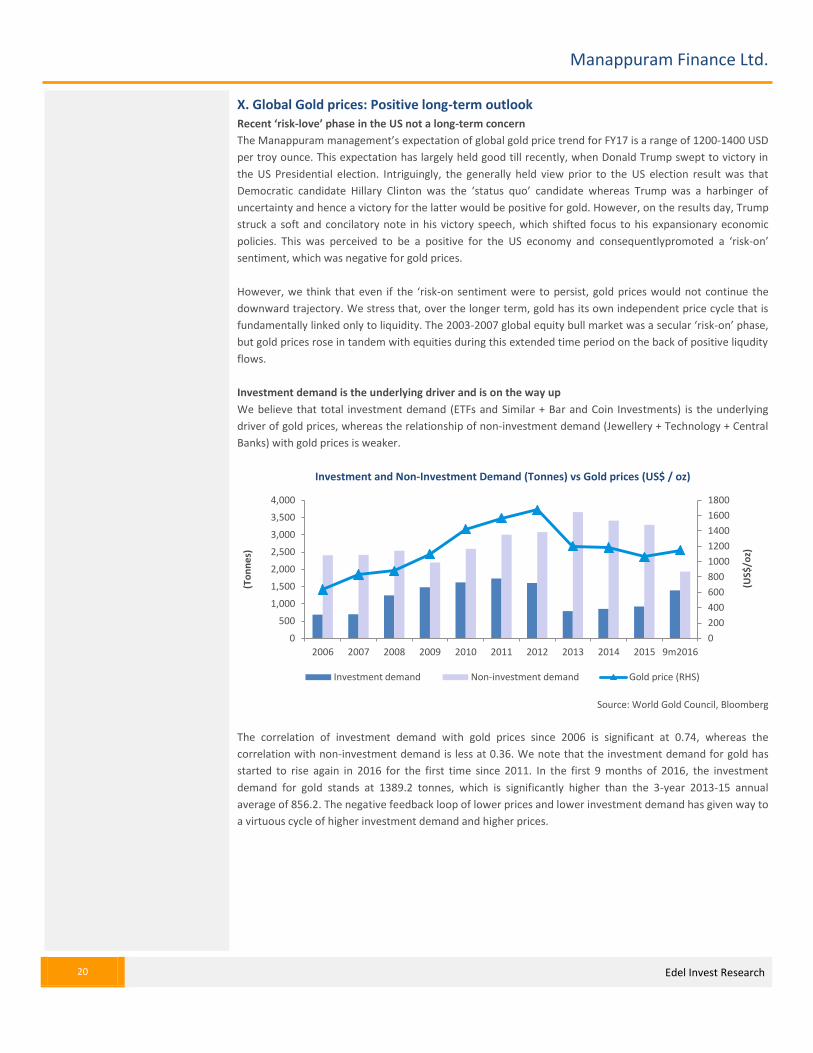
Investment demand is the underlying driver and is on the way up
We believe that total investment demand (ETFs and Similar + Bar and Coin Investments) is the underlying
driver of gold prices, whereas the relationship of non-investment demand (Jewellery + Technology + Central
Banks) with gold prices is weaker.
Investment and Non-Investment Demand (Tonnes) vs Gold prices (US$ / oz)
Source: World Gold Council, Bloomberg
The correlation of investment demand with gold prices since 2006 is significant at 0.74, whereas the
correlation with non-investment demand is less at 0.36. We note that the investment demand for gold has
started to rise again in 2016 for the first time since 2011. In the first 9 months of 2016, the investment
demand for gold stands at 1389.2 tonnes, which is significantly higher than the 3-year 2013-15 annual
average of 856.2. The negative feedback loop of lower prices and lower investment demand has given way to
a virtuous cycle of higher investment demand and higher prices.
0
200
400
600
800
1000
1200
1400
1600
1800
0
500
1,000
1,500
2,000
2,500
3,000
3,500
4,000
2006 2007 2008 2009 2010 2011 2012 2013 2014 2015 9m2016
(US$
/oz)
(To
nn
es)
Investment demand Non-investment demand Gold price (RHS)

Manappuram Finance Ltd.
21 Edel Invest Research
Long-term liqudity flows into gold will be robust
The US Federal Reserve has greatly expanded its balance sheet since 2008. While this incremental liquidity
found its way into gold till 2011, the 2011-2015 phase saw a tapering of investment demand for gold, leading
to lower prices, although non-investment demand was generally more robust in the 2011-2015 phase.
Investment demand for gold has returned in 2016, as a fresh price cycle on the back of positive feedback
loop for gold has begun. The underlying availability of liquidity for gold remains strong, as the balance sheet
of the Fed remains well expanded even at the current juncture.
Balance Sheet (US$ million) of the US Federal Reserve
Source: US Federal Reserve
Given the wide divergence of gold prices and the size of the Fed balance sheet, gold prices are historically
cheap in relation to the size of the Fed balance sheet, and scope of price appreciation is particularly
significant over the long term.
While the Fed has increased its balance sheet size to USD 4.45 trillion as of January 4, 2017, competitive
currency debasement has led the Bank of Japan (BOJ) to raise its balance sheet size to 456.8 trillion Yen as of
September 2016, as per official BOJ data. The same holds true for the European Central Bank (ECB), which
has raised its balance sheet size to 2.78 trillion Euro as of December 2015, and their extensive bond buying
program still continues. Hence, not only the US Fed but the BOJ and ECB have added enormous amounts of
capital to the global liqudity reservoir.
Incremental investment demand for gold can also come from asset allocation change in favour of the yellow
metal among the global asset management industry, whose AUM stood at USD 71.4 trillion at the end of
2015. Such asset allocation change can have a significant impact on gold prices, given that ETF and similar
fund products would have to be backed by gold, whose supply is finite.
0
700000
1400000
2100000
2800000
3500000
4200000
4900000
4-J
an-0
7
4-J
un
-07
4-N
ov-
07
4-A
pr-
08
4-S
ep-0
8
4-F
eb-0
9
4-J
ul-
09
4-D
ec-0
9
4-M
ay-1
0
4-O
ct-1
0
4-M
ar-1
1
4-A
ug-
11
4-J
an-1
2
4-J
un
-12
4-N
ov-
12
4-A
pr-
13
4-S
ep-1
3
4-F
eb-1
4
4-J
ul-
14
4-D
ec-1
4
4-M
ay-1
5
4-O
ct-1
5
4-M
ar-1
6
4-A
ug-
16
4-J
an-1
7
(US$
mn
)

Manappuram Finance Ltd.
22 Edel Invest Research
Indian Gold prices: INR depreciation vis-à-vis USD provides incremental backstop
India’s structual Current Account Deficit a causative agent for INR depreciation
While Indian gold prices are largely related to global gold prices, there is an exchange rate overlay, as global
gold is denominated in USD. Because of this, the structural depreciation of the INR against the USD provides
positive support to Indian gold prices.
India’s Current Account Deficit (CAD) is strutural in nature and has been a driver of the INR’s depreciation
against the USD over the years. While a wildly successful ‘Make in India’ initiative can drastically cut India’s
import dependance, this is not our base case since the western engineering industry will be cautious in their
approach and technology transfer may only be piecemeal in nature.
India’s Current Account Deficit (CAD) and USD/INR historical trend
Source: RBI, Bloomberg
Covered interest rate parity also dictates depreciation of INR against the USD over the long term
As per the covered interest rate parity formula, the INR will depreciate against the USD as long as the 10-
year bond yield in India remains higher compared to the US 10-year treasury bond yield. This is a
manifestation of the No-Arbitrage Principle playing out in the global financial markets. If equity returns are
also considered while calculating a blended yield for the INR as well the USD, then the predicted depreciation
would, on balance, be faster.
Comparision of 10-year Bond Yields for India and US
Source: Bloomberg
0.0
10.0
20.0
30.0
40.0
50.0
60.0
70.0
-6.0%
-5.0%
-4.0%
-3.0%
-2.0%
-1.0%
0.0%
1.0%
2.0%
3.0%
FY0
1
FY0
2
FY0
3
FY0
4
FY0
5
FY0
6
FY0
7
FY0
8
FY0
9
FY1
0
FY1
1
FY1
2
FY1
3
FY1
4
FY1
5
FY1
6
(USD
/ IN
R)
CAD as % of GDP USD INR (RHS)
0.0%
2.0%
4.0%
6.0%
8.0%
10.0%
12.0%
Dec
-00
Jul-
01
Feb
-02
Sep
-02
Ap
r-0
3
No
v-0
3
Jun
-04
Jan
-05
Au
g-0
5
Mar
-06
Oct
-06
May
-07
Dec
-07
Jul-
08
Feb
-09
Sep
-09
Ap
r-1
0
No
v-1
0
Jun
-11
Jan
-12
Au
g-1
2
Mar
-13
Oct
-13
May
-14
Dec
-14
Jul-
15
Feb
-16
Sep
-16
India US

Manappuram Finance Ltd.
23 Edel Invest Research
Key financial indicators
FY15 FY16 FY17E FY18E FY19E
Net Interest Income 1103 1329 1959 2382 2807
Other Income 5.2 4.4 4.7 4.9 5.2
Total Income 1108 1334 1964 2387 2812
Operating Expenses 669 782 834 924 1025
Pre-Provisioning Operating Profit 440 551 1130 1463 1787
Provisions 27 32 59 56 67
Profit Before Tax 412 519 1071 1407 1720
Profit After Tax 271 337 697 985 1204
Basic EPS 3.2 4.0 8.3 11.7 14.3
P/E 28.5 22.9 11.1 7.8 6.4
Book value per share 31 33 40 52 66
P/B 2.9 2.8 2.3 1.8 1.4
Credit Costs 0.3% 0.3% 0.5% 0.4% 0.4%
GNPA Ratio 1.2% 1.0% 1.2% 1.1% 1.0%
NNPA Ratio 1.0% 0.7% 0.9% 0.8% 0.7%
C/I Ratio 60.3% 58.7% 42.5% 38.7% 36.5%
Yield on Average IEA 22.2% 21.9% 24.9% 25.0% 25.0%
Cost of Average Borrowings 12.9% 12.0% 11.5% 11.5% 12.0%
Net Interest Margin 12.4% 13.1% 16.5% 16.5% 16.2%
Return on Average Assets 2.4% 2.9% 5.3% 6.3% 6.4%
Return on Average Equity 10.6% 12.6% 22.8% 25.4% 24.2%
Source: Company data, Edel Invest Research

Manappuram Finance Ltd.
24 Edel Invest Research
Valuation We have used a Residual Income Valuation Model to value Manappuram. We assume a long-term risk-free
rate of 7% for India, a Beta of 1.3 for Manappuram and an India Equity Risk Premium of 6% to arrive at an
overall Cost of Equity of 14.8%. We arrive at a Price Target of INR 118 for Manappuram at which the stock
trades at 2.2x FY18E book value.
Valuation metrics
FY15 FY16 FY17E FY18E FY19E
Basic EPS 3.2 4.0 8.3 11.7 14.3
EPS growth 20% 25% 107% 41% 22%
P/E 28.5 22.9 11.1 7.8 6.4
Book value per share 31 33 40 52 66
P/B 2.9 2.8 2.3 1.8 1.4
Return on Average Equity 10.6% 12.6% 22.8% 25.4% 24.2%
Source: Company data, Edel Invest Research
At CMP, Manappuram trades at a P/B of 1.8x FY18E book, which we think is cheap given the FY17E-19E RoE
of 22.8%-25.4%. Consequently, we think the multiple of 2.2x implied by our Price Target of INR 118 is
reasonable.
The stock trades at a P/E of 7.8x FY18E EPS for FY17E-19E EPS CAGR of 31%, and hence conclude that
Manappuram to be cheap from a P/E basis too.
The stock’s only listed peer Muthoot Finance currently trades at a P/B of 2.0x FY18E consensus book value
for a FY17E-19E consensus RoE of 18.1%-20.4%. Muthoot trades at a P/E of 11.8x FY18E consensus EPS for
FY17E-19E EPS CAGR of 20%. Therefore, we find that Manappuram is trading at a cheaper valuation
compared with Muthoot.

Manappuram Finance Ltd.
25 Edel Invest Research
Income statement (INR cr)
Year to March FY15 FY16 FY17E FY18E FY19E
Interest income 1,976 2,213 2,965 3,598 4,330
Interest charges 872 884 1,006 1,216 1,523
Net interest income 1,103 1,329 1,959 2,382 2,807
Other income 5 4 5 5 5
Net revenues 1,108 1,334 1,964 2,387 2,812
Operating expense 669 782 834 924 1,025
- Employee exp 311 399 439 483 531
- Depreciation / amortisation 54 53 57 63 69
- Other opex 304 330 337 378 425
Preprovis ion op. profi t 440 551 1,130 1,463 1,787
Provis ions 27 32 59 56 67
PBT 412 519 1,071 1,407 1,720
Taxes 142 182 374 422 516
PAT 271 337 697 985 1,204
Extraordinaries 0 0 0 0 0
Reported PAT 271 337 697 985 1,204
Bas ic number of shares (cr.) 84 84 84 84 84
Bas ic EPS (INR) 3.22 4.01 8.28 11.71 14.31
Di luted number of shares (cr.) 84 84 84 84 84
Di luted EPS (INR) 3.22 4.01 8.28 11.71 14.31
Growth Ratios
Year to March FY15 FY16 FY17E FY18E FY19E
NII growth 3% 20% 47% 22% 18%
Net Revenues growth 2% 20% 47% 22% 18%
Opex growth -4% 17% 7% 11% 11%
PPOP growth 13% 25% 105% 29% 22%
Provis ions growth -41% 18% 80% -5% 20%
PAT growth 20% 25% 107% 41% 22%
Operating Ratios
Year to March FY15 FY16 FY17E FY18E FY19E
Yield on IEA 22.2% 21.9% 24.9% 25.0% 25.0%
Cost of Funds 12.9% 12.0% 11.5% 11.5% 12.0%
Spread 9.3% 9.9% 13.4% 13.5% 13.0%
Net Interest Margin 12.4% 13.1% 16.5% 16.5% 16.2%
Cost to Income Ratio 60% 59% 42% 39% 36%
Tax Rate 34% 35% 35% 30% 30%
Financials

Manappuram Finance Ltd.
26 Edel Invest Research
Balance sheet (INR cr)
As on 31st March FY15 FY16 FY17E FY18E FY19E
Share capita l 168 168 168 168 168
Reserves and surplus 2,459 2,569 3,215 4,200 5,404
Shareholders’ funds 2,627 2,737 3,383 4,368 5,573
Long-term borrowings 1,550 1,115 1,561 1,873 2,248
Other long term l iabi l i ties 109 124 124 130 136
Non-current liabilities 1,660 1,239 1,685 2,003 2,385
Short-term borrowings 5,300 6,767 8,053 9,664 11,596
Trade Payables 24 23 26 27 28
Other current l iabi l i ties 1,673 1,078 1,065 959 829
Short-term provis ions 48 67 87 91 96
Current liabilities 7,045 7,935 9,231 10,741 12,550
TOTAL EQUITY AND LIABILITIES 11,332 11,911 14,299 17,112 20,507
Fixed assets 172 190 209 230 253
Non-current investments 168 324 436 567 737
Deferred tax assets (net) 30 39 59 76 99
Long-term loans and advances 86 210 378 454 544
Other non current assets 131 98 98 103 108
Non-current assets 587 861 1,180 1,429 1,741
Current investments 212 0 0 0 0
Cash and bank balances 682 492 492 517 542
Short-term loans and advances 9,255 10,179 12,249 14,699 17,638
Other current assets 596 379 379 468 585
Current assets 10,746 11,050 13,120 15,683 18,766
TOTAL ASSETS 11,332 11,911 14,299 17,112 20,507
RoE Decomposition
Year to March FY15 FY16 FY17E FY18E FY19E
Net Interest Income / Assets 9.7% 11.2% 13.7% 13.9% 13.7%
Other Income / Assets 0.05% 0.04% 0.03% 0.03% 0.03%
Net Revenues / Assets 9.8% 11.2% 13.7% 13.9% 13.7%
Operating Expense / Assets 5.9% 6.6% 5.8% 5.4% 5.0%
Provis ions / Assets 0.2% 0.3% 0.4% 0.3% 0.3%
Taxes / Assets 1.3% 1.5% 2.6% 2.5% 2.5%
Total Costs / Assets 7.4% 8.4% 8.9% 8.2% 7.8%
Return on Assets 2.4% 2.8% 4.9% 5.8% 5.9%
Assets / Equity 4.4 4.2 3.9 3.7 3.4
Return on Equity 10.4% 12.0% 19.1% 21.2% 20.2%
Valuation Metrics
Year to March FY15 FY16 FY17E FY18E FY19E
Bas ic EPS 3.2 4.0 8.3 11.7 14.3
EPS growth 20% 25% 107% 41% 22%
Book va lue per share 31.2 32.5 40.2 51.9 66.2
Bas ic P/E 28.5 22.9 11.1 7.8 6.4
Price - to - Book 2.9 2.8 2.3 1.8 1.4

27 Edel Invest Research
Edelweiss Broking Limited, 1st Floor, Tower 3, Wing B, Kohinoor City Mall, Kohinoor City, Kirol Road, Kurla(W)
Board: (91-22) 4272 2200
Vinay Khattar
Head Research
Rating Expected to
Buy appreciate more than 15% over a 12-month period
Hold appreciate between 5-15% over a 12-month period
Reduce Return below 5% over a 12-month period
0
20
40
60
80
100
120
Jan
-12
Mar
-12
May
-12
Jul-
12
Sep
-12
No
v-1
2
Jan
-13
Mar
-13
May
-13
Jul-
13
Sep
-13
No
v-1
3
Jan
-14
Mar
-14
May
-14
Jul-
14
Sep
-14
No
v-1
4
Jan
-15
Mar
-15
May
-15
Jul-
15
Sep
-15
No
v-1
5
Jan
-16
Mar
-16
May
-16
Jul-
16
Sep
-16
No
v-1
6
Manappuram 5 years price chart

Disclaimer
28 Edel Invest Research
Edelweiss Broking Limited (“EBL” or “Research Entity”) is regulated by the Securities and Exchange Board of India (“SEBI”) and is licensed to carry on the business of broking, depository services and related activities. The business of EBL and its
Associates (list available on www.edelweissfin.com) are organized around five broad business groups – Credit including Housing and SME Finance, Commodities, Financial Markets, Asset Management and Life Insurance.
Broking services offered by Edelweiss Broking Limited under SEBI Registration No.: INZ000005231; Name of the Compliance Officer: Mr. Dhirendra Rautela, Email ID: [email protected] Corporate Office: Edelweiss House,
Off CST Road, Kalina, Mumbai - 400098; Tel. (022) 4009 4400/ 4088 5757/4088 6278
This Report has been prepared by Edelweiss Broking Limited in the capacity of a Research Analyst having SEBI Registration No.INH000000172 and distributed as per SEBI (Research Analysts) Regulations 2014. This report does not constitute an
offer or solicitation for the purchase or sale of any financial instrument or as an official confirmation of any transaction. The information contained herein is from publicly available data or other sources believed to be reliable. This report is
provided for assistance only and is not intended to be and must not alone be taken as the basis for an investment decision. The user assumes the entire risk of any use made of this information. Each recipient of this report should make such
investigation as it deems necessary to arrive at an independent evaluation of an investment in the securities of companies referred to in this document (including the merits and risks involved), and should consult his own advisors to determine
the merits and risks of such investment. The investment discussed or views expressed may not be suitable for all investors.
This information is strictly confidential and is being furnished to you solely for your information. This information should not be reproduced or redistributed or passed on directly or indirectly in any form to any other person or published, copied,
in whole or in part, for any purpose. This report is not directed or intended for distribution to, or use by, any person or entity who is a citizen or resident of or located in any locality, state, country or other jurisdiction, where such distribution,
publication, availability or use would be contrary to law, regulation or which would subject EBL and associates / group companies to any registration or licensing requirements within such jurisdiction. The distribution of this report in certain
jurisdictions may be restricted by law, and persons in whose possession this report comes, should observe, any such restrictions. The information given in this report is as of the date of this report and there can be no assurance that future
results or events will be consistent with this information. This information is subject to change without any prior notice. EBL reserves the right to make modifications and alterations to this statement as may be required from time to time. EBL or
any of its associates / group companies shall not be in any way responsible for any loss or damage that may arise to any person from any inadvertent error in the information contained in this report. EBL is committed to providing independent
and transparent recommendation to its clients. Neither EBL nor any of its associates, group companies, directors, employees, agents or representatives shall be liable for any damages whether direct, indirect, special or consequential including
loss of revenue or lost profits that may arise from or in connection with the use of the information. Our proprietary trading and investment businesses may make investment decisions that are inconsistent with the recommendations expressed
herein. Past performance is not necessarily a guide to future performance .The disclosures of interest statements incorporated in this report are provided solely to enhance the transparency and should not be treated as endorsement of the
views expressed in the report. The information provided in these reports remains, unless otherwise stated, the copyright of EBL. All layout, design, original artwork, concepts and other Intellectual Properties, remains the property and copyright
of EBL and may not be used in any form or for any purpose whatsoever by any party without the express written permission of the copyright holders.
EBL shall not be liable for any delay or any other interruption which may occur in presenting the data due to any reason including network (Internet) reasons or snags in the system, break down of the system or any other equipment, server
breakdown, maintenance shutdown, breakdown of communication services or inability of the EBL to present the data. In no event shall EBL be liable for any damages, including without limitation direct or indirect, special, incidental, or
consequential damages, losses or expenses arising in connection with the data presented by the EBL through this report.
We offer our research services to clients as well as our prospects. Though this report is disseminated to all the customers simultaneously, not all customers may receive this report at the same time. We will not treat recipients as customers by
virtue of their receiving this report.
EBL and its associates, officer, directors, and employees, research analyst (including relatives) worldwide may: (a) from time to time, have long or short positions in, and buy or sell the securities thereof, of company(ies), mentioned herein or (b)
be engaged in any other transaction involving such securities and earn brokerage or other compensation or act as a market maker in the financial instruments of the subject company/company(ies) discussed herein or act as advisor or
lender/borrower to such company(ies) or have other potential/material conflict of interest with respect to any recommendation and related information and opinions at the time of publication of research report or at the time of public
appearance. EBL may have proprietary long/short position in the above mentioned scrip(s) and therefore should be considered as interested. The views provided herein are general in nature and do not consider risk appetite or investment
objective of any particular investor; readers are requested to take independent professional advice before investing. This should not be construed as invitation or solicitation to do business with EBL.
EBL or its associates may have received compensation from the subject company in the past 12 months. EBL or its associates may have managed or co-managed public offering of securities for the subject company in the past 12 months. EBL or
its associates may have received compensation for investment banking or merchant banking or brokerage services from the subject company in the past 12 months. EBL or its associates may have received any compensation for products or
services other than investment banking or merchant banking or brokerage services from the subject company in the past 12 months. EBL or its associates have not received any compensation or other benefits from the Subject Company or third
party in connection with the research report. Research analyst or his/her relative or EBL’s associates may have financial interest in the subject company. EBL, its associates, research analyst and his/her relative may have other potential/material
conflict of interest with respect to any recommendation and related information and opinions at the time of publication of research report or at the time of public appearance.
Participants in foreign exchange transactions may incur risks arising from several factors, including the following: ( i) exchange rates can be volatile and are subject to large fluctuations; ( ii) the value of currencies may be affected by numerous
market factors, including world and national economic, political and regulatory events, events in equity and debt markets and changes in interest rates; and (iii) currencies may be subject to devaluation or government imposed exchange
controls which could affect the value of the currency. Investors in securities such as ADRs and Currency Derivatives, whose values are affected by the currency of an underlying security, effectively assume currency risk.
Research analyst has served as an officer, director or employee of subject Company: No
EBL has financial interest in the subject companies: No
EBL’s Associates may have actual / beneficial ownership of 1% or more securities of the subject company at the end of the month immediately preceding the date of publication of research report.
Research analyst or his/her relative has actual/beneficial ownership of 1% or more securities of the subject company at the end of the month immediately preceding the date of publication of research report: No
EBL has actual/beneficial ownership of 1% or more securities of the subject company at the end of the month immediately preceding the date of publication of research report: No
Subject company may have been client during twelve months preceding the date of distribution of the research report.
There were no instances of non-compliance by EBL on any matter related to the capital markets, resulting in significant and material disciplinary action during the last three years.
A graph of daily closing prices of the securities is also available at www.nseindia.com
Analyst Certification:
The analyst for this report certifies that all of the views expressed in this report accurately reflect his or her personal views about the subject company or companies and its or their securities, and no part of his or her compensation was, is or will
be, directly or indirectly related to specific recommendations or views expressed in this report.
Additional Disclaimer for U.S. Persons
Edelweiss is not a registered broker – dealer under the U.S. Securities Exchange Act of 1934, as amended (the“1934 act”) and under applicable state laws in the United States. In addition Edelweiss is not a registered investment adviser under
the U.S. Investment Advisers Act of 1940, as amended (the "Advisers Act" and together with the 1934 Act, the "Acts), and under applicable state laws in the United States. Accordingly, in the absence of specific exemption under the Acts, any
brokerage and investment services provided by Edelweiss, including the products and services described herein are not available to or intended for U.S. persons.
This report does not constitute an offer or invitation to purchase or subscribe for any securities or solicitation of any investments or investment services and/or shall not be considered as an advertisement tool. "U.S. Persons" are generally
defined as a natural person, residing in the United States or any entity organized or incorporated under the laws of the United States. US Citizens living abroad may also be deemed "US Persons" under certain rules.
Transactions in securities discussed in this research report should be effected through Edelweiss Financial Services Inc.
Additional Disclaimer for U.K. Persons
The contents of this research report have not been approved by an authorised person within the meaning of the Financial Services and Markets Act 2000 ("FSMA").
In the United Kingdom, this research report is being distributed only to and is directed only at (a) persons who have professional experience in matters relating to investments falling within Article 19(5) of the FSMA (Financial Promotion) Order
2005 (the “Order”); (b) persons falling within Article 49(2)(a) to (d) of the Order (including high net worth companies and unincorporated associations); and (c) any other persons to whom it may otherwise lawfully be communicated (all such
persons together being referred to as “relevant persons”).
This research report must not be acted on or relied on by persons who are not relevant persons. Any investment or investment activity to which this research report relates is available only to relevant persons and will be engaged in only with
relevant persons. Any person who is not a relevant person should not act or rely on this research report or any of its contents. This research report must not be distributed, published, reproduced or disclosed (in whole or in part) by recipients to
any other person.
Additional Disclaimer for Canadian Persons
Edelweiss is not a registered adviser or dealer under applicable Canadian securities laws nor has it obtained an exemption from the adviser and/or dealer registration requirements under such law. Accordingly, any brokerage and investment
services provided by Edelweiss, including the products and services described herein, are not available to or intended for Canadian persons.
This research report and its respective contents do not constitute an offer or invitation to purchase or subscribe for any securities or solicitation of any investments or investment services.
Disclosures under the provisions of SEBI (Research Analysts) Regulations 2014 (Regulations)
Edelweiss Broking Limited ("EBL" or "Research Entity") is regulated by the Securities and Exchange Board of India ("SEBI") and is licensed to carry on the business of broking, depository services and related activities. The business of EBL and its
associates are organized around five broad business groups – Credit including Housing and SME Finance, Commodities, Financial Markets, Asset Management and Life Insurance. There were no instances of non-compliance by EBL on any matter
related to the capital markets, resulting in significant and material disciplinary action during the last three years. This research report has been prepared and distributed by Edelweiss Broking Limited ("Edelweiss") in the capacity of a Research
Analyst as per Regulation 22(1) of SEBI (Research Analysts) Regulations 2014 having SEBI Registration No.INH000000172.