COVERAGE AND QOS MEASUREMENTS NETWORK AUDIT 2017
19
July 11, 2018 COVERAGE AND QOS MEASUREMENTS NETWORK AUDIT – 2017
Transcript of COVERAGE AND QOS MEASUREMENTS NETWORK AUDIT 2017

July 11, 2018
COVERAGE AND QOS MEASUREMENTS
NETWORK AUDIT – 2017

www.cra.gov.qa 1
TABLE OF CONTENTS
1. INTRODUCTION .............................................................................................................. 3
2. COVERAGE AUDIT ......................................................................................................... 3
2.1. Measurement Methodology ...................................................................................................... 3
2.1.1. Coverage ................................................................................................................................. 3
2.1.2. Accessibility ............................................................................................................................. 3
2.1.3. Data Coverage - Available Radio Access Technology ..................................................... 3
2.2. Equipment Used ......................................................................................................................... 3
2.3. Measurement Timeline .............................................................................................................. 4
2.4. Samples ....................................................................................................................................... 4
2.5. Geographical Coverage Plots .................................................................................................. 4
2.6. Accessibility Rate ....................................................................................................................... 8
2.7. Data Coverage - Available Radio Access Technology ......................................................... 8
3. QUALITY OF SERVICE AUDIT ........................................................................................ 9
3.1. Measurement Methodology ...................................................................................................... 9
3.1.1. Voice Service Quality Testing .............................................................................................. 9
3.1.2. Short Message Service ......................................................................................................... 9
3.1.3. Data Service Testing.............................................................................................................. 9
3.2. Equipment Used ......................................................................................................................... 9
3.3. Measurement Timeline .............................................................................................................. 9
3.4. Samples ....................................................................................................................................... 9
3.5. Voice Service ............................................................................................................................ 10
3.5.1. Call Completion Rate ........................................................................................................... 11
3.5.2. Unsuccessful Call Attempt Rate ........................................................................................ 11
3.5.3. Call Setup Time .................................................................................................................... 12

www.cra.gov.qa 2
3.5.4. Voice Quality (MOS) ............................................................................................................ 12
3.6. Short Message Service ........................................................................................................... 13
3.7. Data Services to Operator’s Server ....................................................................................... 14
3.7.1. Average Download Throughput – Maximum .................................................................... 14
3.7.2. Average Download Throughput – Distribution & Cumulative ........................................ 14
3.7.3. Average Upload Throughput – Maximum ......................................................................... 15
3.7.4. Average Upload Throughput – Distribution & Cumulative ............................................. 15
3.7.5. Webpage Download Success Rate ................................................................................... 16
3.8. Data Services to International Server ................................................................................... 17
3.8.1. Average Download Throughput – Distribution & Cumulative ........................................ 17
3.8.2. Average Upload Throughput – Distribution & Cumulative ............................................. 17
END OF DOCUMENT ...............................................................................................................18

www.cra.gov.qa 3
1. INTRODUCTION
As per the mandate provided to the Communications Regulatory Authority to safeguard the
interest of telecoms consumers to publish information regarding Service Provider quality of
service performance, including comparisons regarding the quality of service performance among
different Service Providers, CRA in the past has conducted several Quality of Mobile Services
Network Audit since 2012. CRA has conducted the Network Audit in the year 2017 to benchmark
the Coverage as well as Quality of Service offered by the operators.
2. COVERAGE AUDIT
Coverage audit is conducted using drive test system and samples are collected from all roads of
the State of Qatar. In addition, frequently accessed off road routes popularly used for fishing and
camping in seasons are also considered for collecting coverage data.
2.1. Measurement Methodology
2.1.1. Coverage
Coverage is a measure of the Received Signal Strength for each generation of technology
Rx lev (2G), RSCP (3G), RSRP (4G) for each operator.
2.1.2. Accessibility
Call attempts to a pre-defined short number are scheduled automatically, until a ring-
back tone or a specific audio recording (voicemail message) is received.
The accessibility rate is the number of successful attempts to the total number of
attempts to the network, after removal of congestion attempts, if any.
2.1.3. Data Coverage - Available Radio Access Technology
A series of 32 byte file is used to measure the round trip delay of the network. The
technology breakdown (in %) for each tests is reported.
2.2. Equipment Used
TSMW - High speed scanner/receiver (Rohde & Schwarz)
UE-1: LTE CAT 6 device (Smartphone) for Data coverage measurement
UE-2& 3: LTE CAT 3 device (Smartphone)

www.cra.gov.qa 4
UE-4: USB Dongle - LTE CAT 3 device
ROMES Drive test software
2.3. Measurement Timeline
22nd May 2017 to 31st Dec 2017
2.4. Samples
Coverage Areas (100m x 100m) - 70,347
Accessibility - 33,300
Data Coverage - 60,600
2.5. Geographical Coverage Plots
Coverage sample is a square of (100m x 100m) for each technology viz. Rx Lev (2G), RSCP
(3G), RSRP (4G). The sample with the strongest received level in each squares for each
technology is reported.
Signal Level Ooredoo
2G Vodafone
2G Ooredoo
3G Vodafone
3G Ooredoo
4G Vodafone
4G
Above -85dBm 99.88% 99.84% 99.17% 99.08% 88.73% 81.49%
-85dBm to -95dBm 0.09% 0.14% 0.73% 0.82% 9.60% 10.85%
Below -95dBm 0.02% 0.02% 0.10% 0.10% 1.67% 7.66%

www.cra.gov.qa 5

www.cra.gov.qa 6

www.cra.gov.qa 7

www.cra.gov.qa 8
2.6. Accessibility Rate
2.7. Data Coverage - Available Radio Access Technology
Statistical Accuracy
±0.06% ±0.04%
95.00%
96.00%
97.00%
98.00%
99.00%
100.00%
99.67% 99.89%
Call Accessibility Success Rate
0.00% 20.00% 40.00% 60.00% 80.00% 100.00%
96.19%
99.73%
3.80%
0.27%
0.01%
0.00%
Data Coverage - Technology Distribution
LTE UMTS EDGE

www.cra.gov.qa 9
3. QUALITY OF SERVICE AUDIT
The QoS audit is conducted to benchmark the Key performance Indicators of the services Voice
calls, Short message service (SMS) and Data service offered to the consumers. The samples are
collected in both drive test and stationary environments. Samples for stationary environment are
weighted based on the population density of the zones/municipality for the State of Qatar.
3.1. Measurement Methodology
3.1.1. Voice Service Quality Testing
A voice measurement is a call to a Speech Quality Server for one minute duration and
Mean Opinion Score (MOS) is recorded using POLQA algorithm.
3.1.2. Short Message Service
A 52 character sample SMS is send automatically and the received timings are recorded.
Tests are conducted within and across networks.
3.1.3. Data Service Testing
Data throughput measurement is carried out in stationary environment with a test file
size of 100MB and 50MB for download and upload respectively.
Webpage accessibility measurement is also carried out in drive test and stationary
environment which includes download a standard test page from the server.
3.2. Equipment Used
UE-1: LTE CAT 6 device (Smartphone).
UE-2& 3: LTE CAT 3 device (Smartphone).
UE-4: USB Dongle - LTE CAT 3 device.
LTE CAT 9 device with Qualipoc software for Data measurements.
ROMES Drive test software.
3.3. Measurement Timeline
22nd May 2017 to 31st Dec 2017
3.4. Samples
Voice Service - 17,800
Short Message Service - 4,402
Data Service - 2,731
Web Service - 40,600

www.cra.gov.qa 10
3.5. Voice Service
KPI Definition
Call Completion
Rate
Probability that a successful call attempt is maintained for 1 minute until it is released
intentionally by user.
Number of normally ended calls
Call completion rate = ------------------------------------------------------------------x 100
All successful call attempts by all users
Unsuccessful
Call Attempt Rate
The call failure rate assesses the probability that the end user cannot complete the call within
30 seconds.
Unsuccessful telephony service attempts by all users
when service shown as available
Unsuccessful call attempt rate= -------------------------------------------------------------------------x 100
All telephony service attempts by all users
Call Set Up Time
The call set-up time is the time period between sending of complete address information and
receipt of call set up notification.
Call set-up time = t (Connect established) - t (User pressed button on terminal)
Voice Quality
(MOS)
Voice quality in mobile networks is measured with the ITU-T P.863 (POLQA) model is to
predict overall listening speech quality from narrowband (300 to 3'400 Hz) to super wideband
(50 to 14'000 Hz) telecommunication scenarios as perceived by the user.
The average of Mean Opinion Score (MOS) over all samples each with call duration of 1
minute is reported.

www.cra.gov.qa 11
3.5.1. Call Completion Rate
3.5.2. Unsuccessful Call Attempt Rate
Statistical Accuracy
±0.0% ±0.0%
Statistical Accuracy
±0.13% ±0.09%
50%
60%
70%
80%
90%
100%
100% 100%
Call Completion Rate
0.00%
0.20%
0.40%
0.60%
0.80%
1.00%0.81%
0.37%
Unsuccessful Call Attempt Rate

www.cra.gov.qa 12
3.5.3. Call Setup Time
3.5.4. Voice Quality (MOS)
1.00
2.00
3.00
4.00
5.004.31
3.44
Average Call Setup Time (Sec)
1.00
2.00
3.00
4.00
5.00
3.59 3.72
Average Voice Quality (MOS)

www.cra.gov.qa 13
3.6. Short Message Service
KPI Definition
SMS Successful
Completion Rate
(Own & Cross Network)
Number of SMS transfer completed
SMS success rate = --------------------------------------------------------- x 100
Number of SMS Sent successfully
SMS Transfer Time The SMS end to end delivery time is the period of time between sending a short
message to the network and the message being received at the distant terminal (user
device).
SMS end-to-end delivery time = t (B, received) - t (A, send)
Statistical Accuracy
±0.24% ±0.46%
*Note: The originating operator’s does not have absolute control on Cross network KPI’s which are
terminated in the other network.
Statistical Accuracy
±0.47% ±0.09%
95.00%
96.00%
97.00%
98.00%
99.00%
100.00%
99.68%
98.77%
SMS Successful Completion Rate(Own Network)
95.00%
96.00%
97.00%
98.00%
99.00%
100.00% 98.73%
99.95%
SMS Successful Completion Rate
(Cross Network*)
0.0
0.2
0.4
0.6
0.8
1.0
0.8750.811
SMS Average Transfer Time (Sec) (Own Network)
0.0
0.5
1.0
1.5
2.0
0.996
1.349
SMS Average Transfer Time (Sec)
(Cross Network*)
www.cra.gov.qa 14
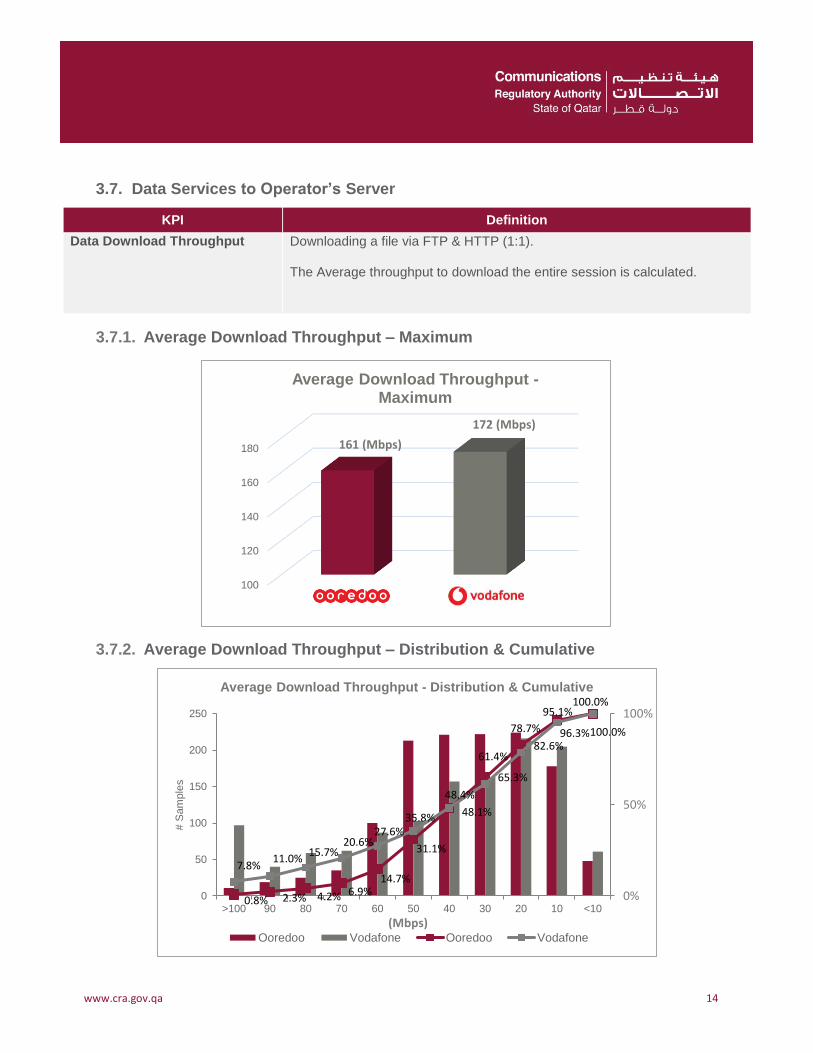
3.7. Data Services to Operator’s Server
KPI Definition
Data Download Throughput Downloading a file via FTP & HTTP (1:1).
The Average throughput to download the entire session is calculated.
3.7.1. Average Download Throughput – Maximum
3.7.2. Average Download Throughput – Distribution & Cumulative
100
120
140
160
180 161 (Mbps)
172 (Mbps)
Average Download Throughput -Maximum
0.8% 2.3% 4.2% 6.9%14.7%
31.1%
48.1%
65.3%
82.6%96.3%100.0%
7.8%11.0%
15.7%20.6%
27.6%35.8%
48.4%
61.4%
78.7%
95.1%100.0%
0%
50%
100%
0
50
100
150
200
250
>100 90 80 70 60 50 40 30 20 10 <10
# S
am
ple
s
(Mbps)
Average Download Throughput - Distribution & Cumulative
Ooredoo Vodafone Ooredoo Vodafone

www.cra.gov.qa 15
3.7.3. Average Upload Throughput – Maximum
3.7.4. Average Upload Throughput – Distribution & Cumulative
KPI Definition
Data Upload Throughput Uploading a file via FTP & HTTP (1:1).
The Average throughput to upload the entire session is calculated.
20
25
30
35
40
45
5044(Mbps)
47 (Mbps)
Average Upload Throughput - Maximum
0.0%
0.9%
34.5%
65.7%
88.8%100.0%
0.0% 6.7%
21.5%
61.7%
86.8%100.0%
0%
50%
100%
0
100
200
300
400
500
600
>50 40 30 20 10 <10
# Sa
mp
les
(Mbps)
Average Upload Throughput - Distribution & Cumulative
Ooredoo Vodafone Ooredoo Vodafone
www.cra.gov.qa 16
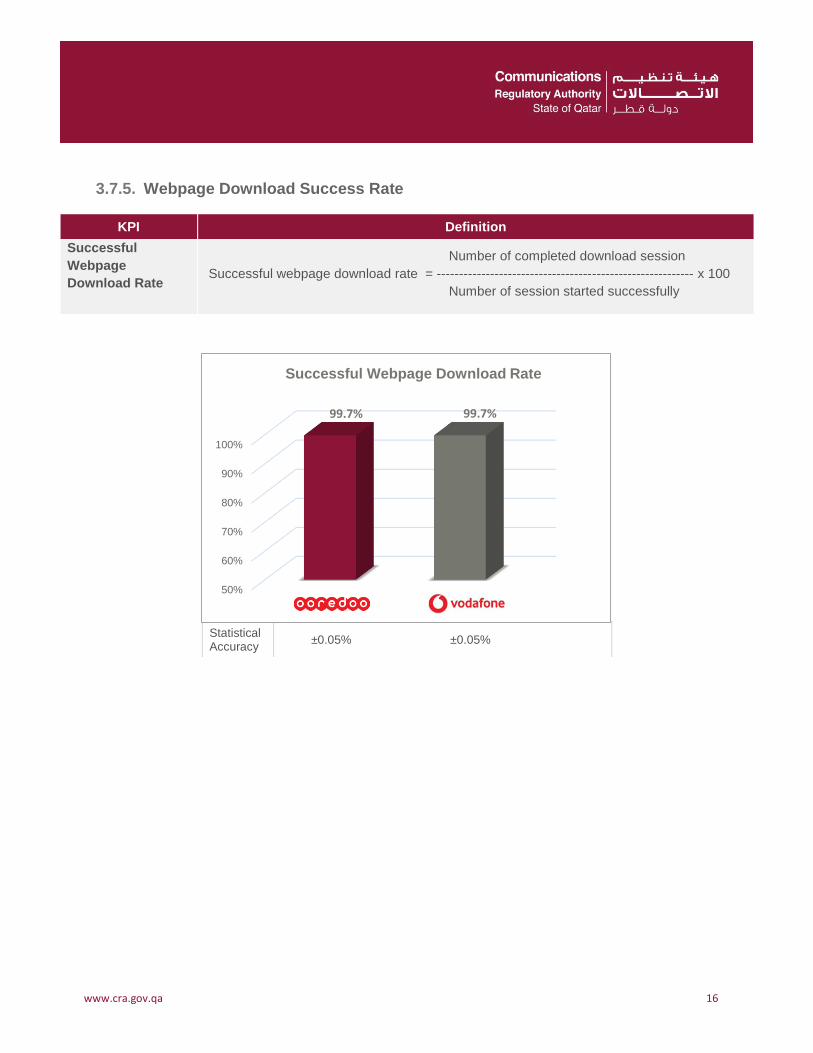
3.7.5. Webpage Download Success Rate
KPI Definition
Successful
Webpage
Download Rate
Number of completed download session
Successful webpage download rate = ---------------------------------------------------------- x 100
Number of session started successfully
Statistical Accuracy
±0.05% ±0.05%
50%
60%
70%
80%
90%
100%
99.7% 99.7%
Successful Webpage Download Rate

www.cra.gov.qa 17
3.8. Data Services to International Server
CRA conducted tests to portrays the user experience of throughputs for data sessions to
servers outside Qatar. The results are summarized as follows.The average throughputs are
indicative and indicates throughputs to the particular International server, chosen by CRA,
the identity of the location of which are kept anonymous to both service providers. The
throughput rates can vary depending on various factors for e.g. location of the server which
may be beyond the operator’s absolute control.
3.8.1. Average Download Throughput – Distribution & Cumulative
3.8.2. Average Upload Throughput – Distribution & Cumulative
0.0% 2.3%6.8%
11.6%20.3%
33.6%
67.0%
100.0%
0.0% 0.0%
18.3%
35.2%
50.1%
71.1%91.8%
100.0%
0%
50%
100%
0
50
100
150
200
250
300
70 60 50 40 30 20 10 <10
# S
am
ple
s
(Mbps)
Average Download Throughput - Distribution & Cumulative(International Server)
Ooredoo Vodafone Ooredoo Vodafone
0.4%
32.7%
65.9%
100.0%
0.0%4.1%
58.7%
100.0%
0%
50%
100%
0
100
200
300
400
500
600
700
800
30 20 10 <10
# S
am
ple
s
(Mbps)
Average Upload Throughput - Distribution & Cumulative (International Server)
Ooredoo Vodafone Ooredoo Vodafone

www.cra.gov.qa 18
END OF DOCUMENT