COVER SHEET - links.sgx.com
78
ICTSI Form 17-Q Q2 2019 1 4 7 2 1 2 SEC Registration Number I N T E R N A T I O N A L C O N T A I N E R T E R M I N A L S E R V I C E S , I N C . A N D S U B S I D I A R I E S (Company’s Full Name) I C T S I A D M I N I S T R A T I O N B U I L D I N G , M A N I L A I N T E R N A T I O N A L C O N T A I N E R T E R M I I N A L S O U T H A C C E S S R O A D , M A N I L A A (Business Address: No. Street City/Town/Province) Jose Joel M. Sebastian 245-4101 (Contact Person) (Company Telephone Number) 1 2 3 1 S E C 17 Q 0 4 Every 3 rd Thursday Month Day (Form Type) Month Day (Fiscal Year) (Annual Meeting) N/A (Secondary License Type, If Applicable) N/A Dept. Requiring this Doc. Amended Articles Number/Section Total Amount of Borrowings 1,378 as at June 30, 2019 US$332.9M US$1,535.1M Total No. of Stockholders Domestic Foreign To be accomplished by SEC Personnel concerned File Number LCU Document ID Cashier S T A M P S Remarks: Please use BLACK ink for scanning purposes. COVER SHEET
Transcript of COVER SHEET - links.sgx.com

ICTSI Form 17-Q Q2 2019
1 4 7 2 1 2SEC Registration Number
I N T E R N A T I O N A L C O N T A I N E R T E R M I N A L
S E R V I C E S , I N C . A N D S U B S I D I A R I E S
(Company’s Full Name)
I C T S I A D M I N I S T R A T I O N B U I L D I N G , M A
N I L A I N T E R N A T I O N A L C O N T A I N E R T E R MII N A L S O U T H A C C E S S R O A D , M A N I L AA
(Business Address: No. Street City/Town/Province)
Jose Joel M. Sebastian 245-4101(Contact Person) (Company Telephone Number)
1 2 3 1 S E C 17 Q 0 4 Every 3rd ThursdayMonth Day (Form Type) Month Day
(Fiscal Year) (Annual Meeting)
N/A(Secondary License Type, If Applicable)
N/ADept. Requiring this Doc. Amended Articles Number/Section
Total Amount of Borrowings
1,378as at June 30, 2019 US$332.9M US$1,535.1M
Total No. of Stockholders Domestic Foreign
To be accomplished by SEC Personnel concerned
File Number LCU
Document ID Cashier
S T A M P S
Remarks: Please use BLACK ink for scanning purposes.
COVER SHEET
ICTSI Form 17-Q Q2 2019
SECURITIES AND EXCHANGE COMMISSION
SEC FORM 17-Q
QUARTERLY REPORT PURSUANT TO SECTION 17 OF THESECURITIES REGULATION CODE AND SRC RULE 17(2)(b) THEREUNDER
1. For the quarterly period ended June 30, 2019
2. Commission identification number: 147212
3. BIR Tax Identification No. 000-323-228
1. Exact name of issuer as specified in its charter:INTERNATIONAL CONTAINER TERMINAL SERVICES, INC.
5. Province, Country or other jurisdiction of incorporation or organization: Philippines
6. Industry Classification Code: ___________________ (SEC Use Only)
7. Address of issuer’s principal office: ICTSI Administration Building, Manila InternationalContainer Terminal, South Access Road, Manila Postal Code: 1012
8. Registrant's telephone number, including area code: (632) 245-4101
9. Former name, former address, and former fiscal year: Not applicable
10. Securities registered pursuant to Sections 8 and 12 of the Code, or Sections 4 and 8 of the RSA.
Title of Each ClassNumber of shares outstanding
as at June 30, 2019
Common 2,013,633,338 Shares
11. Are any or all of the Securities listed on a Stock Exchange?Yes [x] No [ ]
If yes, state the name of such Stock Exchange and the class/es of securities listed therein:Philippine Stock Exchange Common shares
12. Indicate by check mark whether the issuer:
a) has filed all reports required to be filed by Section 17 of the Code and SRC Rule 17 thereunder orSections 11 of the RSA and RSA Rule 11(a)-1 thereunder, and Sections 26 and 141 of The CorporationCode of the Philippines during the preceding 12 months (or for such shorter period that the registrantwas required to file such reports).
Yes [x] No [ ]
(b) has been subject to such filing for the past 90 days. Yes [x] No [ ]

ICTSI Form 17-Q Q2 2019
TABLE OF CONTENTS
PART 1 – FINANCIAL INFORMATION........................................................................................ 1
Item 1. Financial Statements............................................................................................... 1
Consolidated Balance Sheet as at December 31, 2018, as Restated, andUnaudited Interim Consolidated Balance Sheet as at June 30, 2019....................... 3
Unaudited Interim Consolidated Statements of Income for theThree and Six Months Ended June 30, 2018 and 2019 ........................................... 4
Unaudited Interim Consolidated Statements of Comprehensive Income for theThree and Six Months Ended June 30, 2018 and 2019 ........................................... 5
Unaudited Interim Consolidated Statements of Changes in Equity for theSix Months Ended June 30, 2018 and 2019 ............................................................ 6
Unaudited Interim Consolidated Statements of Cash Flows for theSix Months Ended June 30, 2018 and 2019 ............................................................ 8
Notes to Unaudited Interim Condensed Consolidated Financial Statements ..................... 10
Item 2. Management’s Discussion and Analysis or Plan of Operations ............................ 41
PART II – OTHER INFORMATION ............................................................................................. 68
ANNEX 1 – Schedule of Aging of Receivables.............................................................................. 69
ANNEX 2 – Financial Soundness Indicators ................................................................................. 70
ANNEX 3 – List of Effective PFRS Standards and Interpretations .............................................. 71
ANNEX 4 – Map of Subsidiaries ................................................................................................... 74
SIGNATURES ................................................................................................................................ 75

ICTSI Form 17-Q Q2 2019 1
PART 1 – FINANCIAL INFORMATION
Item 1. Financial Statements
The consolidated balance sheet as at December 31, 2018, as restated, and the unaudited interimcondensed consolidated financial statements as at June 30, 2019 and for the three and six monthsended June 30, 2018 and 2019 and the related notes to unaudited interim condensed consolidatedfinancial statements of International Container Terminal Services, Inc. and Subsidiaries (collectivelyreferred to as “the Group”) are filed as part of this Form 17-Q on pages 2 to 40.
Operating segments are also reported in the notes to unaudited interim condensed consolidatedfinancial statements.
There are no other material events subsequent to the end of this interim period that have not beenreflected in the unaudited interim condensed consolidated financial statements filed as part of thisreport.

ICTSI Form 17-Q Q2 2019 2
International Container Terminal Services, Inc.and Subsidiaries
Unaudited Interim Condensed Consolidated Financial StatementsAs at June 30, 2019(with Comparative Figures as at December 31, 2018, as Restated)and for the Three and Six Months Ended June 30, 2018 and 2019

ICTSI Form 17-Q Q2 2019 3
INTERNATIONAL CONTAINER TERMINAL SERVICES, INC.AND SUBSIDIARIESUNAUDITED INTERIM CONSOLIDATED BALANCE SHEETSAs at June 30, 2019(With Comparative Figures as at December 31, 2018, as Restated)(In Thousands)
December 31, 2018(Restated - Note 3)
June 30, 2019(Unaudited)
ASSETSNoncurrent AssetsIntangibles (Note 5) US$1,965,647 US$2,002,010Property and equipment (Notes 3 and 6) 1,378,184 1,384,495Right-of-use assets (Note 3) 523,328 508,716Investment properties 7,439 7,315Investments in and advances to joint ventures and associates
(Notes 8 and 16) 381,188 447,547Deferred tax assets (Note 3) 248,062 266,156Other noncurrent assets (Notes 1, 7 and 19) 138,884 566,615
Total Noncurrent Assets 4,642,732 5,182,854Current AssetsCash and cash equivalents (Note 9) 447,079 295,585Receivables (Note 10) 120,424 109,653Spare parts and supplies 34,044 35,111Prepaid expenses and other current assets (Note 11) 71,465 91,477Derivative assets (Note 19) 426 60
Total Current Assets 673,438 531,886US$5,316,170 US$5,714,740
EQUITY AND LIABILITIESEquity Attributable to Equity Holders of the ParentCapital stock:
Preferred stock US$236 US$236Common stock 67,330 67,330
Additional paid-in capital (Note 15) 549,382 548,315Cost of shares held by subsidiaries (Note 15) (74,261) (74,261)Treasury shares (Note 15) (58,112) (53,746)Excess of acquisition cost over the carrying value of non-controlling
interests (Note 15) (142,555) (143,026)Retained earnings (Notes 3 and 15) 400,099 297,218Perpetual capital securities (Note 15) 1,153,615 1,018,513Other comprehensive loss - net (Notes 15 and 19) (155,505) (159,892)
Total equity attributable to equity holders of the parent 1,740,229 1,500,687Equity Attributable to Non-controlling Interests (Notes 1 and 15) 165,504 159,024
Total Equity 1,905,733 1,659,711Noncurrent LiabilitiesLong-term debt - net of current portion (Notes 12 and 19) 1,220,487 1,608,820Concession rights payable - net of current portion (Notes 5 and 19) 530,666 521,547Lease liabilities - net of current portion (Note 3) 1,122,563 1,143,042Deferred tax liabilities (Note 3) 57,883 64,471Other noncurrent liabilities (Notes 3 and 13) 32,716 40,365
Total Noncurrent Liabilities 2,964,315 3,378,245Current LiabilitiesLoans payable (Note 12) 35,718 31,568Accounts payable and other current liabilities (Notes 3, 14 and 16) 307,698 349,600Current portion of long-term debt (Notes 12 and 19) 50,848 227,633Current portion of concession rights payable (Notes 5 and 19) 10,603 10,902Current portion of lease liabilities (Note 3) 9,033 10,413Income tax payable 31,607 34,693Derivative liabilities (Note 19) 615 11,975
Total Current Liabilities 446,122 676,784Total Liabilities 3,410,437 4,055,029
US$5,316,170 US$5,714,740
See accompanying Notes to Unaudited Interim Condensed Consolidated Financial Statements.

ICTSI Form 17-Q Q2 2019 4
INTERNATIONAL CONTAINER TERMINAL SERVICES, INC.AND SUBSIDIARIESUNAUDITED INTERIM CONSOLIDATED STATEMENTS OF INCOME(In Thousands, Except Per Share Data)
For the Three Months Ended June 30 For the Six Months Ended June 302018
(Restated - Note 3) 20192018
(Restated - Note 3) 2019
INCOMEGross revenues from port operations US$336,384 US$368,001 US$661,764 US$751,785Foreign exchange gain (Note 3) 133 1,319 2,163 2,881Interest income (Notes 9 and 16) 6,353 6,999 12,161 13,101Other income (Note 13) 7,591 4,712 9,204 7,195
350,461 381,031 685,292 774,962
EXPENSESPort authorities’ share in gross revenues
(Notes 3 and 16) 42,283 46,130 84,525 95,343Manpower costs (Notes 15 and 16) 54,655 59,519 107,214 116,831Equipment and facilities-related expenses
(Notes 3 and 16) 29,034 27,934 55,146 54,891Depreciation and amortization (Note 3) 54,879 57,833 109,509 115,225Administrative and other operating expenses
(Note 16) 31,889 32,562 58,817 60,321Interest expense and financing charges on
borrowings (Notes 5, 6 and 12) 25,746 27,976 53,697 53,739Interest expense on concession rights payable
(Note 5) 8,970 9,986 17,038 19,995Interest expense on lease liabilities (Note 3) 26,050 25,859 53,131 51,786Equity in net loss of joint ventures and an
associate (Note 8) 7,578 6,266 16,036 12,398Foreign exchange loss (Note 3) 1,748 516 3,760 2,081Other expenses 3,189 3,325 6,311 5,884
286,021 297,906 565,184 588,494
CONSTRUCTION REVENUE(EXPENSE)
Construction revenue 26,475 41,039 33,702 79,487Construction expense (26,475) (41,039) (33,702) (79,487)
– – – –
INCOME BEFORE INCOME TAX 64,440 83,125 120,108 186,468
PROVISION FOR (BENEFIT FROM)INCOME TAX
Current 17,578 20,786 36,744 44,634Deferred (Note 3) (9,345) (2,226) (20,540) (4,236)
8,233 18,560 16,204 40,398
NET INCOME US$56,207 US$64,565 US$103,904 US$146,070
Attributable ToEquity holders of the parent (Note 3) US$49,358 US$56,067 US$90,242 US$128,470Non-controlling interests 6,849 8,498 13,662 17,600
US$56,207 US$64,565 US$103,904 US$146,070
Earnings Per Share (Notes 3 and 17)Basic US$0.016 US$0.020 US$0.029 US$0.048Diluted 0.016 0.020 0.029 0.048
See accompanying Notes to Unaudited Interim Condensed Consolidated Financial Statements.

ICTSI Form 17-Q Q2 2019 5
INTERNATIONAL CONTAINER TERMINAL SERVICES, INC.AND SUBSIDIARIESUNAUDITED INTERIM CONSOLIDATED STATEMENTS OFCOMPREHENSIVE INCOME(In Thousands)
For the Three Months Ended June 30 For the Six Months Ended June 302018
(Restated – Note 3) 20192018
(Restated – Note 3) 2019
NET INCOME FOR THE PERIOD US$56,207 US$64,565 US$103,904 US$146,070
OTHER COMPREHENSIVE INCOMEItems to be reclassified to profit or loss in
subsequent periodsExchange differences on translation of foreign
operations’ financialstatements (Notes 3 and 15) (44,247) (309) (41,528) 5,647
Net change in unrealized mark-to-market valuesof derivatives (Notes 15 and 19) (2,328) (14,968) 128 (19,409)
Net unrealized mark-to-market gain on available-for-sale investments (Note 15) – (5,928) 88 (66)
Share in other comprehensive gain (loss) of anassociate (Note 15) (2,564) 2,773 (4,191) 2,713
Income tax relating to components of othercomprehensive income(Notes 15 and 19) 206 4,460 (500) 5,363
(48,933) (13,972) (46,003) (5,752)Items not to be reclassified to profit or loss in
subsequent periodsShare in other comprehensive gain (loss) of an
associate (Note 15) (1) – 89 –Actuarial gains (losses) on defined benefit plans -
net of tax (Note 15) 63 – 50 (113)(48,871) (13,972) (45,864) (5,865)
TOTAL COMPREHENSIVE INCOME FORTHE PERIOD US$7,336 US$50,593 US$58,040 US$140,205
Attributable ToEquity holders of the parent (Note 3) US$9,346 US$45,853 US$49,744 US$124,083Non-controlling interests (2,010) 4,740 8,296 16,122
US$7,336 US$50,593 US$58,040 US$140,205
See accompanying Notes to Unaudited Interim Condensed Consolidated Financial Statements.

SEC Form 17-Q Q2 2018 666 6
INTERNATIONAL CONTAINER TERMINAL SERVICES, INC.AND SUBSIDIARIESUNAUDITED INTERIM CONSOLIDATED STATEMENTS OF CHANGES IN EQUITYFOR THE SIX MONTHS ENDED JUNE 30, 2018 and 2019(In Thousands)
Attributable to Equity Holders of the Parent
PreferredStock
CommonStock
AdditionalPaid-inCapital
(Note 15)
PreferredShares Held
by aSubsidiary
(Note 15)
CommonShares Held
by aSubsidiary
(Note 15)
TreasuryShares
(Note 15)
Excess ofAcquisition
Cost over theCarryingValue of
Non-controlling
Interests(Note 15)
RetainedEarnings(Note 15)
PerpetualCapital
Securities(Note 15)
OtherCompre-
hensiveLoss - net
(Notes 3, 15and 19) Total
Non-controlling
Interests(Notes 1 and
15)Total
Equity
Balance at December 31, 2017 US$236 US$67,330 US$547,853 (US$72,492) (US$1,769) (US$15,059) (US$142,555) US$819,668 US$761,341 (US$256,622) US$1,707,931 US$164,638 US$1,872,569Effect of PFRS 16 adoption
(Note 3) – – – – – – – (470,156) – 126,860 (343,296) – (343,296)Balance at December 31, 2017,
as restated 236 67,330 547,853 (72,492) (1,769) (15,059) (142,555) 349,512 761,341 (129,762) 1,364,635 164,638 1,529,273Total comprehensive income for the
period – – – – – – – 90,242 – (40,498) 49,744 8,296 58,040Issuance of perpetual capital
securities (Note 15) – – – – – – – – 392,274 – 392,274 – 392,274Share-based payments (Note 15) – – 2,086 – – – – – – – 2,086 – 2,086Issuance of treasury shares – – (2,277) – – 2,277 – – – – – – –Acquisition of ICTSI common
shares (Note 15) – – – – – (6,090) – – – – (6,090) – (6,090)Cash dividends (Note 15) – – – – – – – (97,584) – – (97,584) (11,184) (108,768)Distributions on perpetual capital
securities (Note 15) – – – – – – – (27,774) – – (27,774) – (27,774)Balance at June 30, 2018 US$236 US$67,330 US$547,662 (US$72,492) (US$1,769) (US$18,872) (US$142,555) US$314,396 US$1,153,615 (US$170,260) US$1,677,291 US$161,750 US$1,839,041

SEC Form 17-Q Q2 2018 777 7
Attributable to Equity Holders of the Parent
PreferredStock
CommonStock
AdditionalPaid-inCapital
(Note 15)
PreferredShares Held
by aSubsidiary
(Note 15)
CommonShares Held
by aSubsidiary
(Note 15)
TreasuryShares
(Note 15)
Excess ofAcquisition
Cost over theCarryingValue of
Non-controlling
Interests(Note 15)
RetainedEarnings(Note 15)
PerpetualCapital
Securities(Note 15)
OtherCompre-
hensiveLoss - net
(Notes 3, 15and 19) Total
Non-controlling
Interests(Notes 1 and
15)Total
Equity
Balance at December 31, 2018 US$236 US$67,330 US$549,382 (US$72,492) (US$1,769) (US$58,112) (US$142,555) US$882,814 US$1,153,615 (US$314,753) US$2,063,696 US$165,504 US$2,229,200Effect of PFRS 16 adoption
(Note 3) – – – – – – – (482,715) – 159,248 (323,467) – (323,467)Balance at December 31, 2018,
as restated 236 67,330 549,382 (72,492) (1,769) (58,112) (142,555) 400,099 1,153,615 (155,505) 1,740,229 165,504 1,905,733Total comprehensive income for the
period – – – – – – – 128,470 – (4,387) 124,083 16,122 140,205Share-based payments (Note 15) – – 3,299 – – – – – – – 3,299 – 3,299Issuance of treasury shares – – (4,366) – – 4,366 – – – – – – –Cash dividends (Note 15) – – – – – – – (194,228) – – (194,228) (15,073) (209,301)Acquisition of non-controlling
interests (Note 15) – – – – – – (471) – – – (471) (7,529) (8,000)Redemption of perpetual capital
securities (Note 15) – – – – – – – (4,584) (135,102) – (139,686) – (139,686)Distributions on perpetual capital
securities (Note 15) – – – – – – – (32,539) – – (32,539) – (32,539)Balance at June 30, 2019 US$236 US$67,330 US$548,315 (US$72,492) (US$1,769) (US$53,746) (US$143,026) US$297,218 US$1,018,513 (US$159,892) US$1,500,687 US$159,024 US$1,659,711
See accompanying Notes to Unaudited Interim Condensed Consolidated Financial Statements.

ICTSI Form 17-Q Q2 2019 8
INTERNATIONAL CONTAINER TERMINAL SERVICES, INC.AND SUBSIDIARIESUNAUDITED INTERIM CONSOLIDATED STATEMENTS OF CASH FLOWS(In Thousands)
For the Six Months Ended June 302018
(Restated – Note 3) 2019
CASH FLOWS FROM OPERATING ACTIVITIESIncome before income tax US$120,108 US$186,468Adjustments for:
Depreciation and amortization 109,509 115,225Interest expense on:
Borrowings (Notes 5, 6 and 12) 53,697 53,739Lease liabilities (Note 3) 53,131 51,786Concession rights payable (Note 5) 17,038 19,995
Equity in net loss of joint ventures and an associate (Note 8) 16,036 12,398Share-based payments (Note 15) 2,075 2,258Interest income (Notes 9 and 16) (12,161) (13,101)Unrealized foreign exchange loss (gain) 171 (1,248)Loss (gain) on sale of property and equipment 171 (89)
Operating income before changes in working capital 359,775 427,431Decrease (increase) in:
Receivables 5,780 9,510Spare parts and supplies (664) (1,404)Prepaid expenses and other current assets (1,887) (20,637)
Increase (decrease) in:Accounts payable and other current liabilities (5,357) (4,753)Pension liabilities 57 878
Cash generated from operations 357,704 411,025Income taxes paid (33,198) (37,337)Net cash provided by operating activities 324,506 373,688CASH FLOWS FROM INVESTING ACTIVITIESAcquisitions of:
Intangible assets (Notes 1 and 5) (83,852) (75,781)Property and equipment (Notes 1 and 6) (42,428) (41,136)
Increase in other noncurrent assets (2,264) (431,164)Additional subscription and acquisition of shares in a joint
venture and an associate (Note 8) – (50,081)Payments of concession rights (Note 5) (38,109) (9,202)Interest received 2,693 4,399Decrease (increase) in advances to joint ventures (Notes 8 and 16) (4,735) 3,593Net proceeds from sale of property and equipment 234 1,055Net cash used in investing activities (168,461) (598,317)

SEC Form 17-Q Q2 2018 999 9
For the Six Months Ended June 302018
(Restated – Note 3) 2019
CASH FLOWS FROM FINANCING ACTIVITIESNet proceeds from:
Long-term borrowings (Note 12) 31,319 590,756Issuance of perpetual capital securities 392,274 –Short-term borrowings (Note 12) 39,726 –
Payments of:Dividends (Note 15) (110,622) (207,648)Interest on borrowings and concession rights payable
(Notes 5 and 12) (66,935) (66,945)Long-term borrowings (Note 12) (183,057) (29,012)Interest on lease liabilities (Note 3) (25,028) (24,814)Short-term borrowings (Note 12) (66,283) (3,990)Lease liabilities (Note 3) (532) (3,399)
Redemption of perpetual capital securities (Note 15) – (139,686)Distributions on perpetual capital securities (Note 15) (27,774) (32,539)Acquisition of non-controlling interest (Note 15) – (8,000)Increase in other noncurrent liabilities (983) (1,148)Acquisition of ICTSI common shares (Note 15) (6,090) –Net cash provided by (used in) financing activities (23,985) 73,575
EFFECT OF EXCHANGE RATE CHANGES ON CASH ANDCASH EQUIVALENTS (9,949) (440)
NET INCREASE (DECREASE) IN CASH AND CASHEQUIVALENTS 122,111 (151,494)
CASH AND CASH EQUIVALENTS AT BEGINNING OF PERIOD 279,427 447,079
CASH AND CASH EQUIVALENTS AT END OF PERIOD (Note 9) US$401,538 US$295,585
See accompanying Notes to Unaudited Interim Condensed Consolidated Financial Statements.

SEC Form 17-Q Q2 2019 1010
INTERNATIONAL CONTAINER TERMINAL SERVICES, INC.AND SUBSIDIARIESNOTES TO UNAUDITED INTERIM CONDENSED CONSOLIDATED FINANCIALSTATEMENTS
1. Corporate Information
1.1 General
International Container Terminal Services, Inc. (ICTSI or the Parent Company) wasincorporated in the Philippines and registered with the Philippine Securities and ExchangeCommission (SEC) on December 24, 1987. The registered office address of the Company isICTSI Administration Building, MICT South Access Road, Manila. ICTSI’s common shareswere listed with the Philippine Stock Exchange (PSE) on March 23, 1992 at an offer price ofP=6.70. ICTSI has 2,013,633,338 common shares outstanding held by 1,378 shareholders onrecord as at June 30, 2019.
1.2 Port Operations
ICTSI and subsidiaries (collectively referred to as “the Group”) entered into various concessionsof port operations which include development, management, and operation of containerterminals and related facilities around the world. As at August 13, 2019, the Group is involvedin 32 terminal concessions and port development projects in 18 countries worldwide. There areeleven terminal operations, including an inland container terminal and a barge terminal in thePhilippines, two each in Indonesia, Papua New Guinea (PNG) and Brazil, one each in China,Ecuador, Poland, Georgia, Madagascar, Croatia, Pakistan, Mexico, Honduras, Iraq, Argentina,Colombia, Democratic Republic (DR) of Congo, and Australia; and an existing concession toconstruct, develop and operate a port in Tuxpan, Mexico.
Concessions for port operations entered into, acquired, developed and terminated by ICTSI andsubsidiaries for the last two years are summarized below:
Umm Qasr, Iraq. ICTSI, through its wholly owned subsidiary, ICTSI (M.E.) DMCC [formerlyICTSI (M.E.) JLT] (ICTSI Dubai), and General Company for Ports of Iraq (GCPI) signed onApril 10, 2014 the Contract for the Construction and Operation of Three New Quays andManagement and Operation of Quay No. 20 (“Contract”) in the Port of Umm Qasr (“Port”) inIraq. The Contract grants ICTSI the rights to: (a) manage and operate the existing containerfacility at Berth 20 of the Port for a period of 10 years, (b) build in three phases, under abuild-operate-transfer (BOT) scheme, a new container and general cargo terminal in the Port fora concession period of 26 years, and (c) provide container and general cargo terminal services inboth components. On March 1, 2016, an addendum to the Contract (“First Addendum”) wassigned by the parties granting ICTSI, through ICTSI Dubai, the right to manage and operate anadditional existing Quay No. 19 for a total of 13 years, with the first three years for thecompletion of rehabilitation works. Also, the First Addendum extended the original term for themanagement and operation of Quay No. 20 from 10 to 13 years. On March 26, 2017, a secondaddendum to the Contract (“Second Addendum”) was signed by the parties granting ICTSI,through ICTSI Dubai, the right to manage and operate Quay No. 21 co-terminus with theContract and the First Addendum. The Second Addendum extended the term for themanagement and operation of Quay No. 19 and 20 from 13 to 21 years.
SEC Form 17-Q Q2 2019 1111
ICTSI commenced trial operations at Berth 20 in September 2014 and full-fledged commercialoperations in November 2014. ICTSI commenced commercial operations of Berth 19 inJune 2016. The rehabilitation works for Berth 21 are on-going and it has started operations inthe third quarter of 2018.
Phase 1 of the expansion project (Berth 27) under the BOT scheme has 250 meters of berth withan estimated capacity of 300,000 TEUs. The facility will have 600 meters of quay with anestimated capacity of 900,000 TEUs. Berth 27 was completed and fully operational in the firstquarter of 2017.
On October 22, 2017, ICTSI signed an agreement with GCPI for the Phase 2 of expansiondevelopment of the Port. The Phase 2 expansion project will involve development of two newberths, Berths 25 and 26, including a 20-hectare yard area. This expansion will increase thePort’s container handling capacity by 600,000 TEUs to 1,200,000 TEUs and its capability tohandle large container vessels of up to 10,000 TEUs. The development of this phase of theexpansion project is on-going and is expected to be completed in the third quarter of 2019.
Port of Melbourne, Australia. On May 2, 2014, ICTSI, through its subsidiary in Australia,Victoria International Container Terminal Ltd. (VICT), signed a contract in Melbourne with Portof Melbourne Corporation for the design, construction, commissioning, operation, maintainingand financing of the Webb Dock Container Terminal (Terminal) and Empty Container Park(ECP) at Webb Dock East (WDE) in the Port of Melbourne. The Contract grants VICT therights to: (a) design, build and commission the new Terminal at berths WDE 4 and WDE 5,(b) design, build and commission the new ECP at WDE, and (c) operate the Terminal and ECPuntil June 30, 2040. Initially, VICT was 90% owned by ICTSI through ICTSI Far East Pte. Ltd.(IFEL), a wholly owned subsidiary, and 10% by Anglo Ports Pty Limited (“Anglo Ports”). OnFebruary 4, 2015, IFEL acquired the 10% non-controlling interest from Anglo Ports and became100% owner of VICT. On January 7, 2016, IFEL’s ownership interest in VICT was transferredto another subsidiary, ICTSI Oceania B.V. (IOBV), making IOBV the new 100% owner ofVICT.
Phase 1 of the Terminal and the ECP with capacities of 350,000 TEUs and 250,000 TEUs,respectively, commenced commercial operations in the second quarter of 2017. Phase 2 of theTerminal commenced commercial operations in the first quarter of 2018 and has increased thecapacity to 1,000,000 TEUs.
Davao, Philippines. On April 21, 2006, the Philippine Ports Authority (PPA) granted DavaoIntegrated Port and Stevedoring Services Corporation (DIPSSCOR) a ten-year contract for cargohandling services at Sasa Wharf, Port of Davao in the Philippines that expired onApril 20, 2016. Thereafter, the PPA granted DIPSSCOR a series of hold-over authority on atemporary basis over the cargo handling services at Sasa Wharf, Port of Davao. OnFebruary 22, 2018, the PPA issued Administrative order (AO) No. 04-2018 directing all PortManagers of the PPA to grant hold-over authorities to cargo handling service providers withcontracts due to expire in 2018, for six months, unless earlier terminated by the PPA or uponaward of a new terminal management contract in accordance with PPA AO No. 03-2016 entitled“Port Terminal Management Regulatory Framework”. On June 11, 2018, the hold-overauthority was issued by the PPA with a validity of six months starting February 26, 2018 untilthe award of a new contract by the PPA, whichever is earlier, unless cancelled or revoked forreason by the PPA during the validity of the hold-over authority. On November 12, 2018, thehold-over authority was issued by the PPA with a validity of six months startingAugust 26, 2018 or until the award of a new contract by the PPA, whichever is earlier, unlesscancelled or revoked for reason by the PPA during the validity of the hold-over authority. As ofAugust 13, 2019, DIPSSCOR has not received a new hold-over authority.

SEC Form 17-Q Q2 2019 1212
South Cotabato, Philippines. On February 20, 2006, the PPA granted South Cotabato IntegratedPort Services, Inc. (SCIPSI) a ten-year contract for the exclusive management and operation ofarrastre, stevedoring, and other cargo handling services, except porterage, at Makar Wharf, Portof General Santos, General Santos City in the Philippines that expired on February 19, 2016.Thereafter, the PPA granted SCIPSI a series of hold-over authority on a temporary basis over thecargo handling services at Makar Wharf, Port of General Santos. On February 22, 2018, thePPA issued AO No. 04-2018 directing all Port Managers of the PPA to grant hold-overauthorities to cargo handling service providers with contracts due to expire in 2018, for sixmonths, unless earlier terminated by the PPA or upon award of a new terminal managementcontract in accordance with PPA AO No. 03-2016. On June 21, 2018, the hold-over authoritywas issued by the PPA with a validity of six months starting February 25, 2018 until the awardof a new contract by the PPA, whichever is earlier, unless cancelled or revoked for reason by thePPA during the validity of the hold-over authority. On October 19, 2018, the hold-overauthority was issued by the PPA with a validity of six months starting August 25, 2018 or untilthe award of a new contract by the PPA, whichever is earlier, unless cancelled or revoked forreason by the PPA during the validity of the hold-over authority. As of August 13, 2019,SCIPSI has not received a new hold-over authority.
Cavite Gateway Terminal, Philippines. On April 21, 2017, ICTSI, through its wholly-ownedsubsidiary, Cavite Gateway Terminal (CGT), in partnership with the Philippine Department ofTransportation, project launched the country’s first container roll-on roll-off barge terminal inTanza, Cavite. CGT will facilitate off-the-roads seaborn transport of containers between Port ofManila and Cavite and service industrial locators in Cavite area. CGT’s barge terminal willhave an annual capacity of 115,000 TEUs, which is equivalent to 140,000 fewer truck trips oncity roads each year. CGT formally commenced commercial operations in November 2018.
Motukea and Lae, Papua New Guinea. In September 2017, ICTSI received a notification fromPNG Ports Corporation Limited (PNGPCL), a PNG state-owned enterprise, of the confirmationby the Independent Consumer and Competition Commission in PNG with respect to the two25-year agreements signed by ICTSI’s PNG subsidiaries, Motukea International TerminalLimited (MITL) and South Pacific International Container Terminal Limited (SPICTL), withPNGPCL for the operation, management and development of the two international ports inMotukea and Lae in PNG. SPICTL and MITL were allowed by PNGPCL to take over the portfacilities and begin operations at the Port of Lae in February 2018 and at the Port of Motukea inMay 2018, respectively. The terminal operating agreements (TOA) and other related contractstook effect on June 1, 2018 after all the parties have complied with the agreed conditionsprecedent.
ICTSI, through its subsidiaries, ISPL, MITL and SPICTL entered into Subscription andShareholders Agreements (SSA) with the impacted communities (IC) for the management andgovernance of and the further transfers and/or issues of shares of MITL and SPICTL. The SSAsbecame effective upon the effectivity of the TOAs. Within one year from the effectivity date ofthe SSAs and upon the required written notification by ICTSI, through ISPL, the ICs have theright to subscribe up to 30% of the total initial shares of MITL and SPICTL. Pre-emptive rightson additional subscriptions are available to all shareholders.
On August 8, 2019, ISPL entered into agreements with the local Tatana and Barunicommunities, represented by Noho-Mage Holdings Limited, for the latter to acquire a 30% stakeof MITL.
As of August 13, 2019, the ICs for SPICTL have not exercised their right to subscribe pendingthe finalization of the capital structure of SPICTL.

SEC Form 17-Q Q2 2019 1313
Manila North Harbor, Philippines. On September 21, 2017, the Board of ICTSI granted theauthority to acquire shares in MNHPI. On the same date, ICTSI signed a Share PurchaseAgreement (SPA) with Petron Corporation for the acquisition of 10,449,000 MNHPI shares,representing 34.83% of the total issued and outstanding shares of MNHPI for a consideration ofPhp1.75 billion (US$33.8 million). The completion of the SPA was subject to severalconditions, one of which was the approval of the acquisition by the Philippine Ports Authority(PPA) which was obtained on October 20, 2017. The SPA was completed on October 30, 2017.An additional investment cost of Php2.45 billion (US$47.3 million) was incurred in relation tothis acquisition.
On September 5, 2018, ICTSI has signed an SPA with Harbour Centre Port Terminal, Inc.(HCPTI) for the acquisition of 4,550,000 shares in MNHPI from HCPTI. The subject sharesrepresent 15.17% of the total issued and outstanding shares of MNHPI. The consideration isPhp910.0 million (US$17.3 million). The Philippine Competition Commission and the PPAapproved the acquisition of shares on March 15, 2019 and April 26, 2019, respectively. With theapproval of the PPA, ICTSI's shareholdings in MNHPI increased from 34.83% to 50% effectiveon April 26, 2019. An additional investment cost of Php2.7 billion (US$50.3 million) wasincurred in relation to this acquisition.
Port of Tanjung Priok, Indonesia. On November 2, 2017, PT ICTSI Jasa Prima Tbk (IJP), anICTSI subsidiary in Indonesia, signed a Conditional Share Purchase Agreement with PTSamudera Terminal Indonesia for the purchase of IJP’s interest in PT Perusahaan Bongkar MuatOlah Jasa Andal (OJA), subject to certain conditions. As of August 13, 2019, the conditionsprecedent have not yet been fulfilled.
Port of Port Sudan, Sudan. On January 3, 2019, ICTSI, through its wholly-owned subsidiaryICTSI Middle East DMCC, signed a Concession Agreement (‘the Agreement’) with Sea PortsCorporation (SPC) of Sudan to operate, manage, and develop the South Port Container Terminal(SPCT) at the Port of Sudan, Republic of the Sudan for 20 years. The Port of Sudan is the onlymajor modern port in the Republic of the Sudan and serves as the international gateway for morethan 95% of country’s cargo flows.
Pursuant to the Agreement, ICTSI is required to pay: (a) an upfront fee of EUR530.0 million ininstallments of EUR410.0 million (US$467.2 million) and five other installments each in theamount of EUR24.0 (US$27.3 million) from the third to the seventh operation year; (b) fixedmonthly fee; and (c) royalty fee during the concession period. The Agreement is secured by asovereign guarantee by the Republic of the Sudan. On January 13, 2019, ICTSI paid the initialinstallment of upfront fee of EUR410.0 million (US$470.2 million, the “Upfront Fee”) andshown as part of “Other noncurrent assets” (see Note 7). In February 2019, ICTSI establishedAfrica Gateway Terminal (AGT), a Sudanese entity, to operate the container terminal.
On January 8, 2019, the Ministry of Finance and Economic Planning (the “Ministry”) issued abond (the “Refund Bond”), which was subsequently amended, wherein it agreed to refund theUpfront Fee in case ICTSI is unable to take over operations by April 7, 2019.
On August 7, 2019, due to the ongoing political instability in the Republic of the Sudan and thefailure of the Sudanese government to turn over SPCT on or before April 7, 2019, the SudaneseMinistry sent ICTSI a letter confirming: (1) the remittance of EUR195.2 million as partialrepayment of the Upfront Fee under the terms of the Refund Bond and (2) that the balance willbe repaid as soon as possible.
ICTSI is in continuous discussion with the Sudanese Government for the repayment schedule ofthe balance of the Upfront Fee and the status of the Concession Agreement following a letterfrom SPC regarding its cancellation which ICTSI disputes. ICTSI reserves and continues toreserve its rights under the Concession Agreement.

SEC Form 17-Q Q2 2019 1414
ICTSI, has an excellent track record of managing and making significant investments incontainer terminal infrastructure and is committed to making the Port of Sudan a leading portand strategic gateway to Africa, benefitting all of its stakeholders.
Port of Rio de Janeiro City, Federative Republic of Brazil. On July 19, 2019, ICTSI, through itswholly-owned subsidiary ICTSI Americas B.V, signed a Share Purchase Agreement with BorealEmpreendimentos e Participações S.A. (Boreal) to acquire 100% of the shares of Libra TerminalRio S.A. (Libra Rio), which holds the concession rights to operate, manage and develop thecontainer terminal Terminal de Contêineres 1 (T1Rio) in the port of Rio de Janeiro City,Federative Republic of Brazil. The concession of T1Rio commenced in 1998 and was extendedin 2011 until 2048. Transfer of the facilities to ICTSI management is expected to take place inthe fourth quarter of 2019, once all conditions precedent and all required regulatory approvalshave been obtained.
1.3 Subsidiaries and Joint Ventures
Percentage of OwnershipPlace of Nature of Functional December 31, 2018 June 30, 2019Incorporation Business Currency Direct Indirect Direct Indirect
Subsidiaries:AsiaInternational Container Terminal Holdings, Inc.
(ICTHI) and SubsidiariesCayman Islands Holding Company US Dollar 100.00 – 100.00 –
ICTSI Ltd. Bermuda Holding Company US Dollar – 100.00 – 100.00ICTSI Mauritius Ltd. Mauritius Holding Company US Dollar – 100.00 – 100.00Aeolina Investments Limited British Virgin
IslandsHolding Company US Dollar – 100.00 – 100.00
Pakistan International Container Terminal(PICT)
Pakistan Port Management Pakistani Rupee – 64.53 – 64.53
IFEL Singapore Holding Company US Dollar – 100.00 – 100.00New Muara Container Terminal Services
Sdn Bhd (NMCTS)Brunei Port Management Brunei Dollar – 100.00 – 100.00
IJP and Subsidiaries Indonesia Maritimeinfrastructure andlogistics
US Dollar – 80.16 – 80.16
OJA Indonesia Port Management US Dollar – 80.16 – 80.16PT Makassar Terminal Services, Inc. (MTS) Indonesia Port Management Indonesian
Rupiah– 95.00 – 95.00
PT Container Terminal Systems SolutionsIndonesia
Indonesia Software Developer US Dollar – 100.00 – 100.00
ICTSI (Hong Kong) Limited Hong Kong Holding Company US Dollar – 100.00 – 100.00Yantai International Container Terminals,
Limited (YICT)China Port Management Renminbi – 51.00 – 51.00
Pentland International Holdings, Ltd. British VirginIslands
Holding Company US Dollar – 100.00 – 100.00
ICTSI Georgia Corp. Cayman Islands Holding Company US Dollar – 100.00 – 100.00Global Procurement Ltd. Bermuda Holding Company US Dollar – 100.00 – 100.00ICTSI Honduras Ltd. Bermuda Holding Company US Dollar – 100.00 – 100.00ICTSI Ltd. Regional Headquarters Philippines Regional
HeadquartersPhilippine Peso – 100.00 – 100.00
International Container Terminal Services(India) Private Limited
India Port Management Indian Rupee – 100.00 – 100.00
Container Terminal de Venezuela ContervenCA (CTVCC)
Venezuela Holding Company US Dollar – 95.00 – 95.00
ICTSI Africa (Pty) Ltd. (c) South Africa BusinessDevelopmentOffice (BDO)
South AfricanRand
– – – –
Australian International Container TerminalsLimited (AICTL)
Australia Port Management Australian Dollar – 70.00 – 70.00
Mindanao International Container TerminalServices, Inc. (MICTSI)
Philippines Port Management Philippine Peso 100.00 − 100.00 −
Abbotsford Holdings, Inc. Philippines Holding Company Philippine Peso 100.00 – 100.00 –Hijo International Port Services, Inc. (HIPS) Philippines Port Management Philippine Peso – 65.00 – 65.00DIPSSCOR Philippines Port Management Philippine Peso – 96.95 – 96.95IWI Container Terminal Holdings, Inc. (IWI
CTHI, formerly ICTSI Warehousing, Inc.)Philippines Warehousing Philippine Peso 100.00 – 100.00 –
IW Cargo Handlers, Inc. Philippines Port EquipmentRental
US Dollar – 100.00 – 100.00
Container Terminal Systems SolutionsPhilippines, Inc.
Philippines Software Developer US Dollar – 100.00 – 100.00
Bauan International Port, Inc. (BIPI) (f) Philippines Port Management Philippine Peso – 60.00 – 80.00Prime Staffers and Selection Bureau, Inc. Philippines Manpower
RecruitmentPhilippine Peso 100.00 – 100.00 –
ICTSI Subic, Inc. (ICTSI Subic) Philippines Port Management US Dollar 100.00 – 100.00 –Subic Bay International Terminal Holdings,
Inc. (SBITHI)Philippines Holding Company US Dollar 83.33 – 83.33 –

SEC Form 17-Q Q2 2019 1515
Percentage of OwnershipPlace of Nature of Functional December 31, 2018 June 30, 2019Incorporation Business Currency Direct Indirect Direct Indirect
Subic Bay International Terminal Corporation(SBITC)
Philippines Port Management US Dollar – 83.33 – 83.33
Cordilla Properties Holdings, Inc. Philippines Holding Company Philippine Peso 100.00 − 100.00 −SCIPSI Philippines Port Management Philippine Peso 35.70 14.38 35.70 14.38ICTSI Dubai United Arab
EmiratesBDO US Dollar 100.00 − 100.00 −
ICTSI Capital B.V. (ICBV) The Netherlands Holding Company US Dollar – 100.00 – 100.00Icon Logistiek B.V. The Netherlands Holding Company US Dollar – 100.00 – 100.00Royal Capital B.V. (RCBV) The Netherlands Holding Company US Dollar – 75.00 – 75.00ICTSI Cooperatief U.A. The Netherlands Holding Company US Dollar 1.00 99.00 1.00 99.00Global Container Capital, B.V. The Netherlands Holding Company US Dollar – 100.00 – 100.00ICTSI Treasury B.V. (ITBV) The Netherlands Holding Company US Dollar – 75.00 – 75.00IABV The Netherlands Holding Company US Dollar – 100.00 – 100.00ICTSI Africa B.V. The Netherlands Holding Company US Dollar – 100.00 – 100.00ICTSI Sudan B.V. (formerly ICTSI Cameroon
B.V.)The Netherlands Holding Company US Dollar – 100.00 – 100.00
CMSA B.V. The Netherlands Holding Company US Dollar – 100.00 – 100.00Tecplata B.V. The Netherlands Holding Company US Dollar – 100.00 – 100.00SPIA Colombia B.V. The Netherlands Holding Company US Dollar – 100.00 – 100.00TSSA B.V. The Netherlands Holding Company US Dollar – 100.00 – 100.00CGSA B.V. The Netherlands Holding Company US Dollar – 100.00 – 100.00SPIA Spain S.L. Spain Holding Company US Dollar – 100.00 – 100.00CGSA Transportadora S.L. Spain Holding Company US Dollar – 100.00 – 100.00Crixus Limited British Virgin
IslandsHolding Company US Dollar – 100.00 – 100.00
VICT Australia Port Management Australian Dollar – 100.00 – 100.00Asia Pacific Port Holdings Private Ltd. (c) Singapore Holding Company US Dollar – – – –ICTSI Global Finance B.V. (IGFBV) The Netherlands Holding Company US Dollar – 75.00 – 75.00IOBV The Netherlands Holding Company US Dollar – 100.00 – 100.00ICTSI Tuxpan B.V. The Netherlands Holding Company US Dollar – 100.00 – 100.00ICTSI Asia Pacific Business Services, Inc.
(APBS)Philippines Business Process
OutsourcingUS Dollar – 100.00 – 100.00
ICTSI Ltd. Regional Operating Headquarters Philippines Regional OperatingHeadquarters
US Dollar – 100.00 – 100.00
ICTSI Project Delivery Services Co. Pte. Ltd. Singapore Port Equipment Saleand Rental
US Dollar – 100.00 – 100.00
ICTSI QFC LLC Qatar Holding Company US Dollar – 100.00 – 100.00ICTSI South Asia Pte. Ltd. Singapore Holding Company US Dollar – 100.00 – 100.00Laguna Gateway Inland Container
Terminal, Inc. (LGICT)Philippines Port Management Philippine Peso – 60.00 – 60.00
ICTSI Middle East DMCC United ArabEmirates
Holding Company US Dollar – 100.00 – 100.00
ICTSI Global Cooperatief U.A. The Netherlands Holding Company US Dollar 99.00 1.00 99.00 1.00Consultports S.A. de C.V. Mexico BDO Mexican Peso – 100.00 – 100.00Asiastar Consultants Limited (a) Hong Kong Management
ServicesUS Dollar – 100.00 – 100.00
CGT Philippines Port Management Philippine Peso – 100.00 – 100.00Intermodal Terminal Holdings, Inc. Philippines Holding Company Philippine Peso 100.00 – 100.00 –ICTSI Americas B.V. (Multinational
Headquarters) (a)Panama BDO US Dollar – 100.00 – 100.00
ICTSI South Pacific Limited (a) Papua New Guinea Holding Company Papua NewGuinean Kina
– 100.00 – 100.00
MITL (a) Papua New Guinea Port Management Papua NewGuinean Kina
– 100.00 – 100.00
SPICTL (a) Papua New Guinea Port Management Papua NewGuinean Kina
– 100.00 – 100.00
Tungsten RE Ltd. (a) Bermuda Insurance Company US Dollar – 100.00 – 100.00Europe, Middle East and Africa (EMEA)Tartous International Container
Terminal, Inc. (TICT)Syria Port Management US Dollar 100.00 – 100.00 –
Madagascar International Container TerminalServices, Ltd. (MICTSL)
Madagascar Port Management Euro – 100.00 – 100.00
Baltic Container Terminal Ltd. (BCT) Poland Port Management US Dollar – 100.00 – 100.00Adriatic Gate Container Terminal (AGCT) Croatia Port Management Euro – 51.00 – 51.00Batumi International Container Terminal LLC
(BICTL)Georgia Port Management US Dollar – 100.00 – 100.00
Lekki International Container TerminalServices LFTZ Enterprise (LICTSLE)
Nigeria Port Management US Dollar – 100.00 – 100.00
ICTSI DR Congo S.A. (IDRC) DR Congo Port Management US Dollar – 52.00 – 52.00ICTSI (M.E.) DMCC Iraq Branch (ICTSI Iraq) Iraq Port Management US Dollar – 100.00 – 100.00AGT (e) Sudan Port Management Euro – – – 100.00AmericasContecon Guayaquil, S.A. (CGSA) Ecuador Port Management US Dollar 51.00 49.00 51.00 49.00Contecon Manzanillo S.A. (CMSA) Mexico Port Management US Dollar 1.00 99.00 1.00 99.00Tecon Suape, S.A. (TSSA) Brazil Port Management Brazilian Real – 100.00 – 100.00ICTSI Oregon, Inc. (ICTSI Oregon) U.S.A. Port Management US Dollar − 100.00 − 100.00C. Ultramar, S.A. Panama Holding Company US Dollar – 100.00 – 100.00Future Water, S.A. Panama Holding Company US Dollar – 100.00 – 100.00Kinston Enterprise, Inc. Panama Holding Company US Dollar – 100.00 – 100.00International Ports of South America and
Logistics SAUruguay Holding Company US Dollar − 100.00 − 100.00
Tecplata S.A. (Tecplata) Argentina Port Management US Dollar − 100.00 − 100.00Nuevos Puertos S. A. Argentina Holding Company US Dollar 4.00 96.00 4.00 96.00

SEC Form 17-Q Q2 2019 1616
Percentage of OwnershipPlace of Nature of Functional December 31, 2018 June 30, 2019Incorporation Business Currency Direct Indirect Direct Indirect
Operadora Portuaria Centroamericana,S.A. (OPC)
Honduras Port Management US Dollar 30.00 70.00 30.00 70.00
Terminal Maritima de Tuxpan, S.Ade C.V (TMT)
Mexico Port Management Mexican Peso – 100.00 – 100.00
CMSA Servicios PortuariosSA De CV (a)
Mexico Manpower Services Mexican Peso – 100.00 – 100.00
CMSA Servicios Profesionales Y DeEspecialistas SA De CV (a)
Mexico Manpower Services Mexican Peso – 100.00 – 100.00
Joint Ventures:Sociedad Puerto Industrial Aguadulce SA
(SPIA)Colombia Port Management US Dollar – 46.30 – 46.30
Falconer Aircraft Management, Inc. (FAMI) (d) Philippines AircraftManagement
Philippine Peso – 49.00 – 49.00
Associates:MNHPI (b) Philippines Port Management Philippine Peso 34.83 – 50.00 –Asiaview Realty and Development Corporation
(ARDC)Philippines Realty Philippine Peso – 49.00 – 49.00
(a) Established in 2017(b) Acquired as an associate on October 30, 2017 and additional shares were purchased effective on April 26, 2019(c) Deregistered in 2017(d) Established in 2018(e) Established in February 2019 and has not yet started commercial operations as of August 13, 2019(f) Percentage of ownership increased to 80% on April 10, 2019 due to acquisition of minority shares (see Note 15.7)
2. Basis of Preparation and Statement of Compliance
2.1 Basis of Preparation
The consolidated balance sheet as at December 31, 2018, as restated, and the unaudited interimcondensed consolidated financial statements as at June 30, 2019 and for the three and six monthsended June 30, 2018 and 2019 have been prepared on a historical cost basis, except for financialassets at fair value through other comprehensive income (FVOCI) and derivative financialinstruments which have been measured at fair value. The unaudited interim condensedconsolidated financial statements are presented in United States dollar (US dollar, USD or US$),the Parent Company’s functional and presentation currency. All values are rounded to thenearest thousand US dollar unit, except when otherwise indicated. Any discrepancies in thetables between the listed amounts and the totals thereof are due to rounding. Accordingly,figures shown as totals may not be an arithmetic aggregation of the figures that precede them.
2.2 Statement of Compliance
The unaudited interim condensed consolidated financial statements have been prepared inaccordance with Philippine Accounting Standard (PAS) 34, Interim Financial Reporting.Accordingly, the interim condensed consolidated financial statements do not include all theinformation and disclosures required in the annual audited consolidated financial statements, andshould be read in conjunction with the Group’s audited annual consolidated financial statementsas at and for the year ended December 31, 2018.
3. Summary of Significant Accounting Policies
3.1 Basis of Consolidation
The unaudited interim condensed consolidated financial statements of the Group include theaccounts of ICTSI and its subsidiaries where the Parent Company has control. Control isachieved when the Group is exposed, or has rights, to variable returns from its involvement withthe investee and has the ability to affect those returns through its power over the investee.
SEC Form 17-Q Q2 2019 1717
Specifically, the Group controls an investee if and only if the Group has: Power over the investee (i.e., existing rights that give it the current ability to direct the
relevant activities of the investee), Exposure, or rights, to variable returns from its involvement with the investee, and The ability to use its power over the investee to affect its returns.
When the Group has less than a majority of the voting or similar rights of an investee, the Groupconsiders all relevant facts and circumstances in assessing whether it has power over an investee,including: The contractual arrangement with the other vote holders of the investee, Rights arising from other contractual arrangements, and The Group’s voting rights and potential voting rights.
The Group re-assesses whether or not it controls an investee if facts and circumstances indicatethat there are changes to one or more of the three elements of control.
Subsidiaries. Subsidiaries are entities controlled by the Parent Company. Subsidiaries areconsolidated from the date of acquisition or incorporation, being the date on which the Groupobtains control, and continue to be consolidated until the date such control ceases.
Non-controlling Interests. Non-controlling interests represent the portion of profit or loss andnet assets in PICT, MTS, AICTL, CTVCC, SBITC, SBITHI, BIPI, DIPSSCOR, YICT, SCIPSI,RCBV, AGCT, IJP, OJA, ITBV, HIPS, IGFBV, IDRC and LGICT not held by the Group andare presented separately in the unaudited interim consolidated statement of income and theunaudited interim consolidated statement of comprehensive income, and interim consolidatedbalance sheet separate from equity attributable to equity holders of the parent.
An acquisition, transfer or sale of a non-controlling interest is accounted for as an equitytransaction. No gain or loss is recognized in an acquisition of a non-controlling interest. Thedifference between the fair value of the consideration and book value of the share in the netassets acquired is presented under “Excess of acquisition cost over the carrying value ofnon-controlling interests” account within the equity section of the unaudited interimconsolidated balance sheet. If the Group loses control over a subsidiary, it: (i) derecognizes theassets (including goodwill) and liabilities of the subsidiary, the carrying amount of any non-controlling interest and the cumulative translation differences recorded in equity; (ii) recognizesthe fair value of the consideration received, the fair value of any investment retained and anysurplus or deficit in the unaudited interim consolidated statement of income; and (iii) reclassifiesthe Parent Company’s share of components previously recognized in other comprehensiveincome to the unaudited interim consolidated statement of income or retained earnings, asappropriate.
Transactions Eliminated on Consolidation. All intragroup transactions and balances includingincome and expenses, and unrealized gains and losses are eliminated in full.
Accounting Policies of Subsidiaries. The financial statements of subsidiaries are prepared forthe same reporting period or year using uniform accounting policies as those of the ParentCompany.
Functional and Presentation Currency. The unaudited interim condensed consolidated financialstatements are presented in US dollar, which is ICTSI’s functional and presentation currency.Each entity in the Group determines its own functional currency, which is the currency that bestreflects the economic substance of the underlying events and circumstances relevant to thatentity, and items included in the financial statements of each entity are measured using thatfunctional currency.

SEC Form 17-Q Q2 2019 1818
At the reporting date, the assets and liabilities of subsidiaries whose functional currency is notUS dollar are translated into the presentation currency of ICTSI using the Bloomberg closingrate at balance sheet date and, their unaudited interim statements of income are translated at theBloomberg weighted average daily exchange rates for the period. The exchange differencesarising from the translation are taken directly to the unaudited interim consolidated statement ofcomprehensive income. Upon disposal of the foreign entity, the deferred cumulative translationamount recognized in the unaudited interim consolidated statement of comprehensive incomerelating to that particular foreign operation is recognized in the unaudited interim consolidatedstatement of income.
The following rates of exchange have been adopted by the Group in translating foreign currencyincome statement and balance sheet items as at and for the six months ended June 30:
2018 2019Closing Average Closing Average
Foreign currency to 1 unit of US dollar:Argentine peso (AR$) 28.93 21.63 42.48 41.46Australian dollar (AUD) 1.35 1.30 1.42 1.42Brazilian real (BRL or R$) 3.88 3.43 3.85 3.84Chinese renminbi (RMB) 6.62 6.37 6.87 6.79Colombian peso (COP) 2,931.61 2,848.75 3,211.36 3,188.99Croatian kuna (HRK) 6.32 6.13 6.51 6.57Euro (EUR or €) 0.86 0.83 0.88 0.89Georgian lari (GEL) 2.45 2.47 2.85 2.70Honduran lempira (HNL) 24.03 23.70 24.59 24.48Hong Kong dollar (HKD) 7.85 7.84 7.81 7.84Indian rupee (INR) 68.47 65.74 69.03 70.03Indonesian rupiah (IDR or Rp) 14,330.00 13,748.00 14,126.00 14,194.00Iraqi dinar (IQD) 1,187.58 1,187.44 1,182.28 1,190.32Malagasy ariary (MGA) 3,374.57 3,246.22 3,651.00 3,609.19Mexican peso (MXN) 19.91 19.07 19.22 19.15Pakistani rupee (PKR or Rs) 121.58 114.33 159.52 143.43Papua New Guinean kina (PGK) 3.29 3.25 3.39 3.37Philippine peso (P=) 53.34 51.95 51.24 52.22Polish zloty (PLN) 3.74 3.49 3.73 3.80Singaporean dollar (SGD) 1.36 1.33 1.35 1.36Sudanese pound (SDG) - - 45.23 46.76
Revenue from Contracts with Customers. The Group applied the following judgements thatsignificantly affect the determination of the amount and timing of revenue from contracts withcustomers: Identifying performance obligations
The Group provides port services, mainly cargo handling, to its customers. The Group hasdetermined that each of the services are capable of being distinct.
Determining the transaction priceThe Group determined that the transaction price is in accordance with the tariff ratespublished by port authorities in certain jurisdictions or agreed rates with the customers.
Determining the timing of satisfaction of port servicesThe Group concluded that the revenue for port operations is to be recognized when theservices are rendered.
Definition of Default and Credit-impaired Financial Assets. The Group defines a financialinstrument as in default, which is fully aligned with the definition of credit-impaired, when acustomer is more than 120 days past due on its contractual obligations. However, in certaincases, the Group may also consider a financial asset to be in default when internal or externalinformation indicates that the Group is unlikely to receive the outstanding contractual amountsin full.

SEC Form 17-Q Q2 2019 1919
The criteria above have been applied to all financial instruments held by the Company and areconsistent with the definition of default used for internal credit risk management purposes. Thedefault definition has been applied consistently to calculate Company’s expected loss.
An instrument is considered to be no longer in default (i.e. to have cured) when it no longermeets any of the default criteria.
Measurement of Expected Credit Losses (ECL). ECLs are derived from unbiased andprobability-weighted estimates of expected loss, and are based on the difference between thecontractual cash flows due in accordance with the contract and all the cash flows that the Groupexpects to receive, discounted at the original effective interest rate, or an approximation thereof.The expected cash flows will include cash flows from the sale of collateral held or other creditenhancements that are integral to the contractual terms.Leases. At the inception of the lease, the Group assesses whether a contract is, or contains, alease. This assessment involves the exercise of judgment about whether it depends on aspecified asset, whether the Group obtains substantially all the economic benefits from the use ofthe asset and whether the Group has the right to direct the use of the asset.
The Group recognizes a right-of-use (ROU) asset and a lease liability at the commencement ofthe lease. The ROU assets are measured at cost, less any accumulated depreciation andimpairment losses, and adjusted for any remeasurement of lease liabilities. The cost of ROUasset includes the present value of lease payments (including upfront fees and periodic fixedpayments), plus initial direct cost and the cost of obligations to refurbish the assets, less anylease incentives received.
The ROU is depreciated on a straight-line basis over the shorter of the lease term or the usefullife of the underlying asset. The ROU is subject to test for impairment if there are indicators forimpairment.
The lease payments include fixed payments (including in-substance fixed payments) less anylease incentives receivable, variable lease payments that depend on an index or a rate, andamounts expected to be paid under residual value guarantees. The lease payments also includethe exercise price of a purchase option reasonably certain to be exercised by the Group andpayments of penalties for terminating a lease, if the lease term reflects the Group exercising theoption to terminate. The variable lease payments that do not depend on an index or a rate arerecognized as expense in the period on which the event or condition that triggers the paymentoccurs.
Lease liabilities are measured at the present value of lease payments to be made over the leaseterm.
In calculating the present value of lease payments, the Group uses the incremental borrowingrate at the lease commencement date if the interest rate implicit in the lease is not readilydeterminable. After the commencement date, the amount of lease liabilities is increased to reflectthe accretion of interest and reduced for the lease payments made. In addition, the carryingamount of lease liabilities is remeasured if there is a modification, a change in the lease term, achange in the in-substance fixed lease payments or a change in the assessment to purchase theunderlying asset.
The Group has elected not to recognize ROU assets and liabilities for leases with terms of lessthan or equal to 12 months, or for leases of low value assets. The payments for such leases arerecognized in the statement of income on a straight-line basis over the lease term.

SEC Form 17-Q Q2 2019 2020
3.2 Changes in Accounting Policies
3.2.1 New and Amended Standards Adopted in 2019
The accounting policies adopted for the unaudited interim condensed consolidated financialstatements are consistent with those followed in the preparation of the Group’s annualconsolidated financial statements as at and for the year ended December 31, 2018 except that theGroup has adopted the following new and amended standards starting January 1, 2019:
Amendments to PFRS 9, Prepayment Features with Negative CompensationUnder PFRS 9, a debt instrument can be measured at amortized cost or at fair value throughother comprehensive income, provided that the contractual cash flows are ‘solely paymentsof principal and interest on the principal amount outstanding’ (the SPPI criterion) and theinstrument is held within the appropriate business model for that classification. Theamendments to PFRS 9 clarify that a financial asset passes the SPPI criterion regardless ofthe event or circumstance that causes the early termination of the contract and irrespective ofwhich party pays or receives reasonable compensation for the early termination of thecontract. The amendments should be applied retrospectively and are effective fromJanuary 1, 2019, with earlier application permitted. The adoption of these amendments didnot result in any significant impact on the unaudited interim condensed consolidatedfinancial statements.
PFRS 16, LeasesPFRS 16 sets out the principles for the recognition, measurement, presentation anddisclosure of leases and requires lessees to account for all leases under a single on-balancesheet model similar to the accounting for finance leases under PAS 17, Leases. The standardincludes two recognition exemptions for lessees - leases of ‘low-value’ assets and short-termleases (i.e., leases with a lease term of 12 months or less). At the commencement date of alease, a lessee shall recognize a liability to deliver lease payments (i.e., the lease liability)and an asset representing the right to use the underlying asset during the lease term (i.e., theright-of-use asset). Lessees are required to separately recognize the interest expense on thelease liability and the depreciation expense on the right-of-use asset.
Lessees shall be required to remeasure the lease liability upon the occurrence of certainevents (e.g., a change in the lease term, a change in future lease payments resulting from achange in an index or rate used to determine those payments). The lessee generallyrecognizes the amount of the remeasurement of the lease liability as an adjustment to theright-of-use asset.
Lessor accounting under PFRS 16 is substantially similar as compared with the accountingunder PAS 17. Lessors will continue to classify all leases using the same classificationprinciple as in PAS 17 and distinguish between two types of leases: operating and financeleases.
PFRS 16 also requires lessees and lessors to provide more disclosures than under PAS 17.
PFRS 16 supersedes PAS 17 Leases, Philippine Interpretation IFRIC 4 Determining whetheran Arrangement contains a Lease, Standard Interpretations Committee (SIC)-15 OperatingLeases-Incentives and SIC-27 Evaluating the Substance of Transactions Involving the LegalForm of a Lease.
The Group adopted PFRS 16 using the full retrospective method of adoption with the date ofinitial application of January 1, 2019. The Group also elected to use the recognitionexemptions for lease contracts that, at the commencement date, have a lease term of12 months or less and do not contain a purchase option (‘short-term leases’), and leasecontracts for which the underlying asset is of low value (‘low-value assets’).

SEC Form 17-Q Q2 2019 2121
The effect of adoption of PFRS 16 are as follows (amounts in thousands):
Impact on the consolidated balance sheet as at December 31, 2018
Increase(decrease)
AssetsProperty and equipment - net US$136Right-of-use assets - net 523,328Deferred tax assets 89,775Total Assets 613,239
EquityRetained earnings (482,715)Cumulative translation adjustments 159,248Total Equity (323,467)
LiabilitiesAccounts payable and other current liabilities (1,621)Current portion of lease liabilities 9,033Lease liabilities - net of current portion 1,122,563Deferred tax liabilities (46,464)Other noncurrent liabilities (146,805)Total Liabilities US$936,706
Impact on the consolidated statements of income
Increase (decrease)For the three
months endedJune 30, 2018
For the sixmonths endedJune 30, 2018
Port Authorities' share in gross revenues (US$5,497) (US$11,754)Equipment and facilities-related expenses (21,268) (44,779)Depreciation and amortization 6,924 14,276Interest expense on lease liabilities 26,050 53,131Income before income tax (6,209) (10,874)Benefit from deferred income tax (1,970) (3,450)Net income (US$4,239) (US$7,424)
Attributable to equity holders of the parent (US$4,239) (US$7,424)
Impact on earnings per share
Increase (decrease)For the three
months endedJune 30, 2018
For the sixmonths endedJune 30, 2018
BasicDiluted
(US$0.002)(US$0.002)
(US$0.004)(US$0.003)
Impact on the consolidated statement of cash flows for the six months ended June 30, 2018
Increase (decrease)Net cash flows from operating activities US$25,560Net cash flows from financing activities (25,560)
SEC Form 17-Q Q2 2019 2222
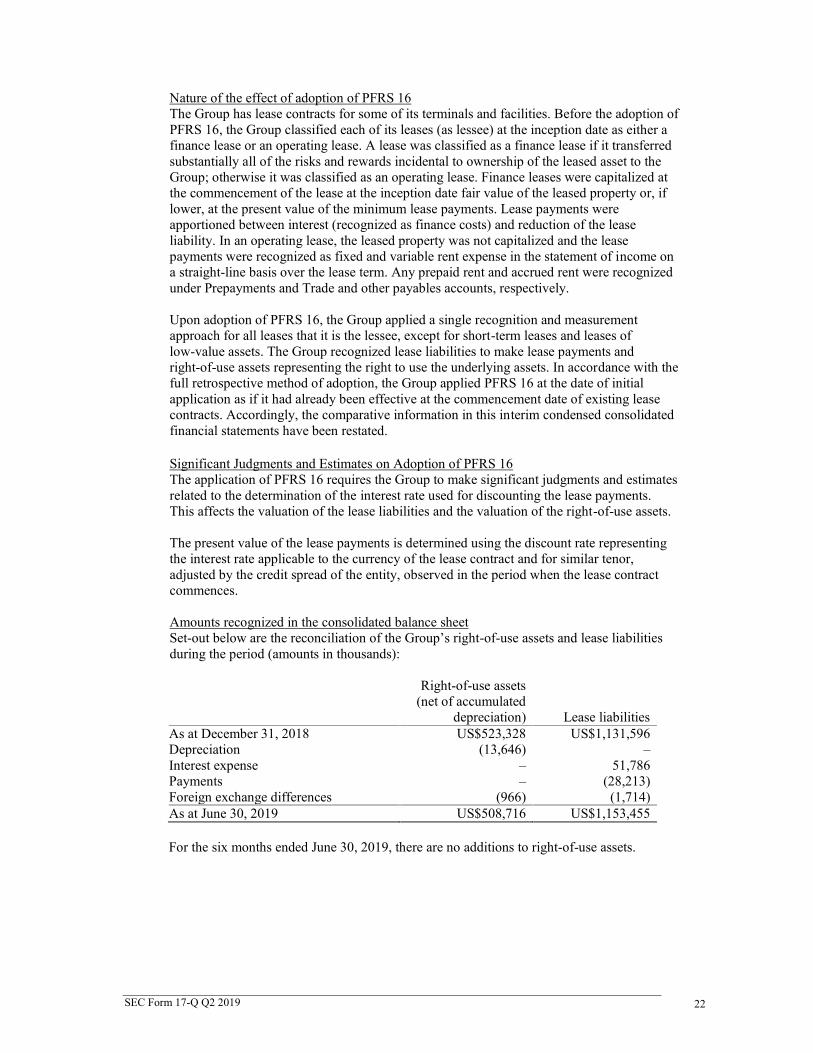
Nature of the effect of adoption of PFRS 16The Group has lease contracts for some of its terminals and facilities. Before the adoption ofPFRS 16, the Group classified each of its leases (as lessee) at the inception date as either afinance lease or an operating lease. A lease was classified as a finance lease if it transferredsubstantially all of the risks and rewards incidental to ownership of the leased asset to theGroup; otherwise it was classified as an operating lease. Finance leases were capitalized atthe commencement of the lease at the inception date fair value of the leased property or, iflower, at the present value of the minimum lease payments. Lease payments wereapportioned between interest (recognized as finance costs) and reduction of the leaseliability. In an operating lease, the leased property was not capitalized and the leasepayments were recognized as fixed and variable rent expense in the statement of income ona straight-line basis over the lease term. Any prepaid rent and accrued rent were recognizedunder Prepayments and Trade and other payables accounts, respectively.
Upon adoption of PFRS 16, the Group applied a single recognition and measurementapproach for all leases that it is the lessee, except for short-term leases and leases oflow-value assets. The Group recognized lease liabilities to make lease payments andright-of-use assets representing the right to use the underlying assets. In accordance with thefull retrospective method of adoption, the Group applied PFRS 16 at the date of initialapplication as if it had already been effective at the commencement date of existing leasecontracts. Accordingly, the comparative information in this interim condensed consolidatedfinancial statements have been restated.
Significant Judgments and Estimates on Adoption of PFRS 16The application of PFRS 16 requires the Group to make significant judgments and estimatesrelated to the determination of the interest rate used for discounting the lease payments.This affects the valuation of the lease liabilities and the valuation of the right-of-use assets.
The present value of the lease payments is determined using the discount rate representingthe interest rate applicable to the currency of the lease contract and for similar tenor,adjusted by the credit spread of the entity, observed in the period when the lease contractcommences.
Amounts recognized in the consolidated balance sheetSet-out below are the reconciliation of the Group’s right-of-use assets and lease liabilitiesduring the period (amounts in thousands):
Right-of-use assets(net of accumulated
depreciation) Lease liabilitiesAs at December 31, 2018 US$523,328 US$1,131,596Depreciation (13,646) –Interest expense – 51,786Payments – (28,213)Foreign exchange differences (966) (1,714)As at June 30, 2019 US$508,716 US$1,153,455
For the six months ended June 30, 2019, there are no additions to right-of-use assets.
SEC Form 17-Q Q2 2019 2323
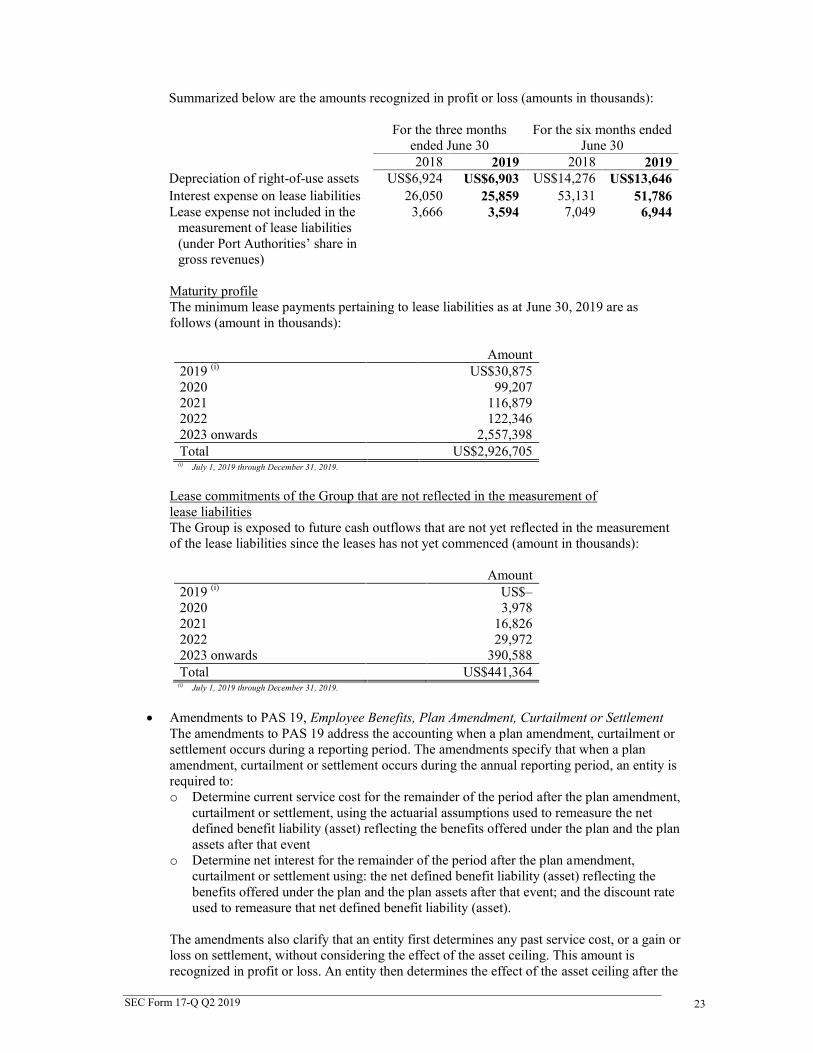
Summarized below are the amounts recognized in profit or loss (amounts in thousands):
For the three monthsended June 30
For the six months endedJune 30
2018 2019 2018 2019Depreciation of right-of-use assets US$6,924 US$6,903 US$14,276 US$13,646Interest expense on lease liabilities 26,050 25,859 53,131 51,786Lease expense not included in the
measurement of lease liabilities(under Port Authorities’ share ingross revenues)
3,666 3,594 7,049 6,944
Maturity profileThe minimum lease payments pertaining to lease liabilities as at June 30, 2019 are asfollows (amount in thousands):
Amount2019 (i) US$30,8752020 99,2072021 116,8792022 122,3462023 onwards 2,557,398Total US$2,926,705
(i) July 1, 2019 through December 31, 2019.
Lease commitments of the Group that are not reflected in the measurement oflease liabilitiesThe Group is exposed to future cash outflows that are not yet reflected in the measurementof the lease liabilities since the leases has not yet commenced (amount in thousands):
Amount2019 (i) US$–2020 3,9782021 16,8262022 29,9722023 onwards 390,588Total US$441,364
(i) July 1, 2019 through December 31, 2019.
Amendments to PAS 19, Employee Benefits, Plan Amendment, Curtailment or SettlementThe amendments to PAS 19 address the accounting when a plan amendment, curtailment orsettlement occurs during a reporting period. The amendments specify that when a planamendment, curtailment or settlement occurs during the annual reporting period, an entity isrequired to:o Determine current service cost for the remainder of the period after the plan amendment,
curtailment or settlement, using the actuarial assumptions used to remeasure the netdefined benefit liability (asset) reflecting the benefits offered under the plan and the planassets after that event
o Determine net interest for the remainder of the period after the plan amendment,curtailment or settlement using: the net defined benefit liability (asset) reflecting thebenefits offered under the plan and the plan assets after that event; and the discount rateused to remeasure that net defined benefit liability (asset).
The amendments also clarify that an entity first determines any past service cost, or a gain orloss on settlement, without considering the effect of the asset ceiling. This amount isrecognized in profit or loss. An entity then determines the effect of the asset ceiling after the

SEC Form 17-Q Q2 2019 2424
plan amendment, curtailment or settlement. Any change in that effect, excluding amountsincluded in the net interest, is recognized in other comprehensive income.
The amendments apply to plan amendments, curtailments, or settlements occurring on orafter the beginning of the first annual reporting period that begins on or afterJanuary 1, 2019, with early application permitted. The Group adopted the amendmentseffective January 1, 2019 and will apply on future plan amendments, curtailments, orsettlements.
Amendments to PAS 28, Long-term Interests in Associates and Joint VenturesThe amendments clarify that an entity applies PFRS 9 to long-term interests in an associateor joint venture to which the equity method is not applied but that, in substance, form part ofthe net investment in the associate or joint venture (long-term interests). This clarification isrelevant because it implies that the expected credit loss model in PFRS 9 applies to suchlong-term interests.
The amendments also clarified that, in applying PFRS 9, an entity does not take account ofany losses of the associate or joint venture, or any impairment losses on the net investment,recognized as adjustments to the net investment in the associate or joint venture that arisefrom applying PAS 28, Investments in Associates and Joint Ventures.
The amendments should be applied retrospectively and are effective from January 1, 2019,with early application permitted. The amendments did not have a significant impact on theunaudited interim condensed consolidated financial statements.
Philippine Interpretation IFRIC-23, Uncertainty over Income Tax TreatmentsThe interpretation addresses the accounting for income taxes when tax treatments involveuncertainty that affects the application of PAS 12, Income Taxes, and does not apply to taxesor levies outside the scope of PAS 12, nor does it specifically include requirements relatingto interest and penalties associated with uncertain tax treatments.
The interpretation specifically addresses the following:o Whether an entity considers uncertain tax treatments separatelyo The assumptions an entity makes about the examination of tax treatments by
taxation authoritieso How an entity determines taxable profit (tax loss), tax bases, unused tax losses,
unused tax credits and tax rateso How an entity considers changes in facts and circumstances
An entity must determine whether to consider each uncertain tax treatment separately ortogether with one or more other uncertain tax treatments. The approach that better predictsthe resolution of the uncertainty should be followed.
The Group adopted the amendments and shall continue to assess the impact in accordancewith the requirements of the said amendments.

SEC Form 17-Q Q2 2019 2525
4. Segment Information
A segment is a distinguishable component of the Group that is engaged either in providing typesof services (business segment) or in providing the services within a particular economicenvironment (geographic segment).
The Group operates principally in one industry segment, which is cargo handling and relatedservices. ICTSI has organized its business into three geographical segments:
Asia - includes Manila International Container Terminal (MICT), BIPI, DIPSSCOR,SCIPSI, SBITC, ICTSI Subic, HIPS, MICTSI, LGICT, CGT and MNHPI in the Philippines;YICT in China; OJA, and MTS in Indonesia; VICT in Australia; NMCTS in Brunei; PICTin Pakistan; MITL and SPICTL in PNG; and AICTL, ICTHI, ICTSI Ltd. and other holdingcompanies and those companies incorporated in The Netherlands for the purpose ofsupporting the funding requirements of the Group;
EMEA - includes BCT in Poland, BICTL in Georgia, AGCT in Croatia, MICTSL inMadagascar, LICTSLE in Nigeria, TICT in Syria, IDRC in DR Congo, ICTSI Iraq in Iraqand AGT in Sudan; and
Americas - includes TSSA in Brazil, CGSA in Ecuador, SPIA in Colombia, Tecplata inArgentina, CMSA, TMT, CMSA Servicios Portuarios SA De CV and CMSA ServiciosProfesionales Y De Especialistas SA De CV in Mexico, OPC in Honduras and ICTSIOregon in Oregon, U.S.A.
Management monitors the operating results of its operating unit separately for making decisionsabout resource allocation and performance assessment. The Group evaluates segmentperformance based on contributions to gross revenues, which is measured consistently withgross revenues from port operations in the interim condensed consolidated statements of income.
Financing is managed on a group basis and centralized at the Parent Company level or at theentities created solely for the purpose of obtaining funds for the Group. Funding requirementsthat are secured through debt are recognized as liabilities of the Parent Company or of the entityissuing the debt instrument, classified under the geographical region of Asia and are notallocated to other geographical segments where funds are eventually transferred and used.The table below presents financial information on geographical segments as ofDecember 31, 2018 (restated) and as of June 30, 2019 (unaudited) and for the three and sixmonths June 30, 2018 (unaudited and restated) and 2019 (unaudited):
2018 (Restated - Note 3)As at and for the Three Months Ended June 30 As at and for the Six Months Ended June 30
Asia EMEA Americas Consolidated Asia EMEA Americas Consolidated
Volume (a) 1,253,784 384,809 750,122 2,388,715 2,495,093 772,190 1,446,972 4,714,255
Gross revenues US$161,697 US$71,461 US$103,226 US$336,384 US$316,735 US$140,439 US$204,590 US$661,764Capital expenditures (b) 33,165 16,616 18,000 67,781 57,952 37,707 40,347 136,006Other information:
Segment assets (c) 3,092,967 512,643 1,462,498 5,068,108 3,092,967 512,643 1,462,498 5,068,108Segment liabilities (d) 2,416,649 145,107 759,191 3,320,947 2,416,649 145,107 759,191 3,320,947
2019 (Unaudited)As at and for the Three Months Ended June 30 As at and for the Six Months Ended June 30Asia EMEA Americas Consolidated Asia EMEA Americas Consolidated
Volume (a) 1,354,478 456,377 752,389 2,563,244 2,653,248 890,664 1,498,004 5,041,916
Gross revenues US$182,711 US$78,753 US$106,537 US$368,001 378,959 154,274 218,552 US$751,785Capital expenditures (b) 33,211 12,257 22,080 67,548 55,215 33,916 32,662 121,793Other information:
Segment assets (c) 2,973,382 1,008,948 1,466,254 5,448,584 2,973,382 1,008,948 1,466,254 5,448,584Segment liabilities (d) 3,058,530 138,385 758,950 3,955,865 3,058,530 138,385 758,950 3,955,865

SEC Form 17-Q Q2 2019 2626
(a) Measured in TEUs.
(b) Capital expenditures include amount disbursed for the acquisition of port facilities and equipment classified as intangibles under IFRIC 12 andproperty and equipment as shown in the unaudited interim consolidated statement of cash flows.
(c) Segment assets do not include deferred tax assets amounting to US$248.1 million and US$266.2 million as at December 31, 2018 (restated) andJune 30, 2019 (unaudited), respectively.
(d) Segment liabilities do not include income tax payable amounting to US$31.6 million and US$34.7 million and deferred tax liabilities amounting toUS$57.9 million and US$64.5 million as at December 31, 2018 (restated) and June 30, 2019 (unaudited), respectively.
Moreover, management monitors the Group’s earnings before interest, taxes, depreciation andamortization (EBITDA) on a consolidated basis for decision-making purposes. The followingtable shows the computation of EBITDA as derived from the unaudited interim consolidated netincome attributable to equity holders of the parent for the three and six months ended June 30:
For the Three Months Ended June 30 For the Six Months Ended June 302018
(Restated - Note 3) 20192018
(Restated - Note 3) 2019Net income attributable to equity
holders of the parent US$49,358 US$56,067 US$90,242 US$128,470Non-controlling interests 6,849 8,498 13,662 17,600Provision for income tax 8,233 18,560 16,204 40,398Income before income tax 64,440 83,125 120,108 186,468Add (deduct):
Depreciation and amortization 54,879 57,833 109,509 115,225Interest and other expenses (a) 73,281 73,928 149,973 145,883Interest and other income (b) (14,077) (13,030) (23,528) (23,177)
EBITDA (c) US$178,523 US$201,856 US$356,062 US$424,399
(a) Interest and other expenses include the following as shown in the unaudited interim consolidated statementsof income: foreign exchange loss; interest expense on concession rights payable; interest expense andfinancing charges on borrowings; interest expense on lease liabilities; equity in net loss of joint ventures andan associate; and other expenses.
(b) Interest and other income include the following as shown in the unaudited interim consolidated statements ofincome: foreign exchange gain; interest income; and other income.
(c) EBITDA is not a uniform or legally defined financial measure. EBITDA is presented because the Groupbelieves it is an important measure of its performance and liquidity. EBITDA is also frequently used bysecurities analysts, investors and other interested parties in the evaluation of companies in the industry.The Group EBITDA figures are not; however, readily comparable with other companies’ EBITDA figures asthese may be calculated differently thus, must be read in conjunction with related additional explanations.EBITDA has limitations as an analytical tool and should not be considered in isolation or as a substitute foranalysis of the Group’s results as reported under PFRS. Some of the limitations concerning EBITDA are: EBITDA does not reflect cash expenditures or future requirements for capital expenditures or contractual
commitments; EBITDA does not reflect changes in, or cash requirements for working capital needs; EBITDA does not reflect the interest expense, or cash requirements necessary to service interest or
principal debt payments; Although depreciation and amortization are non-cash charges, the assets being depreciated or amortized
will often have to be replaced in the future, and EBITDA does not reflect any cash requirements for suchreplacements; and
Other companies in the industry may calculate EBITDA differently, which may limit its usefulness as acomparative measure.
Because of these limitations, EBITDA should not be considered as a measure of discretionary cash availableto the Group to invest in the growth of the business. The Group compensates for these limitations by relyingprimarily on PFRS results and uses EBITDA only as supplementary information.
All segment revenues are from external customers. Gross revenues from port operations ofICTSI and other Philippine-based subsidiaries comprised 34.8% and 36.0% of the unauditedconsolidated gross revenues from port operations for the three months ended June 30, 2018 and2019, respectively, and 35.1% and 37.2% of the unaudited consolidated gross revenues fromport operations for the six months ended June 30, 2018 and 2019, respectively. Gross revenuesfrom port operations outside the Republic of the Philippines comprised 65.2% and 64.0% of theunaudited consolidated gross revenues from port operations for the three months endedJune 30, 2018 and 2019, respectively, and 64.9% and 62.8% of the unaudited consolidated grossrevenues from port operations for the six months ended June 30, 2018 and 2019, respectively.

SEC Form 17-Q Q2 2019 2727
5. Concession Rights and Concession Rights Payable
5.1 Concession Rights
Concession rights are presented as part of intangibles in the interim consolidated balance sheet.Concession rights include upfront fee payments recognized on the concession contracts, cost ofport infrastructure constructed and port equipment purchased, and present value of future fixedfee considerations in exchange for the license or right to operate ports. Concession rights areamortized over the term of the concession agreements.
Additions to concession rights under port infrastructure mainly pertain to construction of variouscivil works and acquisitions of port facilities and equipment in ICTSI, BGT and PNG entities forthe six months ended June 30, 2019.
Borrowing costs capitalized amounted to US$0.7 million for the six months ended June 30, 2018with capitalization rates ranging from 2.90 to 7.0 percent and US$1.3 million for the six monthsended June 30, 2019 with capitalization rate of 7.0 percent.
5.2 Concession Rights Payable
Upon recognition of the fair value of fixed fee on concession contracts, the Group alsorecognized the corresponding concession rights payable. The maturities of the carrying amountof concession rights payable as at June 30, 2019 arising from the capitalization of fixed fees areas follows (amount in thousands):
Amount2019 (1) US$3,6172020 16,0712021 18,9632022 20,5212023 onwards 473,277Total US$532,449
(1) July 1, 2019 through December 31, 2019.
Total fixed portion of port fees paid by the Group for the three and six months endedJune 30, 2018 and 2019 amounted to US$43.3 million and US$14.6 million andUS$55.1 million and US$29.1 million, respectively. These port fees are allocated to paymentsof interest and reduction to or payments of concession rights payable.
Interest expense on concession rights payable amounted to US$9.0 million and US$10.0 millionand US$17.0 million and US$20.0 million for the three and six months ended June 30, 2018 and2019, respectively. The annualized weighted average interest rate was 8.18% and 7.51% as atJune 30, 2018 and 2019, respectively.
Reduction to concession rights payable, shown as payments to concession rights in the interimunaudited consolidated statement of cash flows for the six months ended June 30, 2018 and 2019amounted to US$38.1 million and US$9.2 million, respectively.
Concession fees that were not included in the measurement of concession rights payable werecharged to profit or loss under Port Authorities’ share in gross revenues amounting toUS$37.3 million and US$41.2 million and US$75.0 million and US$85.9 million for the threeand six months ended June 30, 2018 and 2019, respectively.
SEC Form 17-Q Q2 2019 2828
6. Property and Equipment
Property and equipment increased due to construction of various civil works and acquisitions ofterminal equipment in various ports, mainly in BGT and CMSA as at June 30, 2019. There wereno major disposals or write-downs of property and equipment for the six months endedJune 30, 2018 and 2019.
7. Other Noncurrent Assets
This account includes noncurrent portion of input tax, advances to suppliers and contractors,restricted cash, deposits for the acquisition of investments, AFS investments and noncurrentportion of derivative assets, among others. This account increased in 2019 mainly due toincrease in deposits required for the acquisition of a concession contract.
Pursuant to the Concession Agreement signed with SPC of Sudan, ICTSI was required to pay anupfront fee. On January 13, 2019, ICTSI paid the initial installment of Upfront Fee ofEUR410.0 million (US$470.2 million). On July 3, 2019, ICTSI received a partial repayment ofthe Upfront Fee in the amount of EUR195.2 million (US$220.2 million) based on the bond (seeNote 1).
8. Investments in and Advances to Joint Ventures and Associates
This account mainly pertains to ICTSI’s investment in and advances to SPIA and investment inMNHPI and FAMI. This account increased in 2019 mainly due to acquisition of additionalshares in MNHPI from HCPTI.
On September 21, 2017, ICTSI signed an SPA with Petron Corporation for the acquisition of10,449,000 MNHPI shares, representing 34.83 percent of the total issued and outstanding sharesof MNHPI for a consideration of Php1.75 billion (US$33.8 million). The completion of the SPAwas subject to several conditions, one of which was the approval of the acquisition by the PPA.The SPA was completed on October 30, 2017. An additional investment cost of Php2.45 billion(US$47.3 million) was incurred in relation to this acquisition.
On September 5, 2018, ICTSI has signed an SPA with HCPTI for the acquisition of 4,550,000shares in MNHPI from HCPTI. The subject shares represent 15.17% of the total issued andoutstanding shares of MNHPI. The consideration is Php910.0 million (US$17.3 million). ThePhilippine Competition Commission and the PPA approved the acquisition of shares on March15, 2019 and April 26, 2019, respectively. With the approval of the PPA, ICTSI's shareholdingsin MNHPI increased from 34.83% to 50% effective on April 26, 2019. An additionalinvestment cost of Php2.7 billion (US$50.3 million) was incurred in relation to this acquisition.
The Group has a 49 percent investment in FAMI. FAMI was established in March 2018.

SEC Form 17-Q Q2 2019 2929
9. Cash and Cash Equivalents
For the purpose of unaudited interim consolidated statements of cash flows, balances of cash andcash equivalents as at June 30 were as follows:
2018(Unaudited)
2019(Unaudited)
Cash on hand and in banks US$148,955 US$174,319Cash equivalents 252,583 121,266
US$401,538 US$295,585
Cash in banks earns interest at the prevailing bank deposit rates. Cash equivalents are short-terminvestments, which are made for varying periods of up to three months depending on theimmediate cash requirements of the Group and earn interest at the prevailing short-terminvestment rates.
10. Receivables
This account consists of:
December 31,2018
June 30, 2019(Unaudited)
Trade US$113,688 US$101,598Advances and nontrade 14,704 18,110
128,392 119,708Less allowance for doubtful accounts 7,968 10,055
US$120,424 US$109,653
Trade receivables are noninterest-bearing and are generally on 30-60 days’ credit terms.
Advances and nontrade receivables mainly include noninterest-bearing advances to suppliersand vendors that may be applied against payable or collectible within 12 months.
11. Prepaid Expenses and Other Current Assets
This account includes input tax, tax credits, creditable withholding taxes, and prepaid port fees,insurance, bonds and other expenses.
12. Long-term Debt and Loans Payable
12.1 Maturities of Long-term Debt
Maturities of long-term debt, net of unamortized debt issuance costs, premium and discount ofUS$47.9 million, as at June 30, 2019 are as follows (amount in thousands):
Amount2019 (1) US$26,7502020 236,3292021 33,4692022 321,7972023 and onwards 1,218,108Total US$1,836,453
(1) July 1, 2019 through December 31, 2019.

SEC Form 17-Q Q2 2019 3030
12.2 US Dollar-denominated Loans
On March 29, 2016, CGSA (as “Borrower”), Metropolitan Bank and Trust Company (as“Lender” or “MBTC”) and ICTSI (as “Surety”) signed a loan agreement which consists of twotranches of US$32.5 million (Tranche I) and US$7.5 million (Tranche II) with interest based onthree-month London Inter-bank Offered Rate (LIBOR) plus an agreed margin. Tranche I has afinal maturity in March 2021 and Tranche II in May 2017. In 2016, CGSA availed of loans witha total amount of US$40.0 million. Portion of the proceeds of these loans was used to refinancethe unsecured term loans of CGSA amounting to US$9.2 million in April 2016. In 2017, CGSAfully paid the loan under Tranche II. In 2019, CGSA has paid a total amount of US$3.8 millionof the loan under Tranche I. As at June 30, 2019, the outstanding balance of the loan withMBTC amounted to US$13.4 million.
On July 11, 2017, OPC (as “Borrower”), Metropolitan Bank and Trust Company (as “Lender”)and ICTSI (as “Surety”) signed a loan agreement amounting to US$77.0 million with interestbased on three-month LIBOR plus an agreed margin and maturity date of July 2020. Proceedsof the loan was used to finance capital expenditures. OPC availed US$39.5 million out of theUS$77.0 million term loan facility. In 2019, OPC paid US$10.0 million of the loan. As atJune 30, 2019, the outstanding balance of the loan amounted to US$19.5 million.
On October 9, 2018, IDRC availed of a four-year term loan with Rawbank DRC amounting toUS$25.0 million at a fixed interest rate. In 2019, IDRC has paid US$3.1 million of the loan. Asat June 30, 2019, the outstanding balance of the loan amounted to US$20.8 million.
On May 6, 2019, IDRC availed of another four-year term loan with Rawbank DRC amounting toUS$3.0 million at a fixed interest rate. As at June 30, 2019, the outstanding balance of the loanamounted to US$3.0 million.
On March 21, 2019, IGFBV, as borrower, Metropolitan Bank and Trust Company, as lender,and ICTSI, as surety, signed a term loan facility amounting to US$300.0 million with interestbased on three-month LIBOR plus an agreed margin and a tenor of 7 years. On April 29, 2019,IGFBV has fully availed the term loan facility. As at June 30, 2019, the outstanding balance ofthe term loan facility amounted to US$296.3 million, net of US$3.7 million debt issuance costs.
12.3 Foreign Currency-denominated Loans
On July 15, 2016, VICT signed the syndicated project finance facilities with variousinternational and regional banks for principal amount of US$300.0 million (AUD398.0 million),comprising of term facilities totaling US$284.9 million (AUD378.0 million) with interest ratesbased on Australian Bank Bill Swap Reference Rate (bid) (BBSY) plus average margin of3.10 percent per annum and maturities until 2023, 2026 and 2031 and working capital facility ofUS$15.1 million (AUD20.0 million). In 2019, VICT paid US$10.4 million (AUD14.8 million)of the loan from the term facilities. As at June 30, 2019, the outstanding balance of the loansamounted to US$239.4 million (AUD341.1 million), net of debt issuance costs.
On December 5, 2016, YICT obtained a US$21.6 million (RMB150.0 million) short-term loanfrom YPH at a fixed interest rate and a maturity date of January 25, 2017. The loan was used torefinance YICT’s loan with Agricultural Bank of China (ABC). On January 12 andMarch 1, 2017, YICT prepaid a total amount of US$3.0 million (RMB20.0 million) and thebalance of US$18.9 million (RMB130.0 million) was renewed and matured on April 30, 2017.On April 26, 2017, YICT obtained a US$21.8 million (RMB150.0 million) loan from ABCpayable in installments with a final maturity on November 21, 2023 to refinance the maturingloan with YPH. Interest is based on the interest rate published by People's Bank of China(PBOC) minus an agreed margin. The rate is subject to adjustment every twelve months. Theoutstanding balance of the loan from ABC amounted to US$7.3 million (RMB50.0 million) as atJune 30, 2019.

SEC Form 17-Q Q2 2019 3131
On April 13, 2018, ANZ granted PGK-denominated bridge loan facilities to SPICTL and MITLamounting to US$31.1 million (PGK101.0 million) and US$25.2 million (PGK82.0 million),respectively, with interest based on ANZ’s published Indicator Lending Rate minus an agreedmargin. The loans availed by SPICTL and MITL amounting to US$18.3 million(PGK60.2 million) and US$14.2 million (PGK46.7 million) in April 2018 and May 2018,respectively, remained outstanding as of June 30, 2019, and were extended further to mature inAugust 2019 and September 2019, respectively.
On January 9, 2019, ICTSI Middle East DMCC, as borrower, and ICTSI, as guarantor, signed aterm loan facility agreement with Citigroup Global Markets Asia Limited and StandardChartered Bank, the original mandated lead arrangers and bookrunners, for the principal amountof EUR260.0 million (US$297.6 million) with interest rate based on Euro Interbank Offer Rate(EURIBOR) plus an agreed margin and maturity on December 20, 2022. The term facilityagreement was entered into pursuant to the Loan Facility Programme Agreement datedJuly 24, 2014 between ICTSI Global Finance B.V. as the borrower, ICTSI as the guarantor, andThe Bank of New York Mellon, Singapore Branch as the trustee (“Loan Programme”). ICTSIMiddle East DMCC acceded to the Loan Programme as an additional borrower and an additionalobligor thereunder. On January 10, 2019, ICTSI Middle East DMCC has fully availed theUS$297.6 million (EUR260.0 million) from the facility.
On June 12, 2019, ICTSI Middle East DMCC, as borrower, and ICTSI, as guarantor, signed anamendment and syndication agreement with various international and local banks for the termloan facility.
As at June 30, 2019, the outstanding balance of the loans amounted to US$292.7 million(EUR257.4 million), net of debt issuance costs. On July 15, 2019, ICTSI Middle East DMCCprepaid US$221.8 million (EUR195.0 million) of the loan.
12.5 Loan Covenants and Capitalized Borrowing Costs
The loans from local and foreign banks impose certain restrictions with respect to corporatereorganization, disposition of all or a substantial portion of ICTSI’s and subsidiaries’ assets,acquisitions of futures or stocks, and extending loans to others, except in the ordinary course ofbusiness. ICTSI is also required to comply with a specified financial ratio relating to their debtto EBITDA up to 4 times when incurring additional debt.
There was no material change in the covenants related to the Group’s long-term debt. As atJune 30, 2019, ICTSI and subsidiaries were in compliance with their loan covenants except forVICT whose Debt Service Coverage Ratio requirement was not met but having been irrevocablywaived by the creditors, no event of default has occurred.
Interest expense, net of amount capitalized as intangible assets and property and equipment,amounted to US$25.7 million and US$28.0 million, and US$53.7 million and US$53.7 millionfor the three and six months ended June 30, 2018 and 2019, respectively (see Notes 5 and 6).Interest expense includes amortization of debt issue costs amounting to US$1.5 million andUS$2.2 million, and US$3.3 million and US$4.0 million for the three and six months endedJune 30, 2018 and 2019, respectively.
There were no other significant transactions pertaining to the Group’s long-term debt as atJune 30, 2019, except as discussed above.

SEC Form 17-Q Q2 2019 3232
13. Other Noncurrent Liabilities
This account consists of:
December 31,2018
(Restated -Note 3)
June 30,2019
Government grant US$10,815 US$9,584Pension liabilities 9,241 9,697Derivative liabilities 2,220 9,754Accrued taxes and others 6,857 7,256Finance lease payable 894 924Others 2,689 3,150
US$32,716 US$40,365
Government GrantOn March 29, 2012, BCT and Centrum Unijnych Projektow Transportowych (CUPT), a Polishgrant authority, signed a grant agreement (the “EU Grant”) whereby CUPT would grant BCT asubsidy amounting to US$17.3 million (PLN53.9 million) and on October 21, 2013, BCT andCUPT signed a second EU Grant whereby CUPT would grant BCT a subsidy amounting toUS$4.8 million (PLN14.6 million). The confirmation of the availability of the EU Grant is acondition precedent to any borrowing under the facility agreement of BCT. As at June 30, 2019,BCT has availed a total of US$19.5 million of the EU Grant. The EU Grant is treated asdeferred income and is amortized over the duration of the existing concession agreement endingon May 31, 2023. The unamortized deferred income from government grant amounted toUS$10.8 million and US$9.6 million as at December 31, 2018 and June 30, 2019, respectively.Amortization of deferred income included under “Other income” account of the unauditedinterim consolidated statements of income amounted to US$1.2 million both for the six monthsended June 30, 2018 and 2019.
14. Accounts Payable and Other Current Liabilities
This account includes trade payables, output and other taxes payables, accruals for interest,salaries and benefits and other expenses, customers’ deposits, provisions for claims and lossesand other current liabilities.
15. Equity
15.1 Stock Incentive Plan (SIP)
Certain officers and employees of the Group receive remuneration through share-based paymenttransactions, whereby officers and employees are given awards, in the form of ICTSI commonshares, in lieu of cash incentives and bonuses under the SIP (“equity-settled transactions”). TheSIP was approved by the stockholders of ICTSI on March 7, 2007, effective for a period often years unless extended by the Board. On March 7, 2016, the Board approved for theextension of the SIP for a further 10 years until March 2027 and the amendment of vestingperiod of the SIP. The vesting period of the SIP was amended from two years where 50% is tovest on the first anniversary date of the award and the other 50% to vest on the secondanniversary date of the award, to three years where 25% is to vest on the first anniversary date ofthe award, 25% to vest on the second anniversary date of the award, and 50% to vest on the thirdanniversary date of the award. Unless the Stock Incentive Committee determines otherwise,when dividends are declared by the Company, the number of shares subject to an award shall be

SEC Form 17-Q Q2 2019 3333
increased by the number equal in value to the dividends the awardee would have received inrespect of an award had the shares awarded to the awardee vested at the time of the dividenddeclaration. This is designated as the Dividend Re-investment Plan (DRIP).
The shares covered by the SIP are held under treasury until they are awarded and issued to theofficers and employees as determined by the Stock Incentive Committee.
On March 1, 2019, the Stock Incentive Committee granted 1,662,309 shares of stock awards toofficers and employees of ICTSI and ICTSI Ltd., including its regional operating headquarters.The fair value of the shares was US$2.19 (P=113.00) at the date of grant. The fair value per sharewas determined based on the market price of stock at the date of grant.
As at June 30, 2019, there were 45,201,465 ICTSI common shares granted in aggregate underthe SIP since it became effective in 2007. Also, as at June 30, 2019, 31,544,333 ICTSI commonshares were held under treasury and allotted for the SIP.
Total compensation expense recognized on the vesting of the fair value of stock awardsamounted to US$1.3 million and US$0.9 million and US$2.1 million and US$2.3 million for thethree and six months ended June 30, 2018 and 2019, respectively.
15.2 Dividends Declared
On April 11, 2019, the Board of ICTSI declared a regular dividend of US$0.06 (P=2.92) per shareand a special cash dividend of US$0.04 (P=2.08) per share to stockholders of record datedApril 29, 2019. The dividends were paid on May 7, 2019.
15.3 Cost of Shares Held by Subsidiaries
As at December 31, 2018 and June 30, 2019, ICTHI held 3,800,000 of ICTSI’s preferred Ashares while IWI held 734,970 common shares of ICTSI.
15.4 Treasury Shares
The Company acquired 3,664,790 of its own common shares amounting to US$6.1 million in2018. The Company did not acquire any of its own common shares in 2019.
15.5 Other Comprehensive Loss
This account consists of:
CumulativeTranslation
Adjustments
Mark-to-Market
Gains(Losses) onDerivatives
RevaluationIncrement
UnrealizedMark-to-
MarketGain on
Available-for-Sale
Investments
Share inother
comprehensive income
(loss) of anassociate
ActuarialGains onDefinedBenefit
Plans
TotalComprehensiveIncome (Loss)
Balance at January 1, 2018 (US$259,680) US$247 US$610 US$587 US$1,043 US$571 (US$256,622)Effect of PFRS 16 (see Note 3) 126,860 – – – – – 126,860Balance at January 1, 2018, as restated (132,820) 247 610 587 1,043 571 (129,762)Translation differences arising from
translation of foreignoperations’ financial statements (36,162) – – – – – (36,162)
Net change in actuarial gain on definedbenefit plans – – – – – 50 50
Net change in unrealized mark-to-market values of derivatives – 128 – – – – 128
Net change in unrealized mark-to-market values of AFSinvestments – – – 88 – – 88
Share in other comprehensive gain(loss) of an associate – – – – (4,191) 89 (4,102)
Income tax relating to components ofother comprehensive income – (500) – – – – (500)
Balance at June 30, 2018 (US$168,982) (US$125) US$610 US$675 (US$3,148) US$710 (US$170,260)

SEC Form 17-Q Q2 2019 3434
CumulativeTranslation
Adjustments
Mark-to-Market
Gains onDerivatives
RevaluationIncrement
UnrealizedMark-to-Market
Gain onAvailable-for-
Sale Investments
Share in othercomprehensive income of an
associate
ActuarialGains
(Losses) onDefinedBenefit
Plans
TotalComprehensive
Income (Loss)
Balance at January 1, 2019 (US$314,374) (US$1,534) US$610 US$980 (US$1,040) US$605 (US$314,753)Effect of PFRS 16 (see Note 3) 159,248 – – – – – 159,248Balance at January 1, 2019, as restated (155,126) (1,534) 610 980 (1,040) 605 (155,505)Translation differences arising from
translation of foreignoperations’ financial statements 7,125 – – – – – 7,125
Net change in actuarial loss on definedbenefit plans – – – – – (113) (113)
Net change in unrealized mark-to-market values of derivatives – (19,409) – – – – (19,409)
Net change in unrealized mark-to-market values of AFSinvestments – – – (66) – (66)
Share in other comprehensive gain ofan associate – – – – 2,713 – 2,713
Income tax relating to components ofother comprehensive income – 5,363 – – – – 5,363
Balance at June 30, 2019 (US$148,001) (US$15,580) US$610 US$914 US$1,673 US$492 (US$159,892)
15.6 Perpetual Capital Securities
On January 10, 2018, the Board approved the principal terms and conditions and issuance of theUS$350.0 million 5.875 percent fixed-for-life Senior Guaranteed Perpetual Capital Securities(the “New Securities”). The New Securities were unconditionally and irrevocably guaranteed byICTSI.
On January 11, 2018, the Board approved the issuance of additional Senior GuaranteedPerpetual Capital Securities amounting to US$50.0 million (“Additional Securities”) which wasconsolidated and formed a single series with the New Securities initially offered onJanuary 10, 2018. The Additional Securities were also unconditionally and irrevocablyguaranteed by ICTSI.
The cash proceeds received by RCBV from the issuance of the New and Additional Securitiesamounted to US$392.3 million, net of debt issuance costs, which were alloted for the financingof acquisitions and capital expenditures and for general corporate purposes.
On May 2, 2019, RCBV redeemed the remaining US$139.7 million of the US$300-millionSenior Guaranteed Perpetual Capital Securities (“Securities”) and paid the associated accrueddistributions of US$4.4 million. The difference amounting to US$4.6 million between theredemption price of US$139.7 million and the carrying value of the Securities ofUS$135.1 million was directly charged to retained earnings.
Interest expense on Perpetual Capital Securities, which represents cumulative distributions toholders of Perpetual Capital Securities, amounted to US$31.4 million and US$32.5 million forthe six months ended June 30, 2018 and 2019. However, the interest expense has not beenrecognized in the unaudited interim consolidated statements of income but instead directlycharged against retained earnings since the Perpetual Capital Securities are presented as equityattributable to equity holders of the parent. For purposes of computing for earnings per share,the cumulative distributions to holders of Perpetual Capital Securities are deducted from netincome attributable to equity holders of the parent.

SEC Form 17-Q Q2 2019 3535
15.7 Non-controlling Interests
On April 10, 2019, IWI CTHI acquired 2,050,000 common shares of BIPI, representing20% non-controlling interest from Atlantic, Gulf & Pacific Company of Manila, Inc. (AG&P)for US$8.0 million (Php416.1 million). This transaction increased IWI CTHI’s ownership inBIPI from 60% to 80% (see Note 1.3) and reduced non-controlling interests by US$7.5 million(Php391.6 million). The difference between the purchase price and carrying value of thenon-controlling interest of US$0.5 million (Php24.5 million) was recognized in equity as“Excess of acquisition cost over the carrying value of non-controlling interests” in the2019 unaudited interim consolidated balance sheet.
The dividends distributed to non-controlling shareholders for the six months period endedJune 30 are as follows (in thousands):
2018 2019IDRC US$2,858 US$9,600YICT 1,914 2,405PICT 3,870 2,186AGCT 1,890 499LGICT – 383SCIPSI 623 –DIPSSCOR 29 –
US$11,184 US$15,073
16. Related Party Transactions
16.1 Transactions with the Shareholders and Affiliates
2018 2019
Related Party Relationship Nature of Transaction
TransactionAmount for
the ThreeMonths
EndedJune 30
TransactionAmount for
the SixMonths
EndedJune 30
OutstandingReceivable
(Payable)BalanceAmount
as atDec 31
TransactionAmount for
the ThreeMonths
EndedJune 30
TransactionAmount for
the SixMonths
EndedJune 30
OutstandingReceivable
(Payable)BalanceAmount
as atJune 30
(In Millions)ICBVSPIA Joint venture Interest-bearing loans
(see Note 8) (i)US$– US$4.40 US$– US$– US$– US$–
Interest income (converted intointerest-bearing loan)(see Note 8) (i)
5.00 8.66 – – – –
Interest receivable (i) 4.79 9.44 – – – –SPIA Spain S.L.SPIA Joint venture Interest-bearing loans
(see Note 8) (i)– – 270.99 (2.25) (3.96) 267.02
Interest income (converted intointerest-bearing loan)(see Note 8) (i)
– – 53.26 4.83 9.25 61.42
Interest receivable (i) – – 9.73 4.98 9.89 10.16YICTYantai Port
GroupCommon
shareholderPort fees (ii) 0.92 1.78 (0.90) 1.36 1.99 (0.89)
Trade transactions (iii) 0.43 0.81 (0.20) 0.42 0.79 (0.01)Yantai Port
HoldingsNon-
controllingshareholder
Port fees (ii) 0.01 0.02 0.15 0.01 0.02 –
Trade transactions (iii) 0.01 0.01 (0.07) 0.28 0.52 (0.05)SCIPSIAsian Terminals,
Inc.Non-controllingshareholder
Management fees 0.04 0.09 (0.02) 0.05 0.09 (0.02)
AGCTLuka Rijeka D.D.
(Luka Rijeka)Non-
controllingshareholder
Provision of services (iv) 0.08 0.16 (0.03) 0.12 0.23 (0.05)

SEC Form 17-Q Q2 2019 3636
2018 2019
Related Party Relationship Nature of Transaction
TransactionAmount for
the ThreeMonths
EndedJune 30
TransactionAmount for
the SixMonths
EndedJune 30
OutstandingReceivable
(Payable)BalanceAmount
as atDec 31
TransactionAmount for
the ThreeMonths
EndedJune 30
TransactionAmount for
the SixMonths
EndedJune 30
OutstandingReceivable
(Payable)BalanceAmount
as atJune 30
(In Millions)PICTPremier
MercantileServices(Private)Limited
CommonShareholder
Stevedoring and storagecharges (v)
1.10 2.22 (0.01) 0.28 0.93 (0.11)
Container handling revenue(v)
0.01 0.02 – 0.01 0.02 0.01
Marine Services(Private)Limited,PortlinkInternational(Private)Limited, andAMI Pakistan(Private)Limited
Commonshareholder
Container handling revenue(vi)
0.08 0.17 – 0.05 0.19 0.02
LGICTNCT
TransnationalCorp.
Non-controllingshareholder
Management fees 0.11 0.22 (0.03) 0.02 0.11 (0.10)
Maintenance and repairs 0.03 0.06 (0.02) – 0.04 (0.04)BIPIAtlantic Gulf and
Pacific Co. ofManila, Inc.
Commonshareholder
Rent expense 0.02 0.05 (0.03) 0.04 0.06 (0.03)
Utilities 0.01 0.01 (0.01) 0.01 0.01 (0.01)IDRCLedya SARL Non-
controllingshareholder
Management fees 0.58 1.03 (0.53) 0.59 1.18 (0.59)
Parent CompanyPrime Metro
BMDCorporation
Commonshareholder
Construction services (vii) – – 5.73 4.14 14.18 0.14
Dredging services (vii) – – 0.40 0.36 1.16 –Rental income (vii) – – – – 0.03 0.03
CGTPrime Metro
BMDCorporation
Commonshareholder
Contract administrationand site managementservices (viii)
0.1 0.1 (0.25) – 1.09 –
(i) On October 1, 2018, ICBV assigned to SPIA Spain S.L. all its outstanding interest-bearing loans, including interest converted into interest-bearing loan, and interestreceivable from SPIA as of the same date, amounting to US$321.1 million and US$9.6 million, respectively.
(ii) YICT is authorized under the Joint Venture Agreement to collect port charges levied on cargoes, port construction fees and facility security fee in accordance withgovernment regulations. Port fees remitted by YICT for YPH /YPG are presented as part of “Port authorities’ share in gross revenues” in the consolidated statements ofincome. Outstanding payable to YPH/YPG related to these port charges are presented under “Accounts payable and other current liabilities” account in theconsolidated balance sheets.
(iii) Trade transactions include utilities, rental and other transactions paid by YICT to YPH and YPG.
(iv) AGCT has entered into agreements with Luka Rijeka, a non-controlling shareholder, for the latter’s provision of services such as equipment maintenance, power and fueland supply of manpower, among others. Total expenses incurred by AGCT in relation to these agreements were recognized and presented in the consolidated statementsof income as part of Manpower costs, Equipment and facilities-related expenses and Administrative and other operating expenses.
(v) PICT has entered into an agreement with Premier Mercantile Services (Private) Limited for the latter to render stevedoring and other services, which are settled on amonthly basis.
(vi) Marine Services (Private) Limited, Portlink International (Private) Limited, and AMI Pakistan (Private) Limited are customers of PICT.
(vii) ICTSI has entered into contracts with Prime Metro BMD Corporation for the construction of port facilities and sublease of office space.
(viii) CGT has entered into contract with Prime Metro BMD Corporation for contract administration and site management services.
The outstanding balance arising from these related party transactions are current and payablewithout the need for demand.

SEC Form 17-Q Q2 2019 3737
16.2 Compensation of Key Management Personnel
Compensation of key management personnel consists of the following for the six months endedJune 30 (amount in thousands):
2018 2019Short-term employee benefits US$747 US$749Share-based payments 1,050 970Post-employment pension 15 14Total compensation to key management personnel US$1,812 US$1,733
17. Earnings Per Share Computation
The table below shows the computation of basic and diluted earnings per share for the three andsix months ended June 30 (amounts are in thousands, except number of shares and per sharedata):
For the Three Months Ended June 30 For the Six Months Ended June 302018
(Unaudited andRestated - Note 3)
2019(Unaudited)
2018(Unaudited and
Restated - Note 3)2019
(Unaudited)Net income attributable to equity holders of the
parent, as presented in the unaudited interimconsolidated statements of income (see Note 3) US$49,358 US$56,067 US$90,242 US$128,470
Adjustment for the effect of cumulativedistribution on subordinated perpetual capitalsecurities (see Note 15.6) (16,270) (16,270) (31,364) (32,539)
Net income attributable to equity holders of theparent, as adjusted (a) US$33,088 US$39,797 US$58,878 US$95,931
Common shares outstanding at beginning of year 2,045,177,671 2,045,177,671 2,045,177,671 2,045,177,671Weighted treasury shares (12,039,039) (32,180,968) (12,039,039) (32,180,968)Weighted shares held by subsidiaries (734,970) (734,970) (734,970) (734,970)Weighted average shares outstanding (b) 2,032,403,662 2,012,261,733 2,032,403,662 2,012,261,733Effect of dilutive stock awards 4,630,729 3,807,507 4,630,729 3,807,507Weighted average shares outstanding adjusted for
potential common shares (c) 2,037,034,391 2,016,069,240 2,037,034,391 2,016,069,240
Basic earnings per share (a/b) US$0.016 US$0.020 US$0.029 US$0.048
Diluted earnings per share (a/c) US$0.016 US$0.020 US$0.029 US$0.048
18. Contingencies
Due to the nature of the Group’s business, it is involved in various legal proceedings, both asplaintiff and defendant, from time to time. Management and its legal counsels believe that theGroup has substantial legal and factual bases for its position and is of the opinion that lossesarising from the existing legal actions and proceedings, if any, will not have a material adverseimpact on the Group’s interim condensed consolidated financial position and results ofoperations.

SEC Form 17-Q Q2 2019 3838
19. Financial Instruments
19.1 Fair values
Set out below is a comparison of carrying amounts and fair values of the Group’s financialinstruments by category whose fair value is different from its carrying amount (amount inthousands):
December 31, 2018 (Restated - Note 3) June 30, 2019Carrying Amount Fair Value Carrying Amount Fair Value
Financial LiabilitiesOther financial liabilities:
Long-term debt US$1,271,335 US$1,318,503 US$1,836,453 US$1,923,240Concession rights payable 541,269 556,134 532,449 574,772Lease liabilities 1,131,596 1,307,605 1,153,455 1,410,922
US$2,944,200 US$3,182,242 US$3,522,357 US$3,908,934
Carrying values of cash and cash equivalents, receivables, accounts payable and other currentliabilities and loans payable approximate their fair values due to the short-term nature of thetransactions.
The fair values of the US dollar-denominated notes and US dollar-denominated medium-termnotes are based on quoted prices. The fair value of other fixed interest-bearing loans, concessionrights payable and lease liabilities were estimated at the present value of all future cash flowsdiscounted using the applicable rates for similar types of loans ranging from 1.26 percent to13.90 percent as at December 31, 2018 and 0.70 percent to 19.56 percent as at June 30, 2019.
For variable interest-bearing loans repriced monthly or quarterly, the carrying amountapproximates the fair value due to the regular repricing of interest rates.
19.2 Fair Value Hierarchy
The following tables below present the fair value hierarchy of the Group’s financial instruments(amount in thousands):
December 31, 2018 (Restated - Note 3)
Amount
Quoted prices inactive market
(Level 1)
Significantobservable
inputs(Level 2)
Significantunobservable
inputs(Level 3)
Assets and Liabilities Measured at FairValue:Derivative assets US$579 US$− US$579 US$−Derivative liabilities 2,835 − 2,835 −Financial assets at FVOCI 13,032 13,032 − −
Liabilities for which Fair Values areDisclosed:
Other financial liabilities:Long-term debt 1,318,503 984,326 − 334,177Concession rights payable 556,134 − − 556,134Lease liabilities 1,307,605 − − 1,307,605
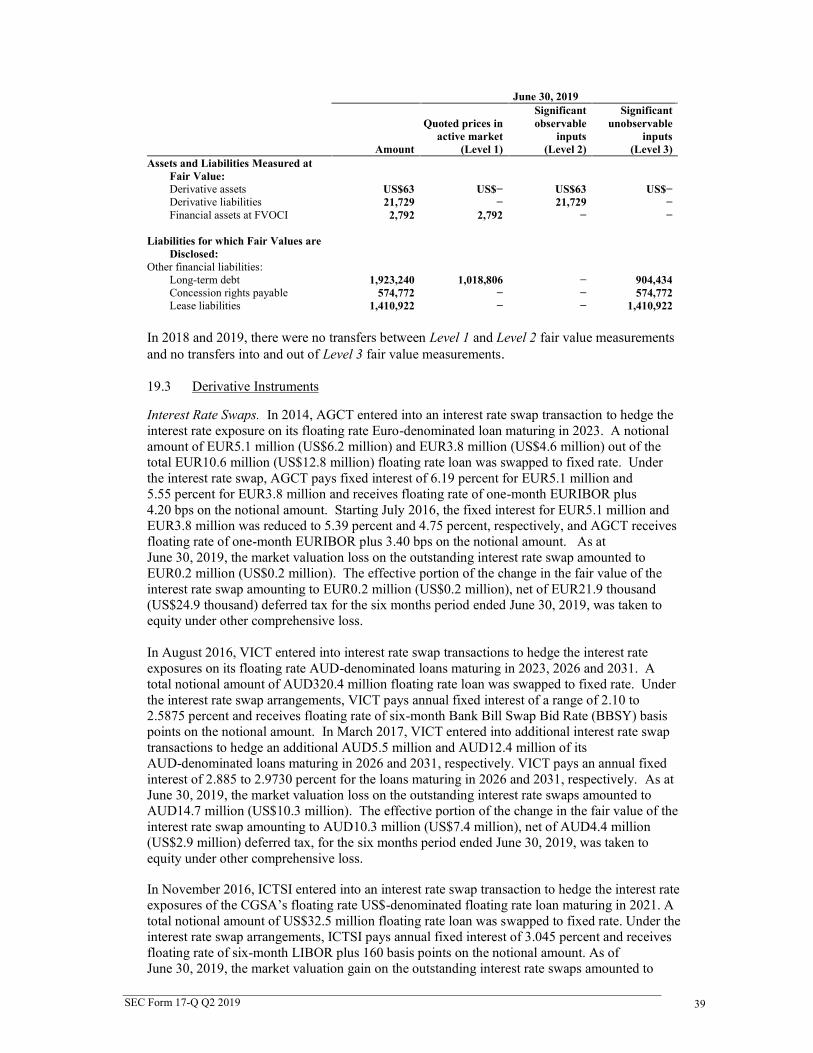
SEC Form 17-Q Q2 2019 3939
June 30, 2019
Amount
Quoted prices inactive market
(Level 1)
Significantobservable
inputs(Level 2)
Significantunobservable
inputs(Level 3)
Assets and Liabilities Measured atFair Value:Derivative assets US$63 US$− US$63 US$−Derivative liabilities 21,729 − 21,729 −Financial assets at FVOCI 2,792 2,792 − −
Liabilities for which Fair Values areDisclosed:
Other financial liabilities:Long-term debt 1,923,240 1,018,806 − 904,434Concession rights payable 574,772 − − 574,772Lease liabilities 1,410,922 − − 1,410,922
In 2018 and 2019, there were no transfers between Level 1 and Level 2 fair value measurementsand no transfers into and out of Level 3 fair value measurements.
19.3 Derivative Instruments
Interest Rate Swaps. In 2014, AGCT entered into an interest rate swap transaction to hedge theinterest rate exposure on its floating rate Euro-denominated loan maturing in 2023. A notionalamount of EUR5.1 million (US$6.2 million) and EUR3.8 million (US$4.6 million) out of thetotal EUR10.6 million (US$12.8 million) floating rate loan was swapped to fixed rate. Underthe interest rate swap, AGCT pays fixed interest of 6.19 percent for EUR5.1 million and5.55 percent for EUR3.8 million and receives floating rate of one-month EURIBOR plus4.20 bps on the notional amount. Starting July 2016, the fixed interest for EUR5.1 million andEUR3.8 million was reduced to 5.39 percent and 4.75 percent, respectively, and AGCT receivesfloating rate of one-month EURIBOR plus 3.40 bps on the notional amount. As atJune 30, 2019, the market valuation loss on the outstanding interest rate swap amounted toEUR0.2 million (US$0.2 million). The effective portion of the change in the fair value of theinterest rate swap amounting to EUR0.2 million (US$0.2 million), net of EUR21.9 thousand(US$24.9 thousand) deferred tax for the six months period ended June 30, 2019, was taken toequity under other comprehensive loss.
In August 2016, VICT entered into interest rate swap transactions to hedge the interest rateexposures on its floating rate AUD-denominated loans maturing in 2023, 2026 and 2031. Atotal notional amount of AUD320.4 million floating rate loan was swapped to fixed rate. Underthe interest rate swap arrangements, VICT pays annual fixed interest of a range of 2.10 to2.5875 percent and receives floating rate of six-month Bank Bill Swap Bid Rate (BBSY) basispoints on the notional amount. In March 2017, VICT entered into additional interest rate swaptransactions to hedge an additional AUD5.5 million and AUD12.4 million of itsAUD-denominated loans maturing in 2026 and 2031, respectively. VICT pays an annual fixedinterest of 2.885 to 2.9730 percent for the loans maturing in 2026 and 2031, respectively. As atJune 30, 2019, the market valuation loss on the outstanding interest rate swaps amounted toAUD14.7 million (US$10.3 million). The effective portion of the change in the fair value of theinterest rate swap amounting to AUD10.3 million (US$7.4 million), net of AUD4.4 million(US$2.9 million) deferred tax, for the six months period ended June 30, 2019, was taken toequity under other comprehensive loss.
In November 2016, ICTSI entered into an interest rate swap transaction to hedge the interest rateexposures of the CGSA’s floating rate US$-denominated floating rate loan maturing in 2021. Atotal notional amount of US$32.5 million floating rate loan was swapped to fixed rate. Under theinterest rate swap arrangements, ICTSI pays annual fixed interest of 3.045 percent and receivesfloating rate of six-month LIBOR plus 160 basis points on the notional amount. As ofJune 30, 2019, the market valuation gain on the outstanding interest rate swaps amounted to
SEC Form 17-Q Q2 2019 4040
US$63.4 thousand. The effective portion of the change in the fair value of the interest rate swapamounting to US$44.4 thousand, net of US$19.0 thousand deferred tax, for the six monthsperiod ended June 30, 2019, was taken to equity under other comprehensive loss.
In April 2019, ICTSI entered into an interest rate swap transaction to hedge the interest rateexposures of the ICTSI Global Finance B.V.’s floating rate US$-denominated floating rate loanmaturing in 2026. A total notional amount of US$300.0 million floating rate loan was swappedto fixed rate. Under the interest rate swap arrangements, ICTSI pays annual fixed interest of3.6981 percent and receives floating rate of three-month LIBOR plus 130 basis points on thenotional amount. As of June 30, 2019, the market valuation loss on the outstanding interest rateswaps amounted to US$10.2 million. The effective portion of the change in the fair value of theinterest rate swap amounting to US$7.1 million, net of US$3.1 million deferred tax, for thesix months period ended June 30, 2019, was taken to equity under other comprehensive loss.
Net Investment Hedging. In March 2017, ICTSI entered into a cross currency swap that convertsthe US dollar bond with a coupon of 7.375 percent maturing on March 17, 2020 to a Euroliability that has a coupon of 5.05 percent with the same maturity. The EUR15.0 million crosscurrency swap was designated as a net investment hedge to offset the movement of the Group’sEuro net investment in its subsidiary in Madagascar, MICTSL. As of June 30, 2019, the marketvaluation loss on the outstanding cross currency swap amounted to EUR0.8 million(US$0.9 million). The effective portion of the change in the fair value of the cross currencyswap amounting to EUR0.6 million (US$0.6 million), net of EUR0.2 million (US$0.3 million)deferred tax, for the six months period ended June 30, 2019, was taken to equity under othercomprehensive loss.
Translation Hedging. In 2018, ICTSI designated EUR138.3 million (US$158.5 million) of itsEuro-denominated cash equivalents as cash flow hedges to hedge the variability of anEuro-denominated transaction that would arise as a result of changes in the EUR:USD exchangerate.
On January 8, 2019, ICTSI terminated the cash flow hedge of its Euro-denominated cashequivalents. The related foreign currency translation loss on the Euro-denominated cashequivalents designated as cash flow hedges aggregating to US$10.6 million that was taken toequity was reclassified as part of upfront fee paid to SPC.
20. Trends, Events, or Uncertainties Affecting Recurring Revenues and Profit
The Group is exposed to a number of trends, events and uncertainties which can affect itsrecurring revenues and profits. These include levels of general economic activity andcontainerized trade volume in countries where it operates, as well as certain cost items, such aslabor, fuel and power. In addition, the Group operates in a number of jurisdictions other than thePhilippines and collects revenues in various currencies. Continued appreciation of the US dollarrelative to other major currencies, particularly the Philippine peso, Brazilian real, Mexican pesoand the Euro, may adversely affect the Group’s reported levels of revenues and profits.

SEC Form 17-Q Q2 2019 4141
Item 2. Management’s Discussion and Analysis or Plan of Operations
The following discussion and analysis relate to the consolidated financial position and results ofoperations of ICTSI and its wholly and majority-owned subsidiaries (collectively known as “ICTSIGroup”) and should be read in conjunction with the accompanying unaudited interim consolidatedfinancial statements and related notes as of and for the quarter ended June 30, 2019. References to“ICTSI”, “the Company”, and “Parent Company” pertain to ICTSI Parent Company, whilereferences to “the Group” pertain to ICTSI and its subsidiaries.
2.1 Overview
The Group is an international operator of common user container terminals serving the globalcontainer shipping industry. Its business is the acquisition, development, operation and managementof container terminals focusing on facilities with total annual throughput ranging from 50,000 to3,000,000 twenty-foot equivalent units (TEUs). It also handles general cargoes and provides anumber of ancillary services such as storage, container packing and unpacking, inspection, weighing,and services for refrigerated containers or reefers. As of report date, the Group is involved in 32terminal concessions and port development projects in 18 countries worldwide. There are eleventerminal operations, including an inland container terminal and a barge terminal, in the Philippines,two each in Indonesia, Papua New Guinea and Brazil; and one each in China, Ecuador, Poland,Georgia, Madagascar, Croatia, Pakistan, Honduras, Mexico, Iraq, Argentina, DR Congo, Colombiaand Australia; and an existing concession to construct, develop and operate a port in Tuxpan,Mexico.
ICTSI was established in 1987 in connection with the privatization of Manila International ContainerTerminal (MICT) in the Port of Manila, and has built upon the experience gained in rehabilitating,developing and operating MICT to establish an extensive international network concentrated inemerging market economies. International acquisitions principally in Asia, Europe, Middle East andAfrica (EMEA) and Americas substantially contributed to the growth in volume, revenues, EBITDAand net income. ICTSI’s business strategy is to continue to develop its existing portfolio ofterminals and proactively seek acquisition opportunities that meet its investment criteria.
The Group operates principally in one industry segment which is cargo handling and relatedservices. ICTSI has organized its business into three geographical segments:
Asiao Manila - Manila International Container Terminal, Port of Manila, Philippines (MICT)o Zambales - New Container Terminal (NCT) 1 and 2, Subic Bay Freeport Zone, Olongapo
City, Philippines (SBITC/ICTSI Subic)o Batangas - Bauan Terminal, Bauan, Philippines (BIPI)o Laguna - Laguna Gateway Inland Container Terminal, Calamba City, Laguna, Philippines
(LGICT)o Cavite – Cavite Gateway Terminal, Tanza, Cavite, Philippines (CGT)o Davao - Sasa Wharf, Port of Davao (DIPSSCOR) and Hijo International Port, Davao del
Norte, Philippines (HIPS)o General Santos - Makar Wharf, Port of General Santos, Philippines (SCIPSI)o Misamis Oriental - Phividec Industrial Estate, Tagaloan, Philippines (MICTSI)o Manila - Manila North Harbour Port, Inc., North Harbor, Manila, Philippines (MNHPI)o Indonesia - Makassar Port Container Terminal, Makassar, South Sulawesi, Indonesia (MTS)
and Port of Tanjung Priok, Jakarta, Indonesia (OJA)o China - Yantai International Container Terminal, Port of Yantai, Shandong Province, China
(YICT)o Pakistan - Port of Karachi, Karachi, Pakistan (PICT)o Australia - Webb Dock Container Terminal and ECP at Webb Dock East, Port of
Melbourne, Australia (VICT)o Papua New Guinea - Port of Motukea, Papua New Guinea (MITL) and Port of Lae, Papua
New Guinea (SPICTL)

SEC Form 17-Q Q2 2019 4242
EMEAo Poland - Baltic Container Terminal, Gdynia, Poland (BCT)o Georgia - Port of Batumi, Batumi, Georgia (BICT)o Croatia - Brajdica Container Terminal, Rijeka, Croatia (AGCT)o Madagascar - Port of Toamasina, Toamasina, Madagascar (MICTSL)o DR Congo - Matadi Gateway Terminal, Mbengu, Matadi, Democratic Republic of Congo
(IDRC)o Iraq - Basra Gateway Terminal at Port of Umm Qasr, Iraq (ICTSI Iraq)
Americaso Brazil - Suape Container Terminal, Suape, Brazil (TSSA) and Terminal de Contêineres, Port
of Rio de Janeiro City, Brazil (T1Rio)o Ecuador - Port of Guayaquil, Guayaquil, Ecuador (CGSA)o Argentina - Port of La Plata, Buenos Aires Province, Argentina (Tecplata)o Mexico - Port of Manzanillo, Manzanillo, Mexico (CMSA) and Port of Tuxpan, Mexico
(TMT)o Colombia - Port of Buenaventura, Buenaventura, Colombia (SPIA)o Honduras - Puerto Cortés, Republic of Honduras (OPC)
Concessions for port operations entered into, acquired, developed and terminated by ICTSI andsubsidiaries for the last two years are summarized below:
Port of Rio de Janeiro City, Brazil. On July 19, 2019, ICTSI, through its wholly-owned subsidiaryICTSI Americas B.V, signed a Share Purchase Agreement with Boreal Empreendimentos eParticipações S.A. (Boreal) to acquire 100% of the shares of Libra Terminal Rio S.A. (Libra Rio),which holds the concession rights to operate, manage and develop the container terminal Terminalde Contêineres 1 (T1Rio) in the port of Rio de Janeiro City, Federative Republic of Brazil. Theconcession of T1Rio commenced in 1998 and was extended in 2011 until 2048. Transfer of thefacilities to ICTSI management is expected to take place in the fourth quarter of 2019, once allconditions precedent and all required regulatory approvals have been obtained.
In 2018, T1Rio had a throughput of 135,000 TEUs. The terminal has a capacity in excess of530,000 TEU with the capability for expansion. T1Rio has state-of-the-art container terminal assets,including 5 Ship-to-Shore Gantry Cranes and an extensive range of yard handling equipmentincluding more than 16 Rubber-Tired-Gantry Cranes. It has a total land area of 18.8 hectares and715 meters of quay wall, with a design water depth of up to 16 meters and thus the capability toreceive global shipping lines’ largest container vessels.
Manila North Harbour Port, Inc., Philippines. On September 21, 2017, the BOD of ICTSI grantedthe authority to acquire shares in MNHPI. On the same date, ICTSI signed a Share PurchaseAgreement (SPA) with Petron Corporation for the acquisition of 10,449,000 MNHPI shares,representing 34.83% of the total issued and outstanding shares of MNHPI for a consideration ofPhp1.75 billion(US$33.8 million). The completion of the SPA was subject to several conditions, one of which wasthe approval of the acquisition by the Philippine Ports Authority (PPA) which was obtained onOctober 20, 2017. The SPA was completed on October 30, 2017. An additional investment cost ofPhp2.45 billion (US$47.3 million) was incurred in relation to this acquisition.
On September 5, 2018, ICTSI has signed an SPA with Harbour Centre Port Terminal, Inc. (HCPTI)for the acquisition of 4,550,000 shares in MNHPI from HCPTI. The subject shares represent15.17% of the total issued and outstanding shares of MNHPI. The consideration is Php910.0 million(US$17.3 million). The Philippine Competition Commission and the PPA approved the acquisitionof shares on March 15, 2019 and April 26, 2019, respectively. With the approval of the PPA,ICTSI's shareholdings in MNHPI increased from 34.83% to 50.00% effective on April 26, 2019. Anadditional investment cost of Php2.70 billion (US$50.3 million) was incurred in relation to thisacquisition.

SEC Form 17-Q Q2 2019 4343
Port of Motukea and Port of Lae, Papua New Guinea. In September 2017, ICTSI received anotification from PNG Ports Corporation Limited (PNGPCL), a Papua New Guinea (PNG) state-owned enterprise, of the confirmation by the Independent Consumer and Competition Commissionin PNG with respect to the two 25-year agreements signed by ICTSI through its wholly-ownedsubsidiaries, Motukea International Terminal Limited (MITL) and South Pacific InternationalContainer Terminal Limited (SPICTL), with PNGPCL for the operation, management anddevelopment of the two international ports in Motukea and Lae in PNG.
SPICTL and MITL were allowed by PNGPCL to take over the port facilities and begin operations atthe Port of Lae in February 2018 and at the Port of Motukea in May 2018, respectively. Theterminal operating agreements and other related contracts took effect on June 1, 2018 after all theparties have complied with the agreed conditions precedent.
Cavite Gateway Terminal, Philippines. On April 21, 2017, ICTSI, through its wholly-ownedsubsidiary, Cavite Gateway Terminal (CGT), in partnership with the Philippine Department ofTransportation, project launched the country’s first container roll-on roll-off barge terminal in Tanza,Cavite. CGT will facilitate off-the-roads seaborn transport of containers between Port of Manila andCavite and service industrial locators in Cavite area. CGT’s barge terminal has an annual capacityof 115,000 TEUs. The terminal was formally inaugurated and commenced commercial operationson November 22, 2018.
Port of Umm Qasr, Iraq. In April 2014, ICTSI, through its wholly owned subsidiary ICTSI (M.E.)JLT, and General Company for Ports of Iraq (GCPI) signed the Contract for the Construction andOperation of Three New Quays and Management and Operation of Quay No. 20 (“Contract”) in thePort of Umm Qasr (“Port”) in Iraq. The Contract grants ICTSI the rights to: (a) manage and operatethe existing container facility at Berth 20 of the Port for a period of 10 years, (b) build, under abuild-operate-transfer (BOT) scheme, a new container and general cargo terminal in the Port for aconcession period of 26 years, and (c) provide container and general cargo terminal services in bothcomponents. On March 1, 2016, an addendum to the Contract (“First Addendum”) was signed bythe parties granting ICTSI, through ICTSI Dubai, the right to manage and operate an additionalexisting Quay No. 19 for a total of 13 years, with the first three years for the completion ofrehabilitation works. Also, the First Addendum extended the original term for the management andoperation of Quay No. 20 from 10 to 13 years. On March 26, 2017, a second addendum to theContract (“Second Addendum”) was signed by the parties granting ICTSI, through ICTSI Dubai, theright to manage and operate Quay No. 21 co-terminus with the Contract and the First Addendum.The Second Addendum extended the term for the management and operation of Quay No. 19 and 20from 13 to 21 years.
Phase 1 of the expansion project (Berth 27) was completed and fully operational in the first quarterof 2017. On October 22, 2017, ICTSI signed an agreement with GCPI for the Phase 2 of expansiondevelopment of the Port which involves development of two new berths, Berths 25 and 26, includinga 20-hectare yard area. The development of this phase of the expansion project is on-going and isexpected to be completed in the third quarter of 2019.
Extension of Contracts
Davao Sasa Port, Philippines. On April 21, 2006, the Philippine Ports Authority (PPA) grantedDIPSSCOR a ten-year contract for cargo handling services at Sasa Wharf, Port of Davao in thePhilippines that expired on April 20, 2016. Since then, the local office of the PPA in Davao City hasgranted DIPSSCOR a series of hold-over authorities for a period ranging from six months to oneyear. On November 12, 2018, a hold-over authority was issued by the PPA Port Manager withavailability of six months starting August 26, 2018 or until the award of a new contract by the PPA,whichever is earlier, unless cancelled or revoked for reason by the PPA during the validity of thehold-over authority. As of report date, DIPSSCOR has not yet received a new hold-over authority.

SEC Form 17-Q Q2 2019 4444
Makar Wharf, Port of General Santos, South Cotabato, Philippines. On February 20, 2006, the PPAgranted South Cotabato Integrated Port Services, Inc. (SCIPSI) a ten-year contract for the exclusivemanagement and operation of arrastre, stevedoring, bagging and crated cargo handling services atMakar Wharf, Port of General Santos, General Santos City in the Philippines that expired onFebruary 19, 2016. Since then, the local office of the PPA in General Santos City has grantedSCIPSI a series of hold-over authorities for a period of one year. On October 19, 2018, a hold-overauthority was issued by the PPA Port Manager with availability of six months startingAugust 25, 2018 or until the award of a new contract by the PPA, whichever is earlier, unlesscancelled or revoked for reason by the PPA during the validity of the hold-over authority. As ofreport date, SCIPSI has not yet received a new hold-over authority.
OthersPort of Tanjung Priok, Indonesia. On November 2, 2017, PT ICTSI Jasa Prima Tbk (IJP), an ICTSIsubsidiary in Indonesia, signed a Conditional Share Purchase Agreement with PT SamuderaTerminal Indonesia (STI) for the purchase of IJP’s interest in PT Perusahaan Bongkar Muat OlahJasa Andal (OJA), subject to certain conditions. As of report date, the conditions precedent have notyet been fulfilled.
Port of Port Sudan, Republic of the Sudan. On January 3, 2019, ICTSI, through its wholly-ownedsubsidiary ICTSI Middle East DMCC, signed a Concession Agreement (‘the Agreement’) with SeaPorts Corporation (SPC) of Sudan to operate, manage, and develop the South Port ContainerTerminal (SPCT) at the Port of Sudan, Republic of the Sudan for 20 years. The Port of Sudan is theonly major modern port in the Republic of the Sudan and serves as the international gateway formore than 95% of country’s cargo flows.
Pursuant to the Agreement, ICTSI is required to pay: (a) an upfront fee of EUR530.0 million ininstallments of EUR410.0 million (US$467.2 million) and five other installments each in the amountof EUR24.0 (US$27.3 million) from the third to the seventh operation year; (b) fixed monthly fee;and (c) royalty fee during the concession period. The Agreement is secured by a sovereignguarantee by the Republic of the Sudan. On January 13, 2019, ICTSI paid the initial installment ofupfront fee of EUR410 million (US$470.2 million). In February 2019, ICTSI established AfricaGateway Terminal (AGT), a Sudanese entity, to operate the container terminal.
On January 8, 2019, the Ministry of Finance and Economic Planning (the “Ministry”) issued a bond(the “Refund Bond”), which was subsequently amended, wherein it agreed to refund the Upfront Feein case ICTSI is unable to take over operations by April 7, 2019.
On August 7, 2019, due to the ongoing political instability in the Republic of the Sudan and thefailure of the Sudanese government to turn over SPCT on or before April 7, 2019, the SudaneseMinistry sent ICTSI a letter confirming: (1) the remittance of EUR195.2 million as partial repaymentof the Upfront Fee under the terms of the Refund Bond and (2) that the balance will be repaid assoon as possible.
ICTSI is in continuous discussion with the Sudanese Government for the repayment schedule of thebalance of the Upfront Fee and the status of the Concession Agreement following a letter from SPCregarding its cancellation which ICTSI disputes. ICTSI reserves and continues to reserve its rightsunder the Concession Agreement.
ICTSI, has an excellent track record of managing and making significant investments in containerterminal infrastructure and is committed to making the Port of Sudan a leading port and strategicgateway to Africa, benefitting all of its stakeholders
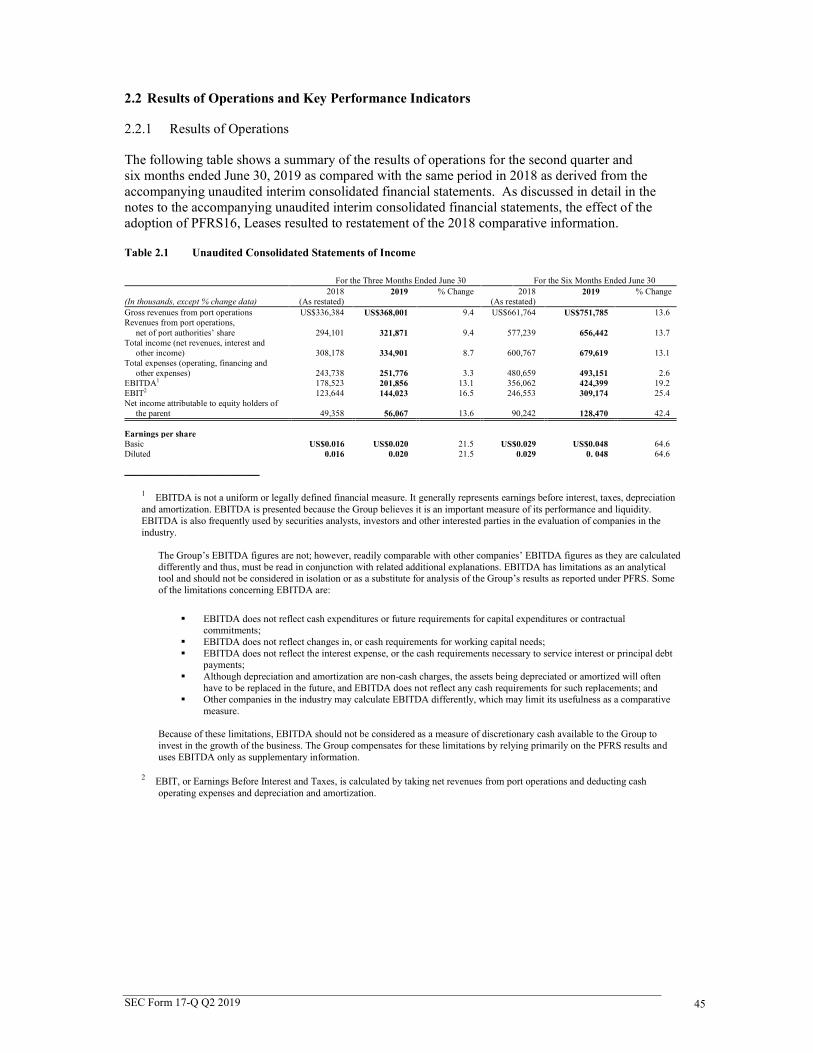
SEC Form 17-Q Q2 2019 4545
2.2 Results of Operations and Key Performance Indicators
2.2.1 Results of Operations
The following table shows a summary of the results of operations for the second quarter andsix months ended June 30, 2019 as compared with the same period in 2018 as derived from theaccompanying unaudited interim consolidated financial statements. As discussed in detail in thenotes to the accompanying unaudited interim consolidated financial statements, the effect of theadoption of PFRS16, Leases resulted to restatement of the 2018 comparative information.
Table 2.1 Unaudited Consolidated Statements of Income
For the Three Months Ended June 30 For the Six Months Ended June 30
(In thousands, except % change data)2018
(As restated)2019 % Change 2018
(As restated)2019 % Change
Gross revenues from port operations US$336,384 US$368,001 9.4 US$661,764 US$751,785 13.6Revenues from port operations,
net of port authorities’ share 294,101 321,871 9.4 577,239 656,442 13.7Total income (net revenues, interest and
other income) 308,178 334,901 8.7 600,767 679,619 13.1Total expenses (operating, financing and
other expenses) 243,738 251,776 3.3 480,659 493,151 2.6EBITDA1 178,523 201,856 13.1 356,062 424,399 19.2EBIT2 123,644 144,023 16.5 246,553 309,174 25.4Net income attributable to equity holders of
the parent 49,358 56,067 13.6 90,242 128,470 42.4
Earnings per shareBasic US$0.016 US$0.020 21.5 US$0.029 US$0.048 64.6Diluted 0.016 0.020 21.5 0.029 0. 048 64.6
__________________1 EBITDA is not a uniform or legally defined financial measure. It generally represents earnings before interest, taxes, depreciationand amortization. EBITDA is presented because the Group believes it is an important measure of its performance and liquidity.EBITDA is also frequently used by securities analysts, investors and other interested parties in the evaluation of companies in theindustry.
The Group’s EBITDA figures are not; however, readily comparable with other companies’ EBITDA figures as they are calculateddifferently and thus, must be read in conjunction with related additional explanations. EBITDA has limitations as an analyticaltool and should not be considered in isolation or as a substitute for analysis of the Group’s results as reported under PFRS. Someof the limitations concerning EBITDA are:
EBITDA does not reflect cash expenditures or future requirements for capital expenditures or contractualcommitments;
EBITDA does not reflect changes in, or cash requirements for working capital needs; EBITDA does not reflect the interest expense, or the cash requirements necessary to service interest or principal debt
payments; Although depreciation and amortization are non-cash charges, the assets being depreciated or amortized will often
have to be replaced in the future, and EBITDA does not reflect any cash requirements for such replacements; and Other companies in the industry may calculate EBITDA differently, which may limit its usefulness as a comparative
measure.
Because of these limitations, EBITDA should not be considered as a measure of discretionary cash available to the Group toinvest in the growth of the business. The Group compensates for these limitations by relying primarily on the PFRS results anduses EBITDA only as supplementary information.
2 EBIT, or Earnings Before Interest and Taxes, is calculated by taking net revenues from port operations and deducting cashoperating expenses and depreciation and amortization.

SEC Form 17-Q Q2 2019 4646
The following table presents the computation of EBITDA as derived from the Group’s unauditedinterim consolidated net income attributable to equity holders of the parent for the second quarterand six months ended June 30, 2019 as compared with the same period in 2018:
Table 2.2 EBITDA Computation
For the Three Months Ended June 30 For the Six Months Ended June 30
(In thousands, except % change data)2018
(As restated)2019 % Change 2018
(As restated)2019 % Change
Net income attributable to equity holdersof the parent US$49,358 US$56,067 13.6 US$90,242 US$128,470 42.4
Minority interests 6,849 8,498 24.1 13,662 17,600 28.8Provision for income tax 8,233 18,560 125.4 16,204 40,398 149.3Income before income tax 64,440 83,125 29.0 120,108 186,468 55.3Add (deduct):
Depreciation and amortization 54,879 57,833 5.4 109,509 115,225 5.2Interest and other expenses 73,281 73,928 0.9 149,973 145,883 (2.7)Interest and other income (14,077) (13,030) ( 7.4) (23,528) (23,177) (1.5)
EBITDA US$178,523 US$201,856 13.1 US$356,062 US$424,399 19.2
2.2.2 Key Performance Indicators
The five (5) key performance indicators (KPIs) include gross moves per hour per crane, craneavailability and berth utilization, which affect the operations of the Group, and volume growth intwenty-foot equivalent unit (TEU) and gross revenue growth, which are both financial in nature.These KPIs are discussed in detail in the succeeding paragraphs.
2019 Compared with 2018
Gross moves per hour per crane ranged to 14.7 to 29.1 moves per hour in 2019 from 13.8 to33.6 moves per hour in 2018. Crane availability ranged to 75.2 percent to 98.4 percent in 2019 from77.2 percent to 99.7 percent in 2018. Berth utilization was at 19.8 percent to 80.8 percent in 2019and 16.7 percent to 91.3 percent in 2018.
2018 Compared with 2017
Gross moves per hour per crane ranged to 13.8 to 33.6 moves per hour in 2018 from 17.4 to31.7 moves per hour in 2017. Crane availability ranged to 77.2 percent to 99.7 percent in 2018 from93.0 percent to 99.3 percent in 2017. Berth utilization was 16.7 percent to 91.3 percent in 2018 andat 17.3 percent to 88.4 percent in 2017.
The gross moves per hour per crane is a measure of crane productivity while working on vesselsduring discharging or loading operations. The crane availability relates to the efficiency of themaintenance of the crane. While berth utilization is a measure of how long the berth is utilized for agiven period and this indicator measures the efficiency of the operations and the productivity on thevessel.
2.3 Comparison of Operating Results for the Second Quarters Ended June 30, 2019 and 2018
2.3.1 TEU Volume
The below table presents the volume (in TEU) handled by the Group for the second quarters endedJune 30, 2018 and 2019:
Table 2.3 Volume
For the Three Months Ended June 302018 2019 % Change
Asia 1,253,784 1,354,478 8.0Americas 750,122 752,389 0.3EMEA 384,809 456,377 18.6
2,388,715 2,563,244 7.3
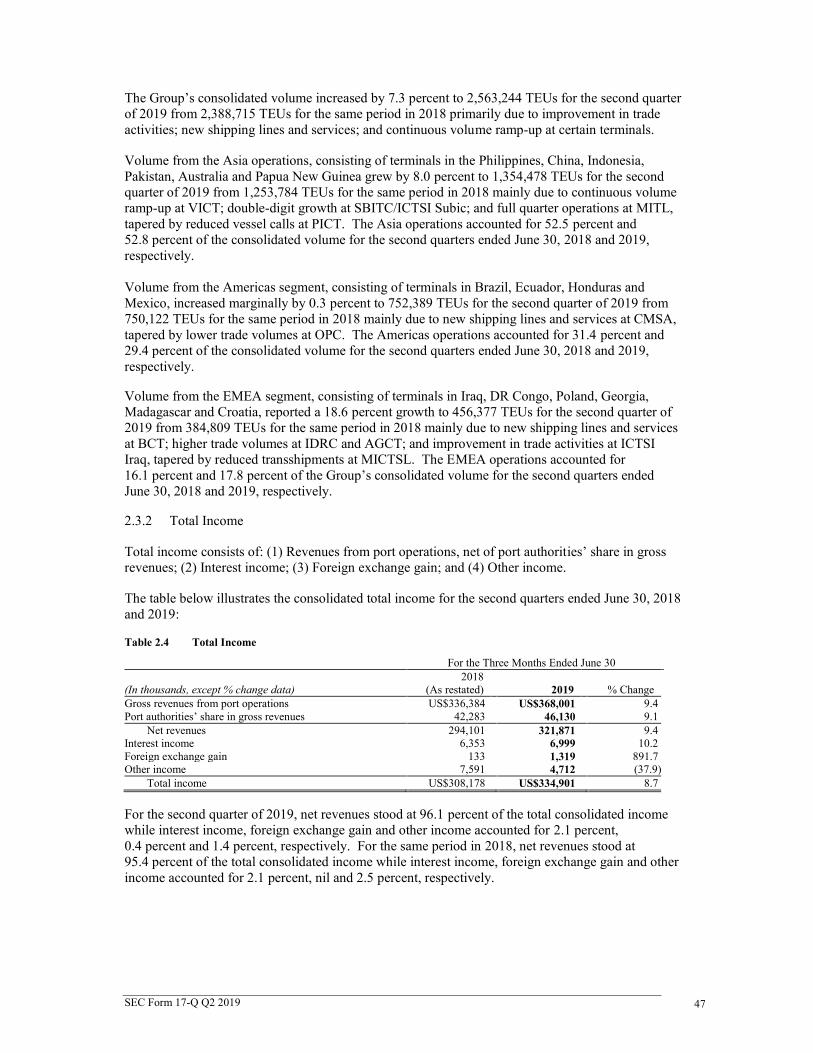
SEC Form 17-Q Q2 2019 4747
The Group’s consolidated volume increased by 7.3 percent to 2,563,244 TEUs for the second quarterof 2019 from 2,388,715 TEUs for the same period in 2018 primarily due to improvement in tradeactivities; new shipping lines and services; and continuous volume ramp-up at certain terminals.
Volume from the Asia operations, consisting of terminals in the Philippines, China, Indonesia,Pakistan, Australia and Papua New Guinea grew by 8.0 percent to 1,354,478 TEUs for the secondquarter of 2019 from 1,253,784 TEUs for the same period in 2018 mainly due to continuous volumeramp-up at VICT; double-digit growth at SBITC/ICTSI Subic; and full quarter operations at MITL,tapered by reduced vessel calls at PICT. The Asia operations accounted for 52.5 percent and52.8 percent of the consolidated volume for the second quarters ended June 30, 2018 and 2019,respectively.
Volume from the Americas segment, consisting of terminals in Brazil, Ecuador, Honduras andMexico, increased marginally by 0.3 percent to 752,389 TEUs for the second quarter of 2019 from750,122 TEUs for the same period in 2018 mainly due to new shipping lines and services at CMSA,tapered by lower trade volumes at OPC. The Americas operations accounted for 31.4 percent and29.4 percent of the consolidated volume for the second quarters ended June 30, 2018 and 2019,respectively.
Volume from the EMEA segment, consisting of terminals in Iraq, DR Congo, Poland, Georgia,Madagascar and Croatia, reported a 18.6 percent growth to 456,377 TEUs for the second quarter of2019 from 384,809 TEUs for the same period in 2018 mainly due to new shipping lines and servicesat BCT; higher trade volumes at IDRC and AGCT; and improvement in trade activities at ICTSIIraq, tapered by reduced transshipments at MICTSL. The EMEA operations accounted for16.1 percent and 17.8 percent of the Group’s consolidated volume for the second quarters endedJune 30, 2018 and 2019, respectively.
2.3.2 Total Income
Total income consists of: (1) Revenues from port operations, net of port authorities’ share in grossrevenues; (2) Interest income; (3) Foreign exchange gain; and (4) Other income.
The table below illustrates the consolidated total income for the second quarters ended June 30, 2018and 2019:
Table 2.4 Total Income
For the Three Months Ended June 30
(In thousands, except % change data)2018
(As restated) 2019 % ChangeGross revenues from port operations US$336,384 US$368,001 9.4Port authorities’ share in gross revenues 42,283 46,130 9.1
Net revenues 294,101 321,871 9.4Interest income 6,353 6,999 10.2Foreign exchange gain 133 1,319 891.7Other income 7,591 4,712 (37.9)
Total income US$308,178 US$334,901 8.7
For the second quarter of 2019, net revenues stood at 96.1 percent of the total consolidated incomewhile interest income, foreign exchange gain and other income accounted for 2.1 percent,0.4 percent and 1.4 percent, respectively. For the same period in 2018, net revenues stood at95.4 percent of the total consolidated income while interest income, foreign exchange gain and otherincome accounted for 2.1 percent, nil and 2.5 percent, respectively.

SEC Form 17-Q Q2 2019 4848
2.3.2.1 Gross Revenues from Port Operations
Gross revenues from port operations include fees received for cargo handling, wharfage, berthing,storage, and special services.
Table 2.5 Gross Revenues from Port Operations
For the Three Months Ended June 30(In thousands, except % change data) 2018 2019 % ChangeAsia US$161,697 US$182,711 13.0Americas 103,226 106,537 3.2EMEA 71,461 78,753 10.2
US$336,384 US$368,001 9.4
The Group’s consolidated gross revenues from port operations increased by 9.4 percent toUS$368.0 million for the second quarter of 2019 from US$336.4 million for the same period in 2018mainly due to volume growth; tariff adjustments at certain terminals; new contracts with shippinglines and services; and increase in revenues from general cargoes, storage and ancillary services.
Gross revenues from the Asia segment grew by 13.0 percent to US$182.7 million for the secondquarter of 2019 from US$161.7 million for the same period in 2018 mainly due to volume growth;tariff adjustments at certain terminals; favorable container mix; infrastructure levy at VICT; andincrease in revenues from storage and ancillary services, partially tapered by lower trade volumes atPICT; and unfavorable translation impact of the depreciation of Australian Dollars (AUD)-basedrevenues at VICT. The Asia operations captured 48.1 percent and 49.6 percent of the consolidatedgross revenues for the second quarters ended June 30, 2018 and 2019, respectively.
Gross revenues from the Americas segment increased by 3.2 percent to US$106.5 million for thesecond quarter of 2019 from US$103.2 million for the same period in 2018 mainly due to volumegrowth; tariff adjustments at CMSA, TSSA and OPC; and increase in revenues from storage andancillary services, partially tapered by unfavorable translation impact of the depreciation of BrazilianReais (BRL)-based revenues at TSSA. The Americas operations accounted for 30.7 percent and29.0 percent of the consolidated gross revenues for the second quarters ended June 30, 2018 and2019, respectively.
Gross revenues from the EMEA operations increased by 10.2 percent to US$78.8 million for thesecond quarter of 2019 from US$71.5 million for the same period in 2018 primarily due to volumegrowth; increase in revenues from general cargoes at ICTSI Iraq; and infrastructure levy at IDRC,partially tapered by unfavorable translation impact of the depreciation of Euro (EUR)-basedrevenues at MICTSL and AGCT. The EMEA operations stood at 21.2 percent and 21.4 percent ofthe consolidated gross revenues for the second quarters ended June 30, 2018 and 2019, respectively.
2.3.2.2 Port Authorities’ Share in Gross Revenues
Port authorities’ share in gross revenues, which represents the variable fees paid to Port Authoritiesat certain terminals, increased by 9.1 percent to US$46.1 million for the second quarter of 2019 fromUS$42.3 million for the same period in 2018 as a result of volume growth and stronger revenues atthese terminals.
2.3.2.3 Interest Income, Foreign Exchange Gain and Other Income
Consolidated interest income increased by 10.2 percent to US$7.0 million for the second quarter of2019 from US$6.4 million for the same period in 2018 mainly due to higher interest income earnedfrom advances to SPIA, a joint venture associate.
Foreign exchange gain increased to US$1.3 million for the second quarter of 2019 fromUS$0.1 million for the same period in 2018 mainly due to the favorable translation impact of certaincurrencies against US dollar. Foreign exchange gain mainly arises from the settlement and

SEC Form 17-Q Q2 2019 4949
translation or restatement adjustments of foreign currency-denominated monetary assets andliabilities.
Other income decreased to US$4.7 million for the second quarter of 2019 from US$7.6 million forthe same period in 2018 mainly due to the absence of the non-recurring pre-termination gain fromthe interest rate swap at CMSA in 2018. Other income includes the Group’s rental, dividendincome, and other sundry income accounts.
2.3.3 Total Expenses
The table below shows the breakdown of total expenses for the second quarters ended June 30, 2018and 2019.
Table 2.6 Total Expenses
Total cash operating expenses of the Group increased by 3.8 percent to US$120.0 million for thesecond quarter ended June 30, 2019 from US$115.6 million for the same period in 2018 mainly dueto volume growth; government-mandated and contracted salary rate adjustments at certain terminals;increase in professional fees; taxes and licenses; and full quarter cost contribution of MITL, partiallytapered by continuous monitoring of cost optimization measures; and favorable translation impact ofPakistan Rupee (PKR)-based expenses at PICT, AUD-based expenses at VICT and BRL-basedexpenses at TSSA.
2.3.3.1 Manpower Costs
Manpower costs increased by 8.9 percent to US$59.5 million for the second quarter of 2019 fromUS$54.7 million for the same period in 2018 primarily driven by volume growth; government-mandated and contracted salary rate adjustments at certain terminals; and full quarter costcontribution of MITL, partially tapered by continuous monitoring of cost optimization measures.
Manpower costs accounted for 47.3 percent and 49.6 percent of consolidated cash operatingexpenses for the second quarters ended June 30, 2018 and 2019, respectively.
2.3.3.2 Equipment and Facilities-Related Expenses
Equipment and facilities-related expenses consist mainly of repairs and maintenance costs of portequipment and facilities, power and light, tools expenses, equipment rentals, and fuel, oil andlubricants.
Equipment and facilities-related expenses decreased by 3.8 percent to US$27.9 million for thesecond quarter of 2019 from US$29.0 million for the same period in 2018 mainly due to the absenceof external yard rental and port lease expense at SPICTL and MITL in 2018, partially tapered byhigher fuel and power consumption and increase in equipment rental driven by volume growth; andincrease in price of fuel at certain terminals.
For the Three Months Ended June 30
(In thousands, except % change data)2018
(As restated) 2019 % ChangeManpower costs US$54,655 US$59,519 8.9Equipment and facilities-related expenses 29,034 27,934 (3.8)Administrative and other operating expenses 31,889 32,562 2.1
Total cash operating expenses 115,578 120,015 3.8Depreciation and amortization 54,879 57,833 5.4Interest expense and financing charges on borrowings 25,746 27,976 8.7Interest expense on lease liabilities 26,050 25,859 (0.7)Interest expense on concession rights payable 8,970 9,986 11.3Equity in net loss of a joint venture and an associate 7,578 6,266 (17.3)Foreign exchange loss and others 4,937 3,841 (22.2)
Total expenses US$243,738 US$251,776 3.3

SEC Form 17-Q Q2 2019 5050
Equipment and facilities-related expenses represented 25.1 percent and 23.3 percent of consolidatedcash operating expenses for the second quarters ended June 30, 2018 and 2019, respectively.
2.3.3.3 Administrative and Other Operating Expenses
Administrative and other operating expenses increased by 2.1 percent to US$32.6 million for thesecond quarter of 2019 from US$31.9 million for the same period in 2018 mainly due to increase intaxes and licenses driven by revenue growth; and increase in professional fees, partially tapered byreduction in office expenses and travel costs.
Administrative and other operating expenses stood at 27.6 percent and 27.1 percent of consolidatedcash operating expenses for the second quarters ended June 30, 2018 and 2019, respectively.
2.3.3.4 Depreciation and Amortization
Depreciation and amortization expense increased by 5.4 percent to US$57.8 million for the secondquarter of 2019 from US$54.9 million for the same period in 2018 mainly due to higher depreciationarising from expansion projects at MICT, ICTSI Iraq and OPC; and full quarter depreciation of portequipment at MITL and SPICTL.
2.3.3.5 Interest and Financing Charges on Borrowings
Interest and financing charges on borrowings increased by 8.7 percent to US$28.0 million for thesecond quarter of 2019 from US$25.7 million for the same period in 2018 due to higher averageoutstanding loan balance during the period arising from new term loans obtained in 2019.
2.3.3.6 Interest Expense on Lease Liabilities
Interest expense on lease liabilities decreased marginally by 0.7 percent to US$25.9 million for thesecond quarter of 2019 from US$26.1 million for the same period in 2018 mainly due to favorabletranslation impact of AUD-based interest expense at VICT and BRL-based interest expense atTSSA.
2.3.3.7 Interest Expense on Concession Rights Payable
Interest expense on concession rights payable increased by 11.3 percent to US$10.0 million for thesecond quarter ended June 30, 2019 from US$9.0 million for the same period in 2018 mainly due tothe full quarter impact of the concession right liabilities recognized at SPICTL and MITL in June2018.
2.3.3.8 Equity in Net Loss of A Joint Venture and An Associate
Equity in net loss of a joint venture and an associate decreased by 17.3 percent to US$6.3 million inthe second quarter of 2019 from US$7.6 million for the same period in 2018 mainly due to thedecrease in the Company’s share in net loss at SPIA driven by volume and revenue growth resultingto higher EBITDA. Equity in net loss of a joint venture and an associate in 2019 is net of theGroup’s share in net income of MNHPI, a 50.00%-owned associate.
2.3.3.9 Foreign Exchange Loss and Others
Foreign exchange loss and others decreased to US$3.8 million in the second quarter of 2019 fromUS$4.9 million for the same period in 2018 mainly due to decrease in foreign exchange loss arisingfrom the favorable translation impact of certain currencies against US dollar. Foreign exchange lossmainly results from the translation or restatement as well as from the settlement of foreign currency-denominated monetary assets and liabilities.

SEC Form 17-Q Q2 2019 5151
2.3.4 EBITDA and EBIT
Consolidated EBITDA increased by 13.1 percent to US$201.9 million for the second quarter of 2019from US$178.5 million for the same period in 2018 primarily due to strong revenues. EBITDAmargin increased to 54.9 percent in 2019 from 53.1 percent in 2018.
Meanwhile, consolidated EBIT increased by 16.5 percent to US$144.0 million for the second quarterof 2019 from US$123.6 million for the same period in 2018 mainly due to stronger EBITDA,partially tapered by higher depreciation charges. EBIT margin increased to 39.1 percent in 2019from 36.8 percent in 2018.
2.3.5 Income Before Income Tax and Provision for Income Tax
Consolidated income before income tax increased by 29.0 percent to US$83.1 million for the quarterended June 30, 2019 from US$64.4 million for the same period in 2018 primarily due to strongoperating income and decrease in equity in net loss at SPIA. Excluding the non-recurring pre-termination gain from the interest rate swap at CMSA in 2018, consolidated income before incometax would have increased by 37.4 percent in 2019. The ratio of consolidated income before incometax to consolidated gross revenues stood at 19.2 percent and 22.6 percent in 2018 and 2019,respectively.
Consolidated provision for current and deferred income taxes increased to US$18.6 million for thesecond quarter of 2019 from US$8.2 million for the same period in 2018 mainly due to highertaxable income at most of the terminals; and increase in deferred income tax expense onremeasurement of nonmonetary assets from local currency to functional currency at CMSA; andlower deferred income tax benefit on net operating losses at VICT, partially tapered by decrease indeferred income tax expense from unrealized foreign exchange loss at MICT. Effective income taxrate in 2018 and 2019 stood at 12.8 percent and 22.3 percent, respectively.
2.3.6 Net Income
Consolidated net income increased by 14.9 percent to US$64.6 million for the quarter endedJune 30, 2019 from US$56.2 million for the same period in 2018. Excluding the non-recurring pre-termination gain from the interest rate swap at CMSA in 2018, consolidated net income would haveincreased by 20.8 percent in 2019. The ratio of consolidated net income to gross revenues stood at16.7 percent and 17.5 percent in 2018 and 2019, respectively.
Consolidated net income attributable to equity holders increased by 13.6 percent to US$56.1 millionfor the quarter ended June 30, 2019 from US$49.4 million for the same period in 2018. Excludingthe non-recurring pre-termination gain from the interest rate swap at CMSA in 2018, consolidatednet income attributable to equity would have increased by 20.3 percent in 2019.
Basic and diluted earnings per share increased to US$0.020 in 2019 from US$0.016 in 2018.

SEC Form 17-Q Q2 2019 5252
2.4 Comparison of Operating Results for the Six Months Ended June 30, 2019 and 2018
2.4.1 TEU Volume
The below table presents the volume (in TEU) handled by the Group for the six months endedJune 30, 2018 and 2019:
Table 2.7 Volume
For the Six Months Ended June 302018 2019 % Change
Asia 2,495,093 2,653,248 6.3Americas 1,446,972 1,498,004 3.5EMEA 772,190 890,664 15.3
4,714,255 5,041,916 7.0
Consolidated volume handled by the Group increased by 7.0 percent to 5,041,916 TEUs for the firstsix months of 2019 from 4,714,255 TEUs for the same period in 2018 mainly due to improvement intrade activities; new contracts with shipping lines and services; and continuous volume ramp-up atcertain terminals.
Volume from the Asia segment increased by 6.3 percent to 2,653,248 TEUs for the first six monthsof 2019 from 2,495,093 TEUs for the same period in 2018 mainly due to continuous volumeramp-up at VICT; full six months operations at SPICTL and MITL; and double-digit growth atSBITC/ICTSI Subic, partially tapered by reduced vessel calls at PICT. The Asia operationsaccounted for 52.9 percent and 52.6 percent of the consolidated volume for the six months endedJune 30, 2018 and 2019.
Volume from the Americas segment increased by 3.5 percent to 1,498,004 TEUs for the first sixmonths of 2019 from 1,446,972 TEUs for the same period in 2018 mainly due to new shipping linesand services at CMSA and CGSA; and higher trade volumes at TSSA, partially tapered by lowertrade volumes at OPC. The Americas operations accounted for 30.7 percent and 29.7 percent of theconsolidated volume for the six months ended June 30, 2018 and 2019, respectively.
Volume from the EMEA segment increased by 15.3 percent to 890,664 TEUs for the first sixmonths of 2019 from 772,190 TEUs for the same period in 2018 mainly due to new shipping linesand services at BCT; increased trade volumes at IDRC and AGCT; and improvement in tradeactivities at ICTSI Iraq. The EMEA segment stood at 16.4 percent and 17.7 percent of theconsolidated volume for the six months ended June 30, 2018 and 2019, respectively.
2.4.2 Total Income
Table 2.8 Total Income
For the Six Months Ended June 30
(In thousands, except % change data)2018
(As restated) 2019 % ChangeGross revenues from port operations US$661,764 US$751,785 13.6Port authorities’ share in gross revenues 84,525 95,343 12.8
Net revenues 577,239 656,442 13.7Interest income 12,161 13,101 7.7Foreign exchange gain 2,163 2,881 33.2Other income 9,204 7,195 (21.8)
Total income US$600,767 US$679,619 13.1
For the six months ended June 30, 2019, net revenues accounted for 96.6 percent of the totalconsolidated income while interest income, foreign exchange gain and other income represented1.9 percent, 0.4 percent and 1.1 percent, respectively. For the same period in 2018, net revenuesaccounted for 96.1 percent of the total consolidated income while interest income, foreign exchangegain, and other income represented 2.0 percent, 0.4 percent and 1.5 percent, respectively.

SEC Form 17-Q Q2 2019 5353
2.4.2.1 Gross Revenues from Port Operations
Gross revenues from port operations include fees received for cargo handling, wharfage, berthing,storage, and special services.
Table 2.9 Gross Revenues from Port Operations
For the Six Months Ended June 30(In thousands, except % change data) 2018 2019 % ChangeAsia US$316,735 US$378,959 19.6Americas 204,590 218,552 6.8EMEA 140,439 154,274 9.9
US$661,764 US$751,785 13.6
The Group’s consolidated gross revenues from port operations increased by 13.6 percent toUS$751.8 million for the first six months of 2019 from US$661.8 million for the same period in2018 mainly due to volume growth; tariff adjustments at certain terminals; new contracts withshipping lines and services; and increase in revenues from general cargoes, storage and ancillaryservices.
Gross revenues from the Asia segment grew by 19.6 percent to US$379.0 million for the first sixmonths of 2019 from US$316.7 million for the same period in 2018 mainly due to volume growth;tariff adjustments at certain terminals; favorable container mix; infrastructure levy at VICT; andincrease in revenues from storage and ancillary services, partially tapered by lower trade volumes atPICT; and unfavorable translation impact of the depreciation of AUD-based revenues at VICT. TheAsia segment accounted for 47.9 percent and 50.4 percent of the consolidated gross revenues for thesix months ended June 30, 2018 and 2019, respectively.
Gross revenues from the Americas segment increased by 6.8 percent to US$218.6 million for thefirst six months of 2019 from US$204.6 million for the same period in 2018 mainly due to volumegrowth; tariff adjustments at CMSA, TSSA and OPC; increase in revenues from storage andancillary services, partially tapered by unfavorable translation impact of the depreciation of BrazilianReais (BRL)-based revenues at TSSA. The Americas segment stood at 30.9 percent and29.1 percent of the consolidated gross revenues for the six months ended June 30, 2018 and 2019,respectively.
Gross revenues from the EMEA segment increased by 9.9 percent to US$154.3 million for the firstsix months of 2019 from US$140.4 million for the same period in 2018 primarily due to volumegrowth; increase in revenues from general cargoes and storage at ICTSI Iraq; and infrastructure levyat IDRC, partially tapered by unfavorable translation impact of the depreciation of EUR-basedrevenues at MICTSL and AGCT. The EMEA operations accounted for 21.2 percent and20.5 percent of the consolidated gross revenues for the six months ended June 30, 2018 and 2019,respectively.
2.4.2.2 Port Authorities’ Share in Gross Revenues
Port authorities’ share in gross revenues, which represents the variable fees paid to Port Authoritiesby certain terminals, increased by 12.8 percent to US$95.3 million for the first six months of 2019from US$84.5 million for the same period in 2018 as a result of volume growth and strongerrevenues at these terminals.
2.4.2.3 Interest Income, Foreign Exchange Gain, and Other Income
Consolidated interest income increased by 7.7 percent to US$13.1 million for the first six months of2019 from US$12.2 million for the same period in 2018 mainly due to higher interest income earnedfrom advances to SPIA, a joint venture associate.

SEC Form 17-Q Q2 2019 5454
Foreign exchange gain increased to US$2.9 million for the first six months of 2019 fromUS$2.2 million for the same period in 2018 mainly due to the favorable translation impact of certaincurrencies against US dollar. Foreign exchange gain mainly arises from the settlement andtranslation or restatement adjustments of foreign currency-denominated monetary assets andliabilities.
Other income decreased to US$7.2 million for the first six months of 2019 from US$9.2 million forthe same period in 2018 mainly due to the absence of a non-recurring gain from pre-termination ofinterest rate swap at CMSA in 2018. Other income includes the Group’s rental, dividend income,and other sundry income accounts of ICTSI and subsidiaries.
2.4.3 Total Expenses
The table below shows the breakdown of total expenses for the six months ended June 30, 2018 and2019:
Table 2.10 Total Expenses
For the Six Months Ended June 30
(In thousands, except % change data)2018
(As restated) 2019 % ChangeManpower costs US$107,214 US$116,831 9.0Equipment and facilities-related expenses 55,146 54,891 (0.5)Administrative and other expenses 58,817 60,321 2.6
Total cash operating expenses 221,177 232,043 4.9Depreciation and amortization 109,509 115,225 5.2Interest expense and financing charges on borrowings 53,697 53,739 0.1Interest expense on lease liabilities 53,131 51,786 (2.5)Interest expense on concession rights payable 17,038 19,995 17.4Equity in net loss of a joint venture and an associate 16,036 12,398 (22.7)Foreign exchange loss and others 10,071 7,965 (20.9)
Total expenses US$480,659 US$493,151 2.6
The Group’s cash operating expenses increased by 4.9 percent to US$232.0 million for the sixmonths ended June 30, 2019 from US$221.2 million for the same period in 2018 mainly due tovolume growth; government-mandated and contracted salary rate adjustments at certain terminals;increase in information technology-related expenses; and full six months cost contribution ofSPICTL and MITL, partially tapered by continuous monitoring of cost optimization measures; andfavorable translation impact of, PKR-based expenses at PICT, AUD-based expenses at VICT andBRL-based expenses at TSSA.
2.4.3.1 Manpower Costs
Manpower costs increased by 9.0 percent to US$116.8 million for the first six months of 2019 fromUS$107.2 million for the same period in 2018 driven by volume growth; government-mandated andcontracted salary rate adjustments at certain terminals; and full six months cost contribution ofSPICTL and MITL, partially tapered by continuous monitoring of cost optimization measures.
Manpower costs accounted for 48.5 percent and 50.3 percent of consolidated cash operatingexpenses for the six months ended June 30, 2018 and 2019, respectively.

SEC Form 17-Q Q2 2019 5555
2.4.3.2 Equipment and Facilities-related Expenses
Equipment and facilities-related expenses consist mainly of repairs and maintenance costs of portequipment and facilities, power and light, tools expenses, equipment rentals, and fuel, oil andlubricants.
Equipment and facilities-related expenses decreased marginally by 0.5 percent to US$54.9 millionfor the first six months of 2019 from US$55.1 million for the same period in 2018 mainly due to theabsence of external yard rental and port lease expense at SPICTL and MITL in 2018, partiallytapered by higher fuel and power consumption and increase in equipment rental driven by volumegrowth; and increase in prices of fuel.
Equipment and facilities-related expenses stood at 24.9 percent and 23.7 percent of consolidatedcash operating expenses for the six months ended June 30, 2018 and 2019, respectively.
2.4.3.3 Administrative and Other Operating Expenses
Administrative and other operating expenses increased by 2.6 percent to US$60.3 million for thefirst six months of 2019 from US$58.8 million for same period in 2018 mainly due to increase ininformation technology-related and business development expenses, partially tapered by reduction inoffice expenses and travel costs.
Administrative and other operating expenses accounted for 26.6 percent and 26.0 percent ofconsolidated cash operating expenses for the six months ended June 30, 2018 and 2019, respectively.
2.4.3.4 Depreciation and Amortization
Depreciation and amortization expense increased by 5.2 percent to US$115.2 million for the firstsix months of 2019 from US$109.5 million for the same period in 2018 mainly due to higherdepreciation arising from expansion projects at MICT, ICTSI Iraq and OPC; and full six monthsdepreciation of port equipment at SPICTL and MITL.
2.4.3.5 Interest and Financing Charges on Borrowings
Interest and financing charges on borrowings increased marginally by 0.1 percent toUS$53.7 million for the first six months of 2019 from US$53.7 million for the same period in 2018due to higher average outstanding loan balance during the period arising from term loans obtained in2019, tapered by interest reduction from pre-termination of the Project Finance Facility at CMSA inMay 2018.
2.4.3.6 Interest Expense on Lease Liabilities
Interest expense on lease liabilities decreased by 2.5 percent to US$51.8 million for the first sixmonths of 2019 from US$53.1 million for the same period in 2018 mainly due to favorabletranslation impact of AUD-based interest expense at VICT and BRL-based interest expense atTSSA.
2.4.3.7 Interest Expense on Concession Rights Payable
Interest on concession rights payable increased by 17.4 percent to US$20.0 million for the first sixmonths ended June 30, 2019 from US$17.0 million for the same period in 2018 mainly due to theconcession right liabilities recognized at SPICTL and MITL in June 2018.
2.4.3.8 Equity in Net Loss of A Joint Venture and An Associate
Equity in net loss of a joint venture and an associate decreased by 22.7 percent to US$12.4 millionfor the first six months of 2019 from US$16.0 million for the same period in 2018 mainly due to the
SEC Form 17-Q Q2 2019 5656
decrease in the Company’s share in net loss at SPIA driven by volume and revenue growth andhigher EBITDA. Equity in net loss of a joint venture and an associate in 2019 is net of the Group’sshare in net income of MNHPI, a 50.00%-owned associate.
2.4.3.9 Foreign Exchange Loss and Others
Foreign exchange loss and others decreased to US$8.0 million for the first six months of 2019 fromUS$10.1 million for the same period in 2018 mainly due to decrease in foreign exchange loss arisingfrom the favorable translation impact of certain currencies against US dollar. Foreign exchange lossmainly results from the translation or restatement as well as from the settlement of foreign currency-denominated monetary assets and liabilities.
2.4.4 EBITDA and EBIT
Consolidated EBITDA increased by 19.2 percent to US$424.4 million for the first six months of2019 from US$356.1 million for the same period in 2018 primarily due to strong revenues.EBITDA margin increased to 56.5 percent in 2019 from 53.8 percent in 2018.
Meanwhile, consolidated EBIT went up by 25.4 percent to US$309.2 million for the first six monthsof 2019 from US$246.6 million for the same period in 2018 mainly due to stronger EBITDA,tapered by higher depreciation. EBIT margin increased to 41.1 percent in 2019 from 37.3 percent in2018.
2.4.5 Income Before Income Tax and Provision for Income Tax
Consolidated income before income tax increased by 55.3 percent to US$186.5 million for the firstsix months of 2019 from US$120.1 million for the same period in 2018 primarily due to strongoperating income; and decrease in equity in net loss at SPIA. Excluding the non-recurring pre-termination gain from the interest rate swap at CMSA in 2018, consolidated income before incometax would have increased by 60.5 percent in 2019. The ratio of consolidated income before incometax to consolidated gross revenues stood at 18.1 percent and 24.8 percent in 2018 and 2019,respectively.
Consolidated provision for current and deferred income taxes increased to US$40.4 million for thefirst six months of 2019 from US$16.2 million for the same period in 2018 mainly due to highertaxable income at most of the terminals; and increase in deferred income tax expense onremeasurement of nonmonetary assets from local currency to functional currency at CMSA; andlower deferred income tax benefit on net operating losses at VICT, partially tapered by decrease indeferred income tax expense from unrealized foreign exchange loss at MICT. Effective income taxrate in 2018 and 2019 stood at 13.5 percent and 21.7 percent, respectively.
2.4.6 Net Income
Consolidated net income increased by 40.6 percent to US$146.1 million for the first six months of2019 from US$103.9 million for the same period in 2018. Excluding the non-recurring pre-termination gain from the interest rate swap at CMSA in 2018, consolidated net income would haveincreased by 44.4 percent in 2019. The ratio of consolidated net income to gross revenues stood at15.7 percent and 19.4 percent for the six months ended June 30, 2018 and 2019, respectively.
Consolidated net income attributable to equity holders increased by 42.4 percent toUS$128.5 million for six months ended June 30, 2019 from US$90.2 million for the same period in2018. Excluding the non-recurring pre-termination gain from the interest rate swap at CMSA in2018, consolidated net income attributable to equity holders would have increased by 46.8 percent in2019.
Basic and diluted earnings per share increased to US$0.048 in 2019 from US$0.029 in 2018.
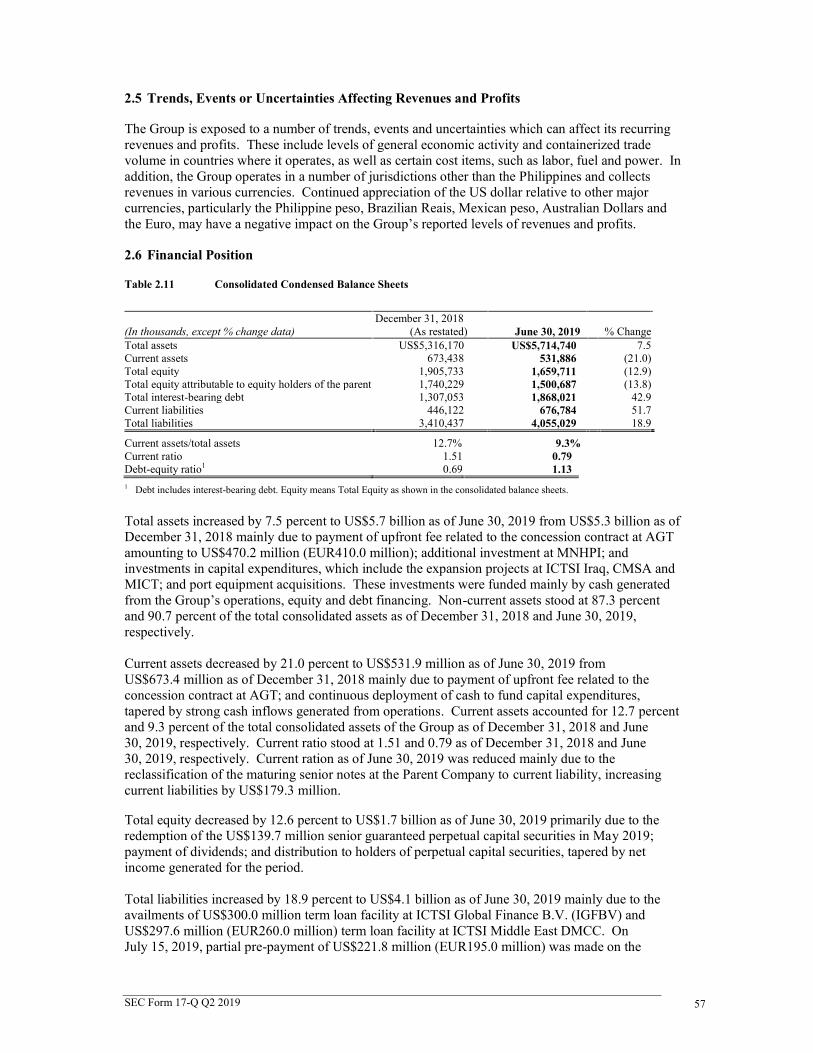
SEC Form 17-Q Q2 2019 5757
2.5 Trends, Events or Uncertainties Affecting Revenues and Profits
The Group is exposed to a number of trends, events and uncertainties which can affect its recurringrevenues and profits. These include levels of general economic activity and containerized tradevolume in countries where it operates, as well as certain cost items, such as labor, fuel and power. Inaddition, the Group operates in a number of jurisdictions other than the Philippines and collectsrevenues in various currencies. Continued appreciation of the US dollar relative to other majorcurrencies, particularly the Philippine peso, Brazilian Reais, Mexican peso, Australian Dollars andthe Euro, may have a negative impact on the Group’s reported levels of revenues and profits.
2.6 Financial Position
Table 2.11 Consolidated Condensed Balance Sheets
(In thousands, except % change data)December 31, 2018
(As restated) June 30, 2019 % ChangeTotal assets US$5,316,170 US$5,714,740 7.5Current assets 673,438 531,886 (21.0)Total equity 1,905,733 1,659,711 (12.9)Total equity attributable to equity holders of the parent 1,740,229 1,500,687 (13.8)Total interest-bearing debt 1,307,053 1,868,021 42.9Current liabilities 446,122 676,784 51.7Total liabilities 3,410,437 4,055,029 18.9
Current assets/total assets 12.7% 9.3%Current ratio 1.51 0.79Debt-equity ratio1 0.69 1.131 Debt includes interest-bearing debt. Equity means Total Equity as shown in the consolidated balance sheets.
Total assets increased by 7.5 percent to US$5.7 billion as of June 30, 2019 from US$5.3 billion as ofDecember 31, 2018 mainly due to payment of upfront fee related to the concession contract at AGTamounting to US$470.2 million (EUR410.0 million); additional investment at MNHPI; andinvestments in capital expenditures, which include the expansion projects at ICTSI Iraq, CMSA andMICT; and port equipment acquisitions. These investments were funded mainly by cash generatedfrom the Group’s operations, equity and debt financing. Non-current assets stood at 87.3 percentand 90.7 percent of the total consolidated assets as of December 31, 2018 and June 30, 2019,respectively.
Current assets decreased by 21.0 percent to US$531.9 million as of June 30, 2019 fromUS$673.4 million as of December 31, 2018 mainly due to payment of upfront fee related to theconcession contract at AGT; and continuous deployment of cash to fund capital expenditures,tapered by strong cash inflows generated from operations. Current assets accounted for 12.7 percentand 9.3 percent of the total consolidated assets of the Group as of December 31, 2018 and June30, 2019, respectively. Current ratio stood at 1.51 and 0.79 as of December 31, 2018 and June30, 2019, respectively. Current ration as of June 30, 2019 was reduced mainly due to thereclassification of the maturing senior notes at the Parent Company to current liability, increasingcurrent liabilities by US$179.3 million.
Total equity decreased by 12.6 percent to US$1.7 billion as of June 30, 2019 primarily due to theredemption of the US$139.7 million senior guaranteed perpetual capital securities in May 2019;payment of dividends; and distribution to holders of perpetual capital securities, tapered by netincome generated for the period.
Total liabilities increased by 18.9 percent to US$4.1 billion as of June 30, 2019 mainly due to theavailments of US$300.0 million term loan facility at ICTSI Global Finance B.V. (IGFBV) andUS$297.6 million (EUR260.0 million) term loan facility at ICTSI Middle East DMCC. OnJuly 15, 2019, partial pre-payment of US$221.8 million (EUR195.0 million) was made on the

SEC Form 17-Q Q2 2019 5858
EUR260 term loan facility. Financial leverage, the ratio of total interest-bearing debt to total assets,stood at 24.6 percent and 32.7 percent as of December 31, 2018 and June 30, 2019, respectively.
Meanwhile, current liabilities increased to US$676.8 million as of June 30, 2019 fromUS$446.1 million as of December 31, 2018 mainly due to the reclassification of the US$179.3million senior notes scheduled for repayment in the next twelve-months at the Parent Company; andhigher accounts payable, tapered by partial repayment of loans at OPC and BCT.
2.6.1 Material Variances Affecting the Balance Sheet
Balance sheet accounts as of June 30, 2019 with variances of plus or minus 5.0 percent againstDecember 31, 2018 balances are discussed, as follows:
Noncurrent Assets1. Deferred tax assets increased by 7.3 percent to US$266.2 million as of June 30, 2019 mainly due
to deferred income tax benefit from net operating loss carry-over recognized at VICT.2. Investment and advances in and advances to a joint venture and associate increased by
17.4 percent to 447.5 million as of June 30, 2019 mainly due to additional acquisition of the15.17 % stake in MNHPI.
3. Other noncurrent assets increased to US$566.6 million as of June 30, 2019 mainly due topayment of upfront fee related to the concession contract at AGT.
Current Assets4. Cash and cash equivalents decreased by 33.9 percent to US$295.6 million as of June 30, 2019
due to payment of upfront fee related to the concession contract at AGT; continuous deploymentof cash to fund capital expenditures; and partial repayment of loans at OPC and VICT during theperiod.
5. Receivables decreased by 8.9 percent to US$109.7 million as of June 30, 2019 mainly due toimproved collections at certain terminals.
6. Prepaid expenses and other current assets increased by 28.0 percent to US$91.5 million as ofJune 30, 2019 mainly due to timing of utilization of input tax at Parent Company and CMSA.
7. Derivative assets decreased to US$60 thousand as of June 30, 2019 due to loss on mark-to-market valuation from interest rate swap at CGSA.
Equity8. Treasury shares decreased by 7.5 percent to US$53.7 million as of June 30, 2019 mainly as a
result of stock awards vested and issued in 2019.9. Retained earnings decreased by 25.7 percent to US$297.2 million as of June 30, 2019 mainly
due to dividends declared and paid during the period; and distribution to holders of perpetualcapital securities, partially tapered by net income attributable to equity holders of the parent forthe first six months amounting to US$128.5 million.
10. Perpetual capital securities decreased by 11.7 percent to US$1.0 billion as of June 30, 2019 dueto the redemption of the US$139.7 million senior guaranteed perpetual securities in May 2019.
Noncurrent Liabilities11. Noncurrent portion of long-term debt increased by 31.8 percent to US$1.6 billion as of June
30, 2019 mainly due to availments of term loan facilities at IGFBV amounting to US$300.0million and ICTSI Middle East DMCC amounting to US$297.6 million (EUR260.0 million),partially tapered by partial repayment of loans at OPC and VICT. On July 15, 2019, partial pre-payment of US$221.8 million (EUR195.0 million) was made on the EUR260 term loan facility.
12. Deferred tax liabilities increased by 13.2 percent to US$65.5 million as of June 30, 2019mainly due to the income tax effect of translation difference between functional and localcurrency; and difference in depreciation and amortization periods of port infrastructureclassified as concession rights at certain terminals.
13. Other noncurrent liabilities increased by 23.4 percent to US$40.4 million as of June 30, 2019arising mainly from loss on mark-to-market valuation from interest rate swap at VICT.

SEC Form 17-Q Q2 2019 5959
Current Liabilities14. Loans payable decreased by 11.6 percent to US$31.6 million as of June 30, 2019 due to
repayment of loan at BCT.15. Accounts payable and other current liabilities increased by 13.6 percent to US$349.6 million as
of June 30, 2019 mainly due to port equipment payables at MICT; and the additional investmentcost for the increased stake in MNHPI.
16. Current portion of long-term debt increased by to US$227.6 million as of June 30, 2019primarily due to the reclassification of the senior notes scheduled for repayment in the nexttwelve months at the Parent Company, tapered by partial repayment of loan at OPC.
17. Current portion of lease liabilities increased by 15.3 percent to US$10.4 million as ofJune 30, 2019 mainly arising from higher lease scheduled for payment at TSSA in the nexttwelve months.
18. Income tax payable increased by 9.8 percent to US$34.7 million as of June 30, 2019 mainly dueto higher taxable income at ICTSI Iraq.
19. Derivative liabilities increased to US$12.0 million as of June 30, 2019 due to loss on mark-to-market valuation from interest rate swap at IGFBV and VICT.
2.7 Liquidity and Capital Resources
This section discusses the Group’s sources and uses of funds as well as its debt and equity capitalprofile.
2.7.1 Liquidity
The table below shows the Group’s consolidated cash flows as of June 30, 2018 and 2019:
Table 2.12 Consolidated Cash Flows
Consolidated cash and cash equivalents decreased by 26.4 percent to US$295.6 million as ofJune 30, 2019 from US$401.5 million for the same period in 2018 mainly due to payment of upfrontfee related to the concession contract at AGT; continuous deployment of cash to fund capitalexpenditures; and partial repayment of loans, tapered by strong cash inflows generated fromoperations.
Net cash provided by operating activities increased by 15.2 percent to US$373.7 million for thesix months ended June 30, 2019 from US$324.5 million for the same period in 2018 mainly due tostrong results of operations.
Net cash used in investing activities for the six months ended June 30, 2019 amounted toUS$598.3 million which consists mainly of payment of upfront fee related to the concession contractat AGT amounting to US$470.2 million (EUR410.0 million); additional investment at MNHPIamounting to US$48.4 million; and capital expenditures of US$120.5 million, excluding capitalizedborrowing costs. The Group finances these requirements through existing cash, cash generated fromoperations, external borrowings and/or equity issuances, as necessary.
Net cash provided by financing activities for the six months ended June 30, 2019 amounted toUS$73.6 million which consists mainly of the US$287.8 million (EUR253.4 million) andUS$300.0 million net proceeds from a loan availments at ICTSI Middle East and IGFBV,
For the Six Months Ended June 30
(In thousands, except % change data)2018
(As restated) 2019 % ChangeNet cash provided by operating activities US$324,506 US$373,688 15.2Net cash used in investing activities (168,461) (598,317) 255.2Net cash provided by (used in) financing activities (23,985) 73,575 (406.8)Effect of exchange rate changes on cash (9,949) (440) (95.6)Net increase (decrease) in cash and cash equivalents 122,111 (151,494) (224.1)Cash and cash equivalents, beginning 279,427 447,079 60.0Cash and cash equivalents, end US$401,538 US$295,585 (26.4)

SEC Form 17-Q Q2 2019 6060
respectively, tapered by partial repayment of loans at OPC, VICT and BCT; redemption of theperpetual capital securities amounting to US$139.7 million; payment of dividends; and debtservicing costs. Meanwhile, the net cash used in financing activities for the same period in 2018includes the US$392.3 million net proceeds from the issuance of senior guaranteed perpetual capitalsecurities in January 2018.
2.7.2 Capital Resources
The table below illustrates the Group’s capital sources as of December 31, 2018 and June 30, 2019:
Table 2.13 Capital Sources
(In thousands, except % change data)December 31, 2018
(As restated) June 30, 2019 % ChangeLoans payable US$35,718 US$31,568 (11.6)Current portion of long-term debt 50,848 227,633 347.7Long-term debt, net of current portion 1,220,487 1,608,820 31.8Total short and long-term debt 1,307,053 1,868,021 42.9Equity 1,905,733 1,665,763 (12.6)
US$3,212,786 US$3,533,784 10.0
The Group’s total debt and equity capital increased by 10.0 percent as of June 30, 2019 primarilydue to increase in debt and equity financing activities to fund acquisitions, expansion projects,capital expenditures and other general corporate requirements.
2.7.2.1 Debt Financing
The table below provides the breakdown of the Group’s outstanding loans as of June 30, 2019:
Table 2.14 Outstanding Loans
(In thousands) CompanyFinalMaturity Interest Rate Amount
Short-Term DebtPGK Loan SPICTL 2019 Fixed US$17,778PGK Loan MITL 2019 Fixed 13,790
US$31,568Long-Term DebtUnsecured US Dollar Bond ITBV 2023 –
2025Fixed 760,195
Secured US Dollar Term Loan IGFBV 2026 Fixed* 296,328Secured EUR Term Loan ICTSI Middle
East2022 Floating 292,729
Secured AUD Term Loan VICT 2023 –2031
Fixed* 239,420
Unsecured US Dollar Bond** Parent 2020 Fixed 179,264Secured US Dollar Term Loans IDRC 2022 Fixed 23,833Secured US Dollar Term Loans OPC 2020 Floating 19,500Secured US Dollar Term Loans CGSA 2021 Fixed* 13,382Secured RMB Term Loan YICT 2023 Floating 7,282Secured Euro Term Loans AGCT 2019 –
2024Fixed* 4,520
1,836,453Total Debt 1,868,021Less current portion and short-term 259,201Long-term debt, net of current portion US$1,608,820
*Under interest rate swap agreement**US$17.1 million under Euro-US Dollar cross currency swap agreement

SEC Form 17-Q Q2 2019 6161
The table below is a summary of debt maturities, net of unamortized debt issuance cost, of the Groupas of June 30, 2019:
Table 2.15 Outstanding Debt Maturities
(In thousands) Amount2019 US$26,7502020 236,3292021 33,4692022 321,7972023 and onwards 1,218,108
Total US$1,836,453
MTN ProgrammeOn January 9, 2013, ICTSI Treasury B.V. (ICTSI Treasury), a majority-owned subsidiary throughICTSI Ltd., established the MTN Programme that would allow ICTSI Treasury from time to time toissue medium-term notes (MTN), unconditionally and irrevocably guaranteed by ICTSI and listed onthe Singapore Stock Exchange. The aggregate nominal amount of the MTN outstanding will not atany time exceed US$750.0 million (or its equivalent in other currencies), subject to increase asdescribed in the terms and conditions of the Programme Agreement. In August 2013, the maximumaggregate nominal amount of the MTN outstanding that may be issued under the Programme wasincreased to US$1.0 billion.
Pursuant to the MTN Programme, on January 9, 2013, ICTSI Treasury and ICTSI signed aSubscription Agreement with HSBC and UBS AG, Hong Kong Branch, for the issuance of 10-yearUS$300.0 million guaranteed MTN (the “Original MTN”). The Original MTN were issued onJanuary 16, 2013 to mature on January 16, 2023 at a fixed interest rate of 4.625 percent p.a., net ofapplicable taxes, set at a price of 99.014 and payable semi-annually in arrears. Moreover, onJanuary 28, 2013, an additional US$100.0 million guaranteed MTN was issued to form a singleseries with the original MTN.
In June 2013, ICTSI purchased a total of US$6.0 million of ICTSI Treasury’s US$400.0 millionMTN at US$5.7 million.
In September 2013, ICTSI Treasury further issued US$207.5 million notes from the MTNProgramme at a fixed interest rate of 5.875 percent p.a. payable semi-annually and will be due in2025 (“2025 Notes”), in exchange for US$178.9 million of ICTSI’s US$450.0 million senior notesdue in 2020 (“2020 Notes”). Concurrent with the exchange offer, noteholders of the 2020 Notesprovided their consent to the modifications to the terms and conditions of the 2020 Notes to conformto the terms and conditions of all the notes issued under the MTN Programme. Moreover, onApril 30, 2014, an additional US$75.0 million notes were issued to form a single series with the2025 Notes.
In January 2015, an additional US$117.5 million notes were issued to form a single series with the2025 Notes. Of this new issue, US$102.6 million was used to fund the exchange forUS$91.8 million of the 2020 Notes.
The aggregate net proceeds of the issuances under the MTN Programme were used to fund newprojects and capital expenditures, refinance some of ICTSI’s existing debt and for other generalcorporate purposes.
As of June 30, 2019, carrying value of notes under the MTN Programme amounted toUS$760.2 million.

SEC Form 17-Q Q2 2019 6262
US Dollar-denominated Notes
In March 2010, ICTSI signed a Subscription Agreement with HSBC and JP Morgan Securities, Ltd.for the issuance of US$250.0 million ten-year senior notes (the “Original Notes”) bearing interest ata fixed rate of 7.375 percent, net of applicable taxes, payable semi-annually in arrears. InApril 2010, ICTSI tapped a further US$200.0 million (the “Further Notes”) of the Original Notesincreasing the size to US$450.0 million. The Further Notes were issued in May 2010 bearinginterest at the fixed rate of 7.375 percent, net of applicable taxes. The Original and Further Notesare collectively referred to as the “2020 Notes”.
The net proceeds of the 2020 Notes amounting to US$448.1 million were used to fund ICTSI’sinvestments in existing and new terminal construction activities, refinance some of its existing debtand for other general corporate purposes.
The 2020 Notes were not registered with the SEC. The Notes were offered in offshore transactionsoutside the United States in reliance on Regulation S under the Securities Act of 1933, as amended,and, subject to certain exceptions, may not be offered or sold within the United States. The 2020Notes are traded and listed in the Singapore Stock Exchange.
In 2013 and 2015, ICTSI redeemed an aggregate of US$270.7 million of the 2020 Notes in exchangefor the 2025 Notes under the MTN Programme.
In March 2017, ICTSI entered into a cross currency swap that converts the US dollar bond with acoupon of 7.375% maturing on March 17, 2020 to a Euro liability that has a coupon of 5.05% withthe same maturity. The EUR15.0 million cross currency swap was designated as a net investmenthedge to offset the movement of the Group’s Euro net investment in its subsidiary in Madagascar,MICTSL. As of June 30, 2019, the market valuation loss on the outstanding cross currency swapamounted to US$0.9 million (EUR0.8 million).
As of June 30, 2019, the carrying value of the 2020 Notes amounted to US$179.3 million.
Project Finance Facilities
VICT. On July 15, 2016, VICT signed the syndicated project finance facilities with variousinternational and regional banks for principal amount of US$300.0 million (AUD398.0 million),comprising of term facilities totaling US$284.9 million (AUD378.0 million) with interest rates basedon Australian Bank Bill Swap Reference Rate (bid) (BBSY) plus average margin of 3.10 percent perannum and maturities until 2023, 2026 and 2031 and working capital facility of US$15.1 million(AUD20.0 million).
In 2016 and 2017, VICT entered into interest rate swap transactions to hedge the interest rateexposures on its floating rate AUD-denominated loans maturing in 2023, 2026 and 2031. A totalnotional amount of AUD338.3 million floating rate loan was swapped to fixed rate. Under theinterest rate swap arrangements, VICT pays annual fixed interest of a range of 2.10 percent to2.973 percent and receives floating rate of six-month Bank Bill Swap Bid Rate (BBSY) basis pointson the notional amount. As of June 30, 2019, the market valuation loss on the outstanding interestrate swaps amounted to US$10.3 million (AUD14.7 million).
As of June 30, 2019, the term facilities were fully drawn and the carrying value of the loansamounted to US$239.4 million (AUD341.1 million).
US dollar and Foreign Currency-denominated Term Loans and Securities
CGSA. On March 29, 2016, CGSA (as “Borrower”), Metropolitan Bank and Trust Company (as“Lender”) and ICTSI (as “Surety”) signed a loan agreement which consists of two tranches of loansamounting to US$32.5 million (Tranche I) and US$7.5 million (Tranche II) with interest based on

SEC Form 17-Q Q2 2019 6363
three-month LIBOR plus an agreed margin. Tranche I has a final maturity in March 2021 whileTranche II in May 2017. On May 30, 2017, CGSA fully paid the loan under Tranche II.
In November 2016, ICTSI entered into an interest rate swap transaction to hedge the interest rateexposures of the CGSA’s floating rate US$-denominated floating rate loan maturing in 2021. Atotal notional amount of US$32.5 million floating rate loan was swapped to fixed rate. Under theinterest rate swap arrangements, ICTSI pays annual fixed interest of 3.045 percent and receivesfloating rate of six-month LIBOR plus 160 basis points on the notional amount. As ofJune 30, 2019, the market valuation gain on the outstanding interest rate swaps amounted toUS$63.4 thousands.
As of June 30, 2019, the outstanding balance of the loans aggregated to US$13.4 million.
YICT. On April 26, 2017, YICT obtained a US$21.8 million (RMB150.0 million) loan fromAgricultural Bank of China at an interest rate published by People's Bank of China (PBOC) minusan agreed margin and a final maturity in November 2023 to refinance its maturing loan. As ofJune 30, 2019, the outstanding balance of the loan amounted to US$7.3 million (RMB50.0 million).
AGCT. In 2013, AGCT signed a ten-year loan agreement for US$13.7 million (EUR10.6 million)with Raiffeisenbank Austria d.d. which carries a mark-up at the rate of 1-month EURIBOR plus3.40 percent and is secured by AGCT’s port equipment. The principal is repayable in monthlyinstallments until April 30, 2023.
The loan is under an interest rate swap agreement in which the floating rate Euro denominated loanwas swapped to fixed interest. Under the interest rate swap, AGCT pays fixed interest of5.39 percent for US$3.5 million (EUR2.9 million) and 4.75 percent for US$2.6 million(EUR2.2 million) and receives floating rate of one-month EURIBOR plus 3.40 bps on theUS$6.1 million (EUR5.1 million). As of June 30, 2019, the market valuation loss on the outstandinginterest rate swap amounted to US$0.2 million (EUR0.2 million).
On April 30, 2018, AGCT obtained a loan amounting to US$0.7 million (EUR0.6 million) fromRaiffeisen Bank d.d. at a fixed rate of 2.50 percent and a maturity date of October 31, 2019.As of June 30, 2019, the outstanding balance of the loans aggregated US$4.5 million(EUR4.0 million).
OPC. On July 11, 2017, OPC (as “Borrower”), Metropolitan Bank and Trust Company (as“Lender”) and ICTSI (as “Surety”) signed a loan agreement amounting to US$77.0 million withinterest based on three-month LIBOR plus an agreed margin and maturity date of July 2020 tofinance capital expenditures. OPC drew US$39.5 million out of the US$77.0 million term loanfacility. As of June 30, 2019, the outstanding balance of the loan amounted to US$19.5 million.
SPICTL and MITL. On April 13, 2018, Australia and New Zealand (ANZ) Banking Group (PNG)Limited granted PGK-denominated bridge loan facilities to SPICTL and MITL amounting toUS$31.1 million (PGK101.0 million) and US$25.2 million (PGK82.0 million), respectively, withinterest based on ANZ’s published Indicator Lending Rate minus an agreed margin and initial tenorof six months from drawdown date. The loans availed by SPICTL and MITL in April 2018 andMay 2018, respectively, were extended further to mature in August 2019 and September 2019,respectively. As of June 30, 2019, the outstanding balance of the loans amounted US$17.8 million(PGK60.2 million) for SPICTL and US$13.8 million (PGK46.7 million) for MITL.
IDRC. On October 9, 2018, IDRC availed of a four-year term loan with Rawbank RDC amountingto US$25.0 million at a fixed interest rate of 8.00 percent per annum. On May 6, 2019, IDRCavailed of another four-year term loan with Rawbank DRC amounting to US$3.0 million at a fixedinterest rate.
As at June 30, 2019, the outstanding balance of the loan aggregated to US$23.8 million.

SEC Form 17-Q Q2 2019 6464
ICTSI Middle East DMCC. On January 9, 2019, ICTSI Middle East DMCC, as borrower, andICTSI, as guarantor, signed a term loan facility agreement with Citigroup Global Markets AsiaLimited and Standard Chartered Bank, the original mandated lead arrangers and bookrunners, for theprincipal amount of EUR260.0 million (US$297.6million) with interest rate based on EURIBORplus an agreed margin and maturing on December 20, 2022. The term facility agreement wasentered into pursuant to the Loan Facility Programme Agreement dated July 24, 2014 betweenICTSI Global Finance B.V. as the borrower, ICTSI as the guarantor, and The Bank of New YorkMellon, Singapore Branch as the trustee (“Loan Programme”). ICTSI Middle East DMCC accededto the Loan Programme as an additional borrower and an additional obligor thereunder.
On January 10, 2019, ICTSI Middle East DMCC has fully drawn the EUR260.0 million from thefacility. On June 12, 2019, ICTSI Middle East DMCC, as borrower, and ICTSI, as guarantor, signedan amendment and syndication agreement with various international and local banks for the termloan facility. As at June 30, 2019, the outstanding balance of the loan amounted toUS$292.7 million (EUR257.4 million).
On July 15, 2019, partial pre-payment of US$221.8 million (EUR195.0 million) was made on theEUR260 term loan facility.
ICTSI Global Finance B.V.. On March 21, 2019, IGFBV, as borrower, Metropolitan Bank and TrustCompany, as lender, and ICTSI, as surety, signed a term loan facility amounting toUS$300.0 million with interest based on three-month LIBOR plus an agreed margin and a tenor of7 years. On April 29, 2019, IGFBV has fully availed the term loan facility.
In April 2019, ICTSI entered into an interest rate swap transaction to hedge the interest rateexposures of the ICTSI Global Finance B.V.’s floating rate US$-denominated floating rate loanmaturing in 2026. A total notional amount of US$300.0 million floating rate loan was swapped tofixed rate. Under the interest rate swap arrangements, ICTSI pays annual fixed interest of3.6981 percent and receives floating rate of three-month LIBOR plus 130 basis points on thenotional amount. As of June 30, 2019, the market valuation loss on the outstanding interest rateswaps amounted to US$10.2 million.
As of June 30, 2019, the outstanding balance of the term loan facility amounted toUS$296.3 million.
2.7.2.2 Loan Covenants
The loans from local and foreign banks impose certain restrictions with respect to corporatereorganization, disposition of all or a substantial portion of ICTSI’s and subsidiaries’ assets,acquisitions of futures or stocks, and extending loans to others, except in the ordinary course ofbusiness. ICTSI is also required to comply with a specified financial ratio relating to their debt toEBITDA up to 4 times when incurring additional debt.
There was no material change in the covenants related to the Group’s long-term debts. As ofJune 30, 2019, ICTSI and subsidiaries were in compliance with their loan covenants except forVICT whose Debt Service Coverage Ratio requirement was not met but having been irrevocablywaived by the creditors, no event of default has occurred.
2.7.2.3 Equity Financing
Perpetual Capital Securities
On January 29, 2015, RCBV issued US$300.0 million 6.25 percent Senior Guaranteed PerpetualCapital Securities unconditionally and irrevocably guaranteed by ICTSI at a price of 99.551 percentor US$298.7 million. The new issue was partly used to finance the tendered US$230.0 million8.375 percent Subordinated Guaranteed Perpetual Capital Securities (“Original Securities) at a
SEC Form 17-Q Q2 2019 6565
tender price of 107.625 or US$247.5 million. The cash proceeds received by RCBV amounted toUS$46.7 million, net of debt issuance cost.
On August 26, 2015, RCBV issued US$450.0 million 5.50 percent Senior Guaranteed PerpetualCapital Securities (“New Securities”) unconditionally and irrevocably guaranteed by ICTSI. Thecash proceeds received by RCBV amounted to US$436.3 million, net of debt issue cost, will be usedfor refinancing, funding capital expenditures and general corporate purposes.
On March 10, 2016, RCBV (the “Issuer”) and ICTSI (the “Guarantor”) sent a notice to The HongKong and Shanghai Banking Corporation Limited (HSBC, as “Trustee” and “Agent”) for theredemption of the remaining US$108.3 million of the US$350-million Subordinated GuaranteedPerpetual Capital
Securities (“Securities”) and payment of accrued distributions. The securities were eventuallyredeemed in May 2016.
On October 3, 2016, RCBV tendered its US$300.0 million 6.25 percent and US$450.0 million5.50 percent Senior Guaranteed Perpetual Capital Securities for redemption at a price of 106.75 and105.75, respectively. On October 20, 2016, RCBV redeemed a total of US$345.5 million of thetendered securities and paid the associated accrued distributions of US$9.3 million. Together withthe redemption, RCBV issued US$375.0 million 4.875 percent Senior Guaranteed Perpetual CapitalSecurities unconditionally and irrevocably guaranteed by ICTSI at a price of 99.225 percent. Thenew issue was used to finance the redemption and payment of accrued distributions of the tenderedsecurities.
On January 10, 2018, the Board approved the principal terms and conditions of theUS$350.0 million 5.875 percent fixed-for-life Senior Guaranteed Perpetual Capital Securities (the“New Securities”). The New Securities were unconditionally and irrevocably guaranteed by ICTSIat par. On January 11, 2018, the Board approved the issuance of additional Senior GuaranteedPerpetual Capital Securities amounting to US$50.0 million (“Additional Securities”) which wasconsolidated and formed a single series with the New Securities initially offered onJanuary 10, 2018. The Additional Securities were also unconditionally and irrevocably guaranteedby ICTSI. The cash proceeds received by RCBV from the issuance of the New and AdditionalSecurities amounted to US$392.3 million, net of debt issuance costs, which shall be used for thefinancing of acquisitions and capital expenditures and for general corporate purposes.
On March 14, 2019, RCBV (the “Issuer”) and ICTSI (the “Guarantor”) sent a notice to The HongKong and Shanghai Banking Corporation Limited (HSBC, as “Trustee” and “Agent”) for theredemption of the remaining US$139.7 million of the US$300-million Senior Guaranteed PerpetualCapital Securities (“Securities”) and payment of accrued distributions on May 5, 2019. Thesecurities were redeemed on May 2, 2019.
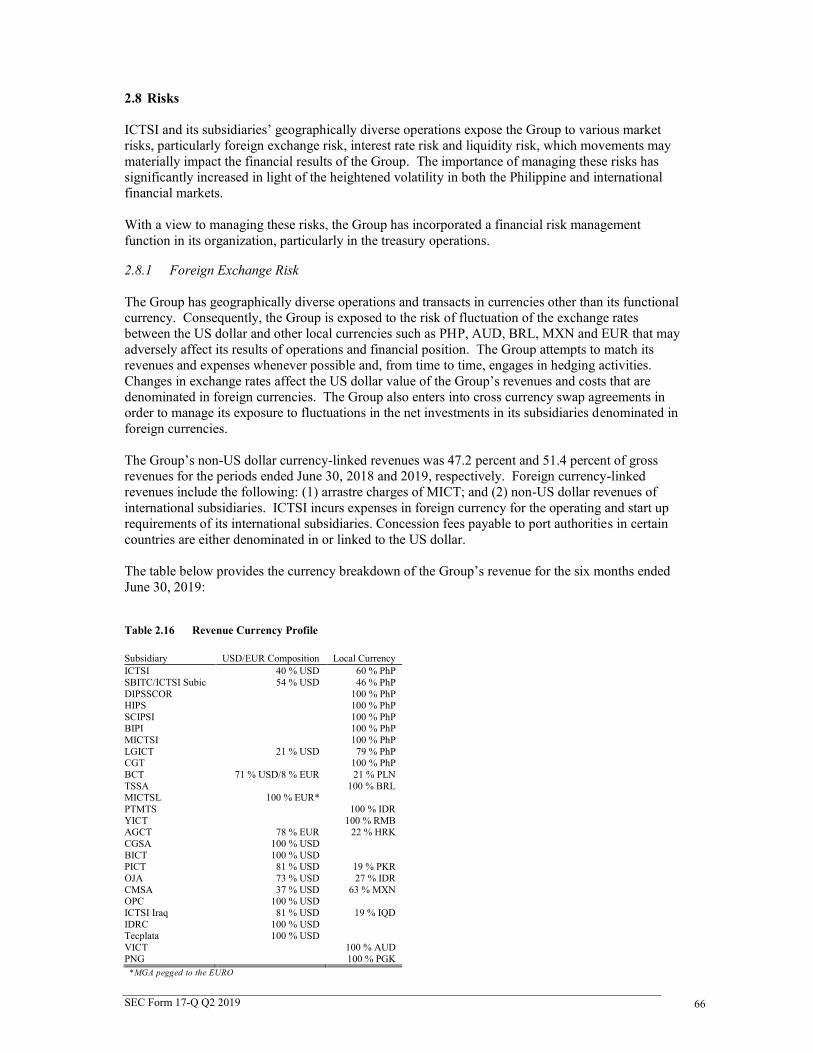
SEC Form 17-Q Q2 2019 6666
2.8 Risks
ICTSI and its subsidiaries’ geographically diverse operations expose the Group to various marketrisks, particularly foreign exchange risk, interest rate risk and liquidity risk, which movements maymaterially impact the financial results of the Group. The importance of managing these risks hassignificantly increased in light of the heightened volatility in both the Philippine and internationalfinancial markets.
With a view to managing these risks, the Group has incorporated a financial risk managementfunction in its organization, particularly in the treasury operations.
2.8.1 Foreign Exchange Risk
The Group has geographically diverse operations and transacts in currencies other than its functionalcurrency. Consequently, the Group is exposed to the risk of fluctuation of the exchange ratesbetween the US dollar and other local currencies such as PHP, AUD, BRL, MXN and EUR that mayadversely affect its results of operations and financial position. The Group attempts to match itsrevenues and expenses whenever possible and, from time to time, engages in hedging activities.Changes in exchange rates affect the US dollar value of the Group’s revenues and costs that aredenominated in foreign currencies. The Group also enters into cross currency swap agreements inorder to manage its exposure to fluctuations in the net investments in its subsidiaries denominated inforeign currencies.
The Group’s non-US dollar currency-linked revenues was 47.2 percent and 51.4 percent of grossrevenues for the periods ended June 30, 2018 and 2019, respectively. Foreign currency-linkedrevenues include the following: (1) arrastre charges of MICT; and (2) non-US dollar revenues ofinternational subsidiaries. ICTSI incurs expenses in foreign currency for the operating and start uprequirements of its international subsidiaries. Concession fees payable to port authorities in certaincountries are either denominated in or linked to the US dollar.
The table below provides the currency breakdown of the Group’s revenue for the six months endedJune 30, 2019:
Table 2.16 Revenue Currency Profile
Subsidiary USD/EUR Composition Local CurrencyICTSI 40 % USD 60 % PhPSBITC/ICTSI Subic 54 % USD 46 % PhPDIPSSCOR 100 % PhPHIPS 100 % PhPSCIPSI 100 % PhPBIPI 100 % PhPMICTSI 100 % PhPLGICT 21 % USD 79 % PhPCGT 100 % PhPBCT 71 % USD/8 % EUR 21 % PLNTSSA 100 % BRLMICTSL 100 % EUR*PTMTS 100 % IDRYICT 100 % RMBAGCT 78 % EUR 22 % HRKCGSA 100 % USDBICT 100 % USDPICT 81 % USD 19 % PKROJA 73 % USD 27 % IDRCMSA 37 % USD 63 % MXNOPC 100 % USDICTSI Iraq 81 % USD 19 % IQDIDRC 100 % USDTecplata 100 % USDVICT 100 % AUDPNG 100 % PGK
*MGA pegged to the EURO

SEC Form 17-Q Q2 2019 6767
2.8.2 Interest Rate Risk
The Group’s exposure to market risk for changes in interest rates (cash flow interest rate risk) relatesprimarily to the Group’s bank loans and is addressed by a periodic review of the Group’s debt mixwith the objective of reducing interest cost and maximizing available loan terms. The Group alsoenters into interest rate swap agreements in order to manage its exposure to interest rate fluctuations.
2.8.3 Liquidity Risk
The Group manages its liquidity profile to be able to finance its working capital and capitalexpenditure requirements through internally generated cash and proceeds from debt and/or equity.As part of the liquidity risk management, the Group maintains strict control of its cash and makessure that excess cash held by subsidiaries are up streamed timely to the Parent Company. The Groupalso monitors the receivables and payables turnover to ensure that these are at optimal levels. Inaddition, it regularly evaluates its projected and actual cash flow information and continuallyassesses the conditions in the financial market to pursue fund raising initiatives. These initiativesmay include accessing bank loans, project finance facilities and the debt capital markets.
ICTSI monitors and maintains a level of cash and cash equivalents and bank credit facilities deemedadequate to finance the Group’s operations, ensure continuity of funding and to mitigate the effectsof fluctuations in cash flows.
There are no other known trends, demands, commitments, events or uncertainties that will materiallyaffect the company’s liquidity.

SEC Form 17-Q Q2 2019 6868
PART II – OTHER INFORMATION
There are no other information not previously reported in SEC Form 17-C that need to be reported inthis section.
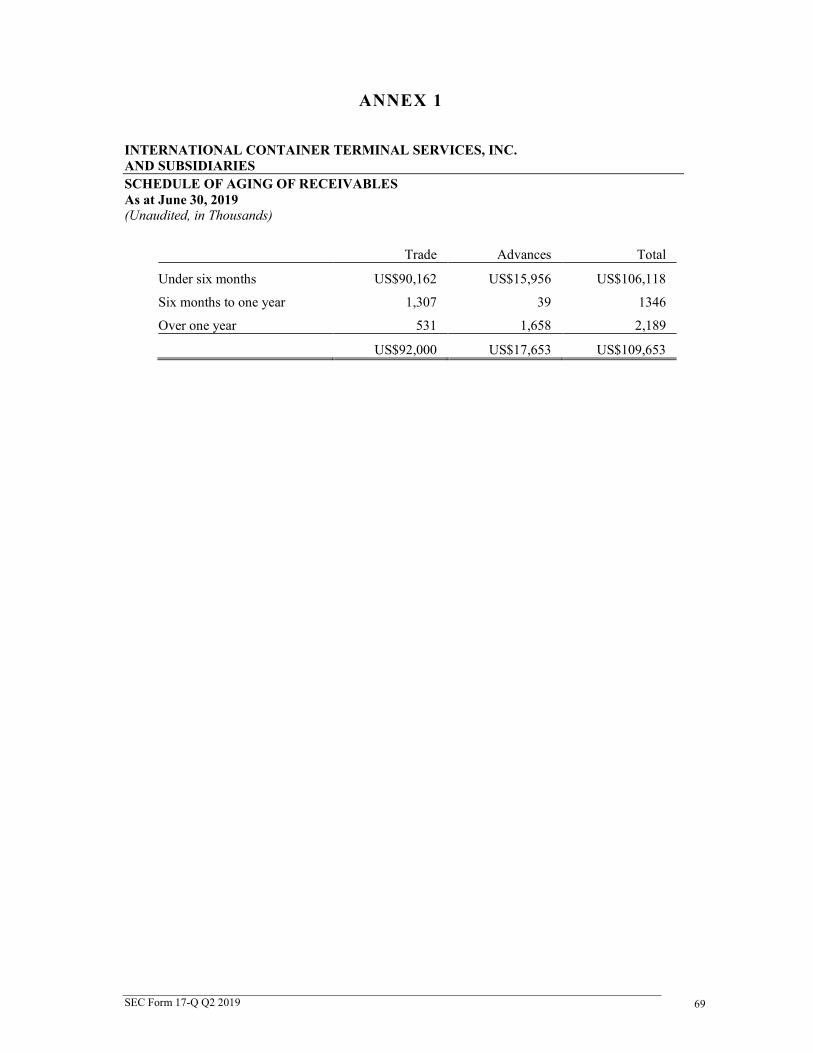
SEC Form 17-Q Q2 2019 6969
ANNEX 1
INTERNATIONAL CONTAINER TERMINAL SERVICES, INC.AND SUBSIDIARIESSCHEDULE OF AGING OF RECEIVABLESAs at June 30, 2019(Unaudited, in Thousands)
Trade Advances Total
Under six months US$90,162 US$15,956 US$106,118
Six months to one year 1,307 39 1346
Over one year 531 1,658 2,189
US$92,000 US$17,653 US$109,653

SEC Form 17-Q Q2 2019 7070
ANNEX 2
INTERNATIONAL CONTAINER TERMINAL SERVICES, INC.AND SUBSIDIARIESFINANCIAL SOUNDNESS INDICATORSAs at and for the Six Months Ended June 30
2018(Restated - Note 3) 2019
Liquidity ratiosCurrent ratio (a) 1.66 0.79Interest rate coverage ratio (b) 6.63 7.90
Solvency ratiosDebt to equity ratio (c) 0.67 1.13Asset to equity ratio (d) 2.72 3.44
Profitability ratioEBITDA margin (e) 53.8% 56.5%
(a) Current assets over current liabilities(b) EBITDA over interest expense and financing charges on borrowings(c) Interest-bearing debts over total equity(d) Total assets over total equity(e) EBITDA over gross revenues from port operations

SEC Form 17-Q Q2 2019 7171
ANNEX 3
INTERNATIONAL CONTAINER TERMINAL SERVICES, INC.AND SUBSIDIARIESLIST OF EFFECTIVE PFRS STANDARDS AND INTERPRETATIONS*June 30, 2019
PHILIPPINE FINANCIAL REPORTING STANDARDS ANDINTERPRETATIONSEffective as of June 30, 2019 Adopted Not Adopted
NotApplicable
Philippine Financial Reporting Standards
PFRS 1 First-time Adoption of Philippine Financial ReportingStandards
PFRS 2 Share-based Payment
Amendments to PFRS 2, Classification andMeasurement of Share-based Payment Transactions
PFRS 3 Business Combinations
Annual PFRS Improvement Process: PFRS 3 BusinessCombinations - Previously held Interests in a jointoperation
PFRS 4 Insurance Contracts
Amendments to PFRS 4, Applying PFRS 9 FinancialInstruments with PFRS 4 Insurance Contracts
PFRS 5 Non-current Assets Held for Sale and DiscontinuedOperations
PFRS 6 Exploration for and Evaluation of Mineral Resources
PFRS 7 Financial Instruments: Disclosures
PFRS 8 Operating Segments
PFRS 9 Financial Instruments
Amendments to PFRS 9, Prepayment Features withNegative Compensation
PFRS 10 Consolidated Financial Statements
PFRS 11 Joint Arrangements
Annual PFRS Improvement Process: PFRS 11 JointArrangements - Previously held Interests in a jointoperation
PFRS 12 Disclosure of Interests in Other Entities
PFRS 13 Fair Value Measurement
PFRS 14 Regulatory Deferral Accounts
PFRS 15 Revenue from Contracts with Customers
PFRS 16 Leases
Philippine Accounting Standards
PAS 1 Presentation of Financial Statements
PAS 2 Inventories
PAS 7 Statement of Cash Flows
PAS 8 Accounting Policies, Changes in Accounting Estimatesand Errors
PAS 10 Events after the Reporting Period
PAS 12 Income Taxes
Annual PFRS Improvement Process: PAS 12 Income

SEC Form 17-Q Q2 2019 7272
PHILIPPINE FINANCIAL REPORTING STANDARDS ANDINTERPRETATIONSEffective as of June 30, 2019 Adopted Not Adopted
NotApplicable
Taxes - Income tax consequences of payments onfinancial instruments classified as equity
PAS 16 Property, Plant and Equipment
PAS 19 Employee Benefits
Amendments to PAS 19, Plan Amendment, Curtailmentor Settlement
PAS 20 Accounting for Government Grants and Disclosure ofGovernment Assistance
PAS 21 The Effects of Changes in Foreign Exchange Rates
PAS 23 Borrowing Costs
Annual PFRS Improvement Process: PAS 23Borrowing Costs - Borrowing costs eligible forcapitalization
PAS 24 Related Party Disclosures
PAS 26 Accounting and Reporting by Retirement Benefit Plans
PAS 27 Separate Financial Statements
PAS 28 Investments in Associates and Joint Ventures
Amendments to PAS 28, Measuring an Associate orJoint Venture at Fair Value (Part of AnnualImprovements to PFRSs 2014 - 2016 Cycle)
Amendments to PAS 28, Long-term Interests inAssociates and Joint Ventures
PAS 29 Financial Reporting in Hyperinflationary Economies
PAS 32 Financial Instruments: Presentation
PAS 33 Earnings per Share
PAS 34 Interim Financial Reporting
PAS 36 Impairment of Assets
PAS 37 Provisions, Contingent Liabilities and ContingentAssets
PAS 38 Intangible Assets
PAS 39 Financial Instruments: Recognition and Measurement
PAS 40 Investment Property
Amendments to PAS 40, Transfers of InvestmentProperty
PAS 41 Agriculture
Philippine Interpretations
PhilippineInterpretationIFRIC-1
Changes in Existing Decommissioning, Restoration andSimilar Liabilities
PhilippineInterpretationIFRIC-2
Members’ Shares in Co-operative Entities and SimilarInstruments
PhilippineInterpretationIFRIC-4
Determining whether an Arrangement contains a Lease
PhilippineInterpretationIFRIC-5
Rights to Interests arising from Decommissioning,Restoration and Environmental Rehabilitation Funds
PhilippineInterpretationIFRIC-6
Liabilities arising from Participating in a SpecificMarket—Waste Electrical and Electronic Equipment

SEC Form 17-Q Q2 2019 7373
PHILIPPINE FINANCIAL REPORTING STANDARDS ANDINTERPRETATIONSEffective as of June 30, 2019 Adopted Not Adopted
NotApplicable
PhilippineInterpretationIFRIC-7
Applying the Restatement Approach under PAS 29Financial Reporting in Hyperinflationary Economies
PhilippineInterpretationIFRIC-10
Interim Financial Reporting and Impairment
PhilippineInterpretationIFRIC-12
Service Concession Arrangements
PhilippineInterpretationIFRIC-14
PAS 19—The Limit on a Defined Benefit Asset,Minimum Funding Requirements and their Interaction
PhilippineInterpretationIFRIC-16
Hedges of a Net Investment in a Foreign Operation
PhilippineInterpretationIFRIC-17
Distributions of Non-cash Assets to Owners
PhilippineInterpretationIFRIC-19
Extinguishing Financial Liabilities with EquityInstruments
PhilippineInterpretationIFRIC-20
Stripping Costs in the Production Phase of a SurfaceMine
PhilippineInterpretationIFRIC-21
Levies
PhilippineInterpretationIFRIC-22
Foreign Currency Transactions and AdvanceConsideration
PhilippineInterpretationIFRIC-23
Uncertainty over Income Tax Treatments
PhilippineInterpretationSIC-7
Introduction of the Euro
PhilippineInterpretationSIC-10
Government Assistance—No Specific Relation toOperating Activities
PhilippineInterpretationSIC-15
Operating Leases—Incentives
PhilippineInterpretationSIC-25
Income Taxes—Changes in the Tax Status of an Entityor its Shareholders
PhilippineInterpretationSIC-27
Evaluating the Substance of Transactions Involving theLegal Form of a Lease
PhilippineInterpretationSIC-29
Service Concession Arrangements: Disclosures
PhilippineInterpretationSIC-32
Intangible Assets—Web Site Costs
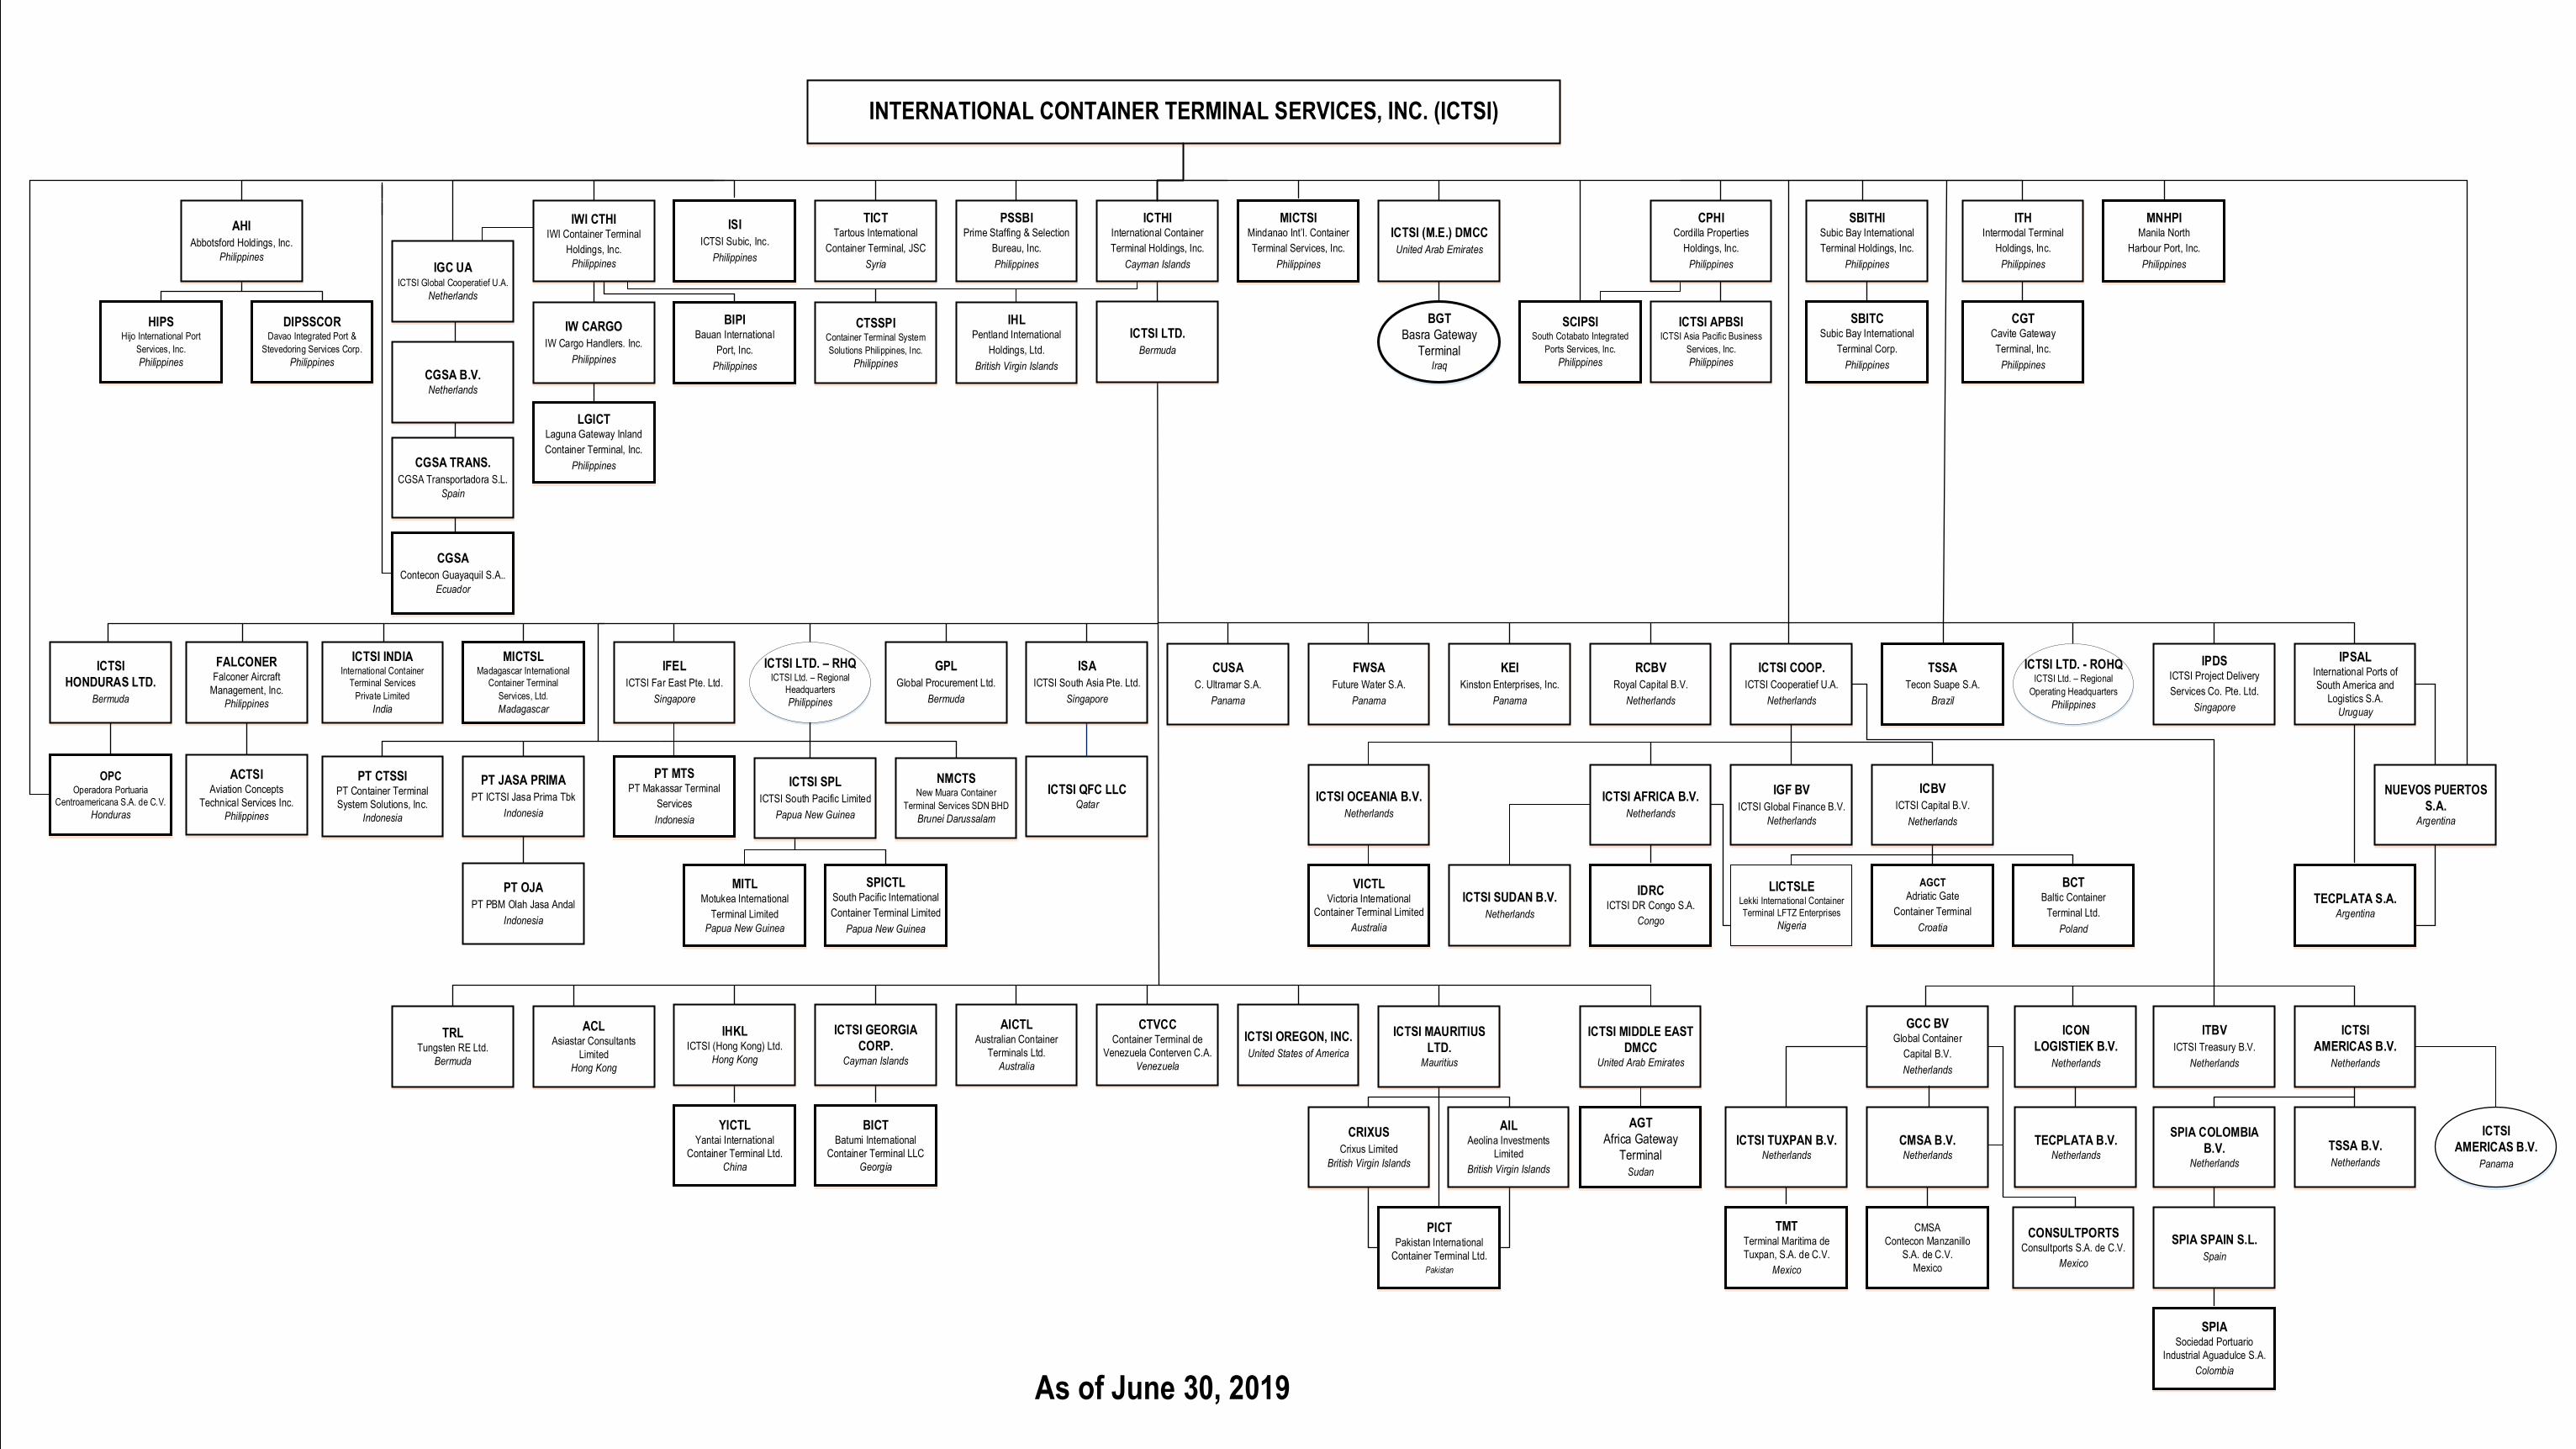
INTERNATIONAL CONTAINER TERMINAL SERVICES, INC. (ICTSI)
ICTHIInternational Container
Terminal Holdings, Inc.
Cayman Islands
ICTSI LTD.
Bermuda
PSSBIPrime Staffing & Selection
Bureau, Inc.
Philippines
TICTTartous International
Container Terminal, JSC
Syria
ISI
ICTSI Subic, Inc.
Philippines
IWI CTHIIWI Container Terminal
Holdings, Inc.
PhilippinesIGC UAICTSI Global Cooperatief U.A.
Netherlands
AHI
Abbotsford Holdings, Inc.
Philippines
MICTSIMindanao Int’l. Container
Terminal Services, Inc.
Philippines
ICTSI (M.E.) DMCC
United Arab Emirates
CPHICordilla Properties
Holdings, Inc.
Philippines
SBITHISubic Bay International
Terminal Holdings, Inc.
Philippines
ITHIntermodal Terminal
Holdings, Inc.
Philippines
LGICTLaguna Gateway Inland
Container Terminal, Inc.
Philippines
ICTSI
HONDURAS LTD.
Bermuda
CUSA
C. Ultramar S.A.
Panama
FWSA
Future Water S.A.
Panama
KEI
Kinston Enterprises, Inc.
Panama
RCBV
Royal Capital B.V.
Netherlands
ICTSI COOP.
ICTSI Cooperatief U.A.
Netherlands
TSSA
Tecon Suape S.A.
Brazil
IPDSICTSI Project Delivery
Services Co. Pte. Ltd.
Singapore
IPSALInternational Ports of
South America and
Logistics S.A.
Uruguay
OPCOperadora Portuaria
Centroamericana S.A. de C.V.
Honduras
PT CTSSI PT Container Terminal
System Solutions, Inc.
Indonesia
PT MTSPT Makassar Terminal
Services
Indonesia
ICTSI QFC LLCQatar
NUEVOS PUERTOS
S.A.Argentina
ICTSI AFRICA B.V.
Netherlands
ICTSI OCEANIA B.V.
Netherlands
ICTSI SUDAN B.V.
Netherlands
TECPLATA S.A.Argentina
AGCT
Adriatic Gate
Container Terminal
Croatia
LICTSLELekki International Container
Terminal LFTZ Enterprises
Nigeria
IDRCICTSI DR Congo S.A.
Congo
VICTLVictoria International
Container Terminal Limited
Australia
BICTBatumi International
Container Terminal LLC
Georgia
YICTLYantai International
Container Terminal Ltd.
China
PT OJA
PT PBM Olah Jasa Andal
Indonesia
ICTSI MIDDLE EAST
DMCCUnited Arab Emirates
ICTSI
AMERICAS B.V.
Netherlands
ICON
LOGISTIEK B.V.
Netherlands
ITBV
ICTSI Treasury B.V.
Netherlands
SPIA COLOMBIA
B.V.Netherlands
TECPLATA B.V.Netherlands
SPIA SPAIN S.L.
Spain
SPIASociedad Portuario
Industrial Aguadulce S.A.
Colombia
IHLPentland International
Holdings, Ltd.
British Virgin Islands
IW CARGO
IW Cargo Handlers. Inc.
Philippines
CGSA B.V.Netherlands
CGSA TRANS.
CGSA Transportadora S.L.
Spain
As of June 30, 2019
ICTSI MAURITIUS
LTD.Mauritius
SCIPSISouth Cotabato Integrated
Ports Services, Inc.
Philippines
ICTSI APBSIICTSI Asia Pacific Business
Services, Inc.
Philippines
SBITCSubic Bay International
Terminal Corp.
Philippines
CGTCavite Gateway
Terminal, Inc.
Philippines
BIPIBauan International
Port, Inc.
Philippines
ICTSI LTD. - ROHQICTSI Ltd. – Regional
Operating Headquarters
Philippines
PT JASA PRIMA
PT ICTSI Jasa Prima Tbk
Indonesia
TSSA B.V.
Netherlands
ISA
ICTSI South Asia Pte. Ltd.
Singapore
GPL
Global Procurement Ltd.
Bermuda
IFEL
ICTSI Far East Pte. Ltd.
Singapore
MICTSLMadagascar International
Container Terminal
Services, Ltd.
Madagascar
ICTSI INDIAInternational Container
Terminal Services
Private Limited
India
ICTSI LTD. – RHQICTSI Ltd. – Regional
Headquarters
Philippines
AILAeolina Investments
Limited
British Virgin Islands
CRIXUS
Crixus Limited
British Virgin Islands
PICTPakistan International
Container Terminal Ltd.
Pakistan
ICBV
ICTSI Capital B.V.
Netherlands
BCTBaltic Container
Terminal Ltd.
Poland
HIPSHijo International Port
Services, Inc.
Philippines
DIPSSCORDavao Integrated Port &
Stevedoring Services Corp.
Philippines
ICTSI
AMERICAS B.V.
Panama
CTSSPIContainer Terminal System
Solutions Philippines, Inc.
Philippines
NMCTSNew Muara Container
Terminal Services SDN BHD
Brunei Darussalam
SPICTLSouth Pacific International
Container Terminal Limited
Papua New Guinea
MITLMotukea International
Terminal Limited
Papua New Guinea
ICTSI SPL
ICTSI South Pacific Limited
Papua New Guinea
ACLAsiastar Consultants
Limited
Hong Kong
ICTSI OREGON, INC.
United States of America
CTVCCContainer Terminal de
Venezuela Conterven C.A.
Venezuela
AICTLAustralian Container
Terminals Ltd.
Australia
ICTSI GEORGIA
CORP.Cayman Islands
IHKLICTSI (Hong Kong) Ltd.
Hong Kong
IGF BV
ICTSI Global Finance B.V.
Netherlands
TRLTungsten RE Ltd.
Bermuda
MNHPIManila North
Harbour Port, Inc.
Philippines
CMSA
Contecon Manzanillo
S.A. de C.V.
Mexico
TMTTerminal Maritima de
Tuxpan, S.A. de C.V.
Mexico
CMSA B.V.Netherlands
ICTSI TUXPAN B.V.Netherlands
CONSULTPORTSConsultports S.A. de C.V.
Mexico
GCC BVGlobal Container
Capital B.V.
Netherlands
BGT
Basra Gateway
TerminalIraq
AGT
Africa Gateway
Terminal
Sudan
CGSA
Contecon Guayaquil S.A..
Ecuador
FALCONERFalconer Aircraft
Management, Inc.
Philippines
ACTSIAviation Concepts
Technical Services Inc.
Philippines

13, 2019
13, 2019