How to Cook Low Calorie Meals: 32 Healthy Low Calorie Recipes


Pur
eCirc
le A
nnua
l Rep
ort
20
12
EVERYTHINGSTEVIA
PURECIRCLE HAS ESTABLISHED ITSELF AS THE WORLD’S LEADING PRODUCER AND MARKETER OF HIGH PURITY STEVIA INGREDIENTS
PureCircle has established itself as the world’s leading producer of high purity stevia ingredient– no-calorie ingredients that provide a great-tasting way to reduce calories. Our sights are firmly set on leading the development of stevia as a mainstream natural ingredient around the world. To do so, we have passionately shaped a company that is capable of building an industry and importantly, acting as a global partner to our clients.
It is our focus on Everything Stevia that sets us apart. While it has been several years in the making, 2012 marked the year that PureCircle truly completed the evolution to become the leading partner for the world’s most recognised companies. We have invested extensively to support customers through five key platforms – 1. Innovation & Technical Development 2. Trust Communications 3. Health Professional Advocacy 4. Sustainability Solutions and 5. Everything Stevia.
Building on the industry’s leading vertically integrated supply chain, more than ever, we are successfully helping our customers take advantage of Everything Stevia from PureCircle.
Pur
eCirc
le A
nnua
l Rep
ort
20
12

Eve
rythin
g S
tevia
Everything Stevia’s Platforms
By focusing on the following platforms to engage with customers, stevia partners,and end consumers :
1. Innovation & Technical Development Creating competitive advantage through world class innovation and customer technical support
2. Trust Communications Expanding the adoption of the Stevia PureCircle trustmark to support compelling consumer communications
3. Health Professional Advocacy Providing confidence to the industry through the Global Stevia Institute
4. Sustainability Solutions Translating supply chain integration into environmental advantage
5. Everything Stevia Establishing ourselves as the “Everything Stevia” company – from marketing services to integrated communications

Pur
eCirc
le A
nnua
l Rep
ort
20
12
INNOVATION &TECHNICALDEVELOPMENT
Deepening R&D Partnership•Newformalisedprogramtoengage
customers to develop better solutions1
Accelerating ApplicationDevelopment•Developedsuiteofnearly200“turn-key”
applications across food and beverages categories
CREATING COMPETITIVE ADVANTAGE THROUGH WORLD CLASS INNOVATION AND CUSTOMER TECHNICAL SUPPORT
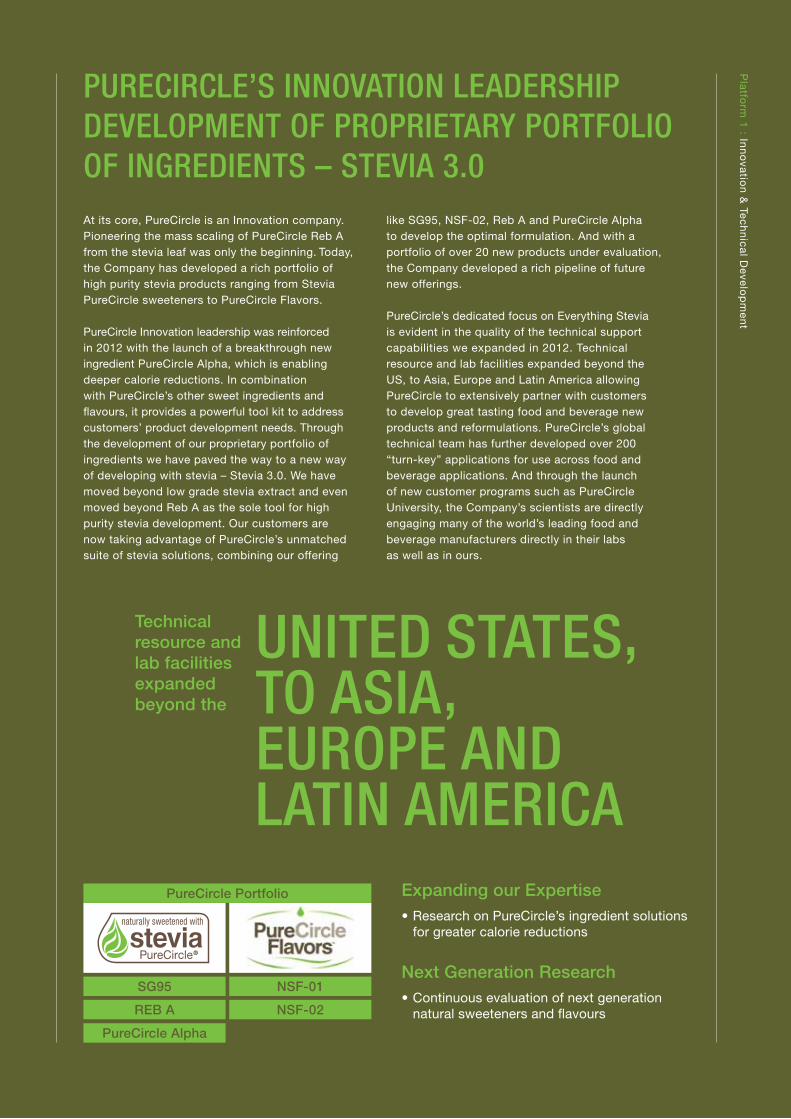
likeSG95,NSF-02,RebAandPureCircleAlphato develop the optimal formulation. And with a portfolio of over 20 new products under evaluation, the Company developed a rich pipeline of future new offerings.
PureCircle’s dedicated focus on Everything Stevia is evident in the quality of the technical support capabilities we expanded in 2012. Technical resource and lab facilities expanded beyond the US, to Asia, Europe and Latin America allowing PureCircle to extensively partner with customers to develop great tasting food and beverage new products and reformulations. PureCircle’s global technical team has further developed over 200 “turn-key” applications for use across food and beverage applications. And through the launch of new customer programs such as PureCircle University, the Company’s scientists are directly engaging many of the world’s leading food and beverage manufacturers directly in their labs as well as in ours.
Pla
tform
1 : In
no
vatio
n &
Tec
hn
ica
l De
velo
pm
en
t
PURECIRCLE’S INNOVATION LEADERSHIP DEVELOPMENT OF PROPRIETARY PORTFOLIO OF INGREDIENTS – STEVIA 3.0At its core, PureCircle is an Innovation company. PioneeringthemassscalingofPureCircleRebAfrom the stevia leaf was only the beginning. Today, the Company has developed a rich portfolio of high purity stevia products ranging from Stevia PureCirclesweetenerstoPureCircleFlavors.
PureCircle Innovation leadership was reinforced in 2012 with the launch of a breakthrough new ingredient PureCircle Alpha, which is enabling deeper calorie reductions. In combination with PureCircle’s other sweet ingredients and flavours, it provides a powerful tool kit to address customers’ product development needs. Through the development of our proprietary portfolio of ingredients we have paved the way to a new way of developing with stevia – Stevia 3.0. We have moved beyond low grade stevia extract and even movedbeyondRebAasthesoletoolforhighpurity stevia development. Our customers are now taking advantage of PureCircle’s unmatched suite of stevia solutions, combining our offering
Expanding our Expertise•ResearchonPureCircle’singredientsolutions
for greater calorie reductions
Next Generation Research•Continuousevaluationofnextgeneration
natural sweeteners and flavours
SG95
PureCircle Portfolio
REB A
NSF-01
NSF-02
PureCircle Alpha
UNITED STATES, TO ASIA,EUROPE ANDLATIN AMERICA
Technical resource and lab facilities expanded beyond the
Pur
eCirc
le A
nnua
l Rep
ort
20
12
TRUSTCOMMUNICATIONS
2
EXPANDING THE ADOPTION OF THE STEVIA PURECIRCLE TRUSTMARK TO SUPPORT COMPELLING CONSUMER COMMUNICATIONS
Stevia PureCircle TrustmarkAs part of our leadership within the stevia industry, PureCircle has pioneered an industry trustmark that educates consumers about the benefits of stevia and provides a strong basis for trust with both consumers and manufacturers alike.
We Grow JoyWe Grow Joy is a marketing campaign designed to promote stevia as a better sweet choice and educate the market place about the Stevia PureCircle trustmark, appearing on the packaging of leading global manufacturers.
Global Licensing•Rapidglobalexpansionthrough
table top partnership
•160productslicensedacross 32 countries
Trademarks SecuredGlobally•Registeredin18regions (44 countries) in four continents
Pla
tform
2 : Tru
st Co
mm
un
ica
tion
s
PureCircle’s investment in trust communications has continued to play a critical role in helping customers to understand exactly when and how stevia can play a role in providing benefits to consumers. The launch of the Stevia PureCircle trustmark was built on insights from proprietary studies conducted by the PureCircle Insights Group. Using these insights PureCircle has continued to tailor its communication guidance to align with country specific learnings. We recognised that while nothing is more appealing than communicating the natural source of stevia sweetness, no one can share the story of these benefits with consumers better than PureCircle. Our vertical integration, quality controls and traceability provide reassurance to consumer and brand owners that Stevia PureCircle provides a trusted source of sweetness.
In 2012, the Stevia PureCircle Trustmark was usedon160productslaunchedacross32countries,from table top sweetener products to flavoured waters, with additional product launches in the pipelineforFY2013.TheassociatedWeGrowJoy (www.steviapurecircle.com) consumer campaign was further localised to support new major markets including Latin America and China. And with trademark registrations secured across four conti-nents, the brand is poised for further expansion.
160products launched across
32countries
Stevia PureCircle Trustmark was used on
STEVIA PURECIRCLE TRUSTMARK HAS NOW REACHED MORE PRODUCTS AND MARKETS THAN ANY OTHERIN THE INDUSTRY

Pur
eCirc
le A
nnua
l Rep
ort
20
12
Market / Advisor Expansion•6countriesacross3continents
•RecentadditionofUKandItaly
Global Speaker Circuit•Chosentospeakatleadingindustry
conferences and launch events
Media and Coverage•10+ million media impressions
Global Digital Outreach•4languages,newsletterreaches2,700+
•Websitetrafficfrom138countries
F&B Industry Recognition•Distributionto450,000+ consumers
via health care professionals
3
HEALTH PROFESSIONAL ADVOCACYPROVIDING CONFIDENCE TO THE INDUSTRY THROUGH THE GLOBAL STEVIA INSTITUTE
As the global market for stevia has developed, the role that the Global Stevia Institute (GSI) plays across regions for independent, scientific, ingredient advocacy and protection has become fundamental. The GSI is now firmly established with internationally recognised health professional Advisory Board Members active across 4 continents. In 2012, the Board was further strengthened with local Expert Advisors within Europe and is expanding further into South America and China as major brands are launching with stevia.
The GSI now attracts 3,000 subscribers to its monthly newsletter and remains the leading source of reliable science based information around the safety of stevia and its important role in improving and encouraging healthier diets around the globe. The GSI resources are referenced not only by healthcare professionals and key opinion formers, they also provide an important source of accurate information and support for customers launching stevia-sweetened products. In 2012, companies like Unilever have included reference to the GSI website on the packaging of new products they have launched across Europe.
Working in conjunction with major companies, GSI materials have been distributed to hundreds of thousands of consumers via health professionals and the GSI’s website (www.globalsteviainstitute.com) has been visited now by interested viewers from over 120 different countries.
Pla
tform
3 : H
ea
lth P
rofe
ssion
al A
dvo
ca
cy
Attracts 3,000subscribers to its monthly newsletter
Leading source of reliable sciencebased information
Provide Industry Leadership
The Global Stevia Institute is a resource designed to promote accurate and consistent information and to educate people about the natural, no-calorie sweetener, stevia.
Led by an advisory board of esteemed international healthprofessionalsincludingMDs,PhDs,RNs university professors, nutritionists, award winning authors and other influential health professionals with experience in the areas of obesity, nutrition, endocrinology, biochemistry and food regulations.
Pur
eCirc
le A
nnua
l Rep
ort
20
12
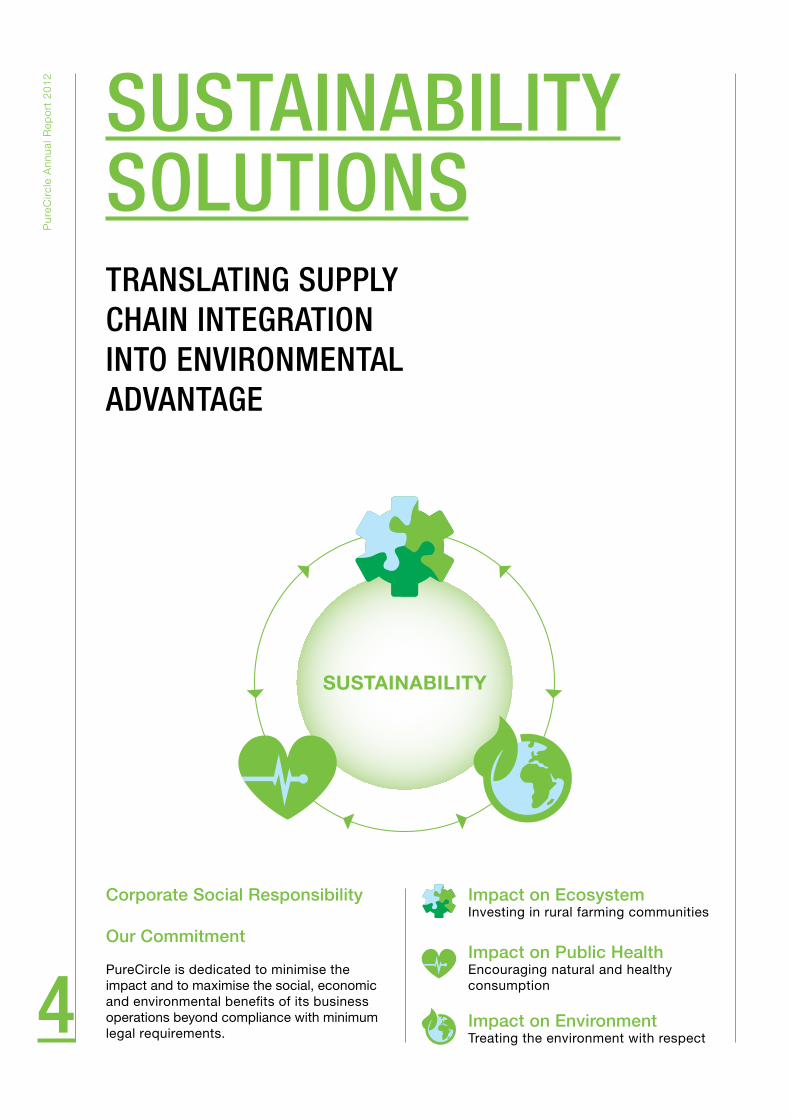
Impact on EcosystemInvesting in rural farming communities
Impact on Public HealthEncouraging natural and healthy consumption
Impact on EnvironmentTreating the environment with respect
TRANSLATING SUPPLY CHAIN INTEGRATION INTO ENVIRONMENTAL ADVANTAGE
SUSTAINABILITYSOLUTIONS
4
Corporate Social Responsibility
Our Commitment
PureCircle is dedicated to minimise the impact and to maximise the social, economic and environmental benefits of its business operations beyond compliance with minimum legal requirements.
Pla
tform
4 : S
usta
ina
bility S
olu
tion
s
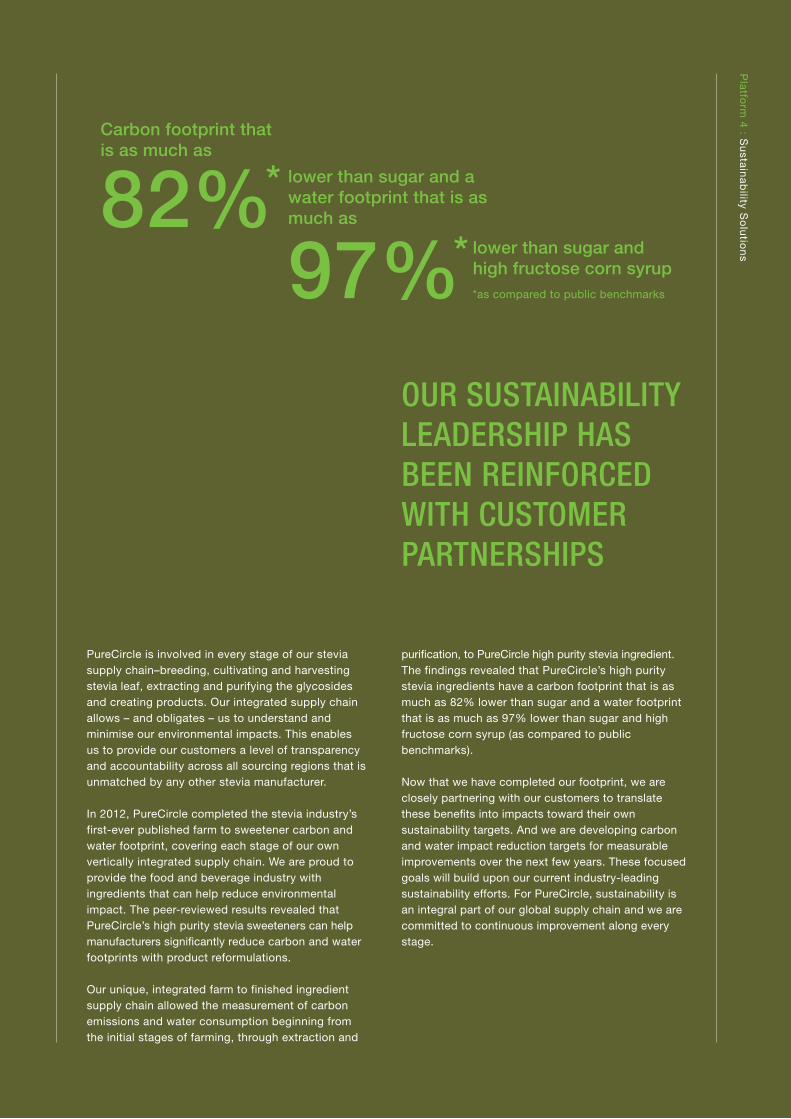
OUR SUSTAINABILITY LEADERSHIP HAS BEEN REINFORCED WITH CUSTOMER PARTNERSHIPS
PureCircle is involved in every stage of our stevia supply chain–breeding, cultivating and harvesting stevia leaf, extracting and purifying the glycosides and creating products. Our integrated supply chain allows – and obligates – us to understand and minimise our environmental impacts. This enables us to provide our customers a level of transparency and accountability across all sourcing regions that is unmatched by any other stevia manufacturer.
In 2012, PureCircle completed the stevia industry’s first-ever published farm to sweetener carbon and water footprint, covering each stage of our own vertically integrated supply chain. We are proud to provide the food and beverage industry with ingredients that can help reduce environmental impact. The peer-reviewed results revealed that PureCircle’s high purity stevia sweeteners can help manufacturers significantly reduce carbon and water footprints with product reformulations. Our unique, integrated farm to finished ingredient supply chain allowed the measurement of carbon emissions and water consumption beginning from the initial stages of farming, through extraction and
purification, to PureCircle high purity stevia ingredient. The findings revealed that PureCircle’s high purity stevia ingredients have a carbon footprint that is as muchas82%lowerthansugarandawaterfootprintthatisasmuchas97%lowerthansugarandhighfructose corn syrup (as compared to public benchmarks). Nowthatwehavecompletedourfootprint,weareclosely partnering with our customers to translate these benefits into impacts toward their own sustainability targets. And we are developing carbon and water impact reduction targets for measurable improvements over the next few years. These focused goals will build upon our current industry-leading sustainabilityefforts.ForPureCircle,sustainabilityisan integral part of our global supply chain and we are committed to continuous improvement along every stage.
82%* lower than sugar and a water footprint that is as much as
Carbon footprint thatis as much as
lower than sugar and high fructose corn syrup97%**as compared to public benchmarks
Pur
eCirc
le A
nnua
l Rep
ort
20
12
Global Communications•Campaignextendedacrossallelementsof
PureCircle Communications
•Expandingourreachthroughalternativechannels such as Twitter
Everything Stevia Conferences•HeldinLondon,Spain,Italy,Germany
•Reachingover250delegatesfrom150topEUFoodandBeverageManufacturers
5
EVERYTHING STEVIA
Marketing Services & Solutions•NewinsightsdrivingEurope(Spain,UK,France)
•Toolkitsofsolutionsforcustomers to enhance solution selling force
ESTABLISHING OURSELVES AS THE “EVERYTHING STEVIA” COMPANY– FROM MARKETING SERVICES TO INTEGRATED COMMUNICATIONS
Pla
tform
5 : E
veryth
ing
Ste
via
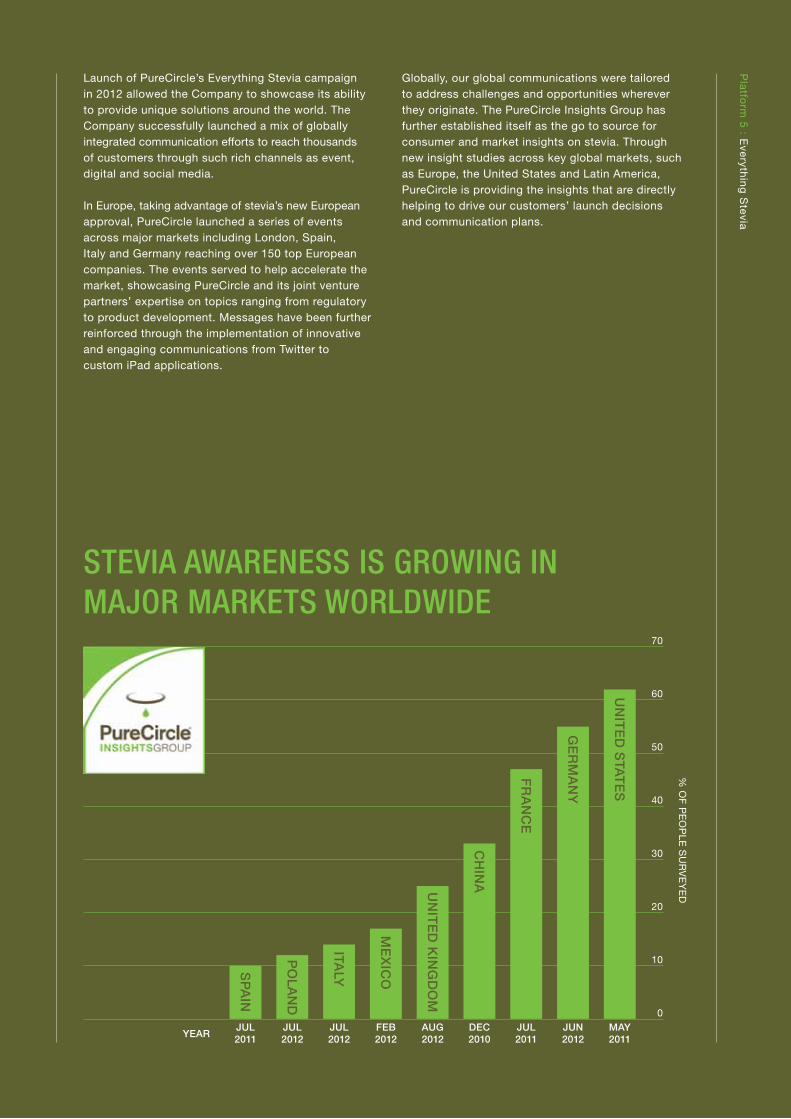
STEVIA AWARENESS IS GROWING IN MAJOR MARKETS WORLDWIDE
70
60
50
40
30
20
10
0JUL2011YEAR
JUL2012
JUL2012
FEB2012
AUG2012
DEC2010
JUL2011
JUN2012
MAY2011
SP
AIN
PO
LAN
D
ITALY
ME
XIC
O
UN
ITE
D K
ING
DO
M
UN
ITE
D S
TAT
ES
CH
INA
FR
AN
CE
GE
RM
AN
Y
%O
FPEOPLE
SURVEYED
Launch of PureCircle’s Everything Stevia campaign in 2012 allowed the Company to showcase its ability to provide unique solutions around the world. The Company successfully launched a mix of globally integrated communication efforts to reach thousands of customers through such rich channels as event, digital and social media.
In Europe, taking advantage of stevia’s new European approval, PureCircle launched a series of events across major markets including London, Spain, Italy and Germany reaching over 150 top European companies. The events served to help accelerate the market, showcasing PureCircle and its joint venture partners’ expertise on topics ranging from regulatory to product development. Messages have been further reinforced through the implementation of innovative and engaging communications from Twitter to custom iPad applications.
Globally, our global communications were tailored to address challenges and opportunities wherever they originate. The PureCircle Insights Group has further established itself as the go to source for consumer and market insights on stevia. Through new insight studies across key global markets, such as Europe, the United States and Latin America, PureCircle is providing the insights that are directly helping to drive our customers’ launch decisions and communication plans.


Nature’s Gift
Pur
eCirc
le A
nnua
l Rep
ort
20
12
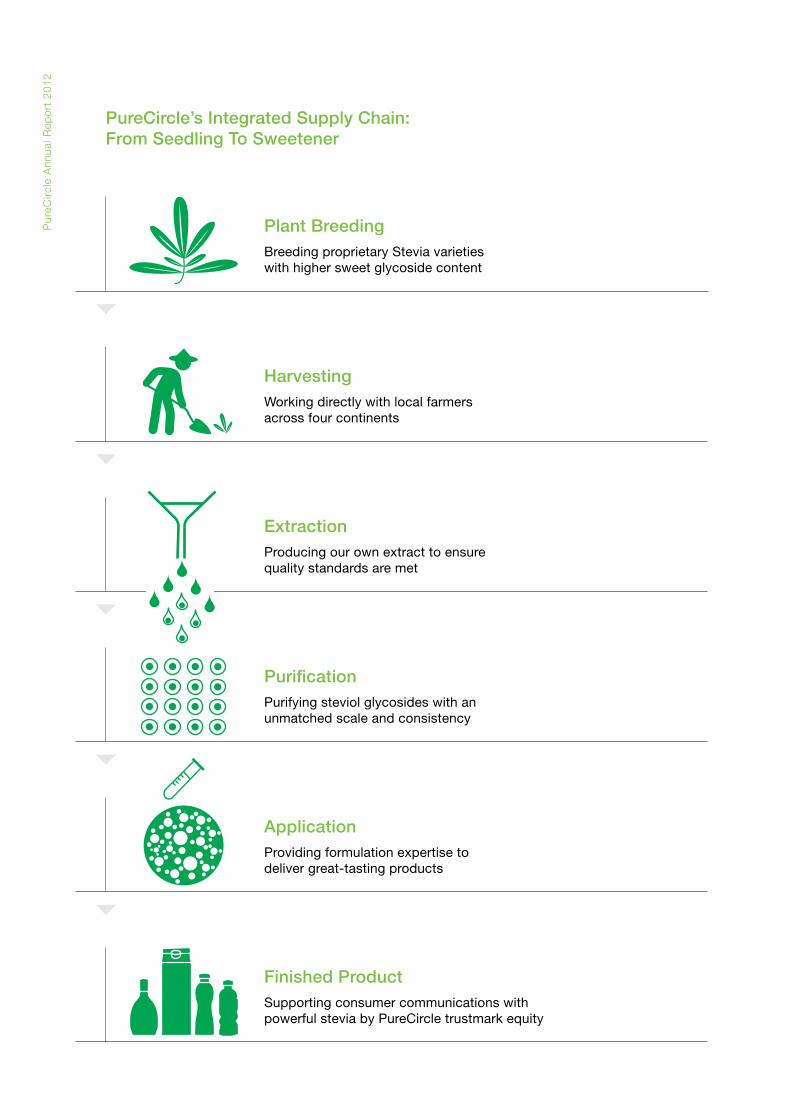
PureCircle’s Integrated Supply Chain:From Seedling To Sweetener
Plant BreedingBreeding proprietary Stevia varietieswith higher sweet glycoside content
HarvestingWorking directly with local farmersacross four continents
ExtractionProducing our own extract to ensurequality standards are met
PurificationPurifying steviol glycosides with an unmatched scale and consistency
ApplicationProviding formulation expertise to deliver great-tasting products
Finished ProductSupporting consumer communications with powerful stevia by PureCircle trustmark equity

Overview 018...021 1.1 Visionandstrategy
1.2 Our market
1.3 Highlights for the year
Business review 022...028 2.1 Chairman’s statement
2.2 Chief Executive’s review
Corporate governance 029...037 3.1 Corporate governance report
3.2 ReportoftheRemunerationCommittee
3.3 Director’s report
3.4 Board of directors
Independent auditors’ report 038
Accounts and notes 040...091
Shareholder information 092
Table of Contents
1.0
2.0
3.0
4.0
5.0
6.0
Pur
eCirc
le A
nnua
l Rep
ort
20
12
18
1.1 Vision and StrategyPureCircle’s vision is to lead the global expansion of stevia as the next mass volume natural sweetener. All mass volume sweeteners have four characteristics:
• Greattaste • Economicpricing • Scalablesupply • Sustainablesupply
Onlysugar,cornandsteviafulfillthesefourcriteria.Oftheseonlysteviahastheaddedadvantageofcontributingnocaloriestofoodandbeverageandhasalowglycemicindex,makingitsafefordiabetics.Additionallysteviahasthebenefitofhavingexcellentapplicationsynergieswithsugarand corn as well as cost advantages that can offset corn andsugarsweetenerinputcosts.Intoday’smarketwhereconsumersarerequiringhealthier,morenaturalchoicesandmanufacturersarelookingtomeetthisdemandwhilecontinuallydrivingcostefficiencies,steviaisaclearsolution.
Our vision is to grow stevia to become a multi-billion dollar globalmarket.Withsustainedgrowthoverseveraldecades,weexpectittotakeasignificantshareoftheUSD60billionnaturalmassvolumesweetenermarket.Inachievingthisvision,itisexpectedsteviawillbecommonlyusedasacomplement to sugar and corn sweeteners – reducing calories in major mainstream brands around the world.
Withthisvisioninmind,PureCircleisfocusedonthree core strategies:
1.Developingtheglobalsteviamarketandsecuringmarketshare–Oursalesandmarketingactivitiesaredirected towards contracts with the world’s leading food and beverage manufacturers and supporting them with consumer insights and education and technical support and innovation for their product development.
2.Scalingandsustainingsupply–Oursupplychainfocusisonallelementsnecessarytoensurewearepreparedtoscalerapidlyinlinewithglobaldemandonasustainablebasis,throughsuchactivitiesasplantbreeding,agriculturaldiversification,processingefficienciesandexpansion.Intheprocess,wewilldelivermassvolumesupplyateconomicprices.
3.Deliveringinnovationleadership–Thehighpuritysteviaindustrywilldevelopovermanydecades.Innovationwill enable wider and deeper usage across all food and beverage categories. Innovation is at the core of our business and we will use innovation to continue to lead thegrowthoftheindustry.
1.0 Overview
PureCircle is the global leader in the production, marketing and distribution of high purity stevia ingredients, the world’s first all natural sweetener and flavour solutions regarded as a viable complement to sugar and corn (High Fructose Corn Syrup) in mainstream food and beverage production.
Through our innovative technologies and processes we are able to extract the highest purity natural sweeteners and flavour from the stevia plant, enabling our customers to develop healthier, lower calorie formulations for their mainstream consumer products.
As leaders in this industry, we are continually developing this global market in partnership with our blue chip customers and business partners in a transparent and responsible manner.
18
19
1.0
Ove
rview
13
1.2 Our MarketConsumersareseekinganingredientthatprovidesgreattasting sweetness but which also supports the natural and healthylifestylecharacteristicsbeingdemandedof21stcenturyfoodandbeverageproducts.Steviaingredientsare well positioned to meet the mainstream consumer requirementsforacomplementaryingredienttosugar and corn.
Aswellaslookingtoaddressthegrowinghealthconcernsofconsumers,foodandbeverageproducersarecontinuallyseekingforefficientsolutionstooffsetcommoditypriceincreasesofrecentyears.
Steviaisaplant-based,no-calorie,naturalingredient thathasbeenusedforhundredsofyearsasaregularpartofsomeregionaldiets.Extractsfromsteviahavebeenusedasformsofsweetenerformanycenturieswithoutever becoming mainstream. PureCircle has addressed the technological issues and overcome the hurdles associated withdevelopingamajornewingredientmarket.
Highpuritysteviaistheonlyviablemassvolumenaturalingredientcomplementtosugarandcorncurrentlyincommercial development. PureCircle believes it is unique initsabilitytoproduceaportfolioofhighpuritystevia
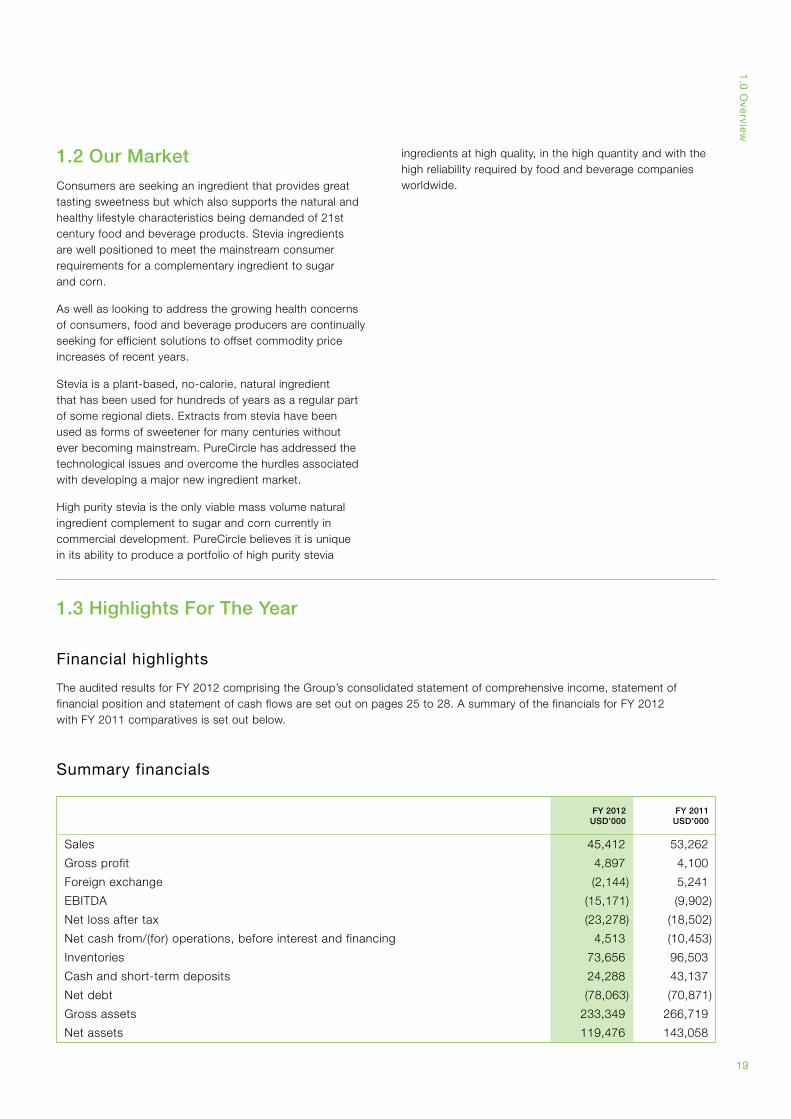
FY 2012USD’000
FY 2011USD’000
Sales 45,412 53,262
Grossprofit 4,897 4,100
Foreign exchange (2,144) 5,241
EBITDA (15,171) (9,902)
Net loss after tax (23,278) (18,502)
Netcashfrom/(for)operations,beforeinterestandfinancing 4,513 (10,453)
Inventories 73,656 96,503
Cash and short-term deposits 24,288 43,137
Net debt (78,063) (70,871)
Grossassets 233,349 266,719
Net assets 119,476 143,058
1.3 Highlights For The Year
Financialhighlights
TheauditedresultsforFY2012comprisingtheGroup’sconsolidatedstatementofcomprehensiveincome,statementoffinancialpositionandstatementofcashflowsaresetoutonpages25to28.AsummaryofthefinancialsforFY2012withFY2011comparativesissetoutbelow.
Summary financials
ingredientsathighquality,inthehighquantityandwiththehighreliabilityrequiredbyfoodandbeveragecompaniesworldwide.
Pur
eCirc
le A
nnua
l Rep
ort
20
12
20
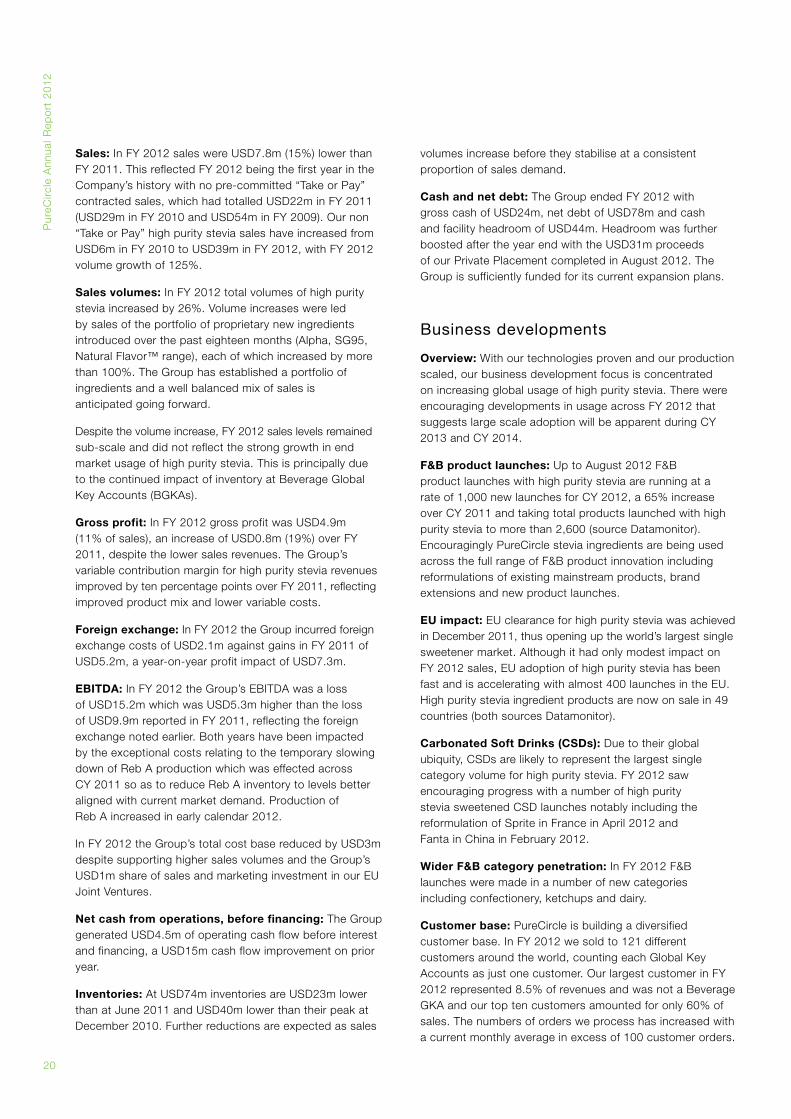
Sales:InFY2012saleswereUSD7.8m(15%)lowerthanFY2011.ThisreflectedFY2012beingthefirstyearintheCompany’shistorywithnopre-committed“TakeorPay”contractedsales,whichhadtotalledUSD22minFY2011(USD29minFY2010andUSD54minFY2009).Ournon“TakeorPay”highpuritysteviasaleshaveincreasedfromUSD6minFY2010toUSD39minFY2012,withFY2012volumegrowthof125%.
Sales volumes:InFY2012totalvolumesofhighpuritysteviaincreasedby26%.Volumeincreaseswereledbysalesoftheportfolioofproprietarynewingredientsintroducedoverthepasteighteenmonths(Alpha,SG95,NaturalFlavor™range),eachofwhichincreasedbymorethan100%.TheGrouphasestablishedaportfolioofingredients and a well balanced mix of sales is anticipated going forward.
Despitethevolumeincrease,FY2012saleslevelsremainedsub-scale and did not reflect the strong growth in end marketusageofhighpuritystevia.Thisisprincipallydue tothecontinuedimpactofinventoryatBeverageGlobal KeyAccounts(BGKAs).
Gross profit:InFY2012grossprofitwasUSD4.9m (11%ofsales),anincreaseofUSD0.8m(19%)overFY2011,despitethelowersalesrevenues.TheGroup’svariablecontributionmarginforhighpuritysteviarevenuesimprovedbytenpercentagepointsoverFY2011,reflectingimproved product mix and lower variable costs.
Foreign exchange:InFY2012theGroupincurredforeignexchangecostsofUSD2.1magainstgainsinFY2011ofUSD5.2m,ayear-on-yearprofitimpactofUSD7.3m.
EBITDA:InFY2012theGroup’sEBITDAwasaloss ofUSD15.2mwhichwasUSD5.3mhigherthanthelossofUSD9.9mreportedinFY2011,reflectingtheforeignexchangenotedearlier.Bothyearshavebeenimpactedbytheexceptionalcostsrelatingtothetemporaryslowingdown of Reb A production which was effected across CY2011soastoreduceRebAinventorytolevelsbetteralignedwithcurrentmarketdemand.Productionof RebAincreasedinearlycalendar2012.
InFY2012theGroup’stotalcostbasereducedbyUSD3mdespitesupportinghighersalesvolumesandtheGroup’sUSD1mshareofsalesandmarketinginvestmentinourEU JointVentures.
Net cash from operations, before financing:TheGroupgeneratedUSD4.5mofoperatingcashflowbeforeinterestandfinancing,aUSD15mcashflowimprovementonprioryear.
Inventories:AtUSD74minventoriesareUSD23mlowerthanatJune2011andUSD40mlowerthantheirpeakatDecember2010.Furtherreductionsareexpectedassales
volumesincreasebeforetheystabiliseataconsistentproportion of sales demand.
Cash and net debt:TheGroupendedFY2012with grosscashofUSD24m,netdebtofUSD78mandcashandfacilityheadroomofUSD44m.HeadroomwasfurtherboostedaftertheyearendwiththeUSD31mproceedsofourPrivatePlacementcompletedinAugust2012.TheGroupissufficientlyfundedforitscurrentexpansionplans.
Business developments
Overview:Withourtechnologiesprovenandourproductionscaled,ourbusinessdevelopmentfocusisconcentratedonincreasingglobalusageofhighpuritystevia.TherewereencouragingdevelopmentsinusageacrossFY2012thatsuggestslargescaleadoptionwillbeapparentduringCY2013andCY2014.
F&B product launches:UptoAugust2012F&B productlauncheswithhighpuritysteviaarerunningatarateof1,000newlaunchesforCY2012,a65%increaseoverCY2011andtakingtotalproductslaunchedwithhighpuritysteviatomorethan2,600(sourceDatamonitor).EncouraginglyPureCirclesteviaingredientsarebeingusedacrossthefullrangeofF&Bproductinnovationincludingreformulationsofexistingmainstreamproducts,brandextensions and new product launches.
EU impact:EUclearanceforhighpuritysteviawasachievedinDecember2011,thusopeninguptheworld’slargestsinglesweetenermarket.AlthoughithadonlymodestimpactonFY2012sales,EUadoptionofhighpuritysteviahasbeenfastandisacceleratingwithalmost400launchesintheEU.Highpuritysteviaingredientproductsarenowonsalein49countries(bothsourcesDatamonitor).
Carbonated Soft Drinks (CSDs):Duetotheirglobalubiquity,CSDsarelikelytorepresentthelargestsinglecategoryvolumeforhighpuritystevia.FY2012sawencouragingprogresswithanumberofhighpurity steviasweetenedCSDlaunchesnotablyincludingthe reformulationofSpriteinFranceinApril2012and FantainChinainFebruary2012.
Wider F&B category penetration:InFY2012F&Blaunches were made in a number of new categories includingconfectionery,ketchupsanddairy.
Customer base: PureCircle is building a diversified customerbase.InFY2012wesoldto121differentcustomersaroundtheworld,countingeachGlobalKeyAccountsasjustonecustomer.OurlargestcustomerinFY2012represented8.5%ofrevenuesandwasnotaBeverageGKAandourtoptencustomersamountedforonly60%ofsales.Thenumbersofordersweprocesshasincreasedwithacurrentmonthlyaverageinexcessof100customerorders.
21
Geographical spread:InFY2012theGroupsoldto47differentcountriesofdestination.TheUSAnowrepresents40%oftotalsales,withstronggrowthinsalestoChina,Mexico,EuropeandBrazil.
Regulatory:Highpuritystevianowhasregulatory approvalinmostmajormarkets.FY2012approvals includedIndonesiaandPhilippinesaswellastheEU. ThekeyremainingcountriesareIndia,Canada,Thailand andSouthAfrica.Approvalisexpectedinallofthese beforeendJune2013andwillprovideafurther1.6billionnewconsumerswithaccesstohighpuritystevia.
PureCircle product portfolio:FY2012wasthefirst fullyearofsalesforourproprietaryingredientsSG95andNaturalFlavor™range;inadditioninFY2012welaunchedAlpha.RebArepresentedjust40%ofourtotalrevenues (FY2009:90%).Ourenhancedingredientrangecomprisesnewproductsdevelopedspecificallyinresponsetocustomerneedsandtheyareproprietary.Marketresponsehasbeenpositive,withyear-on-yearsalesgrowthwellinexcessof100%andpipelinegrowthevenhigher.
PureCircle’sinnovationiswhatsetsusapartintheindustryand we have further innovative product plans in the pipeline.
Technical support:WehaveexpandedourtechnicalsupportopeningapplicationlaboratoriesinkeymarketssuchasEurope(UK),ChinaandsoonMexico.WehavedevelopedthePureCircleUniversityprogrammeinresponsetocustomerdemand for direct access to our technical support. Launched inFY2012thisalreadyhasastrongpipelineofcustomerparticipation and is building deep relationships.
Stevia advocacy and sustainability initiatives: Our initiativescontinuetoproviderealindustryleadershipandlong-term value for PureCircle.
• ThePureCircleSteviaTrustmark™isnowusedon160products launched across 32 countries with additional productlaunchesinthepipelineforFY2013.
• Ourcarbonandwaterfootprintauditsarebeingdeveloped further to provide clear consumer benefits to our customers.
• OurInsightsGroupisbuildingmarketstudiesdirectlyinpartnershipwithkeycustomers.
• TheGlobalSteviaInstitute(GSI)isnowestablishedwithadvisersactiveacross4continents.TheGSInowattracts3,000subscriberstoitsmonthlynewsletter.
Joint Ventures:WiththeopeningoftheEUmarket,FY2012sawthefirstsalescontributionsfromourJointVentures.ThepaceofF&BlaunchesintheEUsuggests thattheJVswillexperiencesalesgrowthinfutureyears.
Supply chain:InFY2012oursupplychainsupportedoverallsalesvolumeincreasesofover26%anddeliverednewproductvolumesupmorethan100%onalowercostbaseandwithreducedvariablecosts.Thisprovidesaplatformforimprovedprofitabilityassalesvolumesincrease.ThetrueextentoftheproductionefficiencygainsmadeinFY2012ismaskedbytheone-offcostsandthehigherproduction overheads charged to profit due to lower inventorylevels.
Commentingontheauditedresults,theChairmanPaulSelway-Swiftsaid:
“FY 2012 was the first year that our sales were not supported by committed “Take or Pay” contracts. Despite this our high purity stevia sales volumes increased. Further some 85% of sales comprised demand that did not exist three years ago. This augurs well for future sales growth.
Our recent results have been impacted by the tough decisions we made in 2011 to slowdown Reb A production temporarily to better align inventories to current market demand. Results should improve as the evident growth in market usage of our products starts to translate into higher sales.
We remain confident of the future of our high purity stevia business but continue our guidance that this should be seen as a mid to long-term opportunity.”
1.0
Ove
rview
Pur
eCirc
le A
nnua
l Rep
ort
20
12
22
2.0 Business Review
2.1 Chairman’s Statement FY2012hasbeenayearofconsiderableprogressinthedevelopmentofthehighpuritysteviaindustryandintheestablishmentofPureCircleastheleadingcompanyintheindustry,althoughclearlythatprogressisnotyetevident in our reported financial results.
NotablemilestonesforthehighpuritysteviaindustryhaveincludedregulatoryapprovalfortheEUmarketinDecember2011,whichopensuptheworld’slargestsweetenermarket,andthefirstlaunchesofmajorCarbonatedSoftDrinkscontaininghighpuritystevia.Eachofthesedevelopmentsincreasesmateriallytheaddressablemarketforhighpuritystevia.
DuringFY2012PureCirclehasfurtherdiversifieditscustomerbase,deliverednewproprietaryingredientstomarket,increasedsalesvolumesbymorethan26%andreduceditscostbase,whilstcontinuingtoinvestininnovationandleafdevelopment.Thesedevelopments all provide confidence in the robustness and sustainabilityofourbusinessmodel.
Weremainconfidentaboutthelong-termfutureofthehighpuritysteviaindustryandoftheopportunityforPureCircle toplaytheleadingroleinit.PureCircleisoperationallygeared and our financial results are sensitive to sales revenues.OurguidanceremainsthatitislikelytobeCY2013or2014beforemassvolumeadoptionofhighpuritystevia is evident and the benefits of increased usage starts to be reflected in our results.
2.2 Chief Executive’s Review
1. Operations1.1 Market
Ourmarketisdefinedbythedemandforourproprietaryingredientsbytheworld’sfoodandbeverage(F&B)companies.Inturnthesizeanddynamicsofthismarket areinfluencedbytheend-consumerdemandforF&BproductsusingPureCircleingredients.FY2012sawimportantgrowthinourmarketandinconsumer demandforhighpuritystevia.
DatamonitorreportsF&BproductsusinghighpuritystevialaunchingacrossCY2012to-dateatanannualrateof1,000newproducts,anincreaseof65%onayearagoand606%increasesincethestartof2009.Morethan2,600productshavenowbeenlaunchedusinghighpuritysteviaasaningredient.
Steviaproductlauncheshavebeenreportedinmorethan49countriesinCY2012,boostedbytheopeningoftheEUmarketinDecember2011.TheEU,whichistheworld’slargestmarketforsweeteners,hasseenmorethan40%ofthetotalnewlaunchesmadeto-dateinCY2012.
Consumerawarenessofsteviacontinuestogrowsharply.IntheUSAconsumerawarenessisover62%,upmorethan30percentagepointsfrom3yearsago.InGermanyandFranceawarenessisalreadyatorabove50%,almost30percentage points higher than in 2010.
Regulatory
WiththeopeningoftheEU,IndonesiaandPhilippinesmarkets,highpuritysteviaisnowapprovedinalmostallmajorconsumermarkets.India,Thailand,CanadaandSouthAfrica,whicharetheprincipalcountriesstillawaitingclearances are each expected to secure approval within twelvemonths.Whentheydoso,approvalwillgrantabout1.6billionnewpotentialconsumersaccesstohighpuritystevia,representingalmost23%oftheworld’spopulation.
Other commodity sweeteners
InFY2012bothsugarandhighfructosecornsyrupcontinuedtoexperiencetighteningofsupplyagainstdemandandvolatilityintheirpricing.Thesetrendscan onlyhelpthefuturedevelopmentofmassvolume demand for PureCircle ingredients.
1.2 Sales
InFY2012oursalesofUSD45.4mwereUSD8m(15%)lowerthanFY2011.ThisreflectedFY2012beingthefirstyearintheCompany’shistorywithnopre-committed“TakeorPay”contractedsales,whichhadtotalledUSD22minFY2011,USD29minFY2010andUSD54minFY2009.Ournon“TakeorPay”highpuritysteviasaleshaveincreasedfromUSD6minFY2010toUSD39minFY2012,withFY2012volumegrowthof125%.
InFY2012totalvolumesofhighpuritysteviaincreasedby26%.Volumeincreaseswereledbysalesoftheportfolioofproprietarynewingredientsintroducedoverthepasteighteenmonths(Alpha,SG95,NaturalFlavor™range),eachofwhichincreasedbymorethan100%.RebAcontributedjust40%ofrevenuesinFY2012.ThisportfolioofingredientswillhelptheGrouptohaveawellbalancedmix of sales going forward.
23
2.0B
usin
essR
evie
w
Co-productswereUSD6m(15%)ofFY2012revenues (FY2011USD7m).
SalesincludedUSD1.1mshareofsalesbyJointVentures,principallyfromourEUpartnershipswithTereosandNordzuckerwhichbenefittedfromtheopeningoftheEUmarketinDecember2011.
DuringFY2012PureCirclefurtherextendeditscustomerbaseinallmarkets,withthelargestincreasesseeninthenewlyopenedEUmarket,wherecustomersareservicedprincipallythroughourJointVentures,ChinaandinLatinAmerica.InFY2012weservicedmorethan121customers,witheachGlobalKeyAccountcountingasjustone.Ourlargestcustomerrepresentedjust8.5%ofsalesandwasnotaBeverageGlobalKeyAccount.InFY2012PureCirclesoldinto47countries:theUSArepresented40%ofsales,followedbyChina,MexicoandtheEU.
Reviewing the food and beverage products launched into marketthatareusinghighpuritystevia,itisclearthatPureCircle and our partners continue to secure the major shareofmarket.Thishasbeenfurtherunderpinnedbythesuccessesofourproprietarynewproductslaunched within the last eighteen months.
1.3 Marketing and technical support
Wehaveexpandedouttechnicalsupportandfurtherdevelopedoursteviaadvocacyandsustainabilityplatforms.
WehaveopenedapplicationsupportlaboratoriesinEurope(UK)andChinaand,soontobeopened,Mexico.Ourpipeline of customer technical projects is growing and thenumberofcustomerworkingsessionshasincreasedsignificantly.
Oursteviatechnicalsupport,advocacyandsustainabilityinitiativesarebasedonthefiveplatformsoftheGlobalSteviaInstitute,thePureCircleInsightsGroup,thePureCircleTrustmarksolutions,PureCircleUniversityandoursustainablepartnerships.Eachhavedevelopedstronglyduringtheyearunderreviewandarenoweachrecognisedasindustryleadersintheirownright.Eachprovidesanexcellent basis for deeper partnership relationships with our customers.
• ThePureCircleSteviaTrustmark™isnowusedon160products launched across 32 countries with additional productlaunchesinthepipelineforFY2013.
• Ourcarbonandwaterfootprintauditsarebeingdeveloped further to provide clear consumer benefits to our customers.
• OurInsightsGroupisbuildingmarketstudiesdirectly inpartnershipwithkeycustomers.
• TheGlobalSteviaInstitute(GSI)isnowestablishedwith
advisersactiveacross4continents.TheGSInowattracts3,000subscriberstoitsmonthlynewsletter.
• ThePureCircleUniversityprogrammewasdevelopedinresponse to customer demand for direct access to our technicalsupport.LaunchedinFY2012thisalreadyhasa strong pipeline of customer participation and is building deep relationships.
1.4 Supply chain
InFY2012leafsupplyhasbeenfurtherdiversifiedandstrengthenedwithKenya,ParaguayandUSAbeingaddedto China. Although Reb A production was slowed down in CY2011productionofotherproductsinportfolioincreasedstronglyasreflectedinthehigheroverallvolumeofhighpuritysteviasold.Thiswasachievedonalowertotalcostbase and with lower variable costs.
Overallthesupplychainisinrobustshapeandreadytorespondtoincreasedmarketdemandinthefuture.
1.5 R&D
TheGroupactivelycontinuedtoinvestininnovationandisworkingtocommercializenewandexcitingproductstofurther strengthen its portfolio and enhance future earnings.
2. Management
TheGrouphasambitiouslong-termgrowthplans.Todeliverthese we will continue to invest in management with the skillsandexperiencetodriveandsupportourgrowthplansinallaspectsofourbusiness.OurpriorityinFY2012hasbeensalesandmarketingwithinvestmentfocusingonourEU,ChinaandLatinAmericasalesbusinessesandonexpandingourtechnicalandapplicationcapacity.
Movingforwardwewillstrengthenfurtherourglobalsupplychain and logistics to better service the anticipated increase in demand.
3.GroupFinancialReview
TheGroup’sFY2012financialyearcoverstheperiodfrom1July2011to30June2012.FY2011comparativesarefortheperiodfrom1July2010to30June2011.
Setoutonpage24isanextractfromtheauditedFY2012accounts.Thefullconsolidatedstatementofcomprehensiveincome,statementoffinancialpositionandstatementofcash flows follow in pages 25 to 28.
Pur
eCirc
le A
nnua
l Rep
ort
20
12
24
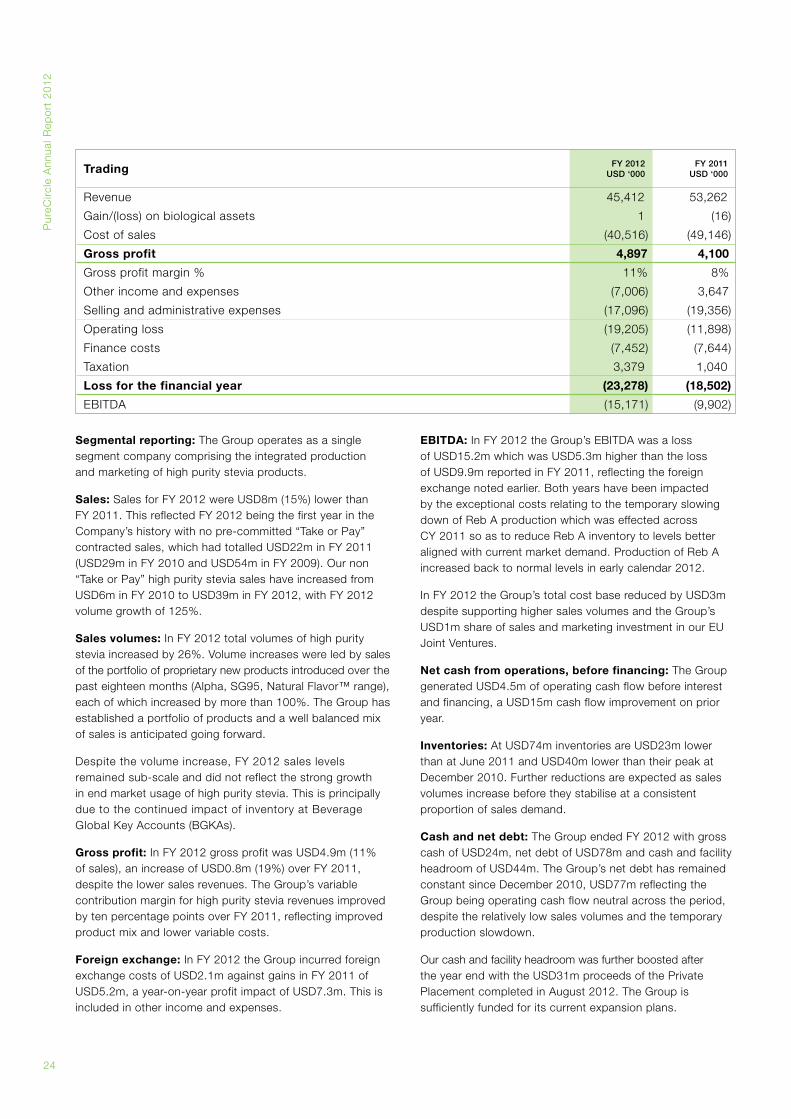
Trading FY 2012USD ‘000
FY 2011USD ‘000
Revenue 45,412 53,262
Gain/(loss)onbiologicalassets 1 (16)
Cost of sales (40,516) (49,146)
Gross profit 4,897 4,100
Grossprofitmargin% 11% 8%
Other income and expenses (7,006) 3,647
Sellingandadministrativeexpenses (17,096) (19,356)
Operating loss (19,205) (11,898)
Finance costs (7,452) (7,644)
Taxation 3,379 1,040
Loss for the financial year (23,278) (18,502)
EBITDA (15,171) (9,902)
Segmental reporting:TheGroupoperatesasasinglesegmentcompanycomprisingtheintegratedproduction andmarketingofhighpuritysteviaproducts.
Sales:SalesforFY2012wereUSD8m(15%)lowerthanFY2011.ThisreflectedFY2012beingthefirstyearintheCompany’shistorywithnopre-committed“TakeorPay”contractedsales,whichhadtotalledUSD22minFY2011(USD29minFY2010andUSD54minFY2009).Ournon“TakeorPay”highpuritysteviasaleshaveincreasedfromUSD6minFY2010toUSD39minFY2012,withFY2012volumegrowthof125%.
Sales volumes:InFY2012totalvolumesofhighpuritysteviaincreasedby26%.Volumeincreaseswereledbysalesoftheportfolioofproprietarynewproductsintroducedoverthepasteighteenmonths(Alpha,SG95,NaturalFlavor™range),eachofwhichincreasedbymorethan100%.TheGrouphasestablished a portfolio of products and a well balanced mix of sales is anticipated going forward.
Despitethevolumeincrease,FY2012saleslevelsremained sub-scale and did not reflect the strong growth inendmarketusageofhighpuritystevia.ThisisprincipallyduetothecontinuedimpactofinventoryatBeverageGlobalKeyAccounts(BGKAs).
Gross profit:InFY2012grossprofitwasUSD4.9m(11%ofsales),anincreaseofUSD0.8m(19%)overFY2011,despitethelowersalesrevenues.TheGroup’svariablecontributionmarginforhighpuritysteviarevenuesimprovedbytenpercentagepointsoverFY2011,reflectingimprovedproduct mix and lower variable costs.
Foreign exchange:InFY2012theGroupincurredforeignexchangecostsofUSD2.1magainstgainsinFY2011ofUSD5.2m,ayear-on-yearprofitimpactofUSD7.3m.Thisisincluded in other income and expenses.
EBITDA:InFY2012theGroup’sEBITDAwasaloss ofUSD15.2mwhichwasUSD5.3mhigherthanthelossofUSD9.9mreportedinFY2011,reflectingtheforeignexchangenotedearlier.Bothyearshavebeenimpactedbytheexceptionalcostsrelatingtothetemporaryslowingdown of Reb A production which was effected across CY2011soastoreduceRebAinventorytolevelsbetteralignedwithcurrentmarketdemand.ProductionofRebAincreasedbacktonormallevelsinearlycalendar2012.
InFY2012theGroup’stotalcostbasereducedbyUSD3mdespitesupportinghighersalesvolumesandtheGroup’sUSD1mshareofsalesandmarketinginvestmentinourEU JointVentures.
Net cash from operations, before financing:TheGroupgeneratedUSD4.5mofoperatingcashflowbeforeinterestandfinancing,aUSD15mcashflowimprovementonprioryear.
Inventories:AtUSD74minventoriesareUSD23mlowerthanatJune2011andUSD40mlowerthantheirpeakatDecember2010.Furtherreductionsareexpectedassalesvolumesincreasebeforetheystabiliseataconsistentproportion of sales demand.
Cash and net debt:TheGroupendedFY2012withgrosscashofUSD24m,netdebtofUSD78mandcashandfacilityheadroomofUSD44m.TheGroup’snetdebthasremainedconstantsinceDecember2010,USD77mreflectingtheGroupbeingoperatingcashflowneutralacrosstheperiod,despitetherelativelylowsalesvolumesandthetemporaryproduction slowdown.
OurcashandfacilityheadroomwasfurtherboostedaftertheyearendwiththeUSD31mproceedsofthePrivatePlacementcompletedinAugust2012.TheGroupissufficientlyfundedforitscurrentexpansionplans.
25
2.0B
usin
essR
evie
w
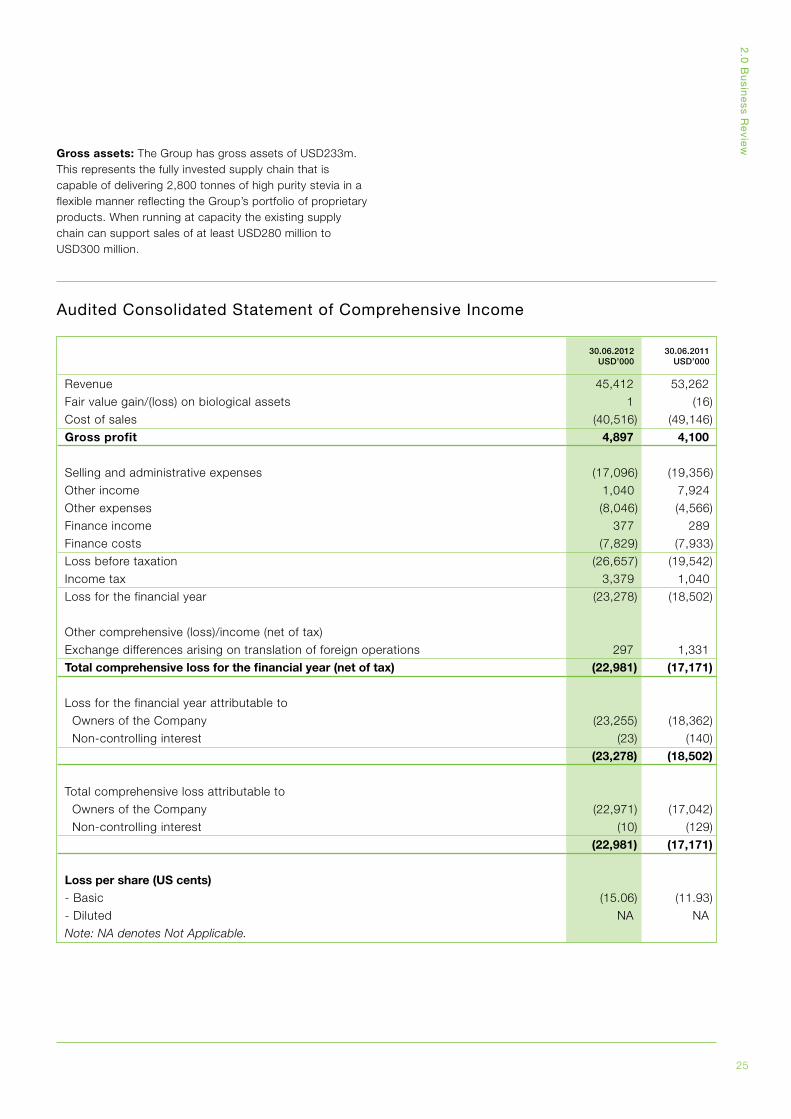
Gross assets:TheGrouphasgrossassetsofUSD233m.Thisrepresentsthefullyinvestedsupplychainthatiscapableofdelivering2,800tonnesofhighpuritysteviainaflexiblemannerreflectingtheGroup’sportfolioofproprietaryproducts.WhenrunningatcapacitytheexistingsupplychaincansupportsalesofatleastUSD280milliontoUSD300million.
30.06.2012USD’000
30.06.2011USD’000
Revenue 45,412 53,262
Fairvaluegain/(loss)onbiologicalassets 1 (16)
Cost of sales (40,516) (49,146)
Gross profit 4,897 4,100
Sellingandadministrativeexpenses (17,096) (19,356)
Other income 1,040 7,924
Other expenses (8,046) (4,566)
Finance income 377 289
Finance costs (7,829) (7,933)
Loss before taxation (26,657) (19,542)
Income tax 3,379 1,040
Lossforthefinancialyear (23,278) (18,502)
Othercomprehensive(loss)/income(netoftax)
Exchangedifferencesarisingontranslationofforeignoperations 297 1,331
Total comprehensive loss for the financial year (net of tax) (22,981) (17,171)
Lossforthefinancialyearattributableto
OwnersoftheCompany (23,255) (18,362)
Non-controlling interest (23) (140)
(23,278) (18,502)
Totalcomprehensivelossattributableto
OwnersoftheCompany (22,971) (17,042)
Non-controlling interest (10) (129)
(22,981) (17,171)
Loss per share (US cents)-Basic (15.06) (11.93)
-Diluted NA NA
Note: NA denotes Not Applicable.
Audited Consolidated Statement of Comprehensive Income
Pur
eCirc
le A
nnua
l Rep
ort
20
12
26
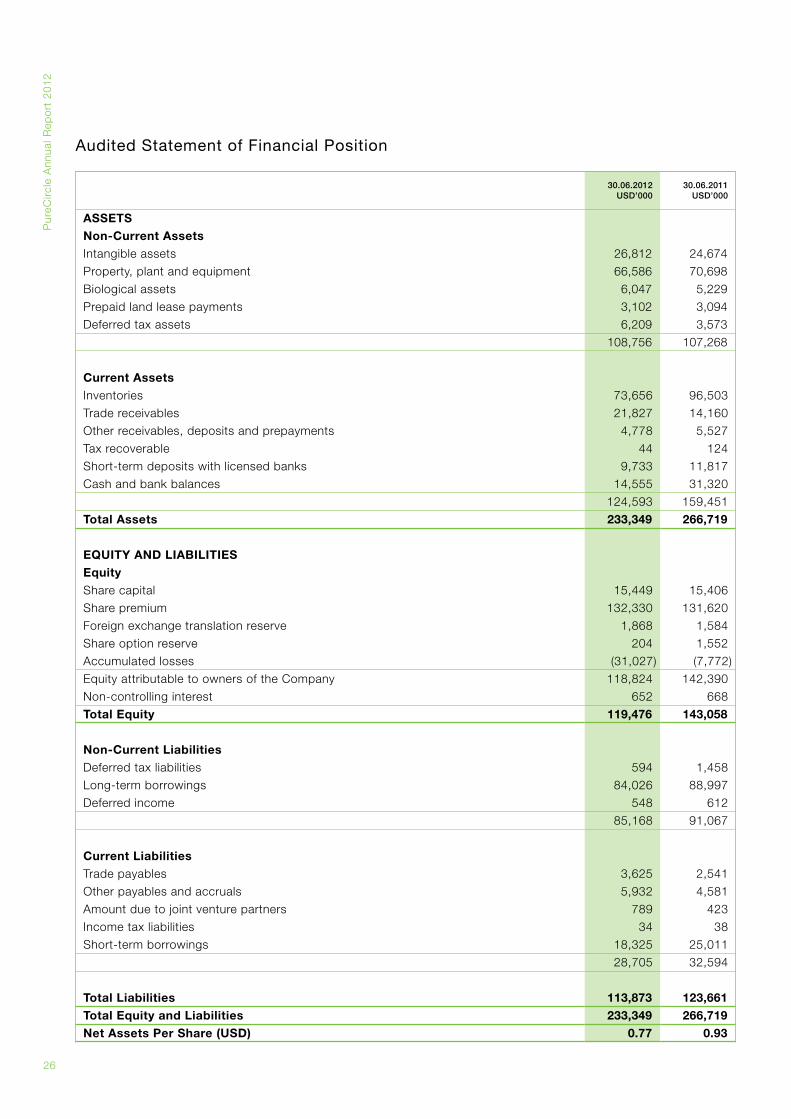
30.06.2012USD’000
30.06.2011USD’000
ASSETSNon-Current AssetsIntangible assets 26,812 24,674
Property,plantandequipment 66,586 70,698
Biologicalassets 6,047 5,229
Prepaidlandleasepayments 3,102 3,094
Deferredtaxassets 6,209 3,573
108,756 107,268
Current AssetsInventories 73,656 96,503
Tradereceivables 21,827 14,160
Otherreceivables,depositsandprepayments 4,778 5,527
Taxrecoverable 44 124
Short-termdepositswithlicensedbanks 9,733 11,817
Cashandbankbalances 14,555 31,320
124,593 159,451
Total Assets 233,349 266,719
EQUITY AND LIABILITIESEquitySharecapital 15,449 15,406
Sharepremium 132,330 131,620
Foreign exchange translation reserve 1,868 1,584
Shareoptionreserve 204 1,552
Accumulated losses (31,027) (7,772)
EquityattributabletoownersoftheCompany 118,824 142,390
Non-controlling interest 652 668
Total Equity 119,476 143,058
Non-Current LiabilitiesDeferredtaxliabilities 594 1,458
Long-term borrowings 84,026 88,997
Deferredincome 548 612
85,168 91,067
Current LiabilitiesTradepayables 3,625 2,541
Otherpayablesandaccruals 5,932 4,581
Amount due to joint venture partners 789 423
Income tax liabilities 34 38
Short-termborrowings 18,325 25,011
28,705 32,594
Total Liabilities 113,873 123,661Total Equity and Liabilities 233,349 266,719Net Assets Per Share (USD) 0.77 0.93
AuditedStatementofFinancialPosition
27
2.0B
usin
essR
evie
w
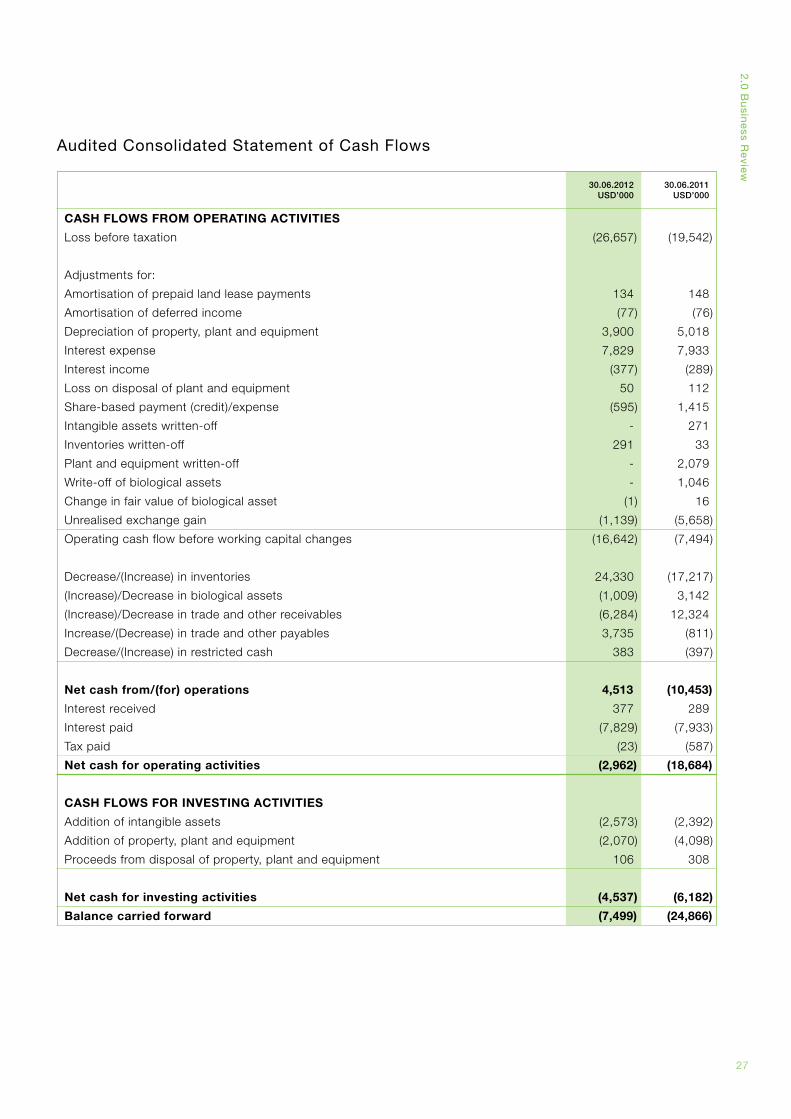
AuditedConsolidatedStatementofCashFlows
30.06.2012USD’000
30.06.2011USD’000
CASH FLOWS FROM OPERATING ACTIVITIES
Loss before taxation (26,657) (19,542)
Adjustments for:
Amortisationofprepaidlandleasepayments 134 148
Amortisation of deferred income (77) (76)
Depreciationofproperty,plantandequipment 3,900 5,018
Interest expense 7,829 7,933
Interest income (377) (289)
Loss on disposal of plant and equipment 50 112
Share-basedpayment(credit)/expense (595) 1,415
Intangible assets written-off - 271
Inventories written-off 291 33
Plant and equipment written-off - 2,079
Write-offofbiologicalassets - 1,046
Change in fair value of biological asset (1) 16
Unrealisedexchangegain (1,139) (5,658)
Operatingcashflowbeforeworkingcapitalchanges (16,642) (7,494)
Decrease/(Increase)ininventories 24,330 (17,217)
(Increase)/Decreaseinbiologicalassets (1,009) 3,142
(Increase)/Decreaseintradeandotherreceivables (6,284) 12,324
Increase/(Decrease)intradeandotherpayables 3,735 (811)
Decrease/(Increase)inrestrictedcash 383 (397)
Net cash from/(for) operations 4,513 (10,453)
Interest received 377 289
Interest paid (7,829) (7,933)
Taxpaid (23) (587)
Net cash for operating activities (2,962) (18,684)
CASH FLOWS FOR INVESTING ACTIVITIES
Addition of intangible assets (2,573) (2,392)
Additionofproperty,plantandequipment (2,070) (4,098)
Proceedsfromdisposalofproperty,plantandequipment 106 308
Net cash for investing activities (4,537) (6,182)
Balance carried forward (7,499) (24,866)
Pur
eCirc
le A
nnua
l Rep
ort
20
12
28
30.06.2012USD’000
30.06.2011USD’000
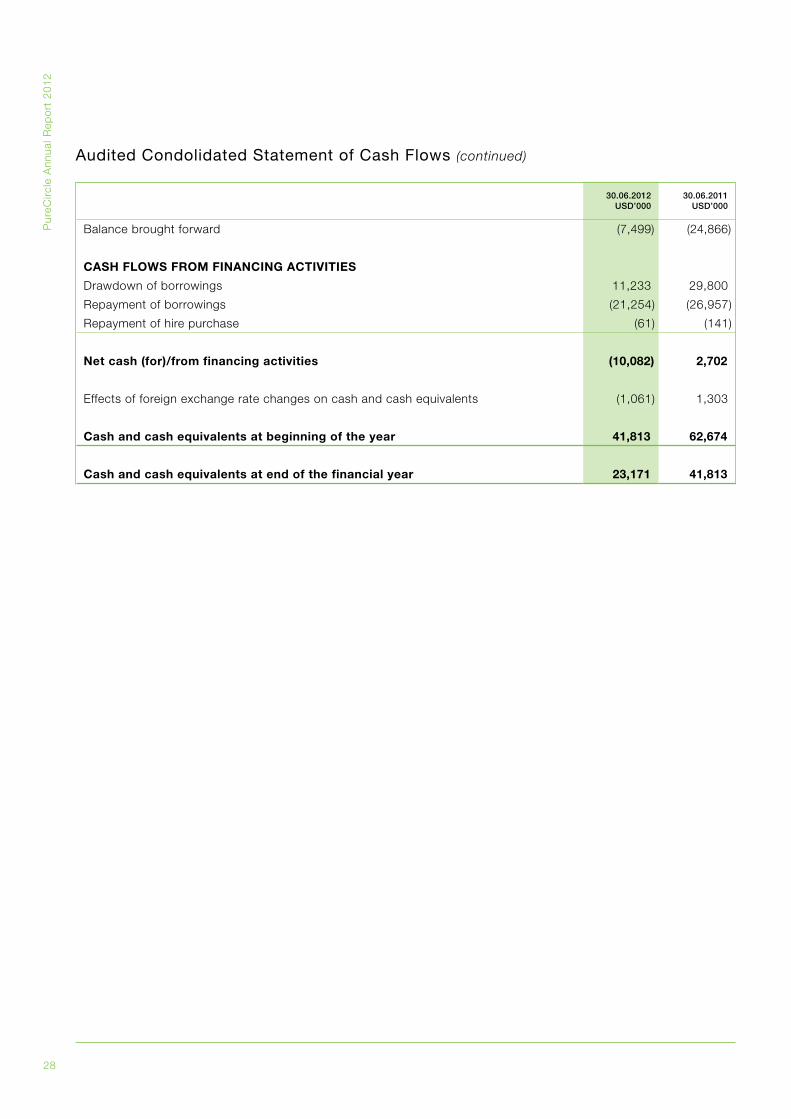
Balancebroughtforward (7,499) (24,866)
CASH FLOWS FROM FINANCING ACTIVITIES
Drawdownofborrowings 11,233 29,800
Repaymentofborrowings (21,254) (26,957)
Repaymentofhirepurchase (61) (141)
Net cash (for)/from financing activities (10,082) 2,702
Effectsofforeignexchangeratechangesoncashandcashequivalents (1,061) 1,303
Cash and cash equivalents at beginning of the year 41,813 62,674
Cash and cash equivalents at end of the financial year 23,171 41,813
AuditedCondolidatedStatementofCashFlows(continued)
29
3.0 Corporate Governance
3.1 Corporate Governance Report TheFinancialServicesAuthorityrequiresLondonStockExchangemainBoardlistedcompaniesincorporatedintheUKtostateintheirreportandaccountswhethertheycomplywiththeUKCorporateGovernanceCode(formerlytheCombinedCode)andidentifyandgivereasonsforanyareasofnon-compliance.PureCircleislistedonAIMandincorporatedinBermudaandtherefore,noformaldisclosures are required.
However,theBoardisfullyawareandiscommittedtoachievinggoodstandardsofcorporategovernance,integrityandbusinessethicsforallactivities.TheDirectorsofPureCircle regard corporate governance as important to thesuccessoftheCompany’sbusinessandarecommittedtoapplyingtheprinciplesnecessarytoensurethatgoodgovernance is practised in all of its business dealings in respectofallitsstakeholders.
ThefollowingsectionsetsouthowPureCirclehasappliedthe principles and provisions of the Code in the running of theBoard.
The BoardBoard composition and Board independence
TheBoardcomprisesaNon-ExecutiveChairman,twoExecutiveDirectorsandfiveotherNon-ExecutiveDirectors.Collectively,theyhaveadiverserangeofknowledgeandcommercial experience and serve the function of bringing objectivejudgementonthedevelopment,performanceandriskmanagementoftheGroupthroughtheircontributionsinboardmeetings.WiththeexceptionofSunnyVerghese,JohnSlosarandTanBoonSeng,theBoardconsidersall theNon-ExecutiveDirectorstobeindependent.
At the date of this report:
• SunnyVergheseistheGroupManagingDirectorofOlamInternationalLimited(“Olam”).Olamholds18.6%equityinterestintheCompany.
• JohnSlosaristheChiefExecutiveOfficerofCathayPacificLtdandChairmanofSwireBeverageswhicharepartlyownedbytheSwireGroup.SwireBeveragesHoldingsLtdholdsatotalof3.5%equityinterestintheCompany.
• TanBoonSengistheChairmanandManagingDirector ofLeeHingDevelopmentLimited,acompanylistedontheHongKongStockExchangeandtheholdingcompanyofWangTakCompanyLimited("WangTak"),ofwhichheisalsoadirector.WangTakholds11.7%equityinterest intheCompany.
TherolesoftheChairmanandChiefExecutiveareseparateandclearlydefined.
The role of the Board
TheBoard’sprincipalresponsibilityistodelivershareholdervalue and provide an overall vision and leadership for the Group.Italsohasanoversightrole,monitoringoperationalplansandensuringinternalcontrolsandriskmanagementareeffective.ThereisaformalscheduleofmattersreservedfortheBoard,whichprovidesaframeworkforittooverseethecontroloftheGroup’sdirectionandaffairs.
Thescheduleofmattersreservedincludetheapprovalofthefinancialstatementsanddividends,strategy,acquisitionsanddisposals,majorprojects,contracts,delegatedauthorities,majorcapitalexpenditure,riskmanagementstrategies,healthandsafetyandsuccessionplanning.WhilsttheCEOandExecutiveDirectorsareresponsibleforrecommendingtheoverallstrategyoftheGroup,theBoardmeetsatleastonceayeartoreviewstrategyandthefutureofthebusiness.ImplementationofthestrategyisdelegatedbytheCEOandExecutiveDirectorstotheExecutivemanagement team.
TheDirectorsaresatisfiedthattheBoardcontinuestodeliver a strategic vision and effective leadership for the Group.
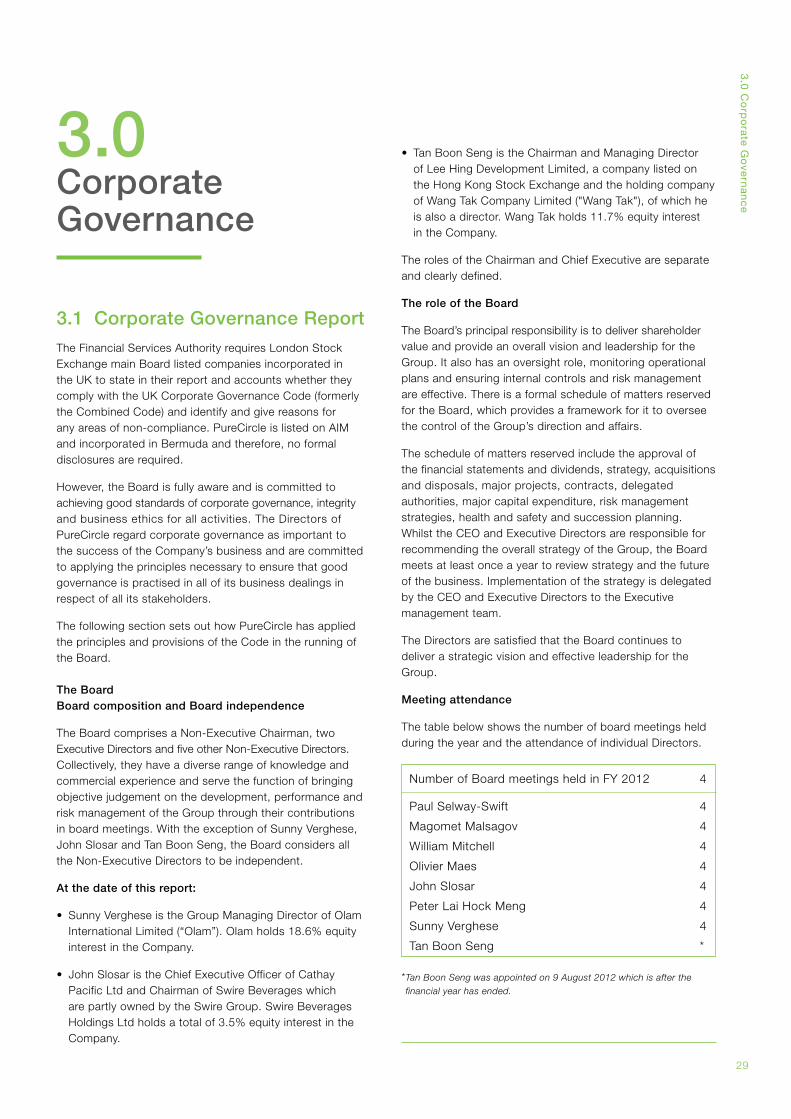
Meeting attendance
ThetablebelowshowsthenumberofboardmeetingsheldduringtheyearandtheattendanceofindividualDirectors.
* Tan Boon Seng was appointed on 9 August 2012 which is after the
financial year has ended.
NumberofBoardmeetingsheldinFY2012 4
PaulSelway-Swift 4
Magomet Malsagov 4
WilliamMitchell 4
Olivier Maes 4
JohnSlosar 4
PeterLaiHockMeng 4
SunnyVerghese 4
TanBoonSeng *
3.0
Co
rpo
rate
Go
vern
an
ce
Pur
eCirc
le A
nnua
l Rep
ort
20
12
30
Chairman
PaulSelway-SwiftwhoistheChairmanofPureCircleLimitedalso chairs the Nomination Committee.
TheChairmancarriesresponsibilityforensuringtheefficientoperationoftheBoardanditsCommittees,forensuringthatcorporategovernancemattersareaddressed,andforrepresentingtheGroupexternallyandcommunicatingwithshareholders when required.
Chief Executive Officer
TheCEO,MagometMalsagov,isresponsiblefortheExecutivemanagementoftheGroup.HehasresponsibilitytorecommendandtoimplementtheGroup’sstrategicobjectives.
Independent directors
TheIndependentDirectorsarePaulSelway-Swift,OlivierMaesandPeterLaiHockMeng.
Theirresponsibilitiesincludebeingavailabletoliaisewithshareholdersshouldthisbenecessary.
Board processes
TheBoardisscheduledtomeetonaquarterlybasis,andinanyeventnolessthanfourtimesayear.TheBoardwillmeetatleastonceayeartoreviewthestrategicdirectionoftheGroup.Inadditiontonormalscheduledmeetings,theBoardwill convene as required.
AllDirectorshaveaccesstoandmay,infurtheranceoftheirduties,seekindependentprofessionaladviceattheCompany’sexpense.
TheChairmanandNon-ExecutiveDirectorswillmeetannuallywithouttheExecutiveDirectorspresent.InaccordancewiththeCompany’sBye-Law,ateachAGM,uptoone-thirdoftheDirectorsarerequiredtoretirebyrotationeachyear,withpriorityforretirementbeingthoseDirectorswho have been in office longest since last appointment orre-appointment.Inaddition,anyDirectorappointedduringtheyearissubjecttoelectionattheAGMaftertheirappointment.TheNon-ExecutiveDirectorsareappointedforaninitialthree-yeartermafterwhichtheyaresubjecttoannual re-appointment.
Board performance and evaluation
TheBoardiscommittedtoevaluatingitsownperformance.ThisisanongoingprocessledbytheChairmanandtheIndependentDirectors.
Board Committees
TheBoardisassistedindischargingitsresponsibilitiesthrough three principal committees: Audit Committee;
Remuneration Committee and Nomination Committee which wereformallyestablishedinMarch2008.MembershipoftheAuditandRemunerationCommitteesconsistswhollyofNon-ExecutiveDirectors.
TheChairmanofeachCommitteeprovidesareportofthatCommitteeatthenextBoardmeeting.
AsummaryoftheCommitteesoftheBoardandtheirmembership is set out below:
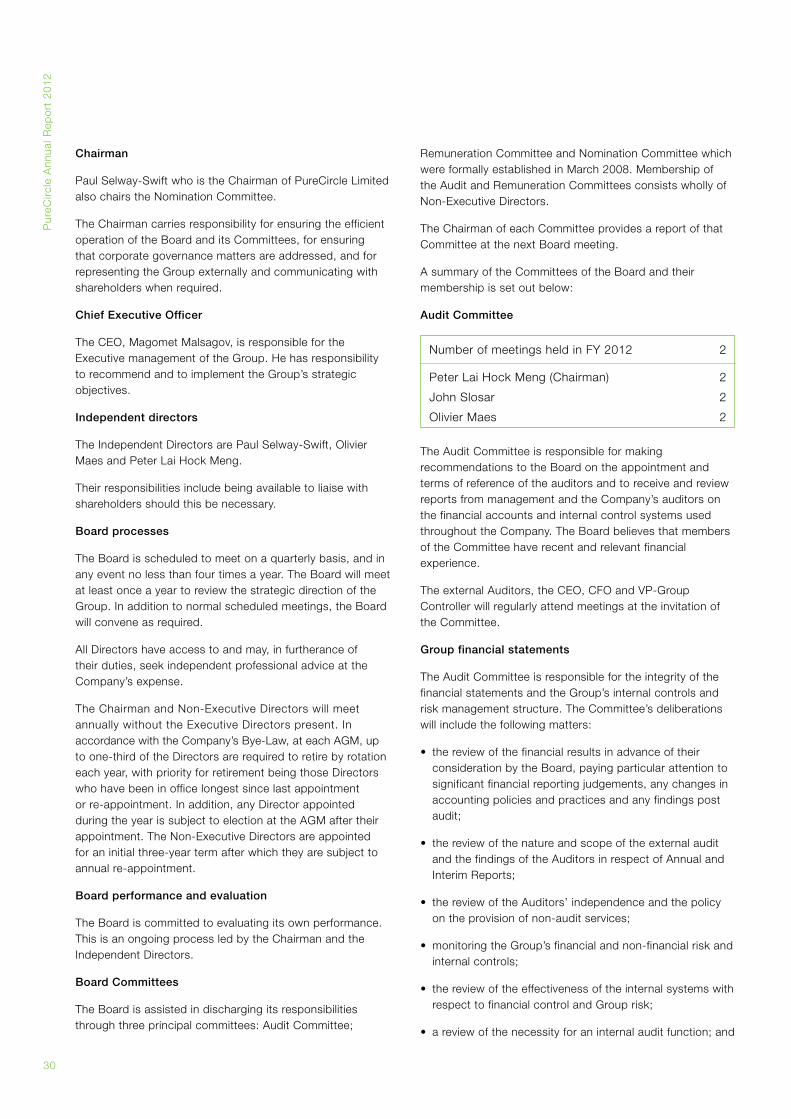
Audit Committee
TheAuditCommitteeisresponsibleformakingrecommendationstotheBoardontheappointmentandterms of reference of the auditors and to receive and review reportsfrommanagementandtheCompany’sauditorsonthefinancialaccountsandinternalcontrolsystemsusedthroughouttheCompany.TheBoardbelievesthatmembersof the Committee have recent and relevant financial experience.
TheexternalAuditors,theCEO,CFOandVP-GroupControllerwillregularlyattendmeetingsattheinvitationofthe Committee.
Group financial statements
TheAuditCommitteeisresponsiblefortheintegrityofthefinancialstatementsandtheGroup’sinternalcontrolsandriskmanagementstructure.TheCommittee’sdeliberationswill include the following matters:
• thereviewofthefinancialresultsinadvanceoftheirconsiderationbytheBoard,payingparticularattentiontosignificantfinancialreportingjudgements,anychangesinaccountingpoliciesandpracticesandanyfindingspostaudit;
• thereviewofthenatureandscopeoftheexternalauditand the findings of the Auditors in respect of Annual and Interim Reports;
• thereviewoftheAuditors’independenceandthepolicyon the provision of non-audit services;
• monitoringtheGroup’sfinancialandnon-financialriskandinternal controls;
• thereviewoftheeffectivenessoftheinternalsystemswithrespecttofinancialcontrolandGrouprisk;
• areviewofthenecessityforaninternalauditfunction;and
NumberofmeetingsheldinFY2012 2
PeterLaiHockMeng(Chairman) 2
JohnSlosar 2
Olivier Maes 2
31
3.0
Co
rpo
rate
Go
vern
an
ce
• areviewofthemeansbywhichemployeesmayraiseconcernsregardingthesystemsofinternalfinancialcontrol.
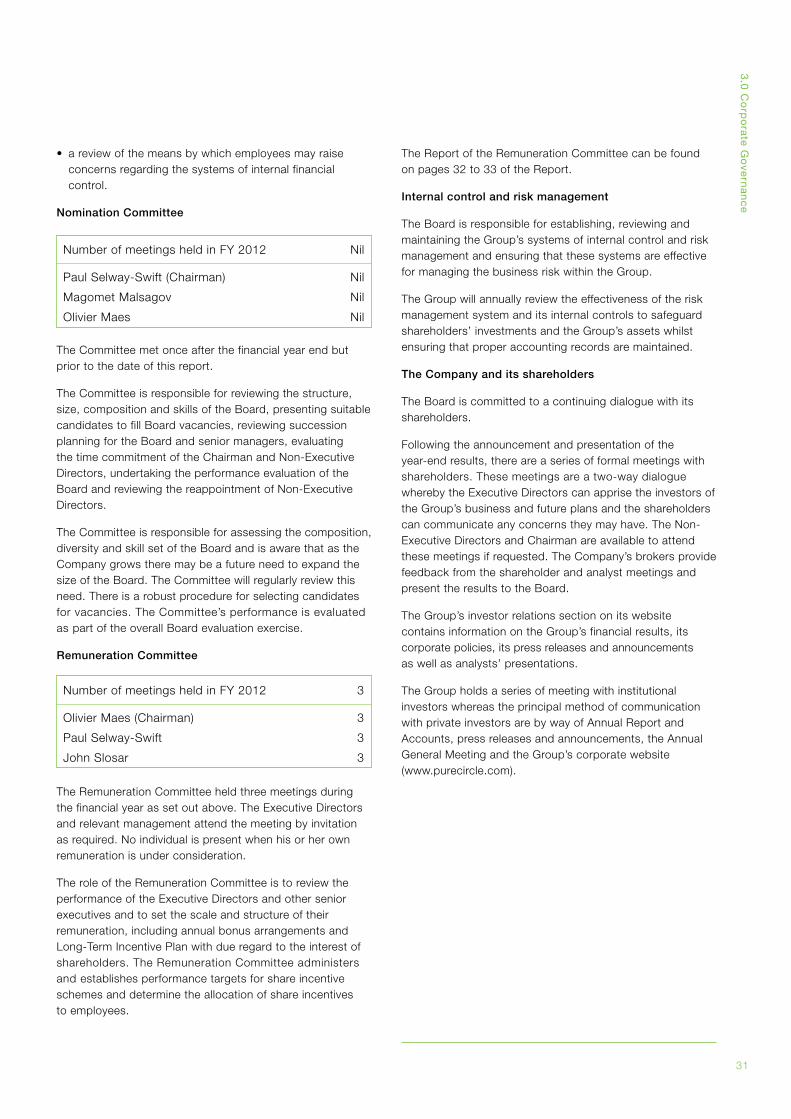
Nomination Committee
NumberofmeetingsheldinFY2012 Nil
PaulSelway-Swift(Chairman) Nil
Magomet Malsagov Nil
Olivier Maes Nil
TheCommitteemetonceafterthefinancialyearendbutprior to the date of this report.
TheCommitteeisresponsibleforreviewingthestructure,size,compositionandskillsoftheBoard,presentingsuitablecandidatestofillBoardvacancies,reviewingsuccessionplanningfortheBoardandseniormanagers,evaluatingthetimecommitmentoftheChairmanandNon-ExecutiveDirectors,undertakingtheperformanceevaluationoftheBoardandreviewingthereappointmentofNon-ExecutiveDirectors.
TheCommitteeisresponsibleforassessingthecomposition,diversityandskillsetoftheBoardandisawarethatastheCompanygrowstheremaybeafutureneedtoexpandthesizeoftheBoard.TheCommitteewillregularlyreviewthisneed.Thereisarobustprocedureforselectingcandidatesforvacancies.TheCommittee’sperformanceisevaluatedaspartoftheoverallBoardevaluationexercise.
Remuneration Committee
TheRemunerationCommitteeheldthreemeetingsduringthefinancialyearassetoutabove.TheExecutiveDirectorsandrelevantmanagementattendthemeetingbyinvitationas required. No individual is present when his or her own remuneration is under consideration.
TheroleoftheRemunerationCommitteeistoreviewtheperformanceoftheExecutiveDirectorsandotherseniorexecutives and to set the scale and structure of their remuneration,includingannualbonusarrangementsandLong-TermIncentivePlanwithdueregardtotheinterestofshareholders.TheRemunerationCommitteeadministersand establishes performance targets for share incentive schemes and determine the allocation of share incentives toemployees.
NumberofmeetingsheldinFY2012 3
OlivierMaes(Chairman) 3
PaulSelway-Swift 3
JohnSlosar 3
TheReportoftheRemunerationCommitteecanbefound on pages 32 to 33 of the Report.
Internal control and risk management
TheBoardisresponsibleforestablishing,reviewingandmaintainingtheGroup’ssystemsofinternalcontrolandriskmanagementandensuringthatthesesystemsareeffectiveformanagingthebusinessriskwithintheGroup.
TheGroupwillannuallyreviewtheeffectivenessoftheriskmanagementsystemanditsinternalcontrolstosafeguardshareholders’investmentsandtheGroup’sassetswhilstensuring that proper accounting records are maintained.
The Company and its shareholders
TheBoardiscommittedtoacontinuingdialoguewithitsshareholders.
Following the announcement and presentation of the year-endresults,thereareaseriesofformalmeetingswithshareholders.Thesemeetingsareatwo-waydialoguewherebytheExecutiveDirectorscanapprisetheinvestorsoftheGroup’sbusinessandfutureplansandtheshareholderscancommunicateanyconcernstheymayhave.TheNon-ExecutiveDirectorsandChairmanareavailabletoattendthesemeetingsifrequested.TheCompany’sbrokersprovidefeedbackfromtheshareholderandanalystmeetingsandpresenttheresultstotheBoard.
TheGroup’sinvestorrelationssectiononitswebsitecontainsinformationontheGroup’sfinancialresults,itscorporatepolicies,itspressreleasesandannouncements aswellasanalysts’presentations.
TheGroupholdsaseriesofmeetingwithinstitutionalinvestors whereas the principal method of communication withprivateinvestorsarebywayofAnnualReportandAccounts,pressreleasesandannouncements,theAnnualGeneralMeetingandtheGroup’scorporatewebsite (www.purecircle.com).
Pur
eCirc
le A
nnua
l Rep
ort
20
12
32
3.2 Report of the Remuneration CommitteeTheCompany’sRemunerationCommitteeischairedbyOlivierMaeswithPaulSelway-SwiftandJohnSlosarasmembers.TheRemunerationCommitteemeetsatleastonceayearandistaskedtoadviseonremunerationpolicyfortheExecutiveDirectorsandseniormanagement.ItalsoreviewsandapprovesLong-TermIncentivePlanforeligibleemployees.
Remuneration policy
TheRemunerationCommitteesetstheoverallremunerationpolicydesignedinlinewiththeCompany’slong-termbusinessgoals.IndividualremunerationpackagesaredeterminedbytheRemunerationCommitteewithintheframeworkofthefollowingpolicy.
TheExecutiveDirectors’remunerationpackagescomprisethefollowingcomponents:
a.Annualsalary–theactualsalaryforeachoftheExecutiveDirectorthatreflectstheexperienceandperformanceofeachindividualandtakingintoaccountofmarketcompetitiveness;
b.Annualincentivepayment–theExecutiveDirectorsareentitledtoannualbonusesrelatestoperformanceoftheCompanyandotherinternaltargets;and
c.ShareoptionsundertheLong-TermIncentivePlan(“LTIP”)thatisapprovedbytheRemunerationCommittee.
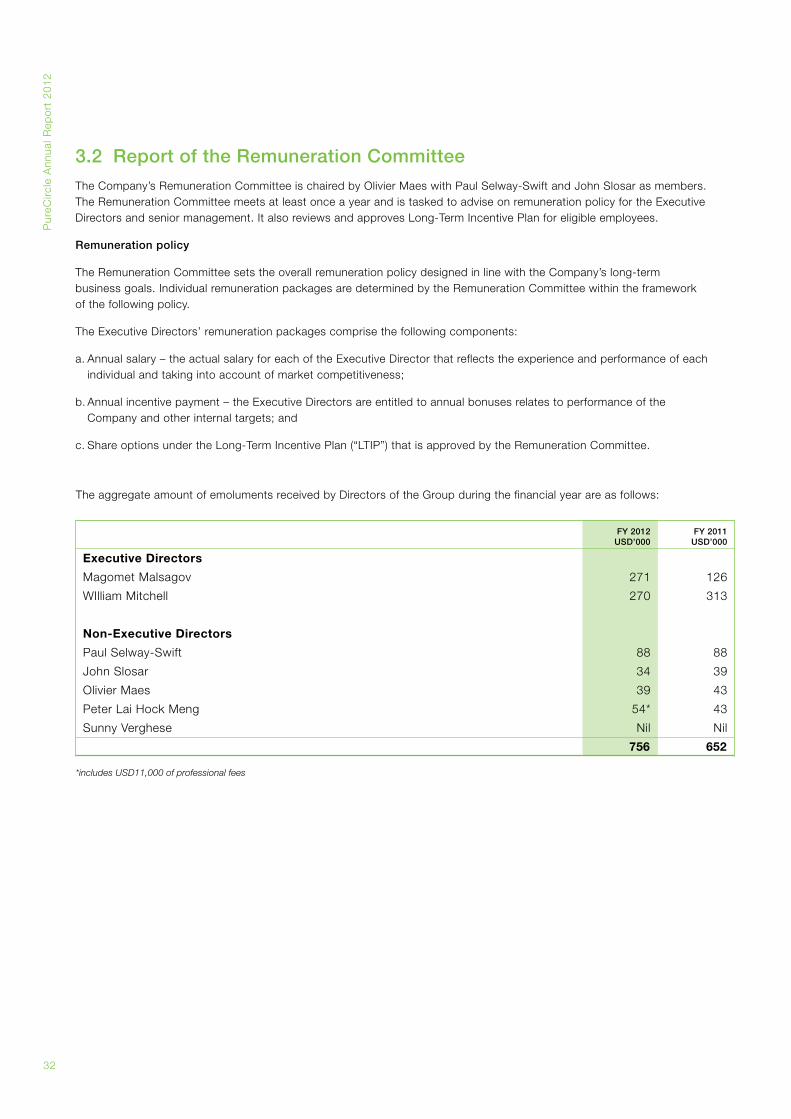
TheaggregateamountofemolumentsreceivedbyDirectorsoftheGroupduringthefinancialyearareasfollows:
*includes USD11,000 of professional fees
FY 2012USD’000
FY 2011USD’000
Executive Directors
Magomet Malsagov 271 126
WIlliamMitchell 270 313
Non-Executive Directors
PaulSelway-Swift 88 88
JohnSlosar 34 39
Olivier Maes 39 43
PeterLaiHockMeng 54* 43
SunnyVerghese Nil Nil
756 652
33
3.0
Co
rpo
rate
Go
vern
an
ce
1 July 2011 Granted Exercised 30 June 2012
Exercise price
Date from which exerciseable Expiry date
Magomet Malsagov 30,000 - - 30,000 158p 16Apr2010 16Apr2015
42,436 - (42,436) - Nil N / A N / A
212,872 - - 212,872 Nil 30 Nov 2013 30 Jun 2015
- 213,128 - 213,128 Nil 20Sept2014 30 Jun 2015
285,308 213,128 (42,436) 456,000
William Mitchell 215,000 - - 215,000 Nil 30 Nov 2013 30 Jun 2015
20,227 6,678 (26,905) - Nil N / A N / A
- 66,000 - 66,000 Nil 20Sept2014 30 Jun 2015
235,227 72,678 (26,905) 281,000
Non-Executive Directors
JohnSlosar 12,500 21,700 (23,350) 10,850 Nil 10July2012 10July2012
Olivier Maes 14,000 24,400 (26,200) 12,200 Nil 10July2012 10July2012
PeterLaiHockMeng 21,500 27,100 (35,050) 13,550 Nil 10July2012 10July2012
48,000 73,200 (84,600) 36,600
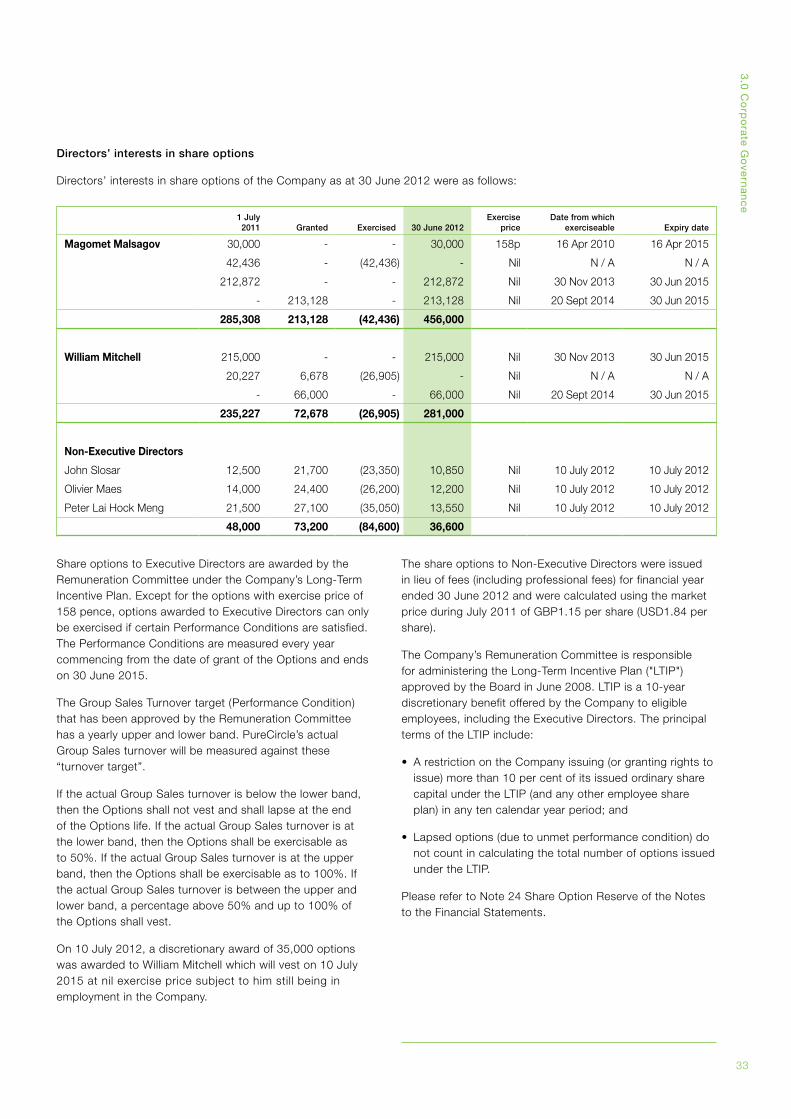
Directors’ interests in share options
Directors’interestsinshareoptionsoftheCompanyasat30June2012wereasfollows:
ShareoptionstoExecutiveDirectorsareawardedbytheRemunerationCommitteeundertheCompany’sLong-TermIncentivePlan.Exceptfortheoptionswithexercisepriceof158pence,optionsawardedtoExecutiveDirectorscanonlybe exercised if certain Performance Conditions are satisfied. ThePerformanceConditionsaremeasuredeveryyearcommencing from the date of grant of the Options and ends on 30 June 2015.
TheGroupSalesTurnovertarget(PerformanceCondition)thathasbeenapprovedbytheRemunerationCommitteehasayearlyupperandlowerband.PureCircle’sactual GroupSalesturnoverwillbemeasuredagainstthese“turnovertarget”.
IftheactualGroupSalesturnoverisbelowthelowerband,then the Options shall not vest and shall lapse at the end oftheOptionslife.IftheactualGroupSalesturnoverisatthelowerband,thentheOptionsshallbeexercisableasto50%.IftheactualGroupSalesturnoverisattheupperband,thentheOptionsshallbeexercisableasto100%.IftheactualGroupSalesturnoverisbetweentheupperandlowerband,apercentageabove50%andupto100%of the Options shall vest.
On10July2012,adiscretionaryawardof35,000optionswasawardedtoWilliamMitchellwhichwillveston10July2015 at nil exercise price subject to him still being in employmentintheCompany.
TheshareoptionstoNon-ExecutiveDirectorswereissuedinlieuoffees(includingprofessionalfees)forfinancialyearended30June2012andwerecalculatedusingthemarketpriceduringJuly2011ofGBP1.15pershare(USD1.84pershare).
TheCompany’sRemunerationCommitteeisresponsibleforadministeringtheLong-TermIncentivePlan("LTIP")approvedbytheBoardinJune2008.LTIPisa10-yeardiscretionarybenefitofferedbytheCompanytoeligibleemployees,includingtheExecutiveDirectors.TheprincipaltermsoftheLTIPinclude:
• ArestrictionontheCompanyissuing(orgrantingrightstoissue)morethan10percentofitsissuedordinarysharecapitalundertheLTIP(andanyotheremployeeshareplan)inanytencalendaryearperiod;and
• Lapsedoptions(duetounmetperformancecondition)donot count in calculating the total number of options issued undertheLTIP.
PleaserefertoNote24ShareOptionReserveoftheNotestotheFinancialStatements.
Pur
eCirc
le A
nnua
l Rep
ort
20
12
34
3.3 Director’s ReportTheDirectorsherebysubmittheirreportandtheauditedfinancialstatementsoftheGroupandthestatementoffinancialpositionandsummaryofsignificantaccountingpoliciesandotherexplanatorynotesoftheCompanyfor thefinancialyearended30June2012.
Principal activities
TheCompanyisengagedprincipallyinthebusinessofinvestment holding whilst the principal activities of the rest oftheGrouparetheproduction,marketinganddistributionofnaturalsweetenersandflavours.Therehavebeennosignificant changes in the nature of these activities during thefinancialyear.
Business review and future developments
ThefinancialresultsoftheGroupandthefinancialpositionoftheGroupandoftheCompanyforthefinancialyearareshown in the annexed financial statements.
Results and dividends
PureCircleGroup’sturnoverforthefinancialyearended30June2012wasUSD45million.ThePureCircleGroup’slossattributabletotheownersoftheCompanywasUSD23million,equivalenttoalosspershareofUSD15.06cents.
TheGroupendedtheyearwithnetassetsofUSD119million,grossassetsofUSD233millionandgrosscashbalancesofUSD24million.
TheDirectorsdonotrecommendpaymentofadividendinrespectoftheyearended30June2012.
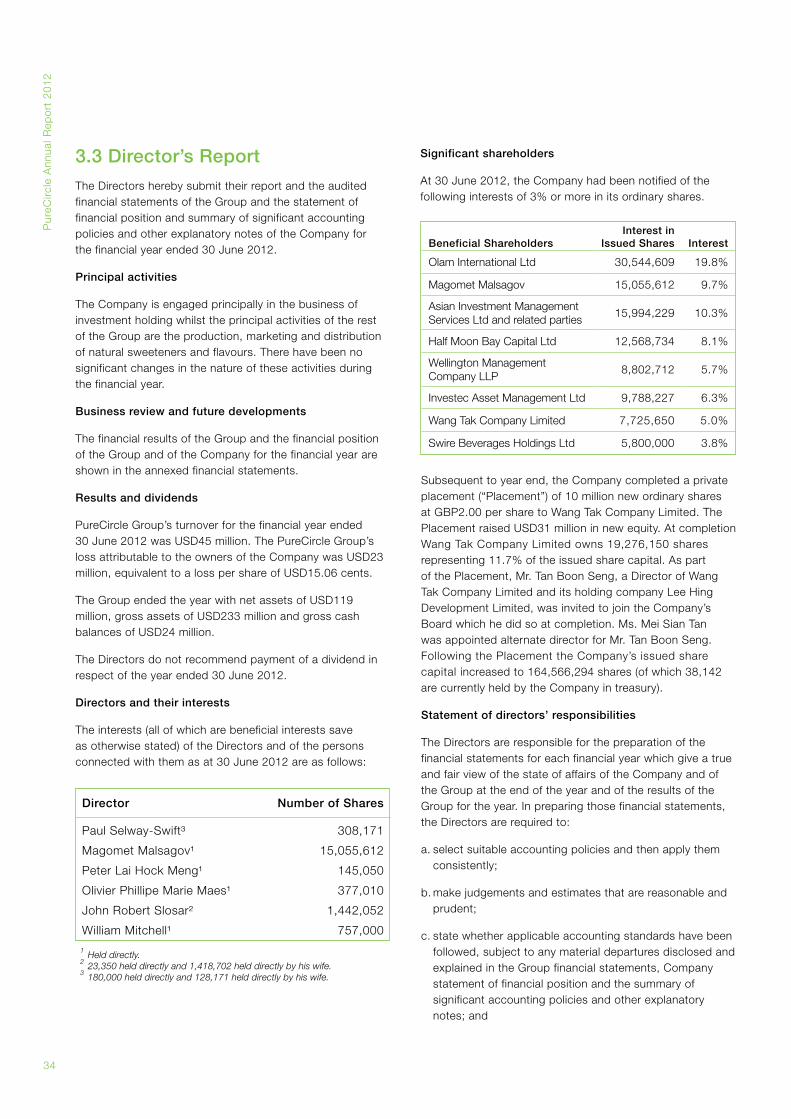
Directors and their interests
Theinterests(allofwhicharebeneficialinterestssaveasotherwisestated)oftheDirectorsandofthepersonsconnected with them as at 30 June 2012 are as follows:
Significant shareholders
At30June2012,theCompanyhadbeennotifiedofthefollowinginterestsof3%ormoreinitsordinaryshares.
Director Number of Shares
PaulSelway-Swift³ 308,171
MagometMalsagov¹ 15,055,612
PeterLaiHockMeng¹ 145,050
OlivierPhillipeMarieMaes¹ 377,010
JohnRobertSlosar² 1,442,052
WilliamMitchell¹ 757,000
1 Held directly. 2 23,350 held directly and 1,418,702 held directly by his wife. 3 180,000 held directly and 128,171 held directly by his wife.
Beneficial ShareholdersInterest in
Issued Shares Interest
Olam International Ltd 30,544,609 19.8%
Magomet Malsagov 15,055,612 9.7%
Asian Investment Management ServicesLtdandrelatedparties
15,994,229 10.3%
HalfMoonBayCapitalLtd 12,568,734 8.1%
WellingtonManagementCompanyLLP
8,802,712 5.7%
Investec Asset Management Ltd 9,788,227 6.3%
WangTakCompanyLimited 7,725,650 5.0%
SwireBeveragesHoldingsLtd 5,800,000 3.8%
Subsequenttoyearend,theCompanycompletedaprivateplacement(“Placement”)of10millionnewordinarysharesatGBP2.00persharetoWangTakCompanyLimited.ThePlacementraisedUSD31millioninnewequity.AtcompletionWangTakCompanyLimitedowns19,276,150sharesrepresenting11.7%oftheissuedsharecapital.AspartofthePlacement,Mr.TanBoonSeng,aDirectorofWangTakCompanyLimitedanditsholdingcompanyLeeHingDevelopmentLimited,wasinvitedtojointheCompany’sBoardwhichhedidsoatcompletion.Ms.MeiSianTanwasappointedalternatedirectorforMr.TanBoonSeng.FollowingthePlacementtheCompany’sissuedsharecapitalincreasedto164,566,294shares(ofwhich38,142arecurrentlyheldbytheCompanyintreasury).
Statement of directors’ responsibilities
TheDirectorsareresponsibleforthepreparationofthefinancialstatementsforeachfinancialyearwhichgiveatrueandfairviewofthestateofaffairsoftheCompanyandoftheGroupattheendoftheyearandoftheresultsoftheGroupfortheyear.Inpreparingthosefinancialstatements,theDirectorsarerequiredto:
a.selectsuitableaccountingpoliciesandthenapplythemconsistently;
b.makejudgementsandestimatesthatarereasonableandprudent;
c. state whether applicable accounting standards have been followed,subjecttoanymaterialdeparturesdisclosedandexplainedintheGroupfinancialstatements,Companystatementoffinancialpositionandthesummaryofsignificantaccountingpoliciesandotherexplanatorynotes; and
35
d.preparetheGroupfinancialstatements,Companystatementoffinancialpositionandthesummaryofsignificantaccountingpoliciesandotherexplanatorynotes on the going concern basis unless it is inappropriatetoassumethattheGroupwill continue in business.
TheDirectorsareresponsibleforkeepingproperaccountingrecordswhichdisclosewithreasonableaccuracyatanytimethefinancialpositionoftheGroupandCompanyandto enable them to ensure that the financial statements complywithInternationalFinancialReportingStandards.TheDirectorsarealsoresponsibleforsafeguardingtheassetsoftheGroupandCompanyandhencefortakingreasonablesteps for the prevention and detection of fraud or other irregularities.
TheDirectorsareresponsibleforinformationcontainedinthe directors’ report and other information contained in the accounts.
Payment of creditors
ItisthepolicyoftheGroupinrespectofallitscreditors,whereitisreasonablypracticable,tosettlethepaymentwiththosecreditorsaccordingtothetermsformallyagreedwiththem.
Thecreditors’paymentperiodsfortheGroupthroughout thefinancialyearunderreviewrangefrom0to90days (2011:0to90days).
Auditors
Theauditors,Messrs.PricewaterhouseCoopers,haveexpressed their willingness to continue in office.
3.0
Co
rpo
rate
Go
vern
an
ce
Magomet Malsagov Chief Executive Officer
William Mitchell Chief Financial Officer
SIGNEDINACCORDANCEWITHARESOLUTIONOFTHEDIRECTORSDATED10SEPTEMBER2012

Magomet has held the position of ChiefExecutivesincefoundingthebusiness in 2001.
Heisprimarilyresponsibleforleadingthe successful establishment of the Group’sentiresupplychainfromtheplantations and extraction facilities totherefineryplantsaroundtheworld.AsCEO,hefurtherestablishestheGroup’sbusinessdirectionandstrategies along with his management team and is responsible for managing the growth and development of the Group’sbusiness.
WilliamjoinedPureCircleinJune2008 as Chief Financial Officer.
He is a FCA who trained with PriceWaterhouseLondonandhasextensive experience in the global food andbeverageandtechnologyindustries.AtPriceWaterhouse,headvisedmajor international food and beverage businessesandprivateequityfirmson mergers and acquisitions and post acquisitionintegrations.Williamwasthenpartofthemanagementbuyin-buyoutteamthatacquiredTetleyTea,thenumber 2globalteabrand,fromAlliedDomecq.
AsChiefFinancialOfficer,hesupportstheChiefExecutiveondeterminingstrategyandhasresponsibilitiesforthedevelopmentoftheGroup’sjointventures.
Magomet MalsagovChiefExecutiveOfficer
WilliamMitchellChief Financial Officer
(StandingL–R)TanMeiSian,PeterLaiHockMeng,OlivierMaes,JohnSlosar,TanBoonSeng,SunnyVerghese(SeatedL–R) William Mitchell, Paul Selway-Swift, Magomet Malsagov
3.4 Board of Directors
PaulworkedwiththeHSBCGroupfor30years.HewasadirectorofTheHongkong&ShanghaiBankingCorporation from 1990 to 1998 and of HSBCInvestmentBankplcfrom1996to1998.HeiscurrentlytheChairmanandaDirectorofAtlantisInvestmentManagement(Ireland)LtdandLi&Fung Ltd.
He was appointed Chairman of the CompanyinDecember2007andalsochairs the Nomination Committee.
PaulSelway-SwiftNon-ExecutiveChairman

37
PeterLaiHockMenghasmorethan28yearsexperienceinfinancialservicesindustryincludingcentralbanking,investmentbanking,privatebanking,stockbroking,venturecapital,assetmanagement,treasurymanagementandprivateequityinvestments.Hecurrentlymanages his own boutique corporate advisoryfirmbasedinSingaporeandsitson the board of several other companies listedontheSingaporeExchangeandtheHongKongStockExchangeasIndependentDirector.
PetergraduatedwithaBAinEconomicsfromtheUniversityofCambridge,England.HeisalsoaCFAcharterholderfromtheCFAInstitute,USA,andaFellow oftheCharteredInstituteofMarketing,UK.HejoinedPureCircleinJune2008 and is the Chairman of the Audit Committee.
Olivier joined PureCircle in November 2006asaNon-ExecutiveDirector.
HereadbusinessatEcoledesHautesEtudesCommerciales(MBAHEC)ParisandispresentlytheChiefExecutiveOfficerofGroupeAoste,theleaderofprocessedmeatindustryinFrance and member of the executive teamofCampofrioGroup,Europeanleaderofprocessedmeatmarket. Olivierhasmorethan20yearsofexperienceinFMCGsmarkets.HeformerlyheldCEOpositionsofvariouscompaniesinEuropeandAsiaforDanoneGroupandKraftGroup.
Olivier chairs the Remuneration Committee.
John joined PureCircle in November 2006asaNon-ExecutiveDirector.
HeisalsocurrentlyontheBoardsofCathayPacificAirwaysLtd,JohnSwire&Sons(H.K.)Ltd,SwirePacificLtdandSwireBeverages.HejoinedtheSwireGroupin1980andhasworkedwiththeGroup’sAviationDivisioninHongKong,theUnitedStatesandThailand.
HewasappointedManagingDirectorofHongKongAircraftEngineeringCoLtdin1996.InJuly1998,hewasappointedManagingDirectorofSwirePacific’sBeveragesDivision.HewasappointedChairmanofSwireBeverageson1July2010andChairmanofHongKongDragonAirlineson31March2011in addition to his current role as Chief ExecutiveofCathayPacific.
John was a graduate of both Columbia UniversityandCambridgeUniversity.
PeterLaiHockMengNon-ExecutiveDirector
Olivier MaesNon-ExecutiveDirector
JohnSlosarNon-ExecutiveDirector
SunnyistheGroupManagingDirectorandChiefExecutiveOfficerofOlam,a leading Asia based international agribusinesslistedontheSingaporeStockExchange(“SGX”).Heisresponsibleforthestrategicplanning,business development and overall management for the Olam group of companies worldwide. He is also the ChairmanofInternationalEnterpriseSingapore,astatutoryboardundertheMinistryofTradeandIndustry,aswell as Chairman of the Human Capital Leadership Institute and serves on theBoardofTrusteesoftheNationalUniversityofSingapore.
HewasappointedasaNon-ExecutiveDirectorofPureCircleinOctober2008.
TanBoonSengwasappointedtotheBoardinAugust2012.HeistheChairmanandManagingDirectorofLeeHingDevelopmentLimited,acompanylistedontheHongKongStockExchangeandtheholdingcompanyofWangTakCompanyLimited,ofwhichBoonSengis alsoaDirector.
HeisalsoanExecutiveDirectorofIGBCorporationBerhad,acompanylistedontheBursaMalaysia(theMalaysianStockExchange),andaDirectorofWoKeeHong(Holdings)LimitedandGentingHongKongLimited,eachlistedontheHongKongStockExchange.
TanMeiSianisthealternatedirectortoTanBoonSeng.
MeiSianisaManagerofGoldisBerhad,acompanylistedontheBursaMalaysia(theMalaysianStockExchange),andis responsible for managing corporate andprivateequityinvestments.ShewaspreviouslyanEngagementManageratOliverWymanwhereshespecialisedinfinancialservicesandriskmanagementconsultingandworkedwithmajorfinancialinstitutionsintheUnitedStates,UnitedKingdom,Netherlands,China,Taiwan,HongKong,Singapore,Malaysiaand Australia.
Inaddition,MeiSianistheChairmanofMasterGamesInternational,aprivatelyheldcomputergamescompany,andisadirectorofLautanBumimasSdnBhd,asubsidiaryofGoldisBerhad.
SunnyVergheseNon-ExecutiveDirector
TanBoonSengNon-ExecutiveDirector
TanMeiSianNon-ExecutiveDirector
Pur
eCirc
le A
nnua
l Rep
ort
20
12
38
4.0 Independent Auditors’ Report
Independent Auditors’ Report to The Shareholders of PureCircle Limited (Incorporated in Bermuda) Registration No: 40431
Wehaveaudited:
• theconsolidatedfinancialstatementsofPureCircleLimited(“theCompany”)whichcomprisetheconsolidatedstatementsoffinancialpositionasof30June2012,andtheconsolidatedstatementofcomprehensiveincome,theconsolidatedstatementofchangesinequityandtheconsolidatedstatementofcashflowsfortheyearthenended,andasummaryofsignificantaccountingpoliciesandotherexplanatorynotes,and
• thestatementoffinancialpositionoftheCompanyasof30June2012andasummaryofsignificantaccountingpoliciesandotherexplanatorynotes
setoutonpages40to91(collectivelyreferredtoasthe“FinancialInformation”).
Directors’ responsibility for the Financial Information
TheDirectorsoftheCompanyareresponsibleforthepreparation of the Financial Information that give a true and fair view in accordance with International Financial ReportingStandardsandforsuchinternalcontrolastheDirectorsdetermineasnecessarytoenablethepreparationof Financial Information that are free from material misstatement,whetherduetofraudorerror.
Auditor’s responsibility
OurresponsibilityistoexpressanopinionontheFinancialInformationbasedonouraudit.WeconductedourauditinaccordancewithInternationalStandardsonAuditing.Thosestandardsrequirethatwecomplywithethicalrequirementsand plan and perform the audit to obtain reasonable assurance whether the Financial Information are free from material misstatement.
An audit involves performing procedures to obtain audit evidence about the amounts and disclosures in the Financial Information.Theproceduresselecteddependonourjudgment,includingtheassessmentoftherisksofmaterialmisstatementoftheFinancialInformation,whetherduetofraudorerror.Inmakingthoseriskassessments,weconsiderinternalcontrolrelevanttotheentity’spreparationof the Financial Information that give a true and fair view in order to design audit procedures that are appropriate in the circumstances,butnotforthepurposeofexpressinganopinionontheeffectivenessoftheentity’sintervalcontrol.
An audit also includes evaluating the appropriateness of accounting policies used and the reasonableness of accountingestimatesmadebytheDirectors,aswellas evaluating the overall presentation of the Financial Information.
Webelievethattheauditevidencewehaveobtainedissufficient and appropriate to provide a basis for our audit opinion.
Opinion
Inouropinion,theFinancialInformationhavebeenproperlydrawnupinaccordancewithInternationalFinancialReportingStandardssoastogiveatrueandfairviewofthefinancialpositionoftheGroupandoftheCompanyasof30June2012,andoftheGroup’sfinancialperfomanceandcashflowsfortheyearthenended.
Other matters
Thisreport,includingtheopinion,hasbeenpreparedforandonlyforyou,asabodyandfornootherpurpose.Wedonotassumeresponsibilitytowardsoracceptliabilitytoanyotherperson for the contents of this report.
PricewaterhouseCoopers (No.AF:1146) Chartered Accountants
Kuala Lumpur 10September2012

3913
Financial Statements
Pur
eCirc
le A
nnua
l Rep
ort
20
12
40
The Group The Company
Note30.06.2012
USD’00030.06.2011
USD’00030.06.2012
USD’00030.06.2011
USD’000
ASSETS
Non-Current Assets
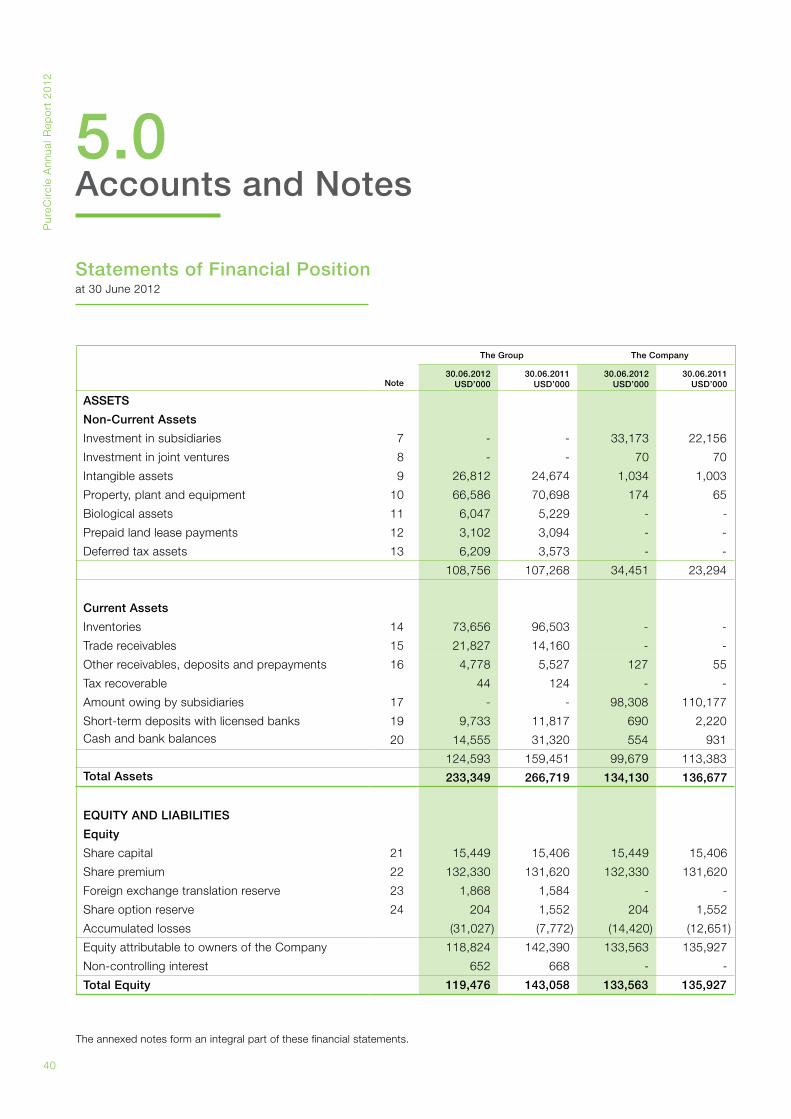
Investment in subsidiaries 7 - - 33,173 22,156
Investment in joint ventures 8 - - 70 70
Intangible assets 9 26,812 24,674 1,034 1,003
Property, plant and equipment 10 66,586 70,698 174 65
Biological assets 11 6,047 5,229 - -
Prepaid land lease payments 12 3,102 3,094 - -
Deferred tax assets 13 6,209 3,573 - -
108,756 107,268 34,451 23,294
Current Assets
Inventories 14 73,656 96,503 - -
Trade receivables 15 21,827 14,160 - -
Other receivables, deposits and prepayments 16 4,778 5,527 127 55
Tax recoverable 44 124 - -
Amount owing by subsidiaries 17 - - 98,308 110,177
Short-term deposits with licensed banks 19 9,733 11,817 690 2,220Cash and bank balances 20 14,555 31,320 554 931
124,593 159,451 99,679 113,383Total Assets 233,349 266,719 134,130 136,677
EQUITY AND LIABILITIES
Equity
Share capital 21 15,449 15,406 15,449 15,406
Share premium 22 132,330 131,620 132,330 131,620
Foreign exchange translation reserve 23 1,868 1,584 - -
Share option reserve 24 204 1,552 204 1,552
Accumulated losses (31,027) (7,772) (14,420) (12,651)
Equity attributable to owners of the Company 118,824 142,390 133,563 135,927
Non-controlling interest 652 668 - -
Total Equity 119,476 143,058 133,563 135,927
5.0Accounts and Notes
Statements of Financial Position at 30 June 2012
The annexed notes form an integral part of these financial statements.
41
5.0
Acco
unts and no
tes
Magomet MalsagovChief Executive Officer
William MitchellChief Financial Officer
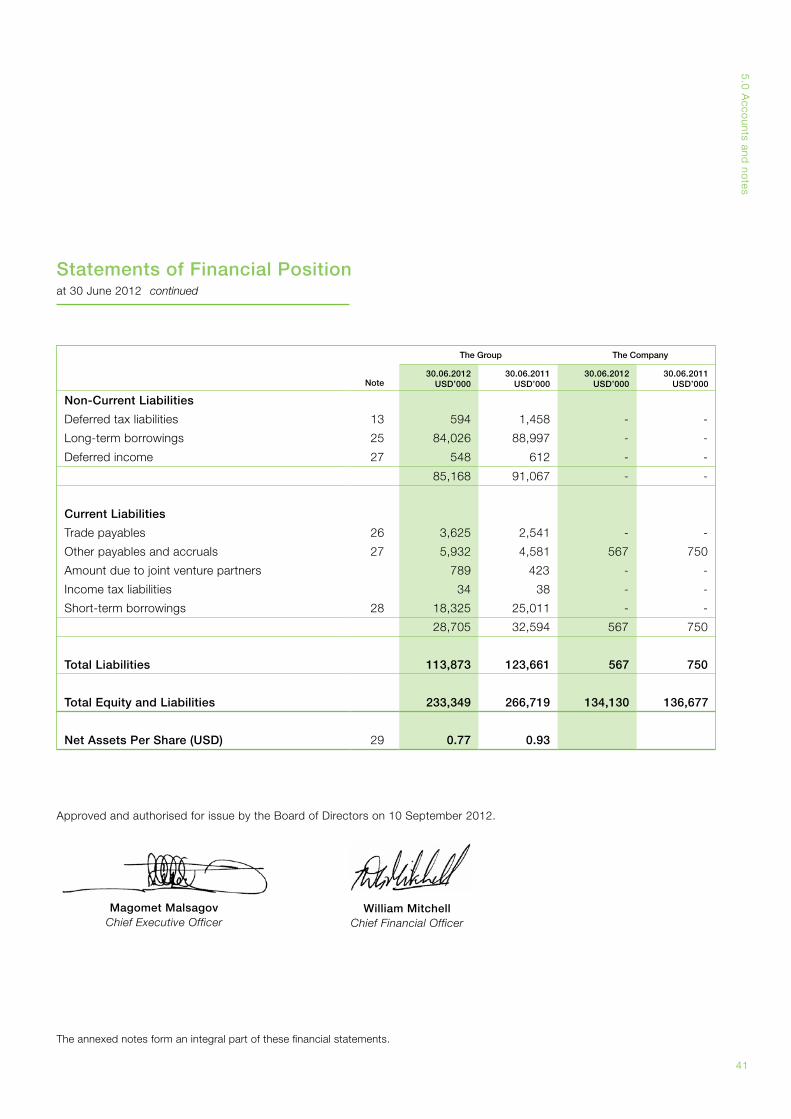
Approved and authorised for issue by the Board of Directors on 10 September 2012.
The Group The Company
Note30.06.2012
USD’00030.06.2011
USD’00030.06.2012
USD’00030.06.2011
USD’000
Non-Current Liabilities
Deferred tax liabilities 13 594 1,458 - -
Long-term borrowings 25 84,026 88,997 - -
Deferred income 27 548 612 - -
85,168 91,067 - -
Current Liabilities
Trade payables 26 3,625 2,541 - -
Other payables and accruals 27 5,932 4,581 567 750
Amount due to joint venture partners 789 423 - -
Income tax liabilities 34 38 - -
Short-term borrowings 28 18,325 25,011 - -
28,705 32,594 567 750
Total Liabilities 113,873 123,661 567 750
Total Equity and Liabilities 233,349 266,719 134,130 136,677
Net Assets Per Share (USD) 29 0.77 0.93
Statements of Financial Position at 30 June 2012 continued
The annexed notes form an integral part of these financial statements.
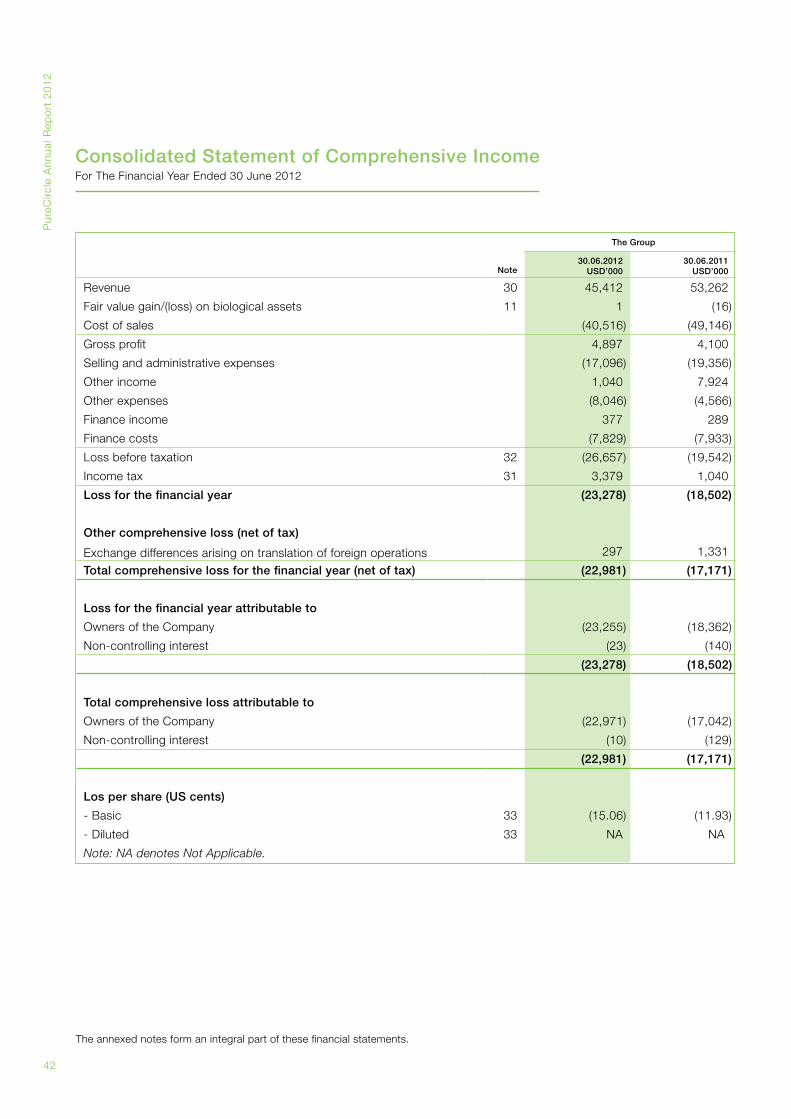
Pur
eCirc
le A
nnua
l Rep
ort
20
12
42
The annexed notes form an integral part of these financial statements.
The Group
Note30.06.2012
USD’00030.06.2011
USD’000
Revenue 30 45,412 53,262
Fair value gain/(loss) on biological assets 11 1 (16)
Cost of sales (40,516) (49,146)
Gross profit 4,897 4,100
Selling and administrative expenses (17,096) (19,356)
Other income 1,040 7,924
Other expenses (8,046) (4,566)
Finance income 377 289
Finance costs (7,829) (7,933)
Loss before taxation 32 (26,657) (19,542)
Income tax 31 3,379 1,040
Loss for the financial year (23,278) (18,502)
Other comprehensive loss (net of tax)
Exchange differences arising on translation of foreign operations 297 1,331
Total comprehensive loss for the financial year (net of tax) (22,981) (17,171)
Loss for the financial year attributable to
Owners of the Company (23,255) (18,362)
Non-controlling interest (23) (140)
(23,278) (18,502)
Total comprehensive loss attributable to
Owners of the Company (22,971) (17,042)
Non-controlling interest (10) (129)
(22,981) (17,171)
Los per share (US cents)
- Basic 33 (15.06) (11.93)
- Diluted 33 NA NA
Note: NA denotes Not Applicable.
Consolidated Statement of Comprehensive Income For The Financial Year Ended 30 June 2012
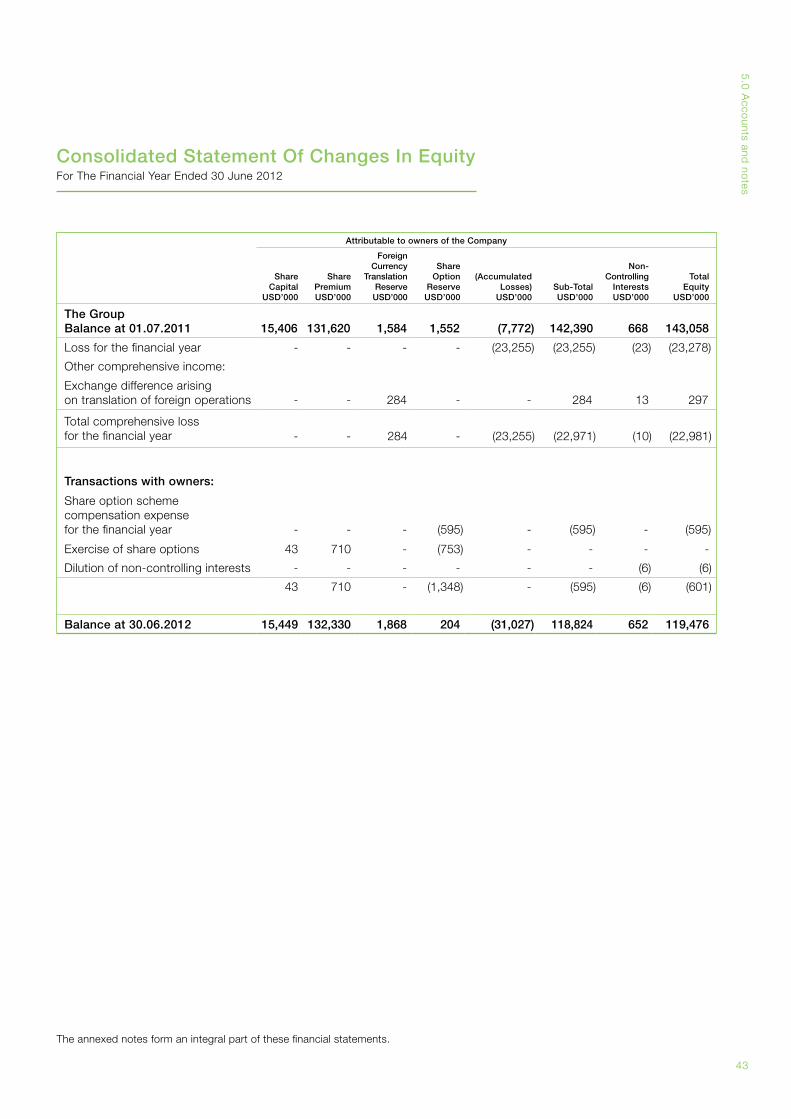
43
5.0
Acco
unts and no
tes
The annexed notes form an integral part of these financial statements.
Attributable to owners of the Company
ShareCapital
USD’000
SharePremiumUSD’000
Foreign Currency
Translation ReserveUSD’000
ShareOption
ReserveUSD’000
(Accumulated Losses)
USD’000Sub-TotalUSD’000
Non-Controlling
InterestsUSD’000
TotalEquity
USD’000
The GroupBalance at 01.07.2011 15,406 131,620 1,584 1,552 (7,772)
142,390 668 143,058
Loss for the financial year - - - - (23,255) (23,255) (23) (23,278)
Other comprehensive income:
Exchange difference arising on translation of foreign operations - - 284 - - 284 13 297
Total comprehensive lossfor the financial year - - 284 - (23,255) (22,971) (10) (22,981)
Transactions with owners:
Share option scheme compensation expense for the financial year - - - (595) - (595) - (595)
Exercise of share options 43 710 - (753) - - - -
Dilution of non-controlling interests - - - - - - (6) (6)
43 710 - (1,348) - (595) (6) (601)
Balance at 30.06.2012 15,449 132,330 1,868 204 (31,027) 118,824 652 119,476
Consolidated Statement Of Changes In EquityFor The Financial Year Ended 30 June 2012
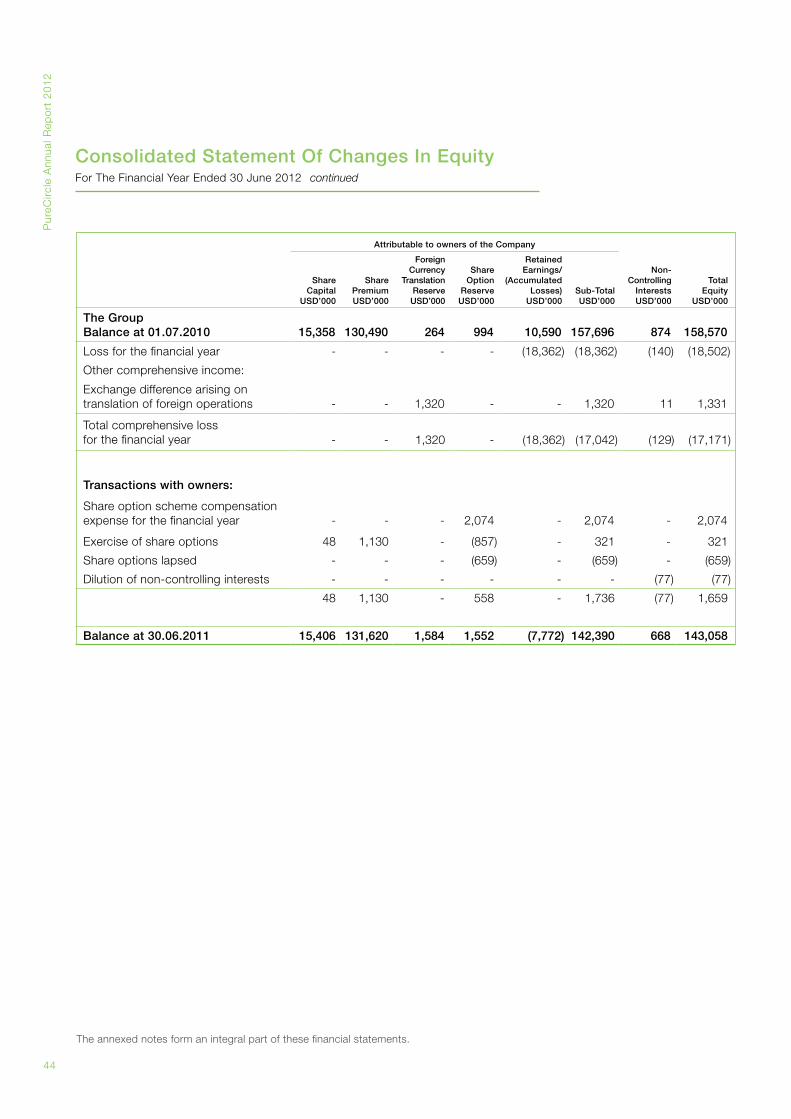
Pur
eCirc
le A
nnua
l Rep
ort
20
12
44
The annexed notes form an integral part of these financial statements.
Attributable to owners of the Company
ShareCapital
USD’000
SharePremiumUSD’000
Foreign Currency
Translation ReserveUSD’000
ShareOption
ReserveUSD’000
Retained Earnings/
(Accumulated Losses)
USD’000Sub-TotalUSD’000
Non-Controlling
InterestsUSD’000
TotalEquity
USD’000
The GroupBalance at 01.07.2010 15,358 130,490 264 994 10,590
157,696 874 158,570
Loss for the financial year - - - - (18,362) (18,362) (140) (18,502)
Other comprehensive income:
Exchange difference arising on translation of foreign operations - - 1,320 - - 1,320 11 1,331
Total comprehensive loss for the financial year - - 1,320 - (18,362) (17,042) (129) (17,171)
Transactions with owners:
Share option scheme compensation expense for the financial year - - - 2,074 - 2,074 - 2,074
Exercise of share options 48 1,130 - (857) - 321 - 321
Share options lapsed - - - (659) - (659) - (659)
Dilution of non-controlling interests - - - - - - (77) (77)
48 1,130 - 558 - 1,736 (77) 1,659
Balance at 30.06.2011 15,406 131,620 1,584 1,552 (7,772) 142,390 668 143,058
Consolidated Statement Of Changes In EquityFor The Financial Year Ended 30 June 2012 continued
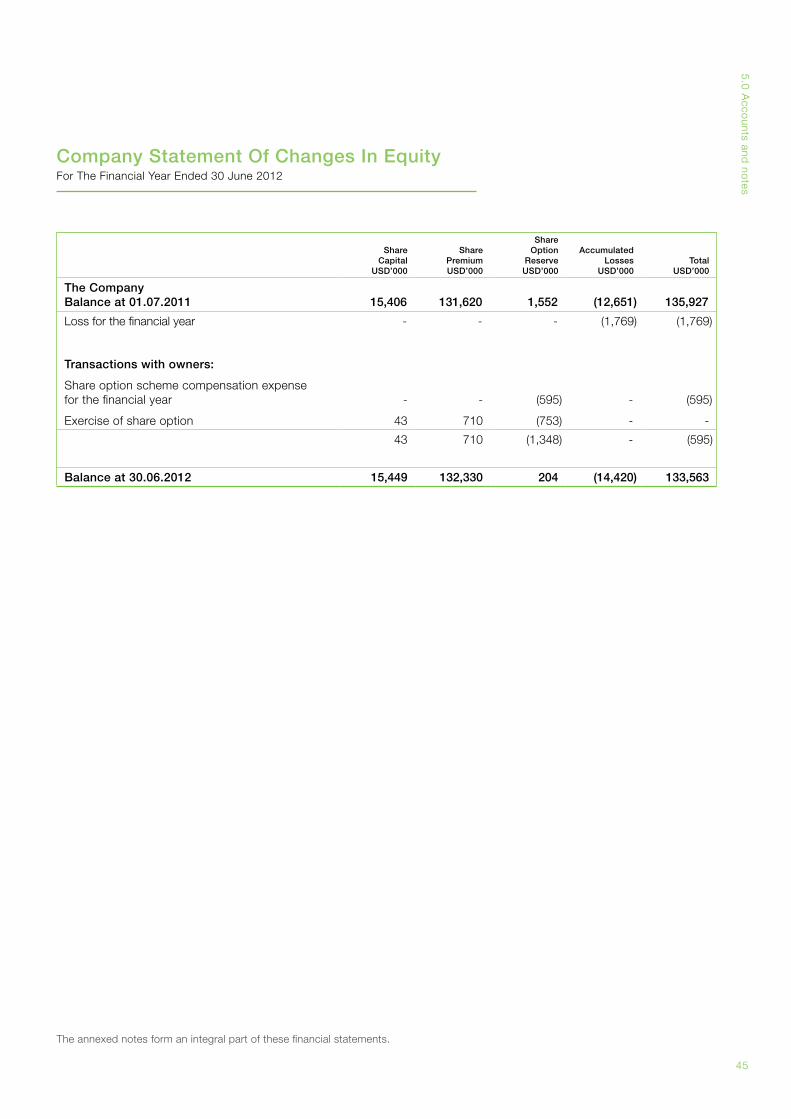
45
5.0
Acco
unts and no
tes
The annexed notes form an integral part of these financial statements.
ShareCapital
USD’000
SharePremiumUSD’000
ShareOption
ReserveUSD’000
Accumulated Losses
USD’000Total
USD’000
The CompanyBalance at 01.07.2011 15,406 131,620 1,552 (12,651) 135,927
Loss for the financial year - - - (1,769) (1,769)
Transactions with owners:
Share option scheme compensation expense for the financial year - - (595) - (595)
Exercise of share option 43 710 (753) - -
43 710 (1,348) - (595)
Balance at 30.06.2012 15,449 132,330 204 (14,420) 133,563
Company Statement Of Changes In EquityFor The Financial Year Ended 30 June 2012
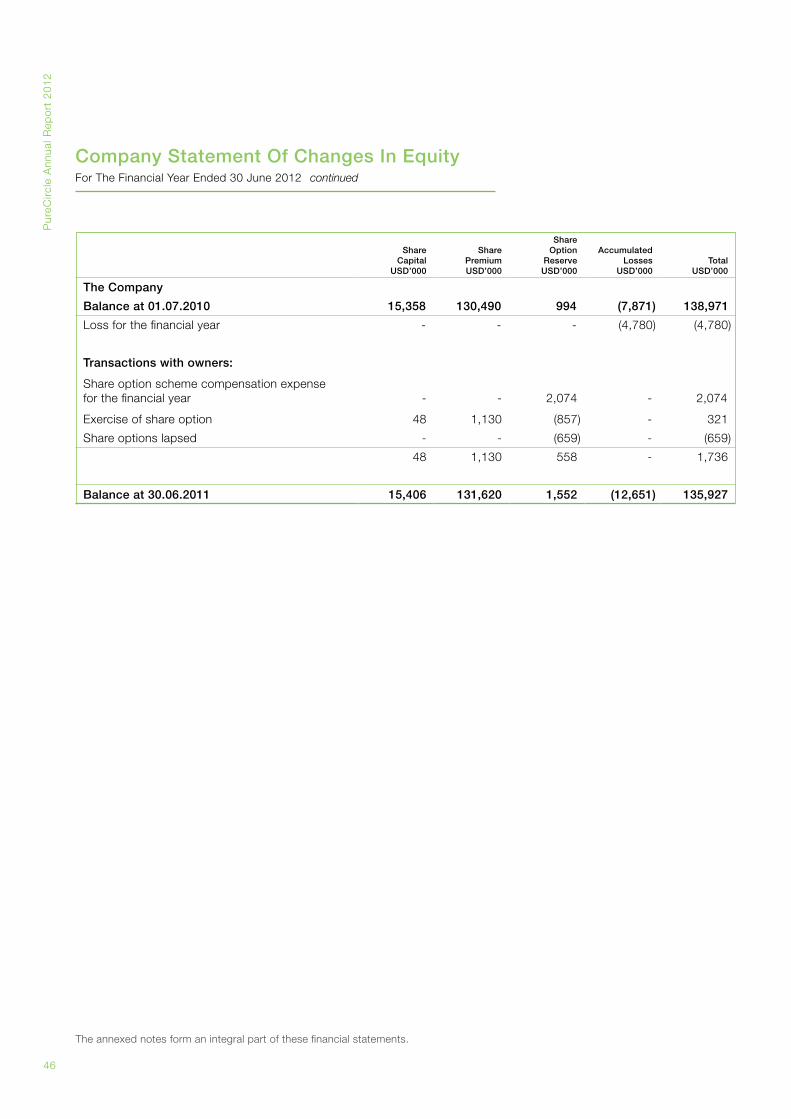
Pur
eCirc
le A
nnua
l Rep
ort
20
12
46
The annexed notes form an integral part of these financial statements.
ShareCapital
USD’000
SharePremiumUSD’000
ShareOption
ReserveUSD’000
Accumulated Losses
USD’000Total
USD’000
The Company
Balance at 01.07.2010 15,358 130,490 994 (7,871) 138,971
Loss for the financial year - - - (4,780) (4,780)
Transactions with owners:
Share option scheme compensation expense for the financial year - - 2,074 - 2,074
Exercise of share option 48 1,130 (857) - 321
Share options lapsed - - (659) - (659)
48 1,130 558 - 1,736
Balance at 30.06.2011 15,406 131,620 1,552 (12,651) 135,927
Company Statement Of Changes In EquityFor The Financial Year Ended 30 June 2012 continued
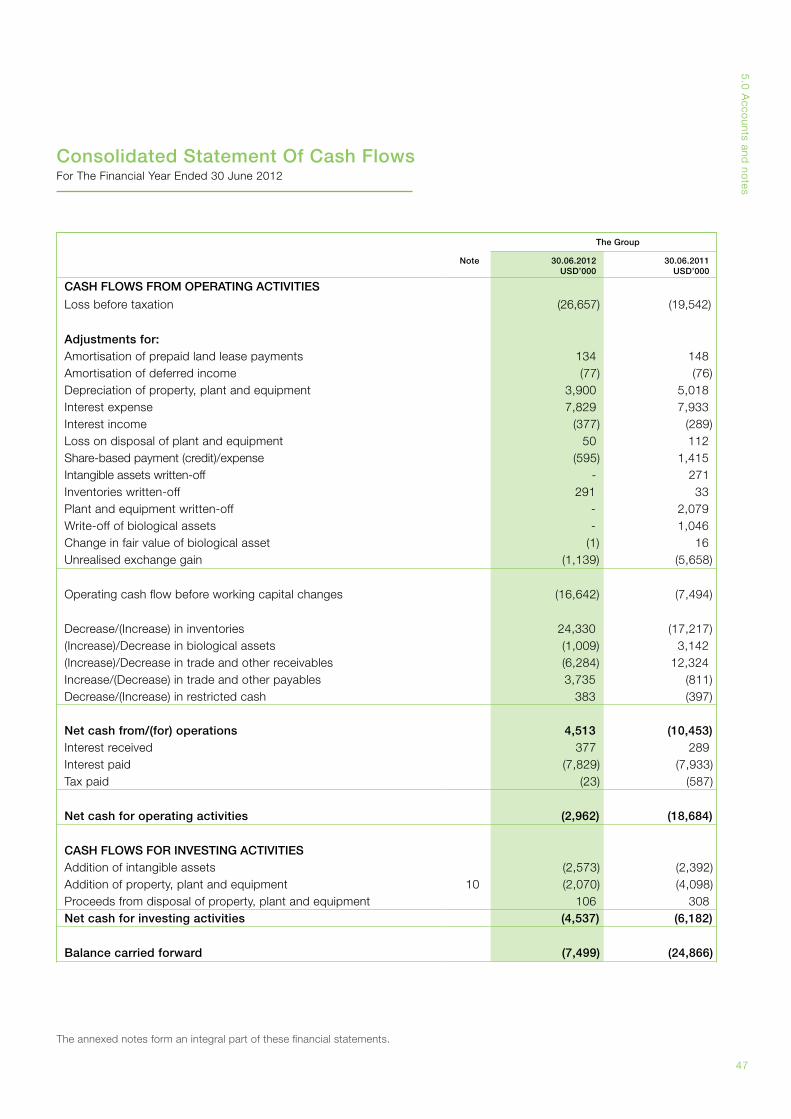
47
5.0
Acco
unts and no
tes
The Group
Note 30.06.2012USD’000
30.06.2011USD’000
CASH FLOWS FROM OPERATING ACTIVITIES
Loss before taxation (26,657) (19,542)
Adjustments for:Amortisation of prepaid land lease payments 134 148Amortisation of deferred income (77) (76)Depreciation of property, plant and equipment 3,900 5,018Interest expense 7,829 7,933Interest income (377) (289)Loss on disposal of plant and equipment 50 112Share-based payment (credit)/expense (595) 1,415Intangible assets written-off - 271Inventories written-off 291 33Plant and equipment written-off - 2,079Write-off of biological assets - 1,046Change in fair value of biological asset (1) 16Unrealised exchange gain (1,139) (5,658)
Operating cash flow before working capital changes (16,642) (7,494)
Decrease/(Increase) in inventories 24,330 (17,217)(Increase)/Decrease in biological assets (1,009) 3,142(Increase)/Decrease in trade and other receivables (6,284) 12,324Increase/(Decrease) in trade and other payables 3,735 (811)Decrease/(Increase) in restricted cash 383 (397)
Net cash from/(for) operations 4,513 (10,453)Interest received 377 289Interest paid (7,829) (7,933)Tax paid (23) (587)
Net cash for operating activities (2,962) (18,684)
CASH FLOWS FOR INVESTING ACTIVITIESAddition of intangible assets (2,573) (2,392)Addition of property, plant and equipment 10 (2,070) (4,098)Proceeds from disposal of property, plant and equipment 106 308Net cash for investing activities (4,537) (6,182)
Balance carried forward (7,499) (24,866)
Consolidated Statement Of Cash FlowsFor The Financial Year Ended 30 June 2012
The annexed notes form an integral part of these financial statements.
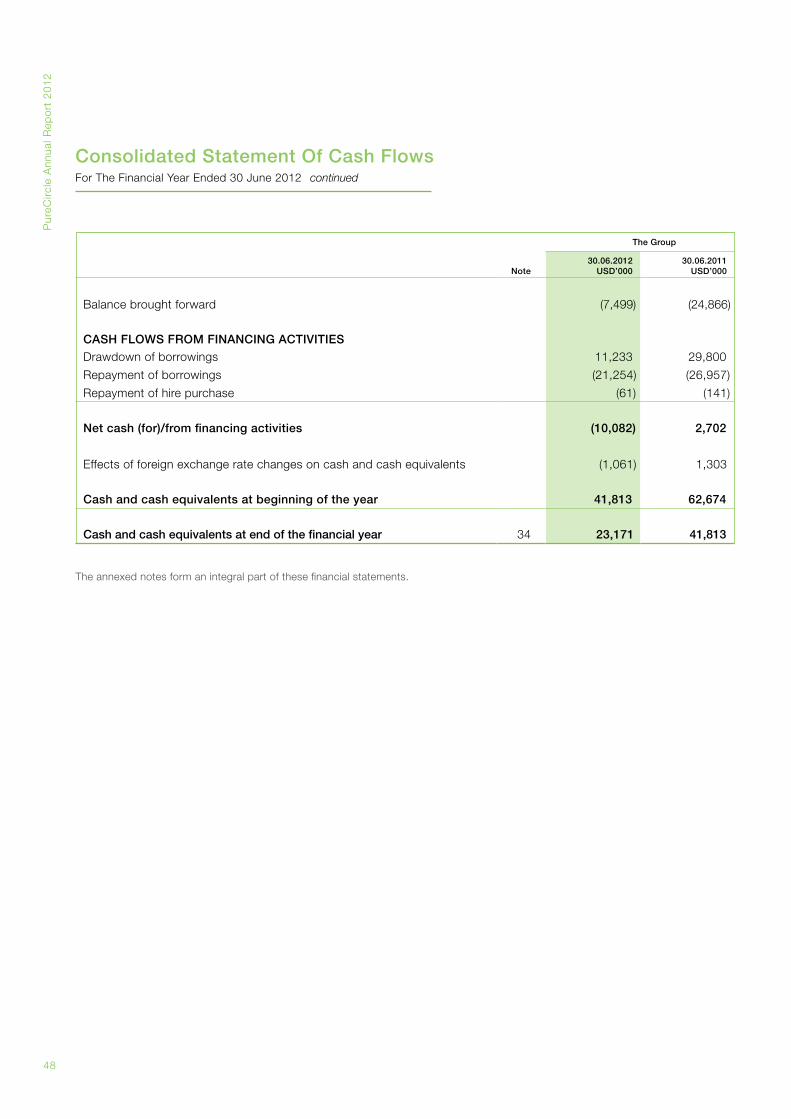
Pur
eCirc
le A
nnua
l Rep
ort
20
12
48
The Group
Note30.06.2012
USD’00030.06.2011
USD’000
Balance brought forward (7,499) (24,866)
CASH FLOWS FROM FINANCING ACTIVITIESDrawdown of borrowings 11,233 29,800
Repayment of borrowings (21,254) (26,957)
Repayment of hire purchase (61) (141)
Net cash (for)/from financing activities (10,082) 2,702
Effects of foreign exchange rate changes on cash and cash equivalents (1,061) 1,303
Cash and cash equivalents at beginning of the year 41,813 62,674
Cash and cash equivalents at end of the financial year 34 23,171 41,813
Consolidated Statement Of Cash FlowsFor The Financial Year Ended 30 June 2012 continued
The annexed notes form an integral part of these financial statements.
49
5.0
Acco
unts and no
tes
Notes To The Financial StatementsFor The Financial Year Ended 30 June 2012
1. General Information
The Company was incorporated and registered as a private limited company in Bermuda, under the Companies (Bermuda) Law 1981. The registered office and principal place of business are as follows:
Registered office : Clarendon House, 2 Church Street,Hamilton HM 11, Bermuda.
Principal place of business: PT23419, Lengkuk Teknologi,Techpark @ Enstek, 71760, Bandar Enstek,Negeri Sembilan, Malaysia.
The Company’s shares are publicly traded on the Alternative Investment Market (“AIM”) division of the London Stock Exchange.
The financial statements were authorised for issue by the Board of Directors in accordance with a resolution of the Directors dated 10 September 2012.
The number of employees in the Group at the end of the financial year amounted to 758 (2011: 779) employees.
2. Principal Activities
The Company is engaged principally in the business of investment holding whilst the principal activities of the rest of the Group are the production, marketing and distribution of natural sweeteners and flavours.
There have been no significant changes in the nature of these activities during the financial year. The principal activities of the subsidiaries and joint ventures are set out in Notes 7 and 8 to the financial statements.
3. Basis of Preparation
The financial statements of the Group and Company have been prepared under the historical cost convention unless otherwise indicated in the significant accounting policies, and in compliance with International Financial Reporting Standards (“IFRSs”) and IFRIC Interpretations.
(a) Standards, amendments and interpretations that are effective for the current financial year
During the current financial year, the Group has adopted the following new, revised and amended standards on 1 July 2011:• IAS24(revised)-Relatedpartydisclosures• Annualimprovements2010• AmendmenttoIFRS7-Financialinstruments:Disclosures• AmendmenttoIFRS1-Hyperinflationandfixeddates• AmendmenttoIFRIC14-Pre-paymentsofaMinimum
Funding Requirement
The adoption of the above revised and amended standards did not have a significant impact to the financial statements of the Group and Company.
(b) Standards adopted early
There have been no standards adopted early by the Group or the Company.
(c) Standards, amendments and interpretations that have been issued and are relevant to the Company’s operations but are not yet effective
The Group and Company have not adopted early the following revised standards, amendments and interpretations that have been issued but are not yet effective for the current financial year.
Effective for annual periods beginning on or after 1 January 2012
• AmendmenttoIAS12-Incometaxesondeferredtax
Effective for annual periods beginning on or after 1 July 2012
• AmendmenttoIAS1-Presentationoffinancialstatements on OCI
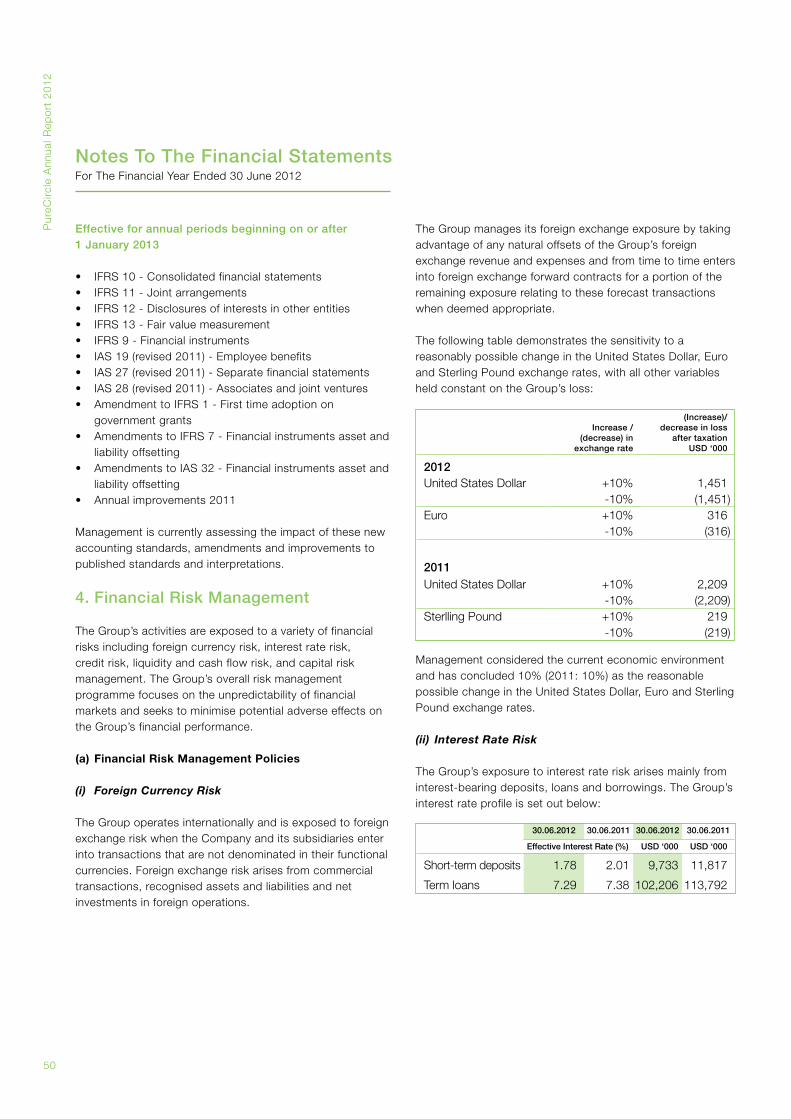
Pur
eCirc
le A
nnua
l Rep
ort
20
12
50
Effective for annual periods beginning on or after 1 January 2013
• IFRS10-Consolidatedfinancialstatements• IFRS11-Jointarrangements• IFRS12-Disclosuresofinterestsinotherentities• IFRS13-Fairvaluemeasurement• IFRS9-Financialinstruments• IAS19(revised2011)-Employeebenefits• IAS27(revised2011)-Separatefinancialstatements• IAS28(revised2011)-Associatesandjointventures• AmendmenttoIFRS1-Firsttimeadoptionon
government grants • AmendmentstoIFRS7-Financialinstrumentsassetand
liability offsetting • AmendmentstoIAS32-Financialinstrumentsassetand
liability offsetting • Annualimprovements2011
Management is currently assessing the impact of these new accounting standards, amendments and improvements to published standards and interpretations.
4. Financial Risk Management
The Group’s activities are exposed to a variety of financial risks including foreign currency risk, interest rate risk, credit risk, liquidity and cash flow risk, and capital risk management. The Group’s overall risk management programme focuses on the unpredictability of financial markets and seeks to minimise potential adverse effects on the Group’s financial performance.
(a) Financial Risk Management Policies
(i) Foreign Currency Risk
The Group operates internationally and is exposed to foreign exchange risk when the Company and its subsidiaries enter into transactions that are not denominated in their functional currencies. Foreign exchange risk arises from commercial transactions, recognised assets and liabilities and net investments in foreign operations.
The Group manages its foreign exchange exposure by taking advantage of any natural offsets of the Group’s foreign exchange revenue and expenses and from time to time enters into foreign exchange forward contracts for a portion of the remaining exposure relating to these forecast transactions when deemed appropriate.
The following table demonstrates the sensitivity to a reasonably possible change in the United States Dollar, Euro and Sterling Pound exchange rates, with all other variables held constant on the Group’s loss:
Management considered the current economic environment and has concluded 10% (2011: 10%) as the reasonable possible change in the United States Dollar, Euro and Sterling Pound exchange rates.
(ii) Interest Rate Risk
The Group’s exposure to interest rate risk arises mainly from interest-bearing deposits, loans and borrowings. The Group’s interest rate profile is set out below:
Increase / (decrease) in
exchange rate
(Increase)/ decrease in loss
after taxation USD ‘000
2012United States Dollar +10% 1,451
-10% (1,451)Euro +10% 316
-10% (316)
2011United States Dollar +10% 2,209
-10% (2,209)Sterlling Pound +10% 219
-10% (219)
30.06.2012 30.06.2011 30.06.2012 30.06.2011
Effective Interest Rate (%) USD ‘000 USD ‘000
Short-term deposits 1.78 2.01 9,733 11,817
Term loans 7.29 7.38 102,206 113,792
Notes To The Financial StatementsFor The Financial Year Ended 30 June 2012
51
5.0
Acco
unts and no
tes
Notes To The Financial StatementsFor The Financial Year Ended 30 June 2012
The Group manages interest rate risk by entering into a mix of fixed and floating rate borrowings. On a regular basis the Group calculates the impact on the income statement of a defined interest rate shift on the Group’s borrowing position.
Based on the forecasts performed, if interest rates on borrowings is 1% higher/lower for a year with all other variables held constant post-tax loss for the year would be USD922,000 (2011: USD954,000) higher/lower, mainly as a result of higher/lower interest expense on floating rate borrowing.
(iii) Credit Risk
The Group trades only with recognised, creditworthy third parties. It is the Group’s policy that all customers who wish to trade on credit terms are subject to credit verification procedures. In addition, receivable balances are monitored on an ongoing basis with the result that the Group’s exposure to bad debt is not significant. The Group and the Company’s maximum exposure is the carrying amount as disclosed in Notes 15, 16 and 17 to the financial statements.
The Group’s concentration to credit risk has reduced significantly as the diversified customer base has expanded. As at 30 June 2012, the seven (2011: two) largest customers constituted 63% (2011: 62%) and it required 72 (2011: 21) customers to constitute 91% of the outstanding third party receivables.
See Note 15 for ageing of trade receivables.
The Group’s cash and cash equivalents and short-term deposits are placed with creditworthy financial institutions.
The Group and Company consider that the credit risk relating to amounts due from jointly controlled entities and subsidiaries respectively to be low. Both the jointly controlled entities and subsidiaries are expected to repay fully the amounts owed to the Group and Company respectively as these related entities are expected to continue on a going concern basis. At year end, the Group believes there is no credit risk provision required for these receivables.
(iv) Liquidity and Cash Flow Risks
Liquidity and cash flow risks arise mainly from general funding and business activities. The Group’s cash flow is reviewed regularly to ensure commitments are settled when they fall due.
Cash flow forecasting is performed both in the operating entities and on a Group consolidated basis. The Group monitors rolling forecasts of its liquidity requirements including projected sales revenues, and inventory and capital expenditure requirements to ensure it has sufficient cash to meet operational needs while maintaining sufficient headroom on its undrawn committed borrowing facilities at all times so that the Group does not breach borrowing limits or financial covenants on any of its borrowing facilities. The Group invest surplus cash into financial interest bearing accounts and money market deposits.
The following tables detail the remaining contractual maturities at the reporting date of the Group’s and the Company’s non-derivative financial assets and financial liabilities, which are based on contractual undiscounted cash flows (including interest payments computed using contractual rates or, if floating, based on rates current at the reporting date) and the earliest date the Group and the Company can be required to receive or pay:
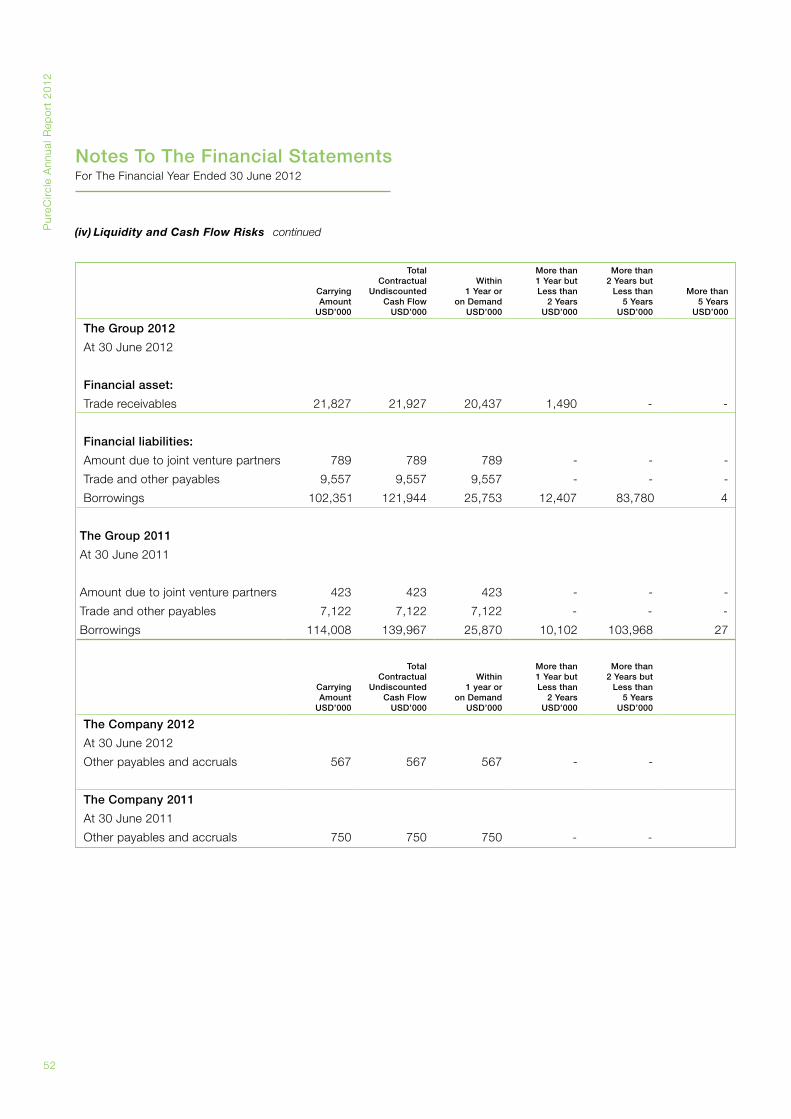
Pur
eCirc
le A
nnua
l Rep
ort
20
12
52
CarryingAmount
USD’000
TotalContractual
UndiscountedCash Flow
USD’000
Within1 Year or
on DemandUSD’000
More than1 Year butLess than
2 YearsUSD’000
More than2 Years but
Less than5 Years
USD’000
More than5 Years
USD’000
The Group 2012
At 30 June 2012
Financial asset:
Trade receivables 21,827 21,927 20,437 1,490 - -
Financial liabilities:
Amount due to joint venture partners 789 789 789 - - -
Trade and other payables 9,557 9,557 9,557 - - -
Borrowings 102,351 121,944 25,753 12,407 83,780 4
The Group 2011
At 30 June 2011
Amount due to joint venture partners 423 423 423 - - -
Trade and other payables 7,122 7,122 7,122 - - -
Borrowings 114,008 139,967 25,870 10,102 103,968 27
CarryingAmount
USD’000
TotalContractual
UndiscountedCash Flow
USD’000
Within1 year or
on DemandUSD’000
More than1 Year butLess than
2 YearsUSD’000
More than2 Years but
Less than5 Years
USD’000
The Company 2012
At 30 June 2012
Other payables and accruals 567 567 567 - -
The Company 2011
At 30 June 2011
Other payables and accruals 750 750 750 - -
Notes To The Financial StatementsFor The Financial Year Ended 30 June 2012
(iv) Liquidity and Cash Flow Risks continued
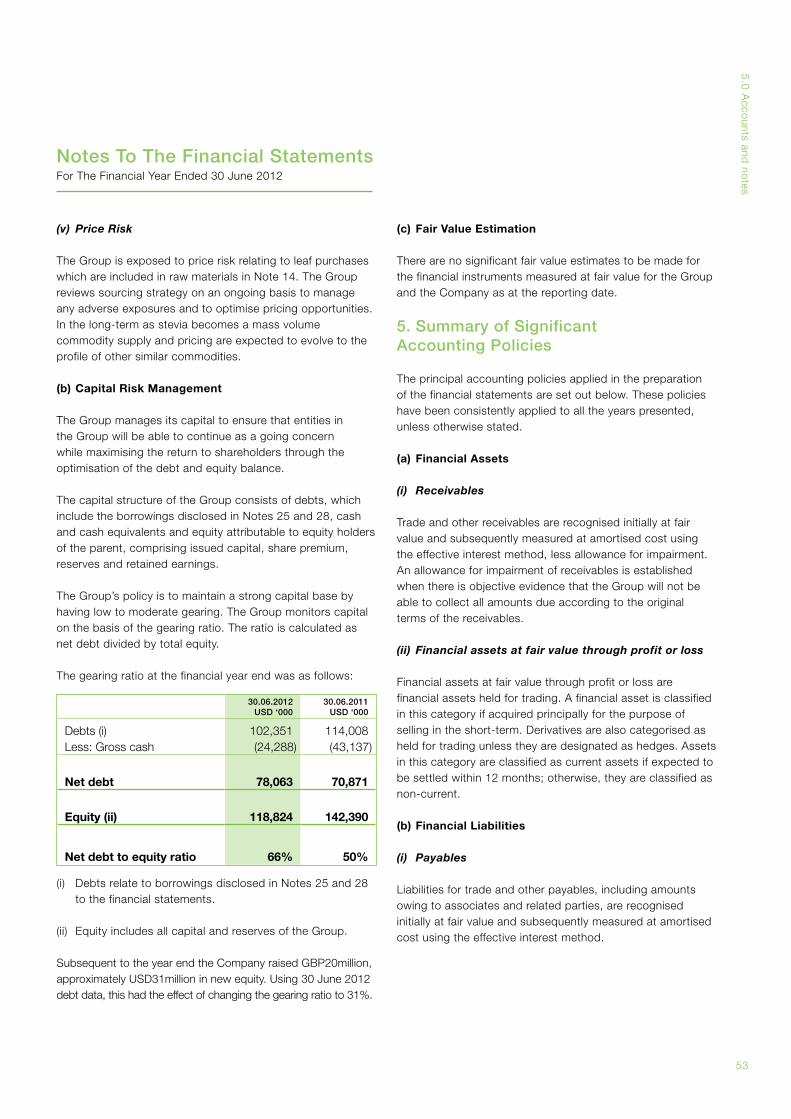
53
5.0
Acco
unts and no
tes
(v) Price Risk
The Group is exposed to price risk relating to leaf purchases which are included in raw materials in Note 14. The Group reviews sourcing strategy on an ongoing basis to manage any adverse exposures and to optimise pricing opportunities. In the long-term as stevia becomes a mass volume commodity supply and pricing are expected to evolve to the profile of other similar commodities.
(b) Capital Risk Management
The Group manages its capital to ensure that entities in the Group will be able to continue as a going concern while maximising the return to shareholders through the optimisation of the debt and equity balance.
The capital structure of the Group consists of debts, which include the borrowings disclosed in Notes 25 and 28, cash and cash equivalents and equity attributable to equity holders of the parent, comprising issued capital, share premium, reserves and retained earnings.
The Group’s policy is to maintain a strong capital base by having low to moderate gearing. The Group monitors capital on the basis of the gearing ratio. The ratio is calculated as net debt divided by total equity.
The gearing ratio at the financial year end was as follows:
(i) Debts relate to borrowings disclosed in Notes 25 and 28 to the financial statements.
(ii) Equity includes all capital and reserves of the Group.
Subsequent to the year end the Company raised GBP20million, approximately USD31million in new equity. Using 30 June 2012 debt data, this had the effect of changing the gearing ratio to 31%.
30.06.2012USD ‘000
30.06.2011USD ‘000
Debts (i) 102,351 114,008Less: Gross cash (24,288) (43,137)
Net debt 78,063 70,871
Equity (ii) 118,824 142,390
Net debt to equity ratio 66% 50%
Notes To The Financial StatementsFor The Financial Year Ended 30 June 2012
(c) Fair Value Estimation
There are no significant fair value estimates to be made for the financial instruments measured at fair value for the Group and the Company as at the reporting date.
5. Summary of SignificantAccounting Policies The principal accounting policies applied in the preparation of the financial statements are set out below. These policies have been consistently applied to all the years presented, unless otherwise stated.
(a) Financial Assets
(i) Receivables
Trade and other receivables are recognised initially at fair value and subsequently measured at amortised cost using the effective interest method, less allowance for impairment. An allowance for impairment of receivables is established when there is objective evidence that the Group will not be able to collect all amounts due according to the original terms of the receivables.
(ii) Financial assets at fair value through profit or loss
Financial assets at fair value through profit or loss are financial assets held for trading. A financial asset is classified in this category if acquired principally for the purpose of selling in the short-term. Derivatives are also categorised as held for trading unless they are designated as hedges. Assets in this category are classified as current assets if expected to be settled within 12 months; otherwise, they are classified as non-current.
(b) Financial Liabilities
(i) Payables
Liabilities for trade and other payables, including amounts owing to associates and related parties, are recognised initially at fair value and subsequently measured at amortised cost using the effective interest method.
Pur
eCirc
le A
nnua
l Rep
ort
20
12
54
(ii) Interest-bearing loans and borrowings
All loans and borrowings are recognised initially at fair value of the consideration received, net of directly attributable transaction cost incurred, and are subsequently stated at amortised cost. Any difference between the proceeds (net of transaction cost) and the redemption value is recognised in the profit or loss over the period of the loans and borrowings using the effective interest method.
(c) Foreign Currency Translation
(i) Functional and presentation currency
The functional currency of each of the Group’s entities is measured using the currency of the primary economic environment in which the entity operates.
The functional and presentation currency of the Company is United States Dollar (“USD”). The consolidated financial statements are presented in United States Dollar (“USD”) which is the parent’s presentation currency.
(ii) Transactions and balances
Transactions of the Company in foreign currency are converted into USD at the approximate rates of exchange ruling at the transaction dates.
Transactions in foreign currency are measured in the respective functional currencies of the Group’s entities and are recorded on initial recognition in the functional currencies at exchange rates approximating those ruling at the transaction dates.
Monetary assets and liabilities at the reporting date are translated at the rates ruling as of that date. Exchange differences arising from the translation of monetary assets are recognised in the profit or loss.
Non-monetary assets and liabilities are translated using exchange rates that existed when the values were determined.
(iii) Foreign Operations
The results and financial position of the subsidiaries are translated into the presentation currency as follows:-
(a) assets and liabilities, including goodwill and fair value adjustments arising on the acquisition of foreign operations, for each statement of financial position presented are translated at the closing rate at the reporting date;
(b) income and expenses for each profit or loss are translated at the average exchange rates for the year;
(c) all resulting exchange differences are recognised as a separate component of equity; and
(d) on disposal, accumulated translation differences are recognised in the profit or loss as part of the gain or loss on sale of the foreign operation.
(d) Basis of Consolidation
The consolidated financial statements include the financial statements of the Company and its subsidiaries.
(i) Subsidiaries
Subsidiaries are all entities over which the Group has the power to govern the financial and operating policies generally accompanying a shareholding of more than one half of the voting rights. The existence and effect of potential voting rights that are currently exercisable or convertible are considered when assessing whether the Group controls another entity. Subsidiaries are fully consolidated from the date on which control is transferred to the Group. They are de-consolidated from the date that control ceases.
The Group uses the acquisition method of accounting to account for business combinations. The consideration transferred for the acquisition of a subsidiary is the fair values of the assets transferred, the liabilities incurred and the equity interests issued by the Group. The consideration transferred includes the fair value of any asset or liability resulting from a contingent consideration arrangement. Acquisition-related costs are expensed as incurred. Identifiable assets acquired and liabilities and contingent liabilities assumed in a business combination are measured initially at their fair values at the acquisition date. On an acquisition-by-acquisition basis, the Group recognises any non-controlling interest in the acquiree either at fair value or at the non-controlling interest’s proportionate share of the acquiree’s net assets. Investments in subsidiaries are accounted for at cost less impairment. Cost is adjusted to reflect changes in consideration arising from contingent consideration amendments. Cost also includes direct attributable costs of investment.
Notes To The Financial StatementsFor The Financial Year Ended 30 June 2012
55
5.0
Acco
unts and no
tes
Notes To The Financial StatementsFor The Financial Year Ended 30 June 2012
The excess of the consideration transferred, the amount of any non-controlling interest in the acquiree and the acquisition-date fair value of any previous equity interest in the acquiree over the fair value of the Group’s share of the identifiable net assets acquired is recorded as goodwill. If this is less than the fair value of the net assets of the subsidiary acquired in the case of a bargain purchase, the difference is recognised directly in the profit or loss (refer Note 5(e)).
Inter-company transactions, balances and unrealised gains on transactions between Group companies are eliminated. Unrealised losses are also eliminated. Accounting policies of subsidiaries have been changed where necessary to ensure consistency with the policies adopted by the Group.
(ii) Transactions with non-controlling interests The Group treats transactions with non-controlling interests as transactions with equity owners of the Group. For purchases from non-controlling interests, the difference between any consideration paid and the relevant share acquired of the carrying value of net assets of the subsidiary is recorded in equity. Gains or losses on disposals to non-controlling interests are also recorded in equity.
When the Group ceases to have control or significant influence, any retained interest in the entity is re-measured to its fair value, with the change in carrying amount recognised in profit or loss. The fair value is the initial carrying amount for the purposes of subsequently accounting for the retained interest as an associate, joint venture or financial asset. In addition, any amounts previously recognised in other comprehensive income in respect of that entity are accounted for as if the Group had directly disposed of the related assets or liabilities. This may mean that amounts previously recognised in other comprehensive income are reclassified to profit or loss.
If the ownership interest in an associate is reduced but significant influence is retained, only a proportionate share of the amounts previously recognised in other comprehensive income are reclassified to profit or loss where appropriate.
(iii) Jointly controlled entities
Jointly controlled entities are those entities over whose activities the Group has joint control, established by contractual agreement and requiring unanimous consent for strategic financial and operating decisions.
The Group’s interests in jointly controlled entities are accounted for by proportionate consolidation. The Group combines its share of the joint venture’s individual income and expenses, assets and liabilities and cash flows on a line-by-line basis with similar items in the Group’s financial statements.
(e) Goodwill on Consolidation
Goodwill that arises upon acquisition of subsidiaries is included in intangible assets. Goodwill on acquisition of joint venture is included in the carrying amount of the investment and is tested for impairment as part of the investment.
Goodwill on consolidation represents the excess of the cost of acquisition over the Group’s share of the fair values of the identifiable net assets of the subsidiaries at the date of acquisition.
The carrying value of goodwill is reviewed for impairment annually. Impairment losses on goodwill are recognised immediately in the profit or loss. An impairment loss recognised for goodwill is not reversed in a subsequent year. Gains and losses on the disposal of an entity include the carrying amount of goodwill relating to the entity sold.
If, after reassessment, the Group’s interest in the fair values of the identifiable net assets of the subsidiaries exceeds the cost of the business combinations, the excess is recognised immediately in the profit or loss.
Goodwill is allocated to cash-generating units for the purpose of impairment testing. The allocation is made to those cash-generating units or groups of cash-generating units that are expected to benefit from the business combination in which the goodwill arose identified according to operating segment.
Acquisition of non-controlling interests are accounted for as transactions with equity holders in their capacity as equity holders and therefore no goodwill is recognized as a result of such transaction.
Pur
eCirc
le A
nnua
l Rep
ort
20
12
56
(ii) Product Development
All research costs are recognised in the profit or loss as incurred.
Expenditure incurred on projects to develop new products is capitalised as intangible assets only when the Group can demonstrate the technical feasibility of completing the intangible assets so that it will be available for use or sale, its intention to complete and its ability to use or sell the asset, how the asset will generate future economic benefits, the availability of resource to complete the project and the ability to measure reliably the expenditure during the developments. These intangible assets are amortised on a straight line basis over their estimated useful life of 20 years starting from the financial year when the product are ready for its intended use.
Product development expenditures which do not meet these criteria are recognised in the profit or loss when incurred.
(h) Property, Plant and Equipment
Property, plant and equipment, other than freehold land, are stated at cost less accumulated depreciation and impairment losses, if any. Freehold land is stated at cost less impairment losses, if any, and is not depreciated. Cost includes expenditure that is directly attributable to the acquisition of the items. The cost of self-constructed assets includes the cost of materials and direct labour, any other costs directly attributable to bringing the assets to working condition for its intended use, and the costs of dismantling and removing the items and restoring the site on which they are located.
Subsequent costs are included in the asset’s carrying amount or recognised as a separate asset, as appropriate, only when it is probable that future economic benefits associated with the item will flow to the Group and the cost of the item can be measured reliably. The carrying amount of the replaced part is derecognised. All other repairs and maintenance are charged to the profit or loss during the financial period in which they are incurred.
Depreciation is calculated under the straight-line method to write-off the depreciable amount of the assets over their estimated useful lives. Depreciation of an asset does not cease when the asset becomes idle or is retired from active use unless the asset is fully depreciated. The principal annual rates used for this purpose are:
Notes To The Financial StatementsFor The Financial Year Ended 30 June 2012
(f) Investments in Subsidiaries and Joint Ventures
Investments in subsidiaries and joint ventures are stated at cost in the statement of financial position of the Company, and are reviewed for impairment at the end of the financial year if events or changes in circumstances indicate that their carrying values may not be recoverable.
On the disposal of the investments in subsidiaries and joint ventures, the difference between the net disposal proceeds and the carrying amount of the investments is taken to the profit or loss.
(g) Intangible Assets (other than Goodwill)
Intangible assets acquired separately are measured on initial recognition at cost. The cost of intangible assets acquired in a business combination is their fair values as at the date of acquisition. Following initial recognition, intangible assets with finite useful lives are carried at cost less any accumulated amortisation and any accumulated impairment losses.
(i) Intellectual Property Rights
The intellectual property consists of the internal investment and external acquisition costs of the patents, trademarks, technological processes and all intellectual and industrial property rights in connection therewith on the production of natural sweetener, pharmaceutical products and chemical derivatives of bio-organic and physiologically active compounds. The acquisition cost is capitalised as an intangible asset as it is able to generate future economic benefits to the Group.
The useful life of these intellectual property rights is considered to be indefinite based on the Directors’ annual reassessment of the useful life; there is no foreseeable limit to the period over which the asset is expected to generate net cash inflows for the Group. Intellectual property rights are stated at cost less impairment losses. They are not amortised but tested for impairment annually or more frequently when indicators of impairment are identified.The intellectual property rights are assessed to have an indefinite useful life because the Group’s natural sweeteners and flavours are expected to become mass volume ingredients in all foods and beverage categories. Similar to the sugar market, there is no expected end to the useful life of the natural sweeteners and flavours such as stevia. Accordingly, the Directors believe the useful life for intellectual property rights is indefinite. The Directors will continue to reassess the useful life of the intellectual property rights on an annual basis.
Buildings 5%Extraction and refinery plants 2% - 20%Office equipment, furniture and fittings and motor vehicles 20%
57
5.0
Acco
unts and no
tes
Notes To The Financial StatementsFor The Financial Year Ended 30 June 2012
The depreciation method, useful life and residual values are reviewed, and adjusted if appropriate, at each reporting date.
An item of property, plant and equipment is derecognised upon disposal or when no future economic benefits are expected from its use. Any gain or loss arising from derecognition of the asset is included in the profit or loss in the year the asset is derecognised.
Capital work-in-progress represents assets under construction, and which are not ready for commercial use at the reporting date. Capital work-in-progress is stated at cost, and will be transferred to the relevant category of long-term assets and depreciated accordingly when the assets are completed and ready for commercial use.
Cost of capital work-in-progress includes direct cost, related expenditure and interest cost on borrowings taken specifically to finance the purchase of the assets, net of interest income on the temporary investment of those borrowings.
(i) Impairment of Non-financial Assets
Assets that have an indefinite useful life, for example goodwill, are not subject to amortisation and are tested annually for impairment. Assets that are subject to amortisation are reviewed for impairment whenever events or changes in circumstances indicate that the carrying amount may not be recoverable. An impairment loss is recognised for the amount by which the asset’s carrying amount exceeds its recoverable amount. The recoverable amount is the higher of an asset’s fair value less costs to sell and value in use. For the purposes of assessing impairment, assets are grouped at the lowest levels for which there are separately identifiable cash flows (cash-generating units). Non-financial assets other than goodwill that suffered impairment are reviewed for possible reversal of the impairment at each reporting date.
(j) Biological Asset
Biological assets comprise primarily stevia plants in the Group’s controlled nurseries (nursery plants) that are used to mass produce seedlings for third party farmers.
All expenditure on the nursery plants up to maturity and through the productive life of the plants is treated as an addition to the nursery plants. Such costs include seedlings, fertiliser, planting materials, water and labour.
Biological assets are stated at fair value less cost to sell. Fair value gains or losses on biological assets are recognised in the profit or loss. Where little biological transformation has taken place since initial cost incurrence, or the impact of the biological transformation on price is not expected to be material, the fair value of the biological assets approximate cost.
Seedlings produced from the nursery plants with an intention of delivery to farmers or other buyers are transferred from biological assets to inventories at its proportion of fair value less cost to sell, which becomes the deemed cost under IAS 2. These inventories comprising seedlings are then stated at the lower of this deemed cost and net realisable value. Seedlings which are maintained for further cultivation process in the Group’s controlled nurseries remain as biological assets of the Group and the fair value of these biological assets approximate cost.
(k) Inventories
Inventories are stated at the lower of cost and net realisable value. Cost is determined on the weighted average basis, and comprises the purchase price and incidentals incurred in bringing the inventories to their present location and condition. Cost of finished goods and work-in-progress includes the cost of materials, labour and production overheads.
Net realisable value represents the estimated selling price less the estimated costs of completion and the estimated costs necessary to make the sale.
Where necessary, due allowance is made for all damaged, obsolete and slow-moving items.
(l) Income Taxes
Income taxes for the year comprise current and deferred tax.
Current tax is the expected amount of income taxes payable in respect of the taxable profit for the year and is measured using the applicable tax rates that have been enacted or substantively enacted at the reporting date in each of the jurisdictions in which the Group operates.
Deferred tax is provided in full, using the liability method, on the temporary differences arising between the tax bases of assets and liabilities and their carrying amounts in the financial statements.
Pur
eCirc
le A
nnua
l Rep
ort
20
12
58
Deferred tax liabilities are recognised for all taxable temporary differences other than those that arise from goodwill or excess of the acquirer’s interest in the net fair value of the acquiree’s identifiable assets, liabilities and contingent liabilities over the business combination costs or from the initial recognition of an asset or liability in a transaction which is not a business combination and at the time of the transaction, affects neither accounting profit nor taxable profit.
Deferred tax assets are recognised for all deductible temporary differences, unused tax losses and unused tax credits to the extent that it is probable that future taxable profits will be available against which the deductible temporary differences, unused tax losses and unused tax credits can be utilised.
Deferred tax assets and liabilities are measured at the tax rates that are expected to be applicable in the period when the asset is realised or the liability is settled, based on the tax rates that have been enacted or substantively enacted at the reporting date.
Deferred tax is recognised in the profit or loss, except when it arises from a transaction which is recognised directly in equity, in which case the deferred tax is also charged or credited directly to equity, or when it arises from a business combination that is an acquisition, in which case the deferred tax is included in the resulting goodwill or excess of the acquirer’s interest in the net fair value of the acquiree’s identifiable assets, liabilities and contingent liabilities over the business combination costs. The carrying amounts of deferred tax assets are reviewed at each reporting date and reduced to the extent that it is no longer probable that sufficient future taxable profits will be available to allow all or part of the deferred tax assets to be utilised.
(m) Equity Instruments
Ordinary shares are classified as equity. Incremental costs directly attributable to the issue of new shares or options are shown in equity as a deduction, net of tax, from proceeds.
Own equity instruments which are reacquired (treasury shares) are deducted from equity. No gain or loss is recognised in profit or loss on the purchase, sale, issue or cancellation of the Group’s own equity instruments.
Dividends on ordinary shares are recognised as liabilities when approved for appropriation.
Where the Company purchases any of its own equity share capital (treasury shares), the consideration paid, including any directly attributable incremental costs (net of income taxes) is shown as a deduction from equity attributable to shareholders of the Company until the shares are cancelled or reissued. Where such ordinary shares are subsequently reissued, any consideration received, net of any directly attributable incremental transaction costs and the related income tax effects, is included in equity attributable to the Company’s equity holders.
(n) Cash and Cash Equivalents
Cash and cash equivalents comprise cash in hand, deposits held at call with banks, short-term deposits with licensed banks with maturities of three month or less, and highly liquid investments that are readily convertible to known amounts of cash and which are subject to an insignificant risk of changes in value. Cash and cash equivalents exclude restricted cash.
Restricted cash comprise cash balances held in an account solely for the purpose of utilising the forward contract facility provided by a licensed financial institution.
(o) Employee Benefits
(i) Short-term Benefits
Wages, salaries, paid annual leave, bonuses and non-monetary benefits are accrued in the period in which the associated services are rendered by employees of the Group.
(ii)Defined Contribution Plans
The Group’s contributions to defined contribution plans are charged to the profit or loss in the period to which they relate. Once the contributions have been paid, the Group has no further liability in respect of the defined contribution plans.
(p) Share-Based Payment
The Group operates one long-term incentive programme which is an equity-settled, share-based compensation plan, under which the entity receives services from employees as consideration for equity instruments (options) of the Group. The fair value of the employee services received in exchange for the grant of the options or shares is recognised as an expense over the vesting period. The total amount to be expensed is determined by reference to the fair value of
Notes To The Financial StatementsFor The Financial Year Ended 30 June 2012
59
5.0
Acco
unts and no
tes
the options or shares granted at the reporting date and the number of shares vested, excluding the impact at any non-market vesting conditions. Non-market vesting conditions are included in assumptions about the number of options that are expected to become exercisable.
When the options are exercised, the Company issues new shares. The proceeds received net of any directly attributable transaction costs are credited to share capital (nominal value) and share premium when the options are exercised.
The grant by the Company of options over its equity instruments to the employees of subsidiary undertakings in the Group is treated as a capital contribution. The fair value of employee services received, measured by reference to the grant date fair value, is recognised over the vesting period as an amount due from the subsidiary, with a corresponding credit to equity.
(q) Provisions
A provision is recognised if, as a result of past event, the Group has a present legal and constructive obligation that can be estimated reliably, and it is probable that an outflow of economic benefits will be required to settle the obligation. Provisions are determined by discounting the expected future cash flows at a pre-tax rate that reflects current market assessments of the time value of money and the risks specific to the liability. The unwinding of the discount is recognised as finance cost.
(r) Leases
Leases where a significant portion of the risks and rewards of ownership are retained by the lessor are classified as operating leases. Payments made under operating leases are charged to profit or loss on a straight-line basis over the period of the lease.
When an operating lease is terminated before the lease period has expired, any payment required to be made to the lessor by way of penalty is recognized as an expense in the period in which the termination takes place.
Leases of property, plant and equipment where the Group has substantially all the risks and rewards of ownerships are classified as finance leases. Finance leases are capitalized at the inception of the lease at the lower of the fair value and the present value of the minimum lease payments. Each lease payment is allocated between the liability and finance charges so as to achieve a constant rate of interest on the finance lease balance outstanding.
Notes To The Financial StatementsFor The Financial Year Ended 30 June 2012
The corresponding rental obligations, net of finance charges, are included as borrowings. The interest element of the finance charge is charged to profit or loss over the lease period so as to produce a constant periodic rate of interest on the remaining balance of the liability for each period.
Plant and equipment acquired under a finance lease is depreciated over the shorter of the estimated useful life of the asset and the lease term.
(s) Segmental Information
Operating segments are reported in a manner consistent with the internal reporting provided to the chief operating decision-maker (i.e. the Chief Executive Officer (“CEO”)). The chief operating decision-maker is responsible for allocating resources and assessing performance of the operating segments.
(t) Revenue Recognition
(i) Sale of Goods
Revenue from the sale of stevia products is recognised when the significant risks and rewards of ownership of the stevia products have passed to the buyer along with customers’ acceptance and where applicable, net of sales tax, returns and trade discounts.
(ii) Interest Income
Interest income is recognised on an accrual basis, based on the effective yield on the investment.
(u) Government Grants Government grants are recognised initially as deferred income at fair value when there is reasonable assurance that they will be received and the Group will comply with the conditions associated with the grant. Grants that compensate the Group for expenses incurred are recognised in the profit or loss as other income on a systematic basis in the same periods in which the expenses are recognised. Grants that compensate the Group for the cost of an asset are recognised in profit or loss on a systematic basis over the useful life of the asset.
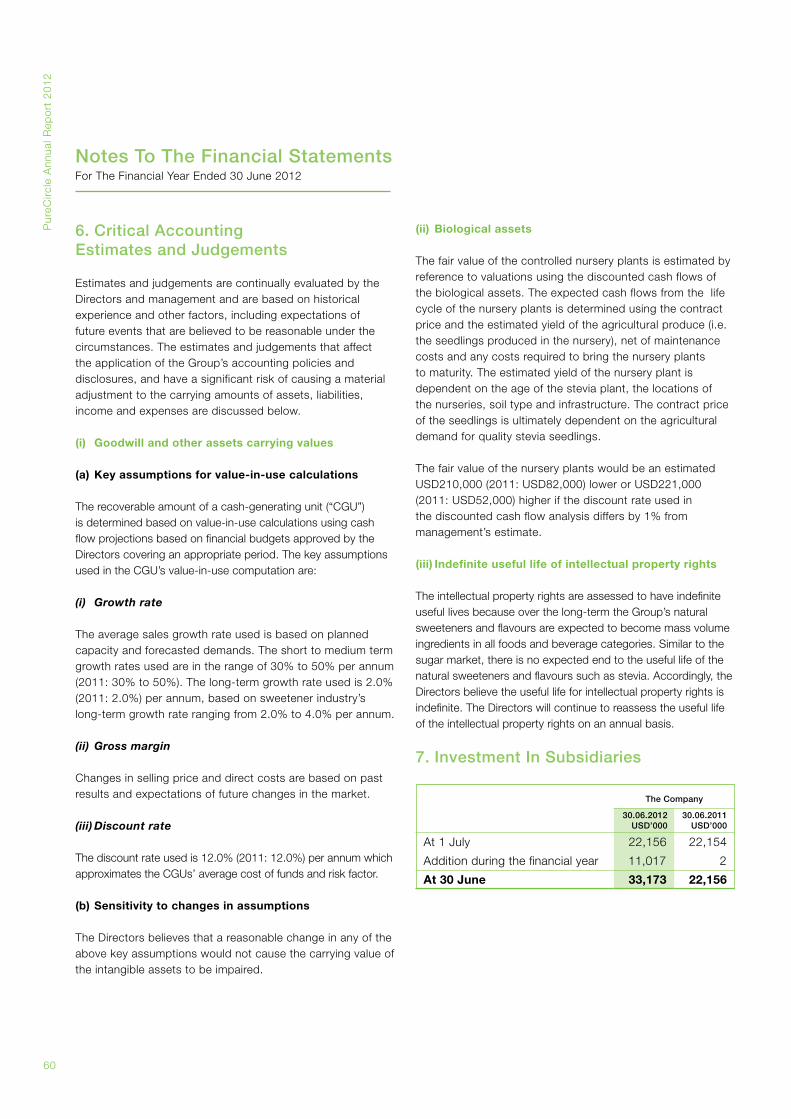
Pur
eCirc
le A
nnua
l Rep
ort
20
12
60
The Company
30.06.2012USD’000
30.06.2011USD’000
At 1 July 22,156 22,154
Addition during the financial year 11,017 2
At 30 June 33,173 22,156
6. Critical AccountingEstimates and Judgements
Estimates and judgements are continually evaluated by the Directors and management and are based on historical experience and other factors, including expectations of future events that are believed to be reasonable under the circumstances. The estimates and judgements that affect the application of the Group’s accounting policies and disclosures, and have a significant risk of causing a material adjustment to the carrying amounts of assets, liabilities, income and expenses are discussed below.
(i) Goodwill and other assets carrying values (a) Key assumptions for value-in-use calculations
The recoverable amount of a cash-generating unit (“CGU”) is determined based on value-in-use calculations using cash flow projections based on financial budgets approved by the Directors covering an appropriate period. The key assumptions used in the CGU’s value-in-use computation are:
(i) Growth rate
The average sales growth rate used is based on planned capacity and forecasted demands. The short to medium term growth rates used are in the range of 30% to 50% per annum (2011: 30% to 50%). The long-term growth rate used is 2.0% (2011: 2.0%) per annum, based on sweetener industry’s long-term growth rate ranging from 2.0% to 4.0% per annum.
(ii) Gross margin
Changes in selling price and direct costs are based on past results and expectations of future changes in the market.
(iii) Discount rate
The discount rate used is 12.0% (2011: 12.0%) per annum which approximates the CGUs’ average cost of funds and risk factor. (b) Sensitivity to changes in assumptions
The Directors believes that a reasonable change in any of the above key assumptions would not cause the carrying value of the intangible assets to be impaired.
(ii) Biological assets
The fair value of the controlled nursery plants is estimated by reference to valuations using the discounted cash flows of the biological assets. The expected cash flows from the life cycle of the nursery plants is determined using the contract price and the estimated yield of the agricultural produce (i.e. the seedlings produced in the nursery), net of maintenance costs and any costs required to bring the nursery plants to maturity. The estimated yield of the nursery plant is dependent on the age of the stevia plant, the locations of the nurseries, soil type and infrastructure. The contract price of the seedlings is ultimately dependent on the agricultural demand for quality stevia seedlings.
The fair value of the nursery plants would be an estimated USD210,000 (2011: USD82,000) lower or USD221,000 (2011: USD52,000) higher if the discount rate used in the discounted cash flow analysis differs by 1% from management’s estimate.
(iii) Indefinite useful life of intellectual property rights
The intellectual property rights are assessed to have indefinite useful lives because over the long-term the Group’s natural sweeteners and flavours are expected to become mass volume ingredients in all foods and beverage categories. Similar to the sugar market, there is no expected end to the useful life of the natural sweeteners and flavours such as stevia. Accordingly, the Directors believe the useful life for intellectual property rights is indefinite. The Directors will continue to reassess the useful life of the intellectual property rights on an annual basis.
7. Investment In Subsidiaries
Notes To The Financial StatementsFor The Financial Year Ended 30 June 2012
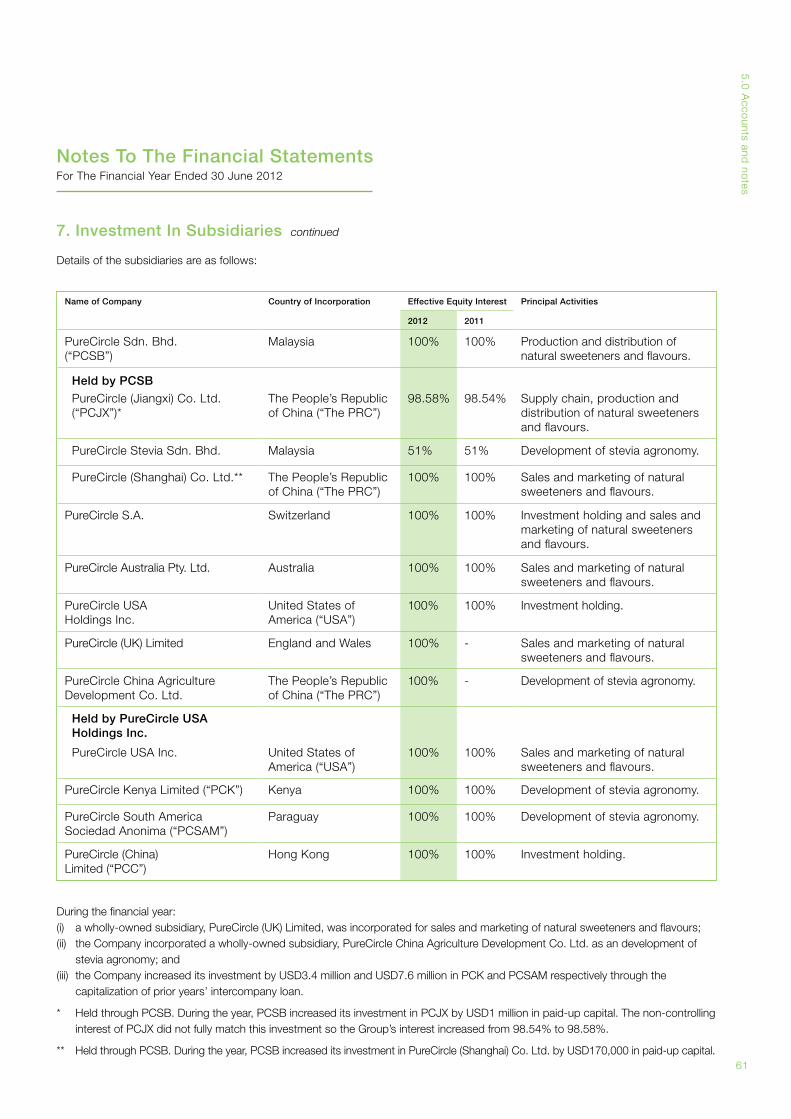
61
5.0
Acco
unts and no
tes
Name of Company Country of Incorporation Effective Equity Interest Principal Activities
2012 2011
PureCircle Sdn. Bhd.(“PCSB”)
Malaysia
100% 100% Production and distribution of natural sweeteners and flavours.
Held by PCSB
PureCircle (Jiangxi) Co. Ltd. (“PCJX”)*
The People’s Republic of China (“The PRC”)
98.58% 98.54% Supply chain, production and distribution of natural sweeteners and flavours.
PureCircle Stevia Sdn. Bhd. Malaysia 51% 51% Development of stevia agronomy.
PureCircle (Shanghai) Co. Ltd.**
The People’s Republic of China (“The PRC”)
100% 100% Sales and marketing of natural sweeteners and flavours.
PureCircle S.A. Switzerland 100% 100% Investment holding and sales and marketing of natural sweeteners and flavours.
PureCircle Australia Pty. Ltd. Australia 100% 100% Sales and marketing of natural sweeteners and flavours.
PureCircle USA Holdings Inc.
United States of America (“USA”)
100% 100% Investment holding.
PureCircle (UK) Limited England and Wales 100% - Sales and marketing of natural sweeteners and flavours.
PureCircle China AgricultureDevelopment Co. Ltd.
The People’s Republic of China (“The PRC”)
100% - Development of stevia agronomy.
Held by PureCircle USA Holdings Inc.
PureCircle USA Inc. United States of America (“USA”)
100% 100% Sales and marketing of natural sweeteners and flavours.
PureCircle Kenya Limited (“PCK”) Kenya 100% 100% Development of stevia agronomy.
PureCircle South America Sociedad Anonima (“PCSAM”)
Paraguay 100% 100% Development of stevia agronomy.
PureCircle (China) Limited (“PCC”)
Hong Kong 100% 100% Investment holding.
Notes To The Financial StatementsFor The Financial Year Ended 30 June 2012
7. Investment In Subsidiaries continued
During the financial year:(i) a wholly-owned subsidiary, PureCircle (UK) Limited, was incorporated for sales and marketing of natural sweeteners and flavours;(ii) the Company incorporated a wholly-owned subsidiary, PureCircle China Agriculture Development Co. Ltd. as an development of
stevia agronomy; and (iii) the Company increased its investment by USD3.4 million and USD7.6 million in PCK and PCSAM respectively through the
capitalization of prior years’ intercompany loan.
* Held through PCSB. During the year, PCSB increased its investment in PCJX by USD1 million in paid-up capital. The non-controlling interest of PCJX did not fully match this investment so the Group’s interest increased from 98.54% to 98.58%.
** Held through PCSB. During the year, PCSB increased its investment in PureCircle (Shanghai) Co. Ltd. by USD170,000 in paid-up capital.
Details of the subsidiaries are as follows:
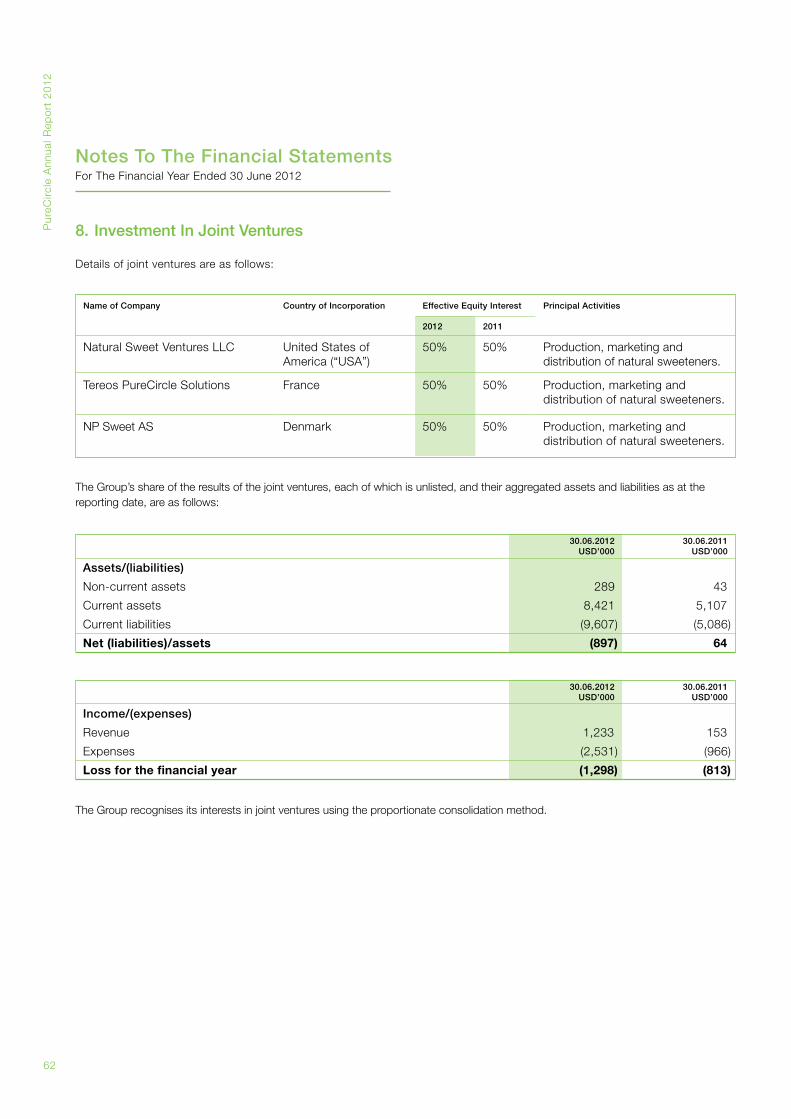
Pur
eCirc
le A
nnua
l Rep
ort
20
12
62
30.06.2012USD’000
30.06.2011USD’000
Assets/(liabilities)
Non-current assets 289 43
Current assets 8,421 5,107
Current liabilities (9,607) (5,086)
Net (liabilities)/assets (897) 64
30.06.2012USD’000
30.06.2011USD’000
Income/(expenses)
Revenue 1,233 153
Expenses (2,531) (966)
Loss for the financial year (1,298) (813)
Name of Company Country of Incorporation Effective Equity Interest Principal Activities
2012 2011
Natural Sweet Ventures LLC United States of America (“USA”)
50% 50% Production, marketing and distribution of natural sweeteners.
Tereos PureCircle Solutions France 50% 50% Production, marketing and distribution of natural sweeteners.
NP Sweet AS Denmark 50% 50% Production, marketing and distribution of natural sweeteners.
8. Investment In Joint Ventures
Details of joint ventures are as follows:
The Group’s share of the results of the joint ventures, each of which is unlisted, and their aggregated assets and liabilities as at the reporting date, are as follows:
The Group recognises its interests in joint ventures using the proportionate consolidation method.
Notes To The Financial StatementsFor The Financial Year Ended 30 June 2012
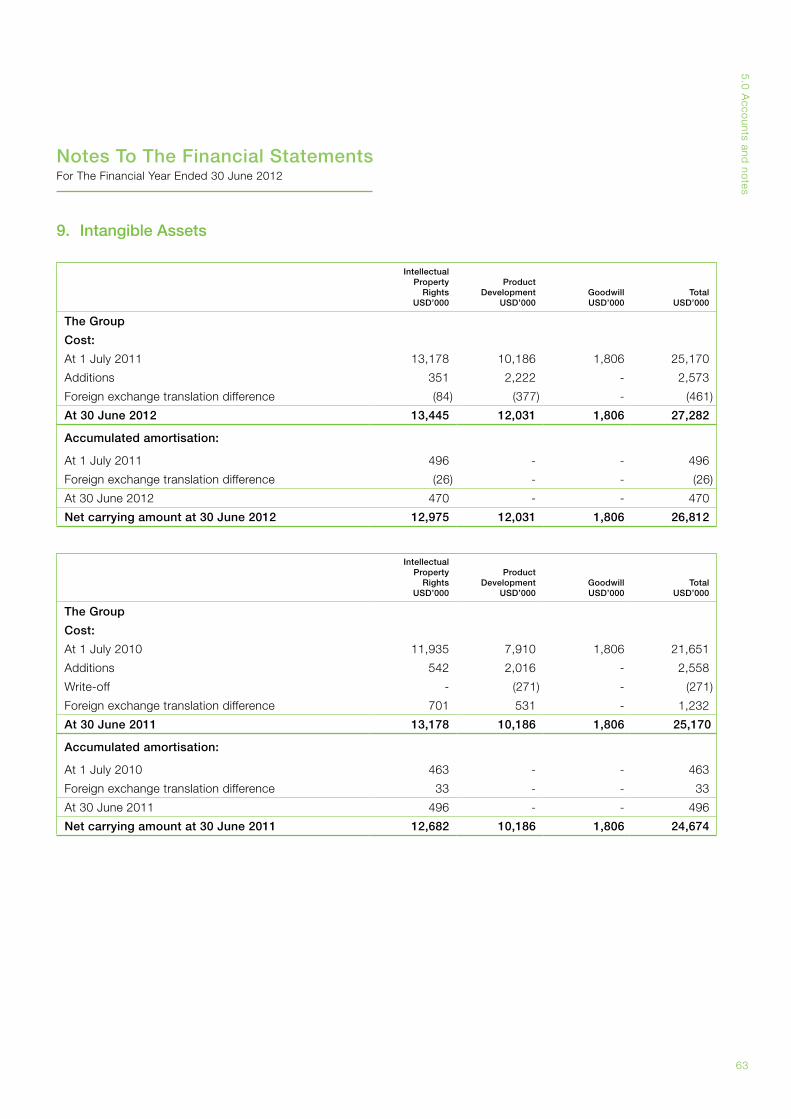
63
5.0
Acco
unts and no
tes
9. Intangible Assets
Intellectual Property
RightsUSD’000
Product Development
USD’000GoodwillUSD’000
TotalUSD’000
The Group
Cost:
At 1 July 2011 13,178 10,186 1,806 25,170
Additions 351 2,222 - 2,573
Foreign exchange translation difference (84) (377) - (461)
At 30 June 2012 13,445 12,031 1,806 27,282
Accumulated amortisation:
At 1 July 2011 496 - - 496
Foreign exchange translation difference (26) - - (26)
At 30 June 2012 470 - - 470
Net carrying amount at 30 June 2012 12,975 12,031 1,806 26,812
Intellectual Property
RightsUSD’000
Product Development
USD’000GoodwillUSD’000
TotalUSD’000
The Group
Cost:
At 1 July 2010 11,935 7,910 1,806 21,651
Additions 542 2,016 - 2,558
Write-off - (271) - (271)
Foreign exchange translation difference 701 531 - 1,232
At 30 June 2011 13,178 10,186 1,806 25,170
Accumulated amortisation:
At 1 July 2010 463 - - 463
Foreign exchange translation difference 33 - - 33
At 30 June 2011 496 - - 496
Net carrying amount at 30 June 2011 12,682 10,186 1,806 24,674
Notes To The Financial StatementsFor The Financial Year Ended 30 June 2012
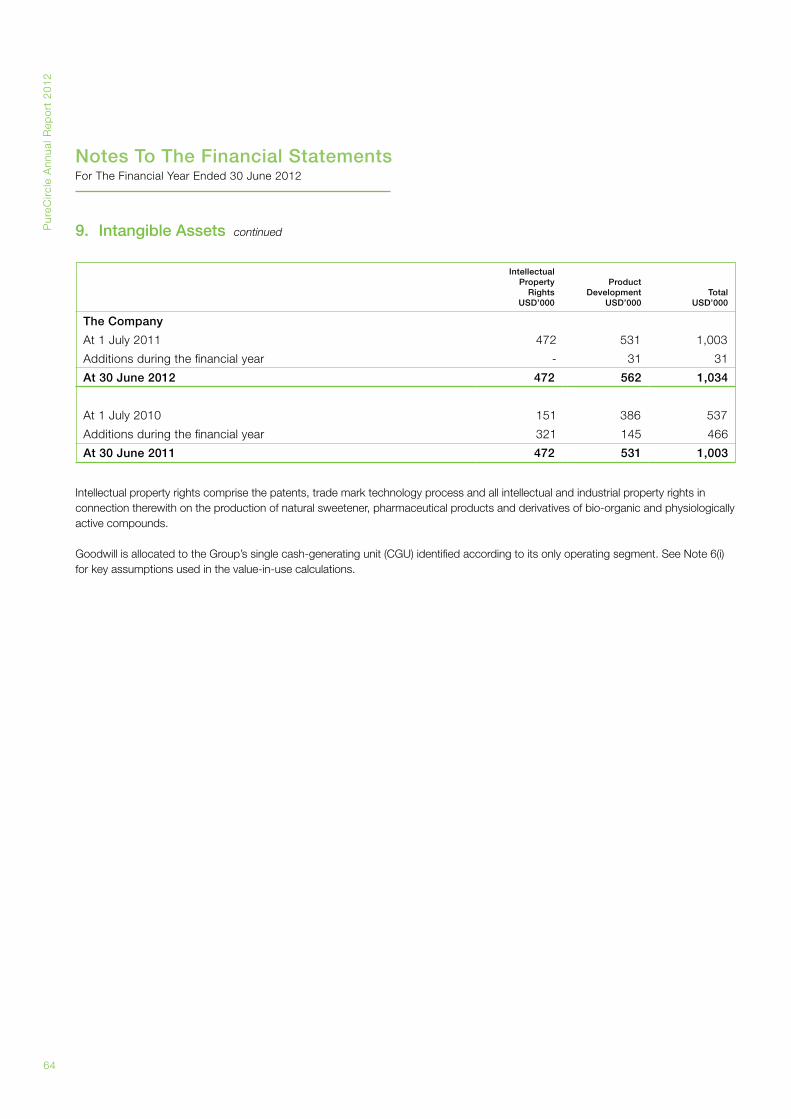
Pur
eCirc
le A
nnua
l Rep
ort
20
12
64
Intellectual property rights comprise the patents, trade mark technology process and all intellectual and industrial property rights in connection therewith on the production of natural sweetener, pharmaceutical products and derivatives of bio-organic and physiologically active compounds.
Goodwill is allocated to the Group’s single cash-generating unit (CGU) identified according to its only operating segment. See Note 6(i) for key assumptions used in the value-in-use calculations.
Notes To The Financial StatementsFor The Financial Year Ended 30 June 2012
9. Intangible Assets continued
Intellectual Property
RightsUSD’000
Product Development
USD’000Total
USD’000
The Company
At 1 July 2011 472 531 1,003
Additions during the financial year - 31 31
At 30 June 2012 472 562 1,034
At 1 July 2010 151 386 537
Additions during the financial year 321 145 466
At 30 June 2011 472 531 1,003
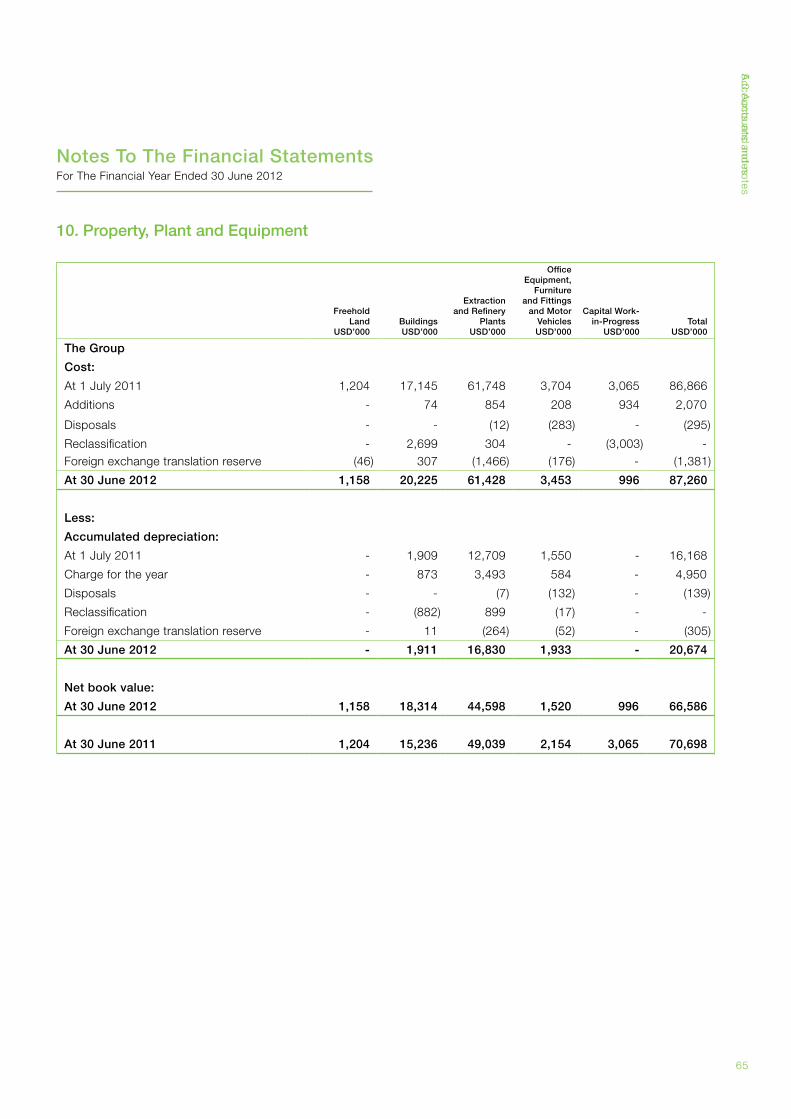
65
5.0
Acco
unts and no
tes
10. Property, Plant and Equipment
Freehold Land
USD’000BuildingsUSD’000
Extraction and Refinery
PlantsUSD’000
Office Equipment,
Furniture and Fittings
and Motor VehiclesUSD’000
Capital Work-in-Progress
USD’000Total
USD’000
The Group
Cost:
At 1 July 2011 1,204 17,145 61,748 3,704 3,065 86,866
Additions - 74 854 208 934 2,070
Disposals - - (12) (283) - (295)
Reclassification - 2,699 304 - (3,003) -Foreign exchange translation reserve (46) 307 (1,466) (176) - (1,381)
At 30 June 2012 1,158 20,225 61,428 3,453 996 87,260
Less:
Accumulated depreciation:
At 1 July 2011 - 1,909 12,709 1,550 - 16,168
Charge for the year - 873 3,493 584 - 4,950
Disposals - - (7) (132) - (139)
Reclassification - (882) 899 (17) - -
Foreign exchange translation reserve - 11 (264) (52) - (305)
At 30 June 2012 - 1,911 16,830 1,933 - 20,674
Net book value:
At 30 June 2012 1,158 18,314 44,598 1,520 996 66,586
At 30 June 2011 1,204 15,236 49,039 2,154 3,065 70,698
Acco
unts and no
tes
Notes To The Financial StatementsFor The Financial Year Ended 30 June 2012
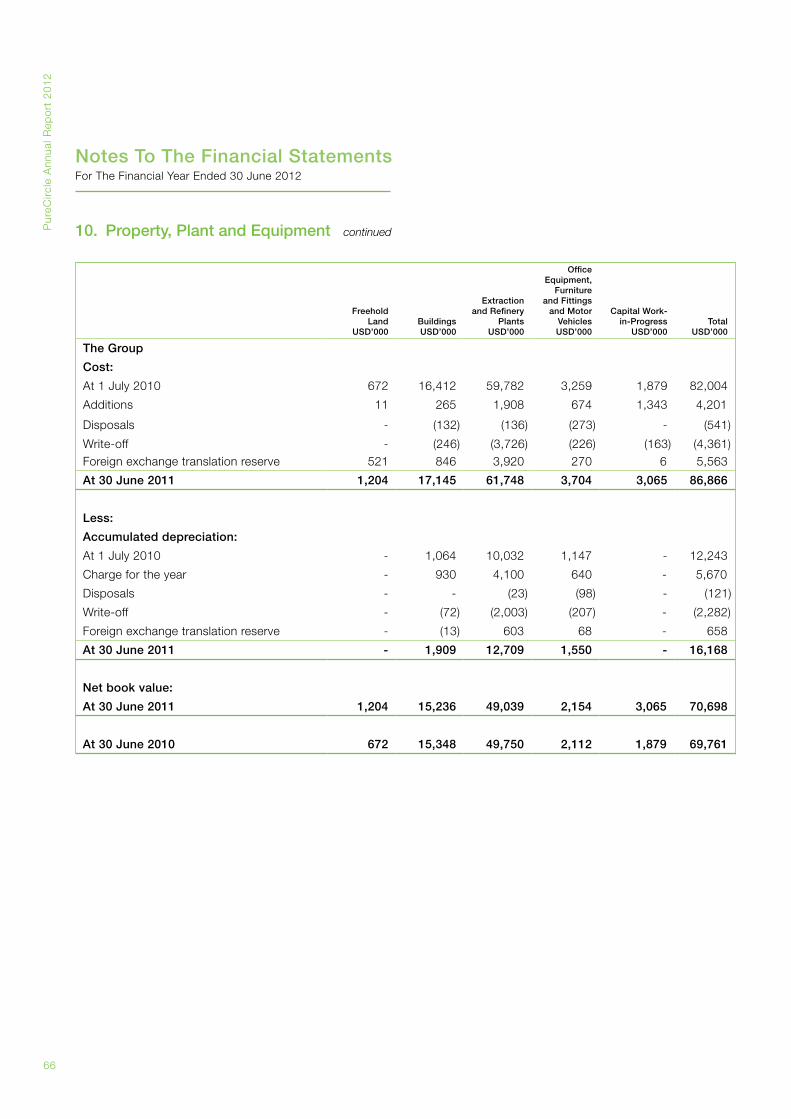
Pur
eCirc
le A
nnua
l Rep
ort
20
12
66
Freehold Land
USD’000BuildingsUSD’000
Extraction and Refinery
PlantsUSD’000
Office Equipment,
Furniture and Fittings
and Motor VehiclesUSD’000
Capital Work-in-Progress
USD’000Total
USD’000
The Group
Cost:
At 1 July 2010 672 16,412 59,782 3,259 1,879 82,004
Additions 11 265 1,908 674 1,343 4,201
Disposals - (132) (136) (273) - (541)
Write-off - (246) (3,726) (226) (163) (4,361)Foreign exchange translation reserve 521 846 3,920 270 6 5,563
At 30 June 2011 1,204 17,145 61,748 3,704 3,065 86,866
Less:
Accumulated depreciation:
At 1 July 2010 - 1,064 10,032 1,147 - 12,243
Charge for the year - 930 4,100 640 - 5,670
Disposals - - (23) (98) - (121)
Write-off - (72) (2,003) (207) - (2,282)
Foreign exchange translation reserve - (13) 603 68 - 658
At 30 June 2011 - 1,909 12,709 1,550 - 16,168
Net book value:
At 30 June 2011 1,204 15,236 49,039 2,154 3,065 70,698
At 30 June 2010 672 15,348 49,750 2,112 1,879 69,761
10. Property, Plant and Equipment continued
Notes To The Financial StatementsFor The Financial Year Ended 30 June 2012
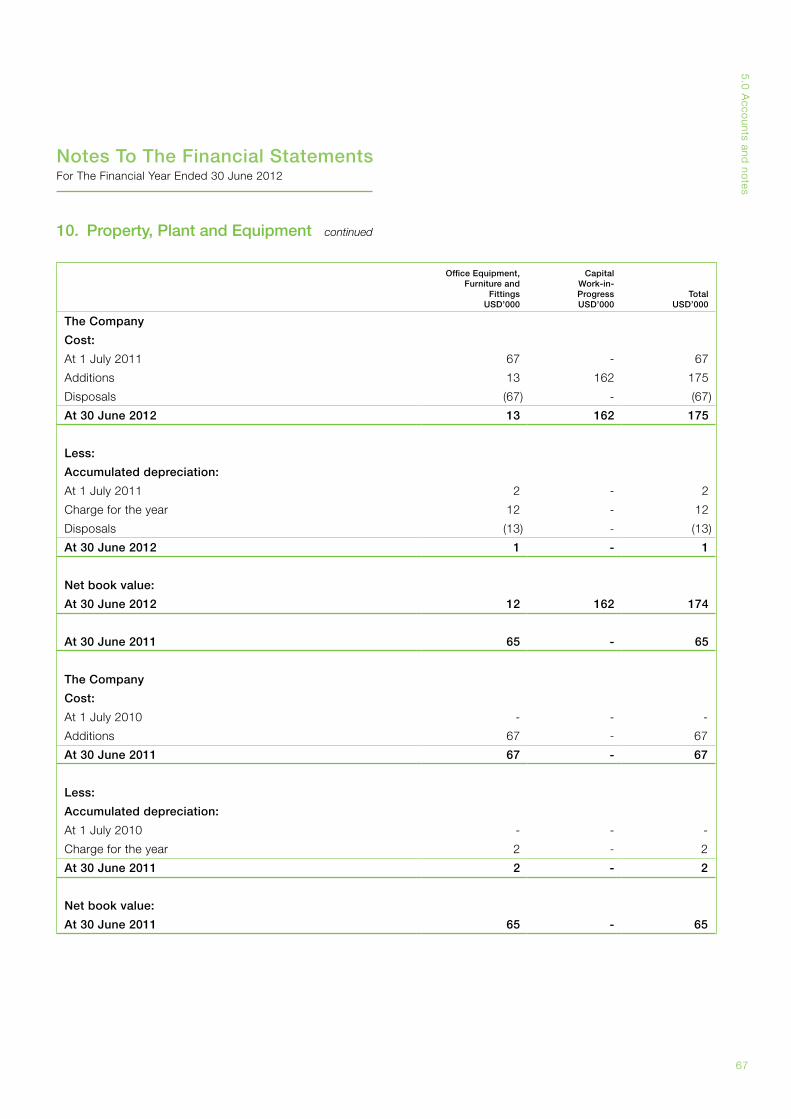
67
5.0
Acco
unts and no
tes
Office Equipment,Furniture and
FittingsUSD’000
CapitalWork-in-ProgressUSD’000
TotalUSD’000
The Company
Cost:
At 1 July 2011 67 - 67
Additions 13 162 175
Disposals (67) - (67)
At 30 June 2012 13 162 175
Less:
Accumulated depreciation:
At 1 July 2011 2 - 2
Charge for the year 12 - 12
Disposals (13) - (13)
At 30 June 2012 1 - 1
Net book value:
At 30 June 2012 12 162 174
At 30 June 2011 65 - 65
The Company
Cost:
At 1 July 2010 - - -
Additions 67 - 67
At 30 June 2011 67 - 67
Less:
Accumulated depreciation:
At 1 July 2010 - - -
Charge for the year 2 - 2
At 30 June 2011 2 - 2
Net book value:
At 30 June 2011 65 - 65
10. Property, Plant and Equipment continued
Notes To The Financial StatementsFor The Financial Year Ended 30 June 2012
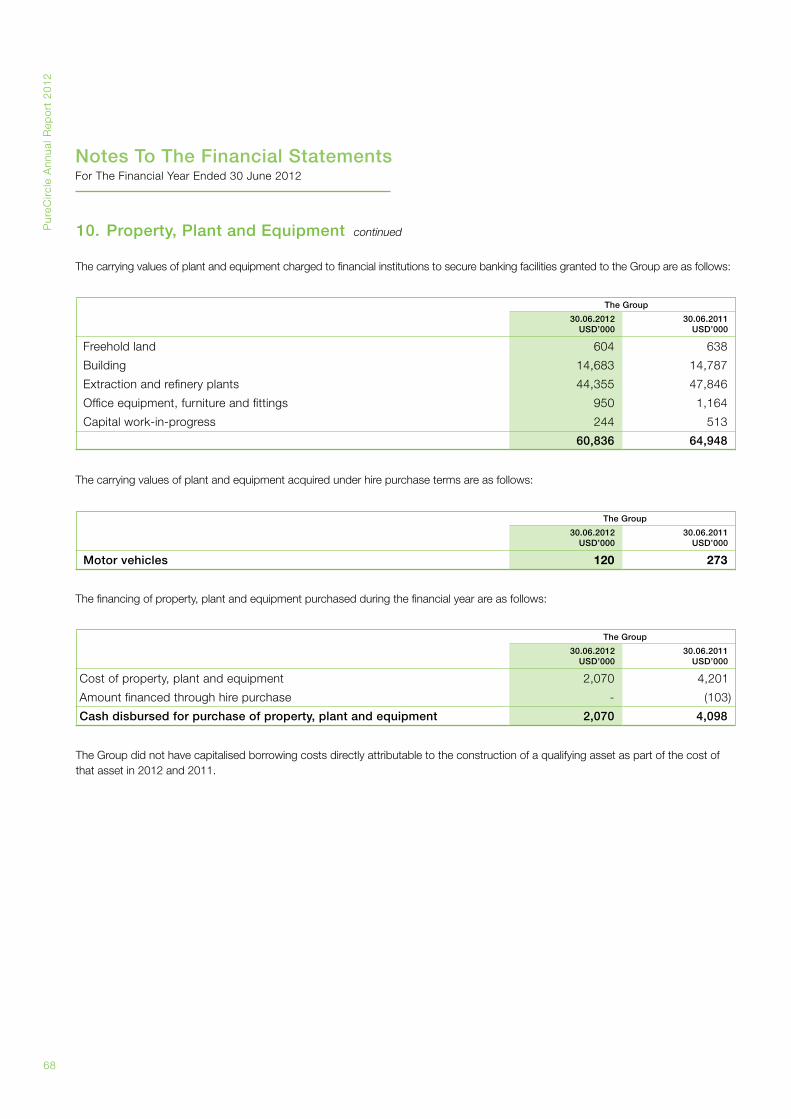
Pur
eCirc
le A
nnua
l Rep
ort
20
12
68
Notes To The Financial StatementsFor The Financial Year Ended 30 June 2012
The Group
30.06.2012USD’000
30.06.2011USD’000
Freehold land 604 638
Building 14,683 14,787
Extraction and refinery plants 44,355 47,846
Office equipment, furniture and fittings 950 1,164
Capital work-in-progress 244 513
60,836 64,948
The Group
30.06.2012USD’000
30.06.2011USD’000
Cost of property, plant and equipment 2,070 4,201
Amount financed through hire purchase - (103)
Cash disbursed for purchase of property, plant and equipment 2,070 4,098
The Group
30.06.2012USD’000
30.06.2011USD’000
Motor vehicles 120 273
The carrying values of plant and equipment charged to financial institutions to secure banking facilities granted to the Group are as follows:
The financing of property, plant and equipment purchased during the financial year are as follows:
The Group did not have capitalised borrowing costs directly attributable to the construction of a qualifying asset as part of the cost of that asset in 2012 and 2011.
The carrying values of plant and equipment acquired under hire purchase terms are as follows:
10. Property, Plant and Equipment continued
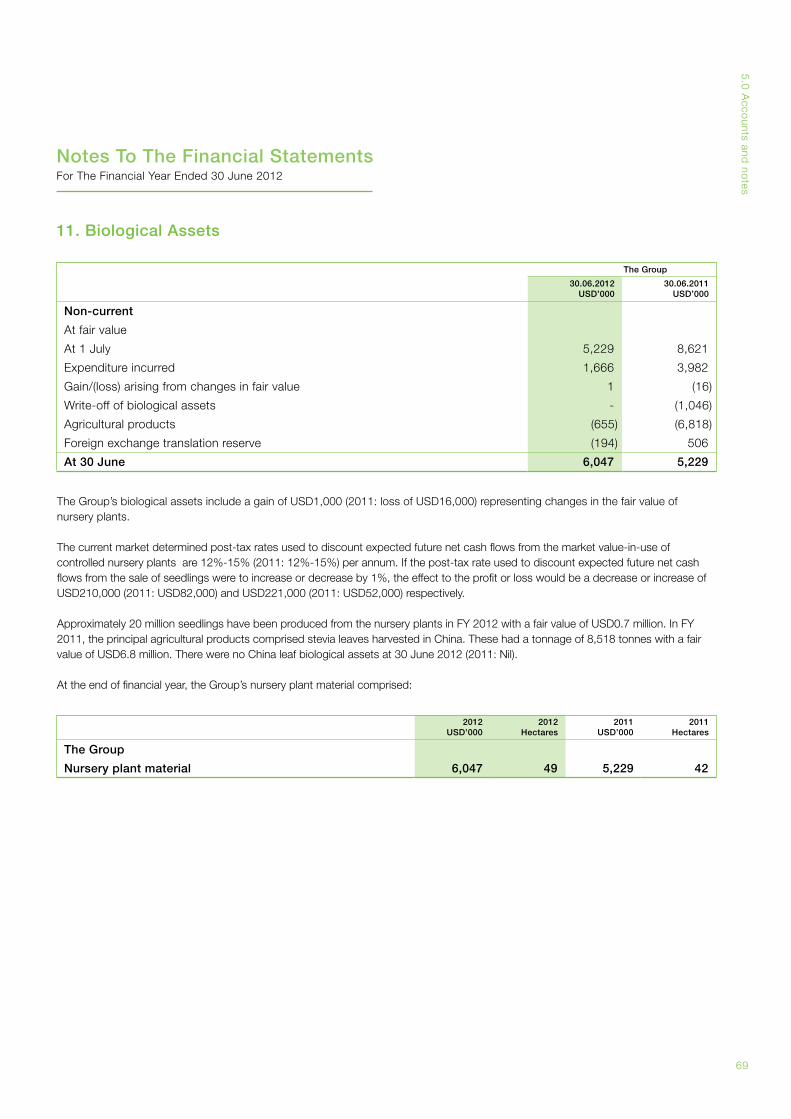
69
5.0
Acco
unts and no
tes
11. Biological Assets
2012USD’000
2012Hectares
2011USD’000
2011Hectares
The Group
Nursery plant material 6,047 49 5,229 42
The Group
30.06.2012USD’000
30.06.2011USD’000
Non-current
At fair value
At 1 July 5,229 8,621
Expenditure incurred 1,666 3,982
Gain/(loss) arising from changes in fair value 1 (16)
Write-off of biological assets - (1,046)
Agricultural products (655) (6,818)
Foreign exchange translation reserve (194) 506
At 30 June 6,047 5,229
The Group’s biological assets include a gain of USD1,000 (2011: loss of USD16,000) representing changes in the fair value of nursery plants.
The current market determined post-tax rates used to discount expected future net cash flows from the market value-in-use of controlled nursery plants are 12%-15% (2011: 12%-15%) per annum. If the post-tax rate used to discount expected future net cash flows from the sale of seedlings were to increase or decrease by 1%, the effect to the profit or loss would be a decrease or increase of USD210,000 (2011: USD82,000) and USD221,000 (2011: USD52,000) respectively.
Approximately 20 million seedlings have been produced from the nursery plants in FY 2012 with a fair value of USD0.7 million. In FY 2011, the principal agricultural products comprised stevia leaves harvested in China. These had a tonnage of 8,518 tonnes with a fair value of USD6.8 million. There were no China leaf biological assets at 30 June 2012 (2011: Nil).
At the end of financial year, the Group’s nursery plant material comprised:
Notes To The Financial StatementsFor The Financial Year Ended 30 June 2012
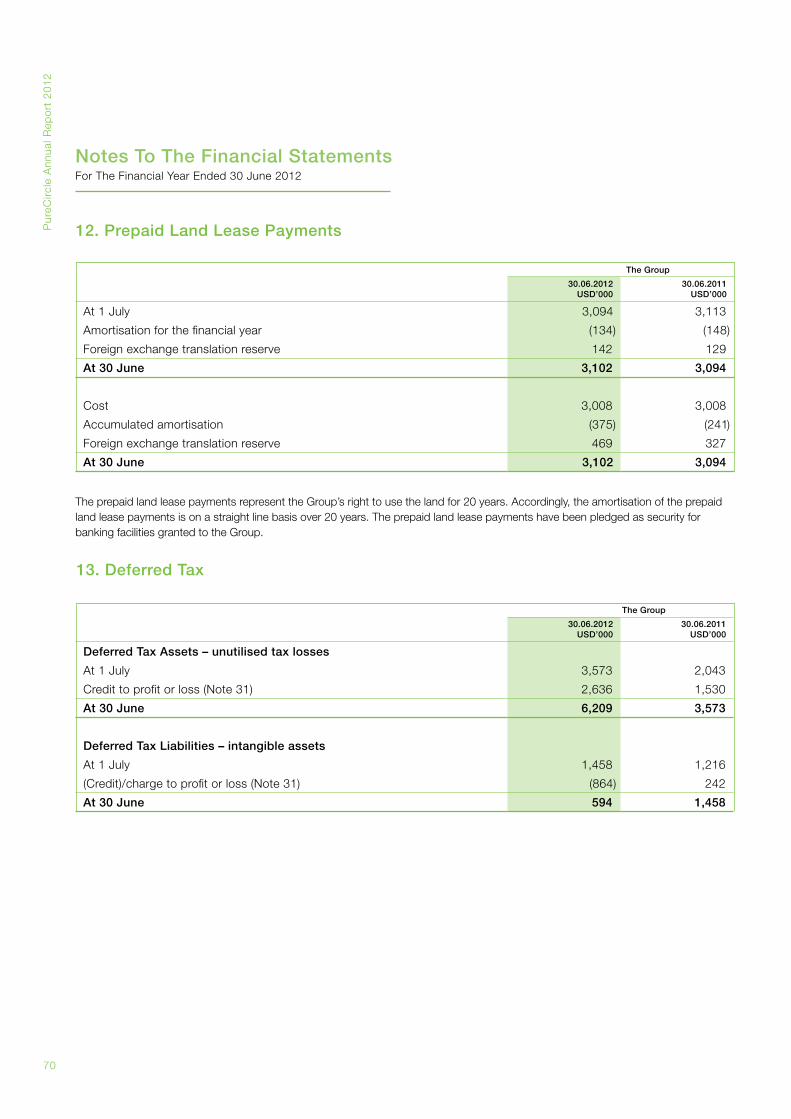
Pur
eCirc
le A
nnua
l Rep
ort
20
12
70
Notes To The Financial StatementsFor The Financial Year Ended 30 June 2012
12. Prepaid Land Lease Payments
The Group
30.06.2012USD’000
30.06.2011USD’000
At 1 July 3,094 3,113
Amortisation for the financial year (134) (148)
Foreign exchange translation reserve 142 129
At 30 June 3,102 3,094
Cost 3,008 3,008
Accumulated amortisation (375) (241)
Foreign exchange translation reserve 469 327
At 30 June 3,102 3,094
The prepaid land lease payments represent the Group’s right to use the land for 20 years. Accordingly, the amortisation of the prepaid land lease payments is on a straight line basis over 20 years. The prepaid land lease payments have been pledged as security for banking facilities granted to the Group.
13. Deferred Tax
The Group
30.06.2012USD’000
30.06.2011USD’000
Deferred Tax Assets – unutilised tax losses
At 1 July 3,573 2,043
Credit to profit or loss (Note 31) 2,636 1,530
At 30 June 6,209 3,573
Deferred Tax Liabilities – intangible assets
At 1 July 1,458 1,216
(Credit)/charge to profit or loss (Note 31) (864) 242
At 30 June 594 1,458
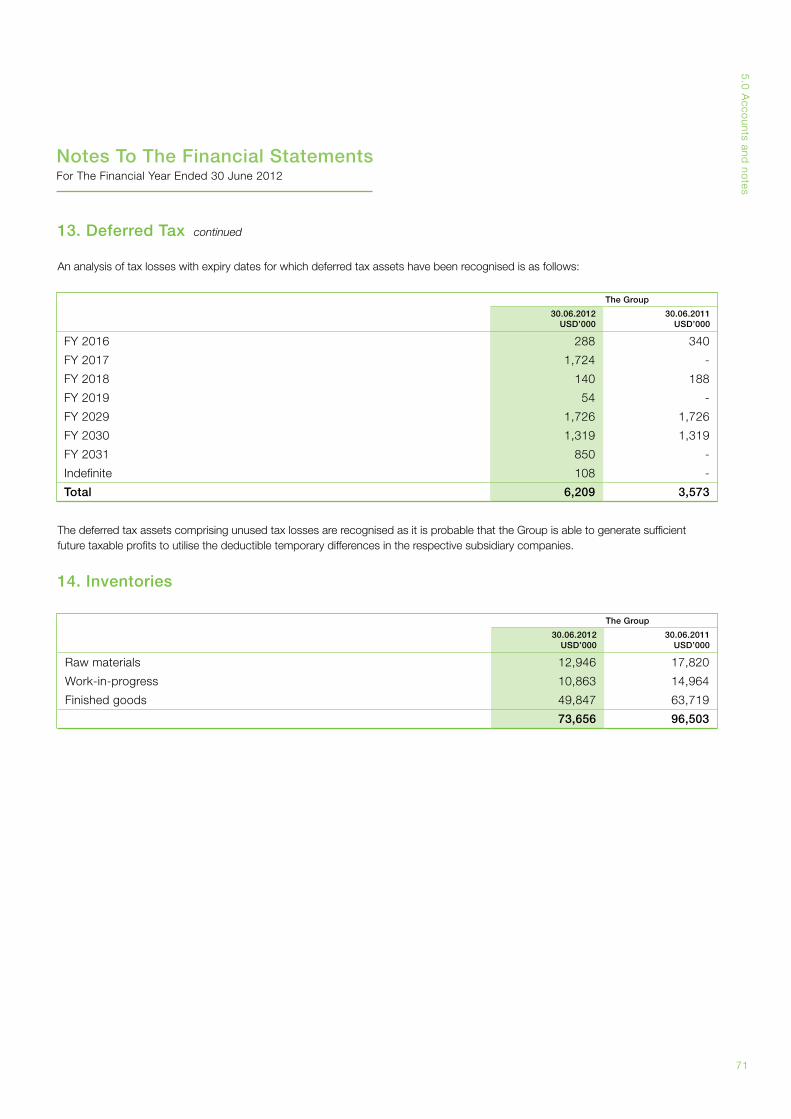
71
5.0
Acco
unts and no
tes
13. Deferred Tax continued
14. Inventories
The Group
30.06.2012USD’000
30.06.2011USD’000
FY 2016 288 340
FY 2017 1,724 -
FY 2018 140 188
FY 2019 54 -
FY 2029 1,726 1,726
FY 2030 1,319 1,319
FY 2031 850 -
Indefinite 108 -
Total 6,209 3,573
The Group
30.06.2012USD’000
30.06.2011USD’000
Raw materials 12,946 17,820
Work-in-progress 10,863 14,964
Finished goods 49,847 63,719
73,656 96,503
An analysis of tax losses with expiry dates for which deferred tax assets have been recognised is as follows:
The deferred tax assets comprising unused tax losses are recognised as it is probable that the Group is able to generate sufficient future taxable profits to utilise the deductible temporary differences in the respective subsidiary companies.
Notes To The Financial StatementsFor The Financial Year Ended 30 June 2012
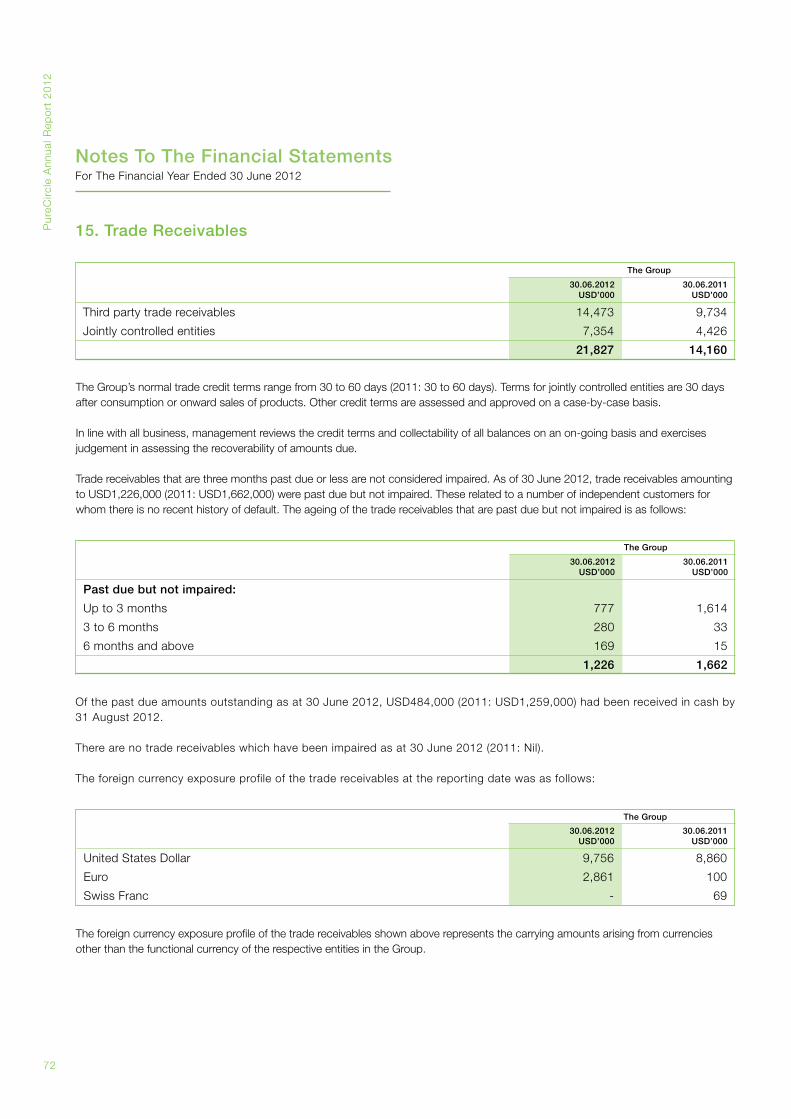
Pur
eCirc
le A
nnua
l Rep
ort
20
12
72
The Group
30.06.2012USD’000
30.06.2011USD’000
United States Dollar 9,756 8,860
Euro 2,861 100
Swiss Franc - 69
Notes To The Financial StatementsFor The Financial Year Ended 30 June 2012
15. Trade Receivables
The Group’s normal trade credit terms range from 30 to 60 days (2011: 30 to 60 days). Terms for jointly controlled entities are 30 days after consumption or onward sales of products. Other credit terms are assessed and approved on a case-by-case basis.
In line with all business, management reviews the credit terms and collectability of all balances on an on-going basis and exercises judgement in assessing the recoverability of amounts due.
Trade receivables that are three months past due or less are not considered impaired. As of 30 June 2012, trade receivables amounting to USD1,226,000 (2011: USD1,662,000) were past due but not impaired. These related to a number of independent customers for whom there is no recent history of default. The ageing of the trade receivables that are past due but not impaired is as follows:
Of the past due amounts outstanding as at 30 June 2012, USD484,000 (2011: USD1,259,000) had been received in cash by 31 August 2012.
There are no trade receivables which have been impaired as at 30 June 2012 (2011: Nil).
The foreign currency exposure profile of the trade receivables at the reporting date was as follows:
The foreign currency exposure profile of the trade receivables shown above represents the carrying amounts arising from currencies other than the functional currency of the respective entities in the Group.
The Group
30.06.2012USD’000
30.06.2011USD’000
Past due but not impaired:
Up to 3 months 777 1,614
3 to 6 months 280 33
6 months and above 169 15
1,226 1,662
The Group
30.06.2012USD’000
30.06.2011USD’000
Third party trade receivables 14,473 9,734
Jointly controlled entities 7,354 4,426
21,827 14,160
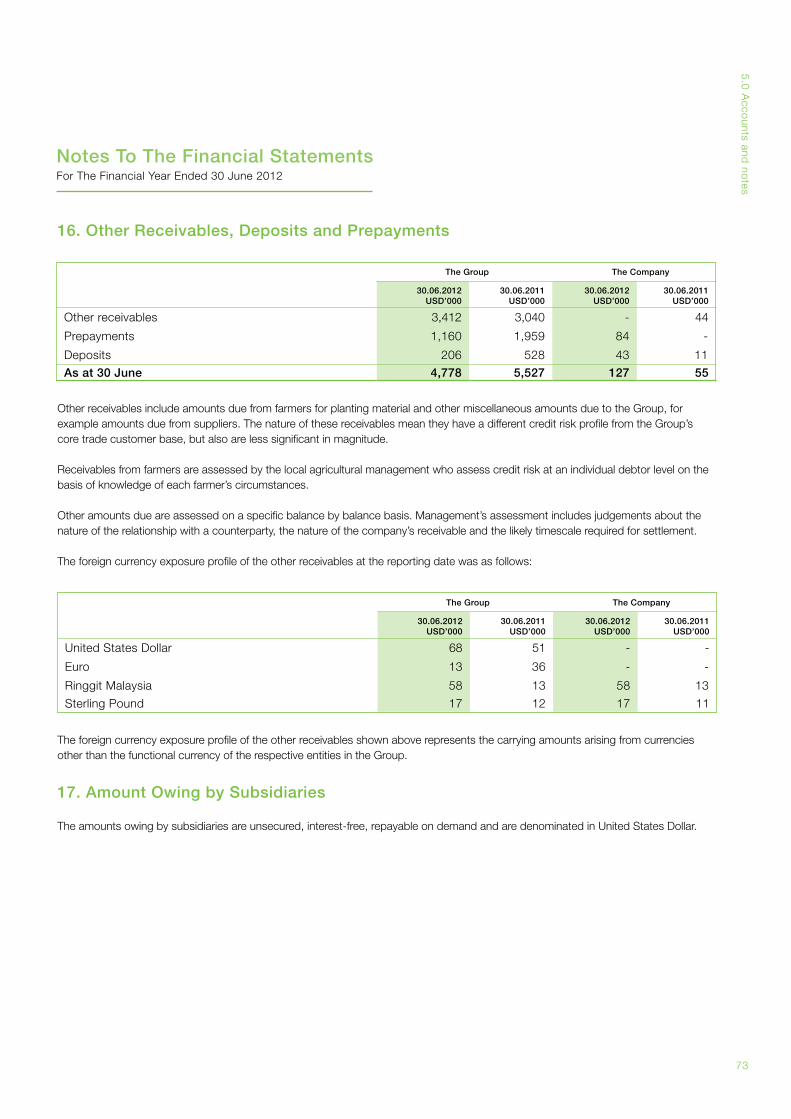
73
5.0
Acco
unts and no
tes
Notes To The Financial StatementsFor The Financial Year Ended 30 June 2012
16. Other Receivables, Deposits and Prepayments
17. Amount Owing by Subsidiaries
Other receivables include amounts due from farmers for planting material and other miscellaneous amounts due to the Group, for example amounts due from suppliers. The nature of these receivables mean they have a different credit risk profile from the Group’s core trade customer base, but also are less significant in magnitude.
Receivables from farmers are assessed by the local agricultural management who assess credit risk at an individual debtor level on the basis of knowledge of each farmer’s circumstances.
Other amounts due are assessed on a specific balance by balance basis. Management’s assessment includes judgements about the nature of the relationship with a counterparty, the nature of the company’s receivable and the likely timescale required for settlement.
The foreign currency exposure profile of the other receivables at the reporting date was as follows:
The amounts owing by subsidiaries are unsecured, interest-free, repayable on demand and are denominated in United States Dollar.
The foreign currency exposure profile of the other receivables shown above represents the carrying amounts arising from currencies other than the functional currency of the respective entities in the Group.
The Group The Company
30.06.2012USD’000
30.06.2011USD’000
30.06.2012USD’000
30.06.2011USD’000
Other receivables 3,412 3,040 - 44
Prepayments 1,160 1,959 84 -
Deposits 206 528 43 11
As at 30 June 4,778 5,527 127 55
The Group The Company
30.06.2012USD’000
30.06.2011USD’000
30.06.2012USD’000
30.06.2011USD’000
United States Dollar 68 51 - -
Euro 13 36 - -
Ringgit Malaysia 58 13 58 13
Sterling Pound 17 12 17 11
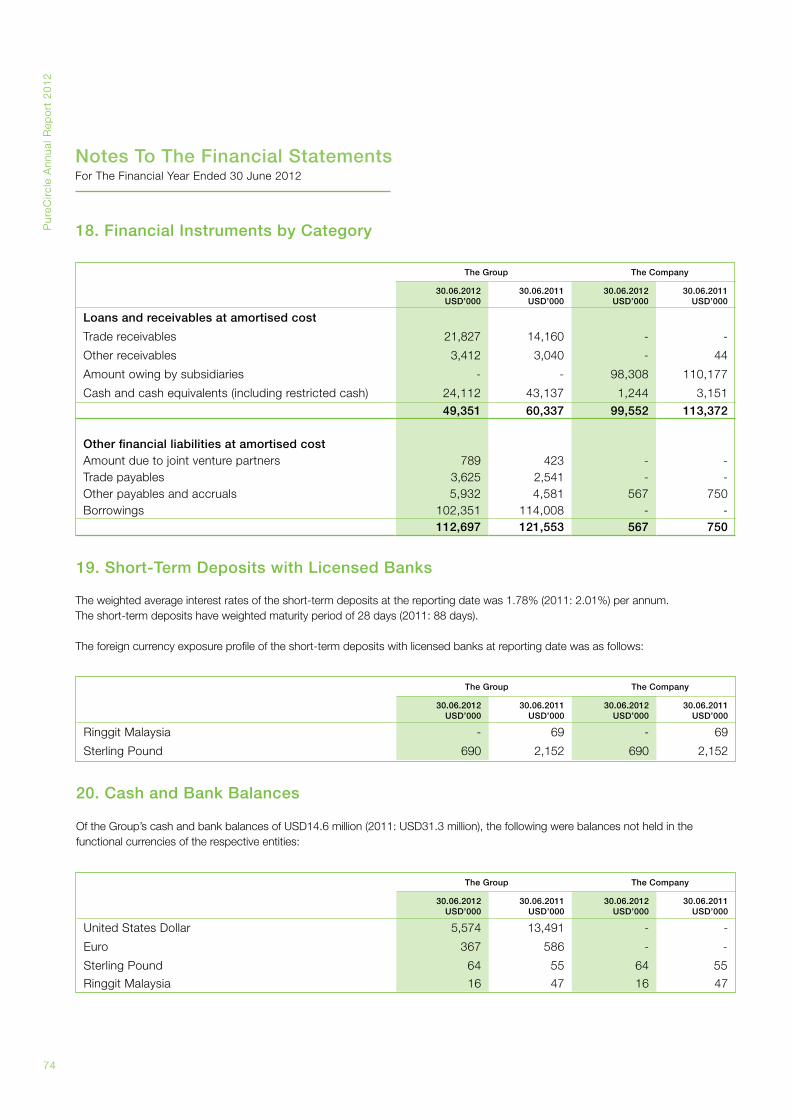
Pur
eCirc
le A
nnua
l Rep
ort
20
12
74
Notes To The Financial StatementsFor The Financial Year Ended 30 June 2012
18. Financial Instruments by Category
19. Short-Term Deposits with Licensed Banks
The weighted average interest rates of the short-term deposits at the reporting date was 1.78% (2011: 2.01%) per annum.The short-term deposits have weighted maturity period of 28 days (2011: 88 days).
The foreign currency exposure profile of the short-term deposits with licensed banks at reporting date was as follows:
The Group The Company
30.06.2012USD’000
30.06.2011USD’000
30.06.2012USD’000
30.06.2011USD’000
Loans and receivables at amortised cost
Trade receivables 21,827 14,160 - -
Other receivables 3,412 3,040 - 44
Amount owing by subsidiaries - - 98,308 110,177
Cash and cash equivalents (including restricted cash) 24,112 43,137 1,244 3,151
49,351 60,337 99,552 113,372
Other financial liabilities at amortised costAmount due to joint venture partners 789 423 - -Trade payables 3,625 2,541 - -Other payables and accruals 5,932 4,581 567 750Borrowings 102,351 114,008 - -
112,697 121,553 567 750
The Group The Company
30.06.2012USD’000
30.06.2011USD’000
30.06.2012USD’000
30.06.2011USD’000
Ringgit Malaysia - 69 - 69
Sterling Pound 690 2,152 690 2,152
20. Cash and Bank Balances
Of the Group’s cash and bank balances of USD14.6 million (2011: USD31.3 million), the following were balances not held in the functional currencies of the respective entities:
The Group The Company
30.06.2012USD’000
30.06.2011USD’000
30.06.2012USD’000
30.06.2011USD’000
United States Dollar 5,574 13,491 - -
Euro 367 586 - -
Sterling Pound 64 55 64 55
Ringgit Malaysia 16 47 16 47
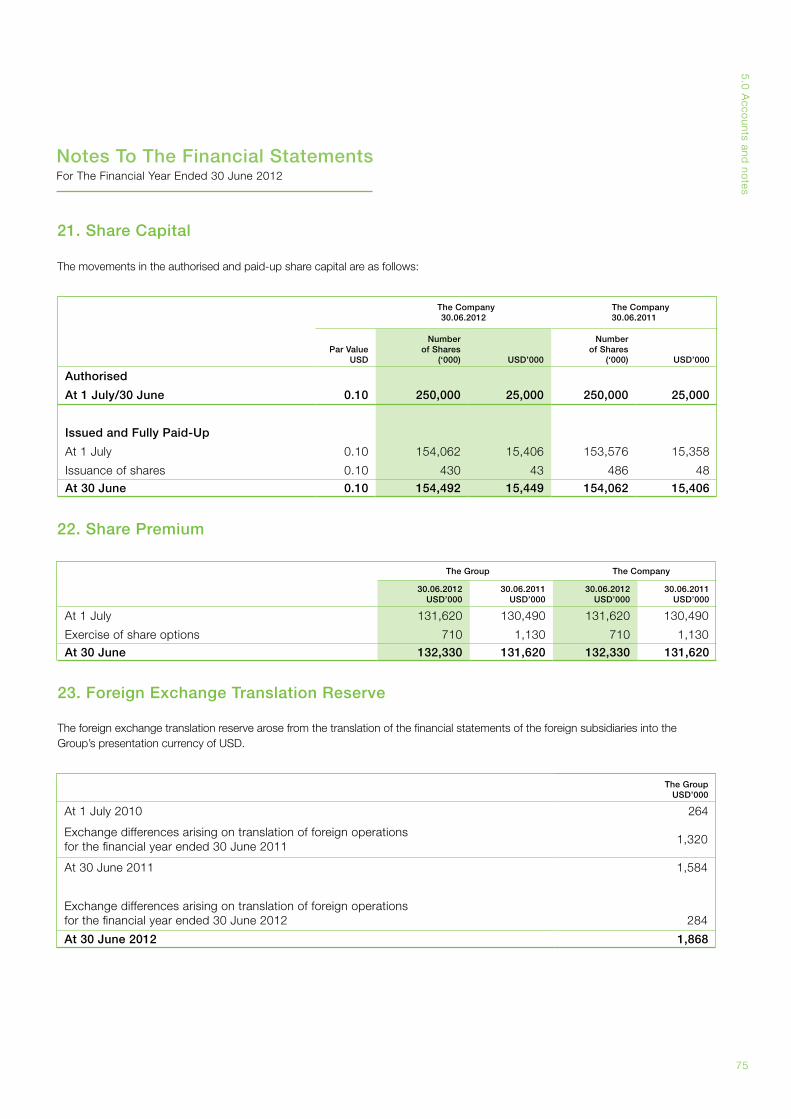
75
5.0
Acco
unts and no
tes
Notes To The Financial StatementsFor The Financial Year Ended 30 June 2012
21. Share Capital
The movements in the authorised and paid-up share capital are as follows:
The Company30.06.2012
The Company30.06.2011
Par ValueUSD
Number of Shares
(‘000) USD’000
Number of Shares
(‘000) USD’000
Authorised
At 1 July/30 June 0.10 250,000 25,000 250,000 25,000
Issued and Fully Paid-Up
At 1 July 0.10 154,062 15,406 153,576 15,358
Issuance of shares 0.10 430 43 486 48
At 30 June 0.10 154,492 15,449 154,062 15,406
22. Share Premium
The Group The Company
30.06.2012USD’000
30.06.2011USD’000
30.06.2012USD’000
30.06.2011USD’000
At 1 July 131,620 130,490 131,620 130,490
Exercise of share options 710 1,130 710 1,130
At 30 June 132,330 131,620 132,330 131,620
23. Foreign Exchange Translation Reserve
The foreign exchange translation reserve arose from the translation of the financial statements of the foreign subsidiaries into the Group’s presentation currency of USD.
The GroupUSD’000
At 1 July 2010 264
Exchange differences arising on translation of foreign operationsfor the financial year ended 30 June 2011
1,320
At 30 June 2011 1,584
Exchange differences arising on translation of foreign operationsfor the financial year ended 30 June 2012 284
At 30 June 2012 1,868
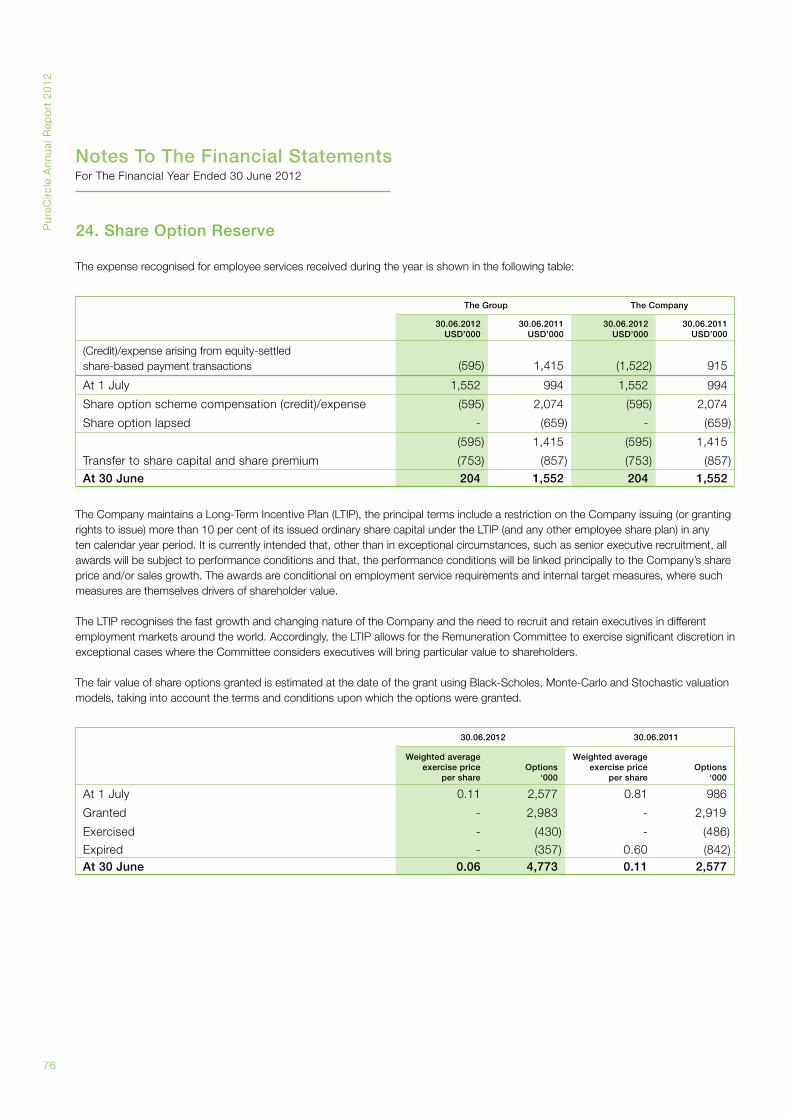
Pur
eCirc
le A
nnua
l Rep
ort
20
12
76
Notes To The Financial StatementsFor The Financial Year Ended 30 June 2012
The expense recognised for employee services received during the year is shown in the following table:
24. Share Option Reserve
The Company maintains a Long-Term Incentive Plan (LTIP), the principal terms include a restriction on the Company issuing (or granting rights to issue) more than 10 per cent of its issued ordinary share capital under the LTIP (and any other employee share plan) in any ten calendar year period. It is currently intended that, other than in exceptional circumstances, such as senior executive recruitment, all awards will be subject to performance conditions and that, the performance conditions will be linked principally to the Company’s share price and/or sales growth. The awards are conditional on employment service requirements and internal target measures, where such measures are themselves drivers of shareholder value.
The LTIP recognises the fast growth and changing nature of the Company and the need to recruit and retain executives in different employment markets around the world. Accordingly, the LTIP allows for the Remuneration Committee to exercise significant discretion in exceptional cases where the Committee considers executives will bring particular value to shareholders.
The fair value of share options granted is estimated at the date of the grant using Black-Scholes, Monte-Carlo and Stochastic valuation models, taking into account the terms and conditions upon which the options were granted.
30.06.2012 30.06.2011
Weighted averageexercise price
per shareOptions
‘000
Weighted averageexercise price
per shareOptions
‘000
At 1 July 0.11 2,577 0.81 986
Granted - 2,983 - 2,919
Exercised - (430) - (486)
Expired - (357) 0.60 (842)At 30 June 0.06 4,773 0.11 2,577
The Group The Company
30.06.2012USD’000
30.06.2011USD’000
30.06.2012USD’000
30.06.2011USD’000
(Credit)/expense arising from equity-settledshare-based payment transactions (595) 1,415 (1,522) 915
At 1 July 1,552 994 1,552 994
Share option scheme compensation (credit)/expense (595) 2,074 (595) 2,074
Share option lapsed - (659) - (659)
(595) 1,415 (595) 1,415
Transfer to share capital and share premium (753) (857) (753) (857)
At 30 June 204 1,552 204 1,552
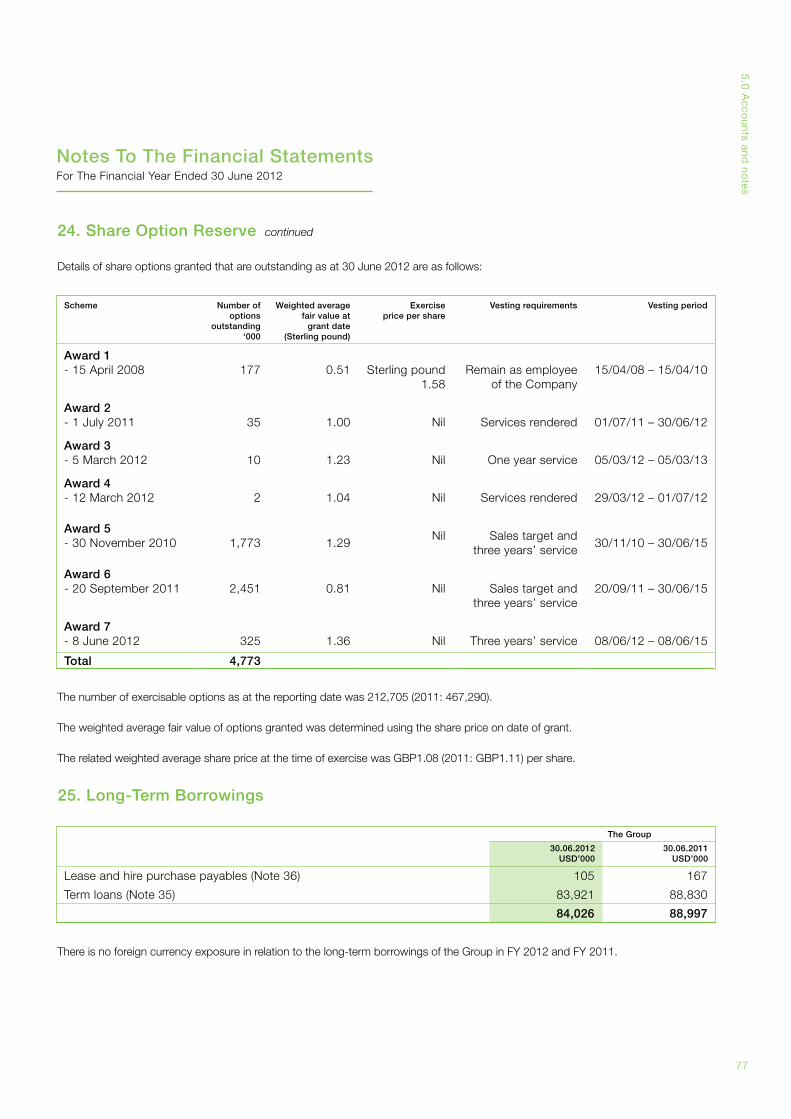
77
5.0
Acco
unts and no
tes
Notes To The Financial StatementsFor The Financial Year Ended 30 June 2012
Details of share options granted that are outstanding as at 30 June 2012 are as follows:
24. Share Option Reserve continued
The number of exercisable options as at the reporting date was 212,705 (2011: 467,290).
The weighted average fair value of options granted was determined using the share price on date of grant.
The related weighted average share price at the time of exercise was GBP1.08 (2011: GBP1.11) per share.
There is no foreign currency exposure in relation to the long-term borrowings of the Group in FY 2012 and FY 2011.
Scheme Number ofoptions
outstanding‘000
Weighted average fair value at
grant date(Sterling pound)
Exercise price per share
Vesting requirements Vesting period
Award 1- 15 April 2008 177 0.51 Sterling pound
1.58 Remain as employee
of the Company15/04/08 – 15/04/10
Award 2- 1 July 2011 35 1.00 Nil Services rendered 01/07/11 – 30/06/12
Award 3- 5 March 2012 10 1.23 Nil One year service 05/03/12 – 05/03/13
Award 4- 12 March 2012 2 1.04 Nil Services rendered 29/03/12 – 01/07/12
Award 5- 30 November 2010 1,773 1.29
Nil Sales target and three years’ service
30/11/10 – 30/06/15
Award 6- 20 September 2011 2,451 0.81 Nil Sales target and
three years’ service20/09/11 – 30/06/15
Award 7- 8 June 2012 325 1.36 Nil Three years’ service 08/06/12 – 08/06/15
Total 4,773
25. Long-Term Borrowings
The Group
30.06.2012USD’000
30.06.2011USD’000
Lease and hire purchase payables (Note 36) 105 167
Term loans (Note 35) 83,921 88,830
84,026 88,997
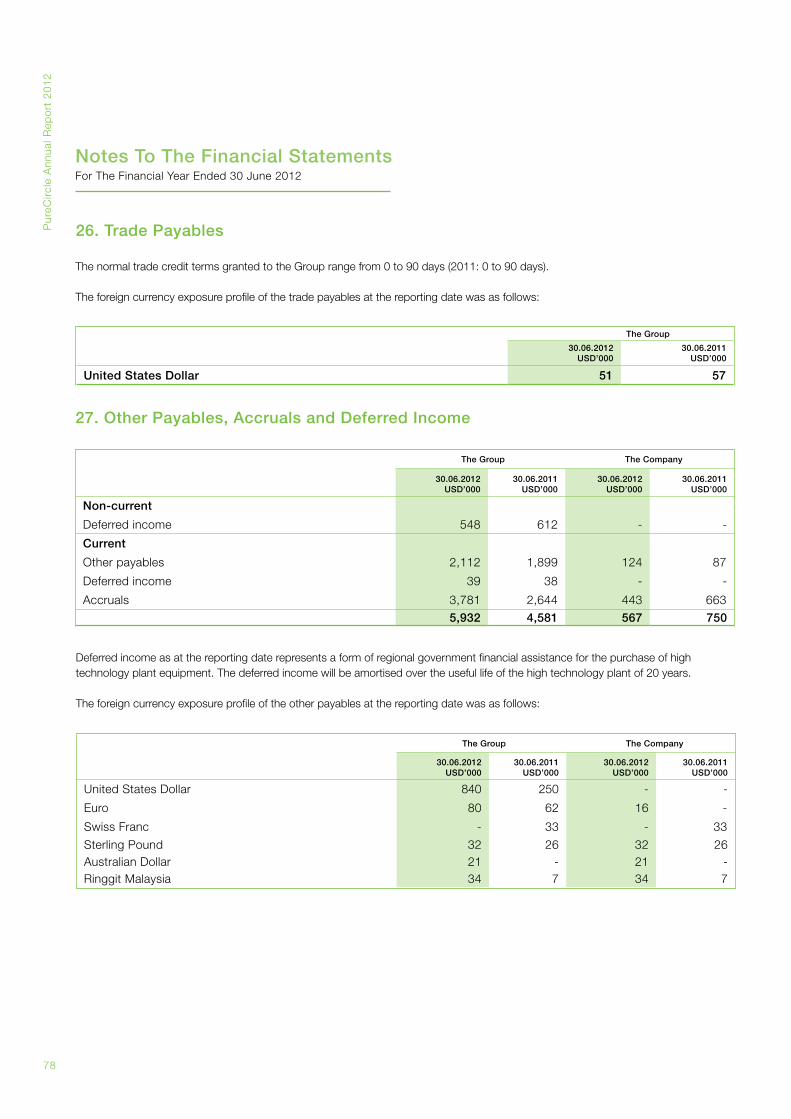
Pur
eCirc
le A
nnua
l Rep
ort
20
12
78
Notes To The Financial StatementsFor The Financial Year Ended 30 June 2012
26. Trade Payables
27. Other Payables, Accruals and Deferred Income
The normal trade credit terms granted to the Group range from 0 to 90 days (2011: 0 to 90 days).
The foreign currency exposure profile of the trade payables at the reporting date was as follows:
The Group
30.06.2012USD’000
30.06.2011USD’000
United States Dollar 51 57
Deferred income as at the reporting date represents a form of regional government financial assistance for the purchase of high technology plant equipment. The deferred income will be amortised over the useful life of the high technology plant of 20 years.
The foreign currency exposure profile of the other payables at the reporting date was as follows:
The Group The Company
30.06.2012USD’000
30.06.2011USD’000
30.06.2012USD’000
30.06.2011USD’000
Non-current
Deferred income 548 612 - -
Current
Other payables 2,112 1,899 124 87
Deferred income 39 38 - -
Accruals 3,781 2,644 443 663
5,932 4,581 567 750
The Group The Company
30.06.2012USD’000
30.06.2011USD’000
30.06.2012USD’000
30.06.2011USD’000
United States Dollar 840 250 - -
Euro 80 62 16 -
Swiss Franc - 33 - 33
Sterling Pound 32 26 32 26Australian Dollar 21 - 21 -Ringgit Malaysia 34 7 34 7
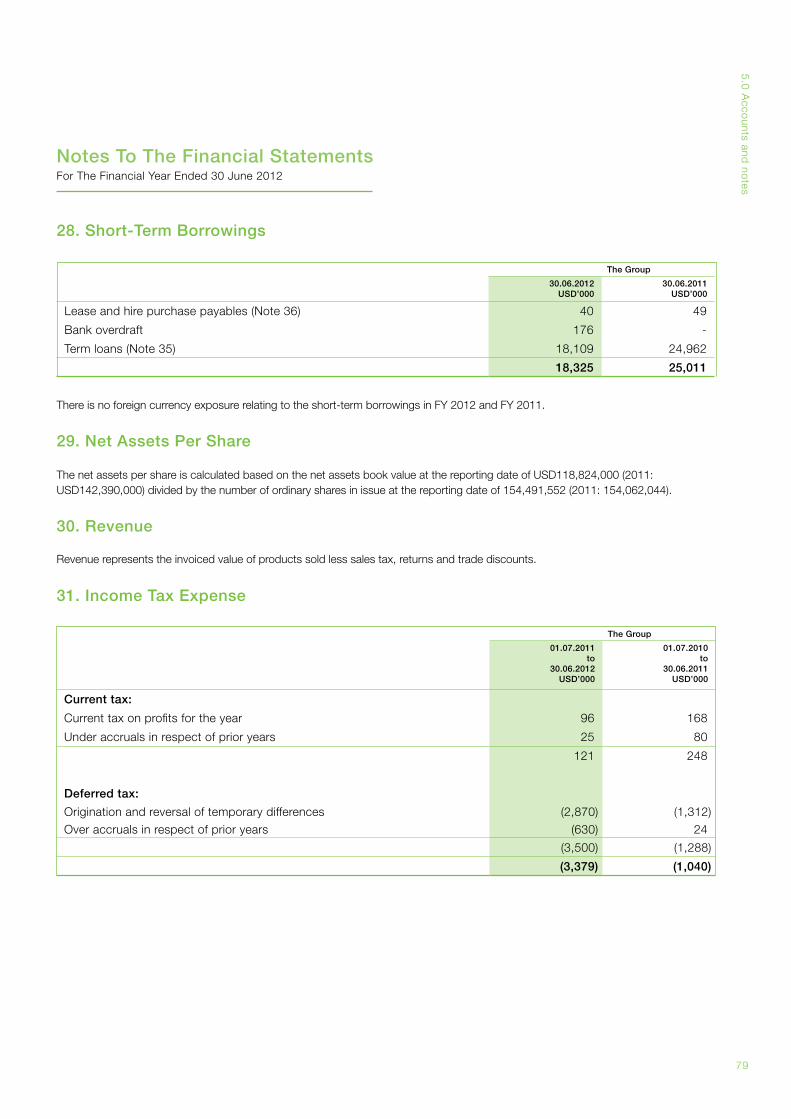
79
5.0
Acco
unts and no
tes
Notes To The Financial StatementsFor The Financial Year Ended 30 June 2012
28. Short-Term Borrowings
29. Net Assets Per Share
30. Revenue
31. Income Tax Expense
The Group
30.06.2012USD’000
30.06.2011USD’000
Lease and hire purchase payables (Note 36) 40 49
Bank overdraft 176 -
Term loans (Note 35) 18,109 24,962
18,325 25,011
The Group
01.07.2011to
30.06.2012USD’000
01.07.2010to
30.06.2011USD’000
Current tax:
Current tax on profits for the year 96 168
Under accruals in respect of prior years 25 80
121 248
Deferred tax:
Origination and reversal of temporary differences (2,870) (1,312) Over accruals in respect of prior years (630) 24
(3,500) (1,288)
(3,379) (1,040)
There is no foreign currency exposure relating to the short-term borrowings in FY 2012 and FY 2011.
The net assets per share is calculated based on the net assets book value at the reporting date of USD118,824,000 (2011: USD142,390,000) divided by the number of ordinary shares in issue at the reporting date of 154,491,552 (2011: 154,062,044).
Revenue represents the invoiced value of products sold less sales tax, returns and trade discounts.
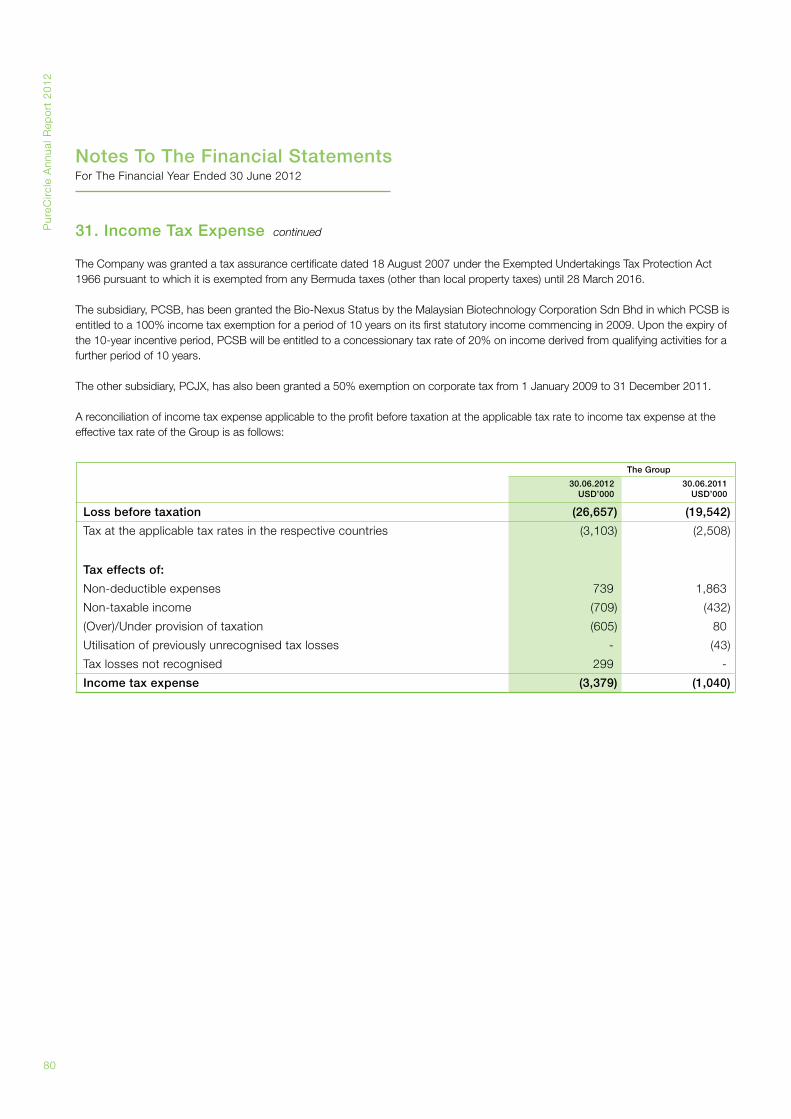
Pur
eCirc
le A
nnua
l Rep
ort
20
12
80
Notes To The Financial StatementsFor The Financial Year Ended 30 June 2012
31. Income Tax Expense continued
The Company was granted a tax assurance certificate dated 18 August 2007 under the Exempted Undertakings Tax Protection Act 1966 pursuant to which it is exempted from any Bermuda taxes (other than local property taxes) until 28 March 2016.
The subsidiary, PCSB, has been granted the Bio-Nexus Status by the Malaysian Biotechnology Corporation Sdn Bhd in which PCSB is entitled to a 100% income tax exemption for a period of 10 years on its first statutory income commencing in 2009. Upon the expiry of the 10-year incentive period, PCSB will be entitled to a concessionary tax rate of 20% on income derived from qualifying activities for a further period of 10 years.
The other subsidiary, PCJX, has also been granted a 50% exemption on corporate tax from 1 January 2009 to 31 December 2011.
A reconciliation of income tax expense applicable to the profit before taxation at the applicable tax rate to income tax expense at the effective tax rate of the Group is as follows:
The Group
30.06.2012USD’000
30.06.2011USD’000
Loss before taxation (26,657) (19,542)
Tax at the applicable tax rates in the respective countries (3,103) (2,508)
Tax effects of:
Non-deductible expenses 739 1,863
Non-taxable income (709) (432)
(Over)/Under provision of taxation (605) 80
Utilisation of previously unrecognised tax losses - (43)
Tax losses not recognised 299 -
Income tax expense (3,379) (1,040)
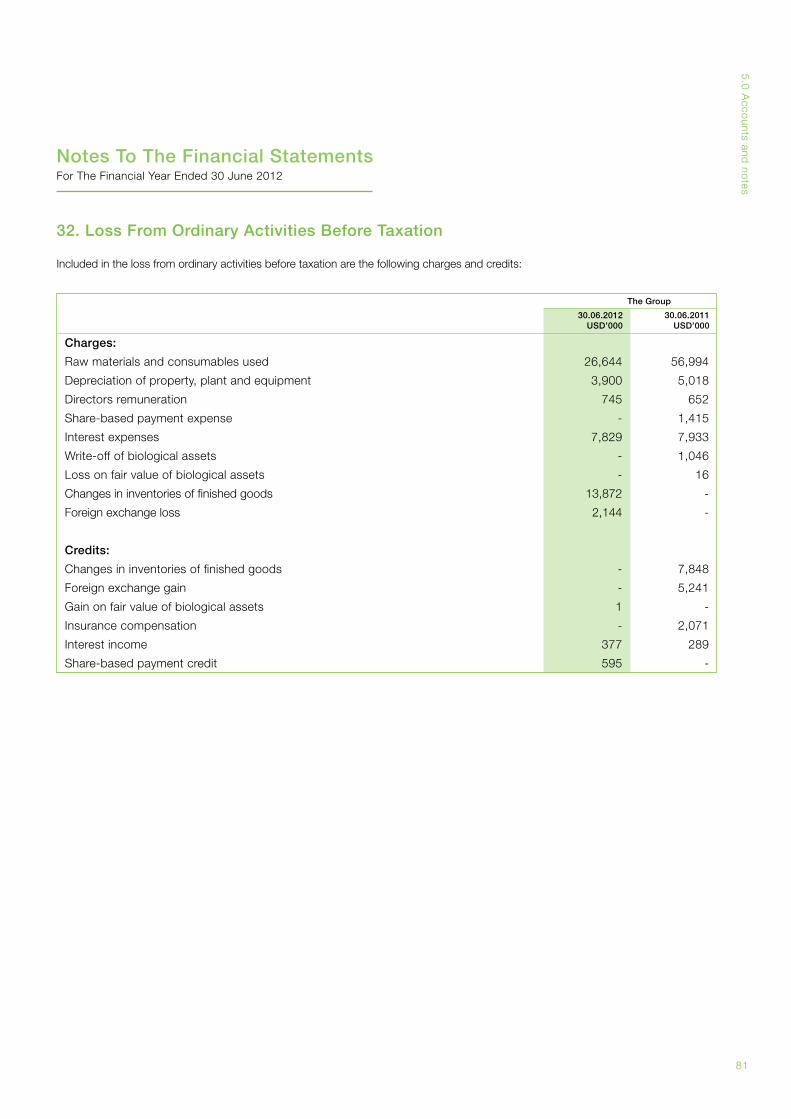
81
5.0
Acco
unts and no
tes
Notes To The Financial StatementsFor The Financial Year Ended 30 June 2012
32. Loss From Ordinary Activities Before Taxation
Included in the loss from ordinary activities before taxation are the following charges and credits:
The Group
30.06.2012USD’000
30.06.2011USD’000
Charges:
Raw materials and consumables used 26,644 56,994
Depreciation of property, plant and equipment 3,900 5,018
Directors remuneration 745 652
Share-based payment expense - 1,415
Interest expenses 7,829 7,933
Write-off of biological assets - 1,046
Loss on fair value of biological assets - 16
Changes in inventories of finished goods 13,872 -
Foreign exchange loss 2,144 -
Credits:
Changes in inventories of finished goods - 7,848
Foreign exchange gain - 5,241
Gain on fair value of biological assets 1 -
Insurance compensation - 2,071
Interest income 377 289
Share-based payment credit 595 -
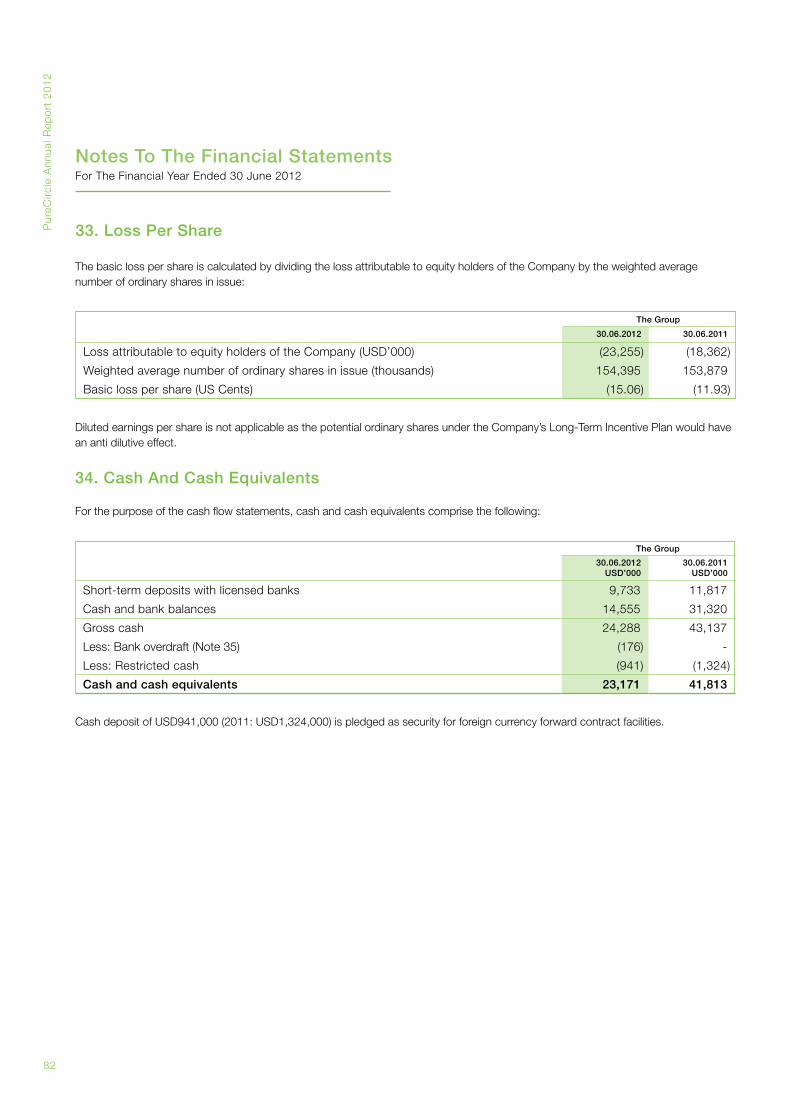
Pur
eCirc
le A
nnua
l Rep
ort
20
12
82
Notes To The Financial StatementsFor The Financial Year Ended 30 June 2012
The Group
30.06.2012 30.06.2011
Loss attributable to equity holders of the Company (USD’000) (23,255) (18,362)
Weighted average number of ordinary shares in issue (thousands) 154,395 153,879
Basic loss per share (US Cents) (15.06) (11.93)
The Group
30.06.2012USD’000
30.06.2011USD’000
Short-term deposits with licensed banks 9,733 11,817
Cash and bank balances 14,555 31,320
Gross cash 24,288 43,137
Less: Bank overdraft (Note 35) (176) -
Less: Restricted cash (941) (1,324)
Cash and cash equivalents 23,171 41,813
34. Cash And Cash Equivalents
For the purpose of the cash flow statements, cash and cash equivalents comprise the following:
Cash deposit of USD941,000 (2011: USD1,324,000) is pledged as security for foreign currency forward contract facilities.
33. Loss Per Share
Diluted earnings per share is not applicable as the potential ordinary shares under the Company’s Long-Term Incentive Plan would have an anti dilutive effect.
The basic loss per share is calculated by dividing the loss attributable to equity holders of the Company by the weighted average number of ordinary shares in issue:
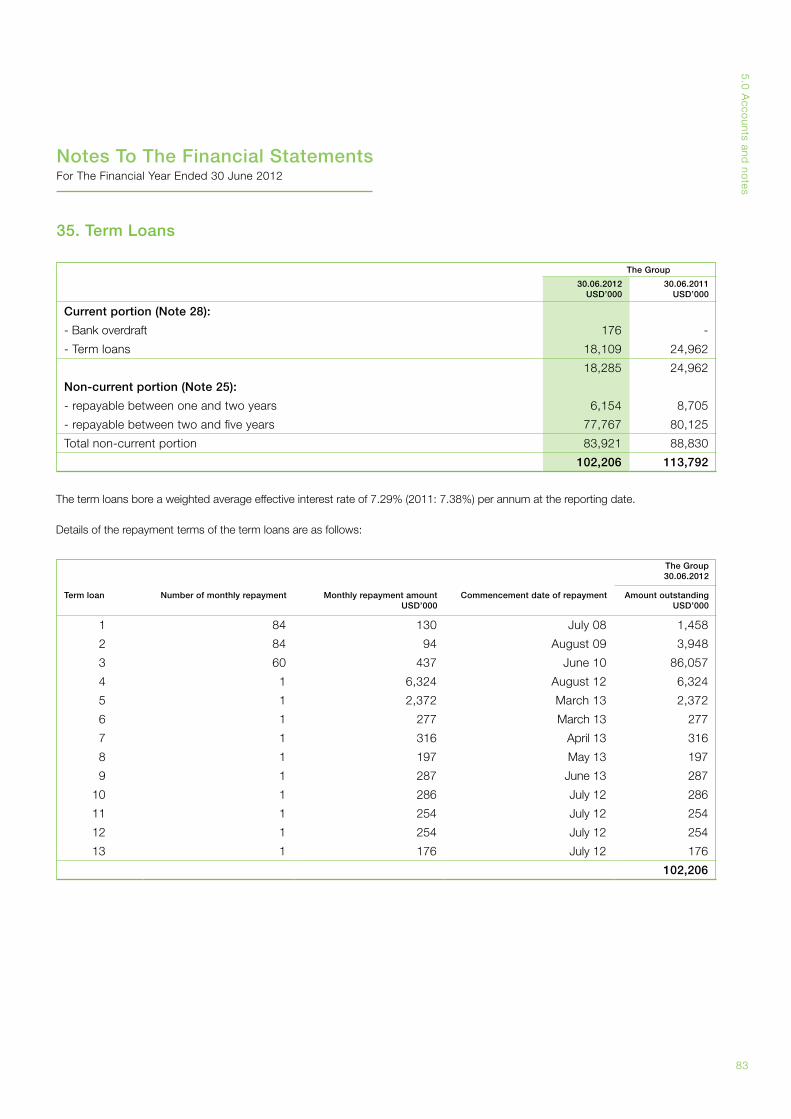
83
5.0
Acco
unts and no
tes
Notes To The Financial StatementsFor The Financial Year Ended 30 June 2012
The Group
30.06.2012USD’000
30.06.2011USD’000
Current portion (Note 28):
- Bank overdraft 176 -
- Term loans 18,109 24,962
18,285 24,962
Non-current portion (Note 25):
- repayable between one and two years 6,154 8,705
- repayable between two and five years 77,767 80,125
Total non-current portion 83,921 88,830
102,206 113,792
The term loans bore a weighted average effective interest rate of 7.29% (2011: 7.38%) per annum at the reporting date.
Details of the repayment terms of the term loans are as follows:
The Group30.06.2012
Term loan Number of monthly repayment Monthly repayment amount USD’000
Commencement date of repayment Amount outstandingUSD’000
1 84 130 July 08 1,458
2 84 94 August 09 3,948
3 60 437 June 10 86,057
4 1 6,324 August 12 6,324
5 1 2,372 March 13 2,372
6 1 277 March 13 277
7 1 316 April 13 316
8 1 197 May 13 197
9 1 287 June 13 287
10 1 286 July 12 286
11 1 254 July 12 254
12 1 254 July 12 254
13 1 176 July 12 176
102,206
35. Term Loans
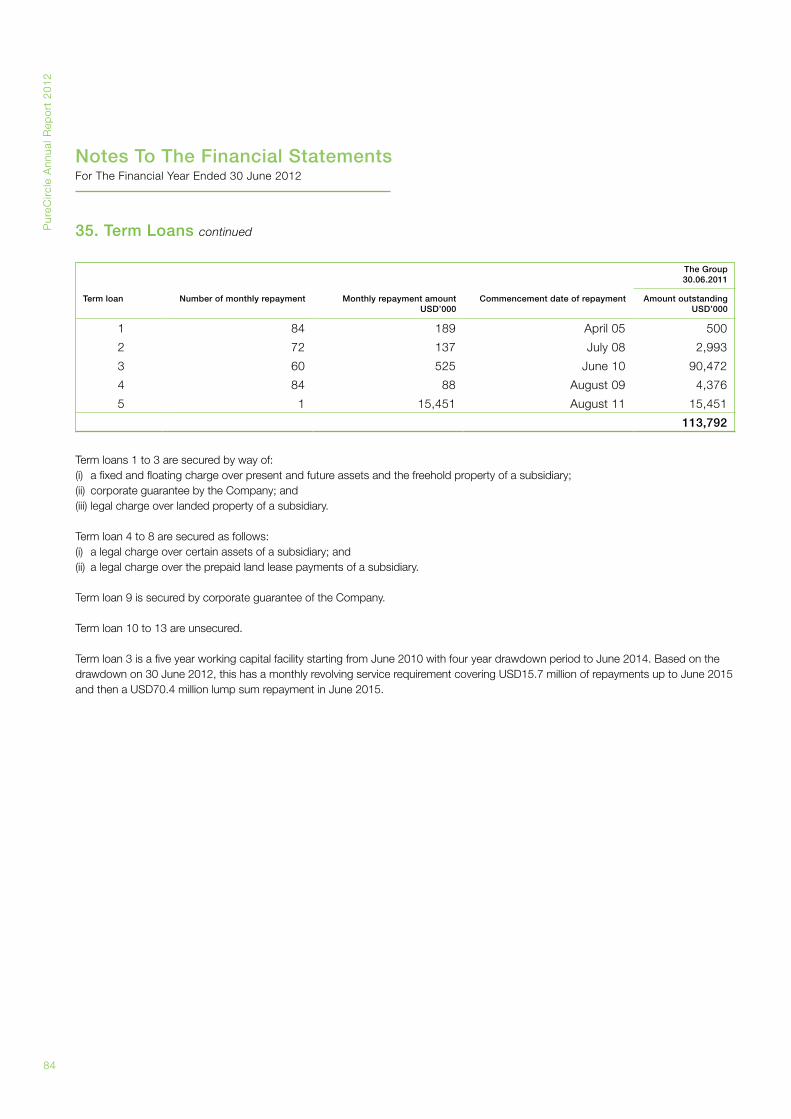
Pur
eCirc
le A
nnua
l Rep
ort
20
12
84
Notes To The Financial StatementsFor The Financial Year Ended 30 June 2012
Term loans 1 to 3 are secured by way of:(i) a fixed and floating charge over present and future assets and the freehold property of a subsidiary; (ii) corporate guarantee by the Company; and(iii) legal charge over landed property of a subsidiary.
Term loan 4 to 8 are secured as follows:(i) a legal charge over certain assets of a subsidiary; and(ii) a legal charge over the prepaid land lease payments of a subsidiary.
Term loan 9 is secured by corporate guarantee of the Company.
Term loan 10 to 13 are unsecured.
Term loan 3 is a five year working capital facility starting from June 2010 with four year drawdown period to June 2014. Based on the drawdown on 30 June 2012, this has a monthly revolving service requirement covering USD15.7 million of repayments up to June 2015 and then a USD70.4 million lump sum repayment in June 2015.
The Group30.06.2011
Term loan Number of monthly repayment Monthly repayment amount USD’000
Commencement date of repayment Amount outstandingUSD’000
1 84 189 April 05 500
2 72 137 July 08 2,993
3 60 525 June 10 90,472
4 84 88 August 09 4,376
5 1 15,451 August 11 15,451
113,792
35. Term Loans continued
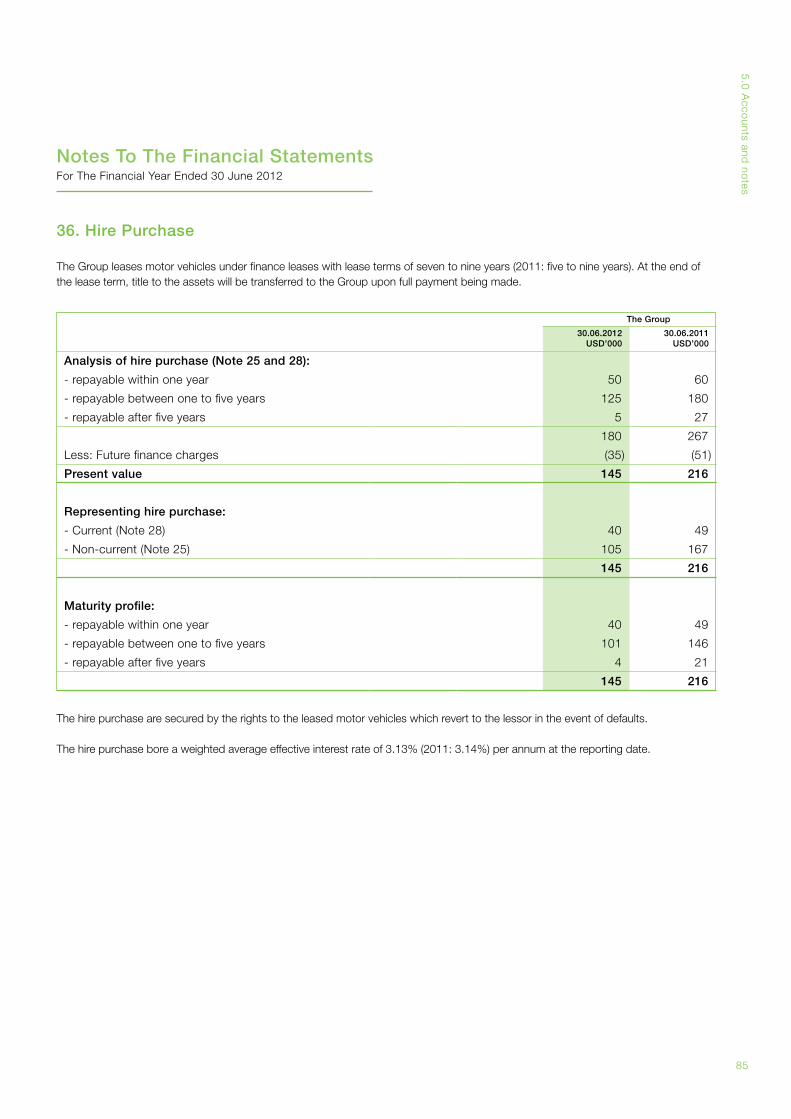
85
5.0
Acco
unts and no
tes
Notes To The Financial StatementsFor The Financial Year Ended 30 June 2012
36. Hire Purchase
The Group
30.06.2012USD’000
30.06.2011USD’000
Analysis of hire purchase (Note 25 and 28):
- repayable within one year 50 60
- repayable between one to five years 125 180
- repayable after five years 5 27
180 267
Less: Future finance charges (35) (51)
Present value 145 216
Representing hire purchase:
- Current (Note 28) 40 49
- Non-current (Note 25) 105 167
145 216
Maturity profile:
- repayable within one year 40 49
- repayable between one to five years 101 146
- repayable after five years 4 21
145 216
The Group leases motor vehicles under finance leases with lease terms of seven to nine years (2011: five to nine years). At the end of the lease term, title to the assets will be transferred to the Group upon full payment being made.
The hire purchase are secured by the rights to the leased motor vehicles which revert to the lessor in the event of defaults.
The hire purchase bore a weighted average effective interest rate of 3.13% (2011: 3.14%) per annum at the reporting date.
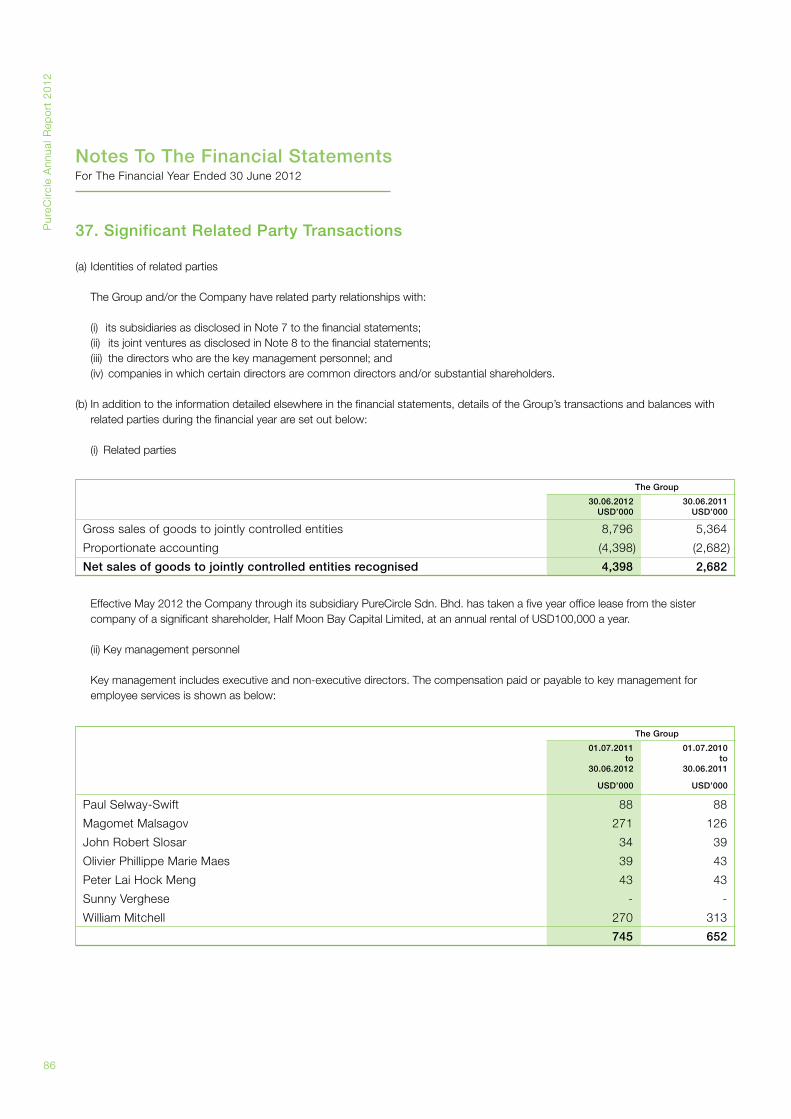
Pur
eCirc
le A
nnua
l Rep
ort
20
12
86
Notes To The Financial StatementsFor The Financial Year Ended 30 June 2012
37. Significant Related Party Transactions
(a) Identities of related parties
The Group and/or the Company have related party relationships with:
(i) its subsidiaries as disclosed in Note 7 to the financial statements; (ii) its joint ventures as disclosed in Note 8 to the financial statements; (iii) the directors who are the key management personnel; and (iv) companies in which certain directors are common directors and/or substantial shareholders.
(b) In addition to the information detailed elsewhere in the financial statements, details of the Group’s transactions and balances with related parties during the financial year are set out below:
(i) Related parties
The Group
30.06.2012USD’000
30.06.2011USD’000
Gross sales of goods to jointly controlled entities 8,796 5,364
Proportionate accounting (4,398) (2,682)
Net sales of goods to jointly controlled entities recognised 4,398 2,682
Effective May 2012 the Company through its subsidiary PureCircle Sdn. Bhd. has taken a five year office lease from the sister company of a significant shareholder, Half Moon Bay Capital Limited, at an annual rental of USD100,000 a year.
(ii) Key management personnel
Key management includes executive and non-executive directors. The compensation paid or payable to key management for employee services is shown as below:
The Group
01.07.2011to
30.06.2012
01.07.2010to
30.06.2011
USD’000 USD’000
Paul Selway-Swift 88 88
Magomet Malsagov 271 126
John Robert Slosar 34 39
Olivier Phillippe Marie Maes 39 43
Peter Lai Hock Meng 43 43
Sunny Verghese - -
William Mitchell 270 313
745 652
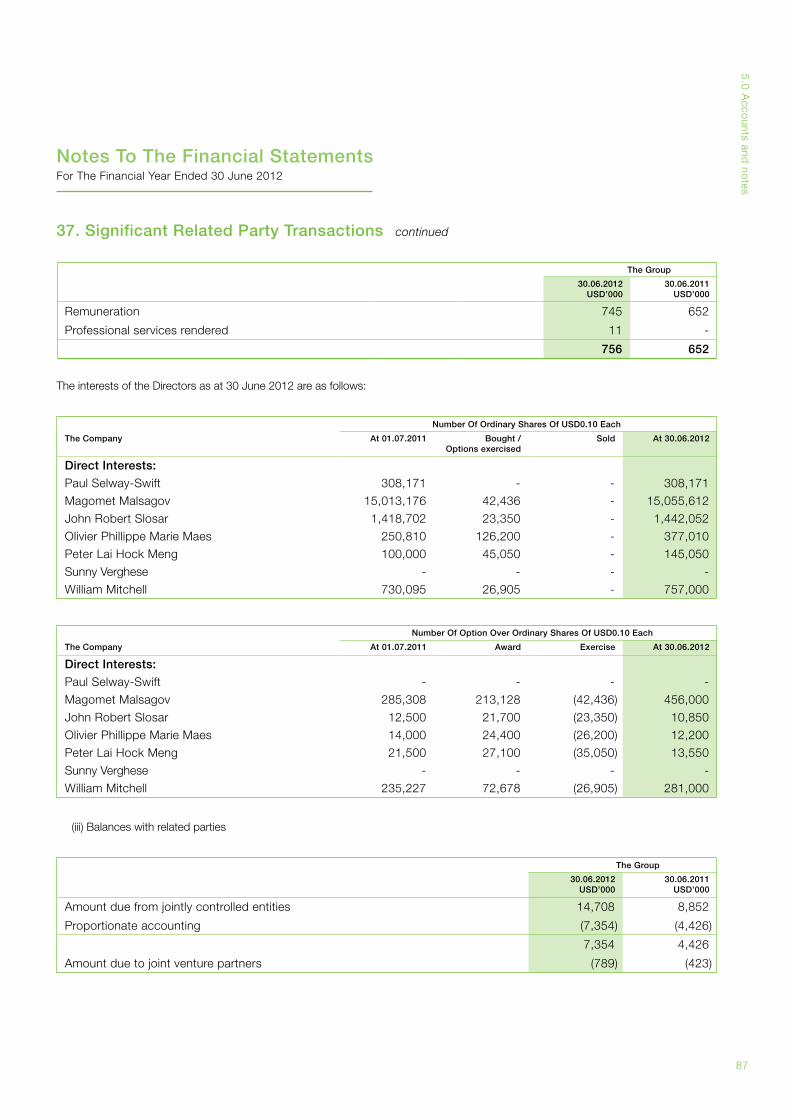
87
5.0
Acco
unts and no
tes
Notes To The Financial StatementsFor The Financial Year Ended 30 June 2012
37. Significant Related Party Transactions continued
The Group
30.06.2012USD’000
30.06.2011USD’000
Remuneration 745 652
Professional services rendered 11 -
756 652
Number Of Ordinary Shares Of USD0.10 Each
The Company At 01.07.2011 Bought / Options exercised
Sold At 30.06.2012
Direct Interests:
Paul Selway-Swift 308,171 - - 308,171
Magomet Malsagov 15,013,176 42,436 - 15,055,612
John Robert Slosar 1,418,702 23,350 - 1,442,052
Olivier Phillippe Marie Maes 250,810 126,200 - 377,010
Peter Lai Hock Meng 100,000 45,050 - 145,050
Sunny Verghese - - - -
William Mitchell 730,095 26,905 - 757,000
Number Of Option Over Ordinary Shares Of USD0.10 Each
The Company At 01.07.2011 Award Exercise At 30.06.2012
Direct Interests:
Paul Selway-Swift - - - -
Magomet Malsagov 285,308 213,128 (42,436) 456,000
John Robert Slosar 12,500 21,700 (23,350) 10,850
Olivier Phillippe Marie Maes 14,000 24,400 (26,200) 12,200
Peter Lai Hock Meng 21,500 27,100 (35,050) 13,550
Sunny Verghese - - - -
William Mitchell 235,227 72,678 (26,905) 281,000
The interests of the Directors as at 30 June 2012 are as follows:
The Group
30.06.2012USD’000
30.06.2011USD’000
Amount due from jointly controlled entities 14,708 8,852
Proportionate accounting (7,354) (4,426)
7,354 4,426
Amount due to joint venture partners (789) (423)
(iii) Balances with related parties
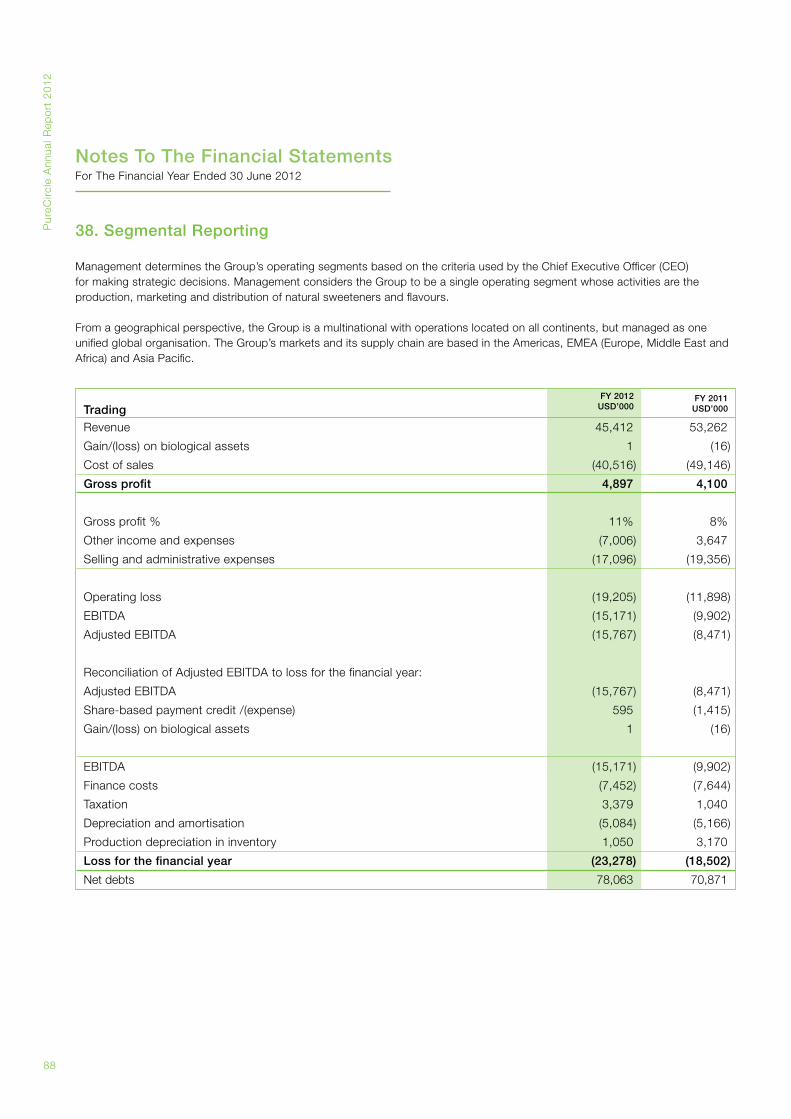
Pur
eCirc
le A
nnua
l Rep
ort
20
12
88
Notes To The Financial StatementsFor The Financial Year Ended 30 June 2012
38. Segmental Reporting
Management determines the Group’s operating segments based on the criteria used by the Chief Executive Officer (CEO) for making strategic decisions. Management considers the Group to be a single operating segment whose activities are the production, marketing and distribution of natural sweeteners and flavours.
From a geographical perspective, the Group is a multinational with operations located on all continents, but managed as one unified global organisation. The Group’s markets and its supply chain are based in the Americas, EMEA (Europe, Middle East and Africa) and Asia Pacific.
TradingFY 2012
USD’000FY 2011
USD’000
Revenue 45,412 53,262
Gain/(loss) on biological assets 1 (16)
Cost of sales (40,516) (49,146)
Gross profit 4,897 4,100
Gross profit % 11% 8%
Other income and expenses (7,006) 3,647
Selling and administrative expenses (17,096) (19,356)
Operating loss (19,205) (11,898)
EBITDA (15,171) (9,902)
Adjusted EBITDA (15,767) (8,471)
Reconciliation of Adjusted EBITDA to loss for the financial year:
Adjusted EBITDA (15,767) (8,471)
Share-based payment credit /(expense) 595 (1,415)
Gain/(loss) on biological assets 1 (16)
EBITDA (15,171) (9,902)
Finance costs (7,452) (7,644)
Taxation 3,379 1,040
Depreciation and amortisation (5,084) (5,166)
Production depreciation in inventory 1,050 3,170
Loss for the financial year (23,278) (18,502)
Net debts 78,063 70,871
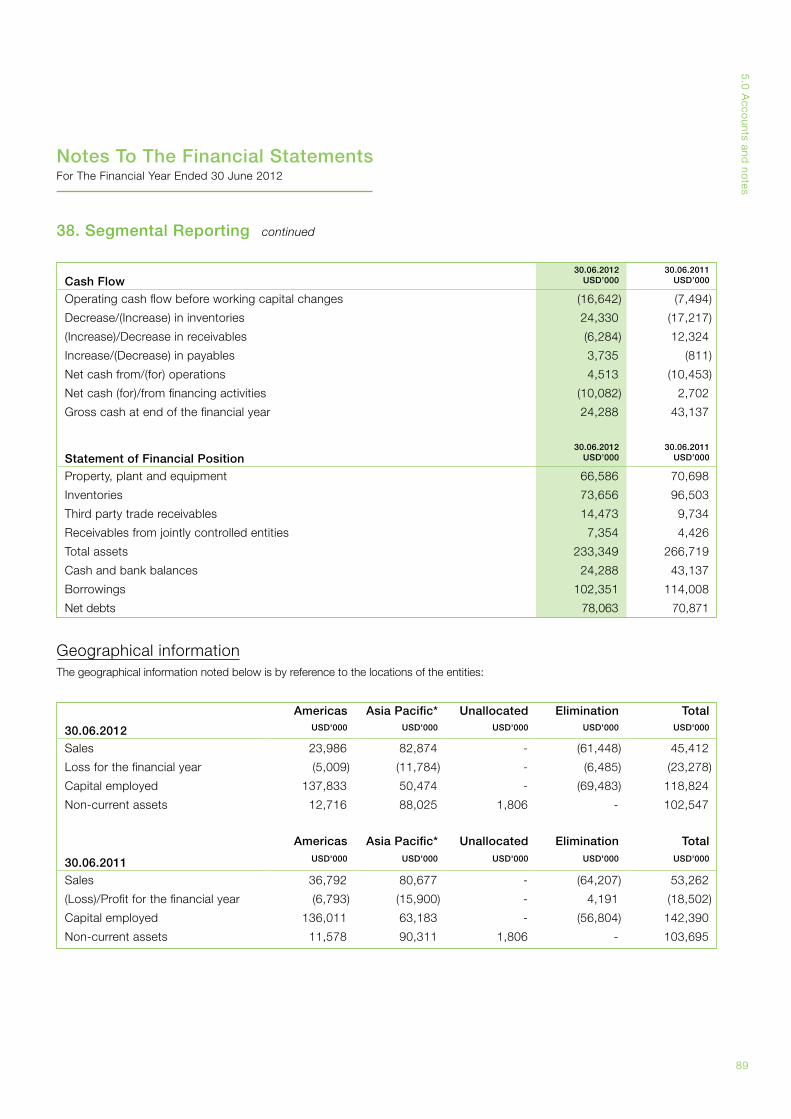
89
5.0
Acco
unts and no
tes
Notes To The Financial StatementsFor The Financial Year Ended 30 June 2012
38. Segmental Reporting continued
Cash Flow30.06.2012
USD’00030.06.2011
USD’000
Operating cash flow before working capital changes (16,642) (7,494)
Decrease/(Increase) in inventories 24,330 (17,217)
(Increase)/Decrease in receivables (6,284) 12,324
Increase/(Decrease) in payables 3,735 (811)
Net cash from/(for) operations 4,513 (10,453)
Net cash (for)/from financing activities (10,082) 2,702
Gross cash at end of the financial year 24,288 43,137
Statement of Financial Position30.06.2012
USD’00030.06.2011
USD’000
Property, plant and equipment 66,586 70,698
Inventories 73,656 96,503
Third party trade receivables 14,473 9,734
Receivables from jointly controlled entities 7,354 4,426
Total assets 233,349 266,719
Cash and bank balances 24,288 43,137
Borrowings 102,351 114,008
Net debts 78,063 70,871
Americas Asia Pacific* Unallocated Elimination Total
30.06.2012 USD'000 USD'000 USD'000 USD'000 USD'000
Sales 23,986 82,874 - (61,448) 45,412
Loss for the financial year (5,009) (11,784) - (6,485) (23,278)
Capital employed 137,833 50,474 - (69,483) 118,824
Non-current assets 12,716 88,025 1,806 - 102,547
Americas Asia Pacific* Unallocated Elimination Total
30.06.2011 USD'000 USD'000 USD'000 USD'000 USD'000
Sales 36,792 80,677 - (64,207) 53,262
(Loss)/Profit for the financial year (6,793) (15,900) - 4,191 (18,502)
Capital employed 136,011 63,183 - (56,804) 142,390
Non-current assets 11,578 90,311 1,806 - 103,695
Geographical informationThe geographical information noted below is by reference to the locations of the entities:
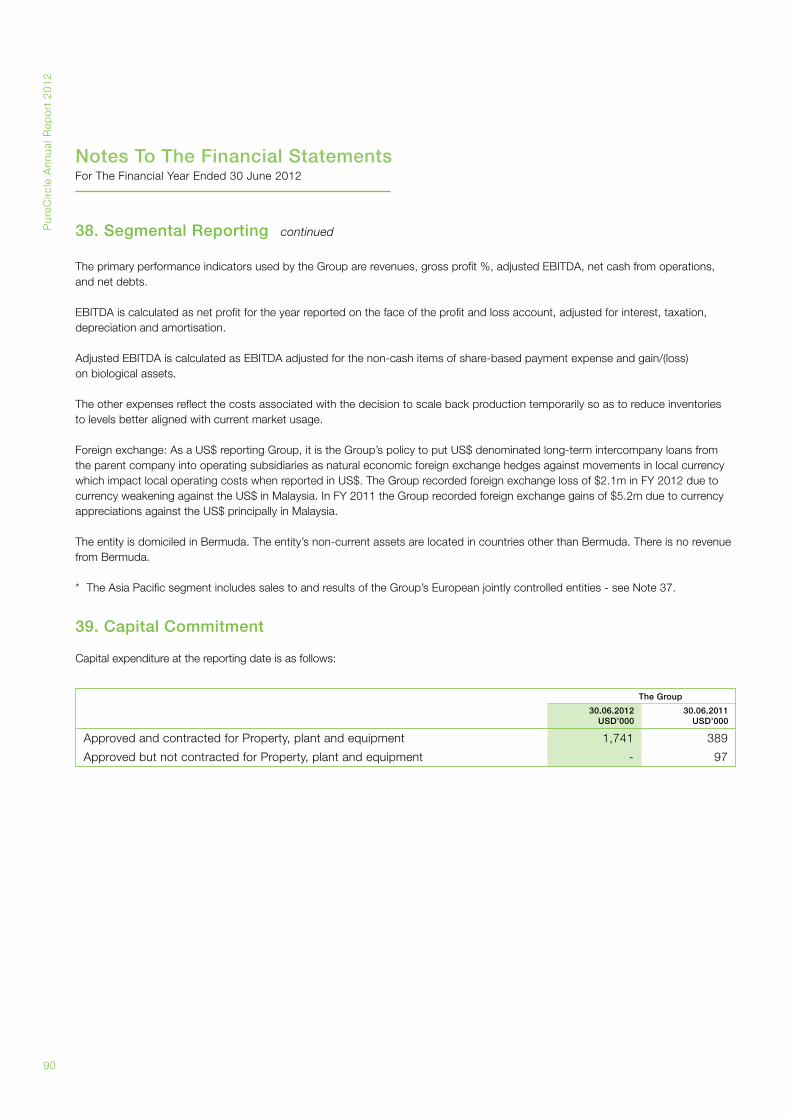
Pur
eCirc
le A
nnua
l Rep
ort
20
12
90
Notes To The Financial StatementsFor The Financial Year Ended 30 June 2012
38. Segmental Reporting continued
The primary performance indicators used by the Group are revenues, gross profit %, adjusted EBITDA, net cash from operations, and net debts.
EBITDA is calculated as net profit for the year reported on the face of the profit and loss account, adjusted for interest, taxation, depreciation and amortisation.
Adjusted EBITDA is calculated as EBITDA adjusted for the non-cash items of share-based payment expense and gain/(loss) on biological assets.
The other expenses reflect the costs associated with the decision to scale back production temporarily so as to reduce inventories to levels better aligned with current market usage.
Foreign exchange: As a US$ reporting Group, it is the Group’s policy to put US$ denominated long-term intercompany loans from the parent company into operating subsidiaries as natural economic foreign exchange hedges against movements in local currency which impact local operating costs when reported in US$. The Group recorded foreign exchange loss of $2.1m in FY 2012 due to currency weakening against the US$ in Malaysia. In FY 2011 the Group recorded foreign exchange gains of $5.2m due to currency appreciations against the US$ principally in Malaysia.
The entity is domiciled in Bermuda. The entity’s non-current assets are located in countries other than Bermuda. There is no revenue from Bermuda.
* The Asia Pacific segment includes sales to and results of the Group’s European jointly controlled entities - see Note 37.
39. Capital Commitment
Capital expenditure at the reporting date is as follows:
The Group
30.06.2012USD’000
30.06.2011USD’000
Approved and contracted for Property, plant and equipment 1,741 389
Approved but not contracted for Property, plant and equipment - 97
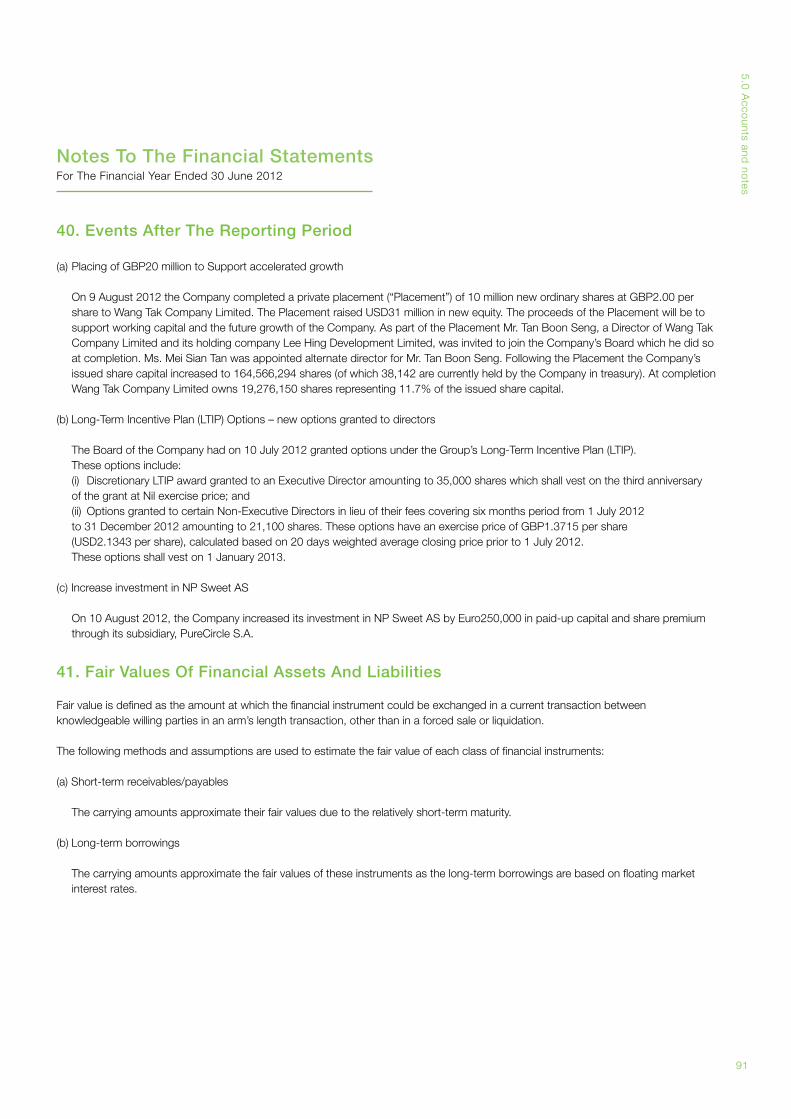
91
5.0
Acco
unts and no
tes
40. Events After The Reporting Period
(a) Placing of GBP20 million to Support accelerated growth
On 9 August 2012 the Company completed a private placement (“Placement”) of 10 million new ordinary shares at GBP2.00 per share to Wang Tak Company Limited. The Placement raised USD31 million in new equity. The proceeds of the Placement will be to support working capital and the future growth of the Company. As part of the Placement Mr. Tan Boon Seng, a Director of Wang Tak Company Limited and its holding company Lee Hing Development Limited, was invited to join the Company’s Board which he did so at completion. Ms. Mei Sian Tan was appointed alternate director for Mr. Tan Boon Seng. Following the Placement the Company’s issued share capital increased to 164,566,294 shares (of which 38,142 are currently held by the Company in treasury). At completion Wang Tak Company Limited owns 19,276,150 shares representing 11.7% of the issued share capital.
(b) Long-Term Incentive Plan (LTIP) Options – new options granted to directors
The Board of the Company had on 10 July 2012 granted options under the Group’s Long-Term Incentive Plan (LTIP). These options include:(i) Discretionary LTIP award granted to an Executive Director amounting to 35,000 shares which shall vest on the third anniversary of the grant at Nil exercise price; and (ii) Options granted to certain Non-Executive Directors in lieu of their fees covering six months period from 1 July 2012 to 31 December 2012 amounting to 21,100 shares. These options have an exercise price of GBP1.3715 per share (USD2.1343 per share), calculated based on 20 days weighted average closing price prior to 1 July 2012. These options shall vest on 1 January 2013.
(c) Increase investment in NP Sweet AS
On 10 August 2012, the Company increased its investment in NP Sweet AS by Euro250,000 in paid-up capital and share premium through its subsidiary, PureCircle S.A.
41. Fair Values Of Financial Assets And Liabilities
Fair value is defined as the amount at which the financial instrument could be exchanged in a current transaction between knowledgeable willing parties in an arm’s length transaction, other than in a forced sale or liquidation.
The following methods and assumptions are used to estimate the fair value of each class of financial instruments:
(a) Short-term receivables/payables
The carrying amounts approximate their fair values due to the relatively short-term maturity.
(b) Long-term borrowings
The carrying amounts approximate the fair values of these instruments as the long-term borrowings are based on floating market interest rates.
Notes To The Financial StatementsFor The Financial Year Ended 30 June 2012
Pur
eCirc
le A
nnua
l Rep
ort
20
12
92
Internet
PureCircle Group operates three websites which are updated regularly to cater for different information needs:
Investors and corporate stakeholderswww.purecircle.com
Consumerswww.steviapurecircle.com
Health professionals, customers, policy makers, consumerswww.globalsteviainstitute.com
Investor Relations
Request for further copies of the annual report or other investor relations matters should be addressed to PureCircle’s office.
Annual General Meeting
The Annual General Meeting (AGM) will be held on 12 December 2012, a formal notice of AGM had been sent to shareholders together with a copy of the annual report for financial year 2012.
2013 Financial Year and Corporate Calendar
Half year end 31 December 2012Interim results March 2013Year end 30 June 2013Final results September 2013
PureCircle Offices
Registered officeClarendon House2 Church StreetHamilton HM 11Bermuda.
Corporate Head QuartersMalaysia10th Floor, West WingRohas Perkasa No. 9 Jalan P. Ramlee 50250 Kuala Lumpur Malaysia.T +603 2166 2206F +603 2166 2207
Sales & Marketing Head OfficeUSA915 Harger Road, Suite 250Oak Brook, IL 60523 USA.T +1 630 361 0374F +1 630 361 0384
Regional Sales Contact details:
US or Canada: [email protected]
Latin America: [email protected]
Europe, Middle East or Africa: [email protected]
Asia Pacific: [email protected]
Auditors
PricewaterhouseCoopersChartered AccountantsLevel 10, 1 SentralJalan Travers, Kuala Lumpur SentralPO Box 1019250706 Kuala LumpurMalaysia.
Nominated adviser
RFC Ambrian Limited Level 15, QV1 Building 250 St Georges Terrace Perth WA 6000 Australia.
Level 14, 19-31 Pitt StreetSydney NSW 2000Australia.
Brokers
Westhouse Securities Limited 12th Floor, 1 Angel Court London EC2R 7HJ United Kingdom.
Mirabaud Securities LLP 33 Grosvenor Place London SW1X 7HY United Kingdom.
Liberum Capital Limited Ropemaker Place, Level 1225 Ropemaker Street London EC2Y 9LYUnited Kingdom.
Share Registrar
In Jersey (Shares)Computershare Investor Services (Jersey)Queensway House, Hilgrove Street St. Helier, Jersey, JE1 1ES.
In the UK (Depositary Interests)Computershare Investor Services plcThe Pavilions, Bridgwater RoadBristol BS13 8AEUnited Kingdom.
designed and produced by dewende.comPrinted on recycled paper
6.0Shareholder Information