
Cover page: Windhof - shielded substation 65 kV · PDF file2 Development of Energy Demand: ......
72
Annual Report 2014
Transcript of Cover page: Windhof - shielded substation 65 kV · PDF file2 Development of Energy Demand: ......

Annual Report 2014

Cover page: Windhof - shielded substation 65 kV
Creos Luxembourg S.A.Registered as a société anonyme (public limited company) under Luxembourg law with capital of EUR 198,851,260Luxembourg Trade and Companies’ Register B 4513Legal headquarters: 59-61 rue de Bouillon, L-1248 Luxembourg
Annual General Meetingof 12 May 2015
Reports presented to the annual general meeting of shareholders by the Board of Directors and the independent auditors
Reports and annual accounts for the 2014 financial year


I Introduction 6
The Creos shielded Transformer and Distribution Substations
8
1 Mission 10
2 Values 11
3 Shareholder Structure 12
4 Enovos Group Structure 13
5 Key Figures 14
6 Corporate Governance Bodies of the Company 15
7 Message 16
II Management Report and Statistics 18
1 Internal Organisation Creos Luxembourg S.A. 20
2 Development of Energy Demand:Electricity and natural Gas Grids
21
3 Technical Activity (Electricity and natural Gas) 30
4 Coordinating Balance and managing Nominations (Electricity)
42
5 Human Resources 43
6 Health and Safety 44
7 Creos Deutschland GmbH 45
III Management Report of the Board 46
1 Grid Activities 48
2 Financial Results 50
3 Outlook 52
4 Auditor 52
IV Annual Accounts 52
1 Balance Sheet 54
2 Profit and Loss account 56
3 Notes to the Annual Accounts 57
4 Audit Report 67
Summary
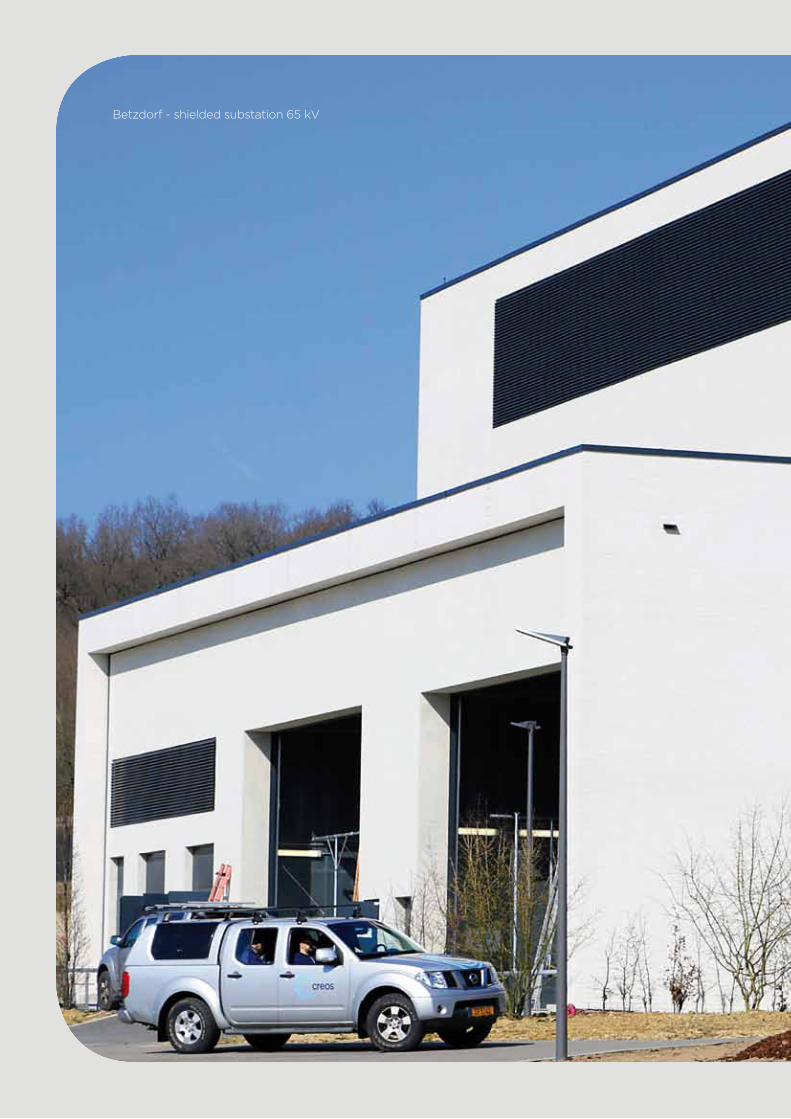
Betzdorf - shielded substation 65 kV
I. Introduction

8 Introduction
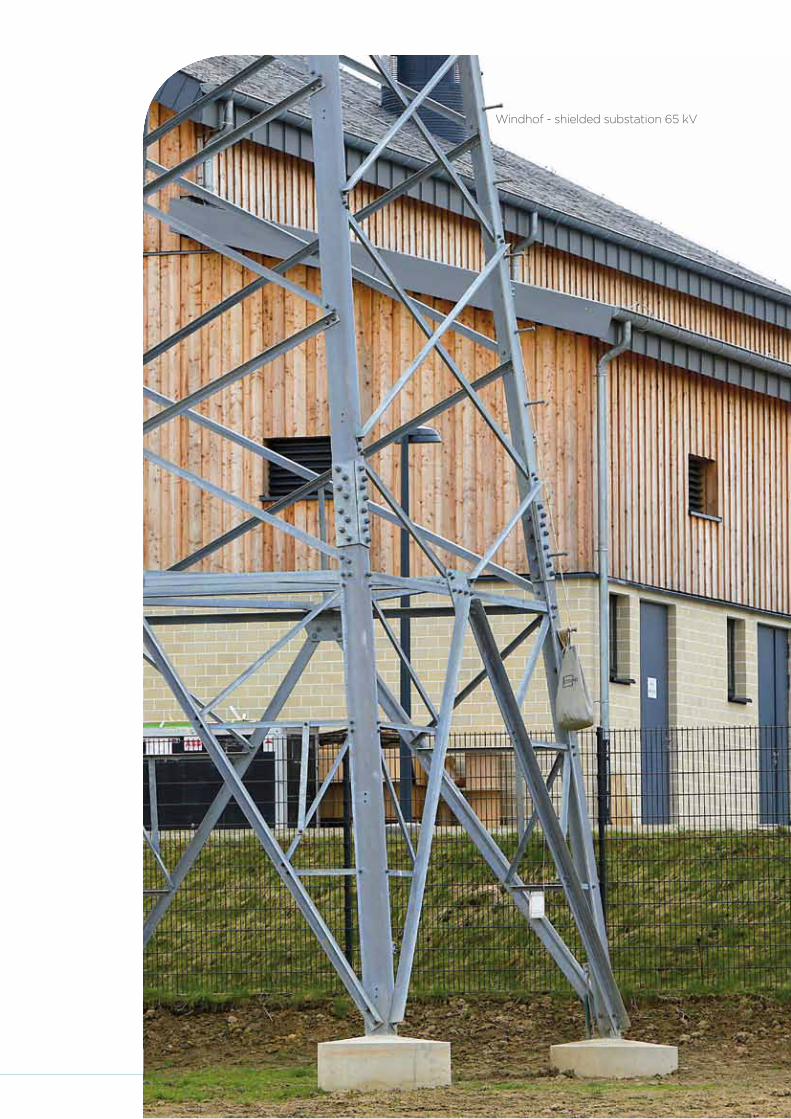
The Creos shielded Transformerand Distribution Substations
Substations are a key component of the electricity grid, performing both transformation and distribution of electricity. They distribute electrical energy at a uniform voltage, before stepping it down so that it can be distributed for consumption by users (homes and businesses).
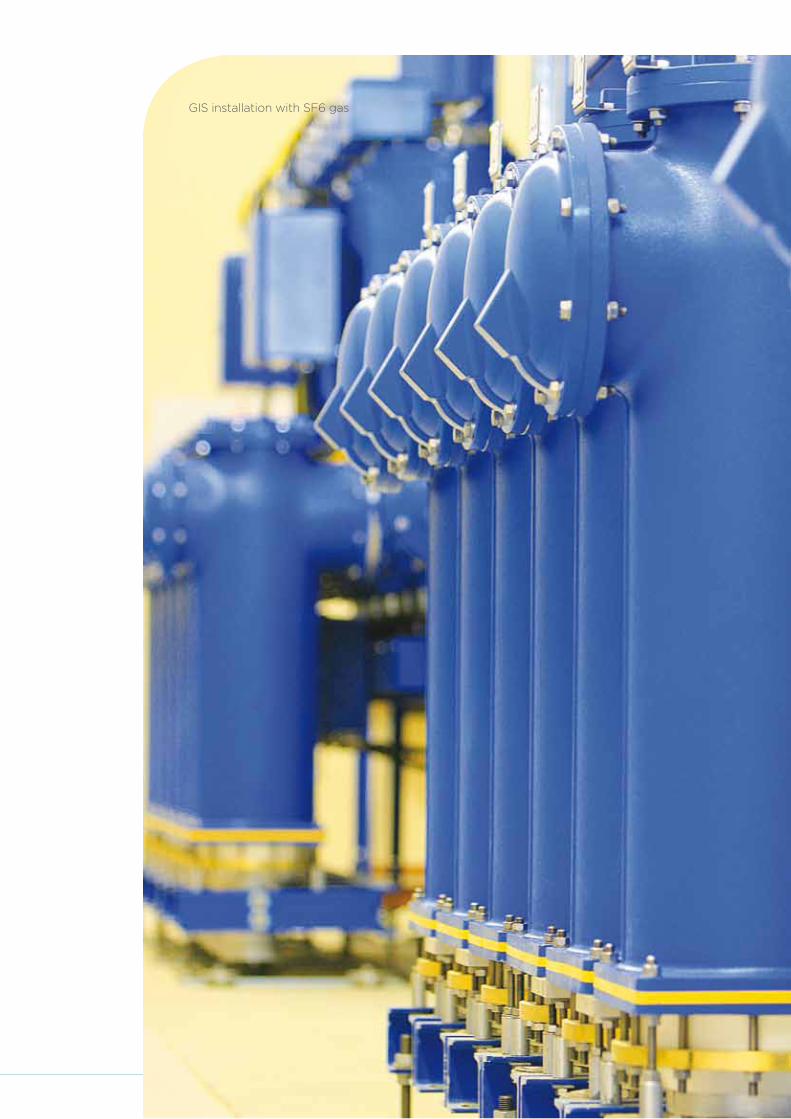
The technology behind shielded substations has certain advantages over the conventional construction method, as it is compact, reliable and low-maintenance. However, its production cost entails greater investment than conventional technology. In this "GIS" (Gas Isolierte Schaltanlage) installation, the electrical conductors are sheathed in a metal envelope filled with a gas (sulphur hexafluoride - SF6). This technology thus uses SF6 gas as insulation instead of the ambient air.
As part of its corporate social responsibility policy, Creos is careful to ensure that its substations are compatible with the local environment, and closely monitors the quality and reliability of its grid, thereby securing supply for its customers.
Incorporating appropriate design and construction materials (concrete, wood, metal, etc.), Creos installations blend harmoniously into their local environment. Note that the construction methods used for Creos substations may vary, depending on the different authorities' obligations and regulations.
Between 2014 and 2019, major investments in the 65kV grid involved the installation of such substationsin the following locations:
Windhof, Betzdorf, Esch/Ehlerange, Gasperich, Kirchberg/Europe, Findel/Senningerberg, Bettembourg, Kirchberg/Weimershof and Hollerich.
In addition to these 65kV installations, the first high-voltage shielded substation in the 220kV grid is currently under construction at Itzig/Blooren.
In this annual report you will see photographs of various 65kV shielded substations currently in service, as well as 65kV and 220kV substations that are currently under construction and will be completed over the next five years.
We hope you enjoy reading this annual report.
9
GIS installation with SF6 gas
10 Introduction
1 Mission
Creos’ mission to ensure the transportation and distribution of energy over the electricity supply and distribution networks and the natural gas pipelines is carried out reliably and at competitive prices in the Grand Duchy of Luxembourg.
The company performs this mission in a non-discriminatory way under the control of the “Institut Luxembourgeois de Régulation” (ILR) and meets its environmental protection obligations.
Creos recognises that certain values are essential to the accomplishment of its mission. Day-to-day activities focus on ensuring commitment, quality, safety and innovation.
The human element is always a priority.
A highly skilled and efficient workforce that enjoys excellent working conditions strives to provide high-quality services for the public.
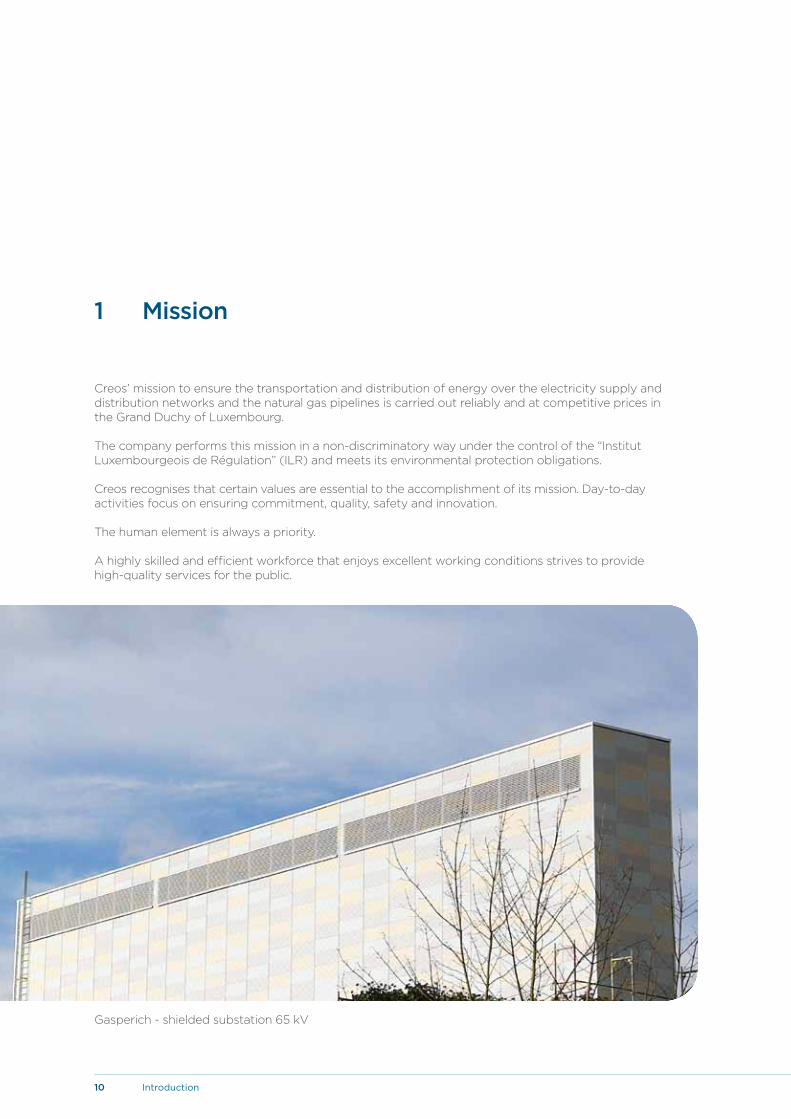
Gasperich - shielded substation 65 kV

11
2 Values
Creos’ values are vital to successfully performing its public service remit.
Ensuring that people from different backgrounds work harmoniously together is a priority in terms of achieving satisfaction and efficiency in the workplace. With this goal in mind, Creos consulted its entire workforce to determine a set of common guiding principles. This gave rise to four shared values.
Energy, motivation and job satisfaction are the principles adopted by employees when assuming the responsibilities involved in their respective tasks on a daily basis. Employees demonstrate commitment and accept current and future challenges.
The safety guidelines and requirements communicated at regular intervals during seminars and training sessions are adhered to and constantly applied in the specific fields of activity. Creos employees always prioritise safety.
All tasks assigned are performed with great care and customers are provided with impeccable service. The technical skills displayed ensure the quality of the network, the optimisation of transport and security of supply.
Employees are receptive to new technologies and anticipate future developments by continually improving their skill sets. The Creos teams are ready to tackle the challenges of tomorrow.
12 Introduction
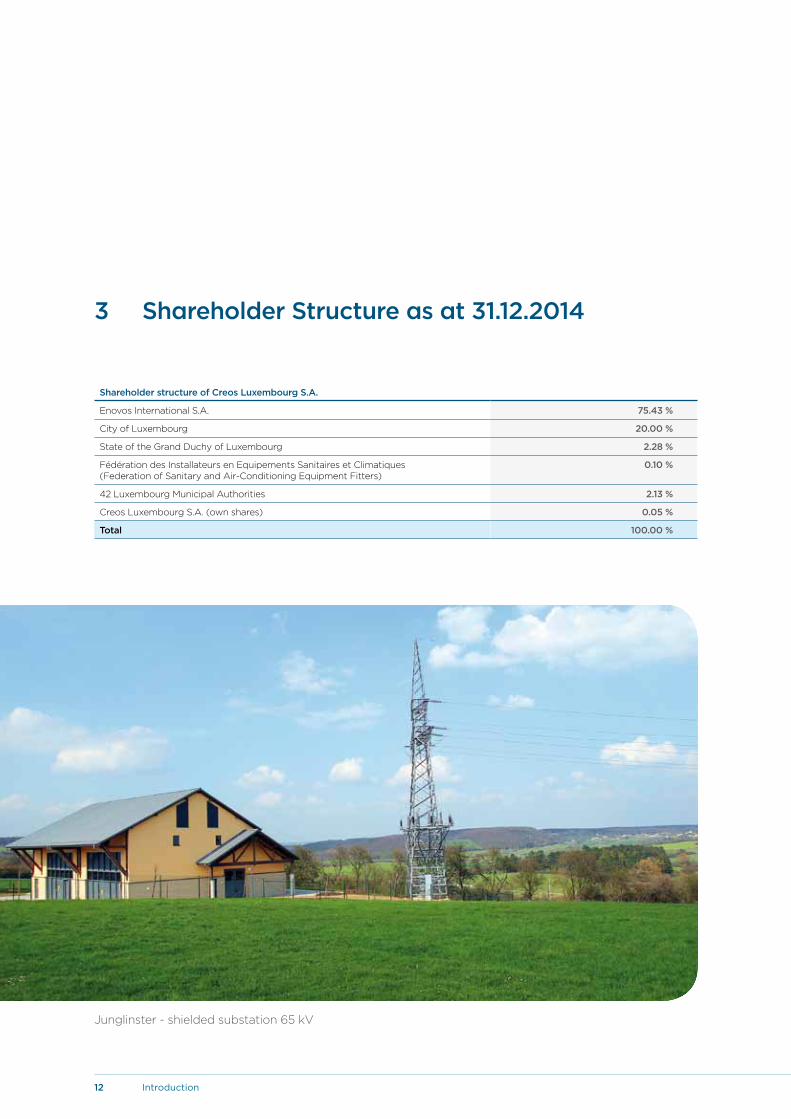
Shareholder structure of Creos Luxembourg S.A.
Enovos International S.A. 75.43 %
City of Luxembourg 20.00 %
State of the Grand Duchy of Luxembourg 2.28 %
Fédération des Installateurs en Equipements Sanitaires et Climatiques (Federation of Sanitary and Air-Conditioning Equipment Fitters)
0.10 %
42 Luxembourg Municipal Authorities 2.13 %
Creos Luxembourg S.A. (own shares) 0.05 %
Total 100.00 %
3 Shareholder Structure as at 31.12.2014
Junglinster - shielded substation 65 kV

13
4 Structure of the Enovos Group
As at 31.12.2014
* Creos Luxembourg S.A. holds 0.05 % own shares.
CreosLuxembourg S.A.*
CreosDeutschland
Holding GmbH
CreosDeutschland
GmbH
CreosDeutschland
Services GmbH
Enovos International S.A.
Leo S.A.EnovosDeutschland SE
Enovos EnergieDeutschland
GmbH
EnovosLuxembourg S.A.
75.43 %
96.88 % 88.98 % 100 %
100 %100 %100 %
11.02 % 100 %

14 Introduction
5 Key Figures
(1) Including workforce of City of Luxembourg made available to Creos Luxembourg S.A.
The financial year corresponds to the calendar year.
Key Figures Creos Luxembourg S.A. (under Lux GAAP)
2013 2014
Net turnover M€ 202.5 223.2
EBITDA M€ 111.6 117.3
EBIT M€ 67.0 65.3
Profit for the financial year M€ 64.2 67.5
Electricity
Electricity flow GWh 4,856.8 4,832.8
Electricity network peak MW 772.0 774.2
Network length Km 9,310.9 9,464.1
Natural gas
Total gas network capacity Nm3/h 280,000 275,289
Gas network peak Nm3/h 253,000 244,600
Volume transported GWh 11,499.5 10,895.4
Network length Km 1,911.8 1,962.2
Workforce (average) (1) 652 650

15
6 Corporate Governance Bodies of the Company
Board of Directors of Creos Luxembourg S.A. as at 31.12.2014
GROTZ Mario Chairman and Managing Director
GAILLOCHET Benoît Vice-Chairman of the Board
BECKER Romain Managing Director and CEO
BAILLIE Sasha Member of the Board
COLLING Patrick Member of the Board
FESS Manfred Member of the Board
GILBERTZ André Member of the Board
KAMPHUES Stephan Member of the Board
KAUFHOLD Lex Member of the Board
KOHNEN Julien Member of the Board
KUFFER Thierry Member of the Board
LAUWERS Mark Member of the Board
LENERT Paulette Member of the Board
NICOLAI Alain Member of the Board
REDER Claude Member of the Board
REUTER Michael Member of the Board
SCHAUL Christiane Member of the Board
SCHILTZ Jean Member of the Board
VAN GOETHEM Anne Member of the Board
WALENTINY Marco Member of the Board
EISCHEN Tom Government Commissioner for Energy
16 Introduction
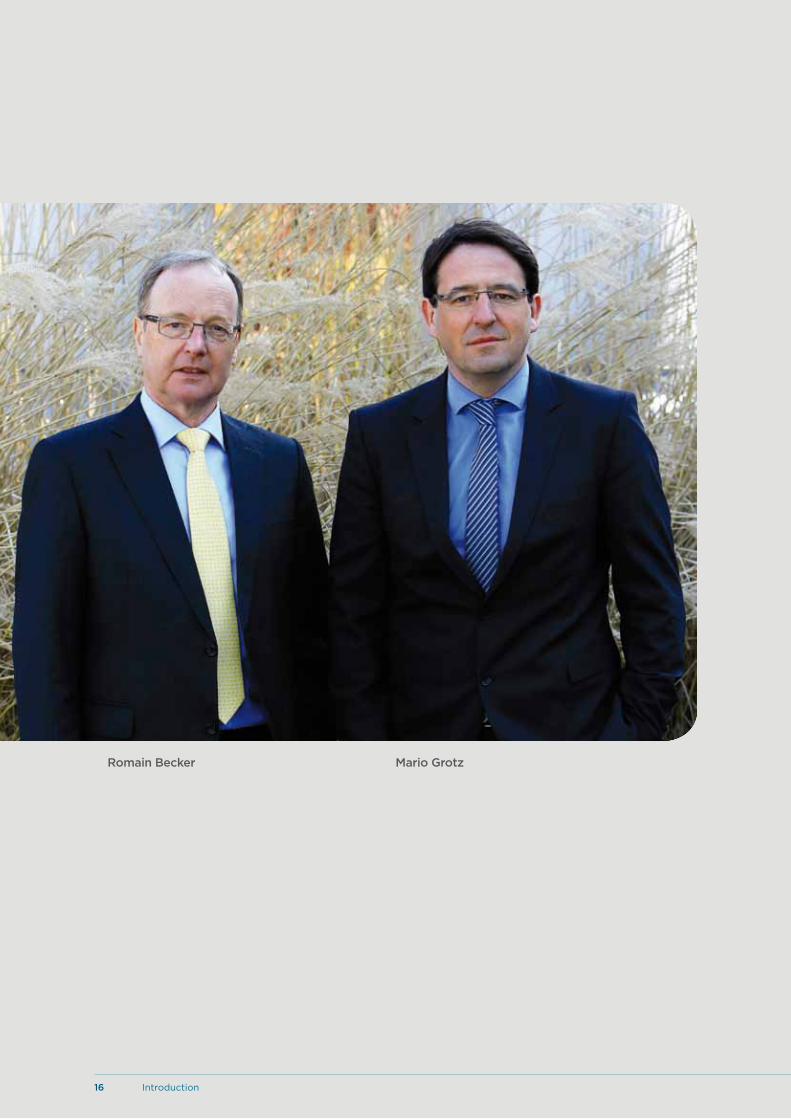
Romain Becker Mario Grotz
17
7 Message
It was a case of "mission accomplished" for Creos in 2014. All its major projects made progress over the course of last year, which saw a very high level of investment and intense activity in all areas.
Securing its supplies of electricity and natural gas remains Creos' number one objective. The realisation of this goal determines the investment that will enable Creos to strengthen its grids to take account of the predictable change in demand. The connection to the Belgian grid, which will become operational at the end of 2015, and the new 220kV loop around the City of Luxembourg are the key elements of this investment programme, which also includes a lot of replacement and reinforcement of the grids at the local and regional level.
The organisation of the markets is another key task for grid operators, one which also involves facilitating the creation of increasingly open and integrated energy markets. A single Belgium-Luxembourg gas market, for example, will open in October 2015, with benefits for suppliers and customers alike. The project, which aims to create a single market for Luxembourg and Belgium, will be unique in Europe, as it will be the first cross-border merger of markets.
The work to replace all electricity and gas meters with a new generation of "intelligent meters" is well under way. The communication technology has been chosen and the characteristics of the meters have been defined. The new meters are therefore scheduled for deployment from 2016 onwards. The new technology will provide customers with new
services while at the same time enabling the grids to be adapted in line with the boom in renewable energy. The system should also be able to cope with consumers who become producers as well as with major fluctuations in energy produced from wind and solar power. This is why we need what are known as "smart grids": digital grids fitted with a number of detectors that enable the situation to be analysed in detail at any moment so that the balance between supply and demand can be optimised and energy flows in the distribution grids can be monitored.
2014 was also memorable on account of the opening of our new Roost site, which will enable us to optimise our regional centres and thus increase the efficiency of our services. Thanks to its proximity to the "Autoroute du Nord", it will also provide fast access to all the areas served by the new Roost site as soon as the road is opened in the autumn of 2015.
All this work will continue in 2015 and be joined by a new activity following the deployment of a nationwide network of charging stations for electric cars.
All that remains for us to do now is to thank the entire Creos team for their effective contribution throughout 2014.
Romain BeckerManaging Director and CEO
Mario GrotzChairmanand Managing Director

Itzig/Blooren - shielded substation 220 kV
II. Management Report and Statistics
20 Management Report and Statistics
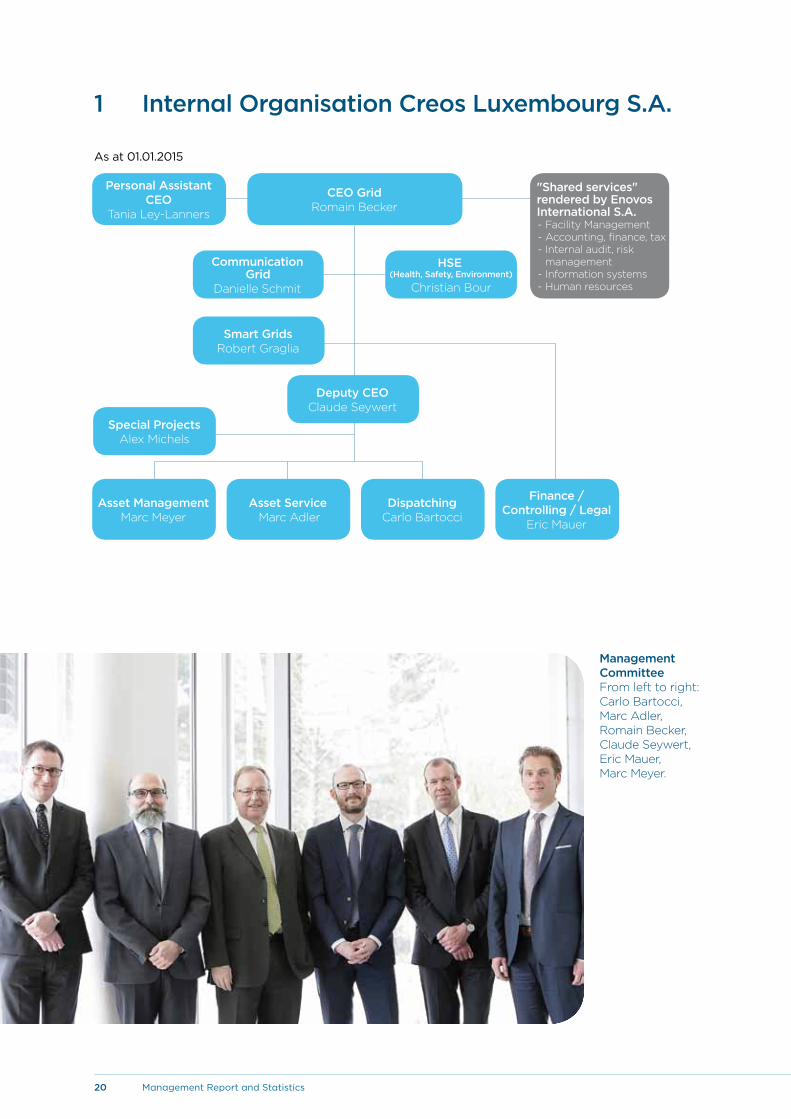
1 Internal Organisation Creos Luxembourg S.A.
As at 01.01.2015
Management CommitteeFrom left to right: Carlo Bartocci, Marc Adler,Romain Becker, Claude Seywert, Eric Mauer, Marc Meyer.
Finance /Controlling / Legal
Eric Mauer
DispatchingCarlo Bartocci
Asset Service Marc Adler
Asset Management Marc Meyer
CEO GridRomain Becker
"Shared services" rendered by Enovos International S.A.- Facility Management- Accounting, finance, tax- Internal audit, risk management- Information systems- Human resources
Deputy CEOClaude Seywert
HSE(Health, Safety, Environment)
Christian Bour
CommunicationGrid
Danielle Schmit
Smart GridsRobert Graglia
Special ProjectsAlex Michels
Personal Assistant CEO
Tania Ley-Lanners

21
2 Development of Energy Demand
The modest economic recovery first observed in 2013 continued in 2014. Although it is too soon to speak of a genuine economic recovery from the crisis of 2008/2009, estimates prepared by the statistics office Statec and international organisations indicate that Luxembourg's GDP grew by around 3 % in 2014.
It is interesting to note in this context that the close correlation between changes in GDP and electricity requirements that was evident in previous decades has been less so in recent years. Nowadays, changes in GDP have less impact on electricity requirements. Structural changes have taken place since 2008 and energy-saving measures have doubtless contributed to this change.
In the natural gas sector, demand in the residential sector fluctuates primarily in line with weather conditions: as 2014 was warmer than 2013, an overall reduction of around 5.25 % was observed in this sector.
Industrial demand for natural gas rose slightly in 2014, but electricity production remains low in comparison to previous years. This trend is apparent throughout Europe, where numerous natural gas power stations are on standby, even though power stations of this type are some of the cleanest conventional plants in terms of greenhouse gas emissions. This trend is due to the difficulty of operating these plants profitably at current market prices.
Administrative Coordination
Committee From left to right:
Robert Graglia, Pascal Hubert,
Carlo Klein,Tania Lanners,
Danielle Schmit,Christian Bour.
22 Management Report and Statistics
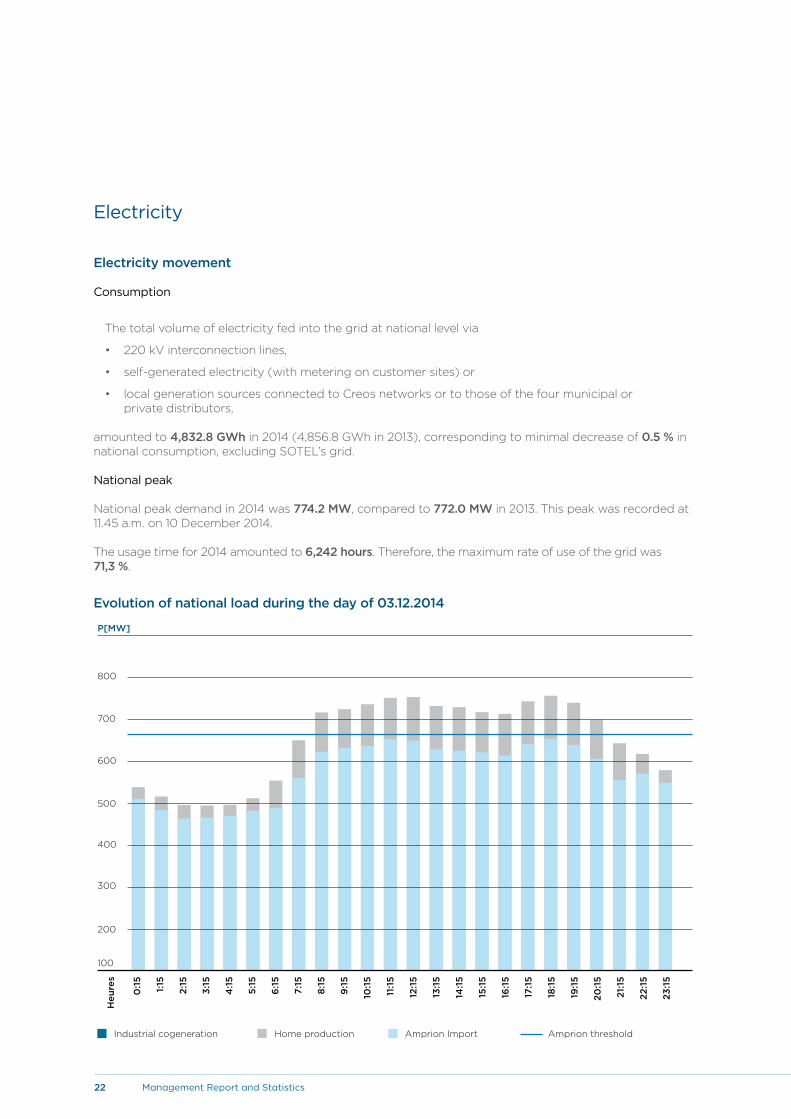
Electricity
Electricity movement
Consumption
The total volume of electricity fed into the grid at national level via
• 220kVinterconnectionlines,
• self-generatedelectricity(withmeteringoncustomersites)or
• localgenerationsourcesconnectedtoCreosnetworksortothoseofthefourmunicipalor private distributors,
amounted to 4,832.8 GWh in 2014 (4,856.8 GWh in 2013), corresponding to minimal decrease of 0.5 % in national consumption, excluding SOTEL’s grid.
National peak
National peak demand in 2014 was 774.2 MW, compared to 772.0 MW in 2013. This peak was recorded at 11.45 a.m. on 10 December 2014.
The usage time for 2014 amounted to 6,242 hours. Therefore, the maximum rate of use of the grid was 71,3 %.
Evolution of national load during the day of 03.12.2014
700
800
600
500
400
300
200
100
P[MW]
0:1
5
1:15
2:15
3:15
4:1
5
5:15
6:1
5
7:15
8:15
9:1
5
10:1
5
11:1
5
12:1
5
13:1
5
14:1
5
15:1
5
16:1
5
17:1
5
18:1
5
19:1
5
20:1
5
21:1
5
22:1
5
23:1
5
Heu
res
Industrial cogeneration Home production Amprion Import Amprion threshold

23
Total electricity demand in the networks of Creos Luxembourg
Injections into the network (including local networks)
(*) Imports: Including production Twinerg, plant connected to the Belgium grid
GWh Variation in %in comparison with 2013
Cross-border exchanges
Imports (*) 4,152.5 + 0.4
Home production (**) 680.3 - 5.5
Of which : Cogeneration 312.6 - 9.3
Hydroelectric 97.3 - 8.3
Wind 82.5 - 1.4
Waste incineration 72.4 - 6.8
Biogas 54.9 + 7.1
Photovoltaic 60.6 + 8.3
Total injection 4,832.8 - 0.5
(**) Of which renewables 367.7 - 1.7
Imports (*)
Cogeneration
Hydroelectric
Wind
Waste incineration
Biogas
Photovoltaic

24 Management Report and Statistics
LT level
20 kV level
Network and other losses Local distributors
220 kV level
65 kV level
Variation in total electricity demand on the Creos grids
GWh %
Demand
220 kV level 93.2 1.9 %
65 kV level 1,216.1 25.2 %
20 kV level 1,822.1 37.7 %
LT level 1,264.2 26.2 %
Local distributors 284.2 5.9 %
Network and other losses 152.9 3.2 %
Total demand 4,832.8
(in GWh) 2013 2014 Variation in %in comparison with 2013
End customers
Industrial sector 1,302.4 1,309.3 + 0.5 %
Business sector and SME industrial and trades 1,865.3 1,822.1 - 2.3 %
Residential and small companies 1,248.3 1,264.2 + 1.3 %
Local distributors (Sudstroum, Mersch, Nordenergie, Steinergy) 287.7 284.2 - 1.2 %
Losses 153.1 152.9 - 0.1 %
Total 4,856.8 4,832.8 - 0.5 %
Total electricity demand by sector
Demand by voltage level
25
Windhof - shielded substation 65 kV
26 Management Report and Statistics
Natural Gas
2013 2014
Total capacity reserved for transmission (in Nm3/h) 280,000 275,289
Gas grid peak (in Nm3/h) 253,000 244,600
Total volume carried 11,499 GWh 10,895 GWh
Transported volume
In 2014, the volume carried on the transmission network amounted to a total of 10,895 GWh, (- 5.2 % compared to 2013).
(in GWh) 2013 2014
Total demand
Industrial sector 3,624.4 3,744.4 + 3.3 %
Electricity generation (>100 MW) 2,285.2 2,424.6 + 6.1 %
Local distributors 5,589.9 4,726.4 - 15.4 %
– of which Creos 3,540.9 3,028.02 - 14.5 %
Total 11,499 GWh 10,895 GWh - 5.2 %
Total demand for natural gas developed as follows:
The economic recovery in 2014 led to a modest rise in consumption by industrial customers. However, demand from residential customers was lower as the weather was warmer in 2014 than in 2013.
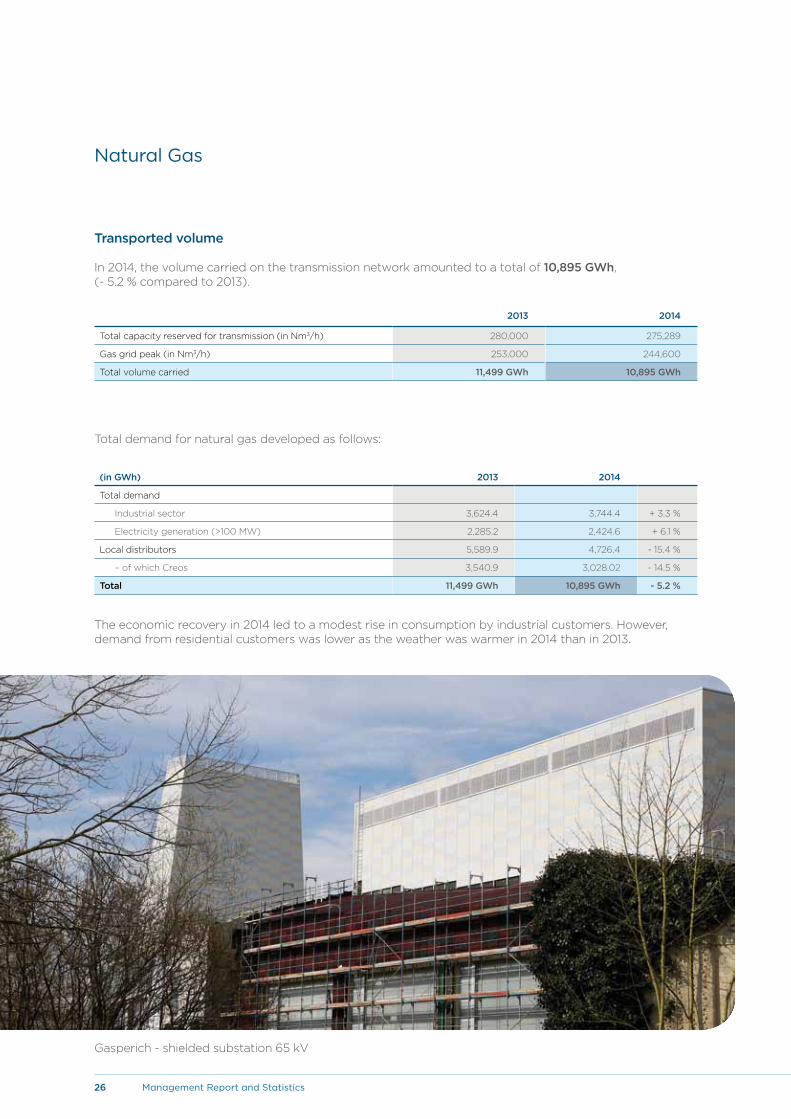
Gasperich - shielded substation 65 kV

27
Total demand of public utilities per month (2012-2014)
Total demand on the local market per month (2012-2014)
Evolution of demand in 2014 (transport and distribution)
GWh
800
1.000
900
700
500
300
100
600
400
200
2012 2013 2014
Janu
ary
Feb
ruar
y
Mar
ch
Ap
ril
May
June
July
Aug
ust
Sep
tem
ber
Oct
ob
er
Nov
emb
er
Dec
emb
er
GWh
1.600
2.000
1.800
1.400
1.000
600
200
1.200
800
400
2012 2013 2014
Janu
ary
Feb
ruar
y
Mar
ch
Ap
ril
May
June
Juiy
Aug
ust
Sep
tem
ber
Oct
ob
er
Nov
emb
er
Dec
emb
er
The total demand includes the industrial sector and the electricity production on a large scale.

28 Management Report and Statistics
Volume of natural gas transported
Public utilitiesTotal demand
2012
2013
2014
GWh
5.000
6.000
3.000
4.000
2.000
1.000
0
5,284.7
5,589.9
4,726.4
Breakdown of flows per point of interconnection
Bras 44 %
Pétange 4 %
Remich 52 %
(in GWh)
Remich German network 5,637.86 52 %
Bras Belgian network 4,810.57 44 %
Postes A Pétange - Belgian network 447.02 4 %
Total 10,895.45 100.00 %
2012
2013
2014
GWh14.000
10.000
12.000
6.000
8.000
4.000
2.000
0
10,895.4
13,581.9
11,499.5

29
(in GWh)
PD (Public Distribution) 4,726.40 43 %
CI (Industrial Customers) 2,424.63 22 %
CE (Electrical Power stations) 3,744.42 34 %
Total 10,895.45 100.00 %
GIS installation with SF6 gas
Breakdown of demand by activity
Public Distribution (PD) 43 %
Electrical Power stations (CE) 34 %
Industrial Customers (IC) 22 %

30 Management Report and Statistics
Electricity
3 Technical Activity
Creos is required to maintain and develop an electrical infrastructure capable of meeting the energy requirements of a steadily growing population and of a cutting-edge, state-of-the art industry that is stringent in its demands for quality of supply.
The 220kV grid
220kV ring around the City of LuxembourgThe groundwork and formalities for obtaining the requisite official and private authorisations are continuing. The laying of the 220 kV line, in underground and overhead cables, of the section between the 220kV Heisdorf - Trèves line and the future 220/65/20kV substation at Itzig/Blooren is in progress.
Installation work is continuing on the new 220/65kV transformation and distribution substation at Itzig/Blooren.
220kV Luxembourg - Belgium Interconnection
With the aim of securing Luxembourg's electrical energy supply and tapping directly into the energy markets, Creos is partnering with Belgian grid operator Elia to construct a new Tie-line from Elia's substation in Aubange (B).
This is in addition to the two existing Tie-lines from Germany, and will be implemented in two phases, namely:
• pre-intermediate: installation of a 245/245 kV phase-shifting transformer (PST) in the arrival span line to Twinerg at the Schifflange 220kV substation;
• intermediate: switching of the 245/245 kV phase-shifting transformer on the line to Bascharage - Aubange (B) and inclusion of the Twinerg power station in Creos' "Schifflange - Oxylux - Schifflange" ring.
Preparatory studies and groundwork for the installation of the 245/245kV PST are under way, with the first phase scheduled to go on-stream during the 4th quarter of 2015.
Negotiations are also ongoing with industrial grid operator Sotel with a view to optimising Sotel's existing assets as part of the Tie-line project.
As regards the long-term solution, analyses and negotiations are continuing with Elia and Amprion.
Projects completed during 2014
31
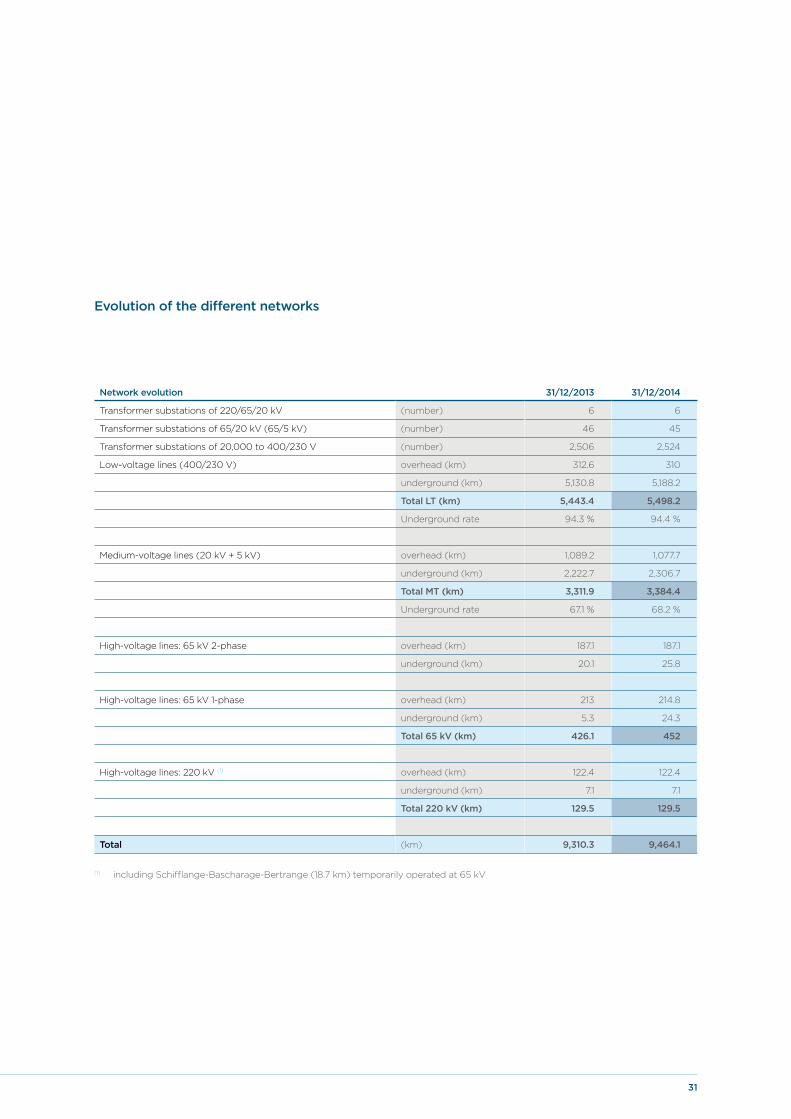
Evolution of the different networks
Network evolution 31/12/2013 31/12/2014
Transformer substations of 220/65/20 kV (number) 6 6
Transformer substations of 65/20 kV (65/5 kV) (number) 46 45
Transformer substations of 20,000 to 400/230 V (number) 2,506 2,524
Low-voltage lines (400/230 V) overhead (km) 312.6 310
underground (km) 5,130.8 5,188.2
Total LT (km) 5,443.4 5,498.2
Underground rate 94.3 % 94.4 %
Medium-voltage lines (20 kV + 5 kV) overhead (km) 1,089.2 1,077.7
underground (km) 2,222.7 2,306.7
Total MT (km) 3,311.9 3,384.4
Underground rate 67.1 % 68.2 %
High-voltage lines: 65 kV 2-phase overhead (km) 187.1 187.1
underground (km) 20.1 25.8
High-voltage lines: 65 kV 1-phase overhead (km) 213 214.8
underground (km) 5.3 24.3
Total 65 kV (km) 426.1 452
High-voltage lines: 220 kV (1) overhead (km) 122.4 122.4
underground (km) 7.1 7.1
Total 220 kV (km) 129.5 129.5
Total (km) 9,310.3 9,464.1
(1) including Schifflange-Bascharage-Bertrange (18.7 km) temporarily operated at 65 kV
32 Management Report and Statistics
Protection of people and their environment
Gradual installation of power lines underground
Creos has made a specific commitment to bury network infrastructure underground in population centres and the surrounding areas when renewing lines or installing new infrastructure.
These works are often completed in close collaboration with the state and municipal authorities.
The burial of Creos power lines has now reached 94.4 % in low voltage and 68.2 % in medium voltage which represents more than 7,000 km and therefore more than ⅔ of the grid, a European-level performance.
Integration of substations into the environment
Creos has always been concerned about the harmonious integration of its facilities into the environment. Accordingly, the new high-voltage transformer substations are now designed as shielded substations. At the cutting edge of technology, these substations are compact, discrete and surrounded by plantations to seamlessly blend into the environment and the landscape. The surface area used for a shielded substation represents one fifth of the surface area of a traditional exterior substation.
The medium and low-voltage substations installed among population centres are today exclusively manufactured in the form of shielded brick, prefab concrete or steel substations, or again directly integrated into a bus stop or inside a building.
Safety
Creos has invested in all the precautionary measures necessary to guarantee optimal protection in case of fire, break-in and bad weather. Accordingly, the premises for the transformer have been sound-proofed and equipped with a waterproof tank to recover any oil leak.
Total lenght of overhead lines Change compared to 31.12.1992
End of 1992: 2,496 km p.m.
End of 2014: 1,912 km - 584 km

33
The high-voltage electricity network
34 Management Report and Statistics
Grid peak and demand on the network managed by Creos Luxembourg
Peak [MW] Consumption [GWh]
700,0
800,0
900,0
600,0
500,0
400,0
300,0
200,0
100,0
6000,0
5000,0
4000,0
3000,0
2000,0
1000,0
1936
194
2
194
8
1954
196
0
196
6
1972
1978
1984
Peak Consumption
199
0
199
6
200
2
200
8
2014
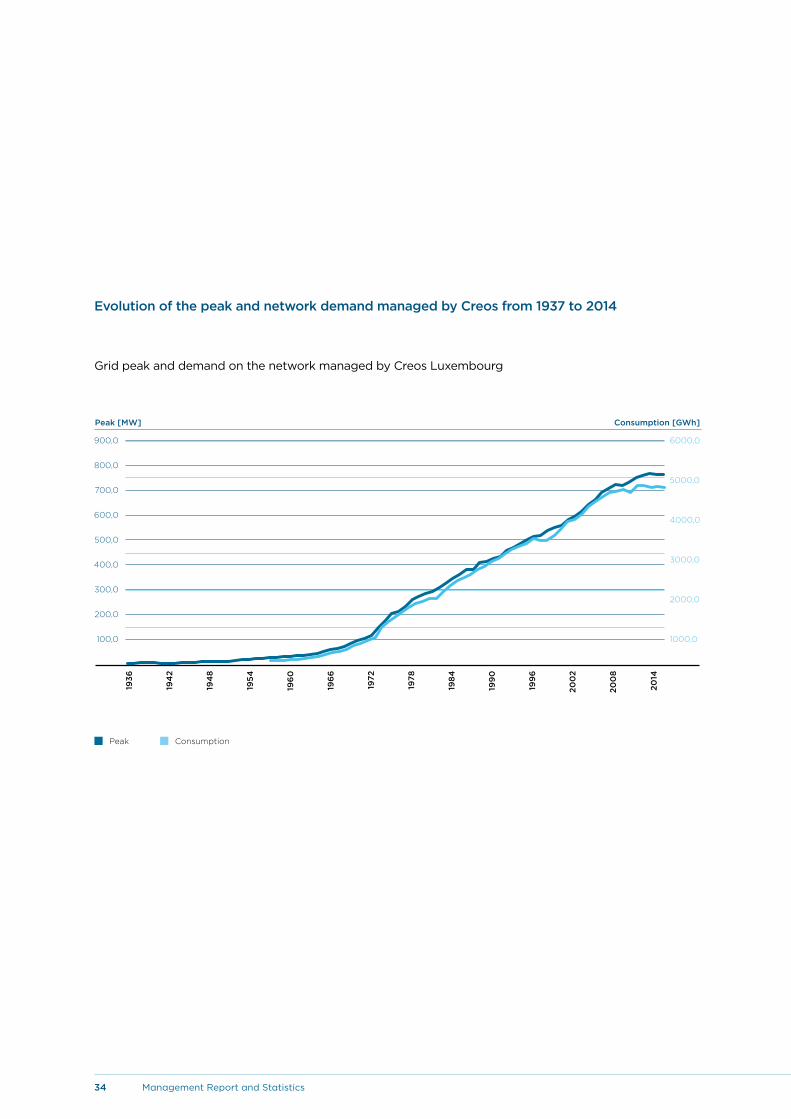
Evolution of the peak and network demand managed by Creos from 1937 to 2014
35
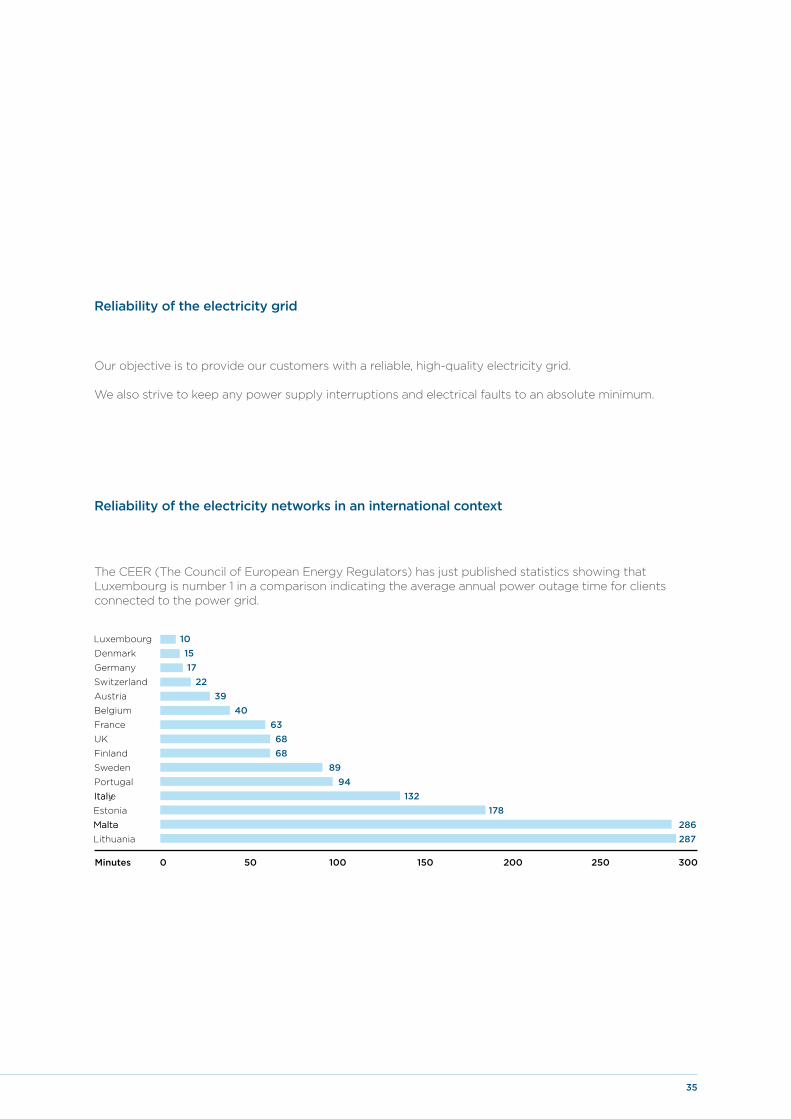
Reliability of the electricity networks in an international context
The CEER (The Council of European Energy Regulators) has just published statistics showing that Luxembourg is number 1 in a comparison indicating the average annual power outage time for clients connected to the power grid.
50 100 150 200 250 3000Minutes
Italie
Malte
101517
132
636868
8994
2239
40
287286
178
Luxembourg
Denmark
Germany
Italy
France
UK
Finland
Sweden
Portugal
Switzerland
Austria
Belgium
Lithuania
Malta
Estonia
Our objective is to provide our customers with a reliable, high-quality electricity grid.
We also strive to keep any power supply interruptions and electrical faults to an absolute minimum.
Reliability of the electricity grid

36 Management Report and Statistics
Natural gas
Creos Luxembourg's grid is supplied with natural gas mainly via interconnecting pipelines to Belgium and Germany.
The launch of the Belux project during 2014, in close collaboration with Fluxys Belgium, reflects our efforts to secure transport capacity for the benefit of our end customers. Gas transmission system (GTS) operators Creos (in Luxembourg) and Fluxys Belgium, together with their respective regulators, Institut Luxembourgeois de Régulation (ILR) and Commission de Régulation de l’Electricité et du Gaz (CREG), have been working closely on integrating our two national markets from 1 October 2015 onwards.
This initiative forms part of the European Union's desire to build a frontier-free European gas market, and will constitute the first ever integration of two Member States' markets.
In this integrated Belux market, entry-exit access rights between Belgium and the Grand Duchy of Luxembourg will be lifted and the Zeebrugge Trading Point (ZTP) will become the gas exchange point in the integrated zone. In addition, balancing rules will be harmonised between the two countries and a new joint entity will be set up to manage the balancing of the integrated zone. Creos Luxembourg and Fluxys Belgium will nevertheless
retain their separate identities and organisational structures.
Sourcing procedures for suppliers currently operating in the Grand Duchy of Luxembourg will be simplified by having direct access to the ZTP, and to LNG (Liquid Natural Gas) and storage facilities in Belgium. Industrial consumers and electricity producers operating in both countries will also be able to optimise their sourcing portfolios.
Our grid-planning priority is to assure maximum equipment reliability, so all new facilities are installed in accordance with the latest DVGW (Deutscher Verein des Gas- und Wasserfaches) specifications.
The aim of all the work carried out so far is to ensure that the infrastructure operates perfectly, thereby ensuring the continuity and quality of the natural gas supply, as well as fulfilling the energy requirements of our residential customers and a cutting-edge, state-of-the art industry with stringent demands for quality of supply, while complying with the requirements to ensure personal safety and protection of the natural environment.
Development of the gas grid2012 2013 2014
TSO (transport) 412.1 km 412.1 km 280.8 km
DSO (distribution) 1,505.5 km 1,537.6 km 1,711.4 km
Total 1,917.6 km 1,949.7 km 1,992.2 km
Progress of major projects planned in the 2014 investment programme
Changes to our grids in 2014 include the reallocation of our equipment between our transport and distribution activities. 136.26km have thus been reassigned from the transport sector (TSO) to the distribution sector (DSO). (Asset Shift TSO to DSO end 2013)
Development of the various gas grids
Interconnection strategy and grid planning
37
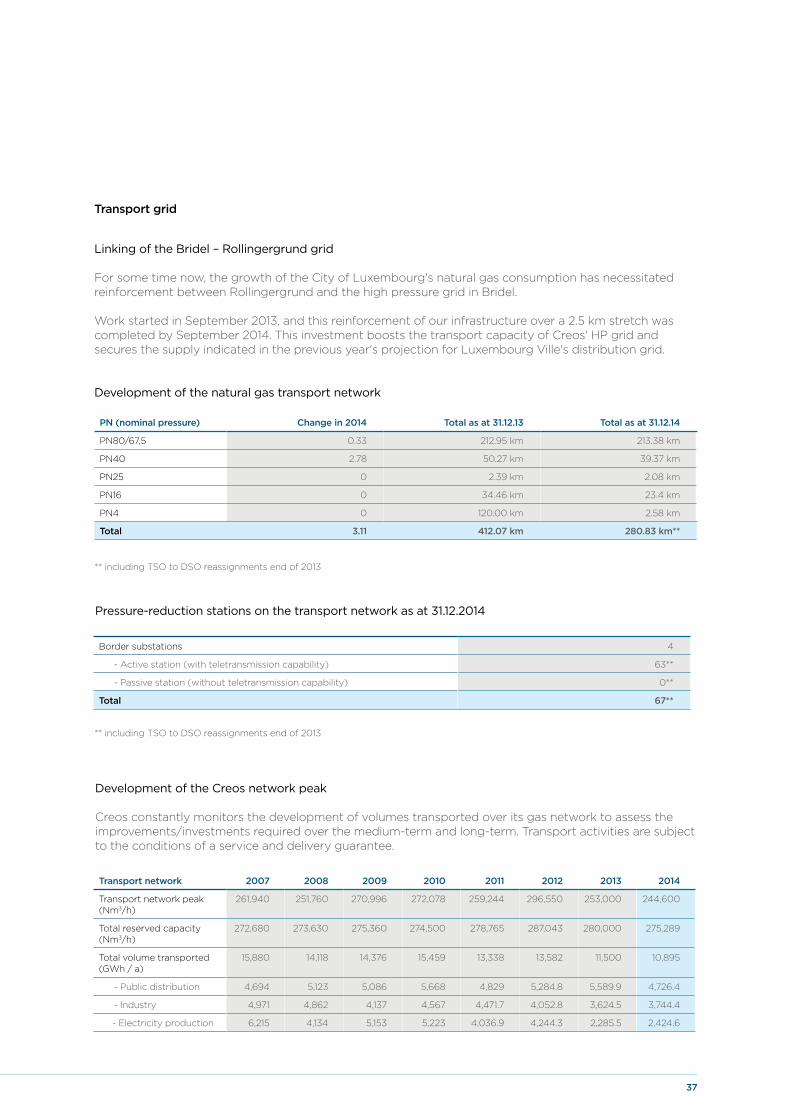
PN (nominal pressure) Change in 2014 Total as at 31.12.13 Total as at 31.12.14
PN80/67,5 0.33 212.95 km 213.38 km
PN40 2.78 50.27 km 39.37 km
PN25 0 2.39 km 2.08 km
PN16 0 34.46 km 23.4 km
PN4 0 120.00 km 2.58 km
Total 3.11 412.07 km 280.83 km**
** including TSO to DSO reassignments end of 2013
Border substations 4
- Active station (with teletransmission capability) 63**
- Passive station (without teletransmission capability) 0**
Total 67**
** including TSO to DSO reassignments end of 2013
Transport network 2007 2008 2009 2010 2011 2012 2013 2014
Transport network peak (Nm3/h)
261,940 251,760 270,996 272,078 259,244 296,550 253,000 244,600
Total reserved capacity (Nm3/h)
272,680 273,630 275,360 274,500 278,765 287,043 280,000 275,289
Total volume transported (GWh / a)
15,880 14,118 14,376 15,459 13,338 13,582 11,500 10,895
- Public distribution 4,694 5,123 5,086 5,668 4,829 5,284.8 5,589.9 4,726.4
- Industry 4,971 4,862 4,137 4,567 4,471.7 4,052.8 3,624.5 3,744.4
- Electricity production 6,215 4,134 5,153 5,223 4,036.9 4,244.3 2,285.5 2,424.6
Transport grid
Linking of the Bridel – Rollingergrund grid
For some time now, the growth of the City of Luxembourg's natural gas consumption has necessitated reinforcement between Rollingergrund and the high pressure grid in Bridel.
Work started in September 2013, and this reinforcement of our infrastructure over a 2.5 km stretch was completed by September 2014. This investment boosts the transport capacity of Creos' HP grid and secures the supply indicated in the previous year's projection for Luxembourg Ville's distribution grid.
Development of the natural gas transport network
Pressure-reduction stations on the transport network as at 31.12.2014
Development of the Creos network peak
Creos constantly monitors the development of volumes transported over its gas network to assess the improvements/investments required over the medium-term and long-term. Transport activities are subject to the conditions of a service and delivery guarantee.
38 Management Report and Statistics
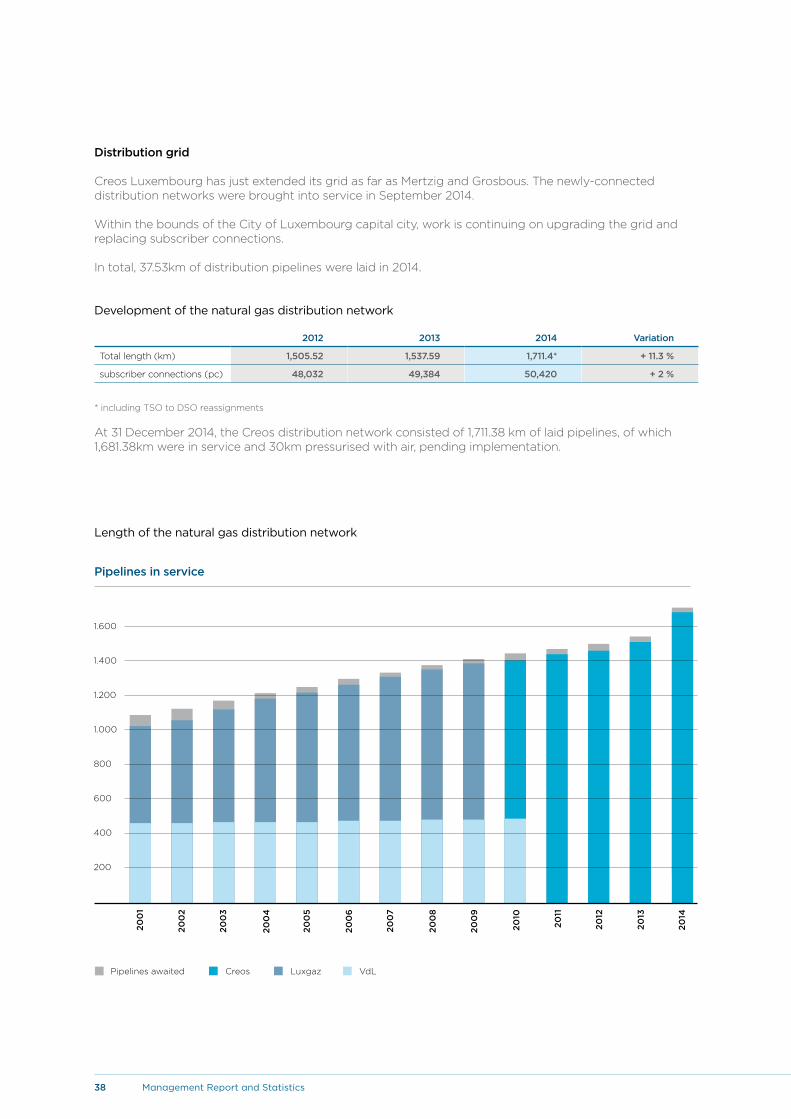
2012 2013 2014 Variation
Total length (km) 1,505.52 1,537.59 1,711.4* + 11.3 %
subscriber connections (pc) 48,032 49,384 50,420 + 2 %
Distribution grid
Creos Luxembourg has just extended its grid as far as Mertzig and Grosbous. The newly-connected distribution networks were brought into service in September 2014.
Within the bounds of the City of Luxembourg capital city, work is continuing on upgrading the grid and replacing subscriber connections.
In total, 37.53km of distribution pipelines were laid in 2014.
Development of the natural gas distribution network
* including TSO to DSO reassignments
At 31 December 2014, the Creos distribution network consisted of 1,711.38 km of laid pipelines, of which 1,681.38km were in service and 30km pressurised with air, pending implementation.
Length of the natural gas distribution network
Pipelines in service
1.400
1.200
1.600
1.000
800
600
400
200
2011
Creos
2013
2014
2012
Luxgaz VdL
200
1
200
2
200
3
200
4
200
5
200
6
200
7
200
8
200
9
2010
Pipelines awaited
39
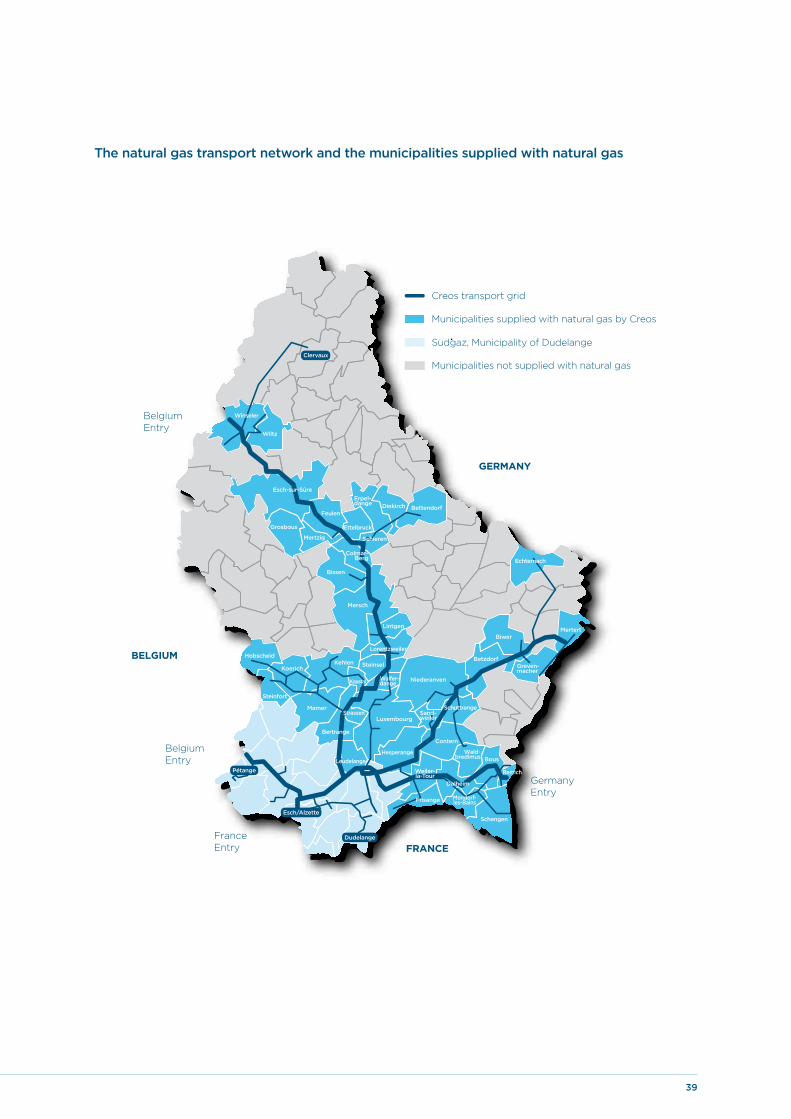
The natural gas transport network and the municipalities supplied with natural gas
Sudgaz, Municipality of Dudelange
Municipalities not supplied with natural gas
Municipalities supplied with natural gas by Creos
Creos transport grid
France Entry
Belgium Entry
Belgium Entry
Germany Entry
FRANCE
BELGIUM
GERMANY
Bettendorf
Schengen
DiekirchErpel-dange
Ettelbruck
Schieren
Feulen
Mertzig
Bissen
Grosbous
Mersch
Wiltz
Lintgen
Kehlen
Niederanven
Biwer
Greven-macher
Mertert
Luxembourg
Mamer
Steinfort
Hobscheid
Mondorf-les-Bains
Bous
Remich
Contern
Esch-sur-Sûre
Colmar-Berg
Lorentzweiler
Steinsel
Kopstal
Koerich
Strassen
Bertrange
Sand-weiler
LeudelangeHesperange
Schuttrange
Wald-bredimus
Betzdorf
Winseler
Dalheim
Frisange
Walfer-dange
Weiler-la-Tour
Dudelange
Esch/Alzette
Pétange
Clervaux
Echternach

40 Management Report and Statistics
Miscellaneous investments
Smart Meter project
In early 2014, Creos and other electricity and gas grid operators held a joint tender call for a national smart metering solution. Evaluation of the bids led to the choice of the suppliers for the remote management station and of the equipment to be installed on-site. At the same time, the groundwork began for the mass deployment of smart meters.
Roost Centre and Workshops - an innovative architectural concept
After a two-year planning phase followed by two years' construction, 230 of our employees moved into their new workplace at Roost. Creos has thus completed a first strategic step in relocating and optimising its regional sites.
The new building houses the former Wiltz and Heisdorf regional electricity Centres, the Heisdorf high voltage Centre, the Contern regional gas Centre and the Mersch workshops and central warehouse. Its primary role is constructing, operating and maintaining the electrical and natural gas grids in Luxembourg's central and northern regions. Central relocation of several local sites has made for synergy gains with the aim of streamlining the customer service organisation while controlling costs. As the human dimension is always a primary concern at Creos, the building needed to be functional and practical, and at the same time a pleasant and harmonious living and working space.
LightThe base, clad in extruded aluminium, is overhung by three glass blocks with a double-skin façade.
The space inside the three blocks has special lighting that adjusts automatically to external light levels. This distinctive and original design creates subdued lighting and naturally controlled warmth. Thorough planning of light management helps to ensure comfort and well-being in the workspace.
The energy conceptTo ensure personal comfort and well-being, the light is managed and controlled, and temperature, humidity and air quality are monitored to optimise energy consumption. 100 % of cooling require-ments and 60 % of heat requirements are provided by a heat pump equipped with probes reaching almost 100m below ground. The ventilation system provides an exchange of clean and thermally- conditioned air, recovering a maximum of energy.
The Roost building will react to changes in light, temperature and air quality in order to provide its occupants with the highest level of comfort and optimal working conditions.
IT projects
The following major projects were completed in 2014:- implementation of the new stock management
system using cutting-edge technology (scanners, chaotic stock management, enhanced automation),
- preparation of the tools required for the roll-out of smart meters and drawing up specifications for smart meter management tools,
- preparing separation scenarios for the Enovos and Creos information systems,
- preparing workforce management tools and scenarios for our teams of fitters.
41
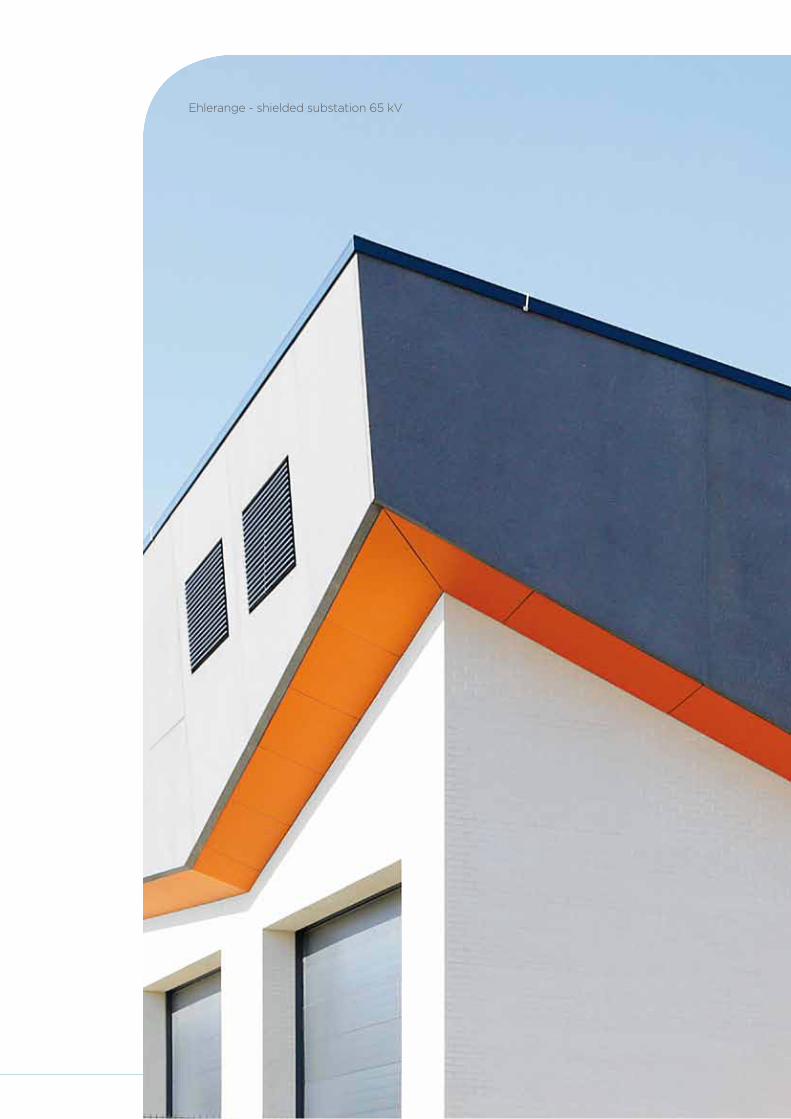
Ehlerange - shielded substation 65 kV
42 Management Report and Statistics
Unlike chemical fuel, electrical energy cannot be stored in its original form. For this reason there must be a constant balance between the energy injected into the grid and the energy drawn from supply points. Any imbalance between injections and withdrawals results in variations in frequency, which must be compensated in real time by the transport network operators.
To ensure a perfect and permanent balance between demand and production, Creos Luxembourg S.A. has been appointed by the Ministry of the Economy to coordinate the balance of the Luxembourg grid. The balance coordinator coordinates energy exchanges with neighbouring adjustment zones and with various operators (producers, suppliers and network operators) at work in the Creos zone.
To coordinate these exchanges of electrical energy, a "balance perimeter" is attributed to all operators in the Creos zone. To this end, a "balance contract" is signed between Creos (the balance coordinator) and each operator responsible for balancing supply and demand within its perimeter. This contract stipulates, inter alia, that each supplier must make daily projections for its customers' total electrical energy requirements.
Transport network operators such as Creos need these short-term forecasts for the load on their network so that they can supply the appropriate quantity of energy. The balance manager must send the balance coordinator the most accurate possible daily estimates of next-day consumption for its balance perimeter(s), called a "nomination", so as to supply the appropriate quantity of energy
through energy exchanges with other balance perimeters. These "nominations" list, for every 15-minute period, all the energy transactions of a balance perimeter with other balance perimeters. The balance coordinator ensures consistency of the "nominations", and projects the total estimated charge curve for the adjustment zone.
The next day, the customers' actual consumption naturally differs from the previous day's estimates, and actual supply seldom matches the forecasts exactly. To maintain the balance between sup-ply and demand, Creos has a contract with the upstream grid, Germany's Amprion network, which provides supplies that correspond to actual demand. The difference between forecasts and actual requirements, or "balancing energy", is either taken back by Amprion, if forecasts were higher than actual demand, or supplied by Amprion, in the contrary case.
At the end of each day a report is drawn up for each balance perimeter for the differences thus identified and a cost is allocated according to market principles.
To apportion the resulting cost among the various balance managers, the balance coordinator must allocate an "adjustment energy" quota to each balance manager. The balance coordinator re-invoices the balancing costs in full, with fair apportionment, to the balance managers when drawing up the adjustment reports. This is also commonly referred to as "balancing".
In 2014 there were 26 balance perimeters.
4 Coordinating Balance and managing Nominations (Electricity)

43
5 Human Resources
Change in workforce and key figuresAverage workforce for the year was 650, of which 536 for Creos Luxembourg S.A., and 114 persons made available by the City of Luxembourg. The group is active in the employment market, hiring through both internal and external recruitment. It also takes part in job fairs and attends school and university recruitment events. In 2014, Creos Luxembourg S.A. recruited 32 people on permanent contracts for its departments. 12 people also joined the company on fixed-term contracts.
In total, eight different nationalities are represented at Creos: Luxembourg, French, German, Belgian, Italian, Portuguese, Dutch and Bosnian.
Women account for 7.51 % of the total workforce of the company.
Ongoing professional trainingWith a view to ensuring the transfer of skills and know-how as part of the integration process, prospective career management and skills planning process, ongoing training is a way of meeting the need for skills in a rapidly changing energy sector. The group’s HR strategy remains focused on managing and developing skills. The percentages in the table next page show the investments made in the different macro areas of training. Investment in professional training accounts for 2.97 % of the overall payroll. 47 % of all training was delivered by internal trainers and 53 % by external trainers.
We would like to congratulate and thank all our employees for their commitment and the services delivered throughout 2014, as well as their dedication which allowed our company to reach its goals.
Itzig/Blooren - shielded substation 220 kV
44 Management Report and Statistics
6 Health and Safety
The philosophy of Creos Luxembourg's HSE department is to guarantee health and safety at the workplace, in particular by risk prevention.
Values, standards and directives are in place to protect the general public, the environment and also our personnel.
Financial returns never take precedence over health, safety or environmental protection. There is no justification, however, important or urgent, for neglecting HSE principles.
Health and safety training and information at Creos LuxembourgElectricians and gas fitters face certain risks. To raise employee awareness of risks and to prevent accidents in the workplace, Creos Luxembourg's HSE departments organises regular safety seminars and training sessions.
In 2014, two safety seminars were held for personnel in risky positions.
Following the training sessions, Creos Luxembourg issued 14 Sachkundiger certificates to gas fitters. 20 electricians were awarded their Schaltberechtigung, authorising them to perform connection operations on the electricity grid. 29 employees passed the Working at Heights course and 31 attended the First Aid course.
2014 workplace accidents and severity ratesCreos Luxembourg recorded a total of 64 accidents during 2014. For the personnel of Creos Luxembourg, and the City of Luxembourg electricity and gas departments, we recorded 41 minor accidents, and 23 accidents that laid the victims off work for more than 3 days. The main causes were commuting accidents, (31 %), wrong movements (11 %) and falls (8 %).
The severity rate of Creos Luxembourg's accidents during 2014 was 0.42. This rate is defined as the ratio of calendar days lost to total productive (worked) hours, multiplied by 1,000. The target rate, set at a maximum of 0.4, was slightly exceeded.
Breakdown of work accidents and commuting accidents
Company Work accidents Commuting accidents
Creos Luxembourg 35 18
Creos worforce of City of Luxembourg 9 2
Total 44 20

45
7 Creos Deutschland GmbH
Creos Deutschland transports natural gas through its near-1,700km high pressure grid in the Sarre and Rhineland-Palatinate regions. The company is responsible for managing natural gas transport and for constructing, operating and maintaining high pressure gas pipelines and the associated technical installations. Personnel with advanced technical, commercial and legal know-how provide optimal management of the energy networks.
Technical and commercial activity
2014 was marked by an increase in technical activity and the completion of numerous projects, with higher investment than in 2013.
The company slightly exceeded its budget-forecast financial results. In 2014, a dividend of EUR 7.75 million was paid to Creos Luxembourg in respect of the 2013 financial year:
Relocation of Creos Deutschland's registered office
In 2014, Creos Deutschland GmbH bought a plot of land in Homburg and will relocate its registered office from Saarbrücken to Homburg during 2016. Construction work will start in 2015.
The Saarbrücken site will be closed for financial and logistical reasons, and Creos Deutschland's operating centres will reduce from four sites to three: Homburg, Völklingen and Frankenthal.
Homburg will be the central site, hosting Creos Deutschland's main activities.This reorganisation will result in significant cost savings and the streamlining of working procedures.
Key figures2013 2014
Gas transport (GWh) 29,493 25,533
Revenues (MEUR) 78.5 88.9
EBITDA (MEUR) 19.2 21.1
EBIT (MEUR) 14.0 15.5
Profit for the year (MEUR) 8.2 8.7
Workforce 101 108
Investments (MEUR) 11.4 13.9

Ehlerange - shielded substation 65 kV

III. Management Report of the Board

48 Management Report of the Board
1 Grid Activities
The framework for the organisation of the energy markets has been defined within the 3rd European energy package. Its transposition to the Luxembourgish context is more precisely defined by the Laws on electricity and gas markets dated 7 August 2012.
The main principle is a strict separation between the energy grid infrastructure management and other activities such as production, sale, purchase, trading of energy. Within the Enovos Group, Creos is in charge of the grid activities (planning, building, operating and maintaining gas and power networks).
Regulation and Non-discrimination
Network access is organised and supervised by a regulator, in this case the Luxembourg Institute of Regulation (ILR). The regulator’s task in particular is to ensure non-discrimination, effective competition and the efficient operation of the markets. Furthermore for the grid activities the regulator sets the tariffs which all users of the network have to pay. The main six activities of Creos (which compose more than 95 % of its turnover) are all fully regulated activities: Transport of electricity (TSO power), transport of gas (TSO gas), distribution of electricity (DSO power), distribution of gas (DSO gas), as well as metering of both electricity and gas.
2014 was the second year of the first regulatory period under the so-called “incentive regulation” which caps the allowed operational expenses of a network operator. Thus the regulatory framework under which Creos operated remained unchanged compared to the previous year (and will remain so until 2016 included). Detailed information on the applicable regulation as well as the tariffs approved for Creos can be found on www.ilr.lu.
As required by the law, Creos Luxembourg S.A. has established a programme containing the appropriate measures to exclude any
discriminatory practice in the treatment of different network users. The programme and its annual monitoring are published on our Internet site at www.creos.net. Within the Enovos Group a further clearly visible milestone in the unbundling process was reached in 2014 by the move of all Enovos personnel from Strassen to Esch – ensuring thus a clear physical separation between the grid management (Creos Luxembourg S.A.) and the other activities within the group.
Highlights of the past year
A safe and reliable energy transport and distribution infrastructure is a key element to guarantee the well-being of citizens and the sustainable development of a country’s economy. That is why security of supply remains the top priority of Creos and why Creos continues to heavily invest in its power and gas networks in order to be able to meet future energy demand requirements, to accommodate the development of renewable energies and to prepare new sectors such as electro-mobility, distributed storage, etc.
2014 has been a record year concerning investments for Creos – never before in its history has the company invested so much in its grids and operations, namely EUR 130 million. This big investment program, driven mainly by the expansion of the high voltage grid and the deployment of the smart meters will continue for the next few years before tapering of towards EUR 100 million at the horizon of 2018.
Besides reinforcing its own national grid, Creos has been very active on the European level by working together with the adjacent TSO’s in order to drive forward a regional market integration (gas) respectively create new connections between adjacent markets (power). With these efforts Creos positions itself clearly within the spirit of the European Directive 2009/73/EC, which aims to get the Member States to evolve towards creating a barrier-free single market.

49
Operations
An important milestone for Creos in 2014 was the inauguration of its new operational site in Roost. In this new building, Creos has concentrated the former activities of the regional sites of Wiltz, Heisdorf, Contern, as well as the central warehouse of Mersch. This move, together with other ongoing efficiency initiatives, will allow Creos to optimize its operational costs and thus continue to thrive within the framework of the incentive regulation.
Power
The single largest investment programme of Creos Luxembourg relates to the construction of a new high voltage line (and the transforming stations connected to it) surrounding Luxembourg-City on the East and creating a new North-South connection within the country. Work on this line and its stations continued in 2014 and the first half of the line should be completed in 2015.
Together with Elia (the Belgium TSO) and in cooperation with Amprion (the TSO on the German side), Creos is also creating a new interconnector of the Luxembourg public power grid with Belgium. Discussions around this project which will connect the Belgium and the German market areas have progressed in 2014 and in particular Creos has placed an order for an Phase Shift Transformer which will be installed in 2015 in order to be able to control the electricity flows of this new interconnector. The expectation is to start operating this interconnector at the end of the year 2015.
Natural gas
In close collaboration with Luxembourg's regulatory authority (ILR) and Belgium's Regulatory Commission for Electricity and Gas (CREG), Creos Luxembourg and Fluxys Belgium have signed in May 2014 a cooperation agreement aimed at integrating the two countries' gas
markets. Merging the Belgian and Luxembourg gas markets into one will strengthen the security of supply in Luxembourg and improve overall market functioning. The establishment of a borderless gas market covering the two countries will be the first market integration of this kind between two EU Member States.
Work on the regulatory framework surrounding this integration project (note that Creos Luxembourg and Fluxys Belgium will continue to manage their respective networks) has been going during the year and a public consultation on the harmonised rules for the new “BeLux” market has been launched in February 2015. It is expected that the BeLux market will become operational with the gas year starting in October 2015.
On the infrastructure side, most activity of Creos in 2014 has been concentrated on an important renewal effort of the distribution gas grid of the City of Luxembourg.
Metering
All distribution grid operators (power and gas) in Luxembourg are mandated by law to replace all existing metering devices with “smart meters” by 2020. Together with the other operators, Creos has created the joint venture Luxmetering G.I.E. as a common and unique platform in Luxembourg for smart meters. In 2014, suppliers for both the IT system of the central platform as well as the meter hardware (power and gas) were selected. The first of the selected meters will be delivered in 2015 and the large scale general roll-out of smart meters in the country is anticipated to start in 2016.
50 Management Report of the Board
Proposed appropriation of net profit
The profit available for appropriation of EUR 81,850,850 includes the net profit for the year of EUR 67,494,477, the reversal of the blocked reserve (wealth tax) of EUR 8,000,000 and the profit brought forward of EUR 6,356,373.
The Board of Directors proposes to the Annual Shareholder’s Meeting to be held on 12 May 2015 the following appropriation of net profit:
Dividend of 3 euros per share * 29,812,554
Allocation to the blocked reserve (5 % of net profit until 10 % of subscribed capital) 0
Allocation to the blocked reserve 12,100,000
Allocation to other reserve 35,000,000
Amount carried forward 4,938,296
81,850,850
* Number of shares: 9,937,518 (total shares issued of 9,942,563 minus 5,045 own shares)
2 Financial Results
Profit and loss account
Net turnover reached EUR 223,240,338 in 2014 (EUR 202,518,546 in 2013). Increase in net turnover (see note 16) is mainly due to the increase of gas grid sales following grid tariff increases applied since January 2014 and the impact of balancing energy sales (with no impact on the Earnings Before Interest, Taxes, Depreciation and Amortization (“EBITDA”) as compensated by purchases for the same amount).
The current operating result (EBITDA) was EUR 117,310,357 in 2014 (EUR 111,564,071 in 2013), as a result of increased revenues and a higher own work capitalized due to a stronger investment activity.
Profit for the financial year was EUR 67,494,477 (EUR 64,242,369 in 2013). It includes a dividend received from Creos Deutschland of EUR 7,750,032 (EUR 8,912,537 in 2013).
Balance sheet
There has been no change in subscribed capital of the company since the Extraordinary Meeting of Shareholders held on 6 January 2011 which approved the contribution of the gas and electricity networks of the City of Luxembourg to Creos Luxembourg S.A. with the issue of new shares. The subscribed capital amounts to EUR 198,851,260 and the share premium to EUR 189,562,253.
Risk Management objectives and policies
The main risks the company has to manage are accidents to people (internal and third parties) and network damage because of certain climatic events.
51
3 Outlook
Creos Luxembourg S.A. will continue in 2015 and in the following years to implement a significant plan for investment and maintenance to modernize its networks in order to ensure their safety and reliability. The company will also continue to actively prepare the introduction of the so-called “smart” meters (general roll-out scheduled to start in 2016) and “smart” grids.
Since 1 January 2013, a new “incentive” regulation is in force for a first application period until 2016, according to the ILR regulations E/12/05 (electricity) and E/12/06 (gas) as of 22 March 2012.
At this stage, the company does not foresee any technical or financial development likely to raise issues on its economic or financial situation.
4 Auditor
The mandate of the external independent statutory auditor, PWC, will come to term with the audit of the financial year 2014. The Board of Directors will submit a proposal on this behalf to the Annual General Meeting of Shareholders.
Luxembourg, 12 March 2015The Board of Directors
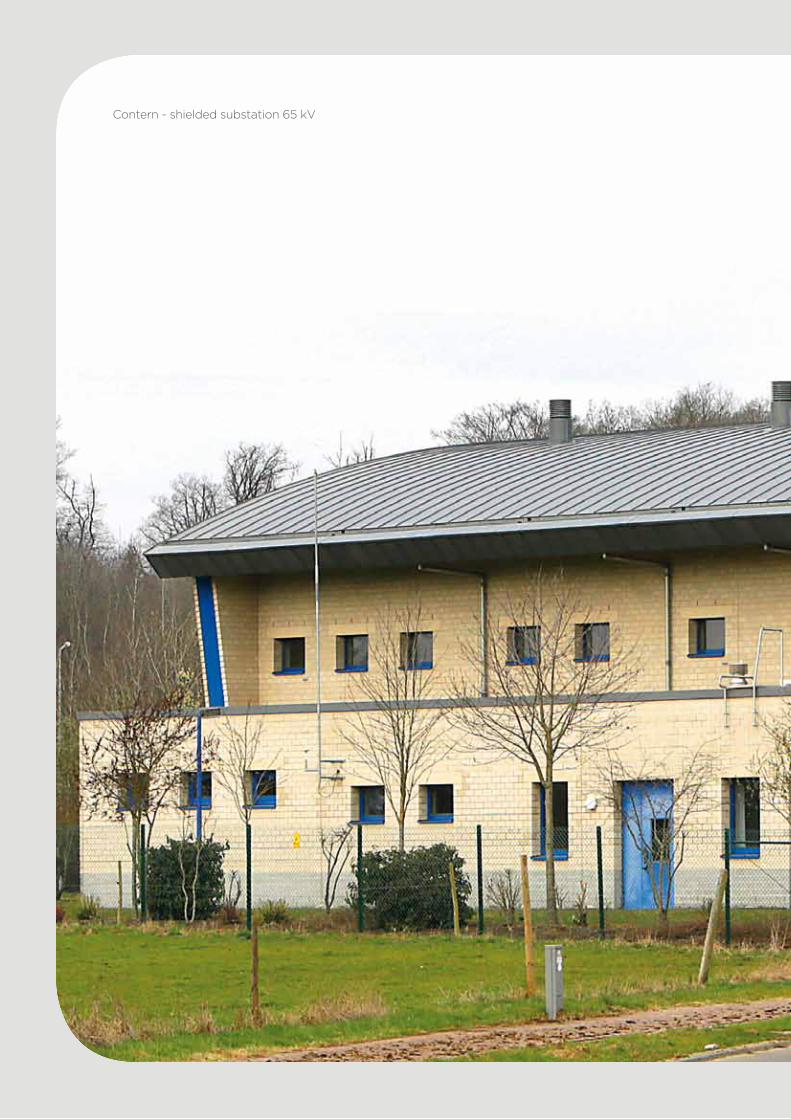
Contern - shielded substation 65 kV

IV. Annual Accounts
54 Annual Accounts
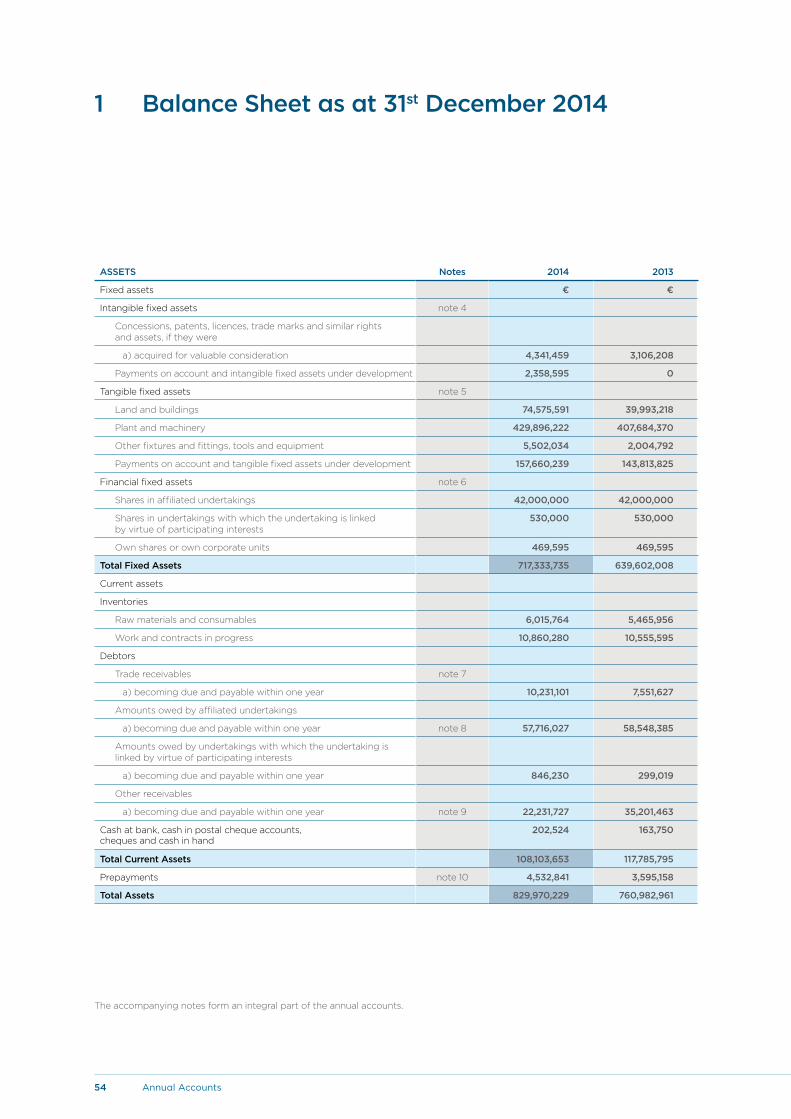
1 Balance Sheet as at 31st December 2014
ASSETS Notes 2014 2013
Fixed assets € €
Intangible fixed assets note 4
Concessions, patents, licences, trade marks and similar rightsand assets, if they were
a) acquired for valuable consideration 4,341,459 3,106,208
Payments on account and intangible fixed assets under development 2,358,595 0
Tangible fixed assets note 5
Land and buildings 74,575,591 39,993,218
Plant and machinery 429,896,222 407,684,370
Other fixtures and fittings, tools and equipment 5,502,034 2,004,792
Payments on account and tangible fixed assets under development 157,660,239 143,813,825
Financial fixed assets note 6
Shares in affiliated undertakings 42,000,000 42,000,000
Shares in undertakings with which the undertaking is linkedby virtue of participating interests
530,000 530,000
Own shares or own corporate units 469,595 469,595
Total Fixed Assets 717,333,735 639,602,008
Current assets
Inventories
Raw materials and consumables 6,015,764 5,465,956
Work and contracts in progress 10,860,280 10,555,595
Debtors
Trade receivables note 7
a) becoming due and payable within one year 10,231,101 7,551,627
Amounts owed by affiliated undertakings
a) becoming due and payable within one year note 8 57,716,027 58,548,385
Amounts owed by undertakings with which the undertaking is linked by virtue of participating interests
a) becoming due and payable within one year 846,230 299,019
Other receivables
a) becoming due and payable within one year note 9 22,231,727 35,201,463
Cash at bank, cash in postal cheque accounts, cheques and cash in hand
202,524 163,750
Total Current Assets 108,103,653 117,785,795
Prepayments note 10 4,532,841 3,595,158
Total Assets 829,970,229 760,982,961
The accompanying notes form an integral part of the annual accounts.

55
LIABILITIES Notes 2014 2013
Capital and reserves note 11 € €
Subscribed capital 198,851,260 198,851,260
Share premium and similar premiums 189,562,253 189,562,253
Reserves
Legal reserve 19,885,126 19,885,126
Reserve for own shares or own corporate units 469,595 469,595
Other reserves 122,785,486 90,660,405
Profit brought forward 6,356,373 3,776,558
Profit for the financial year 67,494,477 64,242,369
Total Capital and reserves 605,404,570 567,447,566
Provisions
Provisions for pensions and similar obligations note 12.1 30,732,979 31,170,966
Other provisions note 12.2 7,262,342 3,824,897
Total Provisions 37,995,321 34,995,863
Non Subordinated debts
Payments received on account of orders as far as they are not deducted distinctly from inventories
a) becoming due and payable within one year 10,486,294 8,919,863
Trade creditors
a) becoming due and payable within one year 35,342,002 33,725,837
Amounts owed to affiliated undertakings
a) becoming due and payable within one year note 13 17,411,897 16,685,523
b) becoming due and payable after more than one year note 13 90,000,000 65,000,000
Amounts owed to undertakings with which the undertaking is linked by virtue of participating interests
a) becoming due and payable within one year 316,937 3,930
Tax and social security debts
a) tax debts note 15 8,241,416 10,200,591
b) social security debts 2,534,559 2,382,280
Other creditors
a) becoming due and payable within one year 1,068,281 953,661
Total Non Subordinated debts 165,401,386 137,871,685
Deferred income note 10 21,168,952 20,667,847
Total Liabilities 829,970,229 760,982,961
The accompanying notes form an integral part of the annual accounts.
56 Annual Accounts
2 Profit and Loss account from 1 January to 31 December 2014
CHARGES Notes 2014 2013
€ €
Use of merchandise, raw materials and consumable materials 31,645,240 23,696,246
Other external charges 42,117,679 36,660,217
Staff costs note 14
a) Wages and salaries 55,813,498 54,082,090
b) Social security on salaries and wages 5,709,405 5,377,836
c) Supplementary pensions costs 2,279,026 1,592,325
Value adjustments
a) on formation expenses and on tangible and intangible fixed assets
notes 4, 5 52,019,682 44,606,592
b) on current assets 0 65,114
Interest and other financial charges
a) concerning affilated undertakings 1,708,271 834,440
b) other interest and similar financial charges 13,977 18,076
Income tax note 15 4,033,787 11,040,358
Other taxes not included in the previous caption 21,400 0
Profit for the financial year 67,494,477 64,242,369
Total Charges 263,306,442 242,215,663
INCOME Notes 2014 2013
€ €
Net turnover note 6 223,240,338 202,518,546
Fixed assets under development note 5 31,651,620 30,162,104
Reversal of value adjustments
a) on assets notes 7 6,876 0
Other operating income 426,370 357,248
Income from financial fixed assets
a) derived from affilated undertakings note 17 7,750,032 8,912,537
Other interest and other financial income
a) derived from affiliated undertakings 15,468 12,514
b) other interest and similar financial income 215,738 252,714
Total Income 263,306,442 242,215,663
The accompanying notes form an integral part of the annual accounts.
57
3 Notes to the Annual Accounts
Note 1 - General information
Creos Luxembourg S.A. (“the Company”) was incorporated in Luxembourg under the name of Cegedel S.A. on 25th April 1928. The Company is registered under RCS nr. B4513. In the context of the below described operations, the Company has been renamed Creos Luxembourg S.A. in 2009.
Following a business combination in 2009 of the grid activities of Cegedel S.A. and Soteg S.A., the integration of the grid activities of Luxgaz Distribution S.A. in 2010 and the integration of the grid activities of the City of Luxembourg in 2011, the main activities of Creos Luxembourg S.A. are to operate in Luxembourg electricity and gas transport and distribution networks. Creos Luxembourg S.A. holds a 96.88 % participation in Creos Deutschland Holding GmbH, which owns a 100% participation in Creos Deutschland GmbH, a result of the merger in 2009 of Saar Ferngas Transport GmbH in Germany with the network activities of Saar Ferngas AG.
The registered office of the Company is established in Luxembourg.
The regulated activities are under the supervision of a Regulator, namely the “Institut Luxembourgeois de Régulation” (“ILR”).
Annual accounts
The Company's financial year runs from 1st January to 31st December each year. Creos Luxembourg S.A. accounts are consolidated into the Enovos International S.A. financial statements, forming at once the largest and the smallest body of undertaking of which the Company forms a part as a subsidiary undertaking. Enovos International S.A. is established in 2, Domaine du Schlassgoard, L-4327 Esch-sur-Alzette, Luxembourg. The consolidated accounts are available at this address.
Note 2 - Authorizations
Following the two European directives 2009/72 and 73 of 13th July 2009 concerning common rules for the internal markets in electricity and natural gas, and the laws that transposed these directives into national laws, namely the laws of 7th August 2012 regarding the organization of the electricity and natural gas markets, transport and distribution grid management activities have been legally separated from the other activities of generation and sale of electricity and gas.
Note 3 - Summary of significant accounting policies Basis of preparation
The annual accounts have been prepared in accordance with Luxembourg legal and regulatory requirements under the historical cost convention. Accounting policies and valuation rules are, besides the ones laid down by the amended Law of 19th December 2002, determined and applied by the Board of Directors.
The preparation of annual accounts requires the use of certain critical accounting estimates. It also requires the Board of Directors to exercise its judgment in the process of applying the accounting policies. Changes in assumptions may have a significant impact on the annual accounts in the period in which the assumptions changed. Board of Directors believes that the underlying assumptions are appropriate and that the annual accounts therefore present the financial position and results fairly.
The Company makes estimates and assumptions that affect the reported amounts of assets and liabilities in the next financial year. Estimates and judgments are continually evaluated and are based on historical experience and other factors, including expectations of future events that are believed to be reasonable under the circumstances.
58 Annual Accounts
Significant accounting policies
The main valuation rules applied by the Company are the following:
Foreign currency translation
Transactions expressed in currencies other than EUR are translated into EUR at the exchange rate effective at the time of the transaction. Formation expenses and long-term assets expressed in currencies other than EUR are translated into EUR at the exchange rate effective at the time of the transaction. At the balance sheet date, these assets remain translated at historical exchange rates.
Cash at bank is translated at the exchange rate effective at the balance sheet date, exchange losses and gains are recorded in the profit and loss account of the year.
Other assets and liabilities are translated separately respectively at the lower or at the higher of the value converted at the historical exchange rate or the value determined on the basis of the exchange rates effective at the balance sheet date. The unrealised exchange losses are recorded in the profit and loss account. The exchange gains are recorded in the profit and loss account at the moment of their realisation.
Where there is an economic link between an asset and a liability, these are valued in total according to the method described above and the net unrealised losses are recorded in the profit and loss account and the net unrealised exchange gains are not recognised.
Intangible fixed assets
Intangible fixed assets are valued at purchase price including the expenses incidental thereto or at production cost, less cumulated depreciation amounts written off and value adjustments. Where the Company considers that an intangible fixed asset has suffered a durable depreciation in value, these value adjustments are not continued if the reasons for which the value adjustments were made have ceased to apply. The depreciation method is straight-line and the duration three years.
Tangible fixed assets
Tangible fixed assets are recorded at their acquisition price including the expenses incidental thereto or at production costs. Tangible fixed assets are depreciated over their estimated useful economic lives.
Value adjustments for electricity assets are made in accordance with the following principles:
• Buildings,plantandequipmentthatarenotpartofthegrid:straight-linedepreciationbasedonthecoefficients laid down in Article 30 of the Concession Agreement of 11th November 1927 and in the Agreement of 8th September, 1998.
• Buildings,plantandequipmentthatarepartofthegrid:depreciationusingthedeclining-balancemethod based on coefficients equal to double those referred to above for investments completed before 1990, and to triple those referred to above for investments completed thereafter.
• Otherequipment,machinesandfurniture:straight-linedepreciationoveroneyearingeneral.
• FixedassetscontributedbytheCityofLuxembourgorpurchasedfromEchternach:straight-linedepreciation, duration from four to forty years.
Value adjustments for gas assets are made in accordance with the following principles:
• Buildings,plantandequipmentcontributedbyLuxgazDistributionS.A.andbytheCityofLuxembourg:straight-line depreciation, duration from four to forty years.
• Thetangibleassetsboughtsince2010byCreosLuxembourgS.A.aredepreciatedusingthedeclining-balance method, based on coefficients equal to triple to linear and a duration from four to forty years.
When a part of grid assets has to be replaced and cannot be separately identified, no disposal of assets is accounted for and the replaced assets continue to be depreciated with normal rates. This accounting principle has been agreed with the Regulator for the determination of grid tariffs.
59
Where the Company considers that a tangible fixed asset has suffered a durable depreciation in value, an additional write-down is recorded to reflect this loss. These value adjustments are not continued if the reasons for which the value adjustments were made have ceased to apply.
Tangible fixed assets in the course of construction are valued at cost, based on the direct costs of the Company, and are reviewed annually for impairment.
The costs incurred on fixed assets under development created by the Company itself are recorded in the profit and loss account under caption “Fixed assets under development” during the year and are transferred at balance sheet date to the appropriate balance sheet caption.
Financial fixed assets
Shares in affiliated undertakings and participating interests are recorded in the balance sheet at their acquisition cost including the expenses incidental thereto. Amounts owed by affiliated undertakings and amounts owed by undertakings with which the Company is linked by virtue of participating interests are included at their nominal value. In the case of an impairment that the Board of Directors considers as permanent in nature, value adjustments are made in respect to these long-term investments to apply the lower value to be assigned to them at the balance sheet date. These value adjustments are not maintained when these reasons for making them have ceased to exist.
Inventories of raw materials and consumables
Raw materials and consumables are valued at the lower of purchase price calculated on the basis of weighted average cost or market value. Value adjustments are recorded when the estimated realisable value of stocks is lower than the weighted average cost. The value adjustments are not maintained if the reasons for recording them have ceased to exist.
Inventories of finished goods and work and contracts in progress
Finished goods and work and contracts in progress are valued at the lower of production cost including the purchase price of the raw materials and consumables, the costs directly attributable to the product/contract in question and a proportion of the costs indirectly attributable to the product/contract in question, and market value. A value adjustment is recorded where the market value is below the production cost. These value adjustments are not continued if the reasons for which the value adjustments were made have ceased to apply.
Debtors
Debtors are recorded at their nominal value. Value adjustments are recorded when there is a risk that all or part of the amounts concerned may not be recovered. These value adjustments are not maintained if the reasons for recording them have ceased to exist.
Prepayments
This asset item includes expenditures incurred during the financial year but relating to a subsequent finan-cial year.
Provisions
The aim of provisions is to cover clearly defined charges and liabilities which, on the balance sheet date, are either probable or certain but for which the amount or date of occurrence cannot be determined. A review is carried out at year-end to determine the provisions to be recorded for the Company's liabilities and charges. Provisions recorded in previous years are reviewed annually and those no longer needed are released.
Provisions may also be created to cover charges which originate in the financial year under review or in a previous financial year, the nature of which is clearly defined and which at the date of the balance sheet are either likely to be incurred or certain to be incurred as to their amount or the date on which they will arise.

60 Annual Accounts
Provisions for pensions and similar obligations
The Company offers its employees a defined benefit plan and a defined contribution plan.
Defined benefit plan
A defined benefit plan defines an amount of pension benefit that an employee will receive on retirement, usually dependent on one or more factors such as age, years of service and compensation. The liability recognized in the balance sheet in respect of defined benefit pension plans is the present value of the defined benefit obligation at the balance sheet. The defined benefit obligation is measured using the projected unit credit method. The present value of the defined benefit obligation is determined by discounting the estimated future payments by reference to the historical evolution of long term interest rates.
Actuarial gains and losses are charged or credited in the profit or loss in the period in which they arise.
Past-service costs are recognized immediately in the profit or loss account.
Defined contribution plan
A defined contribution plan is a pension plan under which the Company pays fixed contributions to a separate entity and has no legal or constructive obligations to pay further contributions if the fund does not hold sufficient assets to pay all employees the benefits relating to employee service in the current and prior periods. Contributions paid are directly registered in the profit and loss during the year they are paid. The commitment of the Company is limited to the contributions that the Company agreed to pay into the fund on behalf of its employees.
Non subordinated debts
Debts are recorded at their reimbursement value. Where the amount repayable on account is greater than the amount received, the difference is recorded in the profit and loss account when the debt is issued. All fixed costs related to setting up the facilities are depreciated over the duration of the loan. Deferred income
This liability item includes income received during the financial year or preceding years but relating to a subsequent financial year.
Net turnover
Net turnover relates to transportation and distribution of electricity and gas provided as well as related activities as part of the Company's ordinary activities, net of discounts, value-added tax and other taxes directly linked to sales.
Other operating income
Other operating income comprises all income only indirectly linked to usual business activities.
Income from financial fixed assets
Dividend income is recorded when dividends are paid.
61
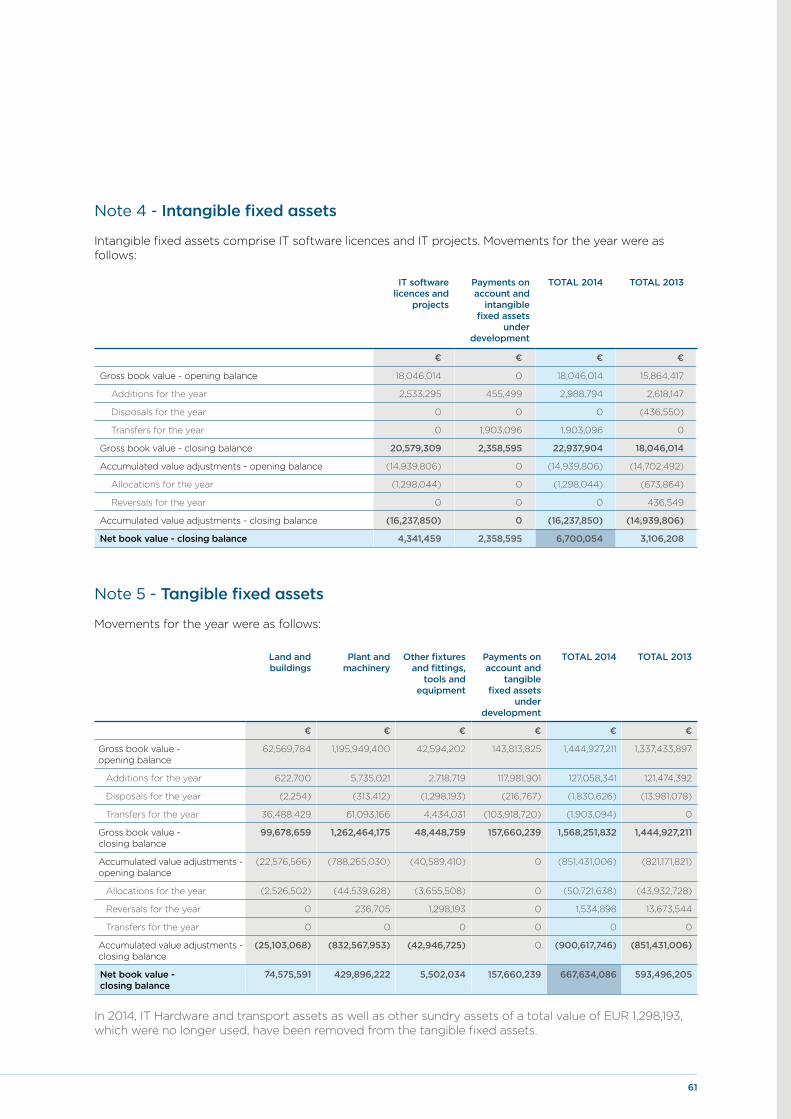
Note 4 - Intangible fixed assets
Intangible fixed assets comprise IT software licences and IT projects. Movements for the year were as follows:
Note 5 - Tangible fixed assets
Movements for the year were as follows:
In 2014, IT Hardware and transport assets as well as other sundry assets of a total value of EUR 1,298,193, which were no longer used, have been removed from the tangible fixed assets.
IT software licences and
projects
Payments on account and
intangiblefixed assets
under development
TOTAL 2014 TOTAL 2013
€ € € €
Gross book value - opening balance 18,046,014 0 18,046,014 15,864,417
Additions for the year 2,533,295 455,499 2,988,794 2,618,147
Disposals for the year 0 0 0 (436,550)
Transfers for the year 0 1,903,096 1,903,096 0
Gross book value - closing balance 20,579,309 2,358,595 22,937,904 18,046,014
Accumulated value adjustments - opening balance (14,939,806) 0 (14,939,806) (14,702,492)
Allocations for the year (1,298,044) 0 (1,298,044) (673,864)
Reversals for the year 0 0 0 436,549
Accumulated value adjustments - closing balance (16,237,850) 0 (16,237,850) (14,939,806)
Net book value - closing balance 4,341,459 2,358,595 6,700,054 3,106,208
Land andbuildings
Plant and machinery
Other fixtures and fittings,
tools and equipment
Payments on account and
tangiblefixed assets
under development
TOTAL 2014 TOTAL 2013
€ € € € € €
Gross book value - opening balance
62,569,784 1,195,949,400 42,594,202 143,813,825 1,444,927,211 1,337,433,897
Additions for the year 622,700 5,735,021 2,718,719 117,981,901 127,058,341 121,474,392
Disposals for the year (2,254) (313,412) (1,298,193) (216,767) (1,830,626) (13,981,078)
Transfers for the year 36,488,429 61,093,166 4,434,031 (103,918,720) (1,903,094) 0
Gross book value - closing balance
99,678,659 1,262,464,175 48,448,759 157,660,239 1,568,251,832 1,444,927,211
Accumulated value adjustments - opening balance
(22,576,566) (788,265,030) (40,589,410) 0 (851,431,006) (821,171,821)
Allocations for the year (2,526,502) (44,539,628) (3,655,508) 0 (50,721,638) (43,932,728)
Reversals for the year 0 236,705 1,298,193 0 1,534,898 13,673,544
Transfers for the year 0 0 0 0 0 0
Accumulated value adjustments - closing balance
(25,103,068) (832,567,953) (42,946,725) 0 (900,617,746) (851,431,006)
Net book value - closing balance
74,575,591 429,896,222 5,502,034 157,660,239 667,634,086 593,496,205
62 Annual Accounts
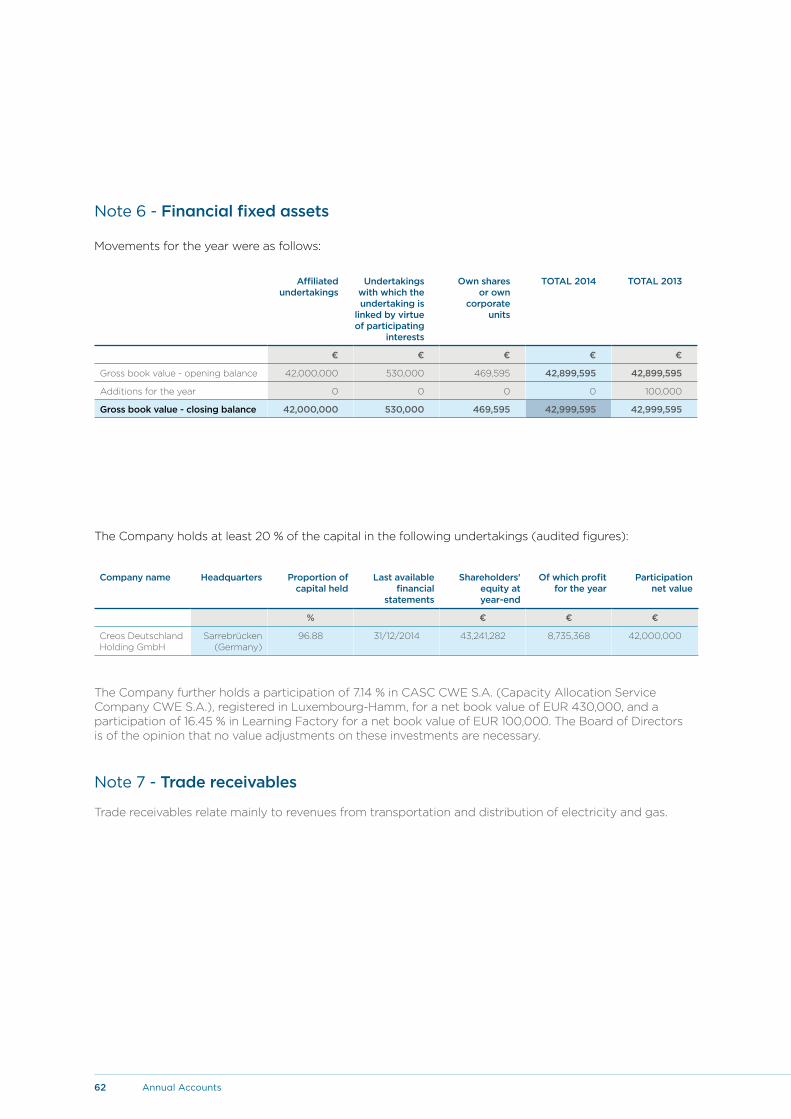
Note 6 - Financial fixed assets
Movements for the year were as follows:
The Company holds at least 20 % of the capital in the following undertakings (audited figures):
The Company further holds a participation of 7.14 % in CASC CWE S.A. (Capacity Allocation Service Company CWE S.A.), registered in Luxembourg-Hamm, for a net book value of EUR 430,000, and a participation of 16.45 % in Learning Factory for a net book value of EUR 100,000. The Board of Directors is of the opinion that no value adjustments on these investments are necessary.
Note 7 - Trade receivables
Trade receivables relate mainly to revenues from transportation and distribution of electricity and gas.
Affiliated undertakings
Undertakings with which the undertaking is
linked by virtue of participating
interests
Own shares or own
corporate units
TOTAL 2014 TOTAL 2013
€ € € € €
Gross book value - opening balance 42,000,000 530,000 469,595 42,899,595 42,899,595
Additions for the year 0 0 0 0 100,000
Gross book value - closing balance 42,000,000 530,000 469,595 42,999,595 42,999,595
Company name Headquarters Proportion of capital held
Last available financial
statements
Shareholders'equity atyear-end
Of which profit for the year
Participation net value
% € € €
Creos Deutschland Holding GmbH
Sarrebrücken (Germany)
96.88 31/12/2014 43,241,282 8,735,368 42,000,000

63
Note 8 - Amounts owed by affiliated undertakings The item “Amounts owed by affiliated undertakings” of EUR 57,716,027 comprises EUR 21,260,225 related to commercial activities with affiliated undertakings (2013: EUR 58,548,385).
Creos Luxembourg S.A. has entered into a cash pooling agreement with Enovos International S.A. which, as of 31st December 2014, owed a cash amount of EUR 36,455,802 to the Company (EUR 35,242,446 as at 31st December 2013). This amount is recorded under the caption “Amounts owed by affiliated undertakings”. The Company paid an interest rate based on Euribor plus a margin for loans (respectivelyis paid an interest based on Euribor minus a margin for deposits).
Note 9 - Other receivables As of 31st December 2014, this caption mainly comprises a receivable of EUR 12,761,393 (2013: EUR 16,691,620) in the context of the mechanism of the “Fonds de compensation”, income tax recoverable of EUR 5,831,600 (2013: EUR 9,416,762), and VAT receivable of EUR 3,222,789 (2013: EUR 8,455,773).
Note 10 – Prepayments and deferred income According to the regulation scheme, the amount of revenues deriving from regulated activities is authorised on an annual basis by the Regulator , the ILR to determine grid tariffs . The difference between actual and authorised revenues is assessed each year by the Regulator. This difference is considered in the determination of the electricity and gas grid tariffs for subsequent years. In case actual revenues are exceeding revenues as accepted by the ILR, tariffs for subsequent years will be reduced and consequently such negative difference is provided for.
According to the regulation scheme, a cumulated difference (2014 and prior years) is calculated individually for each regulated activity (electricity, gas transport, gas distribution, metering electricity, metering gas) and is provided for, when positive, in the caption Prepayments for an amount of EUR 3,514,538 (2013: EUR 2,860,584) and when negative, in the caption Deferred income for an amount of EUR 21,168,952 (2013: EUR 20,667,847).
Furthermore, Creos Luxembourg S.A. participated early 2013 together with the other grid operators in Luxembourg in the “ Luxmetering GIE ” to develop an IT platform dedicated to the smart metering system to come. The GIE has no capital and the financial stake of Creos Luxembourg in the GIE is around 80 %. Cash advances of EUR 745,575 paid to Luxmetering G.I.E. are posted under the caption “Prepayments” (2013: EUR 539,074).
The same caption also comprises prepaid expenses related to rental charges relating to a subsequent financial year for an amount of EUR 92,001 (2013: EUR 92,001).
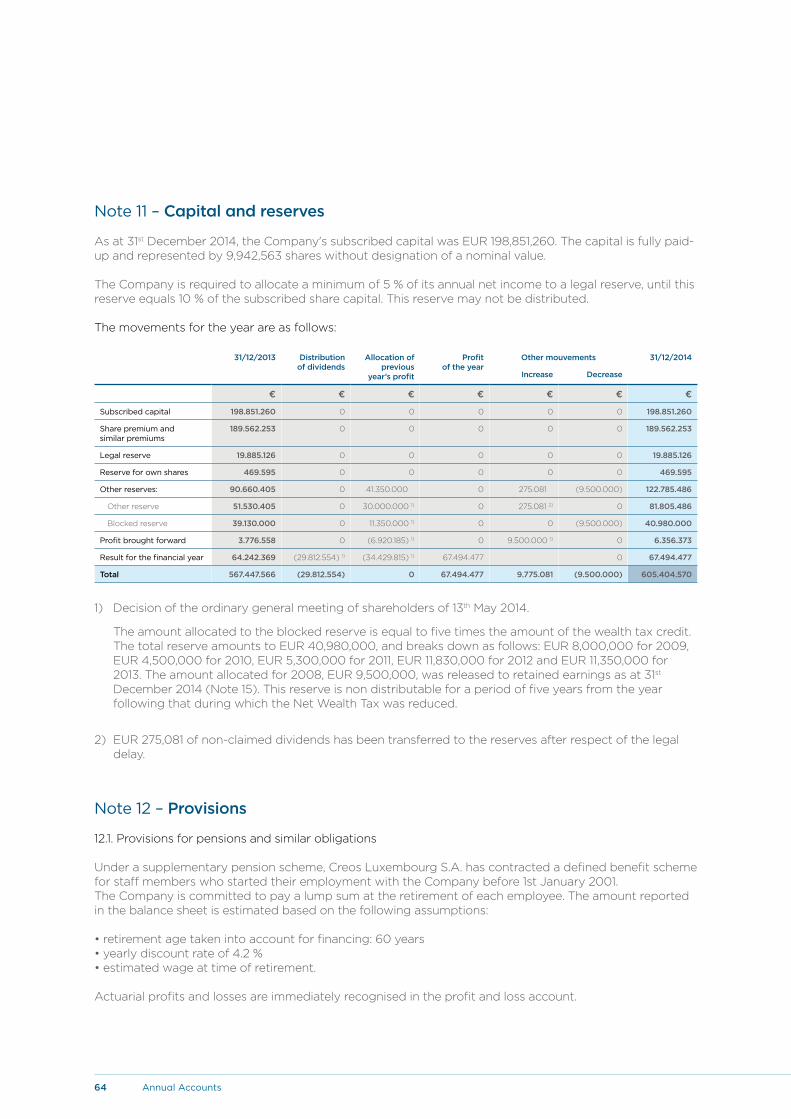
64 Annual Accounts
Note 11 – Capital and reserves As at 31st December 2014, the Company's subscribed capital was EUR 198,851,260. The capital is fully paid-up and represented by 9,942,563 shares without designation of a nominal value.
The Company is required to allocate a minimum of 5 % of its annual net income to a legal reserve, until this reserve equals 10 % of the subscribed share capital. This reserve may not be distributed.
The movements for the year are as follows:
1) Decision of the ordinary general meeting of shareholders of 13th May 2014.
The amount allocated to the blocked reserve is equal to five times the amount of the wealth tax credit. The total reserve amounts to EUR 40,980,000, and breaks down as follows: EUR 8,000,000 for 2009, EUR 4,500,000 for 2010, EUR 5,300,000 for 2011, EUR 11,830,000 for 2012 and EUR 11,350,000 for 2013. The amount allocated for 2008, EUR 9,500,000, was released to retained earnings as at 31st
December 2014 (Note 15). This reserve is non distributable for a period of five years from the year following that during which the Net Wealth Tax was reduced.
2) EUR 275,081 of non-claimed dividends has been transferred to the reserves after respect of the legal delay.
Note 12 – Provisions 12.1. Provisions for pensions and similar obligations
Under a supplementary pension scheme, Creos Luxembourg S.A. has contracted a defined benefit scheme for staff members who started their employment with the Company before 1st January 2001. The Company is committed to pay a lump sum at the retirement of each employee. The amount reported in the balance sheet is estimated based on the following assumptions:
•retirementagetakenintoaccountforfinancing:60years•yearlydiscountrateof4.2%•estimatedwageattimeofretirement.
Actuarial profits and losses are immediately recognised in the profit and loss account.
31/12/2013 Distributionof dividends
Allocation of previous
year’s profit
Profit of the year
Other mouvements 31/12/2014
Increase Decrease
€ € € € € € €
Subscribed capital 198.851.260 0 0 0 0 0 198.851.260
Share premium and similar premiums
189.562.253 0 0 0 0 0 189.562.253
Legal reserve 19.885.126 0 0 0 0 0 19.885.126
Reserve for own shares 469.595 0 0 0 0 0 469.595
Other reserves: 90.660.405 0 41.350.000 0 275.081 (9.500.000) 122.785.486
Other reserve 51.530.405 0 30.000.000 1) 0 275.081 2) 0 81.805.486
Blocked reserve 39.130.000 0 11.350.000 1) 0 0 (9.500.000) 40.980.000
Profit brought forward 3.776.558 0 (6.920.185) 1) 0 9.500.000 1) 0 6.356.373
Result for the financial year 64.242.369 (29.812.554) 1) (34.429.815) 1) 67.494.477 0 67.494.477
Total 567.447.566 (29.812.554) 0 67.494.477 9.775.081 (9.500.000) 605.404.570
65
In addition, in a defined contribution pension scheme for staff members who joined the Company after 1st January, 2001, the Company pays a contribution to an insurance Company that is recorded under expenses for the year. For 2014, expenses for the pension scheme amount to EUR 722,827 (2013: EUR 667,584).
12.2. Other provisions
The caption “Other provisions” comprises provisions to cover liabilities due to employees for holidays not taken and provisions for regulatory risk for an amount of EUR 3,576,279. According to the regulation scheme, the authorised revenue derived from large investment projects can be adjusted based on the actual amounts invested.
Note 13 – Amounts owed to affiliated undertakings As of 31st December 2014, the Company owed EUR 17,411,897 to affiliated undertakings becoming due and payable within 1 year (2013: EUR 16,685,523).
On 26th June 2013, Enovos International issued a German Certificate of Indebtness (Schuldschein) of EUR 102 million with a tenor of 7, 10, 12 and 15 years, of which EUR 65 million were lent to the Company at back-to-back conditions. The interest rate charged reflects the costs incurred by Enovos International S.A. to raise the funds in the financial markets. The Schuldschein bears a floating interest rate for the 7 year tenor and a fix interest rate of 2.81 %, 3.22 % and 3.5 % for the 10, 12 and 15 years tenor respectively. The interests for the floating 7 years tenor are paid twice a year in June and December whereas the interests on the fix tenors are paid in June every year. The interests are appropriately provisioned in the accounts. The accrued interest payable as at 31st December 2014 amounts to EUR 716,777 (2013: EUR 672,512).
On 21th November 2014, Enovos International S.A. issued an additional German Certificate of Indebtedness (“Schuldschein”) of EUR 80 million, of which EUR 25 million were lent to Creos Luxembourg at back-to-back conditions. The interest rate charged reflects the costs incurred by Enovos International S.A. to raise the funds in the financial markets. The Schuldschein bears a fixed interest rate for the 7 years of 1.547 %, 2.004 % for the 10 years and 2.297 % for 12 years. The interests on the fixed tenors are paid in November every year.
Note 14 – Staff costs
Staff costs include salaries, social security costs as well as costs for the pension plans. In 2014, the Company had on average 650 employees (2013: 652). The figure in 2014 includes the staff of the City of Luxembourg made available to Creos Luxembourg S.A. (117 employees), the costs of which are shown under wages and salaries for EUR 11,019,164 (2013: EUR 12,312,680).
Note 15 – Income tax Creos Luxembourg S.A. is subject to all taxes applicable to companies in Luxembourg and the tax provisions have been provided in accordance with the relevant laws. In accordance with paragraph 8a of the Law dated 16th October, 1934 as amended, Creos Luxembourg S.A. will opt for the reduction of the net wealth tax due for the year 2014 by setting up a special reserve equal to five times the amount of the net wealth tax reduced (see note 11). As of 31st December 2014, tax debts cover principally preceding years from 2010 to 2011. For 2012 to 2014, an amount of EUR 5,831,600 is recorded in other receivables (see note 9).

66 Annual Accounts
Note 16 – Net turnover Net turnover for the year 2014 breaks down as follows:
Note 17 – Income from financial fixed assets This caption includes the dividends paid by Creos Deutschland GmbH for an amount of EUR 7,750,032 (2013: EUR 8,912,537).
Note 18 – Remuneration paid to members of the administration and supervisory bodies Remuneration paid to members of the administration and supervisory bodies totalled EUR 768,000 (2013: EUR 565,526). No advance or loan was granted to members of the administration and supervisory bodies, nor was any commitment given on their behalf in respect of any form of guarantee.
Note 19 – Related parties transactions During the financial year, the Company does not conclude any significant transactions with related parties which are not done at market price.
Note 20 – Off balance sheet commitments The Company has issued bank guarantees in the context of its regular business for a total amount of EUR 1,000,000 (2013: EUR 1,000,000).
Note 21 – Post-balance sheet events No major post balance-sheet event has occurred affecting the 2014 accounts.
2014 2013
€ €
Sales grid power 138,707,755 135,271,970
Sales grid gas 41,748,293 34,589,304
Metering revenues 16,356,453 15,533,813
Energy sales power (equilibrium) 1,804,316 (2,801,916)
Other revenue 24,623,521 19,925,375
Total 223,240,338 202,518,546
Energy sales power (Equilibrium) are the differences between nominations made by suppliers and their actual purchases. This difference which can be a cost (or a revenue) for the Company is re-invoiced (or credited) to the suppliers

67
4 Audit Report
Report on the annual accounts
We have audited the accompanying annual accounts of Creos Luxembourg S.A., which comprise the balance sheet as at 31 December 2014, the profit and loss account for the year then ended and a summary of significant accounting policies and other explanatory information.
Board of Directors’ responsibility for the annual accounts
The Board of Directors is responsible for the preparation and fair presentation of these annual accounts in accordance with Luxembourg legal and regulatory requirements relating to the preparation of the annual accounts, and for such internal control as the Board of Directors determines is necessary to enable the preparation of annual accounts that are free from material misstatement, whether due to fraud or error.
Responsibility of the “Réviseur d’entreprises agréé”
Our responsibility is to express an opinion on these annual accounts based on our audit. We conducted our audit in accordance with International Standards on Auditing as adopted for Luxembourg by the “Commission de Surveillance du Secteur Financier”. Those standards require that we comply with ethical requirements and plan and perform the audit to obtain reasonable assurance about whether the annual accounts are free from material misstatement.
An audit involves performing procedures to obtain audit evidence about the amounts and disclosures in the annual accounts. The procedures selected depend on the judgment of the “Réviseur d’entreprises agréé”, including the assessment of the risks of material misstatement of the annual accounts, whether due to fraud or error. In making those risk assessments, the “Réviseur d’entreprises agréé” considers internal control relevant to the entity’s preparation and fair presentation of the annual accounts in order to design audit procedures that are appropriate in the circumstances, but not for the purpose of expressing an opinion on the effectiveness of the entity’s internal control. An audit also includes evaluating the appropriateness of accounting policies used and the reasonableness of accounting estimates made by the Board of Directors, as well as evaluating the overall presentation of the annual accounts.
We believe that the audit evidence we have obtained is sufficient and appropriate to provide a basis for our audit opinion.Opinion
In our opinion, the annual accounts give a true and fair view of the financial position of Creos Luxembourg S.A. as of 31 December 2014, and of the results of its operations for the year then ended in accordance with Luxembourg legal and regulatory requirements relating to the preparation of the annual accounts.
Report on other legal and regulatory requirements
The management report, which is the responsibility of the Board of Directors, is consistent with the annual accounts.
PricewaterhouseCoopersSociété coopérative
Christiane Schaus Luxembourg, 12 March 2015
To the Shareholders of Creos Luxembourg S.A.
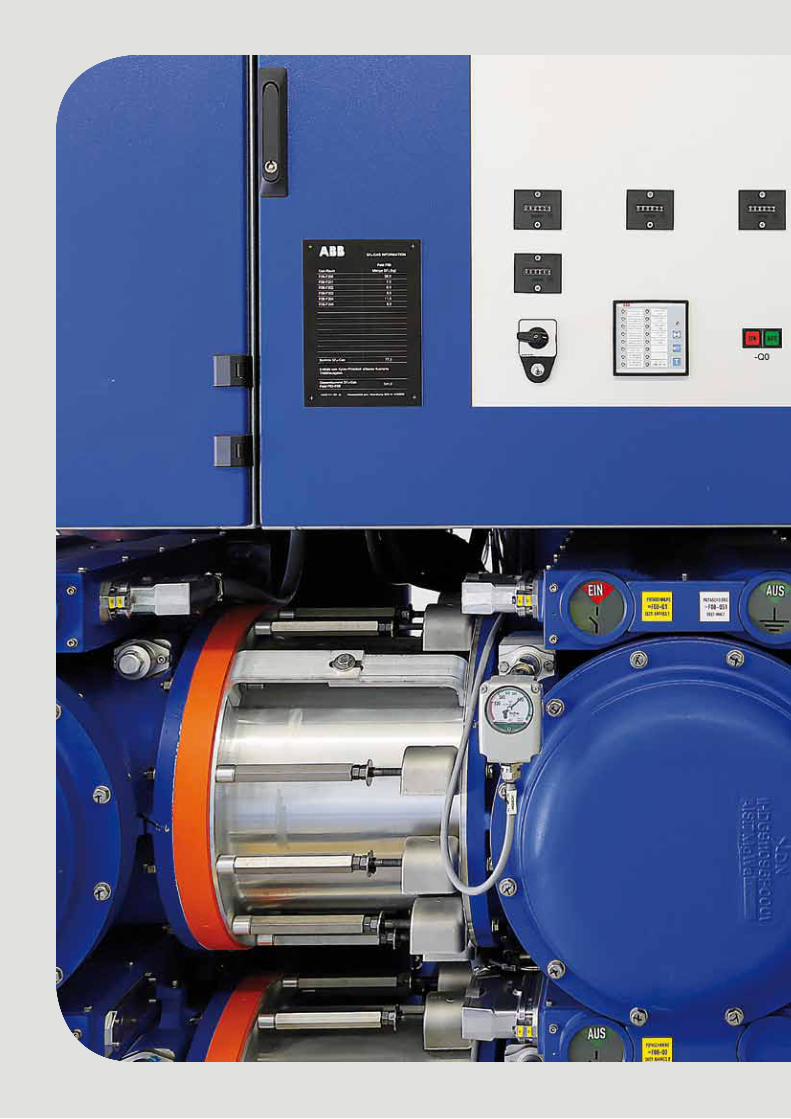

GIS installation with SF6 gas

Energy in motion
Creos Luxembourg Annual Report is published in both English and French.Only the English version may be considered the original; others are simply a free translation.
We would like to thank all those involved in the preparation and publication of this Annual Report.
Publication team:
Coordination:Under the leadership of the Communication Grid Department Creos Luxembourg S.A.
Design and artwork:Brain&More, Agence en communication
Photos:Philippe Hurlin
Printers:Imprimerie Centrale, Luxembourg

Creos Luxembourg S.A.Electricity and natural gas grid operatorLegal headquarters:59-61 rue de Bouillon L-1248 LuxembourgMain offices:2, rue Thomas Edison L-1445 StrassenPostal address: L-2084 LuxembourgTel.: 2624-1 Fax: [email protected]