Covalent and ionic modification of biopolymers for design ...
135
Covalent and Ionic Modification of Biopolymers for Design Properties A Thesis Submitted to the Faculty of Drexel University by Janah Cecelia Szewczyk in partial fulfillment of the requirements for the degree of Master of Science March 2009
Transcript of Covalent and ionic modification of biopolymers for design ...

Covalent and Ionic Modification
of Biopolymers for Design Properties
A Thesis
Submitted to the Faculty of
Drexel University
by
Janah Cecelia Szewczyk
in partial fulfillment of the
requirements for the degree of
Master of Science
March 2009

ii
©2009 Janah Cecelia Szewczyk. All Rights Reserved.

iii Dedication
To my family; especially the memory of my grandmother Virginia, whose commitment to education was only bested by her love for family, graduated
from The Ohio State University at age 71.

iv Acknowledgements
I must thank Dr. Caroline Schauer for her patience in taking on a part time
student; her advice and constant encouragement were always needed and
appreciated; I hope I have not discouraged her from taking on future part time
students. To my thesis committee, Dr. Michelle Marcolongo, and especially Dr.
Christopher Li, a constant professor, your lectures were a joy. My supervisors at
Rohm and Haas Company; Diane Vaessen, Michael Bowe, and Brough Richey,
who encouraged and financed this endeavor, my thanks for putting up with my
tired eyes and college rants. To my colleagues at Rohm and Haas, Wie Xie, Bob
Semet, Ken Laughlin, and Ann Evans who permitted me to beg, borrow, and
steal equipment time, helped with training, and offered a helpful ear; thank you.
To my classmates, labmates, coworkers and colleagues; who made this journey
the true and real reward; especially Valerie Binetti, Michael Birnkrant, Matthew
Cathell, Matthew Hood, and Jessica Schiffman. To my parents, John and Donna
Sorensen, my sister Rebekah, and my Godparents Dana Sorensen and Ann Marie
Jarden for their enduring love and familial harassment, because of them I know
what is truly important in life. Lastly, to Steven, for whom I “wake at dawn with
a winged heart and give thanks for another day of loving”.
Jcs

v Table of Contents
List of Tables.............................................................................................................................................1
List of Equations .....................................................................................................................................1
0BList of Figures ...................................................................................................................................... viii
1BAbstract ......................................................................................................................................................xi
2BChapter 1. Introduction .......................................................................................................................1
3B1.1 The problem to be addressed..........................................................................................1
4B1.2 Carbohydrates .......................................................................................................................1
5B1.3 Glycoproteins and proteoglycans .................................................................................2
6B1.4 Glycosaminoglycans ...........................................................................................................4
7B1.5 Synthesis of glycosaminoglycans..................................................................................6
8B1.6 Hyaluronic acid .....................................................................................................................7
9B1.6.1 Synthesis of hyaluronic acid.................................................................................8
10B1.6.2 Degradation of hyaluronic acid ..........................................................................9
11B1.6.3 Use of hyaluronic acid in‐vivo ............................................................................9
12B1.7 Chitin........................................................................................................................................11
13B1.7.1 Chitin synthesis ........................................................................................................12
14B1.7.2 Alpha and Beta Chitin ...........................................................................................13
15B1.7.2 Harvesting Chitin ....................................................................................................14
16B1.8 Chitosan ..................................................................................................................................14
17B1.8.1 Degree of Deacetylation of Chitosan ..............................................................15
18B1.9 Alginate...................................................................................................................................17
19B1.9.1 Crosslinking alginate .............................................................................................18
20B1.10 Amino acids ..........................................................................................................................19
21B1.11 Carbodiimides and EDC .................................................................................................20
22B1.11.1 EDC reaction and amide formation ................................................................21
23B1.11.2 EDC use with glycosaminoglycans .................................................................21
24BChapter 2. Background ......................................................................................................................24
2.1 25BResearch interest in hyaluronan ..................................................................................24

vi 26B2.1.1 Peptide modification of hyaluronan ...............................................................24
27B2.1.2 Cyclodextran addition to hyaluronan............................................................24
28B2.1.3 Modified glycosaminoglycans films to accelerate wound healing...25
29B2.1.4 Thiol modification of GAG polymers ............................................................26
30B2.2 Research interest in chitin and chitosan ..................................................................29
31B2.2.1 Reaction sites for chitin and chitosan modification .................................29
32B2.2.2 Metal ion absorption ..............................................................................................29
33B2.2.3 Crosslinking chitosan ............................................................................................30
34B2.2.4 Chitosan and glycerol phosphate.....................................................................32
35B2.2.5 Chitosan and tripolyphosphate ........................................................................33
36B2.2.6 Chitosan and thiol modification .......................................................................35
37B2.3 Research interest in alginate..........................................................................................36
38B2.3.1 Alginate and peptide modification .................................................................36
39B2.3.2 Alginate and thiol modification........................................................................38
40B2.3.3 Alginate and silane modification .....................................................................38
41BChapter 3. Experimental Technique ............................................................................................40
42B3.1 Materials .................................................................................................................................40
43B3.2 Characterization of modified biopolymers ............................................................41
44B3.3 Synthesis: glycosaminoglycans and amino acids ................................................42
45B3.4 Synthesis: chitosan and thiol modification.............................................................46
46B3.5 Fluorescent thiol dyes ......................................................................................................48
47B3.5.1 Ellman’s Reagent .....................................................................................................48
48B3.6 Synthesis: alginate and diglycinehistidine .............................................................50
49B3.7 Synthesis: phosphate modification of chitosan and hyaluronan .................52
50B3.8 Synthesis: chitosan and glycerolphosphate ...........................................................53
51B3.9 Synthesis: hyaluronan and glycerolphosphate.....................................................54
52B3.10 Synthesis: hyaluronan and tripolyphosphate .......................................................55
3.11 53BRheology.................................................................................................................................56
54B3.11.1 Introduction of rheology .....................................................................................56

vii 55B3.11.2 Rheology of phosphate modified hyaluronan and chitosan ...............57
56B3.11.3 Test condition of rheometer................................................................................57
57B3.11.4 High performance liquid chromatography .................................................58
58BChapter 4. Results and Discussion ...............................................................................................59
60B44.1 Infrared spectroscopy.......................................................................................................59
4.1.1 Statistical understanding of IR data collected ............................................59
62B4.1.2 Assignment of absorption frequencies ..........................................................59
72B4.2 Infrared spectroscopy of thiolated chitosan...........................................................61
73B4.3 Infrared spectroscopy of diglycinehistidine modified alginate....................63
4.4 Thiol modification of glycosaminoglycans ............................................................67
67B4.4.1 FTIR analysis of cysteine modified glycosaminoglycans......................68
71B4.4.2 UV/Vis spectroscopy of cysteine modified glycosaminoglycans ......75
70B4.4.3 Elemental Analysis of cysteine modified glycosaminoglycans .........80
4.4.4 Conclusions of cysteine modified glycosaminoglycans ........................82
4.5 Non thiol modification of glycosaminoglycans ...................................................83
4.5.1 FTIR analysis of non thiol modified of glycosaminoglycans ..............83
4.5.2 Elemental analysis of non thiolated modified glycosaminoglycans89
68B4.5.3 Summary of non thiolated modified glycosaminoglycans ..................90
74B4.6 Rheometry: Hyaluronan and Glycerol Phosphate..............................................91
75B4.6.1 Varying temperature, varying pH...................................................................91
76B4.7 Rheometry: Hyaluronic Acid and Tripolyphosphate........................................93
4.7.1 Neutral pH; varying temperature....................................................................94
77B4.7.2 Physiologic temperature; varying pH............................................................95
4.7.3 Basic pH, varying temperature .........................................................................96
4.7.4 Discussion of ionic phosphate modification of hyaluronan ................98
79BChapter 5. Conclusions and Future Work ..............................................................................101
80BBibliography .........................................................................................................................................103
Appendix A: Hyaluronan source material .............................................................................111
Appendix B: Infrared peak assignment of hyaluronan ....................................................113

viii Appendix C: Molecular weight of glycosaminoglycans and amino residues .......116

List of Tables Table 1. Glycosaminoglycan polymers and composition .......................................... 6
Table 2. Hyaluronic acid found in the human body and other sources .................. 8
Table 3. Metal ions associated with absorption in neat or modified chitosan. ..... 30
Table 4. Glycosaminoglycan and amino acid reactions. .......................................... 43
Table 5. Chitosan and thiol reactions. ......................................................................... 47
Table 6. Elemental analysis results for thiol modified GAG polymers.................. 81
Table 7. Elemental weight percent of non thiol modified GAG polymers. ........... 90
Table 8. FTIR peak assignments for hyaluronan of sodium salt. ν ‐ stretch bands, δ ‐ bending vibrations.................................................................................................. 114
Table 9. Molecular weight of unmodified hyaluronan, hyaluronan and chondroitin sulfate modified polymers. ................................................................... 116

List of Equations Equation 1. Calculation of degree of deacetylation via NMR. ................................ 16
Equation 2. Substitution of chitosan for hyaluronic acid. ........................................ 54

viii
0BList of Figures Figure 1. Poly(hydroxyl aldehyde) (a) and poly(hydroxyl ketone) (b).................... 2
Figure 2. . Glycoproteins; a) N‐linked and b) O‐linked N‐acetylglucosamine. ...... 3
Figure 3. A proteoglycan: serine branch from peptide, three sugar spacer linking to glycosaminoglycan polymer...................................................................................... 4
Figure 4. Structures of glycosaminoglycan polymers ................................................ 7
Figure 5. Structure of chitin. ......................................................................................... 12
Figure 6. Synthesis of chitin.......................................................................................... 13
Figure 7. Structure of chitosan. .................................................................................... 15
Figure 8. Spectrum of chitosan with peaks of interest.............................................. 16
Figure 9. Structure of Alginate α‐L‐guluronic (G), β‐D‐ mannuronic acid (M).... 18
Figure 10. Egg Box structure of divalent calcium crosslinked alginate ................. 19
Figure 11. Schematic of EDC amide formation and side reactions......................... 23
Figure 12. Cross sections of wound site...................................................................... 26
Figure 13. Hyaluronan coupled with dithiobis(propanoic dihydrazide), n=2 and dithiobis(butyric dihydrazide), n=3 ............................................................................ 27
Figure 14. Schematic of hyaluronic acid sulfhydryl (HASH) synthesis................. 28
Figure 15. Gallium templated chitosan....................................................................... 31
Figure 16. Chitosan TPP microsphere containing Ofloxacin a model drug .......... 35
Figure 17. Reaction scheme indicating the modification of hyaluronan with amino acids; a) hyaluronan‐ glycine, b) hyaluronan‐ glucosamine. ...................... 44
Figure 18. Reaction scheme indicating the modification of; a) hyaluronan ‐ cysteine, b) chondroitin sulfate ‐ cysteine. ................................................................. 45
Figure 19. Structure of Chitosan and thiol modified derivatives. x, the number of glucosamine subunits, y, the number of N‐acetyl glucosamine; x > y ................... 48
Figure 20. Reaction scheme of Ellman’s reagent. ...................................................... 49
Figure 21. Proposed structure of alginate modified with diglycinehistidine. ...... 52
Figure 22. FTIR spectra for a) unmodified chitosan and chitosan modified by b) 2‐iminothioane, c) cysteine, d) lipoic acid, and e) thioglycolic acid. ...................... 62

ix Figure 23. FTIR spectra of fingerprint region for a) unmodified chitosan and chitosan modified by b) 2‐iminothioane, c) cysteine, d) lipoic acid, and e) thioglycolic acid. ............................................................................................................ 62
Figure 24. FTIR spectra of a) unmodified alginate and b) gly‐gly‐his modified alginate. ........................................................................................................................... 65
Figure 25. FTIR spectra of the fingerprint region for a) unmodified alginate and b) gly‐gly‐his modified alginate................................................................................... 66
Figure 26. FTIR spectra for a) chondroitin 6‐sulfate, b) L‐cysteine methyl ester, c) chondroitin sulfate‐cysteine. ........................................................................................ 69
Figure 27. FTIR spectra of fingerprint region for a) chondroitin 6‐sulfate, b) L‐cysteine methyl ester, c) chondroitin sulfate‐cysteine. ............................................. 70
Figure 28. FTIR spectra for a) hyaluronan, b) L‐cysteine methyl ester, c) hyaluronan‐cysteine. ..................................................................................................... 73
Figure 29. FTIR spectra of fingerprint region for a) hyaluronan, b) L‐cysteine methyl ester, c) hyaluronan‐cysteine. ......................................................................... 74
Figure 30. UV‐Vis spectra of DNTB dyed hyaluronan‐cysteine and chondroitin sulfate‐cysteine. .............................................................................................................. 78
Figure 31. UV‐Vis spectra of DNTB dyed hyaluronan‐cysteine and chondroitin sulfate‐cysteine. .............................................................................................................. 79
Figure 32. FTIR spectra for a) hyaluronan, b) glycine methyl ester, c) hyaluronan‐glycine.............................................................................................................................. 84
Figure 33. FTIR spectra of fingerprint region for a) hyaluronan, b) glycine methyl ester, c) hyaluronan‐glycine. ........................................................................................ 85
Figure 34. FTIR spectra of a) hyaluronan, b) glucosamine HCl c) hyaluronan‐glucosamine. ................................................................................................................... 88
Figure 35. FTIR spectra of fingerprint region for a) hyaluronan, b) glucosamine HCl c) hyaluronan‐glucosamine.................................................................................. 89
Figure 36. Rheometry profile of hyaluronan glycerol phosphate solution varying temperature conditions of test and pH of solution. .................................................. 92
Figure 37. Hyaluronan‐tripolyphosphate solutions of neutral pH tested at 25°C, 37°C, and 45°C. ............................................................................................................... 95
Figure 38. Hyaluronan‐tripolyphosphate 37°C heated solution at acidic, neutral, and basic pH. .................................................................................................................. 96

x Figure 39. Hyaluronan‐tripolyphosphate solutions of basic pH tested at 35°C through 60°C................................................................................................................... 97
Figure 40. FTIR spectra comparing a) food grade hyaluronan of sodium salt to b) cosmetic grade hyaluronic acid ................................................................................. 112
Figure 41. FTIR spectra of fingerprint region comparing a) food grade hyaluronan of sodium salt to b) cosmetic grade hyaluronic acid......................... 112
Figure 42. Peak identification of food grade hyaluronic acid. (ν‐ bond stretching, δ‐ bond bending) .......................................................................................................... 115

xi
1BAbstract Covalent and Ionic Modification of Biopolymers for Design Properties
Janah Cecelia Szewczyk Dr. Caroline Schauer
Polysaccharides are abundant in availability, bioderived and intrinsically
biocompatible. Chitosan, alginate, hyaluronic acid and chondroitin sulfate have
seen a significant breadth of research in recent years. In their native form these
natural polymers are used in unique applications such as metal ion absorption,
rheological, drug delivery, and wound healing among others. The modification
of polysaccharides has the ability to alter the properties that define these
applications, such as the manner in which the polymer acts in solution, the pH
and temperature response of the modified polymer, and its propensity for
binding to specific metal ions. Two types of modifications are investigated. The
use of carbodiimide chemistry to covalently attach small molecules and peptides
to chitosan, alginate, hyaluronic acid and chondroitin sulfate is described. The
characterization, analysis, and methodology via FTIR and UV/Vis among other
techniques are explained. Due to the characterization techniques chosen
confirmation of the individual reactions was easier and done with more
confidence if the modifier contained thiol functionality. Hyaluronic acid was
ionically modified with glycerol phosphate and tripolyphosphate. The resulting

xii rheological performance is presented. The reaction to the phosphate modified
polymer to varying temperature and pH environments is described and
compared to published results for chitosan variants.

1
2BChapter 1. Introduction
3B1.1 The problem to be addressed
Polymeric materials have been adopted over the last 70 years for a variety
of applications in the food and beverage, textile, and biomedical industries.
Biologically derived polymers or biopolymers such as cellulose, chitosan,
alginate, and hyaluronic acid are renewable and attractive materials due to their
availability, biocompatibility, and biodegradation mechanisms. Materials, which
degrade or denature soon after processing, create a significant barrier to mass
production and industrial use, limiting research interest beyond academia. It is
difficult to envision biopolymers in their unaltered state having broad industrial
relevance.
The formation of composites by incorporating biopolymers into blends
with synthetic materials and the use crosslinking agents are successful options to
create durable bio‐based materials. The modification of biopolymers with the
addition of functional groups is a common yet elegant mechanism to create
durable and industrial relevant biopolymers.
4B1.2 Carbohydrates Carbohydrates are hydrates of carbon and in their most basic form are
polyhydroxy alcohols, (CH2O)n with n >4, modified by either aldehydes or

2 ketones. Also known as saccharides or sugars, carbohydrates form di‐, oligo, and
polysaccharides as determined by the number of single carbohydrate molecules
that are bound together. These natural polymers follow a hierarchical order
inline with synthetic polymers; in as much as, oligosaccharide refers to a chain
composed of a few carbohydrates and polysaccharide corresponds to larger
carbohydrate chain, typically greater than 10 sugars.
Figure 1. Poly(hydroxyl aldehyde) (a) and poly(hydroxyl ketone) (b).
5B1.3 Glycoproteins and proteoglycans The chemical bonds between carbohydrates are called glycosidic bonds.
Through a process called glycosylation, these bonds form between the donor
carbohydrate’s anomeric carbon, also called the leaving group, and the hydroxyl,
amide, thiol, or free carbon group of the neighboring acceptor molecule. When
the acceptor molecule is a carbohydrate C‐O and C‐N bonds are most common.
When a protein binds to a small carbohydrate chain, similar C‐O and C‐N
C
OH
(CHOH)n
CH2OH
C
OH
(CHOH)n
CH2OH
C
OR
(CHOH)n
CH2OH
C
OR
(CHOH)n
CH2OHa b

3 glycosidic links form; these are instead defined as N‐linked and O‐linked
oligosaccharides and the resulting carbohydrate protein conjugates are called
glycoproteins [1, 2].
There are two major categories of compounds which form when a
carbohydrate chain of nominal length binds to a protein chain, glycoproteins and
proteoglycans. These two compounds are differentiated by the length and
percent composition of the carbohydrate component as well as by the complexity
of the carbohydrate modification. Roughly 4% of a glycoprotein is composed of
carbohydrates; typically mono or oligosaccharides [3]. Modifications to these
oligosaccharides are limited to O‐linked and N‐linked glycosidic bonds.
Hormones like thyroid stimulating hormone (TSH) and Erythroprotein (EPO),
lubricants like mucins, and collagen are examples of glycoproteins, all of which
can be harvested from the extracellular matrix of animals.
Figure 2. . Glycoproteins; a) N‐linked and b) O‐linked N‐acetylglucosamine. [4]
a) b)a) b)

4 Proteoglycans are compounds which consist of polysaccharide chains that
branch off a peptide chains (approximately 50 amino acid residues). The
polysaccharide branches vary in composition within each proteoglycan, but
make up approximately 95% of the structure. Proteoglycans such as aggrecan can
be harvested from the extracellular matrix, specifically articular cartilage [1].
6B1.4 Glycosaminoglycans A specific category of polysaccharide chain is used in the formation of
proteoglycans, originally referred to as mucopolysaccharides, these are now
called glycosaminoglycans. The properties of the proteoglycan are strongly
determined by which glycosaminoglycans is present, as each tends to bind to a
specific protein [5, 6].
Peptide
Peptide
SerineXyloseGalactoseGAG
Peptide
Peptide
SerineXyloseGalactoseGAG
1 Figure 3. A proteoglycan: serine branch from peptide, three sugar spacer
linking to glycosaminoglycan polymer. [4]

5 Glycosaminoglycans, or GAGs, are heteropolysaccharide chains which
consist of negatively charged, covalently bound repeating disaccharide units.
One sugar is based on either glucosamine or galactosamine; the second residue is
based on uronic acid; either iduronic or glucuronic acid. These sugars combine to
form the six glycosaminoglycans; hyaluronic acid, chondroitin sulfate, dermatan
sulfate, keratan sulfate, heparan sulfate, and heparin. Proteins which bind to
GAGs are generally specific for that GAG chain and play a large role in the
extracellular matrix, as they relate to proteoglycans. Independent of their
coupled proteins, GAGs are being extensively researched due to their
abundance, biocompatibility, ability to build high viscosity solutions, and
opportunity for extensive modification beyond protein addition [6‐10].

6
Table 1. Glycosaminoglycan polymers and composition GAG Polymer Linkage
Residue (disaccharide)
Sulfate Uronic Acid Sugar Amine Sugar
Hyaluronic Acid/ Hyaluronan
β‐D, 1‐3, 1‐4 No Glucuronic acid Glucosamine
β‐D, 1‐3, (1‐4)
α‐L, 1‐3, C4 or C 6,
Galactosamine
(1‐4) C2, Iduronic acid
Keratan Sulfate β‐D, 1‐4Yes, Glucuronic
acidGlucuronic acid Galactosamine
α‐L, 1‐4, iduronicβ‐D, 1‐4
glucuronicα‐L, 1‐4, iduronicβ‐D, 1‐4
glucuronic
HeparinYes, Either residue
90/10 Iduronic / Glucuronic acid
Glucosamine
Heparan SulfateYes, Either residue
90/10 Glucuronic/ Iduronic acid
Glucosamine
Dermatan Sulfate Iduronic acid Galactosamine
Chondrointin Sulfate C4 or C 6, Galactosamine
Glucuronic acid Galactosamine
7B1.5 Synthesis of glycosaminoglycans The synthesis of GAG polymers begins with a core protein chain of
approximately 50 amino acids within the Golgi apparatus. The amino acid serine
functions as an initiation site off of the protein chain. A trisaccharide spacer
consisting of xylose and two galactose sugars binds to the serine and the glycosyl
transferases create the disaccharide repeat unit of the GAG. Sulfur transferases
are also involved in the synthesis of sulfur containing GAG polymers [7].

7
Hyaluronan
Chondroitin Sulfate
Dermatan Sulfate
Keratan Sulfate
Heparin
Heparan Sulfate
Figure 4. Structures of glycosaminoglycan polymers. (23)
8B1.6 Hyaluronic acid The structure of hyaluronic acid, also known as hyaluronan, is
complimented by hydrogen bonds which run parallel to the axis of the chain.
These bonds help form a helical structure which progresses to an expanded
polymer coil when in solution. Hyaluronan has a larger radius of gyration,
approximately 200nm and is highly hydrophilic, capable of sustaining 1000x its
mass in water [8]. Hyaluronan is a component of most animal tissue and body

8 fluids, where connective tissues contain higher concentrations than fluids like
blood serum. A 70kg human contains approximately 15g of hyaluronan
however there is a turnover of approximately 5g of hyaluronan within the body
every day [8, 9]
Table 2. Hyaluronic acid found in the human body and other sources.[8, 10] Tissue or fluid Concentration (mg/L)
Rooster comb 7500Human umbilical cord 4100Human synovial fluid 1420‐3600Bovine nasal cartilage 1200Human vitreous body 140‐338Human dermis 200Rabbit brain 65Rabbit muscle 27Human thoracic lymph 8.5‐18Human urine 0.1‐0.5Human serum 0.01‐0.1
9B1.6.1 Synthesis of hyaluronic acid The synthesis of hyaluronic acid, also known as hyaluronan, differs from
that of the other GAG polymers. Hyaluronic acid is synthesized in the plasma
membrane with the assistance of hyaluronan specific glycosyl transferase
enzymes called hyaluronan synthases (HAS) and uracil diphospahte groups
(UDP). These UDP groups are sugar specific, acting as substrates for

9 glycosyltransferases. In hyaluronan, UDP‐glucuronic acid (UDP‐GlcUA) and
UDP‐N‐acetyl‐D‐glucosamine (GlcNAc) alternate addition creating 1‐4, 1‐3 N‐
acetyl glucosamine gluruonic acid repeat disaccharide unit. Unlike other GAG
polymers, hyaluronan does not contain sulfur, thus no sulfurtransferases are
involved in hyaluronan synthesis [8, 9].
10B1.6.2 Degradation of hyaluronic acid Degradation occurs within the liver via endothelial cells which have a
receptor for hyaluronan endocytosis, and in the blood courtesy of lymph nodes
which are highly catabolic towards polysaccharides. Hyaluronan is also found in
the combs of roosters, nasal cartilage of bovine and the brain and muscle of
rabbits. Molecular weight varies according to the source from 5k to 50M Daltons;
though 3‐4M Dalton is typical [10, 11].
11B1.6.3 Use of hyaluronic acid in‐vivo In its native state, hyaluronan performs several functions within the
human body concerning diffusion within tissues, lubrication, wound healing, as
well as cell growth and proliferation. Hyaluronan is also a marker for some types
of cancer. Hyaluronic acid takes on the role of an in‐vivo traffic cop acting as an
osmotic buffer to create a homeostatic environment with the surrounding tissue.
It is able to control the transport and distribution of plasma proteins within
tissue, retarding diffusion via steric exclusion. As a lubricant, hyaluronan is a

10 viscoelastic solution at concentrations less than 1%, and is thixotropic in nature
making it an ideal component of synovial fluid [8, 11].
Following an injury, hyaluronan synthesis amplifies while simultaneously
binding to the readily available fibrinogen, a glycoprotein which aids in blood
coagulation and clotting, resulting in an overall spike in hyaluronan
concentration at the location of the wound. Consequently, edema is present
further aggravated by the swelling of hyaluronan within the tissue to permit
debridement of dead cells and bacteria [11].
Hyaluronan is active in cell proliferation and growth assisting in the
detachment of cells from their support matrix during mitosis, when the rate of
hyaluronan synthesis is highest. Further preserving cell life and integrity, a
pericellular coating called a hyaluronan halo can develop around cells acting as
an immunosuppressive agent fending off cytotoxins like lymphocytes and
viruses. Amniotic fluid, as an example, has high concentrations of hyaluronan for
the protection of the fetus [8, 11].
CD‐44, a glycoprotein that hyaluronan is able to specifically recognize, is
responsible for various cell to cell interactions, cell adhesion, and cellular
migration. CD‐44 is specifically known for its involvement in the metastasis of
malignant tumors, especially those related to ovarian, breast, and colon cancers.
Oligomers of hyaluronan are often found in cancer cells and promote locomotion

11 of the tumor cells via a mechanism similar to debridement of a wound; swelling
within the tissue to facilitate flow. Along these lines, the concentration of
hylauronan also increases when in the company of cancer. Hyaluronan induces
CD‐44 to cleave from the cancer cell; likewise cancer cells secrete hyaluonidase,
enzymatically initiating the fragmentation of hylauronan yielding a net increase
in the number of hyaluronan chains present, though the average molecular
weight has dropped. A cyclic process is created; the more hyaluronic acid
present, the more CD‐44 is able to cleave. Tumors do not necessarily produce
hyaluronan, but the presence of a tumor can instigate other cells to produce
hyaluronan and start the mets cycle [8, 11].
12B1.7 Chitin Chitin represents the second most plentiful biopolymer material on the
planet [12]. Structurally, chitin is a β‐1‐4, 2 acetamido‐2 deoxy D‐glucopyranose
sugar, where all residues contain N‐acetyl glucosamine. Chitin has a molecular
weight between 200 and 700K Daltons [12]. A major component in the shells of
crustacean and mollusks, chitin is predominant in the backbones of squids and
insect cuticles. Chitin is also found in fungi, algae, and protozoa. It is estimated
that approximately 100 billion tons of chitin are synthesized per year, of that the
shell fish industry generates 150,000 tons of chitin/ year. Somewhere between 20
and 40% of a crustaceans shell is composed of chitin [12, 13].

12
H
CH3O
H
H
OH
OH
HO
H ONH
n
Figure 5. Structure of chitin.
13B1.7.1 Chitin synthesis Chitin is synthesized with the help of chitin synthease enzymes which
transport N‐acetyl glucosamine monomers to bind to the growing polymer. In
animals, the chitin associates with the protein present to form hard shells, while
in fungi hydrogen bonding helps chitin form the cell wall.

13
Figure 6. Synthesis of chitin. [12]
14B1.7.2 Alpha and Beta Chitin There are two structures of chitin that can be formed that are specific for
the use of the native organism. Rigid, durable, and solvent resistant, α‐chitin is
highly crystalline due to strong hydrogen bonding within chitin that forms an
anti parallel structure. The α‐chitin is found in crustacean shells and fungal cell
walls. Conversely the β‐chitin, is less crystalline, contains weak hydrogen bonds,
and forms a parallel configuration. As a result β‐chitin is soft, pliable, and a
water friendly material found in squid pens and pogonophore tubes [12, 14].
Glucose
Hexokinase ATP ADP
Glucose-6-P
Phosphoglucomutase
Fructose-6-P Glucosamine-6-P isomerase Glucosamine
Hexokinase Chitin Glucosamin-6-P Chitinase
Glucosamine-P-acetyltransferase Acetyl-CoA N-AcetylGlucosamine
GlcNAc Kinase
N-Acetylglucosamine-6-P Glucosamin-P-mutase
N-Acetylglucosamine-1-P
UDP-N-acetylglucosamine UTP P1 Pyrophosphorylase
UDP-N-Acetylglucosamine
Chitin Synthetase
Chitin Chitin(n+1) + UDP

14 15B1.7.2 Harvesting Chitin
The harvesting and purification of chitin involves the use of acid and base
washes to remove residual minerals and proteins. For chitin from fungal sources,
there is an additional step requiring the extraction of lipids using lithium
chloride and dimethylacetamide (LiCl/DMAc) solution. The degradation of
chitin is enzymatic as the material has, in general, significant acid and base
resistance. Chitin is resistant to the digestive enzymes of most mammals;
although chitinase is found in the digestive system of some fish, lizards, birds
and plants [13].
16B1.8 Chitosan Chitosan is a chemically simpler structure than chitin, theoretically free of
acetyl groups, where each residue contains N‐glucosamine forming β‐1‐4,2
amide 2 deoxy N‐glucosamine. Only chitosan specific fungi are able to naturally
produce chitosan, all other sources are converted from chitin. The synthesis of
fungal produced chitosan includes a chitin deacetylase enzymatic step and is
otherwise identical to chitin [12]. Similarly the purification of fugal produced
chitosan requires the removal of lipids with acetic acid being the solvent of
choice.

15
Figure 7. Structure of chitosan.
17B1.8.1 Degree of Deacetylation of Chitosan Chitin and chitosan are rarely found in nature purely acetylated or
deacetylated respectively; they exist as a blend of both materials. The degree of
deacetylation determines if the blend is classified as chitosan or chitin. A degree
of deacetylation above 70% is classified as chitosan as determined by solubility or
spectroscopy such as with, Nuclear Magentic Resonance, NMR or Fourier
transform infrared spectroscopy, FTIR [15]. Quantitatively, the degree of
deacetylation can be calculated via 1H NMR by comparing the integral intensities
of the CH3 peak to the sum of the integrals of the H2, 3, 4, 5, 6, and 6’ protons as
described by Hirari et al. [16].
nNH2
OHH
H
H
OOH
OH
H

16
Equation 1. Calculation of degree of deacetylation via NMR. [16]
Figure 8. Spectrum of chitosan with peaks of interest. [16]
FTIR can be used to determine the degree of deacteylation by comparing
the absorption intensity ratio of the amide Ia peak at 1655cm‐1 versus an internal
reference such as a hydroxyl peak at 3450cm‐1. Qualitatively, using solubility
techniques, the degree of deacetylation can be determined by using a blend of
LiCl and DMAc solution a good solvent for chitin and acetic acid, a good solvent
for chitosan. Neither polymer is soluble in the good solvent of the other polymer
[12].

17 18B1.9 Alginate
Alginate is an unbranched polymer composed of two sugar residues, β‐D‐
mannuronic acid (M units) and α‐L‐guluronic acid (G units) bound by 1‐4
glycosidic linkages [17]. Alginate, a salt of alginic acid, is a component of brown
algaes such as Macrocystis pyrifera and Ascophyllum nodosum, and bacteria like
Azotobacter vinelandii and Pseudomonas aeruginos [18] According to the US Federal
Drug Administration alginate is “generally regarded as safe” (GRAS) and so
finds common use in the food industry as a binding agent, rheology modifier,
and emulsifier and in medical and pharmaceutical applications as vehicles for
drug delivery and wound healing [19‐21]. Alginate has a molecular weight range
between 50 and 10,000 kDa, and is fully soluble in water, where it is a non‐
Newtonian fluid [22]. The extraction and processing of alginate from brown
algae seaweed is time consuming as it involves a prolonged agitation in both
acid and base solutions prior to filtration; 16h in 0.2N sulfuric acid and 16h in
sodium carbonate respectively [23].

18
Figure 9. Structure of Alginate α‐L‐guluronic (G), β‐D‐ mannuronic acid (M).
[24]
19B1.9.1 Crosslinking alginate Similar to chitosan, alginate is commonly crosslinked to prevent polymer
degradation when in the presence of miscible solvents. In the case of alginate, ion
crosslinking is a reliable and well versed method for crosslink formation,
specifically with divalent calcium. At pH levels above 6.0, the carboxyl groups
within alginate deprotonate; participating with the available hydroxyl groups
and oxygen atoms in cationic coordination with the divalent calcium [25]
effectively bending around the ion and forming an egg box structure. Calcium
coordination is prevalent within blocks of G subunits due to the axial orientation;
rather than the equatorial orientation of the M subunits. Calcium crosslinking
therefore creates discontinuous regions of crosslinked and non‐crosslinked
polymer that effect mechanical properties and solvent resistance. While calcium
crosslinking is common in use, it is also a reversible reaction when cation
chelators like EDTA (ethylenediaminetetraacetic acid), citrate, or lactate are used

19 [26]. Covalent crosslinking eliminates concerns over reversibility and
homogeneity that are prevalent in cation crosslinked systems. Use of
carbodiimides, specifically water soluble EDC, in combination with an amine
bearing molecule is a common method for covalent crosslink formation. The
coupling of various groups such as peptides and silanes are also preformed with
the assistance of EDC [30‐34].
Figure 10. Egg Box structure of divalent calcium crosslinked alginate. [24]
20B1.10 Amino acids Of the 700 amino acids found in nature, there are 20 that function as part
of the building blocks of life, partaking in protein synthesis via the cellular
ribosomes. Amino acids generically refers to molecules which are both acid and
amine functionalized, but specifically implies aminoalkanoic acids which have
the generic structure of H3N+—(CR1R2)n—CO‐2 where n=1 for alpha amino acids,

20 and n=2 for the beta form. Via condensation reactions, amino acids can bind to
one another forming chains. Proteins and peptides are merely chains of amino
acids differentiated by length; peptides contain less than 50 amino acid residues
while proteins contain more.
21B1.11 Carbodiimides and EDC Carbodiimides are RN=C=NR’ based compounds that are used in the
organic synthesis as a crosslinking agent forming ester or amide bonds between
two molecules. Frequently referred to as “zero length crosslinkers” [27, 28]
carbodiimides only enable the crosslink to form and do not remain a permanent
part of the structure. N,Nʹ‐dicyclohexylcarbodiimide, DCC is the most common
carbodiimide; used in organic reactions it is known anecdotally for the allergic
reaction users incur. EDC, 1‐ethyl‐3‐(3‐dimethylaminopropyl) carbodiimide
hydrochloride, is a water soluble carbodiimide universal to polysaccharide and
protein modifications. EDC is generally used for amide formation at low pH.
Successful reactions occur between 3.5 and 4.5 to ensure the availability of both
ionized carboxyl groups and disassociated protons; the latter of which are
hindered by extreme acidic conditions. Weak acidic solutions are not ideal for
EDC reaction as the carbodiimide is stable and unreactive [28].

21 22B1.11.1 EDC reaction and amide formation
The reaction scheme in XFigure 11X depicts amide formation via EDC, as
well as the side reactions. Amide formation begins with the presence of a proton;
forming an EDC (U1U). Carboxyl ions initiate the formation of O‐acylurea (U3U) with
the EDC ion; if no carboxyl ions are available the carbocation will hydrolyze,
form a urea derivative ( U2U), and the reaction is terminated. O‐acylurea can re‐
protonate at the Schiff base to form a second carbocation (U4U). There are four
possible reaction routes at the point of formation of the second carbocation. The
excessive use of EDC in the reaction will force the carbocation to form a N‐
acylurea group (U5U), while the presence of water will cause the formation of a
carboxylate (U6U). In both of these instances, the reaction terminates without
forming an amide bond. Amide formation then is dependent upon the presence
of amine and whether the carboxyl ion is cyclical or not. Reaction with a strong
ionized and cyclic carboxyl group, leads to formation of carboxyl anhydride and
the quick conversion to an amide if amines are available (U7U). Non cyclical
carboxyl groups react with the carbocation and amine to also form the amide ( U7U)
[28].
23B1.11.2 EDC use with glycosaminoglycans The efficiency at which EDC couples amino acids to GAG polymers was
studied by Danizshefsky et al. specifically researching heparin and the methyl

22 ester of the glycine amino acid [29]. The chief concern of this early work was to
form the amide bond without degrading the polymer backbone or removing the
sulfate groups. The successful EDC reaction between the heparin and glycine
was extended to the other GAG polymers and alginate. The amide bond was
formed with all of the polysaccharides attempted although the conversion rate
for heparin and heparan sulfate was remarkable higher than the other
polysaccharides. The α‐L, 1‐4 glycosidic bonds between the uronic acid and
glucosamine residues of the heparin and heparan sulfate were said to be unique
for permitting more open access to the carboxyl groups than the α‐L, 1‐3
glycosidic bond of dermatan sulfate and the β‐D 1‐4 linkage of the other GAGs
polymers [29].

23
Figure 11. Schematic of EDC amide formation and side reactions. [28]

24
24BChapter 2. Background
2.1 25BResearch interest in hyaluronan
26B2.1.1 Peptide modification of hyaluronan As a biocompatible and biodegradable natural polymer, significant
research has been invested in enhancing the swelling, viscosity, and crosslinking
of hyaluronan towards end use applications such as wound healing and drug
delivery. Vittorio Crescenzi from the University of Molise investigated the
swelling characteristics of several amino acid modified derivatives of hyaluronic
acid [30]. Lysine, diaminopentane, and a dipeptide glycine‐lysine were
covalently coupled to hyaluronan and further crosslinked with glutaraldehyde
prior to water immersion. The University of Molise group concluded that any
modification that contributes carboxyl groups will increase the swelling seen in
hyaluronan. Therefore the lysine and glycine‐lysine modified compounds were
compelled to swell, while the diaminopentane, which did not contribute any
carboxyl groups to the structure did not swell. [30].
27B2.1.2 Cyclodextran addition to hyaluronan Hyaluronan has previously been explored as a lubricant for joints due to
its inherent viscoelasticity [8]. Researchers from France expanded on this by
modifying hyaluronan with beta cyclodextran (β‐CD), a polysaccharide known
for its pendant hydrophobic bowl with a hydrophilic shell, ideal for drug

25 encapsulation [31]. Using the model drug sodium adamantine acetate, and later
ibuprofen as the guest molecule within the β‐CD, the viscosity of the complexes
proved to be lower than that of native hyaluronic acid providing a vital lead in
site specific injections to combat ailments like osteoarthritis [31].
28B2.1.3 Modified glycosaminoglycans films to accelerate wound healing Researchers from the University of Utah formulated and cast thin films of
Poly(ethylene glycol (PEG))/ GAG polymers for wound treatment applications
[32]. Hyaluronic acid and chondroitin‐6‐sulfate were each coupled with adipidic
dihydrazide and later propionicdialdehyde modified PEG using a water soluble
carbodiimide. These PEG/ GAG films were used in combination with
Tegaderm™ films, a (sterile bandages composed of urethane and acrylate
polymers sold by 3M Corporation, to treat wounds on lab mice. The PEG/ GAG
films were compared against the use Tegaderm™ alone for wound contraction
and repeithelialization. Observations made at three, five, and seven days post
injury showed that the total surface area of the wound contracted faster with the
use of hyaluronan films, while the chondroitin sulfate films promoted
regeneration of the dermis, epidermis, and adipose tissues quicker than
Hyaluronan films and the blank Tegaderm™ control [32].

26 (i) (ii)
Figure 12. Cross sections of wound site at 5 days (i) and 7 days (ii) post injury. [32] Wounds are dressed with a) hyaluronan film with Tegaderm; chondroitin sulfate film with Tegaderm, c) Tegaderm only, d) peripheral tissue as an
example of normal skin. Adipose (A), dermis (D), epidermis (E), hyaluronan film (F), muscle (M) Tegaderm™ (T).
29B2.1.4 Thiol modification of GAG polymers The Prestwich laboratory at the University of Utah has been the leading
research group investigating the benefits of thiol addition to hyaluronan and
other GAG polymers [33‐35]. The original intent for the added thiol functionality
was to integrate the crosslinking agent within the polymer creating enhanced
hydrogel formation, cell encapsulation, and wound healing [35]. Utilizing
carbodiimide crosslinkers, hyaluronan was coupled with two dihydrazides,
dithiobis(propanoic dihydrazide) (DTP) and dithiobis(butyric dihydrazide)
(DTB). Dithiothreitol (DTT), a reducing agent was added to the reaction
fracturing the disulfide bonds and resulting gel formed during the first steps of

27 the reaction. The resulting thiolated hyaluronan was water soluble showing
promising initial results for cell encapsulation and proliferation. The ability of
the thiolated hyaluronan to undergo a sol/gel transition at physiological
conditions created an interesting system for wound healing and tissue
engineering research.
Figure 13. Hyaluronan coupled with dithiobis(propanoic dihydrazide), n=2
and dithiobis(butyric dihydrazide), n=3. [35] Recently, the Prestwich lab has developed a sulfhydryl modified
hyaluronan polymer (HASH) that is unable to form disulfide bonds and
crosslink when in the presence of oxidizers or bivalent crosslinkers [33].
Synthesized by creating a basic solution of hyaluronan to which ethylene sulfide
and DTT are added, a 4 to 14% thiolated polymer is created. The resulting branch

28 off the polymer backbone is significantly shorter than the thiolated polymer
described by Shu et a.l [35]. It is believed that the reduced size of the branched
compound is a contributing factor to the crosslinking resistance brought on by
steric hindrance. Furthermore, the reduction of thiol content on the polymer as
compared to Shu’s work leaves fewer sites for crosslinking to occur. It is
foreseeable that future research on HASH will focus on the oxidation resistance
for a potential application as synthetic synovial fluid. The natural hyaluronic
acid found in the synovial fluid is susceptible to degradation with time. The
resulting chain fracture of the hyaluronan is noted as a contributing factor to
osteroarthritis. The degradation is the result of polymer oxidation; by preventing
oxidation the degradation and the severity of the arthritic symptoms are feasibly
halted.
Figure 14. Schematic of hyaluronic acid sulfhydryl (HASH) synthesis. [33]

29 30B2.2 Research interest in chitin and chitosan
31B2.2.1 Reaction sites for chitin and chitosan modification Chitin and chitosan were first modified using techniques borrowed from
cellulose processing, which were naturally carried over to all similarly structured
materials. The β form of chitin is the more easily modified conformation,
therefore the α conformation, which is found in more abundance, is typically
modified to the β form with the use of steam or alkali wash [12]. Logistically,
sites where chitin may take part in a reaction, or where additional functionality
can be imparted are at the C‐3 or C‐6 carbons, secondary and primary hydroxyl
groups respectively. As for chitosan, the free amines are possible reaction sites in
addition to the C‐3 and C‐6 hydroxyl groups [12].
32B2.2.2 Metal ion absorption Metal ion adsorption is an often cited attribute of chitosan and its
derivatives, having been investigated under the guise of water purification [36‐
39]. Chitosan is a very efficient chelating agent, more so than alginate or
commercial ion exchange beads like poly(4‐aminostyrene), and is capable of
removing mercury [37] from hard water at neutral pH and arsenic [39] from
ground water. Chitosan has been associated with the adsorption of a wide
variety of metal ions ( XTable 3X) and in general has a higher efficiency of chelation
than alginate and other recycled materials [36].

30 Table 3. Metal ions associated with absorption in neat or modified chitosan.
[12] Cd2+
Cr2+
Al2+
Hg2+
Pb2+
Pt4+
Ni2+
Cu2+
Mo2+
Au2+
Zn2+
V5+
Mg2+
Ag2+
Co2+
Fe3+
Ga2+
As (III)
UO2+
In2+
33B2.2.3 Crosslinking chitosan The crosslinking of chitosan permits chelation in acidic solutions with
minimal degradation to the polymer. Using traditional crosslinking agents such
as gluteraldehyde, epichlorohydrin, or hexamethylene diisocyanate, crosslinked
chitosan is able to absorb Cu2+, Ni2+, Co2+, Hg2+ and Co2+ from acidic solutions [36].
In one novel approach, chitosan is crosslinked after it had absorbed a metal ion
to form a template, designated space for the metal ions to reside [39]. Upon
completion of the crosslinking step, the metal ion is removed from its chitosan
host and the polymer is now able to selectively absorb the original templated
metal ions of similar size, at a greater capacity than that of native chitosan.
Cadmium crosslinked chitosan is selective for cadmium Cd2+, Cu2+, and Hg2+ ions.
Copper templated chitosan is selective for Cd2+, Cu2+, Zn2+, Ni2+, Fe2+, Pb2+, Co2+,

31 Ag2+, Mo4+, V5+, In3+, Ga3+, Al3+. Finally the crosslinking of the chitosan creates an
acid resistant and reusable metal absorption material as the metal ions are
capable of being washed away with an acid wash without degrading the
chitosan [36, 39].
Figure 15. Gallium templated chitosan. [39]
Chitosan has been modified with nitrogen to increase the metal
adsorption by coupling amino acids such as glycine, serine, alanine, leucine, and
their methyl ethers. Thiol groups functionalize chitosan when reacted with
mercaptosuccinic acid, or thioglycolic acid. Phosphate functionality via reaction
with P2O5 or orthophosphoric acid will enable chitosan absorption of Cu2+, Hg2+
and UO2+ ions. Bead formation and rheological properties common to chitosan
when coupled to tripolyphosphate or glycerol phosphate have also been
investigated [36, 40].

32 34B2.2.4 Chitosan and glycerol phosphate In early 2000, Chenite et al. reported the rapid gelation of chitosan and
glycerol phosphate (chitosan/ GP) solutions occurring under physiological
temperatures and pH conditions [41]. The gelation mechanism was
hypothesized by the authors to be the result of a favorable balance of reduced
electrostatic repulsive forces from the basic phosphate groups, which increased
hydrogen bonding within chitosan and the electrostatic attraction via phosphate
and ammonium groups. A follow up study by Chenite et al. demonstrated that
the chitosan/ GP solutions can be buffered up to physiologic pH without gel
forming, indicating that only with heat will gelation occur. [42]. Rheometry
studies showed that the elastic shear modulus calculated during both the heating
and cooling cycles were identical. Moduli measured at physiological and lower
pH conditions shifted the rheogram creating a higher temperature of gelation.
The balance between pH and temperature was therefore noted, but roughly
understood.
Michael Buschmann’s group from Ecole Polytechnique de Montreal
published a pair of reports investigating the mechanism for gelation of chitosan/
GP systems [43, 44]. Using a Poisson‐Boltzman electrochemical cell model, and
collecting pH and laser light transmittance data of Chitosan/GP solution
titrations, and later with the use of 31P NMR spectroscopy a credible sol/gel

33 mechanism for chitosan/GP solutions was established. Buschmann et al
determined that electron disassociation, pKa, the degree of ionization, α, defined
as the ratio of protonated glucosamine to total glucosamine content of the
chitosan, and the degree of deacetylation to be the critical factors in gelation [44].
Glycerol phosphate has a pKa similar to that of chitosan, but unlike chitosan, the
pKa of GP is temperature stable. As chitosan/ GP solution is heated the pKa of
chitosan decreases causing protons to migrate to GP. The loss of protons causes a
subsequent decline in the ionization, α, as chitosan is neutralized permitting
chitosan‐chitosan interactions and gel formation. Acidic shifting in the 31P NMR
spectra of chitosan/GP solution proved the heat induced proton transfer.
35B2.2.5 Chitosan and tripolyphosphate Biopolymer beads formed from chitosan and tripolyphosphate (TPP) have
been researched since the 1980’s [45] for use in applications such as metal ion
absorption [40], and drug delivery [45, 46]. The goal of initial chitosan and TPP
research was to improve the acid resistance of the beads to permit broader in vivo
applications.
Mi et al. described the reaction mechanism between chitosan and TPP as a
combination of deprotonation and ionic crosslinking with the latter being in the
majority [47]. TPP dissolved in water dissociates hydroxyl and tripolyphosphoric
ions that bind to the amine groups of the chitosan precipitating the beads.

34 By adjusting the TPP solution pH, FTIR spectra indicated that the intensity of
P=O peak at 1150cm‐1 rises with declining pH. Furthermore, the weighted
average of the resulting chtiosan TPP beads also increased with declining pH.
Tripolyphosphoric ions are the only ions available in the presented acidic
solutions and ionic crosslinking was proven to be the dominant reaction
mechanism responsible for the mechanical integrity of the beads [47].
Vodnâ et al. investigated the use of chondroitin sulfate incorporation into
chitosan TPP beads as a way to increase mechanical integrity and improve drug
delivery applications [48]. The inclusion of chondroitin sulfate was found to
increase particle size and toughen the shell of the chitosan TPP polymer bead as
indicated by break strength and deformation. Additionally, the efficiency of drug
encapsulation and release was also increased with the use of chondroitin sulfate
[48].

35
Figure 16. Chitosan TPP microsphere containing Ofloxacin a model drug. [48]
36B2.2.6 Chitosan and thiol modification The modification of chitosan with thiol functionality has been used
increase metal ion adsorption [49] and adhesion, especially to biological
substrates like mucus glycoproteins as required for drug delivery applications
[50, 51]. Thiol modification takes place at the primary amine group utilizing
carbodiimides as coupling agents if acid functionality is present, as is the case
with some amino acids. Chitosan had been modified with cysteine, thioglycolic
acid, 4‐thio‐butylamidine, and 2‐iminothioilane respectively, all via EDC
reactions with the exception of 2‐iminothiolane, which is a coupling agent to its
self [50]. Investigated for mucoadhesion, permeation through cellular
membranes post glycoprotein adhesion, and controllable drug release, the
thiolated chitosan conjugates demonstrated improved performance over

36 unmodified chitosan. Furthermore, thiolated chitosan has been shown to go
through a sol/gel transition when undergoing temperature and pH changes
forming disulfide bonds, which crosslink the complex [51].
37B2.3 Research interest in alginate
38B2.3.1 Alginate and peptide modification Work published by Dhoot et al. described the attachment of the YIGSR
peptide to an alginate backbone for the purpose of encouraging neuroblastoma
cell attachment and growth [52]. YIGSR, a peptide composed of tyrosine,
isoleucine, glycine, serine, and arginine amino acids, is an abbreviation based on
the one letter abbreviations for each amino acid in the composition. Cell
attachment increased from 1.5% on an unmodified alginate surface to 66% on a
surface of alginate treated with a 2 mg/g concentration of YIGSR. The binding of
YIGSR to alginate was more effective than surface coating alginate with the
glycoprotein laminin. The attachment of neuroblastoma cells and subsequent
neurite growth was determined to be a function of the peptide density of the
alginate gel.
Rowley et al published several papers describing the binding of RGD
(Arginine‐Glycine‐Aspartic acid) peptides to alginate and the resulting affinity
for myoblast [53] and chondrocyte [54] attachment, proliferation, and growth.
Using the aforementioned EDC reaction to bind the peptides, RGD did not bind

37 preferentially to either the M or G residues of alginate, as the carboxyl groups are
not distinguishable from this perspective. The ability for the C2C12 mouse
skeletal myoblasts to proliferate and differentiate was again found to be
dependent upon the peptide density of the alginate gel [53]. Chondrocytes
attachment to RGD bound alginate was complicated by calcium crosslinking [54].
The crosslinking density, ultimately the stiffness of the substrate, increases the
equilibrium level and rate of chondrocyte attachment while determining the
morphology of the attached chondrocytes. Highly crosslinked RGD‐alginate gels
created flat and stretched chondrocytes while less crosslinked gels yielded round
chondrocytes. Chondrocyte attachment was higher and reached equilibrium in
less time for the RGD‐alginate complex as compared to unmodified alginate, 48h
versus 10h respectively via Schiff base formation between the amino capped
MPEG and carboxyl groups of alginate. The resulting multilayer microspheres
were placed in sodium citrate to liquefy the alginate parathyroid core and
facilitate permeation through the shells. Implanted into the abdominal cavity of
rat hosts, the microspheres were shown to be biologically stable. Furthermore the
permeability of the membrane of tissue encapsulated microspheres was identical
to the tissue free control.

38 39B2.3.2 Alginate and thiol modification
The addition of thiol functionality was detailed by Bernkop‐Schnürch et al.
with the formation of an alginate cysteine complex for use as a mucoadhesive
[55, 56]. All properties pertinent to mucoadhesives were complimented by the
addition of the amino acid versus the control. Increases to swelling, viscosity,
tensile strength, work of adhesion, and internal crosslinking are indicative of a
higher degree of interaction between the mucus and the polymer.
Suzuki et al. used a different peptide to incite bone growth by binding
bone morphogenetic proteins (BPM) to alginate and creating a hydrogel [57].
When used with other biocompatible biopolymers, BPM will release in vivo
quickly in a manner not conducive for calcifying bones. Alginate BMP permitted
a slower and constant release of the peptide creating an environment for ectoptic
bone growth.
40B2.3.3 Alginate and silane modification Silanated alginate, formed by covalent grafting and subsequent hydrolysis
of 3‐aminopropyltriethoxysilane, has the ability to nucleate apatite crystals [58].
Apatite deposition correlates to the availability of functional groups on the
modified alginate. The use of 3‐aminopropyltriethoxysilane creates a net gain in
functionality, with the loss of one carboxylate and gain of three silanol. Gelling
mechanisms like ethylenediamine result in a net loss of functionality limiting the

39 efficiency for apatite deposition. Silanated alginate used as a surface treatment
for surgical grade stainless steel as a method for preventing blood clotting and
coagulation demonstrated improve blood compatibility and reduced the
adhesion of blood components to the surface [59].

40
41BChapter 3. Experimental Technique
42B3.1 Materials Food grade hyaluronan of sodium salt was procured via research
collaborators from Cleo Pharmaceutical Inc (China). This material was used to
synthesize glycosaminoglycans and amino acids derivatives. Cosmetic grade
hyaluronan was procured from Avon Products Inc., (New York, New York) two
years later, which was used in the synthesis of glycerol phosphate derivatives of
hyaluronan. Other base polymers such as chondroitin 6 sulfate of shark cartilage,
alginic acid of sodium slat from brown algae, and 85% deacetylated chitosan of
medium molecular weight, were obtained from Sigma Aldrich (St. Louis, Mo)
and used as base polymers for modification.
The modifying agents such as, D‐(+)‐glucosamine, glycine methyl ester,
and l‐cysteine methyl ester used in GAG modification, thiolglycolic acid, 2‐
iminothiolane, lipoic acid, and again l‐cysteine for chitosan modification, the
diglycinehistidine tripeptide for alginate modification, and the glycerol
phosphate and tripolyphosphate for hyaluronan modification, were all procured
from Sigma Aldrich. The carbodiimide coupling agent, 1‐ethyl‐3‐(3‐
dimethylaminopropyl) carbodiimide hydrochloride) was obtained from Fluka
Biochemika (Switzerland). The Ellman’s reagent thiol dye and other auxiliary

41 reagents such as phosphate buffer solution, methanol, hydrochloric acid, and
sodium hydroxide were procured through Sigma Aldrich.
43B3.2 Characterization of modified biopolymers Modified polysaccharides were characterized via Fourier transform
Infrared spectroscopy – attenuated total reflectance (FTIR‐ATR), elemental
analysis (EA), and gel permeation chromatography (GPC). A Nicolet 380 FTIR
spectrometer from Thermo Scientific of Waltham, MA was used is these
experiments. FTIR‐ATR involves a solid sample being pressed onto a glass plate
of the instrument. The absorption intensity is measured from 4000cm‐1 to 400cm‐1
with a dead zone of zero intensity between 1700cm‐1 and 2000cm‐1 due to the
absorption range of the diamond crystal. Elemental analysis of carbon, nitrogen,
hydrogen, and sulfur content was carried out by Atlantic Microlabs Inc.,
Norcross, GA via atomic absorption spectroscopy. Molecular weight was
calculated using an Aligent HPLC 1100 for high performance liquid
chromatography, HPLC, from Perkin Elmer (Waltham, MA). Samples are run
through the two polystyrene columns of the HPLC unit, models G2500PWXL
(average pore size <200 angstrom) and GMPPWXL (average pore size 100‐1000
angstrom) supplied by TosoHaas (Philadelphia, Pa) to cover a molecular weight
range from dimers to 8M Daltons.

42 Thiol dyes such as Ellman’s reagent was used to confirm and quantify
sulfur modification and content of the cysteine modified hyaluronic acid and
chondroitin sulfate. A Cary 5000 UV/Vis Spectrometer from Varian Inc. (Palo
Alto, Ca) was used to detect interaction between the thiol dyes and the modified
biopolymers.
44B3.3 Synthesis: glycosaminoglycans and amino acids Reactions coupling polysaccharides to amino acids or methyl esters of
amino acids utilized EDC as the crosslinking agent. Amides form between the
amine of the amino acid and the carboxyl group of the polysaccharide. In the
case of GAG polymers, the carboxyl is on the uronic acid residue. Following a
modified procedure of Kast, in general 50mMol of EDC is added to a 1% solution
of water and methyl ester of amino acid under agitation [60]. To this 5.4mMol of
polysaccharide is added to the solution and agitated until dissolved. The pH of
the solution is adjusted using 1M HCl to pH of 5.0. The polysaccharide and
amino acid solution agitates overnight. The reaction product is dialyzed using
3500 molecular weight cut off tubing (Pierce Biotechnology, Rockford, Il) in
deionized distilled water, which is replaced every 24 hours for 3 days prior to
lyophilization, (‐85°C at ‐100mTorr) and characterizing the samples. Methyl
esters of the selected amino acid residues are used to protect the acid group and
limit the EDC reaction between the acid of the polysaccharide and the amine of

43 the amino acid. Without blocking the acid group, the amino acids in solution
with the EDC would likely begin to polymerize. It is hypothesized that this
protocol will result in approximately 20% conversion to modified polymer.
Table 4. Glycosaminoglycan and amino acid reactions. GAG Polymer Amine Moiety Reaction Product
D(+)‐Glucosamine HCl Hyaluronan –Glucosamine
Glycine methyl ester HCl Hyaluronan –Glycine Hyaluronan L‐Cysteine methyl ester HCl
Hyaluronan –Cysteine
Chondroitin 6‐Sulfate
L‐Cysteine methyl ester HCl
Chondroitin sulfate – Cysteine

44
Figure 17. Reaction scheme indicating the modification of hyaluronan with amino acids; a) hyaluronan‐ glycine, b)
hyaluronan‐ glucosamine.
n
a
n
n
n
b

45
Figure 18. Reaction scheme indicating the modification of; a) hyaluronan ‐ cysteine, b) chondroitin sulfate ‐ cysteine.
n
n
a
n n
b

46
45B3.4 Synthesis: chitosan and thiol modification The metal ion absorption of chitosan, specifically thin films of chitosan has
been reported [61]. Thiol functionality is often used to aid adhesion or
encapsulation of metal ions [62, 63]. The incorporation of thiol functional
molecules onto chitosan for eventual use in thin film applications is described.
The medium molecular weight, 85% deacteylated chitosan is to be modified
with l‐cysteine, thiolglycolic acid, 2‐iminothiolane, and lipoic acid. As adapted
from Kast’s Biomaterials paper, [60] thiol containing acids, activated by a
carbodiimide, react with chitosan in dilute solutions resulting in amide
formation. Briefly the respective thiol compounds as noted in XTable 5X are
dissolved into 400mL of ultrapure water to which 50mM of EDC is added.
Chitosan (1.0g) and acetic acid (4mL) are added to the solution and agitated until
dissolved. The solution pH is adjusted to 4.5 ‐ 5 and the reaction agitates
overnight. Dialysis via 3500 molecular weight cut off tubing and lyophilization
follow. The lyophilized sampled were characterized via FTIR.
This procedure was slightly modified for the addition of lipoic acid and 2‐
iminothiolane, the former due to the decreased solubility of the material. In the
case of lipoic acid, the 1.0g if chitosan and 4mL of acetic acid are added to 50mL
of ultrapure water, at which point 0.48g of EDC are added to the solution.
Separately lipoic acid is dissolved in a minimal volume of methanol. The lipoic

47
acid methanol solution is added to the chitosan solution at which time the lipoic
acid precipitates. Additional methanol is used to redissolve the lipoic acid
resulting in a final solvent ratio of 50mL water to 75mL methanol. 2‐iminothilane
utilizes a ring opening reaction absent of carbodiimide which compel
nucleophiles from the chitosan amino group to attack the imino carbon and form
a carboxamidine linkage binding the thiol compound to chitosan.
Table 5. Chitosan and thiol reactions. Polymer Thiol
Compound Thiol Compound Added
Reaction Product
L‐Cystiene 0.660g Chitosan‐L‐ Cysteine (Chit –Lcyst)
Thiolglycolic acid
0.38mL Chitosan‐Thiolglycolic acid (Chit‐TGA)
2‐iminothiolane 0.406g Chitosan‐2‐iminothiolane (Chit‐2‐imino)
Chitosan
Lipoic Acid 0.50g Chitosan‐Lipoic Acid (Chit‐LA)

48
Figure 19. Structure of Chitosan and thiol modified derivatives. x, the number
of glucosamine subunits, y, the number of N‐acetyl glucosamine; x > y
46B3.5 Fluorescent thiol dyes Florescent dyes and markers are quick methods for characterizing the
composition of a material. Fluorescent compounds are materials which emit an
energy photon of specific wavelength in response to an energy excitation.
Reactive fluorescent dyes are compounds which bind to specific function groups,
emitting photos of distinct wavelength based on successful coupling to the
intended functional group. Fluorescent dyes may fluoresce in both the coupled
and uncoupled state, as is the case with Ellman’s reagent.
47B3.5.1 Ellman’s Reagent Ellman’s Reagent, (‐5‐, dithio‐bis(2‐nitrobenzoic acid), also know as
DTNB, is a common material used for quantifying the thiol composition of
Chit – LCyst Chit – TGA Chit – 2‐imino Chit – LAChit – LCyst Chit – TGA Chit – 2‐imino Chit – LA

49
proteins. DTNB is a symmetric disulfide compound that cleaves when in the
presence of free thiols forming a mixed disulfide compound and 2‐nitro‐5
thiobenzoate (TNB). Solutions containing TNB fluoresce at 412nm, quickly
exhibiting a bright yellow color. DTNB fluoresces at 324nm, with known obvious
color change to the solution. The formation of TNB at a 1:1 ratio with the free
thiol present in solution enabling their quantification via UV/Vis spectroscopy
[64, 65]. The reaction of DNTB to TNB is influenced by the temperature of the
reaction solution with temperature rise causing the absorption intensity to
decrease and shift the absorption frequency to longer wavelengths [66].
Furthermore, as DTNB is photo reactive, solutions must be shielded from light to
prevent degradation of the product.
Figure 20. Reaction scheme of Ellman’s reagent. [66]
The L‐ cysteine modification of hyaluronic acid and chondroitin sulfate
results in a pendant thiol group for both biopolymers, suitable for identification
with a thiol dye. Test specimens consisting of 10mg of modified biopolymer are

50
dissolved into 1mL of pH 8.0 phosphate buffered saline (PBS). The dye solution
was composed of 10mg of DNTB, Ellman’s reagent, and 20mL of ph 8.0 ultrapure
water. Last, a concentration curve was measured in order to determine the
precision and approximate level of modification undergone by cysteine
containing biopolymers. Solutions of l‐ cysteine made in logarithmic progression
of concentrations ranging from 10‐2 to 10‐7 were prepared in ultrapure water and
tested. To each cuvette, 2mL of the sample solution and 1mL of DNTB dye is
added. UV absorbance was measured on the Carry UV/Vis spectrometer.
48B3.6 Synthesis: alginate and diglycinehistidine The affinity of alginate to absorb metal ions is of ongoing research interest,
especially the chelation of copper ions [24, 67, 68]. The modification of alginate
with a material that unto itself has an affinity for Cu2+ chelation creates a
synergistic pairing. The tripeptide diglycinehistidine, GlyGlyHis, is known to be
a copper binding peptide [69]. It was hypothesized that thin films of GlyGlyHis
modified alginate would have a novel selectivity and or specificity for copper
ions. Using carbodiimide chemistry, the coupling of alginate and GlyGlyHis is
attempted. Briefly, the carbodiimide reaction occurs between the carboxylic acid
of the alginate’s G residue, and the primary amine of the glycine residue. EDC
will form the amide bond, however the glycine‘s amine must be limited to
coupling only to the acid of the polymer and not that of the histidine residue, a

51
likely occurrence if both residues are activated by EDC. A methyl ester is formed
on the tripeptide to protect the acid of the histidine residue from EDC activation
and prevent the backbiting of the tripeptide. The carboxyl is protected by chilling
oven dried methanol and thionyl chloride at 0°C prior to the addition the
GlyGlyHis. Tert‐butyl methyl ether is added to the peptide solution, at which
time gel precipitates. The gel is washed with additional tert‐butyl methyl ether
prior to coupling with alginate.
Using a protocol similar to the GAG amino acid reactions; 1g of alginate is
dissolved in 400mL of water to which 50mM of EDC is added to activate the
available acids while 10mM of N‐hydroxylsuccinimide is used to limit side
reactions. To the solution 150mg of GlyGlyHis are added under agitation. After
4h the solution is dialyzed with 3500 molecular weight cut off tubing for several
days against water prior to lyphilization up to ‐100 mTorr pressure. The
resulting samples were characterized via FTIR.

52
Figure 21. Proposed structure of alginate modified with diglycinehistidine.
49B3.7 Synthesis: phosphate modification of chitosan and hyaluronan In 2000, Chenite et al. and their affiliated company BioSynth published a
paper in Biomaterials reporting the sol/gel transition of chitosan and
glycerolphosphate when exposed to physiological conditions. By 2007, the
mechanism for this reaction had yet to be confirmed but thought was given to
how further modification of chitosan and phosphate moieties would alter

53
application properties. It was hypothesized that coupling chitosan with a multi
phosphate functional compound would show a more efficient sol/gel transition
and/or unique rheological character as compared to the singular phosphate
addition demonstrated with glycerolphosphate. Furthermore, the intended
wound healing applications of the phosphate modified biopolymer would be
enhanced by the substitution of hyaluronan for chitosan as the base
polysaccharide. Hyaluronan has a cradle to grave in vivo life cycle (synthesis,
functional use, and degradation) which in theory would ease biologic acceptance
of the modified polymer over polymers not synthesized in vivo.
50B3.8 Synthesis: chitosan and glycerolphosphate Recreating the original experiment from Chenite’s Biomaterials paper [7], a
solution is made of 200mg chitosan and 9mL of 0.1M hydrochloric acid, HCl. To
this a solution of 560mg of glycerolphosphate disodium salt and 1mL of
deionized and distilled water is added dropwise at an estimated feed rate of 1
drop per minute. In practice, the glycerolphosphate solution was added
dropwise only after the preceding drop had gone into the chitosan solution. The
chitosan originated from crab shells and contained deacetylated composition
greater than 85%. The chitosan glycerol phosphate solution was left to agitate
approximately 24h in a closed container. Upon return precipitates of various
sizes were distributed throughout the container. Chitosan glycerol phosphate

54
synthesis was repeated two additional times with slight modification to method/
order of addition to prevent precipitate formation, which was not described in
the literature. These attempts failed to achieve a stable solution. Chitosan
glycerol phosphate synthesis was halted pending the hyaluronan derivative
results.
51B3.9 Synthesis: hyaluronan and glycerolphosphate In substituting hyaluronic acid for chitosan, the number of moles of
hydroxyl groups was used as a baseline to equate the two polymers,
hypothesizing the importance of these groups in the sol/gel formation.
HyaluronanmgHAmol
gHAOHmolChitOHmol
ChitgmolChitosanmg 8.318
1385
32
1611200 =×××
HyaluronanmgHyaluronanmg 4.159218.318 =×
Equation 2. Substitution of chitosan for hyaluronic acid. A half batch of these hyaluronan reactions were synthesized due to raw
materials supplied, however the solvent volume was left unchanged, creating a
solution more dilute than that described by Chenite et al. A solution composed
of 280mg of glycerolphosphate and 3.5mL of deionized distilled water are added
to a solution of 159.4mg of cosmetic grade hyaluronan, and 5.5mL of deionized

55
distilled water. The use of additional water insured that the glycerolphosphate
solution can mix with the high viscosity hyaluronic acid solution.
52B3.10 Synthesis: hyaluronan and tripolyphosphate As mentioned previously, the addition of a polyphosphate material was
intended to enhance the sol/gel rheology of the chitosan phosphate system.
Glycerolphosphate was therefore replaced with tripolyphosphate permitting
three times the phosphate functionality. Acknowledging the advantages of in
vivo use of hyaluronic acid over chitosan, a hyaluronic acid tripolyphosphate
material was synthesized. In the initial reaction, both hyaluronan and the
tripolyphosphate were placed into their respective solutions prior to combining.
However due to the high viscosity of the hyaluronic acid, the dropwise addition
of the tripolyphosphate solution was not a feasible method for mixing. It was
decided that as both materials use neutral pH water as solvent, chitosan
requiring an acidic solution, that a dry blend of hyaluronan and
tripolyphosphate would be made prior to the addition of the solvent. Therefore
159.4mg of hyaluronan and 476.75mg of tripolyphosphate were placed in a
Falcon tube and dry blended with the assistance of a vortex stirrer. To this dry
blend, 20mL of deionized distilled water was added; twice the volume used in
the chitosan solutions, again due to the high viscosity of hyaluronan.

56
3.11 53BRheology
54B3.11.1 Introduction of rheology Defined by E.C. Bingham in 1929, rheology is the study of deformation
and flow of matter [70]. The academic interest and development in rheology
began in the 1930’s paralleling research into the mechanical behaviors of rubbers,
plastics, and biological fluids. The flow of these fluids and melts are defined into
one of two systems, Newtonian and non‐Newtonian. Newtonian fluids
demonstrate constant viscosity (a resistance to flow) at a given temperature,
resulting in linear stress strain curves. A non‐Newtonian response generates a
non linear stress strain curve. Rheology covers first order flow effects such as the
increase or decrease of viscosity of a material with rising shear rates, designated
as dilatent or thixotropic respectively.
Non‐Newtonian materials may be either time dependent or independent
in nature as far as their respective responses are to shear stress and shear rates.
Time dependent, non‐Newtonian materials can be either thixotropic or
rheopectic, depending upon if a network is destructed or constructed when a
shear stress is applied and if the rate of shear rises. Thixotropic materials break
down structures, while rheopectic build up. Pseudoplastic materials have no
structure and therefore no yield stress and are simply defined as materials in
which the viscosity decreases with shear rate rise.

57
55B3.11.2 Rheology of phosphate modified hyaluronan and chitosan The Chenite Biomaterials paper demonstrates the rheological properties of
the chitosan glycerolphosphate sol/gel transition [41]. By setting the pH of two
chitosan‐GP solutions to slightly acidic and physiological pH, the elastic shear
modulus was measured as a function of temperature. The resulting curves
showed a distinct rise in the elastic shear modulus (G’) at 37°C for physiological
pH and 46°C for the more acidic solution. This change from liquid to gel was
fully reversible upon cooling.
Rheometry curves were run on the hyaluronic acid phosphate derivatives
to discern differences, advantageous or otherwise versus the chitosan based
solutions. Using a controlled stress rheometer, RheoSci 3000 (TA instruments,
New Castle, De) three pH solutions were prepared for each sample. Using 1M
HCl or 1M NaOH, acidic, neutral, and basic pH solution were made for both the
hyaluronan‐GP and the hyaluronan‐TPP reactions. A cone and plate rheometer
was used with the cone having an angle of 0.04 radians, a 40mm diameter, and
0.05mm gap distance above the plate.
56B3.11.3 Test condition of rheometer The rheometer is controlled stress unit and was run by ramping stress up
on a logarithmic scale from 1.0 to 11,000 dynes/cm2. Samples were tested
without pre‐stressing the materials prior to data collection. Instead as a way to

58
ensure an equivalent shear environment prior to testing, the material was rested
on the stage for a period of no more than 1min and no less than 30 seconds. This
was to permit some measure of equilibrium prior to shear. It was felt that the pre
stress of the sample would represent a significant proportion of the stress that
the samples were capable of undertaking prior to failure. The heated stage
located beneath the plate was used to control temperature test conditions
between 25°C and 60°C, though most tests were run at, below, or above body
temperature.
57B3.11.4 High performance liquid chromatography Molecular weight was measured via high performance liquid
chromatography, HPLC using an Agilent HPLC 1100 Series from (Agilent
Technologies, Santa Clara, CA). Lyophilized modified polymer samples are put
into solution using pH 7 phosphate buffer solution. Approximately 10mg of
sample and 5mL of buffer are used. 2.0mL of solution were filtered through 0.45
micron filter and placed on the auto sampler. Prior to and following the test
series a flow marker was made and placed on the auto sampler.

59
58BChapter 4. Results and Discussion 60B4
4.1 Infrared spectroscopy
4.1.1 Statistical understanding of IR data collected The modified and unmodified biopolymers were run on the ATR‐FTIR
three distinct times for 64 scans during each run. The spectra, which are
described here, are representative of the other scans recorded. It should be
understood that each of the three scans recorded characterize materials from the
same synthesis reaction. In essence, one sample from each synthesis is
thoroughly characterized but the synthesis protocol for each set of modifications
is characterized only once.
62B4.1.2 Assignment of absorption frequencies Modification of the three four biopolymers discussed, chitosan,
hyaluronan, chondroitin sulfate, and alginate, will occur with the formation of a
secondary amide (or amidine) group bonding the small molecule to the
biopolymer which is observed in the FTIR spectra. The secondary amide I bands
appear at 1640cm‐1, 1680cm‐1, and 1700cm‐1 and correspond to the C=O stretch,
while the amide II band representative of the C‐N stretch and N‐H bend appear
between 1570cm‐1 and 1515cm‐1, as well as show a second weak absorption at
1250cm‐1 [71]. The amidine group, which represents the N=C‐N structure, is
known to absorb similarly to the secondary amide I and II bands [72, 73]

60
The primary amine bands observed in the amino acid spectrum will be
absent from the new reaction product spectrum. The N‐H stretch of the primary
amine is referenced as a weak band at 3500cm‐1 for the symmetric and 3400cm‐1
for the asymmetric stretch, while the secondary amine presents this N‐H stretch
within a range of frequencies, namely 3350‐3310cm‐1. The corresponding N‐H
bend of the primary amine occurs between 1650‐1580cm‐1 and the secondary N‐H
bending between 909cm‐1 and 666cm‐1. A C‐N stretch common to primary,
secondary, and tertiary amines that connect to carbon atoms as part of a larger
structure absorbs between 1250cm‐1 and 1020cm‐1 [71].
The absorption intensity of primary methyl bands would increase due to
the addition of the methyl ester, from the glycine and cysteine methyl esters
coupled to the GAG polymer. Methyl groups present a symmetric C‐H stretch at
2962cm‐1 and a corresponding contraction at 2872cm‐1. The symmetric C‐H bend
is referenced at the 1375cm‐1 absorption and the asymmetric bend at 1450cm‐1
[71].
Lastly, in the case of the thiolated chitosan and GAG products a thiol
group demonstrate a weak S‐H stretch between 2600cm‐1 and 2250cm‐1 and a C‐S
stretch between 700cm‐1 and 600cm‐1 [71]. The diamond crystal of the FTIR‐ATR
absorbs between 1800cm‐1 and 2200cm‐1; preventing characterization of
functional groups that absorb within this range [71].

61
72B4.2 Infrared spectroscopy of thiolated chitosan The study of thiol modification of chitosan was initially undertaken as a
means to achieve and alter the specificity of metal ion absorption of chitosan thin
films as an extension of similar alginate research previously published [24]. Only
the infrared characterization and analysis is discussed below as this was the only
portion of the research
The reaction between the chitosan and thiol residues to produce modified
chitosan is dependent upon the formation of amide bonds. To confirm successful
coupling of chitosan to cysteine, lipoic acid, and thioglycolic acid respectively,
the amide I and II absorption bands, as well as amine were investigated while C‐
H and glycosidic bands (C‐O‐C) are confirmed. The modification of 2‐
iminothiolane to chitosan will result in the formation of an amidine group,
absorbing at similar frequencies as the amide also requiring the loss of primary
amine functionality from the chitosan base polymer. The modified and
unmodified chitosan polymers were run on the ATR‐FTIR three distinct times for
64 scans during each run. The spectra, which are described here, are
representative of the other scans recorded.

62
5001000150020002500300035004000
Wavenumber (cm‐1)
Absorba
nce
A
B
C
D
E
Figure 22. FTIR spectra for a) unmodified chitosan and chitosan modified by
b) 2‐iminothioane, c) cysteine, d) lipoic acid, and e) thioglycolic acid.
600700800900100011001200130014001500160017001800
Wavenumber (cm‐1)
Absorba
nce
A
B
C
D
E
Figure 23. FTIR spectra of fingerprint region for a) unmodified chitosan and chitosan modified by b) 2‐iminothioane, c) cysteine, d) lipoic acid, and e)
thioglycolic acid.

63
Amide/ amidine gain. The spectra from thiolated samples contained a signal peak
within the amide I range at 1640cm‐1, a peak that is not found in the spectrum of
the unmodified chitosan. Multiple absorptions are observed in the thiolated
spectra in the secondary amide II frequency range. There are no corresponding
absorptions in the unmodified chitosan spectra.
Amine loss. The intensity of the N‐H bend noted at 1591cm‐1 decrease in the
modified chitosan spectra when compared to unmodified chitosan.
Ethanoate gain. Specifically for the lipoic acid modified chitosan, absorption
bands are present at 1203cm‐1 and 1185cm‐1, which are indicative of the ethanoate
groups C(=O)‐C stretch and the O‐C‐C asymmetric stretch respectively.
The presence of the amide I and II absorptions are contingent on the
disappearance of the primary amine signals indicates the successful modification
of the chitosan with 2‐iminothiolane, cysteine, lipoic acid, and thiolglycolic acid
respectively. The lipoic acid modification is further supported by the ethanoate
absorptions specific for that structure. Synthesis and additional characterization
of these materials were conducted and reported by a collaborator, where
modification was further confirmed via supporting elemental analysis and thiol
dye results [49].
73B4.3 Infrared spectroscopy of diglycinehistidine modified alginate

64
The synthesis success of thiolated chitosan instigated research into
modifying other polysaccharides with thiol functional small molecules. Alginate,
also know in its natural form to absorb metal ions was modified with
diglycinehistidine, a thiolated tripeptide specific for Cu2+ and Ni2+ ion absorption.
The tripeptide modification of alginate again requires the successful
formation of an amide bond. The N‐terminus of the glycine bonds to an available
acid of the alginate polymer. The modified and unmodified alginate polymers
were run on the ATR‐FTIR three distinct times for 64 scans during each run. The
spectra, which are described here, are representative of the other scans recorded.
Amide formation: The secondary amide I band at 1640cm‐1 and 1700cm‐1 are noted
in the gly‐gly‐his alginate spectrum and are absent from the unmodified alginate.
The modified alginate spectrum contains an amide II absorption band at
1567cm‐1, and a weak shoulder present at 1247cm‐1, also corresponds to the amide
II band.

65
5001000150020002500300035004000
Wavenumber (cm‐1)
Absorba
nce
A
B
Figure 24. FTIR spectra of a) unmodified alginate and b) gly‐gly‐his modified
alginate. Primary amine loss: Due to the absence of an IR spectrum for the tripeptide, it is
difficult to determine if the primary amine participated in amide formation.
There are two secondary amines which would remain within the tripeptide
residue if amidation occurred. The absorption range for secondary amines and
primary amines do not differ severely, and in most cases there is significant
overlap. The C‐N stretch for secondary amines is between 1350cm‐1 and 1280cm‐1
versus 1340cm‐1 through 1250cm‐1 for primary amines. The modified alginate
spectrum contains a series of shoulders within this frequency range, one of
which is assigned to the amide II band at 1250cm‐1, the remaining peaks may be a
response of either the primary or secondary amines.

66
60080010001200140016001800
Wavenumber (cm‐1)
Absorbance B
A
Figure 25. FTIR spectra of the fingerprint region for a) unmodified alginate
and b) gly‐gly‐his modified alginate.
The presence of a strong peak at 1600cm‐1 in both the alginate and
modified alginate spectra indicate that this peak is assigned to the polymer’s
structure and corresponds to the carboxylate functionality of alginate, which has
two bands of absorption between 1650cm‐1 – 1550cm‐1 and at 1400cm‐1. Both of
which are presents in the alginate and modified alginate spectra [71]. However,
the two shoulders flanking the 1600cm‐1 peak in the modified alginate spectrum
are amide I and II bands. As there are no amides within unmodified alginate, it
can be concluded that modification of the tripeptide to alginate did occur.

67
Application testing done by colleagues demonstrated negative results for
Cu2+ and Ni2+ solution absorption from spin cast films of the gly‐gly‐his alginate
polymer [74]. The formation of the thin films was also troublesome as the
modified alginate polymer rejected Ca2+ crosslinking, the typical method by
which modified polymer films are given water resistance for metal solution
testing [74]. In the case of alginate, Ca2+ crosslinking is controlled by the G blocks
of the alginate, polymer. It is thought that the tripeptide coupled to this residue
preferentially creating the difficulty in crosslinking. Follow up work would
involve confirmation of the methyl ester blocking of the tripeptide prior to
alginate modification and a thorough investigation of alternate crosslinking
mechanisms.
4.4 Thiol modification of glycosaminoglycans
Glycosaminoglycans, chondroitin sulfate and hyaluronic acid specifically,
see extensive use and research due to their rheological and wound healing
properties. The modification of theses biocompatible polymers with thiol and
non‐thiol amino acids was investigated as an in vivo alternative to the
polysaccharide modification previously described. The covalent bonding of the
thiol molecules to chitosan was very straight forward with the loss of the
polymers primary amine and the resulting amide formation. Cysteine was then
first used to modify hyaluronan and chondroitin sulfate. Later, glycine and

68
glucosamine modification of hyaluronan was undertaken, utilizing the same
synthesis mechanism previously described for chitosan and alginate. In the case
of the thiol modification of GAG polymers, the acid group on the polymer and
the primary amine from the modifying amino acid partake in coupling, thereby
reversing the responsibilities of the reaction scheme presented with the thiolated
chitosan where the amine came from the neat polymer.
For the coupling of cysteine to chondroitin sulfate and hyaluronan, the
amide formation will result in an exchange of the hydroxyl group from the
polymer’s acid to an amine, while gaining new functionalities found on the
amino acid such as carbonyl, methyl, and in the case of cysteine, thiol
functionality.
67B4.4.1 FTIR analysis of cysteine modified glycosaminoglycans
Chondroitin sulfate and L‐cysteine The sulfate functionality of chondroitin 6 sulfate has been assigned
absorptions around 1225cm‐1 by Servaty et al., which also corresponds to the
standard sulfonate absorption ranges listed by Silverman et al [71, 75].
Furthermore this peak is observed in the modified and unmodified chondroitin
sulfate spectra displayed in XFigure 29X and XFigure 30X.
Amide formation. The secondary amide I peak at 1640cm‐1 is observed to be an
ascending shoulder in the unmodified chondroitin sulfate spectrum, while

69
presenting as a more prominent descending shoulder in the cysteine modified
polymer spectrum. The amide I peak at 1680cm‐1 is observed only in the cysteine
modified spectrum. There is no amide peak at 1700cm‐1. The typically weak N‐H
bend, C‐H stretch at 1250cm‐1 is observed as a small shoulder in the chondroitin
sulfate spectrum and as a more defined absorption in the chondroitin sulfate‐
cysteine spectrum. A strong peak at 1610cm‐1 corresponding to the acid C=O
stretch is observed in the unmodified chondroitin sulfate spectrum, which is
referenced by Uchisawa et al. to be between 1550cm‐1 and 1620cm‐1 [76]. The
absence of this peak from the cysteine modified spectrum is further evidence of
amide formation.
5001000150020002500300035004000
Wavenumber (cm‐1)
Absorba
nce
A
B
C
Figure 26. FTIR spectra for a) chondroitin 6‐sulfate, b) L‐cysteine methyl ester,
c) chondroitin sulfate‐cysteine.

70
600700800900100011001200130014001500160017001800
Wavenumber (cm‐1)
Absorba
nce
A
B
C
Figure 27. FTIR spectra of fingerprint region for a) chondroitin 6‐sulfate, b) L‐
cysteine methyl ester, c) chondroitin sulfate‐cysteine. Primary amine loss. A prominent and defined absorption band at 1580cm‐1 is
noted in the amino acid spectrum, which does not appear in the spectrum of the
chondroitin sulfate‐cysteine polymer. A weak shoulder at 1250cm‐1
representative of the C‐N stretch grows more prominent in the chondroitin
sulfate‐cysteine reaction spectrum when compared to the unmodified polymer.
There are multiple absorption peaks between 1250cm‐1 and 1020cm‐1 in the
cysteine methyl ester spectrum that are not found in the modified polymer
spectrum.

71
Methyl loss. Absorption bands at 1375cm‐1 are noted within both the polymer and
the reaction spectra. No peaks are observed at 1450cm‐1, and there are no
distinguishable absorptions at the 2962cm‐1 or 2872cm‐1 frequency.
Thiol addition. Absorption bands indicative of the S‐H stretch between 2600cm‐1
and 2550cm‐1 or the C‐S stretch between 600cm‐1 and 700cm‐1 were undetectable
in the spectra of this series.
The lack of amide definition and resolution in the unmodified chondroitin
sulfate material is of concern, and requires the use of additional characterization
techniques. When amides integral to the structure of the base polymer are
difficult to detect, doubt is cast on confirmation of amides formed via
modification with pendant groups. The absence of many primary amine
absorptions from the modified spectrum, which are prominent in the amino acid
spectrum does give good cause that the chondroitin sulfate polymer was indeed
modified but the results are inconclusive.
Hyaluronan and L‐cysteine Amide formation. Secondary amide I bands at 1640cm‐1 and 1680cm‐1 are present
only in the hyaluronan‐cysteine and are assigned by Haxaire et al to also be
within the unmodified hyaluronan spectrum, though only the 1640cm‐1 peak is
observed there. The secondary amide II band at 1540cm‐1 is noted both in the

72
modified and unmodified polymer spectra. Only the amide I band at 1680cm‐1 is
unique to the cysteine modified hyaluronan spectrum.
Primary amine loss. The primary and secondary amine N‐H stretches assigned
between frequencies of 3300cm‐1 and 3500cm‐1 are indistinguishable with in this
region. Peaks at 1580cm‐1 and 1600cm‐1, representing the primary amine N‐H
scissor bend, are observed in cysteine methyl ester spectrum. Both of these peaks
occur at frequencies of increased absorption for the hyaluronic acid and modified
hyaluronic acid polymers. The 1580cm‐1 frequency represents an inflection point
in both the unmodified and cysteine modified hyaluronan spectra. The peak at
1600cm‐1 in the unmodified spectrum is part of a strong plateau that runs from
1600cm‐1 to 1650cm‐1. However in the cysteine modified spectrum, this peak now
only exists at the 1650cm‐1 frequency, which corresponds to the amide I bands of
the hyaluronan polymer. A peak at 1107cm‐1, one of several within the C‐N
stretch region is also only present in the amino acid. The other peaks observed in
the amino acid spectrum between 1250cm‐1and 1020cm‐1, can be correlated to the
peaks found in the modified polymer within the same range.
The plateaued absorption band in the unmodified polymer spectrum
centered on 1625cm‐1 represents two peaks, at 1600cm‐1 the C=O stretch of the
pendant acid, and at 1650cm‐1 the C=O stretch of the amides carbonyl. With

73
cysteine modification, the acid becomes the carbonyl of the amide, shifting the
absorption over to the 1650cm‐1 in the modified spectrum.
5001000150020002500300035004000
Wavenumber (cm‐1)
Absorbanc
e
A
B
C
Figure 28. FTIR spectra for a) hyaluronan, b) L‐cysteine methyl ester, c)
hyaluronan‐cysteine.

74
600700800900100011001200130014001500160017001800
Wavenumber (cm‐1)
Absorba
nce
A
B
C
Figure 29. FTIR spectra of fingerprint region for a) hyaluronan, b) L‐cysteine
methyl ester, c) hyaluronan‐cysteine.
Methyl loss. The C‐H extension and contraction at 2962 cm‐1 and 2872cm‐1 were
observed in the hyaluronan, cysteine methyl ester, and hyaluronan‐ cysteine
product. A peak at 1375cm‐1 which could correspond to the symmetric C‐H bend
is observed in both the polymer and reaction product. No peak is noted at
1450cm‐1, the asymmetric bend throughout the series.
Thiol addition. Absorption bands, which are assigned to thiol formation between
frequencies 2550cm‐1 to 2600cm‐1 and 600cm‐1 to 700cm‐1, are undetectable within
any of the spectra of this series.
Amide formation and successful coupling of cysteine and hyaluronan are
confirmed. The presence of the amide I band at 1640cm within the modified

75
polymer, the shift of the broad carbonyl stretch from a 1625cm‐1 center in the neat
polymer spectrum to a single peak at 1650cm‐1, and the corresponding primary
amine loss at 1600cm‐1 from the amino acid spectrum provide sufficient evidence
in support of modification.
71B4.4.2 UV/Vis spectroscopy of cysteine modified glycosaminoglycans Ultraviolet visible spectroscopy is used to determine if the Elman’s
reagent successfully dyed the GAG polymers, which were modified with thiol
containing cysteine. Comparing the absorption intensity of the modified GAG
polymers at known wavelengths versus a concentration curve of cysteine the
relative modification of the polymers may be determined. If the percent
modification is unable to be obtained due to an abnormal concentration control
curve, then the UV/Vis results serve as a qualitative spot check to confirm if
cysteine modification was at all successful. In the case of Elman’s reagent, DNTB,
successful coupling to the thiolated polymer forms TNB, as indicated by the
fluorescence at 412nm. If the dye is unable to bond to the modified polymer, then
the DNTB structure will remain intact, fluoresce at 324nm, and determine that
the GAG polymers were not modified with cysteine.
Three independent test specimens for each cysteine concentration and the
cysteine modified GAG sample were prepared for dye. The original protocol was
to dye the thiol containing samples on a 1:1 solution ratio and two of the three

76
test specimens were prepared in such manner. This resulted in a dramatic over
saturation of the sample. The third and final specimen was dyed at a ratio of 2:1
sample solution to dye solution, which generated the data presented.
The hyaluronan‐cysteine, chondroitin sulfate‐cysteine, and the 10‐2 mol/L
cysteine solution fluoresced at 412nm with absorbencies of 1.4, 2.7, and 3.2
absorbance units respectively. Both the cysteine modified hyaluronan and
cysteine modified chondroitin sulfate materials fluoresced at 324nm, doing so at
a lower absorbance, than observed at 412nm, 2.7 and 2.8 absorbance units
respectively. The 10‐2 mol/L solution of cysteine did not fluoresce at 324nm
indicating that no DNTB remained in the solution.
The absorbance of TNB at 412nm within the cysteine modified hyaluronan
and cysteine modified chondroitin sulfate materials points out that both GAG
polymers indeed have some degree of modification of the thiol containing amino
acid. That both modified GAG polymers also fluoresce at 324nm and do so at
lower absorbance than the TNB shows that the concentration of Elman’s reagent
used was greater than the degree of modification of the GAG polymers, leaving
the excess reagent to fluoresce. As an identical concentration of Elman’s reagent
was used to dye both modified GAG polymers, it can be concluded that cysteine
modification was greater for the chondroitin sulfate than for the hyaluronic acid

77
as the relative absorbance of the chondroitin sulfate‐cysteine is 1.3 absorbance
units greater than the cysteine modified hyaluronan.
The cysteine solutions at lower concentrations, specifically 10‐3 through
10‐7 only fluoresced at 324nm indicating that no thiol groups are present. The
intensity of their absorption did not correspond with their relative cysteine
concentration. As was the case for the cysteine modified hyaluronan and
chondroitin sulfate an identical concentration and volume of Elman’s reagent
was used to dye each cysteine solution sample, 1mL of 12.6x10‐4 mol/L DNTB to
2mL of sample. Therefore if the cysteine level and its associated thiol content are
too low for the DNTB to bind and form TNB, the absorbance of DNTB at 324nm
should be equivalent for all samples of the concentration series. As a whole, the
concentration control curve was a failure due to the lack of binding of the dye to
concentrations lower than 10‐2 mol/L.

78
0
0.5
1
1.5
2
2.5
3
3.5
275 325 375 425 475 525 575
Absorbance
Wavelength (nm)
Hyaluronan‐cysteineChondroitin sulfate‐cysteine
Figure 30. UV‐Vis spectra of DNTB dyed hyaluronan‐cysteine and chondroitin sulfate‐cysteine.

79
0
0.5
1
1.5
2
2.5
3
3.5
275 325 375 425 475 525 575
Absorbance
Wavelength (nm)
10^‐2 mol/L cysteine10^‐3 mol/L cysteine10^‐4 mol/L cysteine10^‐5 mol/L cysteine10^‐6 mol/L cysteine10^‐7 mol/L cysteine
Figure 31. UV‐Vis spectra of DNTB dyed hyaluronan‐cysteine and chondroitin sulfate‐cysteine.

64B69B
70B4.4.3 Elemental Analysis of cysteine modified glycosaminoglycans The degree of modification of the hyaluronan and chondroitin sulfate
derivatives were measured via atomic absorption. Atlantic Microlabs, (Norcross,
Ga), utilized combustion testing to determine the percent carbon, hydrogen,
nitrogen, and sulfur of hyaluronic acid and the other modified polymers. Unlike
the hyaluronic acid, the chondroitin sulfate was sourced from an analytical lab,
and hence was not re‐characterized. The detection limits and accuracy/ precision
error limits of Atlantic Microlabs test method are ±0.3%. The theoretical analysis
disclosed below is a result of calculating the percent composition of a 20%
converted sample. This theoretical value is necessary for the labs elemental
analysis protocol. Historically, this theoretical value differs greatly from the
measured value, and that the practice of presuming a 20% conversion during
synthesis has changed. Further more the theoretical numbers were dependent
upon a uniform disaccharide repeat unit; that is 50% uronic acid 50%
glucosamine or galactosamine within the polymer; permitting an acid available
for carbodiimide reaction within every repeat unit. No synthesis errors were
accounted for and the theoretical weight percent values listed in Table 6 are
based on one modifying element per polymer repeat unit.
The first observation is the presence of sulfur in both the cysteine
modified GAG polymers. In the case of hyaluronic acid, this would

81 unequivocally confirm that modification occurred, as any excess amino acid
compounds left in solution following synthesis would have passed through the
dialysis tubing. The analysis of the chondroitin sulfate – cysteine material is
difficult due to the lack of a control sample. However; the measured levels of
nitrogen and sulfur within the modified material are of interest, measuring
approximately 2.5 times greater than theorized. Likewise the measured
composition of sulfur within the cysteine modified hyaluronic acid is two fold
greater than anticipated.
Table 6. Elemental analysis results for thiol modified GAG polymers.
Theor. Meas. Theor. Theor. Meas. Theor. Meas.C14H21O14NS
C 44.33 39.31 36.6 44.17 41.67 36.78 38.1H 5.58 6.22 4.61 5.60 6.25 4.66 6.02N 3.69 9.42 3.05 4.08 9.22 3.41 8.45S - - 6.98 1.29 2.22 7.81 7.55
C18H28O15N2S2C14H21O11N C18H28O12N2S
Hyaluronan-Cysteine Chondroitin Sulfate-CysteineHyaluronan Chondroitin
Sulfate
However, the theoretical and the measured sulfur content for the
modified chondroitin sulfate sample was nearly identical. The 20% conversion
hypothesis is off the mark in all instances except the sulfur content of cysteine
modified chondroitin sulfate. This could be the result of a greater ratio of
glactosamine to glucuronic acid within the copolymer limiting reaction sites for

82 amid formation. This scenario would reduce the overall sulfur content of the
modified polymer closer to that of the unmodified product, but that reduction
would be seen throughout the data.
4.4.4 Conclusions of cysteine modified glycosaminoglycans The overall intensity of the modified GAG polymer spectra are weak in
comparison to the intensity of the unmodified GAG and amino acid spectra
respectively. Judging peak position and band absorptions on such low intensity
data yields a general lack of confidence in the results if used independent of
other characterization techniques to confirm the reaction. The FTIR results for the
cysteine modified chondroitin sulfate polymer and the elemental analysis data
are inconclusive. Only the thiol dye results as shown through UV/Vis are able to
confirm the presence of sulfur that is not related to the polymers sulfate group.
Cysteine modified chondroitin sulfate was formed. The case for cysteine
modified hyaluronic acid is a much easier one. The FTIR data, elemental analysis,
and thiol dye testing indicate that modification did indeed occur. As hyaluronic
acid has no sulfur within its polymer all thiol found via elemental analysis and
UV/Vis is the result of covalent bonding cysteine to the polymer. These
techniques give support to FTIR results, which show amide absorption bands
unique to the modified polymer but are of a low degree of confidence due to

83 spectrum intensity. It is concluded the cysteine modification of hyaluronan and
chondroitin sulfate was successful.
4.5 Non thiol modification of glycosaminoglycans The covalent binding of thiol molecules to chitosan, alginate, hyaluronic
acid, and chondroitin sulfate utilizing the carbodiimide reaction has been well
demonstrated. The use of glycine and glucosamine as non thiol thiol alternatives
to glycosaminoglycans modification became of interest. Focusing only on
hyaluronic acid, these small molecules were chosen to simply demonstrate the
robustness of the reaction and to open the rheological options for hyaluronic
modification.
4.5.1 FTIR analysis of non thiol modified of glycosaminoglycans
Hyaluronan and glycine Amide formation. The amide I band at 1640cm‐1 is present in the hyaluronan and
hyaluronan‐glycine spectra, but not the spectrum of the amino acid. Based on the
assignments by Haxaire et al. of the amide I this amide is native to the
unmodified polymer. A second and distinct amide I band at 1700cm‐1 is only
present in the hyaluronan‐glycine spectrum. The secondary amide II band at
1555cm‐1 is noted in the modified polymer spectrum. While not at the exact
frequency, a prominent shoulder at 1565cm‐1 is observed in the unmodified
hyaluronan spectrum which can be assigned to be the amide II band. In the case

84 of glycine modified hyaluronic acid, only the amide I band at 1700cm‐1 is unique
to the modified polymer and indicates that modification occurred.
5001000150020002500300035004000Wavenumber (cm‐1)
Absorba
nce
A
B
C
Figure 32. FTIR spectra for a) hyaluronan, b) glycine methyl ester, c) hyaluronan‐glycine
Primary amine loss. The N‐H stretch of the primary amine is observed at 3400cm‐1
in the glycine methyl ester and weakly appears within in the hyaluronan‐glycine
spectrum. There is a distinct peak at 1627cm‐1 within the glycine methyl ester
spectrum that is assigned to the N‐H bend referenced between 1650cm‐1 and
1580cm‐1. The absence of the 1627cm‐1 peak from the amino acid to the modified
polymer spectrum points toward amide formation. Lastly there is a strong C‐N

85 stretch at 1250cm‐1 in the glycine spectrum that is not observed in the
hyaluronan‐glycine reaction spectrum.
600700800900100011001200130014001500160017001800
Wavenumber (cm‐1)
Absorba
nce
A
B
C
Figure 33. FTIR spectra of fingerprint region for a) hyaluronan, b) glycine
methyl ester, c) hyaluronan‐glycine.
Methyl gain. The extension stretch of C‐H at 2962cm‐1 and the opposing
contraction at 2872cm‐1 are distinct in the amino acid spectrum but are not fully
apparent in the hyaluronan spectrum and even less so in the modified
hyaluronan spectrum. References cite these stretches to be two independent
peaks, while the results of this study merely show a broad low intensity peak
within that frequency range for the modified polymer [71]. Furthermore the
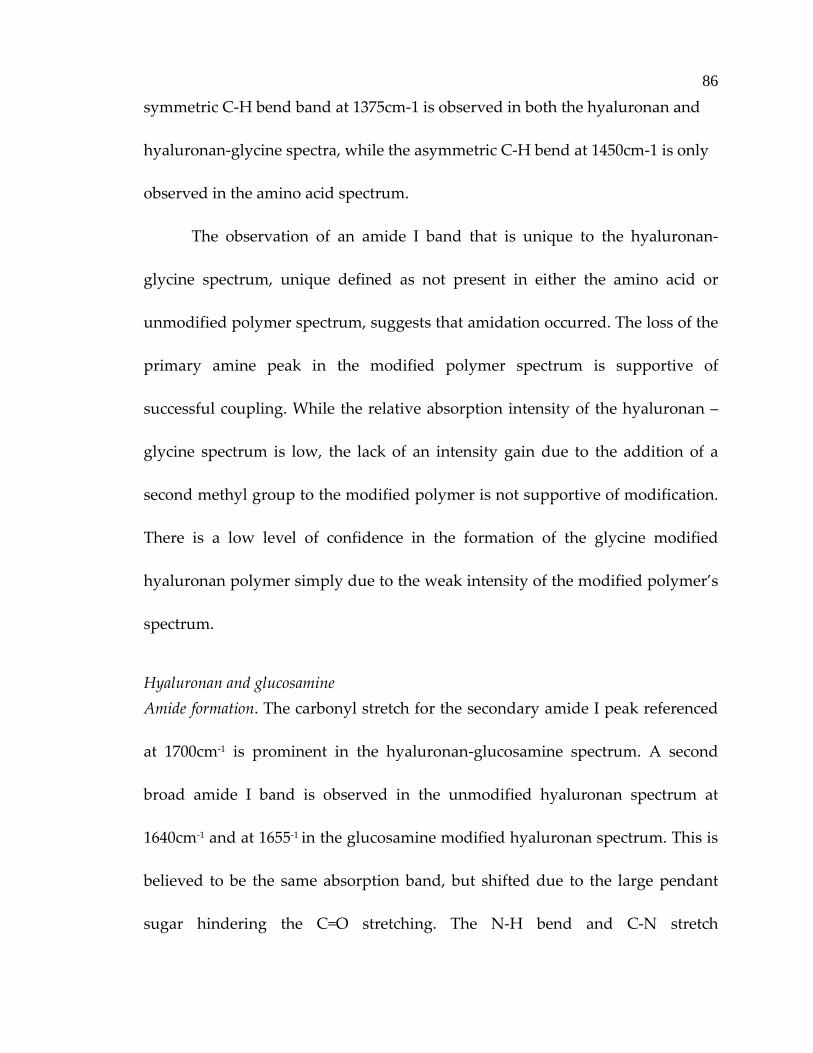
86 symmetric C‐H bend band at 1375cm‐1 is observed in both the hyaluronan and
hyaluronan‐glycine spectra, while the asymmetric C‐H bend at 1450cm‐1 is only
observed in the amino acid spectrum.
The observation of an amide I band that is unique to the hyaluronan‐
glycine spectrum, unique defined as not present in either the amino acid or
unmodified polymer spectrum, suggests that amidation occurred. The loss of the
primary amine peak in the modified polymer spectrum is supportive of
successful coupling. While the relative absorption intensity of the hyaluronan –
glycine spectrum is low, the lack of an intensity gain due to the addition of a
second methyl group to the modified polymer is not supportive of modification.
There is a low level of confidence in the formation of the glycine modified
hyaluronan polymer simply due to the weak intensity of the modified polymer’s
spectrum.
Hyaluronan and glucosamine Amide formation. The carbonyl stretch for the secondary amide I peak referenced
at 1700cm‐1 is prominent in the hyaluronan‐glucosamine spectrum. A second
broad amide I band is observed in the unmodified hyaluronan spectrum at
1640cm‐1 and at 1655‐1 in the glucosamine modified hyaluronan spectrum. This is
believed to be the same absorption band, but shifted due to the large pendant
sugar hindering the C=O stretching. The N‐H bend and C‐N stretch

87 representative of the secondary amide II peak is noted at 1535cm‐1 in the
hyaluronan‐glucosamine and is also oddly prominent in the glucosamine
spectrum. The amide II absorption for hyaluronan is assigned at a higher
frequency of 1565cm‐1 and is observed in the spectrum at this wavelength [71].
Again only the amide I band at 1700cm‐1 is unique to the modified polymer
spectrum to indicate amide coupling between glucosamine and hyaluronic acid
occurred.
Primary amine loss. The primary amine peak representing the N‐H bend observed
between 1650cm‐1 and 1580cm‐1, is noted specifically at 1612cm‐1 within the
glucosamine spectrum but not the reaction product. A weak shoulder at 1140cm‐1
is noted within the C‐N stretch region of the hyaluronan polymer and as a more
distinct peak in the modified polymer’s spectrum indicative of the formation of
two secondary amine groups within the product. The C‐N stretch is noted at this
frequency for both primary and secondary amine groups.
Methyl bands. The C–H symmetric bend at 1375cm‐1 observed in both the polymer
and the hyaluronan glucosamine reaction product. The C‐H extension and
contraction are very weak in both the modified and unmodified spectra. The
asymmetric band was not detected.

88
5001000150020002500300035004000
Wavenumber (cm‐1)
Absorbanc
e
A
B
C
Figure 34. FTIR spectra of a) hyaluronan, b) glucosamine HCl c) hyaluronan‐
glucosamine.
The presence of amide I and II bands, loss of primary amine and the
possible assignment of secondary amine bands indicate the formation of an
amide bond between glucosamine and hyaluronic acid. The amide II band noted
in glucosamine is possibly the primary amine with a frequency shift as the
absorption range for the functional groups are close. The methyl esters of amino
acids were used in the GAG modification synthesis to control the interactions of
the acid and amine during the carbodiimide reaction. This is not a concern of
glucosamine and hyaluronan synthesis and no methyl gain is expected within
the modified polymer as none are available.

89
600700800900100011001200130014001500160017001800
Wavenumber (cm‐1)
Absorba
nce
A
B
C
Figure 35. FTIR spectra of fingerprint region for a) hyaluronan, b) glucosamine
HCl c) hyaluronan‐glucosamine.
4.5.2 Elemental analysis of non thiolated modified glycosaminoglycans
The percent composition of nitrogen is nearly identical for all the samples
submitted, including the unmodified hyaluronan, and this is of interest. The
amide bonding of the modified hyaluronan polymers would results in a
compound which contains two nitrogen molecules, thus the percent nitrogen of
the modified polymers should be greater than that of hyaluronan alone.
Elemental analysis is intended to provide confirmation of composition. The
presence of thiol confirmed the cysteine modified GAG polymers, specifically
hyaluronan which is the not sulfated GAG polymer. In the case of glucosamine

90 and glycine modification, only substantial changes in elemental percentages
indicate modification as the elemental components of the polymer and the
modifiers are identical. No such divergence in elemental composition is noted
and therefore elemental analysis in unable to confirm glucosamine and glycine
coupling to hyaluronic acid.
Table 7. Elemental weight percent of non thiol modified GAG polymers.
Theor. Meas. Theor. Meas. Theor. Meas.
C 44.33 39.31 44.35 41.97 44.53 42.07H 5.58 6.22 5.66 6.47 5.63 6.30N 3.69 9.42 3.99 9.24 4.20 9.86
Hyaluronan
C14H21O11N C20H32O15N2 C17H26O12N2
Hyaluronan-Glucosamine Hyaluronan-Glycine
68B4.5.3 Summary of non thiolated modified glycosaminoglycans Again, the overall intensity of the modified GAG polymer spectra are
weak compared to those of the unmodified GAG and amino acid. The case for
glycine and glucosamine modification of hyaluronic acid is not strong. The
elemental analysis data for the non thiol modifiers is weak and inconclusive. The
FTIR spectrum for glucosamine shows a prominent peak at 1700cm‐1 that is
amide in origin and unique to the modified polymer. This is the lone data point
to confirm modification. The glycine modified hyaluronan has no such
conclusive data. There is a low level of confidence in the modification of

91 glucosamine and glycine to hyaluronan, however it is believed that glucosamine
modified hyaluronan was formed, but glycine modified hyaluronan was not.
74B4.6 Rheometry: Hyaluronan and Glycerol Phosphate Solutions of hyaluronan glycerol phosphate were synthesized twice to
generate the rheometry data analyzed here in. The rheometry profiles are
compared to the published data of the chitosan derived solution. Each series was
tested only once and hence offers a hint of the rheological properties of the
materials but lacks the statistical confidence to fully characterize it.
75B4.6.1 Varying temperature, varying pH. Rheometry curves were plotted comparing the hyaluronan and glycerol
phosphate solutions above and below both physiological pH and temperature. It
is first noted that the curves are grouped by pH with the basic solutions being
the most viscous, and the acidic being the least. Unless samples fail prematurely,
all three pH HA‐GP solutions and temperature conditions share a near common
viscosity fail point. The basic solutions were all pseudoplastic in nature, as were
the neutral pH solutions tested at 25°C and the acidic solution tested at 37°C.
However the remaining curves, neutral pH tested at 37°C and the acidic
solutions run at 25°C and 45°C, appear to be Newtonian in performance. It is
feasible that these curves merely failed in error prior to structure break down
and prior to fully forming the characteristic pseudoplastic curve, as the curves in

92 question do arc. Premature failure could results from spin out of the material
during shear, leaving an insufficient volume of sample left for measurement at
the high shear rates.
0.01
0.1
1
10
100
1000
0.01 0.1 1 10 100 1000 10000
(s‐1)
η (poise)
37°C40°C45°C25°C37°C25°C37°C45°C
γ& Figure 36. Rheometry profile of hyaluronan glycerol phosphate solution
varying temperature conditions of test and pH of solution. Blue – pH 4.5, black – pH 7, red – pH 8.
In the Chenite et al. Biomaterials [41] paper, the chitosan glycerol
phosphate solutions demonstrated a dramatic rise in elastic shear modulus,
which in turn corresponds to viscosity, when the temperature of the solution
moved from 25°C to 37°C for the neutral pH solution and from 25°C to 45°C for
the slightly acidic solution. Looking at the HA‐GP results, two questions arise;

93 does the viscosity of the hyaluronan derivative increase with temperature, and is
that viscosity change effected by pH. The answer is yes to both questions, but not
in the same manner at which Chenite et al. observed. As noted in XFigure 37X, there
is a rise in viscosity of the neutral pH solution from 37°C to 45°C; but only after
the viscosity reduced moving from 25°C to 37°C. Furthermore, the viscosity
change is effected by pH, but unlike the data reported by Chenite et al. the
viscosity does not lag behind at slightly acidic pH, only to rise at higher
temperatures. In the case of HA‐GP, as noted in XFigure 37X, the acidic solutions
reduce their viscosity as the test temperature rises. This is a small reduction of
viscosity when compared to the entire field, and as a general trend, one in line
with the chitosan glycerol phosphate data, the higher pH solutions of HA‐GP do
have a higher viscosity.
76B4.7 Rheometry: Hyaluronic Acid and Tripolyphosphate The rheometry profiles of the varying temperature and pH solutions of
the hyaluronic acid and tripolyphosphate complex are compared to similar tests
run on hyaluronic acid and glycerol phosphate and the published results of
chitosan and glycerol phosphate. After an abbreviated literature review was
conducted it was concluded that the use of tripolyphosphate was not an
equivalent substitute for glycerol phosphate and that likely a different complex
was created with unique rheology from that anticipated at onset.

94 Two solutions of hyaluronan tripolyphosphate (HA‐TPP) were
synthesized to generate the rheometry data analyzed herein. Using these
samples, three series of tests were conducted on the hyaluronan
tripolyphosphate solution, which probed the performance at and around
physiological conditions, of neutral pH and 37°C. Each series was tested only
once and hence offers a hint the rheological properties of the materials but lacks
the statistical confidence to fully characterize the material. The first series
investigated neutral pH solutions above, at, and below physiological
temperature. The second test was based around body temperature looking at the
rheometry profiles of acidic, neutral, and basic pH solutions. Lastly the rheology
of the basic HA‐TPP solution was tested through a temperature range beginning
at 35°C and concluding at 60°C.
4.7.1 Neutral pH; varying temperature
The HA‐TPP solution tested at all three temperature conditions proved to
be pseudoplastic in nature and presented identical profiles, which are only offset
by their initial viscosity at the starting shear rate (0.1 s‐1). The temperature at
which the solutions are tested corresponds to viscosity of the solution with the
45°C test having the lowest viscosity. The solution tested at 25°C demonstrated
the highest viscosity while failing at the lowest shear rate. In general the

95 viscosity profiles of the neutral pH solutions at 25°C, 37°C, and 45°C are nearly
identical.
0.01
0.1
1
10
100
1000
0.1 1 10 100 1000 10000
(s‐1)
η (poise)
25°C
37°C
45°C
γ&
Figure 37. Hyaluronan‐tripolyphosphate solutions of neutral pH tested at 25°C, 37°C, and 45°C.
77B4.7.2 Physiologic temperature; varying pH All three pH conditions resulted in pseudoplastic behavior of HA‐TPP
material tested at 37°C. The basic solution is an order of magnitude more viscous
than the acidic and neutral solutions. The basic solution also fails at a lower
strain rate than both the neutral and acidic solutions. The acidic solution does
exhibit a steep drop in viscosity at lower shear rates, but then quickly subsides

96 showing near identical rheometry profile as the neutral solution. Both materials
demonstrate small declines in viscosity in response to large changes in shear rate.
The viscosity changes to the neutral and acidic HA‐TPP solutions are nil, while
the basic solution demonstrates a drastically different viscosity response at 37°C.
0.01
0.1
1
10
100
1000
0.01 0.1 1 10 100 1000 10000
(s‐1)
η (poise)
pH 4.5
pH 7
pH 8
γ& Figure 38. Hyaluronan‐tripolyphosphate 37°C heated solution at acidic,
neutral, and basic pH.
4.7.3 Basic pH, varying temperature To further understand the viscosity response to basified HA‐TPP, the
material was tested at a range of temperatures. The pseudoplastic nature of the
HA‐TPP material was indifferent to the temperature at which it was tested. The

97 solutions tested at 35° C and 37°C are distinctly segregated from the higher
temperature tests, demonstrating higher viscosity at the lower strain rates by an
order of magnitude. The rheometry profiles of the three lower temperature
curves did converge to a common failure shear rate as the higher temperature
tests.
0.01
0.1
1
10
100
1000
0.01 0.1 1 10 100 1000 10000
(s‐1)
η (poise)
35
37
45
50
60
γ&
Figure 39. Hyaluronan‐tripolyphosphate solutions of basic pH tested at 35°C through 60°C.

98 4.7.4 Discussion of ionic phosphate modification of hyaluronan
While glycerol phosphate and tripolyphosphate are used with chitosan in
different applications, it is of interest, as it was the original intent of this study, to
determine the correlation that the hyaluronan tripolyphosphate derivative has
with hyaluronan glycerol phosphate and the results described by Chenite et al.
The most obvious trend from the perspective of the HA‐GP material was that
acidic solutions were of lower viscosity. This trend was inverted for the HA‐TPP
materials, which demonstrated higher viscosities in basic solutions while the
relative viscosity difference between acidic and neutral solutions was negligible.
With regards to temperature, the neutral pH HA‐TPP material showed a
minimal change in viscosity when tested at 25°C, 37°C, and 45°C. The chitosan‐
GP and the HA‐GP materials both showed significant viscosity responses to
temperature and neutral pH. Both the glycerol phosphate and the
tripolyphosphate derivatives of hyaluronic acid demonstrated remarkable
viscosity performance when formulated to basic solutions. The viscosity of the
HA‐GP was in general, greater than neutral and acidic solutions when tested
across all temperatures. The HA‐TPP material of the same pH was viscous only
at or around body temperature, with viscosity dropping off as temperature
increased to 60°C.

99 The pH effect on viscosity relates to the manner at which both the glycerol
phosphate and the tripolyphosphate materials are able to interact with the
polymer, whether that is hyaluronan or chitosan. The ionic crosslinking of
phosphate to these polymers requires anions to be contributed from the
phosphate moiety. The more anions available, the higher the crosslink density
will be [77, 78]. When the pH of the solution changes the number of anions
available is in flux, in acidic conditions there are few anions available, in basic
there are more. As glycerol phosphate contains two anions per molecule and
tripolyphosphate five, there are fewer anions for the glycerol phosphate to lose
and still couple to the polymer. In the example given by Chenite et al. the slightly
acidic solution did not gel at the same temperature as the neutral solution due to
lower anion count. The gel was able to form at a higher temperature presumably
due to kinetics.
Hyaluronan has a unique rheology in water, which is influenced by pH
[79, 80]. Hyaluronic acid is more inclined to uptake and absorb water when that
water is basic. The higher pH causes a negative charge repulsion within the
polymer forcing the extension of the polymeric chains and drawing in more
water into the polymer network [80]. Structurally, Gatej et al. found that little
changes in hyaluronan across most of the pH spectrum and that only at the
extreme basic and acidic realms do these changes have a phase change impact on

100 the rheological performance. Specifically, below pH 2.8 hyaluronan forms a gel
within its hydrogen bonded network caused by the reduction of net charges at
this low pH either brought on by COOH dissociation or the protonation of the
acetamido groups (hyaluronan’s pendant amide acetyl functionality). Above pH
12, hyaluronan has a low viscosity, less than 10 poise and has demonstrated a
reduced radius of gyration at this pH [79]. It is hypothesized that the viscosity
drop is due to the dissociation of hydroxyl and acetamido groups which
contribute to the stiffness of the polymer [79].

101
79BChapter 5. Conclusions and Future Work
The intent of this study was to modify bio‐based polymers utilizing both
covalent and ionic methods of modification. The carbodiimide reaction coupling
small molecules and peptide chains to chitosan and alginate was successfully
accomplished and confirmed via FTIR. The same mechanism which was used to
couple amino acids to hyaluronic acid and chondroitin sulfate saw moderate
success. In general the FTIR results for the glycosaminoglycan modifications
were either inconclusive or of a confidence level too low to confirm the success of
the coupling as a stand alone test. Only when the thiol moiety of the cysteine
amino acid was detected in the elemental analysis or in the thiol dye results
could the FTIR results be supported and the coupling of cysteine to the GAG
polymers be confirmed. The selection of analytical techniques used to
characterize the materials was not conducive for analyzing products which are
composed of the same elements as both reactants. The analytical support
demonstrating the coupling of glucosamine and hyaluronan is low but it is
believed the modification occurred. The glycine modification of hyaluronic acid
was unable to be confirmed.
Further investigation would involve the use of 13C and DEPT NMR,
nuclear magnetic resonance, to confirm the presence and location of the amino
acids on the GAG polymers. Repetition of these reactions and characterizations

102 to provide statistical confidence would be prudent. Additionally, research of
properties unique and relevant to both chondroitin sulfate and hyaluronic acid
would help determine the performance attributes of modification as they would
apply to end users. Specifically, the rheology and polymer swelling or hydration
of the modified polymers as related to lubrication and wound healing
applications would be of interest.
The rheological effect of modifying hyaluronic acid with phosphate
materials showed promise. While not the striking gelation described for the
chitosan variant, there was a definite viscosity response to pH and temperature
for both the tripolyphosphate and the glycerol phosphate derivatives. Further
work should focus upon confirming the robustness of both systems, as well as
characterizing the physical structures which are formed.

103
80BBibliography 1. Stenesh, J., Dictionary of Biochemistry and Molecular Biology 1989, John Wiley & Sons: New York.
2. Lindhorst, T., Essentials of Carbohydrate Chemistry and Biochemistry 2nd ed. 2003, Kiel Germany: Wiley –VCH.
3. Roughley, P.J. and E.R. Lee, Cartilage Proteoglycans: Structure and Potential Functions. Microscopy Research and Technique, 1994. 28: p. 385.
4. King, M.W. The Medical Biochemsitry Page. Glycosaminoglycans and Proteoglycans 2008 October 12, 2008 [cited 2007, 2008.
5. Kjellen, L. and U. Lindahl, Proteoglycans: Structures and Interactions. Annual Reviews in Biochemistry, 1991. 60.
6. Iozzo, R.V., Matrix Proteoglycans: From Molecular Design to Cellular Function. Annual Reviews in Biochemistry, 1998. 67.
7. Imberty, A., H. Lortat‐Jacobb, and S. Perez, Structural view of glycosaminoglycan–protein interactions. Carbohydrate Research, 2007(342).
8. Laurent, T.C. and R.E. Fraser, Hyaluronan. The FASEB Journal, 1992. 6.
9. Stern, R., Hyaluronan catabolism: a new metabolic pathway. European Journal of Cell Biology, 2004. 83(7): p. 317‐325.
10. Hileman, R.E., et al., Glycosaminoglycan‐protein interactions: definition of consensus sites in glycosaminoglycan binding proteins. BioEssays, 1998. 20.
11. Sterna, R., A.A. Asarib, and K.N. Sugahara, Hyaluronan fragments: An information‐rich system. European Journal of Cell Biology, 2006. 85.
12. Khor, E., Chitin: Fullfilling a Biomaterials Promise. 2001, New York: Elsevier.
13. Kjartansson, G.T., et al., Sonication‐Assisted Extraction of Chitin from North Atlantic Shrimps (Pandalus borealis). J. Agric. Food Chem., 2006. 54(16): p. 5894‐5902.

104 14. Schiffman, J.D. and C.L. Schauer, Solid state characterization of [alpha]‐chitin
from Vanessa cardui Linnaeus wings. Materials Science and Engineering: C. In Press, Accepted Manuscript.
15. Shalaby, S.W., J.A. Dubose, and M. Shalaby, Chitosan Based Systems, in Absorbable and Biodegradable Polymers, S.W.S.a.K.J.L. Burg, Editor. 2004, CRC Press: New York. p. 77.
16. Hirai, A., H. Odani, and A. Nakajima, Determination of degree of deacetylation of chitosan by 1H NMR spectroscopy. Polymer Bulletin, 1991. 26.
17. Haug, A., B. Larsen, and O. Smidsrød, Uronic acid sequence in alginate from different sources. Carbohydrate Research, 1974. 32(2): p. 217‐225.
18. Dumitriu, S., Polysaccharides: structural diversity and functional versatility. 2005, New York: CRC Press.
19. George, M. and T.E. Abraham, Polyionic hydrocolloids for the intestinal delivery of protein drugs: Alginate and chitosan ‐‐ a review. Journal of Controlled Release, 2006. 114(1): p. 1‐14.
20. Smidsrød, O. and G. Skjak‐Brk, Alginate as immobilization matrix for cells. Trends in Biotechnology, 1990. 8: p. 71‐78.
21. Bouhadir, K.H., et al., Sustained and controlled release of daunomycin from cross‐linked poly(aldehyde guluronate) hydrogels. Journal of Pharmaceutical Sciences, 2000. 89(7): p. 910‐919.
22. Augst, A.D., H.J. Kong, and D.J. Mooney, Alginate Hydrogels as Biomaterials. Macromolecular Bioscience, 2006. 6(8): p. 623‐633.
23. Apoya, M., H. Ogawa, and N. Nanba, Alginate content of farmed Undaria pinnatifida (Harvey) Suringar from the three bays of Iwate, Japan during harvest period. Botanica Marina, 2002. 45(5): p. 445‐452.
24. Cathell, M.D. and C.L. Schauer, Structurally Colored Thin Films of Ca2+‐Cross‐Linked Alginate. Biomacromolecules, 2007. 8(1): p. 33‐41.
25. Lamelas, C., et al., Quantifying Pb and Cd Complexation by Alginates and the Role of Metal Binding on Macromolecular Aggregation. Biomacromolecules, 2005. 6(5): p. 2756‐2764.

105 26. Gombotz, W.R. and S. Wee, Protein release from alginate matrices. Advanced
Drug Delivery Reviews, 1998. 31(3): p. 267‐285.
27. Lee, J.M., et al., Crosslin king of tissue‐derived biomaterials in I ‐ethyl‐3‐(3=dimethylaminopropyl)‐carbodiimide (EDC). Journal of Materials Science: Materials in Medicine, 1996. 7.
28. Nakajima, N. and Y. Ikada, Mechanism of Amide Formation by Carbodiimide for Bioconjugation in Aqueous Media. Bioconjugate Chem., 1995. 6.
29. Danishefsky, I. and E. Siskovic, Conversion of Carboxyl Groups of Mucopolysaccharides into Amides of Amino Acid Esters. Carbohydrate Research, 1971. 16.
30. Crescenzi, V., et al., Synthesis and Partial Characterization of Hydrogels Obtained via Glutaraldehyde Crosslinking of Acetylated Chitosan and of Hyaluronan Derivatives. Biomacromolecules, 2003. 4.
31. Wang, C., et al., Enhanced Resistance of Polyelectrolyte Multilayer Microcapsules to Pepsin Erosion and Release Properties of Encapsulated Indomethacin. Biomacromolecules, 2007. 8(5): p. 1739‐1744.
32. Kirkera, K.R., et al., Glycosaminoglycan hydrogel films as bio‐interactive dressings for wound healing. Biomaterials, 2002. 23.
33. Serban, M.A., G. Yang, and G.D. Prestwich, Synthesis, characterization and chondroprotective properties of a hyaluronan thioethyl ether derivative. Biomaterials, 2008. 29(10): p. 1388‐1399.
34. Cai, S., et al., Injectable glycosaminoglycan hydrogels for controlled release of human basic fibroblast growth factor. Biomaterials, 2005. 26(30): p. 6054‐6067.
35. Shu, X.Z., et al., Disulfide Cross‐Linked Hyaluronan Hydrogels. Biomacromolecules, 2002. 3(6): p. 1304‐1311.
36. Varma, A.J., S.V. Deshpande, and J.F. Kennedy, Metal complexation by chitosan and its derivatives: a review. Carbohydrate Polymers, 2004. 55(1): p. 77‐93.
37. Muzzarelli, R.A.A. and R. Rocchetti, The use of chitosan columns for the removal of mercury from waters. Journal of Chromatography A, 1974. 96(1): p. 115‐121.

106 38. Elson, C.M., D.H. Davies, and E.R. Hayes, Removal of arsenic from
contaminated drinking water by a chitosan/chitin mixture. Water Research, 1980. 14(9): p. 1307‐1311.
39. Inoue, K., Y. Baba, and K. Yoshizuka, Adsorption of metal ions on chitosan and crosslinked copper(II)‐complexes chitosan. Bulletin of the Chemical Society of Japan, 1993. 66.
40. Lee, S.‐T., et al., Equilibrium and kinetic studies of copper(II) ion uptake by chitosan‐tripolyphosphate chelating resin. Polymer, 2001. 42(5): p. 1879‐1892.
41. Chenite, A., et al., Novel injectable neutral solutions of chitosan form biodegradable gels in situ. Biomaterials, 2000. 21(21): p. 2155‐2161.
42. Chenite, A., et al., Rheological characterisation of thermogelling chitosan/glycerol‐phosphate solutions. Carbohydrate Polymers, 2001. 46(1): p. 39‐47.
43. Filion, D., M. Lavertu, and M.D. Buschmann, Ionization and Solubility of Chitosan Solutions Related to Thermosensitive Chitosan/Glycerol‐Phosphate Systems. Biomacromolecules, 2007. 8(10): p. 3224‐3234.
44. Lavertu, M., D. Filion, and M.D. Buschmann, Heat‐Induced Transfer of Protons from Chitosan to Glycerol Phosphate Produces Chitosan Precipitation and Gelation. Biomacromolecules, 2008. 9(2): p. 640‐650.
45. Kawashima, Y., et al., The Effects of Thickness and Hardness of the Coating Film on the Drug Release Rate of Theophylline Granules Coated with Chitosan‐Sodium Tripolyphosphate Complex. Chemical & pharmaceutical bulletin 1985. 33(6).
46. Ma, Z., H.H. Yeoh, and L.‐Y. Lim, Formulation pH modulates the interaction of insulin with chitosan nanoparticles. Journal of Pharmaceutical Sciences, 2002. 91(6): p. 1396‐1404.
47. Mi, F.‐L., et al., Kinetic study of chitosan‐tripolyphosphate complex reaction and acid‐resistive properties of the chitosan‐tripolyphosphate gel beads prepared by in‐liquid curing method. Journal of Polymer Science Part B: Polymer Physics, 1999. 37(14): p. 1551‐1564.

107 48. Vodná, L., S. Bubeníková, and D. Bakos, Chitosan Based Hydrogel
Microspheres as Drug Carriers. Macromolecular Bioscience, 2007. 7(5): p. 629‐634.
49. Cathell, M.D., et al., Structurally Colored Thiol Chitosan Thin Films as a Platform for Aqueous Heavy Metal Ion Detection. Biomacromolecules, 2008. 9(1): p. 289‐295.
50. Bernkop‐Schnürch, A., M. Hornof, and D. Guggi, Thiolated chitosans. European Journal of Pharmaceutics and Biopharmaceutics, 2004. 57(1): p. 9‐17.
51. Bernkop‐Schnürch, A., Thiomers: A new generation of mucoadhesive polymers. Advanced Drug Delivery Reviews, 2005. 57(11): p. 1569‐1582.
52. Dhoot, N.O., et al., Peptide‐modified alginate surfaces as a growth permissive substrate for neurite outgrowth. Journal of Biomedical Materials Research Part A, 2004. 71A(2): p. 191‐200.
53. Rowley, J.A. and D.J. Mooney, Alginate type and RGD density control myoblast phenotype. Journal of Biomedical Materials Research, 2002. 60(2): p. 217‐223.
54. Genes, N.G., et al., Effect of substrate mechanics on chondrocyte adhesion to modified alginate surfaces. Archives of Biochemistry and Biophysics, 2004. 422(2): p. 161‐167.
55. Lee, C.H., et al., Microencapsulation of Parathyroid Tissue with Photosensitive Poly(L‐lysine) and Short Chain Alginate‐co‐MPEG. Artificial Organs, 2004. 28(6): p. 537‐542.
56. Bernkop‐Schnurch, A., C.E. Kast, and M.F. Richter, Improvement in the mucoadhesive properties of alginate by the covalent attachment of cysteine. Journal of Controlled Release, 2001. 71(3): p. 277‐285.
57. Suzuki, Y.T., M.; Suzuki, K.; Saitou, A.; Sufan, W. and Nishimura, Y. , Journal of Biomedical Materials Research, 2000. 50.
58. Hosoya, K., et al., A novel covalently crosslinked gel of alginate and silane with the ability to form bone‐like apatite. Journal of Biomedical Materials Research Part A, 2004. 71A(4): p. 596‐601.

108 59. Yoshioka, T., et al., Preparation of alginic acid layers on stainless‐steel
substrates for biomedical applications. Biomaterials, 2003. 24(17): p. 2889‐2894.
60. Kast, C.E. and A. Bernkop‐Schnürch, Thiolated polymers ‐‐ thiomers: development and in vitro evaluation of chitosan‐thioglycolic acid conjugates. Biomaterials, 2001. 22(17): p. 2345‐2352.
61. Schauer, C.L., et al., Colored Thin Films for Specific Metal Ion Detection. Environmental Science and Technology 2004. 38: p. 4409‐4413.
62. Muzzarelli, R.A.A., et al., Preparation and characteristic properties of dithiocarbamate chitosan, a chelating polymer. Carbohydrate Research, 1982. 104(2): p. 235‐243.
63. Lasko, C.L., B.M. Pesic, and D.J. Oliver, Enhancement of the metal‐binding properties of chitosan through synthetic addition of sulfur‐ and nitrogen‐containing compounds. Journal of Applied Polymer Science, 1993. 48(9): p. 1565‐1570.
64. Ellman, G.L., A colorimetric method for determining low concentrations of mercaptans. Archives of Biochemistry and Biophysics, 1958. 74.
65. Guingamp, M.‐F., G. Humbert, and G. Linden, Determination of Sulfhydryl Groups in Milk Using Ellmanʹs Procedure and Clarifying Reagent(R). J. Dairy Sci., 1993. 76(8): p. 2152‐2155.
66. Eyer, P., et al., Molar absorption coefficients for the reduced Ellman reagent: reassessment. Analytical Biochemistry, 2003. 312(2): p. 224‐227.
67. Chen, D., et al., Diffusivity of Cu2+ in calcium alginate gel beads. Biotechnology and Bioengineering, 1993. 41(7): p. 755‐760.
68. Jang, L.K., D. Nguyen, and G.G. Geesey, Selectivity of alginate gel for Cu over Zn when acidic conditions prevail. Water Research, 1999. 33(12): p. 2817‐2825.
69. Morier‐Teissier, E., et al., Synthesis and antitumor properties of an anthraquinone bisubstituted by the copper chelating peptide Gly‐Gly‐L‐His. J. Med. Chem., 1993. 36(15): p. 2084‐2090.
70. Tanner, R.I., Engineering Rheology. Revised ed. Oxford Engineering Science Series, ed. J.M.B. A. Acrivos, F.W. Crawford, A.L. Cullen, L.C. Woods, C.P. Wroth. 1988, Oxford: Clarendon Press.

109 71. Silverstein, R.M., G.C. Bassler, and T.C. Morrill, Spectrometric Identification
of Organic Compounds. 5th ed. 1991, New York: John Wiley & Sons.
72. Prevorsek, D.C., The Structure of N‐Mono and N‐Nʹ‐Disubstituted Amidines. The Journal of Physical Chemistry, 1962. 66(5): p. 769‐778.
73. Macovei, V. and D.W. Robinson, Infrared Study of Some Oxalamidines. Applied Spectroscopy, 1965. 19(2).
74. Cathell, M.D., Structurally Colored Biopolymer�in Films for Detection of Dissolved Metal Ions in Aqueous Solution, in Materials Science and Engineering. 2008, Drexel Univeristy: Philadelphia. p. 278.
75. Servaty, R., et al., IR and NMR Studies on the Action of Hypochlorous Acid on Chondroitin Sulfate and Taurine. Bioorganic Chemistry, 1998. 26(1): p. 33‐43.
76. Uchisawa, H., et al., Binding between calcium ions and chondroitin sulfate chains of salmon nasal cartilage glycosaminoglycan. International Congress Series, 2001. 1223: p. 205‐220.
77. Shu, X.Z. and K.J. Zhu, The influence of multivalent phosphate structure on the properties of ionically cross‐linked chitosan films for controlled drug release. European Journal of Pharmaceutics and Biopharmaceutics, 2002. 54(2): p. 235‐243.
78. Shu, X.Z. and K.J. Zhu, Controlled drug release properties of ionically cross‐linked chitosan beads: the influence of anion structure. International Journal of Pharmaceutics, 2002. 233(1‐2): p. 217‐225.
79. Gatej, I., M. Popa, and M. Rinaudo, Role of the pH on Hyaluronan Behavior in Aqueous Solution. Biomacromolecules, 2005. 6(1): p. 61‐67.
80. Barbucci, R., M. Consumi, and A. Magnani, Dependence of water uptake and morphology of hyaluronan‐ and alginate‐based hydrogels on pH and degree of crosslinking. Macromolecular Chemistry and Physics, 2002. 203(10‐11): p. 1292‐1300.
81. Haxaire, K., et al., Hydration of Polysaccharide Hyaluronan Observed by IR Spectrometry. I. Preliminary Experiments and Band Assignments. Biopolymers Biospectroscopy, 2003. 72: p. 10‐20.

110 82. S. V.Kazakov, I.Y. Galaev, and B. Mattiasson, Characterization of
Macromolecular Solutions by a Combined Static and Dynamic Light Scattering Technique. International Journal of Thermophysics, 2002. 23(1): p. 161‐173.

Appendix A: Hyaluronan source material
The quality of the food grade and cosmetic grade hyaluronic acid
polymers used for modification differ significantly. Subjectively there is a distinct
difference in the purity of the samples based upon visually observed
homogeneity, as well as analyzing the relative absorbance intensity resolution
differences of the respective FTIR spectra as displayed in XFigure 22X. For example
a broad peak centered on 1215cm‐1 in the food grade spectrum is resolved as two
distinct peaks at 1200cm‐1 and 1230cm‐1 in the cosmetic grade spectrum. The
quality of the polymer to be modified must have an effect on the success of the
intended modification; whether that is demonstrated in the performance
properties or in the conversion rate of modification. The use of the lower grade
hyaluronan in GAG modification, despite being the best material available at the
time, created a lower quality final product, one which was difficult to
characterize.

112
5001000150020002500300035004000
Wavenumber (cm‐1)
Absorbance
A
B
Figure 40. FTIR spectra comparing a) food grade hyaluronan of sodium salt to
b) cosmetic grade hyaluronic acid
600700800900100011001200130014001500160017001800
Wavenumber (cm‐1)
Absorbance
A
B
Figure 41. FTIR spectra of fingerprint region comparing a) food grade hyaluronan of sodium salt to b) cosmetic grade hyaluronic acid

113 Appendix B: Infrared peak assignment of hyaluronan
Haxaire et al. were able to successfully assign the peaks of the FTIR spectra
of hyaluronic acid while studying its structural changes, which occur during
hydration [81]. Dry hyaluronan films, approximately three microns in thickness,
were cast and placed in a controlled temperature and humidity cuvette with KBr
windows to permit access by the IR beam. By limiting the degree of hydration of
the polymer, the hydrogen bonding contamination of the spectrum is reduced,
resulting in a higher resolution spectrum. The degree to which Haxaire et al. are
able to dry and maintain this reduced hydration within the specimen container
creates a significant resolution performance gap versus materials which are
lyophilized, transferred, and tested at varying humidity conditions as was done
herein. Of particular note will be the assignment of amide I and amide II bands
within the unmodified hyaluronic acid and how these absorbencies present
within the modified spectrum. Haxaire et al. assigned the amide Ia and the amide
Ib absorption bands of hyaluronic acid to 1675cm‐1 and 1650cm‐1 respectively.
The amide II bands of were assigned to 1565cm‐1 and 1535cm‐1 [81]. In all cases
the authors rounded the absorption frequency to the nearest 5cm‐1.

Table 8. FTIR peak assignments for hyaluronan of sodium salt. ν ‐ stretch
bands, δ ‐ bending vibrations.[81] Wave Number (cm-1) Assignment Description
3540 ν O‐H Weakly hydrogen bonded O™H groups of alcohol3300 ν O‐H Alcohols (a broad band)3275 ν N‐H Hydrogen bonded N™H groups, broad band3100 ν N‐H Fermi resonance1740 ν C=O Carboxyl COOH group in hyaluronic acid1675 Amide I; ν C=O Amide C=O group accepting zero or one hydogen bonds1650 Amide I; ν C=O Amide C=O group accepting one or two hydrogen bonds1620 ν C=O Carboxyl COO‐ group accepting zero or one hydrogen bond
1600 ν C=O Carboxyl COO‐ group accepting one or two hydrogen bonds1565 Amide II; δN‐H Amide N‐H group establishing one hydrogen bond1530 Amide II; δN‐H Free amide N‐H group
1415 ν C‐O‐ Carboxyl COO‐ group accepting zero or one hydrogen bond
1390 ν C‐O‐ Carboxyl COO‐ group accepting one or two hydrogen bonds1220 ν C‐O Carboxyl COOH group in hyaluronic acid1165 ν C‐O‐C Antisymmetric glycoside1145 ν C‐O‐C Antisymmetric glycoside1090 ν C‐O‐C Ring mode1080 ν C‐OH Alcohol II and νC‐O‐C ring mode1070 νC‐OH Alcohol II1050 νC‐OH Alcohol II1030 νC‐OH Alcohol II and νC‐OH of alcohol I (C6‐O6H)1010 νC‐OH Alcohol I (C6‐O6H)

Figure 42. Peak identification of food grade hyaluronic acid. (ν‐ bond
stretching, δ‐ bond bending) [81]

Appendix C: Molecular weight of glycosaminoglycans and amino residues
The number average molecular weight (Mn ), weight average molecular
weight (Mw ), and resulting polydispersity (PDI), were measured via high
performance liquid chromatography for the chondroitin sulfate and hyaluronan
modified polymers, as well as the unmodified hyaluronan. The Mw of
unmodified hyaluronan is measured to be approximately 100,000 g/mol, theMn
is about 4,000 g/mol resulting in a polydispersity of 25; a very high value.
Table 9. Molecular weight of unmodified hyaluronan, hyaluronan and chondroitin sulfate modified polymers.
The modification of hyaluronan with glucosamine and glycine
dramatically reduced the Mw without as great of an impact on the Mn . In these
instances modification resulted in slightly more chains of significantly reduced
weight. The thiol modification of hyaluronan did not show the same trend. The
Mw of cysteine modified hyaluronan is about 2.5 times greater than the
Polymer Mn Mw PDIHyaluronan 3,849 97,716 25.39Hyaluronan-Glucosamine 5,474 12,117 2.21Hyaluronan-Glycine 3,947 18,160 4.60Hyaluronan-Cysteine 2,258 244,740 108.37Chondroitin Sulfate-Cysteine 10,653 275,290 25.84

117
unmodified polymer. It is also interesting that the Mn of cysteine modified
chondroitin sulfate is significantly higher than its hyaluronan derivative. There
are a few possible hypotheses to account for the high polydispersity, the low
Mn , and the high Mw results: errant dialysis, the ionic nature of the polymer
artificially reduces the molecular weight, or the polymer/ column interaction
results in artificially increased molecular weight. In the end it is likely that a
combination of the latter two options resulted in the obscured results.
The measured Mn data for hyaluronan – cysteine is curious, at 2,300g/mol
it is lower than the molecular weight cut off of the dialysis tubing used to remove
salts and low molecular weight residuals at the end of synthesis. This value
would imply that dialysis was not complete, or was done in error. While the Mw
of cysteine methyl ester is not in the 2,000g/mol realm, it can not be ruled out that
if hyaluronan polymers of molecular weight less than 3,500g/mol did not exit
during dialysis, residual cysteine methyl ester was also not removed, and is in
fact a separate component of the material defined as cysteine modified
hyaluronan. By eliminating the assumption that all small molecule amino acids
are absent from the modified polymer products, all characterization data is then
called into question. However there is significant confidence that the dialysis
was performed per the described protocol and that this process results in
successful removal of salts and low molecular weight materials.

118 Size exclusion chromatography operates under the premise that small
materials will take every opportunity to investigate the pores of the columns
which they pass through, resulting in a longer elution time. Materials of larger
size and bulk are not interested by the details of the column and pass through
quickly. Ionically charged materials such as hyaluronic acid will stretch out and
appear enlarged while in solution. The osmosis drives water into the polymer
due to the charge differential. The entrance of the water pushes away the counter
ions that balance the charge on the acid groups causing the negative charges to
repel and expand the chain. By modifying the GAG polymers with small
molecules, the ionic nature of the polymers are reduced since modification
occurs at the acid. This would cause the swelling and apparent size of the
polymer to also be reduced, forcing the modified GAG through the column more
quickly. Typically with the addition of a molecule onto a polymer an increase in
molecular weight would be anticipated. While in fact modification does increase
molecular weight, small molecules like amino acids would not substantially
increase the radius of gyration, the root mean squared distance from opposing
ends of the polymer. This would result in the relative size of the polymer to
remain unchanged and the ionic affects on elution time would out weight those
of the radius of gyration. Poly(acrylic acid) does not follow this theory. Across a
broad pH range the radius of gyration for poly(acrylic acid) does not change [82].

119 It is of interest that four synthesis reactions using identical protocols result
in a broad range of polydispsersity within the data set. However it should be
noted that each sample was run successfully through the GPC only once and
statistically this gives low confidence to the results. Due to the chemistry of the
column, only neutral pH materials will pass and specimens which are not neutral
will coagulate or gel the column preventing further passage. Several attempts
were made to obtain a reading prior to those contained herein. It can not be ruled
out that some fraction of the specimen coagulated in the column creating an
artificially larger sized specimen and distorting the real molecular weight of the
material. This would also contribute to the large polydispersity of the samples.