Course summary TDT4235 Tor Stålhane IDI / NTNU. What we try to do QA – Create trust to a product...
24
Course summary TDT4235 Tor Stålhane IDI / NTNU
-
Upload
cynthia-wilkins -
Category
Documents
-
view
216 -
download
0
Transcript of Course summary TDT4235 Tor Stålhane IDI / NTNU. What we try to do QA – Create trust to a product...

Course summaryTDT4235
Tor StålhaneIDI / NTNU
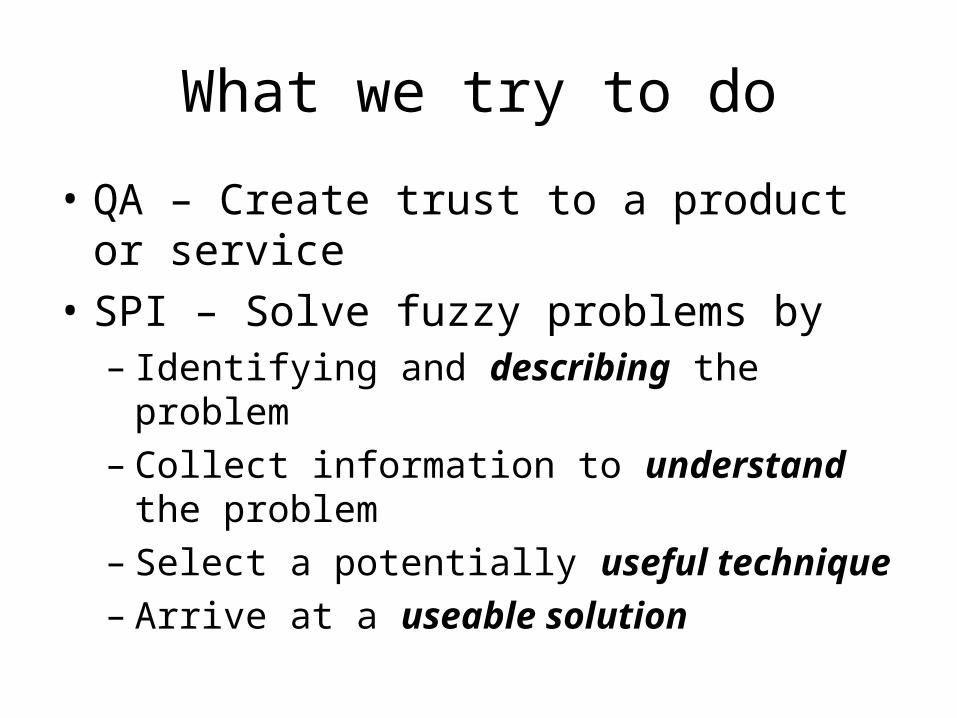
What we try to do
• QA – Create trust to a product or service• SPI – Solve fuzzy problems by
– Identifying and describing the problem– Collect information to understand the problem– Select a potentially useful technique– Arrive at a useable solution

Create trust
Product
Tools and methods
Trust
Customerknowledge

A “soft” problem
Problem
Available tools and methods
Possiblesolution
Experience
Method 4
Method …
Method 2
Method …
Method 7
Method 3
Method n
Method 6Method 1
Method 5

Summary of Quality Assurance – 1 QA is about two things:• Having a way of working that is
– Defined – there is clear description– Documented, written down for everybody to see– Communicated, everybody in the company knows
about it– Agreed-upon, everybody in the company works this
way• Keeping our promises. When we have promised
to do the job in a certain way, this is how it will be if nothing else is agreed upon later.

Summary of Quality Assurance – 2
The QA department or the QA responsible needs to
• Check that we keep our promises• Look for improvement opportunities
– New things to do– Things to change– Things we should stop doing

Summary of Quality Assurance – 3 Quality assurance is • not software process improvement• a way to keep status quo.
tOld statusquo
New status quoChaos Integrate and practice
tOld statusquo
New status quoChaos Integrate and practice
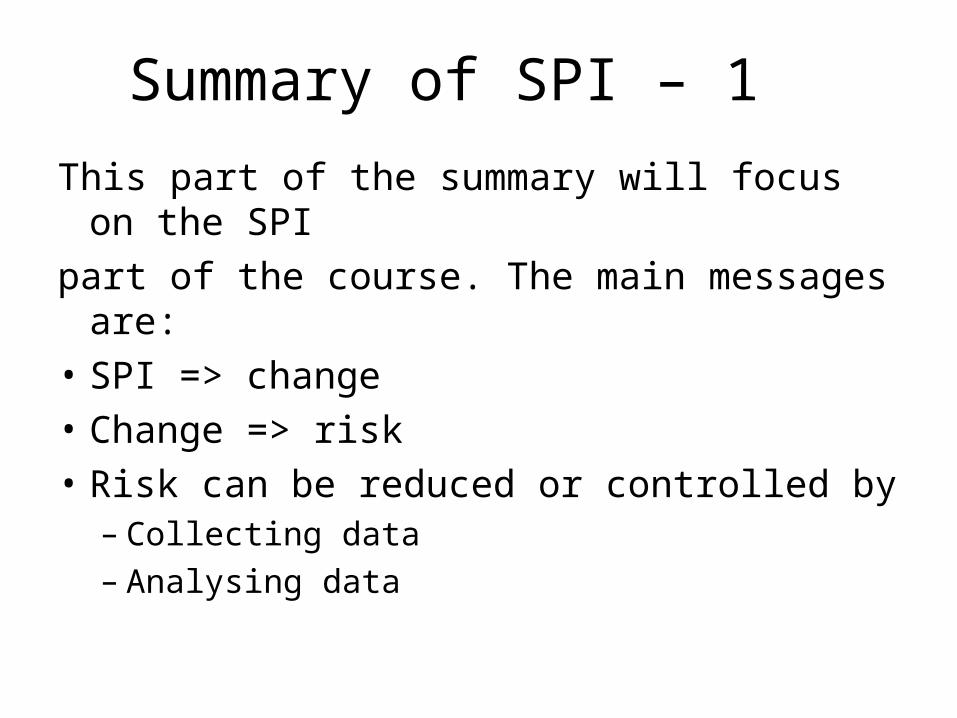
Summary of SPI – 1
This part of the summary will focus on the SPIpart of the course. The main messages are:• SPI => change• Change => risk• Risk can be reduced or controlled by
– Collecting data– Analysing data
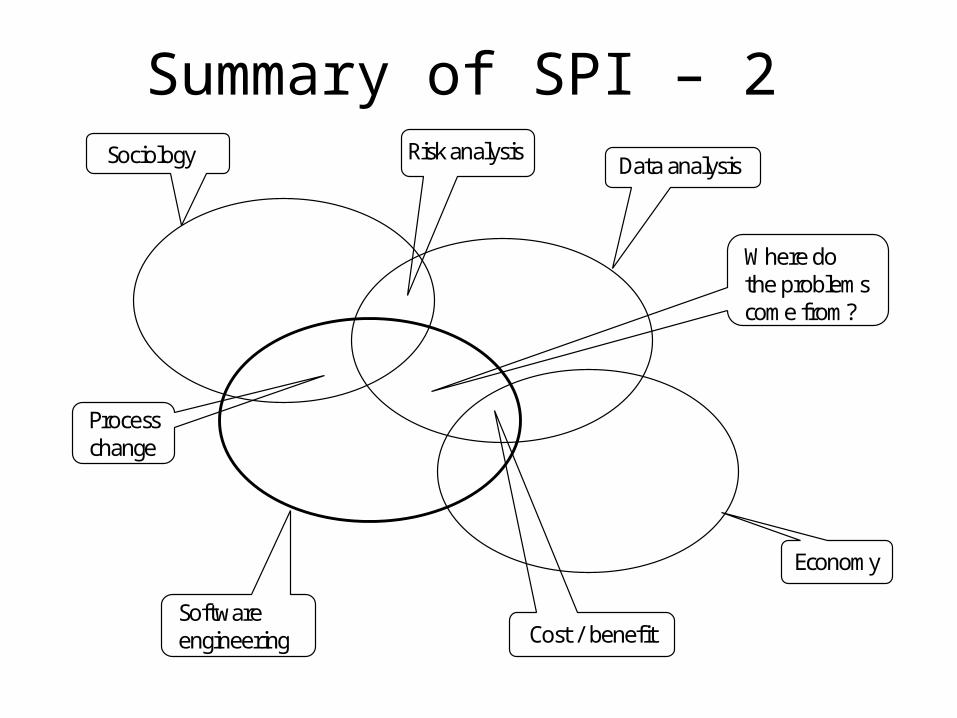
Summary of SPI – 2 Sociology Data analysis
Economy
Software engineering
Risk analysis
Process change
Cost / benefit
Where dothe problemscome from?
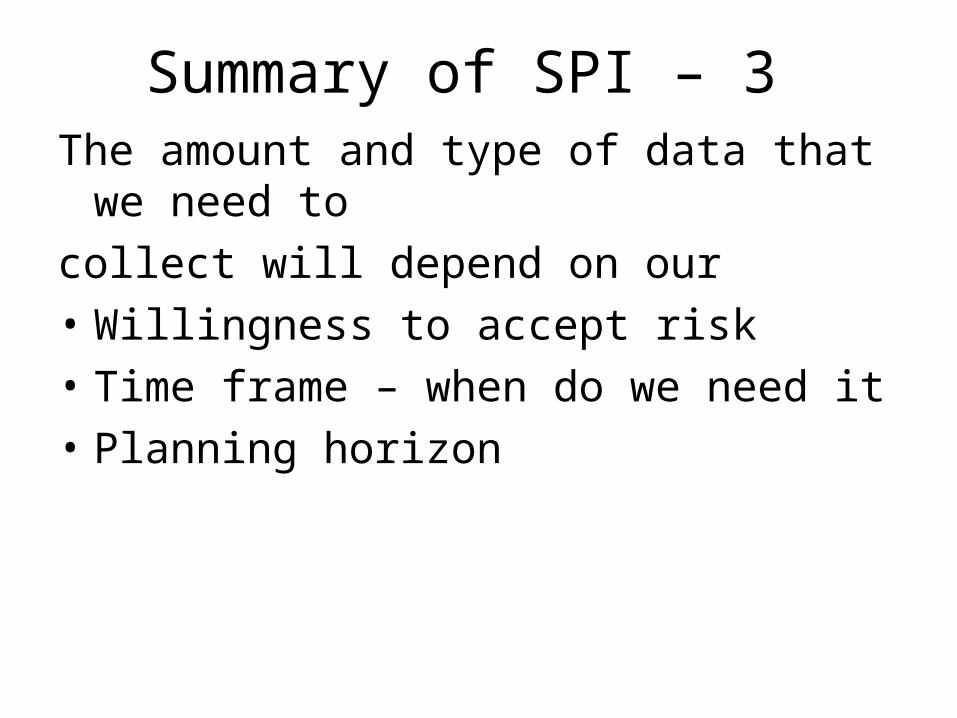
Summary of SPI – 3 The amount and type of data that we need tocollect will depend on our• Willingness to accept risk• Time frame – when do we need it• Planning horizon
C D
PA
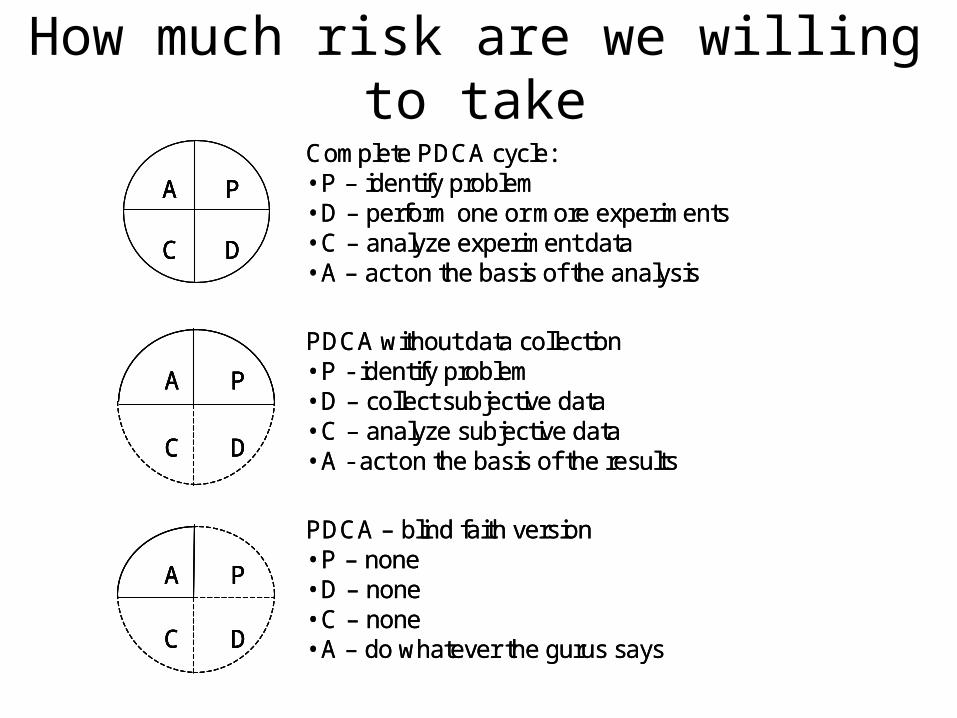
Complete PDCA cycle:• P – identify problem• D – perform one or more experiments • C – analyze experiment data• A – act on the basis of the analysis
C D
PA
PDCA without data collection • P - identify problem• D – collect subjective data• C – analyze subjective data• A - act on the basis of the results
C D
PA
PDCA – blind faith version• P – none• D – none• C – none• A – do whatever the gurus says
C D
PA
C D
PA
C D
PA
Complete PDCA cycle:• P – identify problem• D – perform one or more experiments • C – analyze experiment data• A – act on the basis of the analysis
C D
PA
C D
PA
C D
PA
PDCA without data collection • P - identify problem• D – collect subjective data• C – analyze subjective data• A - act on the basis of the results
C D
PA
C D
PA
C D
PA
PDCA – blind faith version• P – none• D – none• C – none• A – do whatever the gurus says
How much risk are we willing to take

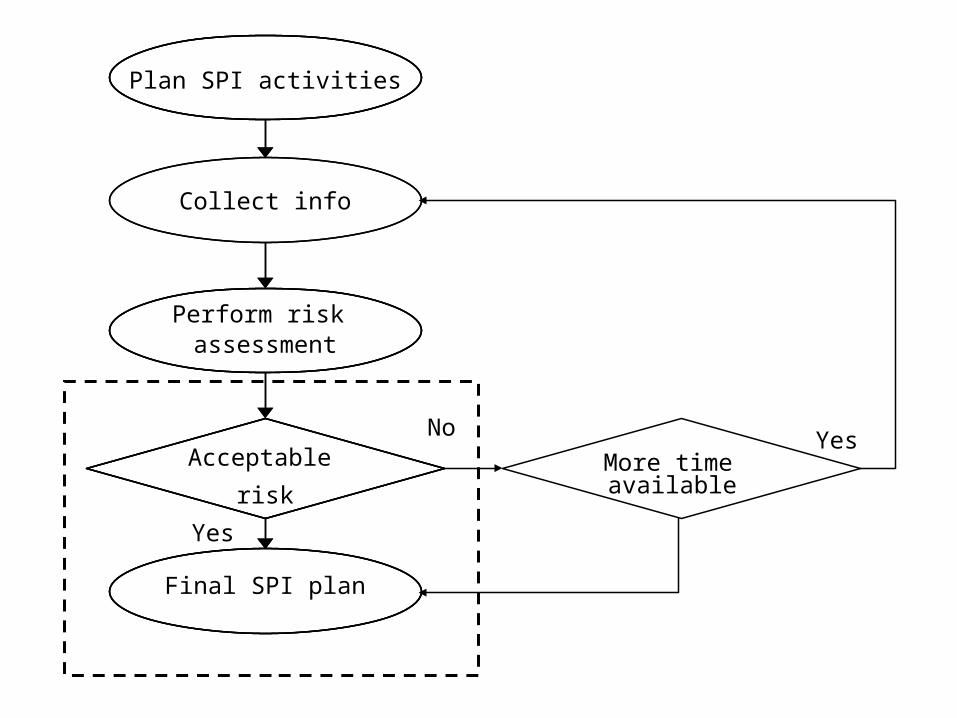
The data collection process
As shown in the next diagram, we wiull keep on collecting data until we
• Can reduce the decision risks to an acceptable level
• Run out of time
Collect info
Perform risk
Final SPI plan
More time available
Yes
Plan SPI activities
assessment
Acceptable
risk
Yes
No

Assess mitigationactivities
Assess cost Assess risk effect
Within limits Acceptable
Final SPI plan including mitigations
No No
Yes Yes
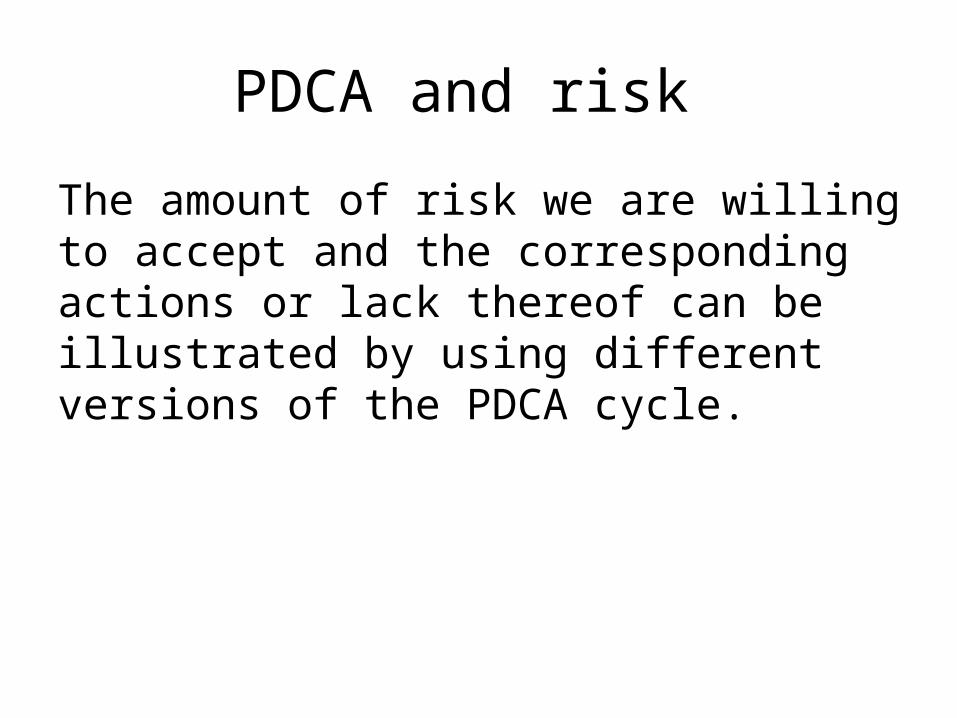
PDCA and risk
The amount of risk we are willing to accept and the corresponding actions or lack thereof can be illustrated by using different versions of the PDCA cycle.
Plan
Do Check
Act
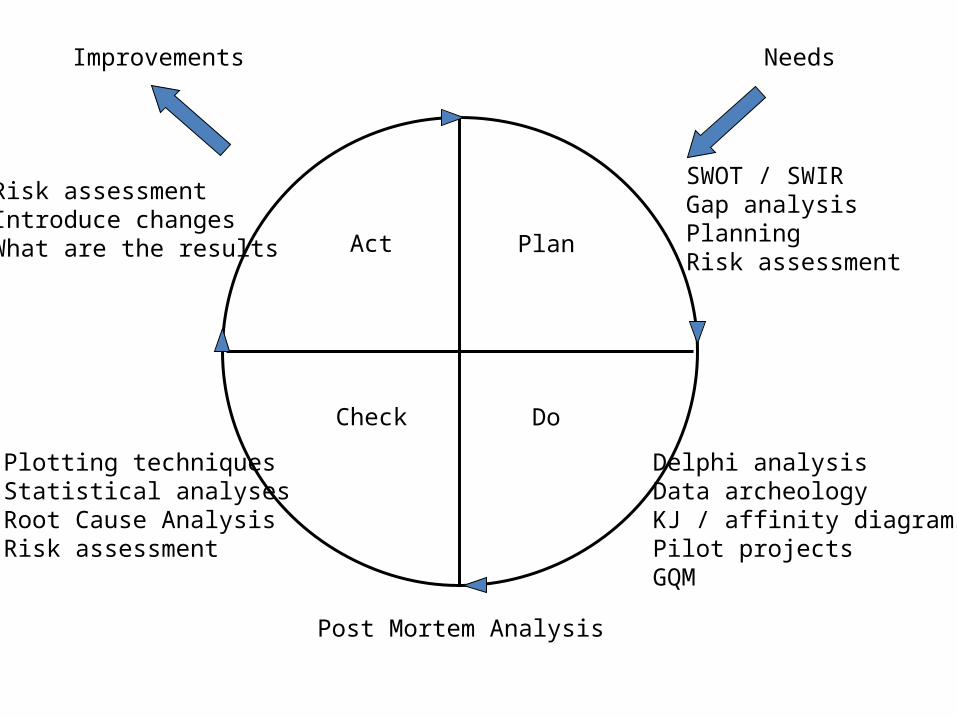
Needs Improvements
SWOT / SWIRGap analysisPlanningRisk assessment
Delphi analysisData archeologyKJ / affinity diagramsPilot projectsGQM
Plotting techniquesStatistical analysesRoot Cause AnalysisRisk assessment
Risk assessmentIntroduce changesWhat are the results
Post Mortem Analysis

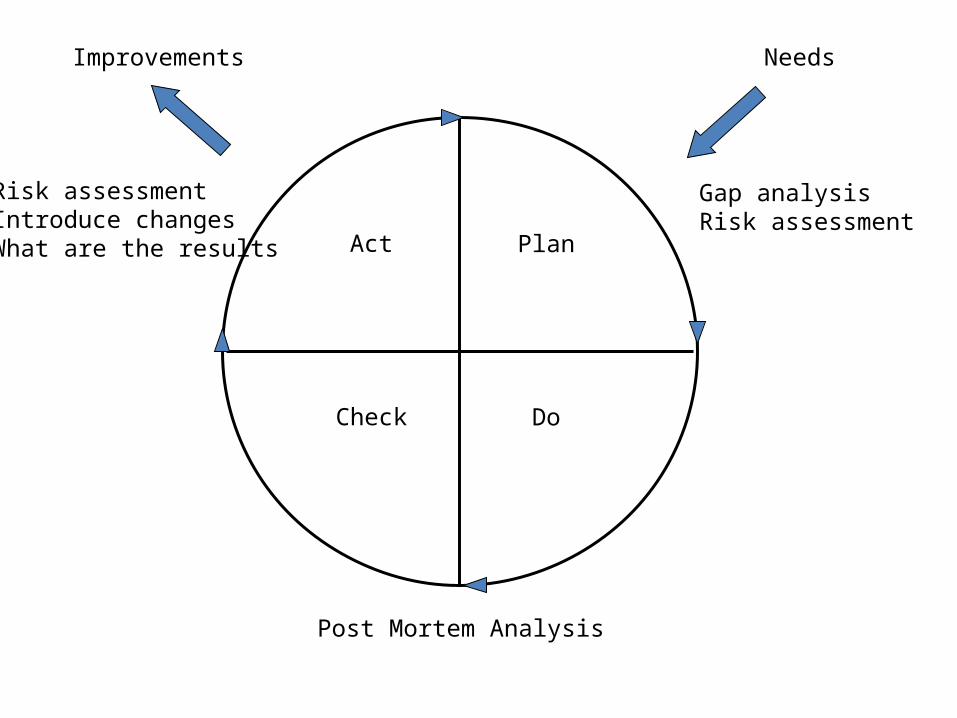
Plan
Do Check
Act
Needs Improvements
SWOT / SWIR
Data archeologyDelphi analysis
Root Cause Analysis
Risk assessment Introduce changesWhat are the results

Plan
Do Check
Act
Needs Improvements
Planning
GQMPilot project
Plotting techniquesStatistical analysesRoot Cause Analysis
Risk assessment Introduce changesWhat are the results

Plan
Do Check
Act
Needs Improvements
Gap analysis
KJ / affinity diagramsRoot Cause Analysis
Risk assessment Introduce changesWhat are the results
Plan
Do Check
Act
Needs Improvements
Post Mortem Analysis
Risk assessment Introduce changesWhat are the results
Gap analysisRisk assessment
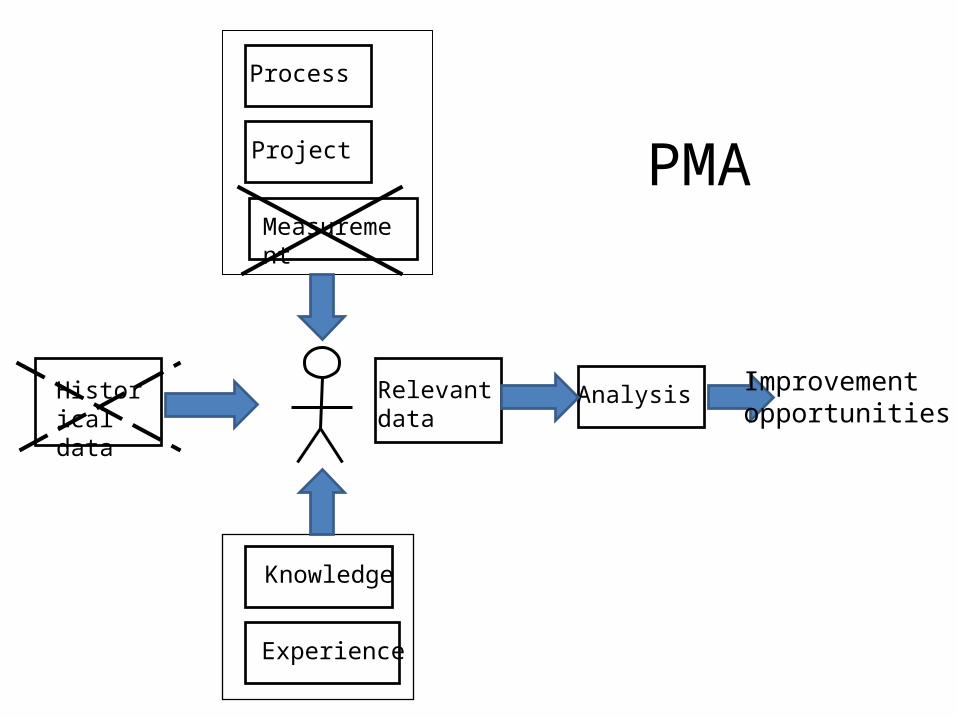
Process
Project
Measurement
Analysis Relevant data
Historicaldata
Experience
Knowledge
PMA
Improvementopportunities

Process
Project
Measurement
Analysis Relevant data
Historicaldata
Experience
Knowledge
GQM
Improvementopportunities
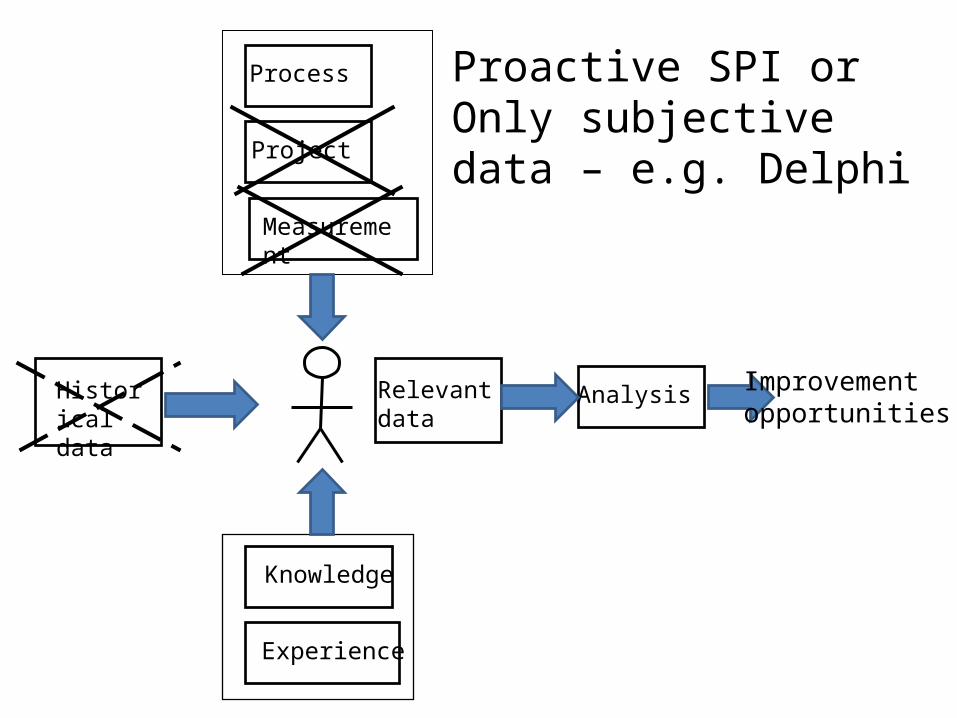
Process
Project
Measurement
Analysis Relevant data
Historicaldata
Experience
Knowledge
Proactive SPI orOnly subjective data – e.g. Delphi
Improvementopportunities
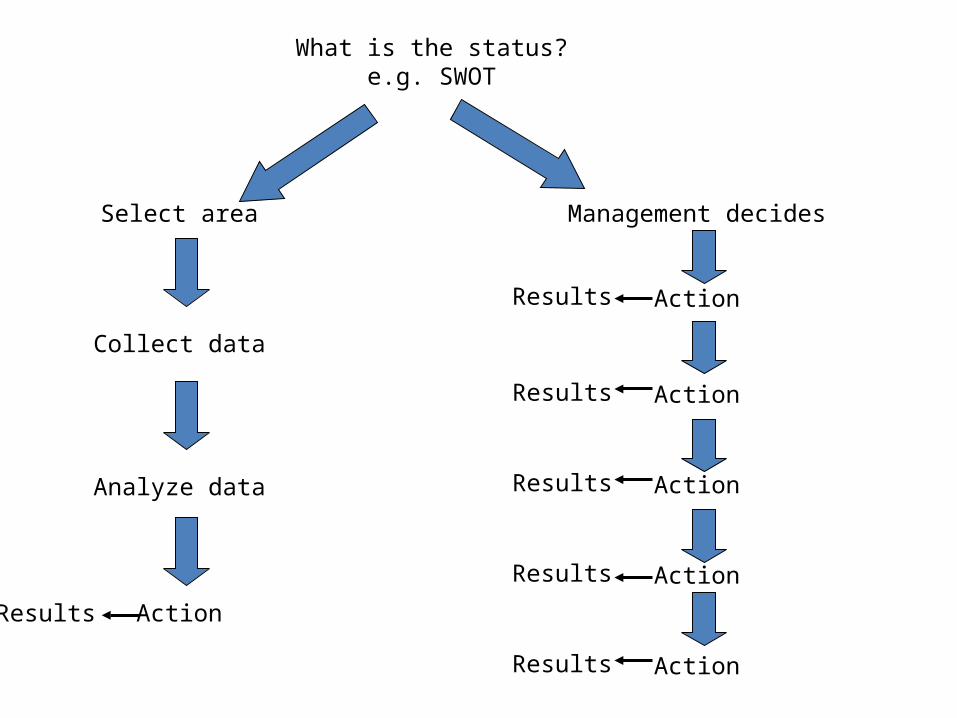
What is the status?e.g. SWOT
Management decides Select area
Action
Action
Action
Action
Action
Results
Results
Results
Results
Results
Collect data
Analyze data
Action Results