![Family Systems of Advanced Charring Ablators for Planetary ... · PDF fileFamily Systems of Advanced Charring Ablators for Planetary Aerocapture and Entry Missions ... [4-5]. This](https://static.fdocuments.net/doc/165x107/5a7aff3e7f8b9a2e6e8b8dd2/family-systems-of-advanced-charring-ablators-for-planetary-systems-of-advanced.jpg)
Coupled Flow Field Simulations of Charring Ablators with ...
16
University of Kentucky University of Kentucky UKnowledge UKnowledge Mechanical Engineering Faculty Publications Mechanical Engineering 6-2013 Coupled Flow Field Simulations of Charring Ablators with Coupled Flow Field Simulations of Charring Ablators with Nonequilibrium Surface Chemistry Nonequilibrium Surface Chemistry Hicham Alkandry University of Michigan Iain D. Boyd University of Michigan Alexandre Martin University of Kentucky, [email protected] Follow this and additional works at: https://uknowledge.uky.edu/me_facpub Part of the Aerodynamics and Fluid Mechanics Commons, and the Computer Sciences Commons Right click to open a feedback form in a new tab to let us know how this document benefits you. Right click to open a feedback form in a new tab to let us know how this document benefits you. Repository Citation Repository Citation Alkandry, Hicham; Boyd, Iain D.; and Martin, Alexandre, "Coupled Flow Field Simulations of Charring Ablators with Nonequilibrium Surface Chemistry" (2013). Mechanical Engineering Faculty Publications. 5. https://uknowledge.uky.edu/me_facpub/5 This Conference Proceeding is brought to you for free and open access by the Mechanical Engineering at UKnowledge. It has been accepted for inclusion in Mechanical Engineering Faculty Publications by an authorized administrator of UKnowledge. For more information, please contact [email protected].
Transcript of Coupled Flow Field Simulations of Charring Ablators with ...
University of Kentucky University of Kentucky
UKnowledge UKnowledge
Mechanical Engineering Faculty Publications Mechanical Engineering
6-2013
Coupled Flow Field Simulations of Charring Ablators with Coupled Flow Field Simulations of Charring Ablators with
Nonequilibrium Surface Chemistry Nonequilibrium Surface Chemistry
Hicham Alkandry University of Michigan
Iain D. Boyd University of Michigan
Alexandre Martin University of Kentucky, [email protected]
Follow this and additional works at: https://uknowledge.uky.edu/me_facpub
Part of the Aerodynamics and Fluid Mechanics Commons, and the Computer Sciences Commons
Right click to open a feedback form in a new tab to let us know how this document benefits you. Right click to open a feedback form in a new tab to let us know how this document benefits you.
Repository Citation Repository Citation Alkandry, Hicham; Boyd, Iain D.; and Martin, Alexandre, "Coupled Flow Field Simulations of Charring Ablators with Nonequilibrium Surface Chemistry" (2013). Mechanical Engineering Faculty Publications. 5. https://uknowledge.uky.edu/me_facpub/5
This Conference Proceeding is brought to you for free and open access by the Mechanical Engineering at UKnowledge. It has been accepted for inclusion in Mechanical Engineering Faculty Publications by an authorized administrator of UKnowledge. For more information, please contact [email protected].
Coupled Flow Field Simulations of Charring Ablators with Nonequilibrium Surface Coupled Flow Field Simulations of Charring Ablators with Nonequilibrium Surface Chemistry Chemistry
Digital Object Identifier (DOI) http://dx.doi.org/10.2514/6.2013-2634
Notes/Citation Information Notes/Citation Information Published in the Proceedings of the 44th AIAA Thermophysics Conference, Paper 2013-2634, p. 1-14.
© Copyright 2013 by Hicham Alkandry, Iain D. Boyd, and Alexandre Martin.
The copyright holders have granted the permission for posting the article here.
This conference proceeding is available at UKnowledge: https://uknowledge.uky.edu/me_facpub/5
Coupled Flow Field Simulations of Charring Ablators
with Nonequilibrium Surface Chemistry
Hicham Alkandry∗ and Iain D. Boyd†
Department of Aerospace Engineering, University of Michigan, Ann Arbor, MI
Alexandre Martin‡
Department of Mechanical Engineering, University of Kentucky, Lexington, KY
This paper describes the coupling of a Navier-Stokes solver to a material response codeto simulate nonequilibrium gas-surface interactions. The Navier-Stokes solver used in thisstudy is LeMANS, which is a three-dimensional computational fluid dynamics code that cansimulate hypersonic reacting flows including thermo-chemical nonequilibrium effects. Thematerial response code employed in this study is MOPAR, which uses the one-dimensionalcontrol volume finite-element method to model heat conduction and pyrolysis gas behav-ior. This coupling is demonstrated using a test case based on the Stardust sample returncapsule. Coupled simulations are performed at three different trajectory conditions. Theeffects of the pyrolysis gas chemistry are evaluated by assuming that the gas is either inchemical equilibrium or composed entirely of non-reacting phenol. The results show thatthe non-reacting pyrolysis gas assumption produces higher convective heat fluxes, surfacetemperatures, and mass blowing rates. These effects are mainly due to the compositionof the pyrolysis gas. The additional species produced by the pyrolysis gas in the chemi-cal equilibrium case react with oxygen and nitrogen atoms in the gas-phase. This resultsin fewer atoms participating in the exothermic surface reactions, which reduces the heattransfer to the vehicle.
Nomenclature
Dk Mass diffusion coefficient of species k, m2/sh Enthalpy, J/kgm Mass blowing rate, kg/m2/sMk Molar weight of species k, kg/molNB Number of bulk-phase speciesp Pressure, Pas Recession rate, m/sTtr Translational/rotational temperature, KTve Vibrational/electronic/electron temperature, Kv Velocity, m/swk Molar production rate of species k, mol/m2/sYk Mass fraction of species kρ Density, kg/m3
subscriptsc Charg Pyrolysis gasn Conditions at the first cell away from the wallw Conditions at the wall
∗Research Fellow, Member AIAA.†James E. Knott Professor of Engineering, Fellow AIAA.‡Assistant Professor, Associate Faculty at the Center for Computational Science, Senior Member AIAA.
1 of 14
American Institute of Aeronautics and Astronautics
Dow
nloa
ded
by U
NIV
ER
SIT
Y O
F M
ICH
IGA
N o
n A
pril
1, 2
014
| http
://ar
c.ai
aa.o
rg |
DO
I: 1
0.25
14/6
.201
3-26
34
44th AIAA Thermophysics Conference
June 24-27, 2013, San Diego, CA
AIAA 2013-2634
Copyright © 2013 by H. Alkandry, I. D. Boyd, and A. Martin. Published by the American Institute of Aeronautics and Astronautics, Inc., with permission.
Fluid Dynamics and Co-located Conferences
I. Introduction
Planetary entry vehicles are required to sustain very high heat loads when entering an atmosphere.For this reason, many vehicles employ charring thermal protection system (TPS) materials. Accurate
simulations of the aerothermal environment expected during re-entry for these vehicles may need to accountfor complicated physical processes, such as nonequilibrium surface chemistry and the behavior of pyrolysisgases emitted from the ablative TPS. One way to account for these complex processes is by coupling a flowfield solver that can simulate the flow around the re-entry vehicle and a material response code that canmodel the pyrolysis process and heat conduction within the TPS.
The goal of this study is to couple a viscous Navier-Stokes solver to an existing material response code.The flow field solver employed in this study is the LeMANS computational fluid dynamics (CFD) code.1,2
LeMANS is developed at the University of Michigan and has been used to simulate hypersonic reactingflows. Recently, a finite-rate surface chemistry module has been implemented in LeMANS in order tomodel nonequilibrium chemical processes that may occur at the surface of a re-entry vehicle.3 The materialresponse code used in this study is called MOPAR.4–6 This code has been developed at the University ofMichigan and the University of Kentucky and can model heat conduction and pyrolysis gas behavior withinner decomposition. This new coupled capability is demonstrated using a test case based on the re-entryconditions of the Stardust sample return capsule.
The paper is presented as follows. The first section describes the coupling approach used in this study.Details regarding the Navier-Stokes solver, the material response code, and the coupling aspects are provided.In the second section of this paper, the capabilities of this coupled method are demonstrated using a testcase based on the Stardust sample return capsule. The effects of the pyrolysis gas mixture composition areevaluated by comparing the numerical results obtained using two different assumptions. The first approachassumes that the pyrolysis gas is in chemical equilibrium, while the second approach assumes that thepyrolysis gas is chemically “frozen” and does not react with any gas-phase species. The last section of thepaper presents conclusions drawn from this study and possible future research directions.
II. Coupling Approach
A. Navier-Stokes Solver
LeMANS is a three-dimensional, parallel code that solves the laminar Navier-Stokes equations on unstruc-tured computational grids including thermo-chemical nonequilibrium effects. In LeMANS, the flow is mod-eled assuming that the continuum approximation is valid. For this study, it is also assumed that thetranslational and rotational energy modes can be described by a single temperature, Ttr, and that the vibra-tional, electronic, and electron translational energy modes are described by a different temperature Tve. Themixture transport properties are calculated using Wilke’s semi-empirical mixing rule7 with species viscositiescomputed using Blottner’s curve fits8 and species thermal conductivities determined using Eucken’s rela-tion.9 In this study, the species mass diffusion coefficients are calculated assuming a constant Lewis numberof 1.4. The mass diffusion fluxes of heavy particles are modeled using a modified version of Fick’s law10
which enforces the requirement that the fluxes sum to zero, and the diffusion flux of electrons is calculatedassuming ambipolar diffusion.
In LeMANS, the set of governing equations are solved using the finite-volume method applied to unstruc-tured grids with second-order spatial accuracy. LeMANS can simulate two-dimensional and axisymmetricflows using any mixture of quadrilateral and triangular mesh cells, and three-dimensional flows using anymixture of hexahedra, tetrahedra, prisms, and pyramids. A modified Steger-Warming Flux Vector Splittingscheme11 is used to discretize the inviscid fluxes across cell faces, which is less dissipative and producesbetter results in boundary layers compared to the original scheme. The viscous terms are computed usingcell-centered and nodal values. The viscous stresses are modeled assuming a Newtonian fluid and Stokes’hypothesis, and the heat fluxes are modeled according to Fourier’s law for the two temperatures. Mesh move-ment capabilities have been implemented in LeMANS to model surface recession for ablative heat-shields.6,12
The method used in LeMANS solves the discrete form of the geometric conservation laws, which state thebalance between the relevant geometric parameters.13 This method is valid for both explicit and implicitschemes and retains the order of accuracy of the CFD model. LeMANS is parallelized using METIS14 topartition the computational mesh, and the Message Passing Interface (MPI) to communicate the necessaryinformation between processors.
2 of 14
American Institute of Aeronautics and Astronautics
Dow
nloa
ded
by U
NIV
ER
SIT
Y O
F M
ICH
IGA
N o
n A
pril
1, 2
014
| http
://ar
c.ai
aa.o
rg |
DO
I: 1
0.25
14/6
.201
3-26
34
Nonequilibrium chemical processes at the surface of a re-entry vehicle are modeled in LeMANS using theFinite-Rate Surface Chemistry (FRSC) Module, originally developed by Marschall and MacLean.15,16 TheFRSC Module allows for the definition of three distinct environments: gas, surface, and bulk. The surfaceand bulk environments can have any number of phases, which represent physically and chemically distinctregions. The gas environment can only have a single phase. Surface reactions may only occur at active sitesthat can either be empty or filled with an adsorbed species on a specific surface phase. The total numberof reaction sites is conserved and sites may neither be created nor destroyed. The number of reaction sites(i.e. site density) is a property of the surface and is defined as a user input. The FRSC Module allows thespecification of several different reaction types. These include,
Adsorption/Desorption: A + (s) A(s)
Eley-Rideal: A + B(s) AB + (s)
Langmuir-Hinshelwood: A(s) + B(s) AB + (s)
Sublimation/Condensation: (s) + A(b) A + (s)
In the previous examples, (s) represents an empty active site, A(s) is an adsorbed particle, and A(b) is abulk species. The FRSC Module also allows for the specification of several other reaction processes that donot strictly fit into the categories given above (e.g. oxidation and nitridation). Additional details regardingthe FRSC Module are provided in Refs. 15 and 16.
B. Material Response Code
The material response code used in this study is MOPAR and has been developed at the University ofMichigan and the University of Kentucky.4–6 MOPAR is based on a code developed at the Sandia NationalLaboratories.17,18 It employs the one-dimensional control volume finite-element method (CVFEM) to modelheat conduction and pyrolysis gas behavior with inner decomposition. MOPAR computes the surface tem-perature and pyrolysis gas mass blowing rate by solving the following governing equations:
Mixture Energy Equation:
d
dt
∫cv
ρE dV −∫cs
ρhvcs dA+
∫cs
φρghgvg dA+
∫cs
q′′ dA = 0 (1)
Solid-Phase Continuity Equation:
d
dt
∫cv
ρs dV −∫cs
ρsvcs dA−∫cv
m′′′s dV = 0 (2)
Gas-Phase Continuity Equation:
d
dt
∫cv
φρg dV −∫cs
φρgvcs dA+
∫cs
φρgvg dA−∫cv
m′′′g dV = 0 (3)
Momentum Equation:∂p
∂x= − µ
Kφvg (4)
where V is the volume, A is the area, E is the total energy, q′′ is the internal heat flux, m′′′ is the volumetricmass source term, φ is the porosity, and p is pressure. The subscript g indicates gas-phase properties, cv isthe control volume, cs is the control surface. Equation 4 is a form of Darcy’s law.
Equations 1 and 2 are solved implicitly on an arbitrary contracting grid using Landau coordinates witha non-linear Newton’s method. Equation 3 is solved analytically, and Equation 4 is solved explicitly forvg and directly integrated in the gas-phase continuity equation. MOPAR has been validated using bothexperimental data and code-to-code comparisons, and additional details can be found in Refs. 4–6.
C. Coupling Aspects
The interaction between the hypersonic gas flow and the surface of a planetary entry vehicle can be simulatedin LeMANS by solving the species mass balance,
−ρwDk,w∇Yk,w + ρwvwYk,w = Mkwk (5)
3 of 14
American Institute of Aeronautics and Astronautics
Dow
nloa
ded
by U
NIV
ER
SIT
Y O
F M
ICH
IGA
N o
n A
pril
1, 2
014
| http
://ar
c.ai
aa.o
rg |
DO
I: 1
0.25
14/6
.201
3-26
34
momentum balance,pn + ρnv
2n = pw + ρwv
2w (6)
and energy balance,
qconv + mchc,w + mghg,w = (1− αw)qrad + σε(T 4w − T 4
∞)
+ (mc + mg)hw + qcond (7)
equations to obtain the species mass fractions (Yk,w), gas density (ρw), and gas normal velocity (vw). Theseequations require additional unknowns which can be calculated using the FRSC Module and MOPAR. Theradiative heat flux qrad in the energy balance equation is neglected in the current study.
The species production rates at the surface are given by,
wk = wk,c +Yk,gMk
mg (8)
The first term in Equation 8 accounts for the contribution from the surface reactions and is calculated bythe FRSC Module based on the pressure, temperature, and species concentrations at the wall. The secondterm accounts for the production of gaseous species from pyrolysis gases and is calculated by MOPAR. Themass fractions, Yk,g, appearing in the second term of Equation 8 are for the pyrolysis gas mixture and notthe gaseous mass fractions at the surface.
The mass blowing rate at the surface includes both the contribution of the removal of bulk species bysurface reactions calculated by the FRSC Module, and the rate of pyrolysis gases passing through the surfaceobtained from MOPAR. This blowing rate is given by,
m = ρwvw = mc + mg = −NB∑j=1
Mjwj + mg (9)
The recession rate is calculated in LeMANS using the mass blowing rate due to surface reactions (char) as,
s =mc
ρb(10)
where ρb is the mass density of the bulk environment (char).The coupling between LeMANS and MOPAR is presented schematically in Figure 1. The coupled simu-
lations begin with the steady-state cold wall non-ablating solution obtained using LeMANS from an initialtrajectory point. MOPAR is first called from LeMANS to calculate the surface temperature, pyrolysis gasmass blowing rate, and pyrolysis mixture composition based on the conduction heat flux (equal to the con-vective heat flux for this initial point), recession rate (equal to zero for this initial point), and pressure alongthe surface. MOPAR then passes these values to LeMANS, where the flow field mesh is first moved basedon the surface recession rate, and then the fluid governing equations are solved iteratively for a user-definednumber of iterations. The species mass and momentum balance equations are solved iteratively using New-ton’s method during each global iteration, while the energy balance equation is solved for the conductionheat flux qcond. Then, MOPAR is called again, and the updated as well as the initial values of conductionheat flux, recession rate, and surface pressure are used as boundary conditions to solve the time-accurategoverning equations. This process is repeated until a converged steady-state solution is reached at the currenttrajectory point.
MOPAR has been recently modified to simulate nonequilibrium chemical processes for the pyrolysis gas.However, it was recently shown that the lack of appropriate chemistry models for the pyrolysis gas preventsthis feature from providing reasonable results.19 Therefore, two different pyrolysis gas assumptions areconsidered in this study. The first assumes that the pyrolysis gas is in chemical equilibrium. The secondassumes that the pyrolysis gas is chemically “frozen” and does not react with any gas-phase species. In thefirst assumption, the properties of the pyrolysis gas are determined as functions of temperature using look-uptables generated by assuming chemical equilibrium. The atomistic mass fractions of the gas are determinedby the resin decomposition since the decomposing solid is assumed to be transformed to the pyrolysis gas. Inthe second approach, the properties of the pyrolysis gas are calculated using curve fit relations similar to theones employed in LeMANS (i.e. viscosity curve fits and Eucken’s relation). These two assumptions providean opportunity to investigate the effects of the pyrolysis gas composition on the flow field predictions for aheat-shield with a charring ablator.
4 of 14
American Institute of Aeronautics and Astronautics
Dow
nloa
ded
by U
NIV
ER
SIT
Y O
F M
ICH
IGA
N o
n A
pril
1, 2
014
| http
://ar
c.ai
aa.o
rg |
DO
I: 1
0.25
14/6
.201
3-26
34
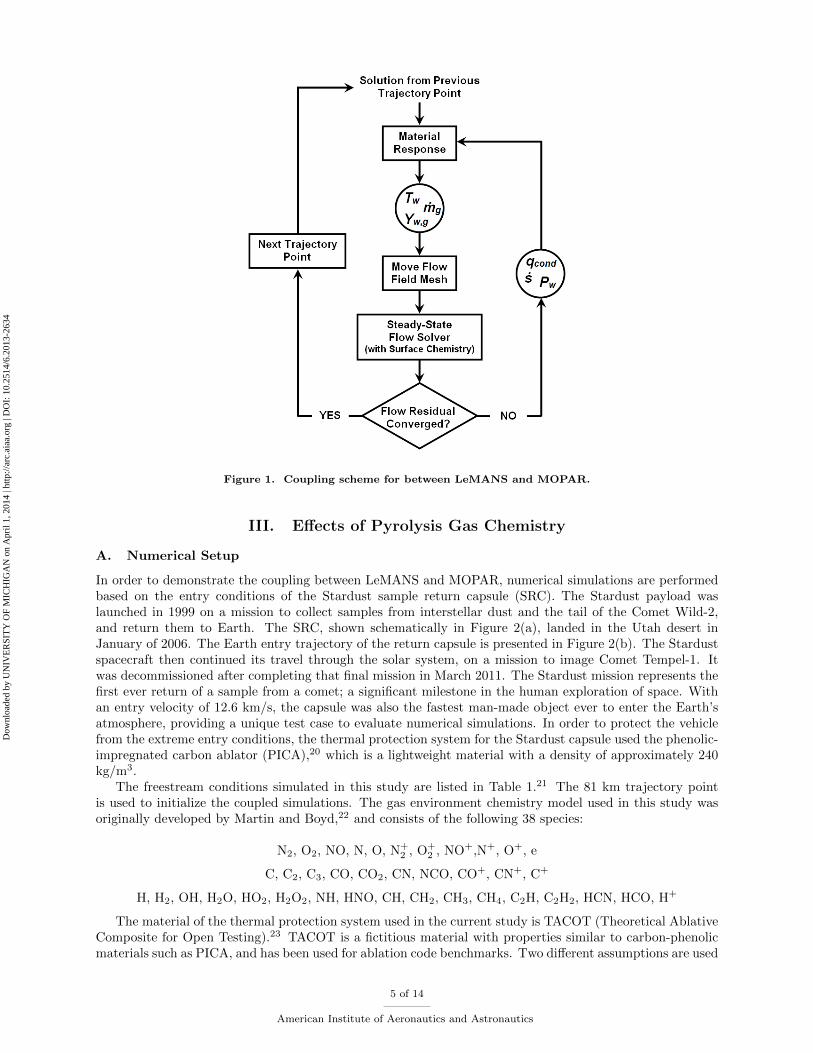
Figure 1. Coupling scheme for between LeMANS and MOPAR.
III. Effects of Pyrolysis Gas Chemistry
A. Numerical Setup
In order to demonstrate the coupling between LeMANS and MOPAR, numerical simulations are performedbased on the entry conditions of the Stardust sample return capsule (SRC). The Stardust payload waslaunched in 1999 on a mission to collect samples from interstellar dust and the tail of the Comet Wild-2,and return them to Earth. The SRC, shown schematically in Figure 2(a), landed in the Utah desert inJanuary of 2006. The Earth entry trajectory of the return capsule is presented in Figure 2(b). The Stardustspacecraft then continued its travel through the solar system, on a mission to image Comet Tempel-1. Itwas decommissioned after completing that final mission in March 2011. The Stardust mission represents thefirst ever return of a sample from a comet; a significant milestone in the human exploration of space. Withan entry velocity of 12.6 km/s, the capsule was also the fastest man-made object ever to enter the Earth’satmosphere, providing a unique test case to evaluate numerical simulations. In order to protect the vehiclefrom the extreme entry conditions, the thermal protection system for the Stardust capsule used the phenolic-impregnated carbon ablator (PICA),20 which is a lightweight material with a density of approximately 240kg/m3.
The freestream conditions simulated in this study are listed in Table 1.21 The 81 km trajectory pointis used to initialize the coupled simulations. The gas environment chemistry model used in this study wasoriginally developed by Martin and Boyd,22 and consists of the following 38 species:
N2, O2, NO, N, O, N+2 , O+
2 , NO+,N+, O+, e
C, C2, C3, CO, CO2, CN, NCO, CO+, CN+, C+
H, H2, OH, H2O, HO2, H2O2, NH, HNO, CH, CH2, CH3, CH4, C2H, C2H2, HCN, HCO, H+
The material of the thermal protection system used in the current study is TACOT (Theoretical AblativeComposite for Open Testing).23 TACOT is a fictitious material with properties similar to carbon-phenolicmaterials such as PICA, and has been used for ablation code benchmarks. Two different assumptions are used
5 of 14
American Institute of Aeronautics and Astronautics
Dow
nloa
ded
by U
NIV
ER
SIT
Y O
F M
ICH
IGA
N o
n A
pril
1, 2
014
| http
://ar
c.ai
aa.o
rg |
DO
I: 1
0.25
14/6
.201
3-26
34
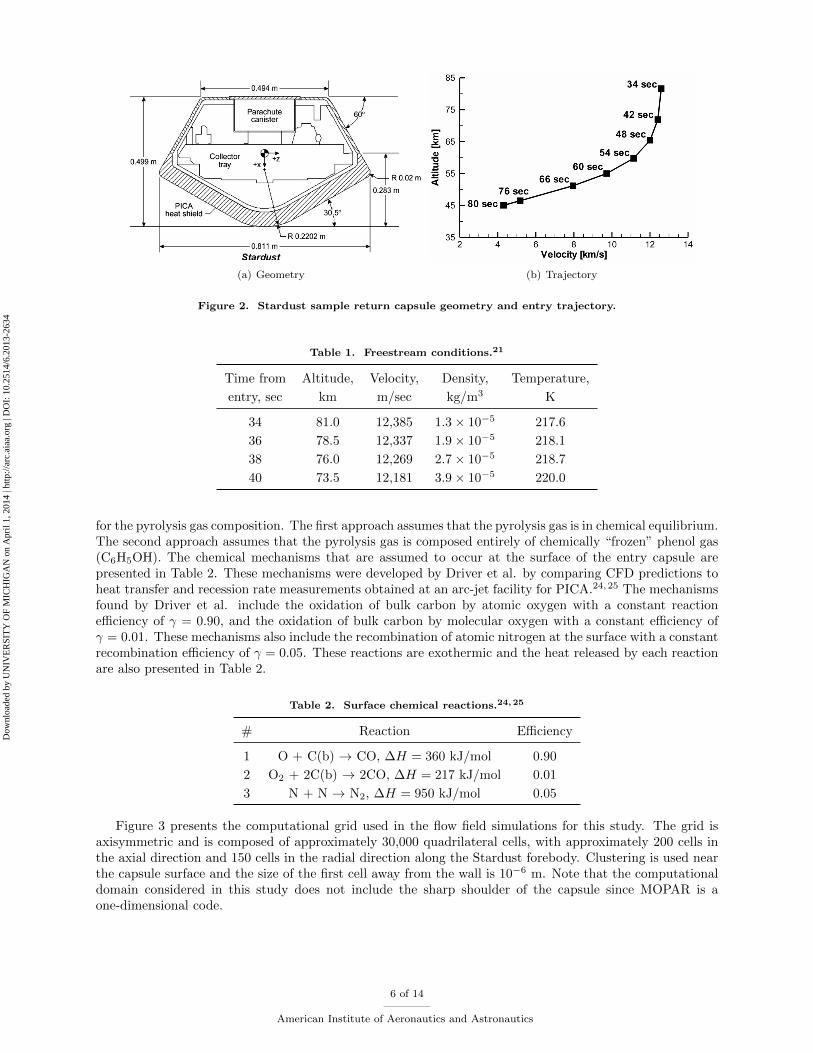
(a) Geometry (b) Trajectory
Figure 2. Stardust sample return capsule geometry and entry trajectory.
Table 1. Freestream conditions.21
Time from Altitude, Velocity, Density, Temperature,
entry, sec km m/sec kg/m3 K
34 81.0 12,385 1.3× 10⁻⁵ 217.6
36 78.5 12,337 1.9× 10⁻⁵ 218.1
38 76.0 12,269 2.7× 10⁻⁵ 218.7
40 73.5 12,181 3.9× 10⁻⁵ 220.0
for the pyrolysis gas composition. The first approach assumes that the pyrolysis gas is in chemical equilibrium.The second approach assumes that the pyrolysis gas is composed entirely of chemically “frozen” phenol gas(C6H5OH). The chemical mechanisms that are assumed to occur at the surface of the entry capsule arepresented in Table 2. These mechanisms were developed by Driver et al. by comparing CFD predictions toheat transfer and recession rate measurements obtained at an arc-jet facility for PICA.24,25 The mechanismsfound by Driver et al. include the oxidation of bulk carbon by atomic oxygen with a constant reactionefficiency of γ = 0.90, and the oxidation of bulk carbon by molecular oxygen with a constant efficiency ofγ = 0.01. These mechanisms also include the recombination of atomic nitrogen at the surface with a constantrecombination efficiency of γ = 0.05. These reactions are exothermic and the heat released by each reactionare also presented in Table 2.
Table 2. Surface chemical reactions.24,25
# Reaction Efficiency
1 O + C(b) → CO, ∆H = 360 kJ/mol 0.90
2 O2 + 2C(b) → 2CO, ∆H = 217 kJ/mol 0.01
3 N + N → N2, ∆H = 950 kJ/mol 0.05
Figure 3 presents the computational grid used in the flow field simulations for this study. The grid isaxisymmetric and is composed of approximately 30,000 quadrilateral cells, with approximately 200 cells inthe axial direction and 150 cells in the radial direction along the Stardust forebody. Clustering is used nearthe capsule surface and the size of the first cell away from the wall is 10−6 m. Note that the computationaldomain considered in this study does not include the sharp shoulder of the capsule since MOPAR is aone-dimensional code.
6 of 14
American Institute of Aeronautics and Astronautics
Dow
nloa
ded
by U
NIV
ER
SIT
Y O
F M
ICH
IGA
N o
n A
pril
1, 2
014
| http
://ar
c.ai
aa.o
rg |
DO
I: 1
0.25
14/6
.201
3-26
34

(a) Overview (b) Stagnation Region
Figure 3. Computational grid used in the flow field.
B. Numerical Results
The main goal of this study is to couple a viscous Navier-Stokes solver to a one-dimensional material responsecode. This coupling can account for nonequilibrium chemical processes that may occur at the surface of anatmospheric entry vehicle. This section presents a demonstration of this coupling by considering the re-entryconditions of the Stardust sample return capsule. Two sets of simulations are performed at three differenttrajectory points. The first set assumes that the pyrolysis gas is in chemical equilibrium, while the secondset assumes that the pyrolysis gas is non-reacting phenol.
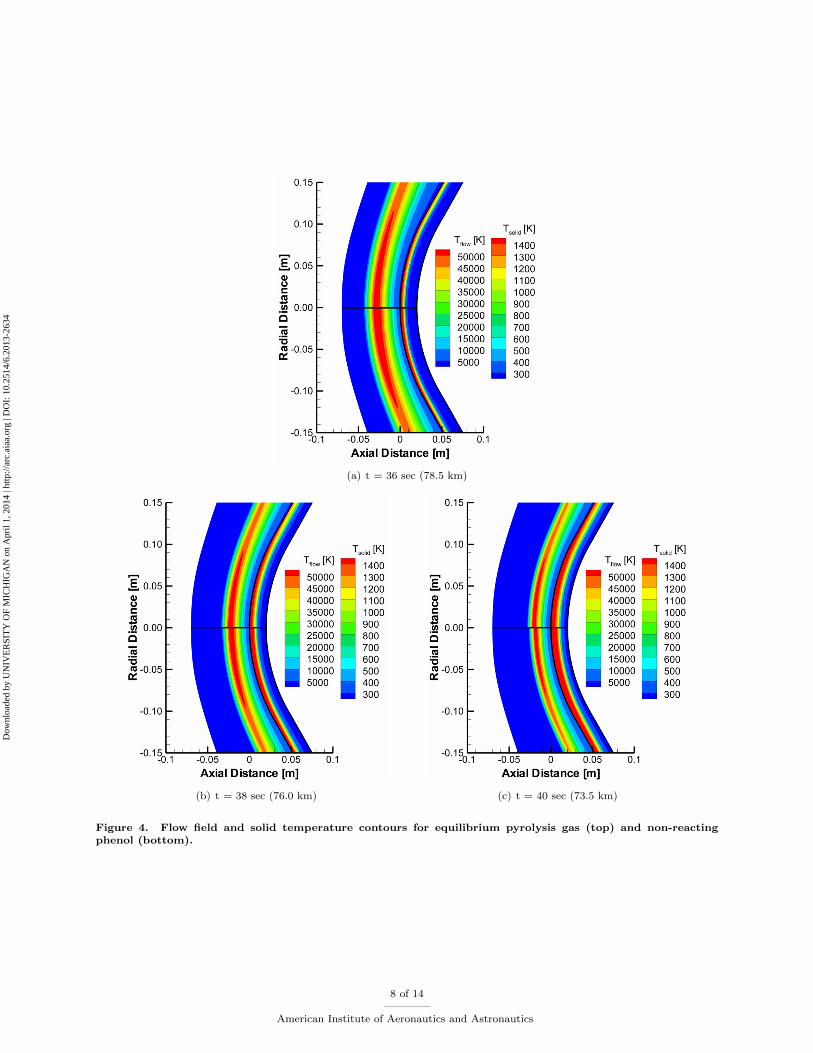
Figure 4 presents the temperature in the flow field predicted by LeMANS and within the solid predictedby MOPAR. The results obtained by assuming that the pyrolysis gas is in chemical equilibrium are ontop, and the results predicted using the “frozen” phenol gas are on the bottom. As the altitude decreases,the peak temperature in the flow field decreases, while the temperature within the solid increases as heatpropagates inside the TPS material. The figures also show that heat propagates farther inside the solid forthe chemically frozen phenol compared to the equilibrium gas, and as a result, the temperature within thesolid is larger.
Temperature profiles along the surface of the Stardust forebody are presented in Figure 5 for the threetrajectory points considered in this study. The solid lines represent the solutions obtained by assuming thatthe pyrolysis gas is in chemical equilibrium, while the dashed lines are the solutions obtained by assumingthat the pyrolysis gas is non-reacting phenol (C6H5OH). As the altitude decreases, the surface temperatureincreases for both assumptions. The temperature at the stagnation point increases from about 1600 K to2100 K for the equilibrium pyrolysis gas, and from about 1850 K to 2350 K for the non-reacting pyrolysisgas. This shows that the non-reacting pyrolysis gas assumption produces an overall larger surface temper-ature compared to the equilibrium gas assumption for the trajectory conditions considered in this study.Specifically, the difference in the temperature at the stagnation point predicted using the two assumptionsis approximately 15%.
The temperatures predicted using both pyrolysis gas assumptions are smaller than some of the valuespublished in other studies. For instance, a study by Winter and Trumble26 deduced from radiation measure-ments obtained during the Stardust re-entry average temperatures from about 2100 K to 2600 K and peaktemperatures from about 2300 K to 2900 K for the trajectory altitudes considered in the current study. Onepossible cause of this difference is the fact that the current study assumes that the TPS material is TACOT,instead of PICA. Another possible cause can be attributed to the trajectory simulation approach undertakenin this study. By using the 81.0 km altitude conditions as the initial solution for the coupled simulations, itis implicitly assumed that significant heat transfer to the surface does not start until this point. However, astudy by Boyd et al. showed that the aerodynamic heating is significant at the 81.0 km trajectory point.27
7 of 14
American Institute of Aeronautics and Astronautics
Dow
nloa
ded
by U
NIV
ER
SIT
Y O
F M
ICH
IGA
N o
n A
pril
1, 2
014
| http
://ar
c.ai
aa.o
rg |
DO
I: 1
0.25
14/6
.201
3-26
34
(a) t = 36 sec (78.5 km)
(b) t = 38 sec (76.0 km) (c) t = 40 sec (73.5 km)
Figure 4. Flow field and solid temperature contours for equilibrium pyrolysis gas (top) and non-reactingphenol (bottom).
8 of 14
American Institute of Aeronautics and Astronautics
Dow
nloa
ded
by U
NIV
ER
SIT
Y O
F M
ICH
IGA
N o
n A
pril
1, 2
014
| http
://ar
c.ai
aa.o
rg |
DO
I: 1
0.25
14/6
.201
3-26
34
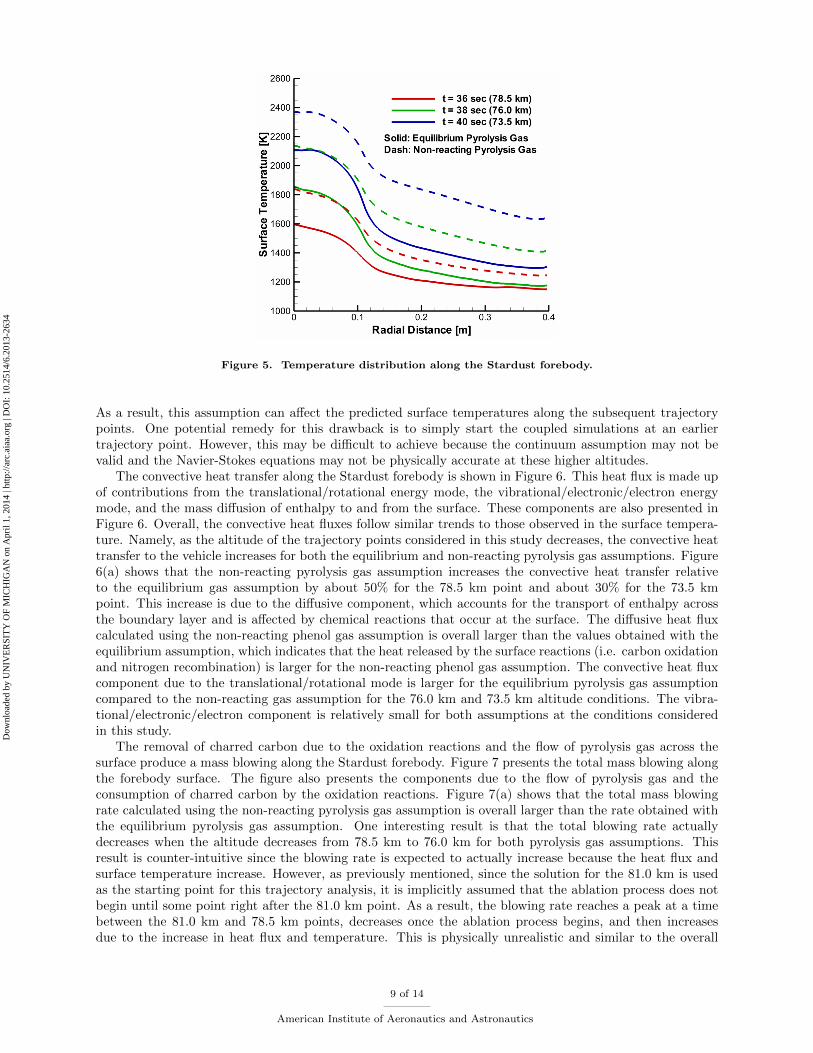
Figure 5. Temperature distribution along the Stardust forebody.
As a result, this assumption can affect the predicted surface temperatures along the subsequent trajectorypoints. One potential remedy for this drawback is to simply start the coupled simulations at an earliertrajectory point. However, this may be difficult to achieve because the continuum assumption may not bevalid and the Navier-Stokes equations may not be physically accurate at these higher altitudes.
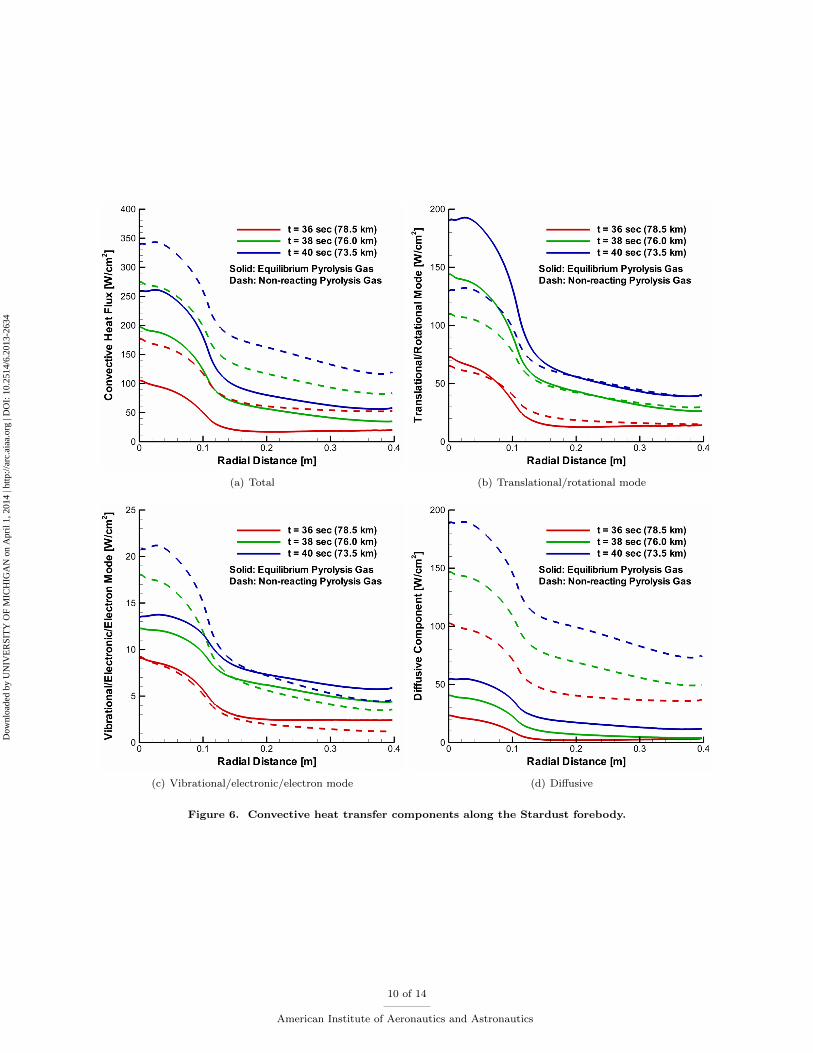
The convective heat transfer along the Stardust forebody is shown in Figure 6. This heat flux is made upof contributions from the translational/rotational energy mode, the vibrational/electronic/electron energymode, and the mass diffusion of enthalpy to and from the surface. These components are also presented inFigure 6. Overall, the convective heat fluxes follow similar trends to those observed in the surface tempera-ture. Namely, as the altitude of the trajectory points considered in this study decreases, the convective heattransfer to the vehicle increases for both the equilibrium and non-reacting pyrolysis gas assumptions. Figure6(a) shows that the non-reacting pyrolysis gas assumption increases the convective heat transfer relativeto the equilibrium gas assumption by about 50% for the 78.5 km point and about 30% for the 73.5 kmpoint. This increase is due to the diffusive component, which accounts for the transport of enthalpy acrossthe boundary layer and is affected by chemical reactions that occur at the surface. The diffusive heat fluxcalculated using the non-reacting phenol gas assumption is overall larger than the values obtained with theequilibrium assumption, which indicates that the heat released by the surface reactions (i.e. carbon oxidationand nitrogen recombination) is larger for the non-reacting phenol gas assumption. The convective heat fluxcomponent due to the translational/rotational mode is larger for the equilibrium pyrolysis gas assumptioncompared to the non-reacting gas assumption for the 76.0 km and 73.5 km altitude conditions. The vibra-tional/electronic/electron component is relatively small for both assumptions at the conditions consideredin this study.
The removal of charred carbon due to the oxidation reactions and the flow of pyrolysis gas across thesurface produce a mass blowing along the Stardust forebody. Figure 7 presents the total mass blowing alongthe forebody surface. The figure also presents the components due to the flow of pyrolysis gas and theconsumption of charred carbon by the oxidation reactions. Figure 7(a) shows that the total mass blowingrate calculated using the non-reacting pyrolysis gas assumption is overall larger than the rate obtained withthe equilibrium pyrolysis gas assumption. One interesting result is that the total blowing rate actuallydecreases when the altitude decreases from 78.5 km to 76.0 km for both pyrolysis gas assumptions. Thisresult is counter-intuitive since the blowing rate is expected to actually increase because the heat flux andsurface temperature increase. However, as previously mentioned, since the solution for the 81.0 km is usedas the starting point for this trajectory analysis, it is implicitly assumed that the ablation process does notbegin until some point right after the 81.0 km point. As a result, the blowing rate reaches a peak at a timebetween the 81.0 km and 78.5 km points, decreases once the ablation process begins, and then increasesdue to the increase in heat flux and temperature. This is physically unrealistic and similar to the overall
9 of 14
American Institute of Aeronautics and Astronautics
Dow
nloa
ded
by U
NIV
ER
SIT
Y O
F M
ICH
IGA
N o
n A
pril
1, 2
014
| http
://ar
c.ai
aa.o
rg |
DO
I: 1
0.25
14/6
.201
3-26
34
(a) Total (b) Translational/rotational mode
(c) Vibrational/electronic/electron mode (d) Diffusive
Figure 6. Convective heat transfer components along the Stardust forebody.
10 of 14
American Institute of Aeronautics and Astronautics
Dow
nloa
ded
by U
NIV
ER
SIT
Y O
F M
ICH
IGA
N o
n A
pril
1, 2
014
| http
://ar
c.ai
aa.o
rg |
DO
I: 1
0.25
14/6
.201
3-26
34
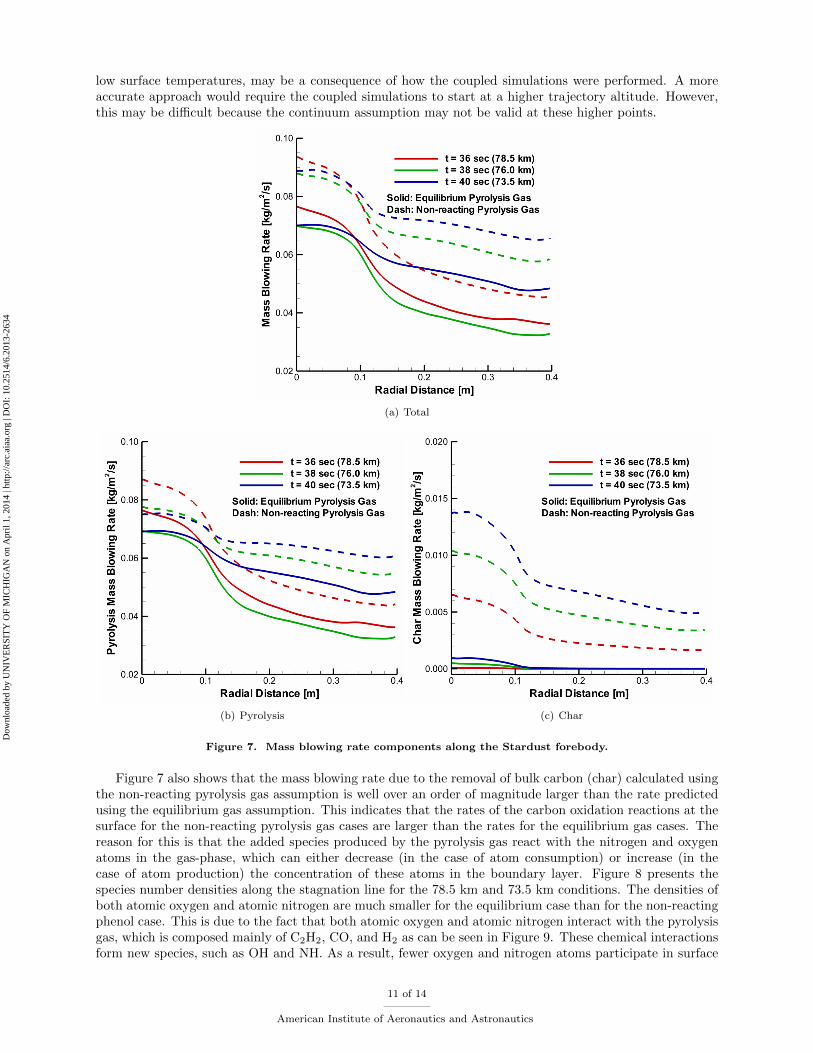
low surface temperatures, may be a consequence of how the coupled simulations were performed. A moreaccurate approach would require the coupled simulations to start at a higher trajectory altitude. However,this may be difficult because the continuum assumption may not be valid at these higher points.
(a) Total
(b) Pyrolysis (c) Char
Figure 7. Mass blowing rate components along the Stardust forebody.
Figure 7 also shows that the mass blowing rate due to the removal of bulk carbon (char) calculated usingthe non-reacting pyrolysis gas assumption is well over an order of magnitude larger than the rate predictedusing the equilibrium gas assumption. This indicates that the rates of the carbon oxidation reactions at thesurface for the non-reacting pyrolysis gas cases are larger than the rates for the equilibrium gas cases. Thereason for this is that the added species produced by the pyrolysis gas react with the nitrogen and oxygenatoms in the gas-phase, which can either decrease (in the case of atom consumption) or increase (in thecase of atom production) the concentration of these atoms in the boundary layer. Figure 8 presents thespecies number densities along the stagnation line for the 78.5 km and 73.5 km conditions. The densities ofboth atomic oxygen and atomic nitrogen are much smaller for the equilibrium case than for the non-reactingphenol case. This is due to the fact that both atomic oxygen and atomic nitrogen interact with the pyrolysisgas, which is composed mainly of C2H2, CO, and H2 as can be seen in Figure 9. These chemical interactionsform new species, such as OH and NH. As a result, fewer oxygen and nitrogen atoms participate in surface
11 of 14
American Institute of Aeronautics and Astronautics
Dow
nloa
ded
by U
NIV
ER
SIT
Y O
F M
ICH
IGA
N o
n A
pril
1, 2
014
| http
://ar
c.ai
aa.o
rg |
DO
I: 1
0.25
14/6
.201
3-26
34
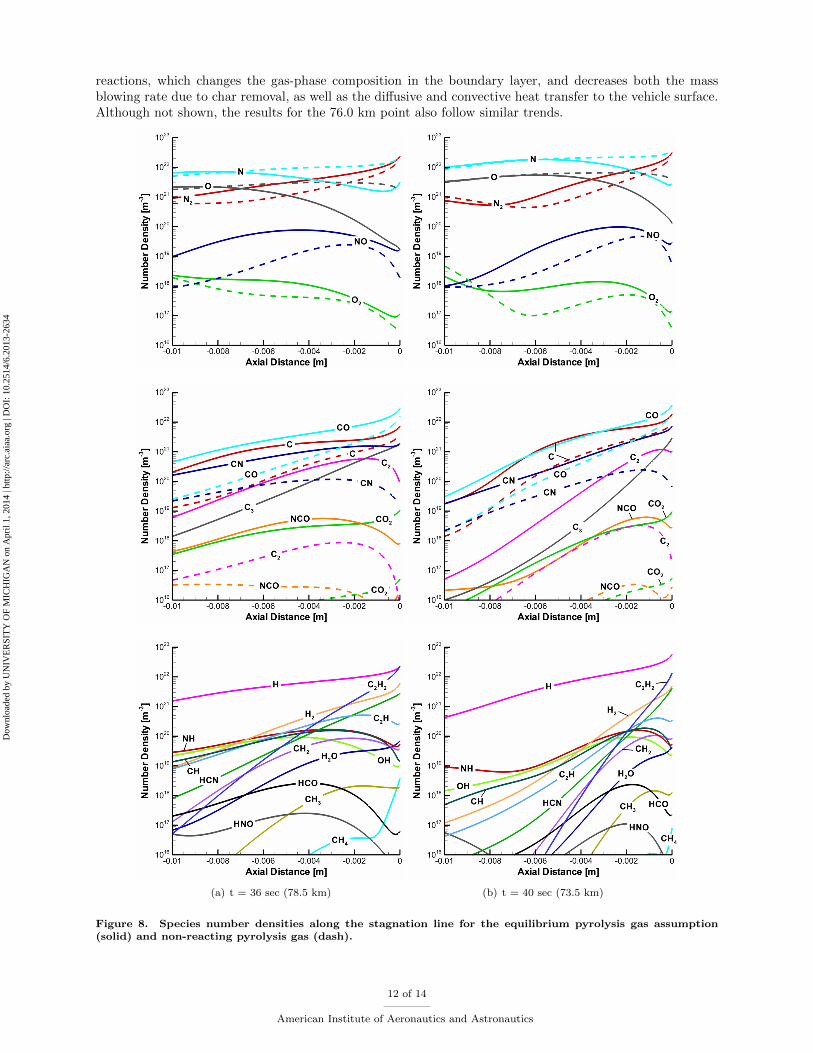
reactions, which changes the gas-phase composition in the boundary layer, and decreases both the massblowing rate due to char removal, as well as the diffusive and convective heat transfer to the vehicle surface.Although not shown, the results for the 76.0 km point also follow similar trends.
(a) t = 36 sec (78.5 km) (b) t = 40 sec (73.5 km)
Figure 8. Species number densities along the stagnation line for the equilibrium pyrolysis gas assumption(solid) and non-reacting pyrolysis gas (dash).
12 of 14
American Institute of Aeronautics and Astronautics
Dow
nloa
ded
by U
NIV
ER
SIT
Y O
F M
ICH
IGA
N o
n A
pril
1, 2
014
| http
://ar
c.ai
aa.o
rg |
DO
I: 1
0.25
14/6
.201
3-26
34
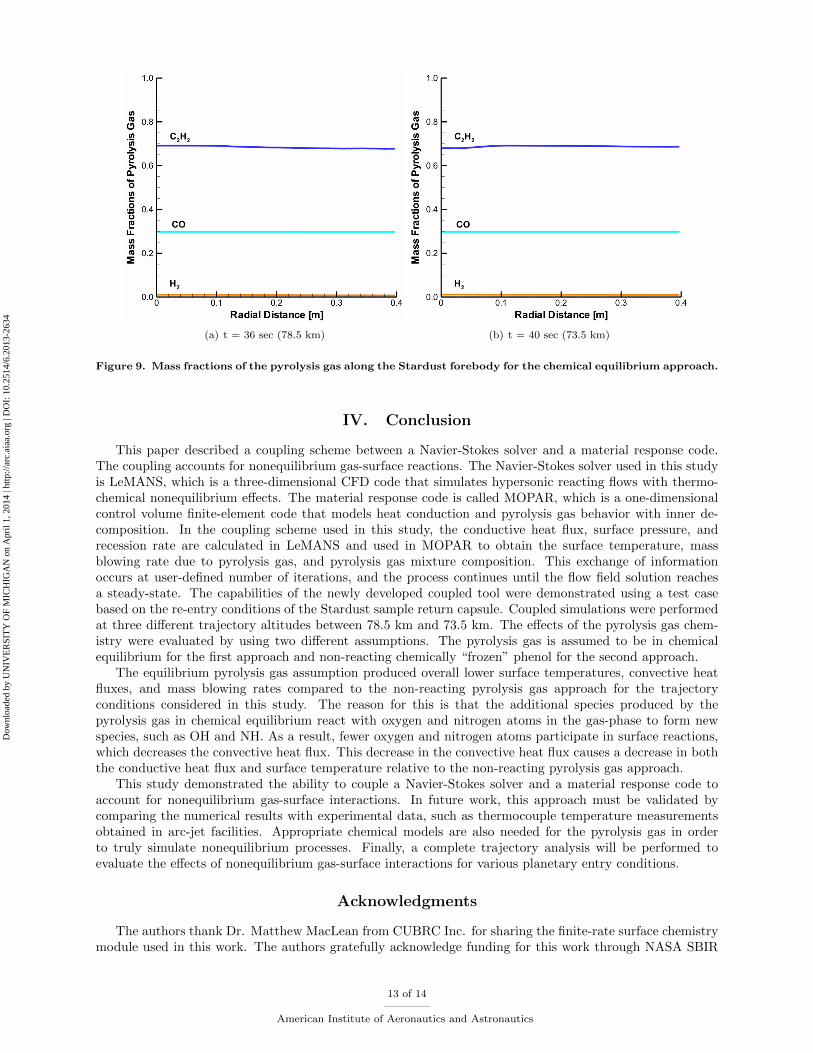
(a) t = 36 sec (78.5 km) (b) t = 40 sec (73.5 km)
Figure 9. Mass fractions of the pyrolysis gas along the Stardust forebody for the chemical equilibrium approach.
IV. Conclusion
This paper described a coupling scheme between a Navier-Stokes solver and a material response code.The coupling accounts for nonequilibrium gas-surface reactions. The Navier-Stokes solver used in this studyis LeMANS, which is a three-dimensional CFD code that simulates hypersonic reacting flows with thermo-chemical nonequilibrium effects. The material response code is called MOPAR, which is a one-dimensionalcontrol volume finite-element code that models heat conduction and pyrolysis gas behavior with inner de-composition. In the coupling scheme used in this study, the conductive heat flux, surface pressure, andrecession rate are calculated in LeMANS and used in MOPAR to obtain the surface temperature, massblowing rate due to pyrolysis gas, and pyrolysis gas mixture composition. This exchange of informationoccurs at user-defined number of iterations, and the process continues until the flow field solution reachesa steady-state. The capabilities of the newly developed coupled tool were demonstrated using a test casebased on the re-entry conditions of the Stardust sample return capsule. Coupled simulations were performedat three different trajectory altitudes between 78.5 km and 73.5 km. The effects of the pyrolysis gas chem-istry were evaluated by using two different assumptions. The pyrolysis gas is assumed to be in chemicalequilibrium for the first approach and non-reacting chemically “frozen” phenol for the second approach.
The equilibrium pyrolysis gas assumption produced overall lower surface temperatures, convective heatfluxes, and mass blowing rates compared to the non-reacting pyrolysis gas approach for the trajectoryconditions considered in this study. The reason for this is that the additional species produced by thepyrolysis gas in chemical equilibrium react with oxygen and nitrogen atoms in the gas-phase to form newspecies, such as OH and NH. As a result, fewer oxygen and nitrogen atoms participate in surface reactions,which decreases the convective heat flux. This decrease in the convective heat flux causes a decrease in boththe conductive heat flux and surface temperature relative to the non-reacting pyrolysis gas approach.
This study demonstrated the ability to couple a Navier-Stokes solver and a material response code toaccount for nonequilibrium gas-surface interactions. In future work, this approach must be validated bycomparing the numerical results with experimental data, such as thermocouple temperature measurementsobtained in arc-jet facilities. Appropriate chemical models are also needed for the pyrolysis gas in orderto truly simulate nonequilibrium processes. Finally, a complete trajectory analysis will be performed toevaluate the effects of nonequilibrium gas-surface interactions for various planetary entry conditions.
Acknowledgments
The authors thank Dr. Matthew MacLean from CUBRC Inc. for sharing the finite-rate surface chemistrymodule used in this work. The authors gratefully acknowledge funding for this work through NASA SBIR
13 of 14
American Institute of Aeronautics and Astronautics
Dow
nloa
ded
by U
NIV
ER
SIT
Y O
F M
ICH
IGA
N o
n A
pril
1, 2
014
| http
://ar
c.ai
aa.o
rg |
DO
I: 1
0.25
14/6
.201
3-26
34
Phase II Contract NNX11CA27C. The use of supercomputers through the NASA Advanced SupercomputingDivision was essential to this work and is also greatly appreciated.
References
1Scalabrin, L. C., Numerical Simulation of Weakly Ionized Hypersonic Flow over Reentry Capsules, Ph.D. thesis, Uni-versity of Michigan, 2007.
2Martin, A., Scalabrin, L. C., and Boyd, I. D., “High Performance Modeling of Atmospheric Re-entry Vehicles,” Journalof Physics: Conference Series, Vol. 341, No. 1, 2012, Article 012002.
3Alkandry, H., Farbar, E. D., and Boyd, I. D., “Evaluation of Finite-Rate Surface Chemistry Models for Simulation of theStardust Reentry Capsule,” AIAA Paper 2012-2874 , June 2012.
4Martin, A. and Boyd, I. D., “Non-Darcian Behavior of Pyrolysis Gas in a Thermal Protection System,” Journal ofThermophysics and Heat Transfer , Vol. 24, No. 1, January-March 2010, pp. 60–68.
5Martin, A. and Boyd, I. D., “Implicit Implementation of Material Response and Moving Meshes for Hypersonic Re-EntryAblation,” AIAA Paper 2009-670 , January 2009.
6Martin, A. and Boyd, I. D., “Strongly Coupled Computation of Material Response and Nonequilibrium Flow for Hyper-sonic Ablation,” AIAA Paper 2009-3597 , June 2009.
7Wilke, C. R., “A Viscosity Equation for Gas Mixtures,” Journal of Chemical Physics, Vol. 18 No. 4, 1950, pp. 517–519.8Blottner, F. G., Johnson, M., and Ellis, M., “Chemically Reacting Viscous Flow Program for Multi-Component Gas
Mixtures,” Tech. rep., SC-RR-70-754, Sandia Laboratories, Albuquerque, New Mexico, 1971.9Vincenti, W. G. and Kruger, C. H., Introduction to Physical Gas Dynamics, Krieger Publishing Company, 2002.
10Sutton, K. and Gnoffo, P. A., “Multi-Component Diffusion with Application to Computational Aerothermodynamics,”AIAA Paper 1998-2575 , June 1998.
11MacCormack, R. W. and Candler, G. V., “The Solution of the Navier-Stokes Equations using Gauss-Seidel Line Relax-ation,” Computers and Fluids, Vol. 17, 1989, pp. 135–150.
12Martin, A. and Boyd, I. D., “Mesh Tailoring for Strongly Coupled Computation of Ablative Material in NonequilibriumHypersonic Flow,” AIAA Paper 2010-5062 , June 2010.
13Zhang, H., Reggio, M., Trepanier, J. Y., and Camarero, R., “Discrete Form of the GCL for Moving Meshes and itsImplementation in CFD Schemes,” Computers and Fluids, Vol. 22, No. 1, January 1993, pp. 9–23.
14Karypis, G. and Kumar, V., “METIS: A Software Package for Partitioning Unstructured Graphs, Partitioning Meshes,and Computing Fill-Reducing Orderings of Sparse Matrices,” University of Minnesota, 1998.
15Marschall, J. and MacLean, M., “Finite-Rate Surface Chemistry Model, I: Formulation and Reaction System Examples,”AIAA Paper 2011-3783 , June 2011.
16MacLean, M., Marschall, J., and Driver, D. M., “Finite-Rate Surface Chemistry Model, II: Coupling to Viscous Navier-Stokes Code,” AIAA Paper 2011-3784 , June 2011.
17Amar, A. J., Modeling of One-Dimensional Ablation with Porous Flow Using Finite Control Volume Procedure, Master’sthesis, North Carolina State University, 2006.
18Blackwell, B. F. and Hogan, R. E., “One-Dimensional Ablation Using Landau Transformation and Finite Control VolumeProcedure,” Journal of Thermophysics and Heat Transfer , Vol. 8, No. 2, April-June 1994, pp. 282–287.
19Martin, A., “Modeling of Chemical Nonequilibrium Effects in a Charring Ablator,” AIAA Paper 2013-0301 , January2013.
20Tran, H. K., Johnson, C. E., Rasky, D. J., Hui, F. C. L., Hsu, M.-T., and Chen, Y. K., “Phenolic Impregnated CarbonAblators (PICA) for Discovery class missions,” AIAA Paper 1996-1911 , June 1996.
21Trumble, K. A., Cozmuta, I., Sepka, S., Jenniskens, P., and Winter, M., “Postflight Aerothermal Analysis of StardustSample Return Capsule,” Journal of Spacecraft and Rockets, Vol. 47, No. 5, September-October 2010, pp. 765–774.
22Martin, A. and Boyd, I. D., “CFD Implementation of a Novel Carbon-Phenolic-in-Air Chemistry Model for AtmosphericRe-entry,” AIAA Paper 2011-143 , January 2011.
23Lachaud, J., Martin, A., Cozmuta, I., and Laub, B., “Ablation test-case series 1,” 4th AFOSR/SNL/NASA AblationWorkshop, 2010.
24Driver, D. M., Olson, M. W., Barnhardt, M. D., and MacLean, M., “Understanding High Recession Rates of CarbonAblators Seen in Shear Tests in an Arc Jet,” AIAA Paper 2010-1177 , January 2010.
25Driver, D. M. and MacLean, M., “Improved Predictions of PICA Recession in Arc Jet Shear Tests,” AIAA Paper2011-141 , January 2011.
26Winter, M. W. and Trumble, K. A., “Near-Ultraviolet Emission Spectroscopy During an Airborne Observation of theStardust Reentry,” Journal of Spacecraft and Rockets, Vol. 48, No. 1, January-February 2011, pp. 59–71.
27Boyd, I. D., Trumble, K. A., and Wright, M. J., “Modeling of Stardust Entry at High Altitude, Part 1: FlowfieldAnalysis,” Journal of Spacecraft and Rockets, Vol. 47, No. 5, September-October 2010, pp. 708–717.
14 of 14
American Institute of Aeronautics and Astronautics
Dow
nloa
ded
by U
NIV
ER
SIT
Y O
F M
ICH
IGA
N o
n A
pril
1, 2
014
| http
://ar
c.ai
aa.o
rg |
DO
I: 1
0.25
14/6
.201
3-26
34