
COUNTY OF SAN DIEGO AFFORDABLE HOUSING … Housing Phase II Feasibility Analysis Page i Final AFH...
66
COUNTY OF SAN DIEGO AFFORDABLE HOUSING PHASE II FEASIBILITY ANALYSIS SAN DIEGO, CALIFORNIA FINAL Prepared for: County of San Diego Department of General Services 5560 Overland Avenue, Suite 410 San Diego, CA 92123 Prepared by: AECOM 401 West A Street, Suite 1200 San Diego, California 92101 Phone: (619) 610-7600 Fax: (619) 610-7601 February 2018
Transcript of COUNTY OF SAN DIEGO AFFORDABLE HOUSING … Housing Phase II Feasibility Analysis Page i Final AFH...

COUNTY OF SAN DIEGO AFFORDABLE HOUSING PHASE II
FEASIBILITY ANALYSIS SAN DIEGO, CALIFORNIA
FINAL
Prepared for:
County of San Diego Department of General Services
5560 Overland Avenue, Suite 410 San Diego, CA 92123
Prepared by:
AECOM 401 West A Street, Suite 1200 San Diego, California 92101
Phone: (619) 610-7600 Fax: (619) 610-7601
February 2018


Affordable Housing Phase II Feasibility Analysis Page i Final AFH Phase II Feasibility Analysis 02-09-18.doc 2/9/2018
TABLE OF CONTENTS
Chapter Page
ACRONYMS AND ABBREVIATIONS ...................................................................................... iii
CHAPTER 1.0 EXECUTIVE SUMMARY ................................................................................... 1 1.1 Feasibility Analysis Overview ................................................................................ 1 1.2 Findings and Recommendations ............................................................................. 1
1.2.1 Neighborhood Amenities, Land Use, and Zoning .......................................1 1.2.2 Housing Policy and Program Context..........................................................2 1.2.3 Development Prototypes and Feasibility .....................................................3 1.2.4 Key Recommendations ................................................................................4
CHAPTER 2.0 INTRODUCTION ................................................................................................. 7 2.1 Overview and Purpose ............................................................................................ 7 2.2 Document Organization .......................................................................................... 8
CHAPTER 3.0 NEIGHBORHOOD AMENITIES, LAND USE, AND ZONING ...................... 11 3.1 Superior Court Family Court Building ................................................................. 11
3.1.1 Neighborhood Amenities ...........................................................................11 3.1.2 Land Use and Zoning .................................................................................15
3.2 Sheriff Regional Crime Lab .................................................................................. 18 3.2.1 Neighborhood Amenities ...........................................................................19 3.2.2 Land Use and Zoning .................................................................................20
3.3 Affordable Housing Bonuses and Incentives ........................................................ 23
CHAPTER 4.0 HOUSING POLICY AND PROGRAM OPTIONS AND FUNDING ............... 25 4.1 City of San Diego Demographic and Housing Issues Overview .......................... 25 4.2 Housing Policy and Program Options................................................................... 26
4.2.1 City of San Diego Housing Element ..........................................................26 4.2.2 City of San Diego Consolidated Plan ........................................................28
4.3 Funding Sources and Programs ............................................................................ 29
CHAPTER 5.0 FINANCIAL FEASIBILITY ANALYSIS .......................................................... 41
CHAPTER 6.0 LITERATURE CITED ........................................................................................ 47 APPENDIX A – PRO FORMA TABLES

Page ii Affordable Housing Phase II Feasibility Analysis Final AFH Phase II Feasibility Analysis 02-09-18.doc 2/9/2018
LIST OF FIGURES
Figure Page Figure 2-1 Superior Court Family Court Division Site Location ............................................. 9 Figure 2-2 Crime Lab Site Location ....................................................................................... 10 Figure 3-1 Family Court Neighborhood Amenities................................................................ 13 Figure 3-2 Crime Lab Neighborhood Amenities .................................................................... 21 Figure 4-1 Family Court TCAC Nearby Scoring Amenities .................................................. 33 Figure 4-2 Sheriff’s Crime Lab TCAC Nearby Scoring Amenities ....................................... 34 Figure 4-3 Family Court Affordable Housing and Sustainable Communities
Locational Scoring ................................................................................................ 37 Figure 4-4 Crime Lab Affordable Housing and Sustainable Communities Locational
Scoring .................................................................................................................. 38
LIST OF TABLES
Table Page Table 1-1 Summary Financial Feasibility Findings ........................................................................ 4 Table 3-1 Family Court: Site Overview ........................................................................................ 11 Table 3-2 Family Court: Neighborhood Amenities (0.5 miles) .................................................... 12 Table 3-3 Family Court: Transportation Amenities ...................................................................... 15 Table 3-4 Family Court: Potential Residential Uses Allowed (Base Zone) ................................. 16 Table 3-5 Family Court: Site Overlay Zones (City of San Diego) ............................................... 17 Table 3-6 Crime Lab: Site Overview ............................................................................................ 18 Table 3-7 Crime Lab: Neighborhood Amenities (0.5 miles) ........................................................ 19 Table 3-8 Crime Lab: Transportation Amenities .......................................................................... 20 Table 3-9 Crime Lab: Potential Residential Uses Allowed (Base Zone) ..................................... 23 Table 4-1 City of San Diego Population, Households, and Median Income Trends .................... 25 Table 4-2 RHNA City of San Diego Allocation ........................................................................... 27 Table 4-3 City of San Diego Con Plan Housing Needs (2010) .................................................... 29 Table 4-4 Expected HUD Funding for FY 2018 .......................................................................... 30 Table 4-5 TCAC Score Thresholds (2017) ................................................................................... 31

Affordable Housing Phase II Feasibility Analysis Page iii Final AFH Phase II Feasibility Analysis 02-09-18.doc 2/9/2018
ACRONYMS AND ABBREVIATIONS AB Assembly Bill AHSC Affordable Housing and Sustainable Communities AIDS acquired immunodeficiency syndrome ALUCP Airport Land Use Compatibility Plan AMI Area Median Income AMSL above mean sea level CAP Climate Action Plan CCIP California Climate Investments Program CCPD-NC Centre City Planned District, Neighborhood Mixed-Use Center CDBG Community Development Block Program CDLAC California Debt Limit Allocation Committee CHAS Comprehensive Housing Affordability Strategy CNEL Community Noise Equivalent Level CO-1-2 Commercial Office Con Plan City of San Diego Housing Element and Consolidated Plan County County of San Diego CPIOZ Community Plan Implementation Overlay Zone Crime Lab Sherriff’s Regional Crime Lab DAC Disadvantage Communities dB decibel DCP Downtown Community Plan ESG Emergency Shelter Grant Program FAA Federal Aviation Administration Family Court San Diego Superior Court Family Court Building FAR floor area ratio FY fiscal year GHG greenhouse gas HCD California Department of Housing and Community Development HHSA County of San Diego Health and Human Services Agency HIV human immunodeficiency virus HOME HOME Investments Partnership Program HOPWA Housing Opportunities for Persons with AIDS HCD State Housing and Community Development Department HUD U.S. Department of Housing and Urban Development IRR internal rate of return

Page iv Affordable Housing Phase II Feasibility Analysis Final AFH Phase II Feasibility Analysis 02-09-18.doc 2/9/2018
LIHTC Low-Income Housing Tax Credits M million ($) MHSA Mental Health Services Act MT Mount MTS Metropolitan Transit System QRRP California Tax Credit Allocation Committee Qualified Residential
Rental Project RFP Request for Proposals RFSQ Request for Statement of Qualifications RHNA Regional Housing Needs Assessment SANDAG San Diego Association of Governments SCS Sustainable Communities Strategy SNHP Local Government Special Needs Housing Program TCAC California Tax Credit Allocation Committee TDM Transportation Demand Management TERPS Terminal Instrument Procedures TPA Transit Priority Area TSS Threshold Siting Surfaces

Affordable Housing Phase II Feasibility Analysis Page 1 Final AFH Phase II Feasibility Analysis 02-09-18.doc 2/9/2018
CHAPTER 1.0 EXECUTIVE SUMMARY
1.1 FEASIBILITY ANALYSIS OVERVIEW The County of San Diego (County) has been asked by the County Board of Supervisors to create a plan for redeveloping two excess County-owned properties in the City of San Diego. These two sites, shown on Figures 2-1 and 2-2, are the former San Diego Superior Court Family Court Building (“Family Court”) located at 1501 and 1555 Sixth Avenue in Downtown San Diego and Sheriff’s Regional Crime Lab (“Crime Lab”) located at 5255 Mount (Mt.) Etna Drive in the Clairemont Mesa neighborhood. In order to initiate this process, AECOM was retained by the County to prepare this Phase II Feasibility Analysis. The intent of this analysis is to provide the County with a comprehensive understanding of the development context and provide potential developer partners with much of the pre-development feasibility analysis that they will need to evaluate the two sites. In this way, the County hopes to accelerate the development process by providing greater certainty to potential development partners. Information, findings, and recommendations from this analysis will be incorporated into a Request for Statement of Qualifications (RFSQ) to be issued by the County in the Spring of 2018, followed by Requests for Proposals (RFP) to be issued to a short list of developers selected from the RFSQ process. The final selected developer or developers from the RFP process will partner with the County to develop the two sites. The final built projects will help meet demand for affordable housing in San Diego, and assist in furthering the revitalization of the surrounding neighborhoods.
1.2 FINDINGS AND RECOMMENDATIONS
1.2.1 Neighborhood Amenities, Land Use, and Zoning
Family Court Site
The Family Court site is located in the community of Downtown/Centre City, specifically
the Cortez neighborhood.

Page 2 Affordable Housing Phase II Feasibility Analysis Final AFH Phase II Feasibility Analysis 02-09-18.doc 2/9/2018
This site is located in neighborhood rich with amenities for future site occupants, including numerous retail, service and transit options within 0.5 miles of the site.
The base zoning at the site is CCPD-NC Centre City Planned District, Neighborhood Mixed Use Center and allows a range of residential uses.
A minimum of 80 percent of the ground-floor street frontage must contain active
commercial uses, unless the property is rezoned.
The Family Court site development intensity is restricted because of the proximity to the San Diego International Airport and location within the Airport Approach Zone and the
3SE Safety Zone.
A maximum allowable residential density of 185 dwelling units and 49,300 square feet of nonresidential capacity (assumes retail occupancy), as defined in the San Diego International Airport Land Use Compatibility Plan (ALUCP), at the 0.69 acre Family
Court site.
The Airport Approach Zone requirements in San Diego Municipal Code Section 132.0205 states that permanent structures cannot be located within 50 feet of the Threshold Siting Surfaces (TSS); therefore the estimated maximum height of future structures is 172 feet above ground level at the highest elevation of the site.
Crime Lab Site
The site is identified as Commercial Office in the Community Core in the current community plan, which does not allow for residential development (City of San Diego 2011). Future residential development proposed prior to the completion of the current community plan update would require a Plan Amendment, if a discretionary action is
required.
Western Clairemont Mesa has a height overlay that limits buildings to 30 feet at the site (San Diego Municipal Code Section 101.0452.5). An exception to this overlay can be applied for as long as the new structure is compatible with surrounding one, two, or three-story structures.
1.2.2 Housing Policy and Program Context
San Diego County is facing a severe housing affordability crisis, particularly for lower-income households and people with special housing needs such as veterans, seniors, homeless or at risk of homelessness, persons with disabilities, at-risk youth, the formerly

Affordable Housing Phase II Feasibility Analysis Page 3 Final AFH Phase II Feasibility Analysis 02-09-18.doc 2/9/2018
homeless, single-parent, female-headed households and seniors. The County’s Consolidated Plan (Con Plan), County’s General Plan Housing Element, and the City of San Diego’s Housing Element are the primary housing policy documents detailing housing needs by household type and incomes levels, as well as setting forth policies and
programs to address these needs.
A variety of housing funding programs exist to support the development of affordable
housing, including most importantly:
o Federal and State Low Income Housing Tax Credits (4 and 9 percent)
o State Housing and Community Development Department (HCD) Funding
Programs such as HOME Investments Partnership Program (HOME)
o Local Government Special Needs Housing Program (SNHP)
o Affordable Housing and Sustainable Communities (AHSC) Program
1.2.3 Development Prototypes and Feasibility AECOM prepared a series of financial feasibility pro formas to test various hypothetical residential and mixed-use development programs for the two sites. The pro formas incorporate cost and revenue assumptions and inputs from comparable recent developer pro formas, as well as from secondary sources such as CoStar, RS Means, and affordable housing finance sources such as HUD, California Department of Housing and Community Development (HCD) and California Tax Credit Allocation Committee (TCAC).
Alternative development scenarios were developed for the two sites based on the land use, zoning and planning analysis presented in this document. In each case, the development programs would be permitted within existing land use and zoning regulations either by right, with deviations, or with a variance and/or discretionary permits. Family Court Site The Family Court site’s development potential is constrained by a number of local plans, overlay districts, and regulations. The basic development scenario tested for this analysis assumes 100 total residential dwelling units with 40 percent of the total ground floor area set aside for commercial retail uses. This is well within already permitted density, height and floor area ratio (FAR) limits for the site, and there may opportunities for further densification. This prototype conservatively assumes a four to five story wood frame building over a concrete podium with structured “half-down” parking.

Page 4 Affordable Housing Phase II Feasibility Analysis Final AFH Phase II Feasibility Analysis 02-09-18.doc 2/9/2018
In addition, a higher density prototype was tested for this site with a total of 185 units. This prototype would maximize the development potential of the site, but would bring higher costs associated with a concrete or steel-frame construction type. Crime Lab Site The Crime Lab site will require a discretionary action in order for residential development to occur. The hypothetical rental development program developed for this site assumes a maximum of 116 residential units with a 10,000 square foot neighborhood serving retail component. The residential and retail components of the development are served by surface parking. In addition, a lower density for-sale prototype was tested for this site that assumes a maximum of 15 dwelling units to the acre for attached townhomes.
Summary financial feasibility findings for the two sites are presented below in Table 1-1.
Table 1-1 Summary Financial Feasibility Findings
1.2.4 Key Recommendations
Family Court Site Based on the three prototypes examined for this site, the following recommendations are provided to suggest specific ways that the County can work in advance of or during the

Affordable Housing Phase II Feasibility Analysis Page 5 Final AFH Phase II Feasibility Analysis 02-09-18.doc 2/9/2018
RFSQ/RFP developer solicitations process to enhance the feasibility of mixed-income and affordable development and in the process create greater value for the County and more certainty for potential developer partners: 1) Consider removing the ground floor commercial requirement for the property in favor of a
requirement that provides greater flexibility to the development community while still
activating the street.
2) Consider underwriting the cost of demolition, including any related environmental testing
and analysis that needs to take place for the site to be development ready.
3) Consider allowing greater flexibility in terms of options for satisfying local parking requirements (including for ground floor commercial uses). This may include shared parking,
car sharing services or accommodations for alternative transportation modes.
4) Finally, the County may wish to work with the City and Civic San Diego to clarify and streamline the development entitlements process for the site in advance of selecting a developer partner.
Crime Lab Site Based on the four prototypes examined for this site, the following recommendations are provided to suggest specific ways that the County can work in advance of or during the RFSQ/RFP developer solicitations process to enhance the feasibility of all the development types analyzed, but particularly the rental housing prototypes. Specifically, the County should:
1) Work proactively to change local land use controls (i.e. community plan amendment) and zoning to permit residential development on the site, and higher densities than would currently be possible. This would increase the likelihood of feasibility for a potential
development partner, and result in higher land values for the County.
2) Consider underwriting the cost of demolition, including any related environmental testing
and analysis that needs to take place for the site to be development ready.
3) Allow developers the flexibility to mix market-rate and affordable projects on the site,
including rental and for-sale housing, while maintaining the ground lease.
4) Encourage strategies for mixed-use development that provides neighborhood retail, services and other community amenities to the site, in order to enhance its attractiveness as a residential location.

Page 6 Affordable Housing Phase II Feasibility Analysis Final AFH Phase II Feasibility Analysis 02-09-18.doc 2/9/2018
This page intentionally left blank.

Affordable Housing Phase II Feasibility Analysis Page 7 Final AFH Phase II Feasibility Analysis 02-09-18.doc 2/9/2018
CHAPTER 2.0 INTRODUCTION
2.1 OVERVIEW AND PURPOSE The County of San Diego (County) has been asked by the County Board of Supervisors to create a plan for redeveloping two excess County-owned properties in the City of San Diego. These two sites, shown on Figures 2-1 and 2-2, are the former San Diego Superior Court Family Court Building (“Family Court”) located at 1501 and 1555 Sixth Avenue in Downtown San Diego and Sheriff’s Regional Crime Lab (“Crime Lab”) located at 5255 Mount (Mt.) Etna Drive in the Clairemont Mesa neighborhood. The County has been asked to develop a plan and strategy for partnering with one or more local developers to create new affordable and mixed-income residential communities on the two sites. In order to initiate this process, AECOM was retained by the County to prepare this Phase II Feasibility Analysis. The purpose of this analysis is to inform the County on feasible development alternatives for the two sites and provide needed pre-development due diligence information that will be incorporated into a Request for Statement of Qualifications (RFSQ) to be issued by the County in Spring of 2018. The RFSQ will be followed by two separate Requests for Proposals (RFP) to be issued to a short list of developers selected from the RFSQ process. The final selected developers from the RFP process will partner with the County to develop the two sites, and assist in satisfying demand for residential development and revitalizing the surrounding neighborhoods. The intent of this analysis is to provide the County with a comprehensive understanding of the development context and provide potential developer partners with much of the pre-development feasibility analysis that will be needed as they evaluate the two sites. In this way, the County hopes to accelerate the development process by providing greater certainty to potential development partners. Given the overall housing affordability crisis affecting San Diego County, this analysis focuses primarily on residential development options for the sites, and in particular affordable housing development alternatives serving low and very low income households as defined by the State Housing and Community Development Department (HCD).1 The County is especially interested in the development potential for new housing targeted to populations with special needs such as the formerly homeless, veterans, and seniors. This analysis is not intended to limit or constrain 1 Very low income: 30 to 50 percent AMI, Low income: 51 to 80 percent AMI (http://www.hcd.ca.gov/grants-funding/income-
limits/index.shtml)

Page 8 Affordable Housing Phase II Feasibility Analysis Final AFH Phase II Feasibility Analysis 02-09-18.doc 2/9/2018
creative development strategies that developers may formulate through the RFSQ/RFP process. Rather the analysis is meant to inform and guide the County and development community as to the various affordable and mixed-income residential and mixed-use development options that are potentially feasible on the two sites given the general land use and planning, policy, market, and financial feasibility context.
2.2 DOCUMENT ORGANIZATION Following this introduction, the following analysis is organized into the following chapters: Chapter 3.0 Neighborhood Amenities, Land Use, and Zoning Chapter 4.0 Housing Policy and Program Options and Funding Chapter 5.0 Financial Feasibility Analysis Chapter 6.0 Literature Cited

1 inch = 200 feet1:2,400
0 140 28070ft
I
LegendSite Boundary
Site 100-ft Buffer
Parcel Boundary
AECOM San Diego P:\projects\_6054\60540239_SD_County_DG\900-CAD-GIS\920 GIS\map_docs\mxd\Surplus_Prop_Assess\planned_landuse_mapbook.mxd, 1/29/2018, ardeshir.beheshti
Sources: ESRI; SanGIS.
Figure 2-1Superior Court Family Court Division
Site Location

1 inch = 200 feet1:2,400
0 140 28070ft
I
LegendSite Boundary
Site 100-ft Buffer
Parcel Boundary
AECOM San Diego P:\projects\_6054\60540239_SD_County_DG\900-CAD-GIS\920 GIS\map_docs\mxd\Surplus_Prop_Assess\planned_landuse_mapbook.mxd, 1/29/2018, ardeshir.beheshti
Sources: ESRI; SanGIS.
Figure 2-2Sheriff Regional Crime Lab
Site Location

Affordable Housing Phase II Feasibility Analysis Page 11 Final AFH Phase II Feasibility Analysis 02-09-18.doc 2/9/2018
CHAPTER 3.0 NEIGHBORHOOD AMENITIES, LAND USE, AND ZONING
In 2017, AECOM completed Phase I environmental due diligence and affordable housing development analysis for five surplus County of San Diego (“County”) properties. This effort included a preliminary screening of land use and zoning of the five County-owned project sites, including the two excess properties carried forward for current consideration. The discussion below incorporates the Phase I analysis for the Family Court and Crime Lab sites, as well as expanded discussion of neighborhood amenities and land use and zoning processes. This chapter also includes a summary of affordable housing density bonus and incentives applicable to the two sites.
3.1 SUPERIOR COURT FAMILY COURT BUILDING
The Family Court site is located on the western half of a downtown city block, owned by the County of San Diego, and within the City of San Diego. See Table 3-1 below for a site overview. A portion of this property was purchased by the County of San Diego on November 6, 1987, with the remainder acquired on September 18, 1991. The existing Family Court functions were relocated to the new downtown courthouse in early 2018, and the site is now vacant and available for redevelopment. The existing structure would require demolition prior to future development.
Table 3-1 Family Court: Site Overview
Site Address APN Size Land Use Zoning Timeframe Available
1501 and 1555 Sixth Ave.
534-014-04 534-014-12
0.69 acres Neighborhood Mixed-Use Center
CCPD-NC: Centre City Planned District, Neighborhood Mixed-Use Center Overlay Zones: Main Street, Transit Area, Residential Tandem Parking, Airport Influence Area, Airport Approach
Summer 2018
3.1.1 Neighborhood Amenities
The Family Court site is located in the community of Downtown/Centre City, specifically the Cortez neighborhood. This neighborhood is one of the oldest residential neighborhoods in San Diego with recent redevelopment including a mix of residential and commercial infill. The Family Court site is proximate (within 0.5 miles) to a number of neighborhood amenities for future site occupants. Table 3-2 lists these amenities and Figure 3-1 shows the location of each amenity, which include five markets, 12 medical clinics, three parks, eight pharmacies, nine public or private schools, one weekly farmers market, the Metropolitan Transit System (MTS) Orange Line Trolley, and numerous MTS bus stops.

Page 12 Affordable Housing Phase II Feasibility Analysis Final AFH Phase II Feasibility Analysis 02-09-18.doc 2/9/2018
Table 3-2 Family Court: Neighborhood Amenities (0.5 miles)
Name Location Markets (5 locations)
Heavenly Market 349 W Cedar St Krisp 1036 Seventh Ave Roma Urban Market 555 W. Beech St. Super Value Food 1053 Eight Ave West Cedar Market 412 W Cedar St
Medical Clinics (12 locations) Downtown Family Health Center Connections 1250 6th Ave Downtown Family Health Ctr 1550 Broadway #2 Family Health Ctr Of San Diego 140 Elm St Jane Westin Clinic 1045 Ninth Ave Luis Marquez Inc 1901 Fourth Ave #100 Mueller Community Wellness Ctr 4601 Park Blvd Pacific Medical Care 1501 Fifth Ave, Suite 100 Pacific Neurobehavioral Clinic 1901 1st Ave Sharp Rees Stealy 300 Fir St Sharp Senior Health Ctr 956 Tenth Ave Socal Hand Therapy 1965 Fifth Ave Sun Health Medical Clinics 427 C St
Parks (3 locations) Balboa Park Tweet Park
Horton Plaza Park Pharmacies (8 locations)
Allen Pharmacy 1141 Sixth Ave CVS 510 C St. Leader Drug Store 1376 3rd Ave Rezcare Pharmacy Inc 748 C St Rite Aid 427 Ct St Ste 100 Sharp Rees-Stealy Pharmacy 300 Fir St University Compounding Pharm 1875 Third Ave University Specialty Drugs 1842 Third Ave
Schools (9 locations) Balboa City School (Private K-12) 525 Hawthorn Street City Tree Christian (Private K-8) 320 Date Street King-Chavez Community High (Public grades 9-12) 1010 2nd Ave KIPP Adelante Preparatory Academy (Public grades 5-8) 1475 Sixth Avenue, Second Floor San Diego Business/Leadership (Public grades 9-12) 1405 Park Boulevard San Diego Early/Middle College (Alternative School grades 9-12) 1425 Russ Boulevard, Suite T112-D San Diego International Studies (Public grades 9-12) 1405 Park Boulevard San Diego Science and Technology (Public grades 9-12) 1405 Park Boulevard Washington Elementary (Public grades K-5) 1789 State Street
Weekly Farmers Market (1 location) Little Italy Mercato Farmers’ Market 519 W Cedar St.

"T
"T
"T
"T
"T
"T
"T
"T"T"T"T
"T
"T
"T
")
")
")
")
")
")
")
")
")
")
")
")
")
")
")
")
")
")
")
")
")
")
")
")
")
")
")
")
")
")
")
")
")
")
")
")
")
")
")
")
")
")
")
")
")
")
")
")
")
")
")
")
")
")
")
")
")
")
")
")
")
")
")
")
")
")
")
")
")
")
")
")
")
")
")
")
")
")
")
")
")
")
!( !( !( !(!( !(
!(
!(
!(
!(
!(
!(
!(
!(
!(
!(
!(
!(
!(
!(
!(
!(
!(
!(
!(
!(
!(
!(
!(
!(
!(
!(
!(
!(
!(
!(
!(
!(!(!(!( !(
!(
!(
!(
!(!(!( !(!(
!(!(!(!(
!(
!(
!(
!(
!(
!(!(
!(
!(
!.
Balboa Park
HortonPlaza Park
Tweet StreetMini-Park
Family Court
FIGURE 3-1FAMILY COURT
NEIGHBORHOOD AMENITIESI
600 6000 Feet
1:7,200Scale: 1 in = 600 feet
LEGEND!. Study Site
Half-Mile Buffer
Market
Medical Clinic
Pharmacy
Weekly Farmers Market
"T Public School
"T Private School
!( Transit Stops
Trolley Lines
Bus Lines
Public Park
Path: \\ussdg1fp001.na.aecomnet.com\data\projects\_6056\60562733_DGS_TO22\900-CAD-GIS\920 GIS\map_docs\mxd\FamilyCourt_Businesses.mxd, ardeshir.beheshti, 1/30/2018, 12:10:59 PM
Source: SANDAG 2014; SanGIS 2018; ESRI Business Analyst 2016
DATE: 1/30/2018

Page 14 Affordable Housing Phase II Feasibility Analysis Final AFH Phase II Feasibility Analysis 02-09-18.doc 2/9/2018
This page intentionally left blank.
Affordable Housing Phase II Feasibility Analysis Page 15 Final AFH Phase II Feasibility Analysis 02-09-18.doc 2/9/2018
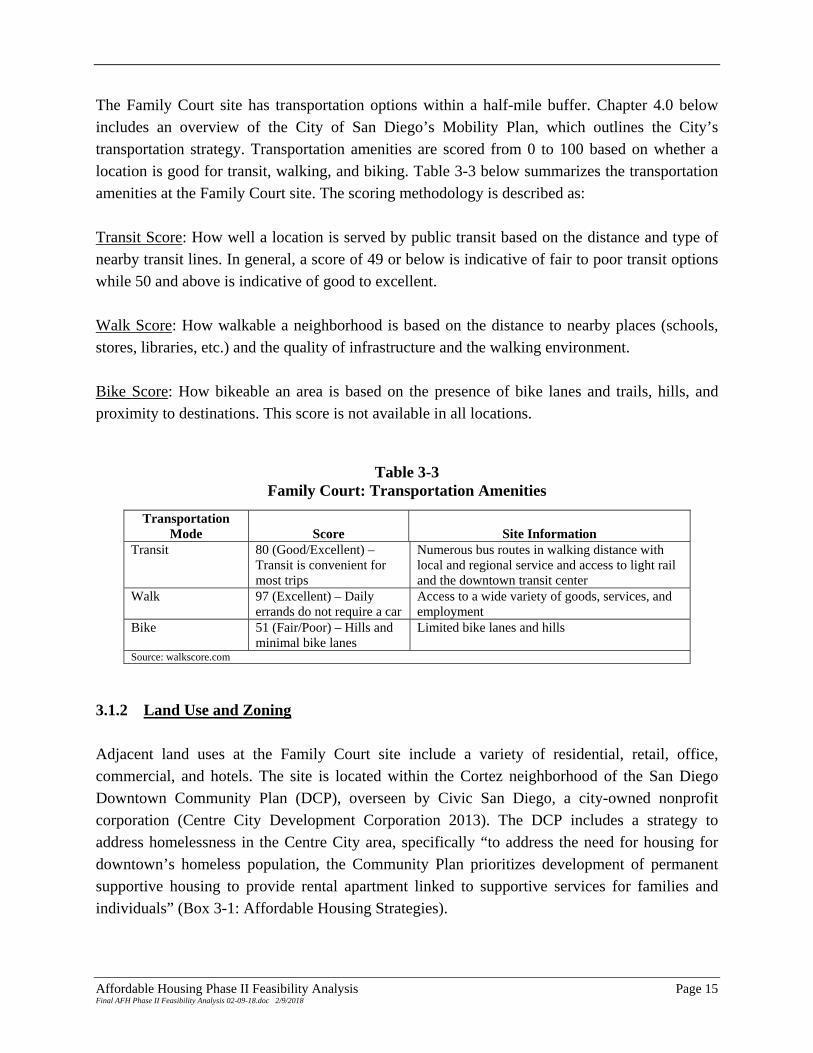
The Family Court site has transportation options within a half-mile buffer. Chapter 4.0 below includes an overview of the City of San Diego’s Mobility Plan, which outlines the City’s transportation strategy. Transportation amenities are scored from 0 to 100 based on whether a location is good for transit, walking, and biking. Table 3-3 below summarizes the transportation amenities at the Family Court site. The scoring methodology is described as: Transit Score: How well a location is served by public transit based on the distance and type of nearby transit lines. In general, a score of 49 or below is indicative of fair to poor transit options while 50 and above is indicative of good to excellent. Walk Score: How walkable a neighborhood is based on the distance to nearby places (schools, stores, libraries, etc.) and the quality of infrastructure and the walking environment. Bike Score: How bikeable an area is based on the presence of bike lanes and trails, hills, and proximity to destinations. This score is not available in all locations.
Table 3-3 Family Court: Transportation Amenities
Transportation Mode Score Site Information
Transit 80 (Good/Excellent) – Transit is convenient for most trips
Numerous bus routes in walking distance with local and regional service and access to light rail and the downtown transit center
Walk 97 (Excellent) – Daily errands do not require a car
Access to a wide variety of goods, services, and employment
Bike 51 (Fair/Poor) – Hills and minimal bike lanes
Limited bike lanes and hills
Source: walkscore.com
3.1.2 Land Use and Zoning Adjacent land uses at the Family Court site include a variety of residential, retail, office, commercial, and hotels. The site is located within the Cortez neighborhood of the San Diego Downtown Community Plan (DCP), overseen by Civic San Diego, a city-owned nonprofit corporation (Centre City Development Corporation 2013). The DCP includes a strategy to address homelessness in the Centre City area, specifically “to address the need for housing for downtown’s homeless population, the Community Plan prioritizes development of permanent supportive housing to provide rental apartment linked to supportive services for families and individuals” (Box 3-1: Affordable Housing Strategies).

Page 16 Affordable Housing Phase II Feasibility Analysis Final AFH Phase II Feasibility Analysis 02-09-18.doc 2/9/2018
The site is planned as a Neighborhood Mixed-Use Center land use within the DCP. This classification ensures development of distinct centers around plazas or “main streets” and supports mixed-use (residential/non-residential) projects that contain active ground floor uses. The proposed affordable housing reuse is compatible with the land use designation of the site. The base zoning at the site is Centre City Planned District, Neighborhood Mixed Use Center (CCPD-NC) and allows a range of residential uses, as shown in Table 3-4 below. The DCP captures development intensity only through floor area ratios (FARs), no separate residential density standards are established.2 The site is subject to the Centre City Development Permitting Process, including transit and parking improvement fees. A Centre City Development Permit is granted if the decision-maker finds that the development is consistent with the Downtown Community Plan, Centre City Planned District Ordinance, Civic San Diego Land Development Manual, San Diego Municipal Code, and all other adopted plans or policies of the City of San Diego pertaining to the Centre City Planned District (San Diego Municipal Code Section 156.0304 (e)(D)).
Table 3-4 Family Court: Potential Residential Uses Allowed (Base Zone)
Allowable Use Type* Baseline Density** Height
Permitted Multiple Dwelling Units, Live/Work Quarters
Maximum FAR: 8.0 Minimum FAR: 5.0
No structure is permitted to permanently encroach within 50 feet of the Federal Aviation Administration (FAA)-established approach path.
Limited Group Living Maximum FAR: 8.0 Minimum FAR: 5.0
No structure is permitted to permanently encroach within 50 feet of the FAA-established approach path.
Conditional Use Permit
Continuing Care Retirement Communities, Senior Housing, Residential Care Facilities, Transitional Housing
Maximum FAR: 8.0 Minimum FAR: 5.0
No structure is permitted to permanently encroach within 50 feet of the FAA-established approach path.
Source: City of San Diego Municipal Code 2010.
* City of San Diego Municipal Code Section 132.0201 and Table 156-0308-A ** State affordable housing density incentives could be used to maximize density at the site to a FAR of 12.0. Overlay zoning is a regulatory tool that creates a special zoning district, placed over an existing base zone, which identifies special provisions in addition to those in the underlying base zone. In addition to the base zoning, these zones and their applicable San Diego Municipal Code sections are shown on Table 3-5 below.
2 Residential density and intensity parameters at the site are defined in the San Diego International Airport Land Use
Compatibility Plan.

Affordable Housing Phase II Feasibility Analysis Page 17 Final AFH Phase II Feasibility Analysis 02-09-18.doc 2/9/2018
Table 3-5 Family Court: Site Overlay Zones (City of San Diego)
Overlay Zone Definition Municipal Code Section(s) Main Street On designated main streets, a minimum of 80 percent of the
ground-floor street frontage shall contain active commercial uses.
156.0307(b)(11), Table 156-0308-A, 156.0315(e)
Transit Area Lowers off-street parking requirements because of a high level of transit service, Affordable housing3 and housing for senior citizens, residential care facilities, and transitional housing facilities in a single dwelling unit are not subject to this parking regulation, but are otherwise subject to all other parking regulations.
132.1001, 142.0525
Residential Tandem Parking
Tandem parking may be counted as two parking spaces in the calculation of required parking.
132.0901, 132.0905
Airport Influence Area
For residential development within the 60 decibel (dB) Community Noise Equivalent Level (CNEL) contour, the applicant must demonstrate that indoor noise levels that are attributable to airport operations shall not exceed 45dB. Development proposals shall comply with the standards of the Runway Protection Zones and Airport Approach Overlay Zone as described by the Airport Land Use Compatibility Plan.
Table 132-03A
Airport Approach Zone
Restricts structures from permanently encroaching within 50 feet of the FAA-established approach paths
132.0205
Development Intensity Parameters
The Family Court site development intensity is restricted because of the proximity to the San Diego International Airport. Development intensities and building height are restricted in this area according to the Centre City Planned District Ordinance provisions to be consistent with the San Diego International Airport Land Use Compatibility Plan (ALUCP) (Ricondo & Associates 2014). The ALUCP shows the site within the Centre City – Cortez neighborhood and 3SE Safety Zone (Exhibit 3-1, Safety Compatibility Zones).
Development Density and Intensity
Per ALUCP Policy S.8, for proposed projects with a mix of residential and nonresidential uses, residential density is converted to intensity and the total number of residential occupants is limited to half of the maximum nonresidential intensity specified in Table 3-1. AECOM utilized ALUCP Tables 3-1 and 3-2 (example 6 of 6) to determine that the maximum allowable residential density is 185 dwelling units and maximum nonresidential capacity is 49,000 square feet
3 Per City Municipal Code Section 142.0527: Affordable housing dwelling units are dwelling units within a multiple dwelling
unit development that meet the following criteria: (A) Dwelling units are rental units reserved for a period of at least 30 years for low income or very low income households in which the tenants do not pay more than 35 percent of gross household income toward gross rent (including utilities). These provisions shall be included in a written agreement with the San Diego Housing Commission; and (B) the development falls into at least one of the following categories: family housing, housing for senior citizens, housing for disabled persons; Single-room Occupancy hotel, or Studio.

Page 18 Affordable Housing Phase II Feasibility Analysis Final AFH Phase II Feasibility Analysis 02-09-18.doc 2/9/2018
(assuming retail occupancy) at the Family Court site.4 Policy S.3 of the ALUCP states that the maximum allowable residential densities in Table 3-1 includes any density bonuses that local agencies may provide for affordable housing developed in accordance with state or local law. Land use projects with density bonuses cannot exceed the allowable densities established in Table 3-1. Development Height
The ALUCP includes Threshold Siting Surfaces (TSS) and Terminal Instrument Procedures (TERPS) surfaces, which are critical airspace that must be protected to allow for safe approaches to runways and execution of instrument approach and departure. The highest point of the Family Court site is approximately 150 feet above mean sea level (AMSL) and the associated TSS and TERPS height limit at the site is 372 AMSL. The height limit at the site is 222 feet above ground level at the highest point to be consistent with the ALUCP Airspace factor.5 However, the Airport Approach Zone requirements in San Diego Municipal Code Section 132.0205 states that permanent structures cannot be located within 50 feet of the TSS, therefore the maximum height of future structures at the site is 172 feet above ground level.
3.2 SHERIFF REGIONAL CRIME LAB
The Crime Lab site is owned by the County of San Diego and located within the City of San Diego. See Table 3-6 below for a site overview. On July 18, 1989, the Clairemont Community Hospital was purchased for County use and on March 1, 1994, the Board of Supervisors authorized the relocation of the Sheriff’s Criminal Investigations Division (“Crime Lab”) to the site. Construction of a new crime lab is currently underway at the County Operations Center in Kearney Mesa. The anticipated move date is Fall 2018, at which point the existing Crime Lab site will be vacant and available for redevelopment. The existing structure would require demolition prior to future development.
Table 3-6 Crime Lab: Site Overview
Address APN Size Land Use Zoning Timeframe Available
5255 Mt. Etna Dr.
361-661-12 4.09 acres Commercial CO-1-2: Commercial Office
Overlay Zones: Community Plan Implementation Overlay Zone (CPIOZ) and Western Clairemont Height
Fall/Winter 2018
4 ALUCP Density Calculation for Family Court, per ALUCP Tables 3-1 and 3-2 (example 6 of 6): Maximum Residential DUs: 842 nonresidential intensity / 2 = 421 people per acre x 0.69 acre site = 290 people / 1.57 (persons
per household) = 185 maximum residential DUs Nonresidential Capacity: 290 people x 170 (Retail occupancy factor) = 49,300 square feet retail space 5 Personal communication with Garret Hollarn (Sr. Airport Planner, San Diego County Regional Airport Authority) on February
6, 2018.

Affordable Housing Phase II Feasibility Analysis Page 19 Final AFH Phase II Feasibility Analysis 02-09-18.doc 2/9/2018
3.2.1 Neighborhood Amenities The Clairemont Mesa community is approximately 13 square miles and includes several commercial centers, multiple transit options, and residential neighborhoods with most homes built in the 1950s and 1960s. The Crime Lab site is proximate (within 0.5 miles) to a number of neighborhood amenities for future site occupants. Table 3-7 lists the amenities and Figure 3-2 shows the location of each amenity, including one child care facility, four markets, five medical clinics, one park, six pharmacies, one private school, one public school, and 18 MTS transit stops.
Table 3-7 Crime Lab: Neighborhood Amenities (0.5 miles)
Name Location Child Care (1 location)
Tsumiki Preschool 4811 Mount Etna Dr Markets (4 locations)
Balboa International Market 5905 Balboa Ave Henry's Marketplace 4439 Genesee Ave Sprouts Farmers Market 4439 Genesee Ave Vons 5555 Balboa Ave
Medical Clinics (5 locations) AFC Urgent Care Clairemont 5671 Balboa Ave California Women’s Medical Clinic 4282 Genesee Ave Great San Diego Clinic Inc 5222 Balboa Ave # 33 Lotusrain Naturopathic Clinic 5210 Balboa Ave # F Sharp Clairemont Senior Health 4320 Genesee Ave
Park (1 location) Mount Etna Neighborhood Park
Pharmacies (6 locations) Balboa Pharmacy 6465 Balboa Ave #101 CVS/Pharmacy 5680 Balboa Ave Rite Aid 5270 Balboa Ave Rx For Less 6070 Mt Alifan Dr Target Pharmacy 5680 Balboa Ave Walgreens 5504 Balboa Ave
Schools (2 locations) Horizon Christian Academy (Private grades K-12) 5351 Mt Alifan Drive Mt. Everest Academy Alternative School grades K-12) 4350 Mount Everest Boulevard
The Crime Lab site has numerous transportation options within a half-mile buffer. Chapter 4.0 below includes an overview of the City of San Diego’s Mobility Plan, which outlines the City’s transportation strategy. These local transportation amenities are scored from 0 to 100 based on whether a location is good for transit, walking, and biking. The scoring methodology is defined

Page 20 Affordable Housing Phase II Feasibility Analysis Final AFH Phase II Feasibility Analysis 02-09-18.doc 2/9/2018
in Section 3.1.1 above. Table 3-8 below summarizes the transportation amenities at the Crime Lab site.
Table 3-8 Crime Lab: Transportation Amenities
Transportation Mode Score Site Information
Transit 35 (Fair/Poor) – A few nearby transit options.
Bus routes in walking distance with service to Mission Valley, UCSD, Pacific Beach, and Kearny Mesa.
Walk 72 (Good) – Most errands can be accomplished on foot.
Access to a variety of goods and services.
Bike 73 (Good) – Flat and good bike lanes.
Class II bike lanes provide connectivity in all directions. Immediate vicinity is flat but terrain becomes hilly in the direction of the coast.
Source: walkscore.com
3.2.2 Land Use and Zoning Existing land uses on surrounding parcels include health care, office (low rise), single family detached, and neighborhood and community shopping. The site is located within the Clairemont Mesa Community Plan, adopted by the San Diego City Council on September 26, 1989, and currently being updated. The draft community plan update is scheduled to be available for public review by the end of 2018, followed by an 18-month environmental review process, and finally, city council approval in summer 2020.6 The site is identified as Commercial Office within the Community Core area of the current community plan, which does not allow for residential development (City of San Diego 2011). Future residential development at the site that triggers a City discretionary action would require a Plan Amendment prior to completion of the community plan update. The base zoning at the site is Commercial—Office (CO-1-2), which allows residential uses as outlined in Table 3-9 below. The site is located within the CPIOZ and allows only commercial uses in the area, however, an affordable housing development, in-fill project as described in Section 143.0915(b)(4), and/or a sustainable building may be permitted with a Neighborhood Development Permit (City of San Diego Municipal Code Table 132-14B footnote). Additionally, western Clairemont Mesa has a height overlay that limits buildings to 30 feet at the site (San Diego Municipal Code Section 101.0452.5). An exception to this overlay can be applied for as long as the new structure is compatible with surrounding one, two, or three-story structures, as described in San Diego Municipal Code Section 101.0452.5.D.
6 Personal communication with Marlon Pangilinan (City of San Diego Planner) on January 24, 2018.

"T
"T
"T
"T
"T"T
"T
"T
"T
"T
"T
"T
!(
!(
!(
!(
!(
!(
!(
!(
!(
!(
!(
!(
!(
!(
!(
!(
!(!(!.
Mount EtnaNeighborhood
Park
Mount AcadiaNeighborhood Park
Sheriff’sCrime Lab
FIGURE 3-2SHERIFF’S CRIME LAB
NEIGHBORHOOD AMENITIESI
600 6000 Feet
1:7,200Scale: 1 in = 600 feet
LEGEND!. Study Site
Half-Mile Buffer
Child Care
Market
Medical Clinic
Pharmacy
"T Public School
"T Private School
!( Transit Stops
Bus Lines
Public Park
Path: P:\_6056\60562733_DGS_TO22\900-CAD-GIS\920 GIS\map_docs\mxd\SheriffsLab_Businesses.mxd, augellop, 1/25/2018, 10:09:06 AM
Source: SANDAG 2014; SanGIS 2018; ESRI Business Analyst 2016
DATE: 1/25/2018

Page 22 Affordable Housing Phase II Feasibility Analysis Final AFH Phase II Feasibility Analysis 02-09-18.doc 2/9/2018
This page intentionally left blank.

Affordable Housing Phase II Feasibility Analysis Page 23 Final AFH Phase II Feasibility Analysis 02-09-18.doc 2/9/2018
Table 3-9 Crime Lab: Potential Residential Uses Allowed (Base Zone)
Allowable Use Type* Baseline Density Height** Permitted Residential care facilities, transitional Six or fewer (1 du/1,500 sq. ft.
of lot area) 30 ft.
Limited Live work, home occupations, sex offender treatment and counseling, child care facilities
1 du/1,500 sq. ft. of lot area 30 ft.
Conditional Use Permit
Continuing care retirement facilities, transitional housing
Seven or more (1 du/1,500 sq. ft. of lot area)
30 ft.
Conditional Use Permit
Homeless facilities, emergency shelters, homeless day centers, intermediate care and nursing facilities, correctional placement facilities
1 du/1,500 sq. ft. of lot area 30 ft.
Source: City of San Diego Municipal Code 2010.
* Intended to accommodate a mix of office and residential uses ** Per Muni Code 6-2000 Article 2: Overlay Zones Division 13: Clairemont Mesa Height Limit Overlay Zone. Base CO-1-2 zone height limit is otherwise 60 ft.
3.3 AFFORDABLE HOUSING BONUSES AND INCENTIVES Development at either the Family Court or Crime Lab site that includes affordable housing units will benefit from various local agency density bonuses and/or State Density Bonus Law incentives. In 1979, the State of California adopted the “State Density Bonus Law,” which offers density bonuses and other concessions to projects that have on-site affordable housing. In 2016, the California Legislature approved four bills to clarify the law and strengthen the encouragement of the development of affordable and senior housing, specifically Assembly Bill (AB) 2501, AB 2442, AB 2556, and AB 1934. An incentive, consistent with the State Density Bonus Law, is defined in part as “a deviation to a development regulation” in City of San Diego Municipal Code Section 143.0740. Bonuses and incentives do not require a plan amendment, zoning change, or other discretionary approval. Incentives can be used to waive local development standards to increase density, such as increased height or bulk. City of San Diego Municipal Code Section 143.0170 states that the City’s affordable housing density bonus regulations provide increased residential density to developers who guarantee a portion of their residential development will be available to moderate income, low income, very low income, or senior households. Tables 143-07A through 143-07C of the San Diego Municipal Code document the Very Low, Low, and Moderate Income density bonus percentages and number of incentives by percent affordable housing units in a development. For example, if future site development includes greater than or equal to 15 percent very low income units or 24 percent low income units, then a 50 percent density bonus and five incentives can be applied to the development.
Page 24 Affordable Housing Phase II Feasibility Analysis Final AFH Phase II Feasibility Analysis 02-09-18.doc 2/9/2018
Height limitations are an example of a zoning constraint that can benefit from application of an affordable housing incentive. For instance, at the Family Court site the Main Street Overlay requires a 65-foot wall height along Sixth Avenue. An incentive could be used to waive this overlay height restriction and the developer can request the base zone 85-foot wall height limit be applied to the development. Affordable housing incentives cannot be applied to use regulation deviations, such as the Main Street Overlay requirement of 80 percent commercial use on the first floor, which would require a rezone.

Affordable Housing Phase II Feasibility Analysis Page 25 Final AFH Phase II Feasibility Analysis 02-09-18.doc 2/9/2018
CHAPTER 4.0 HOUSING POLICY AND PROGRAM OPTIONS AND FUNDING
This chapter identifies housing needs, policies, programs and funding sources for key special needs categories such as single parent female-headed families, seniors, the formerly homeless, and veterans.
4.1 CITY OF SAN DIEGO DEMOGRAPHIC AND HOUSING ISSUES OVERVIEW The City of San Diego is continuing a decades long trend where population growth outstrips household growth, income gains are modest, and supply of new housing does not meet demand. Collectively these factors impact the supply, quality, and cost of housing and are tracked through U.S. Department of Housing and Urban Development (HUD) Comprehensive Housing Affordability Strategy (CHAS) data. Of particular note in these trends is the different growth rate between population and households. Households have grown at a slower rate than population growth. In general, without sufficient delivery of housing units over the long-term this is expected to translate to an increase in household size and in the cost of housing. According to the San Diego Association of Governments (SANDAG) 2010 – 2020 Regional Housing Needs Assessment (RHNA), the region is expected to deliver about 75 percent of the housing units needed to meet regional demand for housing. Median household income is expressed in Table 4-1 without regard for household size, which is different from the HUD and California Department of Housing and Community Development (HCD) income approaches. HUD and HCD classify the income level of a household by income and household size. For example, a one-person household with an income of $66,000 in 2015 would be an above moderate income household according to HCD whereas a four-person household would be classified as low-income. This has the effect of providing a more complete picture of household income distribution across income ranges.
Table 4-1 City of San Diego Population, Households, and Median Income Trends
Demographics 2010 2015 % Change Population 1,311,886 1,394,907 6.3% Households 474,906 485,091 2.1% Median Household Income $62,480 $66,116 5.8% Source: U.S. Census Bureau

Page 26 Affordable Housing Phase II Feasibility Analysis Final AFH Phase II Feasibility Analysis 02-09-18.doc 2/9/2018
The City of San Diego Housing Element and Consolidated Plan (Con Plan) identifies regional housing needs and outline policies, actions, and funding sources to address issues such as the shortage of supply and address the following housing problems:
Housing cost burden – Housing costs, including utilities, exceed 30 percent of gross Area Median Income (AMI)
Severe housing cost burden – Housing costs, including utilities, exceed 50 percent of gross AMI
Overcrowded housing – Housing units with more than one person per room
Units with physical defects – Housing units lacking a complete kitchen or bathroom City of San Diego housing problem highlights from 2010 to 2014 HUD CHAS data include:
Renter households have a higher level of housing problems (54 percent) compared to owner households (36 percent)
Renter households also have a higher level of cost burden (49 percent) and severe cost burden (26 percent) than owner households (35 percent and 15 percent).
Extremely low, very low, and low-income renter households have a higher incidence of housing problems (80 percent) than the respective owner households (64 percent)
4.2 HOUSING POLICY AND PROGRAM OPTIONS
4.2.1 City of San Diego Housing Element The City of San Diego General Plan Housing Element (2013) functions as a policy guide to address housing needs, including detailing measurable goals, policies, and programs. The Housing Elements has five main goals: Goal 1 – Ensure the provision of sufficient housing for all income groups to accommodate San Diego’s anticipated share of regional growth over the next housing element cycle, 2013 – 2020, in a manner consistent with the development pattern of the Sustainable Communities Strategy (SCS), that will help meet regional greenhouse gas (GHG) targets by improving transportation and land use coordination and jobs/housing balance, creating more transit oriented, compact and walkable communities, providing more housing capacity for all income levels, and protecting resource areas.

Affordable Housing Phase II Feasibility Analysis Page 27 Final AFH Phase II Feasibility Analysis 02-09-18.doc 2/9/2018
Goal 2 – Maintain at a high level and upgrade, where necessary, the quality, safety and livability of San Diego’s housing stock, with emphasis on preservation of San Diego’s affordable housing stock. Goal 3 – Streamline the entitlement and permitting process for new residential development by minimizing governmental constraints in the development, improvement, and maintenance of housing without compromising the quality of governmental review or the City’s responsibility to ensure development takes place in a sustainable manner. Goal 4 – Provide affordable housing opportunities consistent with a land use pattern that promotes infill development and socioeconomic equity; and facilitate compliance with all applicable federal, state, and local laws and regulations. Goal 5 – Cultivate the City as a sustainable model of development A key driver in the City’s ability to meet these goals is ensuring that there is sufficient available land for sufficient housing to be provided to households of different income levels. According to the RHNA, City of San Diego’s share of regional incremental housing needs for the 2010 to 2020 period was 88,096 units distributed by the following AMI distributions, shown in Table 4-2.
Table 4-2 RHNA City of San Diego Allocation
Income Group Percentage of AMI Share Extremely Low Income* 0 – 30% of AMI 10,988 Very Low Income 31 – 50% of AMI 10,989 Low Income 51 – 80% of AMI 16,703 Moderate Income 81 – 120% of AMI 15,642 Above Moderate Income 121%+ of AMI 33,954 Source: City of San Diego Housing Element
*In accordance with State Law (AB 2634), the City projected the number of low-income housing by assuming 50% of the very low-income units as extremely low.
Rather than a requirement that the City supply these units, it must demonstrate that there is adequate vacant and potential redevelopable land zoned for residential use to potentially meet the goals for each income group. HCD generally utilize 30 units per acre as the threshold for providing housing units for low and very low income households in urban areas. At the time of completion of the Housing Element, the City had sufficient land zoned for this density to meet this threshold. The City’s adequate sites zoning inventory is the document where these sites are identified. The Family Court and Crime Lab sites are not on this list; however, this is because they are County properties and were not accounted for. The development of these two sites as

Page 28 Affordable Housing Phase II Feasibility Analysis Final AFH Phase II Feasibility Analysis 02-09-18.doc 2/9/2018
affordable or mixed income would be in alignment with the overarching goals of the Housing Element, given the urban location of the two sites, potential for infill, proximity to transit, and inclusion in City Transit Priority Areas (TPAs).
4.2.2 City of San Diego Consolidated Plan Jurisdictions are required by HUD to update their Con Plan every five years. The plans serve to assist San Diego and other jurisdictions to identify critical community needs, priorities, and goals. There are six related goals within the City’s Con Plan, which covers 2015 through 2019 (LeSar Development Consultants 2015). Four of the six goals address housing needs:
Improve housing opportunities by creating and preserving affordable rental and homeowner housing in close proximity to transit, employment, and community services
Assist individuals and families to stabilize in permanent housing after experiencing a housing crisis or homelessness by providing client-appropriate housing and supportive
service solutions
Invest in community services and non-profit facilities that maximize impact by providing new or increased access to programs that serve highly vulnerable populations such as
youth, seniors, and food insecure households
Meet the needs of persons with human immunodeficiency virus/acquired immunodeficiency syndrome (HIV/AIDS) and their families through the provision of housing, health, and support services
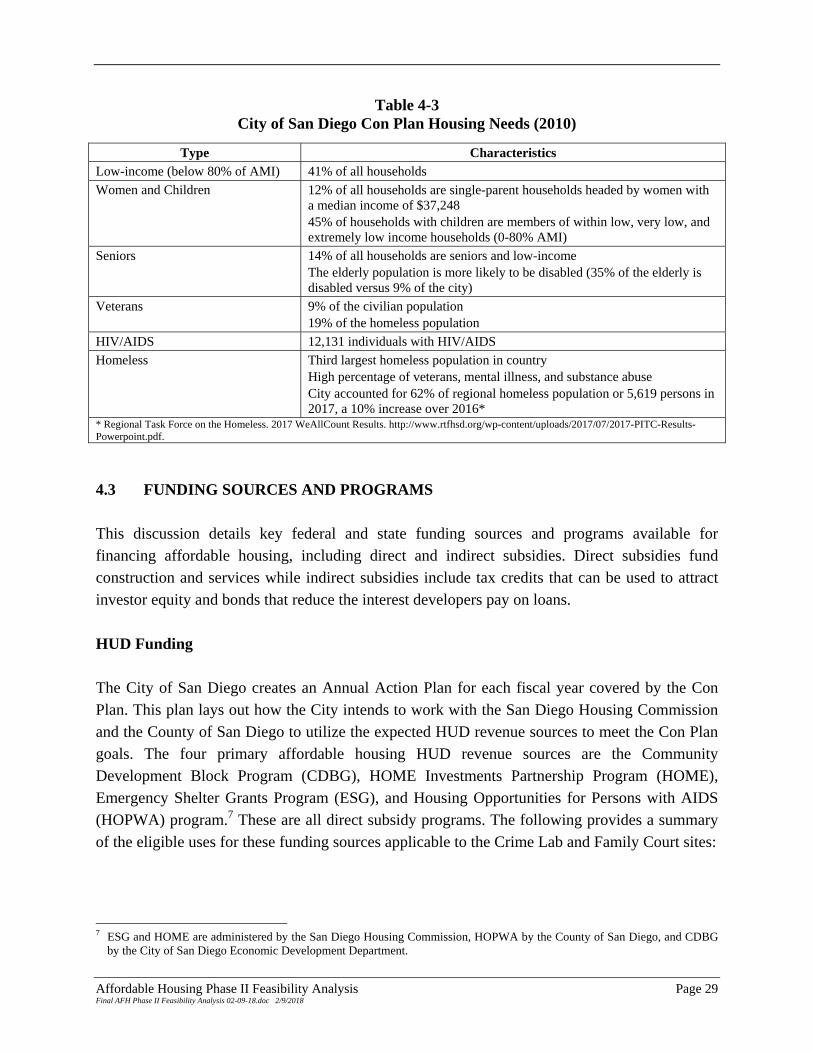
The Con Plan includes an assessment of key demographics within the City such as veterans, homeless, single parents, seniors, disabled persons, special needs, and other populations that suffer from housing problems related to insufficient income, overcrowding, and other substandard problems. According to the Con Plan 2010 census data, there are substantial housing needs across a range of demographics (shown in Table 4-3). It is important to note that the above categories are not mutually exclusive. Some populations can fall in multiple categories such as vulnerable seniors who have a higher rate of physical disabilities than the general population and a higher rate of low-income households.
Affordable Housing Phase II Feasibility Analysis Page 29 Final AFH Phase II Feasibility Analysis 02-09-18.doc 2/9/2018
Table 4-3 City of San Diego Con Plan Housing Needs (2010)
Type Characteristics Low-income (below 80% of AMI) 41% of all households
Women and Children 12% of all households are single-parent households headed by women with a median income of $37,248 45% of households with children are members of within low, very low, and extremely low income households (0-80% AMI)
Seniors 14% of all households are seniors and low-income The elderly population is more likely to be disabled (35% of the elderly is disabled versus 9% of the city)
Veterans 9% of the civilian population 19% of the homeless population
HIV/AIDS 12,131 individuals with HIV/AIDS
Homeless Third largest homeless population in country High percentage of veterans, mental illness, and substance abuse City accounted for 62% of regional homeless population or 5,619 persons in 2017, a 10% increase over 2016*
* Regional Task Force on the Homeless. 2017 WeAllCount Results. http://www.rtfhsd.org/wp-content/uploads/2017/07/2017-PITC-Results-Powerpoint.pdf.
4.3 FUNDING SOURCES AND PROGRAMS This discussion details key federal and state funding sources and programs available for financing affordable housing, including direct and indirect subsidies. Direct subsidies fund construction and services while indirect subsidies include tax credits that can be used to attract investor equity and bonds that reduce the interest developers pay on loans.
HUD Funding The City of San Diego creates an Annual Action Plan for each fiscal year covered by the Con Plan. This plan lays out how the City intends to work with the San Diego Housing Commission and the County of San Diego to utilize the expected HUD revenue sources to meet the Con Plan goals. The four primary affordable housing HUD revenue sources are the Community Development Block Program (CDBG), HOME Investments Partnership Program (HOME), Emergency Shelter Grants Program (ESG), and Housing Opportunities for Persons with AIDS (HOPWA) program.7 These are all direct subsidy programs. The following provides a summary of the eligible uses for these funding sources applicable to the Crime Lab and Family Court sites:
7 ESG and HOME are administered by the San Diego Housing Commission, HOPWA by the County of San Diego, and CDBG
by the City of San Diego Economic Development Department.

Page 30 Affordable Housing Phase II Feasibility Analysis Final AFH Phase II Feasibility Analysis 02-09-18.doc 2/9/2018
CDBG – Construction of housing and public facilities and infrastructure, public services for low-income persons and persons with special needs, and down payment and home
ownership assistance
HOME – New construction, rental assistance, and homebuyer assistance
ESG – Operations and maintenance of a homeless facility, essential supportive services (case management, physical and mental health treatment, substance abuse counseling,
and child care), and homeless prevention
HOPWA – Construction of new housing, facility operations, rental assistance, supportive services and short-term homeless prevention payments
Table 4-4 below provides expected funding levels for these sources for fiscal year (FY) 2018. Future levels of these funding sources are highly uncertain and unpredictable due to shifting priorities at the federal level. As a result, other state and local revenue sources are increasingly critical for financing affordable housing development.
Table 4-4 Expected HUD Funding for FY 2018
Program Type Expected Funding Historical Percentage Allocated to Housing
CDBG $30.3 million 30% HOME $15.4 million 90% HOPWA $3.4 million 60% ESG $1 million 92% Source: Con Plan Fiscal Year 18 Annual Action Plan
California Tax Credit Allocation Committee (TCAC) Low-Income Housing Tax Credits (LIHTC) LIHTCs are the most important source of funding for affordable housing in the United States. Investors claim the credits on their income tax returns in exchange for providing equity that are calculated as a percentage of costs incurred in developing a property and claimed annually over a 10-year period. The equity from LIHTCs can be used for newly constructed rental housing properties for low-income households, and for the acquisition of properties. LIHTCs provide equity equal to the present value of either 30 percent (the 4 percent credit) or 70 percent (the 9 percent credit) of the development cost. Developers compete for a limited pool of credits that can be used to attract equity investors into the project. Candidates submit applications and proposals that are scored based on criteria such as past participation in the program, a track record of

Affordable Housing Phase II Feasibility Analysis Page 31 Final AFH Phase II Feasibility Analysis 02-09-18.doc 2/9/2018
performance, on-site services and amenities, and the characteristics of the surrounding neighborhood. At this stage, only the characteristics of the surrounding neighborhood can be examined for the Family Court and Crime Lab sites. Applicants can earn a maximum of 15 points for being in close proximity to transit stations, markets, medical clinics, parks, libraries, schools, senior centers, and pharmacies. The definition of close proximity varies by the amenity type according to the TCAC Guidelines. The majority of the criteria are applicable to all affordable developments. Other criteria such as proximity to senior centers, special needs, or public schools are only applicable if the proposed development contains affordable units that respectively house seniors, individuals and families with special needs, or where 25 percent of more of the affordable units are three bedrooms or larger. It is estimated that both sites would garner maximum points from the LIHTC under this category (shown on Figures 4-1 and 4-2), based on a preliminary evaluation of the sites and the surrounding areas. The TCAC scoring framework only requires one amenity for each category to qualify for points. Figures 4-1 and 4-2 show the closest neighborhood amenities that are expected to meet the criteria for points. If more than one location for a category is mapped it is because more than one amenity is within close proximity to the site. This only makes up a portion of the overall TCAC scoring. Each year the Committee establishes a minimum point threshold. Based on the 2017 thresholds (Table 4-5 below), if both sites received the maximum 15 points from the characteristics of the surrounding neighborhoods they would account for anywhere from 12 percent to 16 percent of the minimum score threshold.
Table 4-5 TCAC Score Thresholds (2017)
Application Type Minimum Score Maximum Score 9% Applications 117 points 138 points 4% Competitive Applications 98 points 116 points
The Tax Cuts and Jobs Act (December 2017) is having significant impacts on the value of these tax credits. In the few months since its passage the value of tax credits has decreased and could continue to decrease. This is expected to attract less equity into projects creating a larger funding gap that will need to be filled on the local level or through other state programs.

Page 32 Affordable Housing Phase II Feasibility Analysis Final AFH Phase II Feasibility Analysis 02-09-18.doc 2/9/2018
California Tax Credit Allocation Committee Qualified Residential Rental Project (QRRP) Program Under the QRRP state and local governmental agencies and joint powers authorities can issue-tax exempt housing revenue bonds, which effectively lower the interest rate paid by developers, on the condition that developers produce market rate and affordable housing for low and very low income households. Scoring criteria related to neighborhood characteristics is nearly identical to that used to score LIHTC applications. As a result both sites would be expected to achieve the full complement of points.
Local Government Special Needs Housing Program (SNHP) The SNHP is a new low-interest loan program that has replaced the Mental Health Services Act Housing Program (MHSA). The program utilizes funding generated from the passage of the MHSA to finance permanent supportive rental housing (five or more units) that includes units restricted for occupancy by individuals with serious mental illness (and their families) who are homeless or at risk of homelessness. It allows local governments to use MHSA funds with other local funds. The funding is allocated to projects through the County of San Diego Health and Human Services Agency (HHSA).
Affordable Housing and Sustainable Communities (AHSC) Program The AHSC is one of the keystone programs in California’s cap-and-trade funding program, often called the California Climate Investments Program (CCIP). It provides funding through a combination of low-interest loans and grants. The AHSC is a competitive program with a primary goal of reducing GHGs. It achieves GHG reductions through investments in integrated transit-oriented housing and sustainable transportation infrastructure projects. The program is not exclusively limited to affordable housing but the vast majority of the funding has gone to projects that are exclusively affordable or have a very high percentage of affordable units. Many projects funded through the AHSC have also received tax credits from the LIHTC. The majority of high-scoring projects in urban areas are highly affordable transit-oriented housing developments that include transportation components such as improved public transit, biking and walking infrastructure, energy efficiency, and green infrastructure. The GHG reductions for successful projects are mostly achieved through location, housing density, and the encouragement of mode shift. Collaboration between public agencies and developers is also prioritized as is the demonstrable of meaningful public benefits that include job creation and access to jobs, increased climate adaptation and resiliency, and improved public health. Almost half of the total available points (45 of 100) is based off of GHG reductions, location efficiency, and proposed active transportation improvements. These are broken down as follows:

"T
"T
")
")
")
")
")
")
")
")
")
")
")
")
")
")
")
")
")
")
")
")
")
")
")
")
")
")
")
")
")
")
")
")
")
")
")
")
")
")
")
")
")
")
")
")
")
")
")
")
")
")
")
")
")
")
")
")
")
")
")
")
")
")
")
")
")
")
")
")
")
")
")
")
")
")
")
")
")
")
")
")
")
")
!(
!( !.
Tweet StreetMini-Park
Family Court
FIGURE 4-1FAMILY COURT
TCAC NEARBY SCORING AMENITIESI
600 6000 Feet
1:7,200Scale: 1 in = 600 feet
LEGEND!. Study Site
Large Grocer
Medical Clinic
Pharmacy
Small Neighborhood Market
Weekly Farmers Market
"T Public School
!( Closest Transit Stops
Trolley Lines
Bus Lines
Public Park
Path: P:\_6056\60562733_DGS_TO22\900-CAD-GIS\920 GIS\map_docs\mxd\FamilyCourt_TCAC.mxd, augellop, 1/25/2018, 10:15:51 AM
Source: SANDAG 2014; SanGIS 2018
DATE: 1/25/2018
Criteria Family Court (1501 6th Ave. San Diego, CA)
Transit Ne are st Route 3 and 120 bus stopsPublic Park Twe e t S tre e t ParkLibrary N/A
Large Groce r Ralph’s – 101 G S t. S an Die go, CA 92101 Downtown Fam ily He alth Ce nte r Conne ctions – 1250 6th Ave , S an Die go, CA 92101 S un He alth Me d ical Clinics – 427 C S t, S an Die go, CA 92101
S m all Ne ighborhood Mark e t
Rom a Urban Mark e t - 555 Be e ch S t. S an Die go, CA 92101
We e k ly Farm e rs Mark e t
519 W Ce d ar S t, S an Die go, CA 92101
Public S chools King Chave z High S chool – 201 A S t., S an Die go 92101
Pharm acy CVS - 510 C S t., S an Die go, CA, 92101
S e nior Ce nte r N/A
California Tax Credit Allocation Committee (TCAC) Site Nearby Scoring Amenities
Me d ical Clinics
Criteria PointsTransit Proxim ity 7Transit Passe s TBDPublic Park 3Library 0Me d ical Clinic 3Mark e t/Groce r 4Pharm acy 2
S e nior Ce nte r (S e nior De ve lopm e nt) 0Public S chools (De ve lopm e nt with 25%+ thre e be d room units) 2S pe cial Ne e d s TBDEstimated Site Points 15 of 15
Estimated Family Court TCAC Site Nearby Amenities Scoring (Maximum of 15 points)
Scoring Only Applicable to Development Type

"T
")
")
")
")
")
")
")
")
")
")
")
")
")
")
")
")
")
")
")
")
")
")
")
")
")
")
")
")
")
")
")
")
")
")
")
")
")
")
")
")
")
")
")
")
")
")
")
")
")
")
")
")
")
")
")
")
")
")
")
")
")
")
")
")
")
")
")
")
")
")
")
")
")
")
")
")
")
")
")
")
")
")
!(!(
!(
!(
!(
!(
!.
Mount EtnaNeighborhood
Park
Sheriff’sCrime Lab
FIGURE 4-2SHERIFF’S CRIME LAB
TCAC NEARBY SCORING AMENITIESI
600 6000 Feet
1:7,200Scale: 1 in = 600 feet
LEGEND!. Study Site
Large Grocer
Medical Clinic
Pharmacy
Small Neighborhood Market
") Library
"T Public School
!( Closest Transit Stops
Bus Lines
Public Park
Path: P:\_6056\60562733_DGS_TO22\900-CAD-GIS\920 GIS\map_docs\mxd\SheriffsLab_TCAC.mxd, augellop, 1/25/2018, 10:15:03 AM
Source: SANDAG 2014; SanGIS 2018
DATE: 1/25/2018
Criteria Sheriff’s Crime Lab (5255 Mt. Etna Dr. San Diego , CA)
Transit Nearest R oute 41 and 27 bus stopsPublic Park Mt. Etna Neig h borh ood ParkLibrary Balboa Branch Library, 4255 Mt
Abernath y AveLarge Grocer Von’s - 5555 Balboa Ave, San
Dieg o, CA 92111 California Wom en’sMed ical Clinic – 4282 GenesseeAve, San Dieg o, CA 92117 AFC Urgent CareClairem ont – 5671 Balboa AveSan Dieg o CA, 92111
Sm all Neig h borh oodMarket
Balboa International Market - 5905 Balboa Ave, San Dieg o, CA 92111
Weekly Farm ers Market N/A
Public Sch ools N/A
Pharm acy R ite Aid - 5270 Balboa Ave, San Dieg o, CA 92111
Senior Center N/A
Califo rnia Tax Credit Allo catio n Co mmittee (TCAC) Site Nearby Sco ring Amenities
Med ical Clinics
Criteria Po intsTransit Proxim ity 7Transit Passes TBDPublic Park 3Library 2Med ical Clinic 3Market/Grocer 5Pharm acy 2
Senior Center (Senior Developm ent) 0Public Sch ools (Developm ent with 25%+ th ree bed room units) 0Estimated Site Po ints 15 o f 15
Sco ring Only Applicable to Develo pment Type
Estimated Sheriff’s Crime Lab TCAC Site Nearby Amenities Sco ring (Maximum o f 15 po ints)

Affordable Housing Phase II Feasibility Analysis Page 35 Final AFH Phase II Feasibility Analysis 02-09-18.doc 2/9/2018
GHG reductions (up to 30 points) – The AHSC utilizes the California Pollution Control Officers Association framework for calculating project GHGs. The most important factors in maximizing project GHG reductions are a project with a high unit density and proximity to transit. Provided these two factors are in place, a project can reasonably be expected to max out on its total GHG reductions, which accounts for 15 of the 30 points. A range of amenities can be included in the project design to increase GHG reductions should the project fall short of maximizing its reductions. The other 15 points are based off of the quantity of GHG reductions per dollar of AHSC funds. This GHG efficiency scoring is intended to encourage and reward applicants that seek out other revenue
sources and pair them with AHSC requests.
Location efficiency (up to 5 points) - A maximum of five points are awarded for proximity to neighborhood destinations such as transit stops, schools, markets, medical clinics, child care, and general walkability. Figures 4-3 and 4-4 show the various destinations within the potential project area of each site that have been estimated as
meeting the AHSC location efficiency criteria.
Proposed active transportation improvements (up to 10 points) – These points are achieved if the project proposes to expand bikeways and walkways that effectively enhance connectivity to key destinations, transit, close active transportation network gaps, and/or increase safety.
At this time, without a proposed project framework, it is not feasible to estimate with a high level of accuracy the potential points either of the project sites would garner for GHG reductions or proposed active transportation improvements. It is expected that the Family Court site would result in high GHG reductions by virtue of the high density potential of the site and its proximity to the trolley. The Crime Lab is expected to achieve high density levels through density bonus incentives and receive substantial GHG reductions from the density of the development. It is likely a project would be highly competitive in overall GHG reductions, even with bus lines being the only adjacent transit service. Once site options have been better defined it will be possible to simulate GHG reductions from both projects in an effort to gauge GHG reduction potential. Similarly, the ability to capture the 10 points for proposed active transportation improvements cannot be evaluated at this time without well-defined project parameters. For the Family Court site, the Downtown San Diego Mobility Plan does identify the project area as a priority area for pedestrian and bicycle infrastructure. The Mobility Plan includes identification of mobility goals, existing mobility infrastructure, proposed infrastructure, and priority areas for improvements in the Downtown area. The project site is within a high collision area and Beech Street and 6th Avenue are proposed for Class IV Cycle Tracks. As a result there would be opportunities to partner with the

Page 36 Affordable Housing Phase II Feasibility Analysis Final AFH Phase II Feasibility Analysis 02-09-18.doc 2/9/2018
City of San Diego to submit an AHSC application that includes pedestrian and/or bicycling amenities to achieve up to the 10 point limit. There is a proposed Class II or Class III bike path in the City of San Diego Bicycle Master Plan that has been proposed as a high priority project along Balboa Avenue adjacent to the Crime Lab site. There may be other potential improvements that could be explored that could also push that site towards achieving the maximum of 10 points. Based on the guidelines however, it appears that any proposed bicycle project would need to be a Class II bike lane or above to receive points. It is also important to reiterate that the Clairemont Community Plan, where the Crime Lab is located, is currently being updated. As part of this update there could be additional transit and active transportation improvements that are identified and could be included in an AHSC application. Coordination between the City and the potential developer would need to occur for either site to refine and identify the specifics of these amenities before submitting them as part of an application. Location efficiency scoring has been evaluated for both sites. Figures 4-3 and 4-4 illustrate the location of amenities in proximity to the sites that are eligible for points. Three of the five points in this category are allocated based on the EPA’s Walkability Index. Both sites fall into the highly walkable category so would be expected to receive all three points and score well overall. It is estimated that the Family Court site and Crime Lab site would respectively receive five and 4.5 points. Note that the figures do not capture all amenities within the site vicinity for each category. As with TCAC, the focus of the AHSC maps is on amenities closest to the site in a particular category rather than all amenities in its general vicinity. There are 55 additional points available in multiple categories to consider as the Request for Proposals (RFP) process moves forward should the AHSC be deemed a high priority funding source. Points are awarded for the following:
Green Buildings and Renewable Energy (up to 10 points) – Achievement of green building status beyond state mandatory green building requirements and on-site
renewable energy production or status as a Zero Net Energy building
Housing and Transportation Collaboration (up to 10 points) – Dedication of a percentage of the AHSC funding request for transit and/or biking and walking infrastructure and
funding from other CCIP programs
Funds leveraged (up to 5 points) – Awarded for leveraging a high percentage of overall project costs from other sources

"T
"T
!(
!.Family Court
FIGURE 4-3FAMILY COURT
AFFORDABLE HOUSING AND SUSTAINABLE COMMUNITIES LOCATIONAL SCORINGI
600 6000 Feet
1:7,200Scale: 1 in = 600 feet
LEGEND!. Study Site
Grocery Store
Licensed Child Care
Medical Clinic
"T Public School
!( Closest Transit Stops
Trolley Lines
Bus Lines
Path: P:\_6056\60562733_DGS_TO22\900-CAD-GIS\920 GIS\map_docs\mxd\FamilyCourt_AHSC.mxd, augellop, 1/25/2018, 10:22:16 AM
Source: SANDAG 2014; SanGIS 2018
DATE: 1/25/2018
Criteria PointsWalkability* 3
Grocery Stores 0.5
Medical Clin ics 0.5
Public Schools 0.5
Child Care 0.5Total 5 of 5
Estimated AHSC Family Court Locational Efficiency Scoring (Maximum of 5 points)
*Based off the EPA Walkability In dex
Criteria (Family Court) 1501 6th Ave. San Diego, CA
Qualifyin g Tran sit Stops 5th Aven ue Trolley Station
Grocery Stores Rom a U rban Market -555 W. Beech St. San Diego, CA 92101 Dow n tow n Fam ily Health Cen ter Con n ection s – 1250 6th Ave, San Diego, CA 92101 Sun Health Medical Clin ics – 427 C St, San Diego, CA 92101
Public Schools Kin g Chavez High School – 201 A St., San Diego 92101 City College Head Start – 1601 B St. San Diego, CA 92101 Kids on Broadway, 475 W Broadway, San Diego, CA 92101
Affordable Housing and Sustainable Communities (AHSC) Location Scoring Map
Medical Clin ics
Licen sed Child Care

"T
!(!(
!(
!(
!(
!(
!.Sheriff’sCrime Lab
SHERIFF’S CRIME LABAFFORDABLE HOUSING AND SUSTAINABLE COMMUNITIES
LOCATIONAL SCORINGI
600 6000 Feet
1:7,200Scale: 1 in = 600 feet
LEGEND!. Study Site
Grocery Store
Medical Clinic
"T Public School
!( Transit Stops
Bus Lines
Path: P:\_6056\60562733_DGS_TO22\900-CAD-GIS\920 GIS\map_docs\mxd\SheriffsLab_AHSC.mxd, augellop, 1/25/2018, 10:28:54 AM
Source: SANDAG 2014; SanGIS 2018
DATE: 1/25/2018
Criteria PointsWalkability* 3
Grocery Stores 0.5
Medical Clinics 0.5
Public Schools 0.5
Child Care 0Total 4.5 of 5
Estimated AHSC Sheriff’s Crime Lab Locational Efficiency Scoring (Maximum of 5 p oints)
*Based off the EPA Walkability Index
Criteria (Sheriff’s Crime Lab) 5255 Mt. Etna Drive, San Diego, CA
Qualifying T ransit Stops Nearest Route 41 and 27 bus stops
Grocery Stores Von’s - 5555 Balboa Ave, San Diego, CA 92111 California Wom en’s Medical Clinic – 4282 Genessee Ave, San Diego, CA 92117 AFC Urgent Care Clairem ont – 5671 Balboa Ave San Diego CA, 92111
Public Schools Sequoia Elem entary School – 4690 Lim erick Ave, San Diego, CA 92117
Licensed Child Care N/A
Affordable Housing and Sustainable Communities (AHSC) Location Scoring Map
Medical Clinics

Affordable Housing Phase II Feasibility Analysis Page 39 Final AFH Phase II Feasibility Analysis 02-09-18.doc 2/9/2018
Anti-displacement strategies (up to 5 points) – Awarded for jurisdictional policies/programs or project specific programs that intended to prevent displacement of
residents and/or businesses
Local workforce development and hiring practices (up to 2 points) – Awarded for partnerships with workforce programs or project-specific labor agreements
Housing affordability (up to 5 points) – For dedicating between five and 20 percent of
units to Extremely Low Income households
Programs (up to 3 points) – For programs such as bicycle, pedestrian, and transit education programs, Safe Routes to School programs, Transportation Demand
Management (TDM), and rideshare/car share and/or transit subsidy programs
Collaboration and planning (up to 6 points) – For collaboration between governments to implement the regional Sustainable Communities Strategy San Diego Forward, implementation of local planning efforts such as the City of San Diego Climate Action Plan, Bicycle Master Plan, respective community plans, City of San Diego Housing and/or Circulation Element, and others, and/or collaboration between the County and the
developer
Community benefits and engagement (up to 6 points) – Includes how the community is engaged in the development of the project and demonstration of meeting community
needs
Community climate resiliency (up to 3 points) – For defining how the project will increase community resiliency in the face of current and future climate impacts.
Based on the framework for developing these sites, the potential scoring potential of each of the sites is high. Both sites are within City of San Diego TPAs and are focus areas for implementing the City Climate Action Plan (CAP) and have identified bicycle and infrastructure proposed priority projects in close proximity. The City of San Diego also has a suite of anti-displacement measures that would garner substantial points. Additionally, while these sites would not be subject to the County’s Draft CAP under a ground lease, the sites do align with many of the measures and general intent of the document and future development and would be subject to the City’s CAP. As a result, while GHG reductions associated with each site would not count towards the County CAP targets they would be consistent with the content of its plan. The AHSC also requires that at least 50 percent of overall program funding benefit state defined Disadvantaged Communities (DAC). Neither of the sites is within a state-defined DAC; however

Page 40 Affordable Housing Phase II Feasibility Analysis Final AFH Phase II Feasibility Analysis 02-09-18.doc 2/9/2018
the Family Court site is just outside of one. The Family Court project could be designed so that it provides benefits to the neighboring DAC and be prioritized for funding. Both projects could receive funding from this program, especially if they have high levels of affordable units because only 50 percent must benefit DACs.

Affordable Housing Phase II Feasibility Analysis Page 41 Final AFH Phase II Feasibility Analysis 02-09-18.doc 2/9/2018
CHAPTER 5.0 FINANCIAL FEASIBILITY ANALYSIS
This chapter builds on information presented previously in this document to present a financial feasibility analysis of several potential development alternatives for the two sites. This analysis is not meant to constrain potential creative development proposals from developer partners for the two sites, but to indicate the types of projects that would be most likely to achieve feasibility given current market conditions and funding and financing sources.
Methodology and Assumptions AECOM prepared a series of financial feasibility pro formas to test various hypothetical residential and mixed-use development programs for the two sites (see Appendix A, Pro Forma Tables). The pro formas incorporate cost and revenue assumptions and inputs from comparable recent developer pro formas, as well as from secondary sources such as CoStar, RS Means, and affordable housing finance sources such as HUD, HCD and TCAC. Major assumptions affecting all of the pro formas include the following.
Demolition costs for removing the existing structures on the site are included in total development costs, and are borne by the developer.
Developer profit and fees are included as a cost item in the pro formas with residual land value being the bottom line measure of feasibility. If a project returns a positive land value, then it may be considered feasible, assuming the land price paid to the County is
acceptable.
Revenue assumptions (market rents, vacancy rates, capitalization rates, affordable housing rental levels, etc.) are based on recent data and reports published through the end
of 2017.
Cost assumptions (square foot construction costs, soft costs, operating expenses, etc.) are based primarily on recent comparable developer pro formas, as well as on secondary
sources such as per square foot construction cost estimates from RS Means.
Financing assumptions are also sourced primarily from recent pro formas, as well as from HUD, TCAC and California Debt Limit Allocation Committee (CDLAC) for the affordable housing components of each project.

Page 42 Affordable Housing Phase II Feasibility Analysis Final AFH Phase II Feasibility Analysis 02-09-18.doc 2/9/2018
Development Scenarios Alternative development scenarios were developed for each of the two sites based on the land use, zoning and planning analysis presented above. In each case, the development programs would be permitted within existing land use and zoning regulations either by right, or with a variance and/or discretionary permit. Family Court Site. The Family Court site’s development potential is constrained by a number of local plans, overlay districts, and regulations. The basic development scenario tested for this analysis assumes 100 total residential dwelling units with 40 percent of the total ground floor area set aside for commercial retail uses. This is well within already permitted density, height and FAR limits for the site, and there may opportunities for further densification. This prototype conservatively assumes a four to five story wood frame building over a concrete podium with structured “half-down” parking. In addition, a higher density prototype was tested for this site with a total of 185 units. This prototype would maximize the development potential of the site, but would bring higher costs associated with a concrete or steel-frame construction type. Crime Lab Site. The Crime Lab site will require a discretionary permit in order for residential development to occur. The hypothetical development program for this site assumes a maximum of 116 residential units with a small 10,000 square foot neighborhood serving retail component. The residential and retail components of the development are served by surface parking. In addition, a lower density for-sale prototype was tested for this site that assumes a maximum of 15 dwelling units to the acre for attached townhomes. This prototype does not include a commercial component and parking is included in the footprint of the individual townhomes.
Feasibility Findings As mentioned above, developer profit and fees are already incorporated into the pro formas as a cost item, so feasibility is not defined in terms of a percent return on development costs, internal rate of return (IRR) or other conventional bottom line measures of profit that would typically be found in a developer pro forma. Instead, these pro formas take into account total development costs in comparison to an estimate of development value in order to derive total residual land value for each site and also land value per unit. These land values are what the County could hope to potentially achieve either through a fee simple sale of the sites, or through a long-term ground lease. In the case of a ground lease, a small discount is sometimes applied to land values assuming that this is a less attractive alternative for developers and their lenders and investors,

Affordable Housing Phase II Feasibility Analysis Page 43 Final AFH Phase II Feasibility Analysis 02-09-18.doc 2/9/2018
but in this case no discount has yet been applied taking into account the recent success of the ground lease structure for other sites owned by the County, and also taking into account the County’s strong preference for a ground lease deal structure.
Family Court Findings and Recommendations As displayed in Table 1-1 and Appendix A, three hypothetical prototypes were tested for the Family Court site. All three prototypes include a total of 100 units or 185 units, split between one – and two-bedroom unit types. In addition all three prototypes include a ground floor retail component per local zoning regulations. The first of the Family Court prototypes is a mixed-income rental housing property with a 50 percent affordable housing component. As shown, this prototype would result in a negative residual land value for the 100 unit and 185 unit alternatives. The project could be made feasible assuming either a lower affordable housing set aside, or that the affordable units are financed separately through low-income housing tax credits. The second of the Family Court prototypes is a 100 percent affordable project that would be targeted to households earning 55 percent or less of the TCAC income limits. This project would be financed through a mix of four percent tax credits, tax exempt bonds, AHSC and local subsidy sources. Given the relatively shallow subsidy provided by the four percent credit and also taking into account declining tax credit prices (underwritten at $.97 here), this prototype does not achieve feasibility. It could, however, achieve marginally positive land values with a combination of additional subsidy sources (MHSA for example) and if the County is able to underwrite the costs of building demolition. The final Family Court prototype tested is 100 percent affordable development targeted to households earning 45 percent or less of AMI. Financed with nine percent low-income housing tax credits, this development would likely need to serve one or more special needs populations in order to be successful in the highly competitive nine percent tax credit application process (see description above in Chapter 4.0). Assuming that a project sponsor is successful at obtaining nine percent tax credits in combination with other common sources of affordable housing subsidy, the project would return a residual land value $1M or approximately $10,063 per unit on the case of the 100 unit prototype and $4,000 per unit or approximately $742,000 in the case of the 185 unit prototype.

Page 44 Affordable Housing Phase II Feasibility Analysis Final AFH Phase II Feasibility Analysis 02-09-18.doc 2/9/2018
Key Recommendations Based on the three prototypes examined for the Family Court site, the following recommendations are provided to suggest specific ways that the County can work in advance of or during the RFSQ/RFP developer solicitations process to enhance the feasibility of mixed-income and affordable development and in the process create greater value for the County and more certainty for potential developer partners: 1) Consider asking the City of San Diego/Civic San Diego to remove the ground floor
commercial requirement for the property in favor of a requirement that provides greater
flexibility to the development community while still activating the street.
2) Consider underwriting the cost of demolition, including any related environmental testing
and analysis that needs to take place for the site to be development ready.
3) Consider allowing greater flexibility in terms of options for satisfying local parking requirements (including for ground floor commercial uses). This may include shared parking,
car sharing services or accommodations for alternative transportation modes.
4) The County may wish to work with the City and Civic San Diego to clarify and streamline the development entitlements process for the site in advance of selecting a developer partner.
Crime Lab Findings and Recommendations Also displayed in Table 1-1 and Appendix A, four hypothetical prototypes were tested for the Crime Lab site. The three rental prototypes include a total of 116 units, which is the maximum number or residential units allowed under current base zoning, even with an exception. The three rental prototypes include a ground floor retail component that would be neighborhood serving, while the fourth prototype is 100 percent for-sale market-rate community. The first of the Crime Lab prototypes is a mixed-income rental housing property with a 50 percent affordable housing component. As shown, this alternative would not be feasible unless the affordable housing portion is reduced, or financed separately using low income housing tax credits in combination with other sources of funding. The second of the Crime Lab prototypes is modeled as a 100 percent affordable project that would be targeted to households earning 60 percent or less of the TCAC income limits. This project would be financed through a mix of four percent tax credits, tax exempt bonds, AHSC and local subsidy sources. As with the Family Court site, this porotype would be unlikely to be feasible without additional subsidy and the support of the County in demolishing the existing crime lab structures

Affordable Housing Phase II Feasibility Analysis Page 45 Final AFH Phase II Feasibility Analysis 02-09-18.doc 2/9/2018
The third Crime Lab rental prototype is 100 percent affordable development targeted to households earning 50 percent or less of AMI. Financed with nine percent low-income housing tax credits, this development would also likely need to serve one or more special needs populations in order to be successful in the highly competitive nine percent tax credit application process (see description above in Chapter 4.0). Assuming that a project sponsor is successful at obtaining nine percent tax credits in combination with other common sources of affordable housing subsidy, the project would return a residual land value $2.7M or approximately $23,000 per unit. The fourth and final prototype is multifamily for-sale development with market-rate townhomes targeted to moderate- and above-moderate-income buyers. In this scenario, 25 percent of the units would be sold with deed restrictions requiring the buyers to earn no more than 120 percent of AMI. Assuming an average market for sale price of $570,000 and a deed-restricted sale price of $362,000, this prototype achieves the highest residual land cost of any of the alternatives tested. The resulting per unit land value of $57,000 would also potentially permit the County to invest in other community projects of benefit to the surrounding neighborhood. Key Recommendations Based on the four prototypes examined for the Crime Lab site, the following recommendations are provided to suggest specific ways that the County can work in advance of or during the RFSQ/RFP developer solicitations process to enhance the feasibility of all the development types analyzed, but particularly the rental housing prototypes. Specifically, the County should:
1) Work proactively to change local land use controls and zoning to permit residential development on the site, and higher densities than would currently be possible. This would increase the likelihood of feasibility for a potential development partner, and result
in higher land values for the County.
2) Consider underwriting the cost of demolition, including any related environmental testing
and analysis that needs to take place for the site to be development ready.
3) Allow developers the flexibility to mix market-rate and affordable projects on the site,
including rental and for-sale housing while maintaining the ground lease.
4) Encourage strategies for mixed-use development that provide neighborhood retail, services and other community amenities to the site, in order to enhance its attractiveness as a residential location.

Page 46 Affordable Housing Phase II Feasibility Analysis Final AFH Phase II Feasibility Analysis 02-09-18.doc 2/9/2018
This page intentionally left blank.

Affordable Housing Phase II Feasibility Analysis Page 47 Final AFH Phase II Feasibility Analysis 02-09-18.doc 2/9/2018
CHAPTER 6.0 LITERATURE CITED
California Tax Credit Allocation Committee 2017 Maximum Rents For Projects Placed in Service on or After 4/14/17, revised per
HUD Notice.
Centre City Development Corporation 2013 San Diego Downtown Community Plan. Amended.
City of San Diego 2010 San Diego Municipal Code. Amended.
2011 Clairemont Mesa Community Plan. Amended February 17.
2013 General Plan Housing Element 2013-2020. Adopted March 4.
Integra Realty Resources 2017 Viewpoint: 2018 Commercial Real Estate Trends Report, An Integra Realty
Resources Publication.
LeSar Development Consultants 2015 The City of San Diego Fiscal Year 2015-2019 Consolidated Plan and Fiscal Year
2015 Action Plan. Prepared for the City of San Diego Planning, Neighborhoods and Economic Development Department. July 31.
Keyser Marston Associates, Inc. 2017 Construction Costs for San Diego Housing Commission Partnership
Developments. March 10.
Ricondo & Associates, Inc. 2014 San Diego International Airport Land Use Compatibility Plan. Prepared for San
Diego County Regional Airport Authority. Amended May 1.
San Diego Housing Commission 1997 Allowances for Tenant-Furnished Utilities and Other Services, U.S. Department
of Housing and Urban Development, Office of Public and Indian Housing. Handbook 7420.8. Spreadsheet (ver13) based on form HUD-52667. December.

Page 48 Affordable Housing Phase II Feasibility Analysis Final AFH Phase II Feasibility Analysis 02-09-18.doc 2/9/2018
This page intentionally left blank.

APPENDIX A
PRO FORMA TABLES

Family Court Development Mixed-Use/Mixed-Income Alternative
Development Program Assumptions Revenue, Cost and Financing Assumptions Development Costs Value AnalysisSite Area (Acres) 0.69 Residential Demolition Costs 2,200,000$ Residential - Market RateSite Area (sq. ft.) 30,056 Hard Construction Costs (per sq. ft.) (a) 220$ Gross Income 1,650,000$
Soft Costs as % of Hard Costs 25% Residential Less: Operating Costs (495,000)$ Development Project Components Cap Rate (b) 4.50% Hard Costs: Less: Vacancy (57,750)$
Residential 15,180,000$ Residential Market Aff. (c) Parking 2,000,000$ Residential - AffordableMultifamily Residential (gross sq. ft.) 69,000 Permits and Fees/unit (d) 15,000$ 15,000$ Soft Costs 4,295,000$ Gross Income 292,050$
% Affordable 50% Avg. Monthly Rent - One-Bedroom Units 2,500$ 888$ Permits and Fees 1,500,000$ Less: Operating Costs (87,615)$ Sq Ft. Affordable 34,500 Avg. Monthly Rent - Two-Bedroom Units 3,000$ 1,059$ Total: Hard and Soft Costs 22,975,000$ Less: Vacancy (10,222)$
Residential FAR 2.3 Annual Operating Costs (% of Gross Income) 30% 30% Less: LIHTC Equity -$ Number of Units (Total) 100 Vacancy 5% 5% Residential NOI 1,291,463$
One-Bedroom Units (market rate) 25 Loan: 16,082,500$ Two-Bedroom Units (market rate) 25 Retail Points 321,650$ Capitalized Value - Residential 28,699,183$ One-Bedroom Units (affordable) 13 Hard Construction Costs (per sq. ft.) (a) 165$ Interest 868,455$ Two-Bedroom Units (affordable) 13 Soft Costs as % of Hard Costs 20% Subtotal Residential 26,365,105$ Retail
TI Allowance 25.00$ Residential/Unit 263,651.05$ Gross Income 273,000$ Common Area Factor Impact Fees/gross bldg. sq. ft. (d) 2.00$ Retail Less: Vacancy (54,600)$
Ratio Rentable Sq. Ft. to Gross Sq. Ft. 0.85 Rent (NNN/sq.ft./month) 1.75$ Hard Costs 2,145,000$ NOI 218,400$ Vacancy (% of gross income) 20% Soft Costs 429,000$ Capitalized Value - Retail 3,360,000$
Average Unit Size Cap Rate (b) 6.5% Impact Fees 26,000$ One-Bedroom Units (rentable sq. ft.) 750 TI Costs 325,000$ Residual Land ValueTwo-Bedroom Units (rentable sq. ft.) 850 Project-wide Costs Loan: 2,047,500$ Total Capitalized Value 32,059,183$
Demolition Costs (per sq.ft.) -$ Points 40,950$ Less: Total Dev Costs - Res. & Retail (35,596,823)$ Residential Parking Structured/Podium Parking Cost/Space 20,000$ Interest 110,565$ Residual Land Value (3,537,639)$
Parking Ratio (spaces/res. Unit) 1.00 Below Ground Parking Cost/Space 30,000$ Subtotal Retail 3,076,515$ Residual Land Value/Square Foot (118)$ Total Spaces 100 Developer Profit as a % of Hard & Soft Costs 12.5% Land Value/Unit (35,376)$ Structured Spaces 100Underground Spaces 0 Affordable Housing Financing Developer Profit 3,955,203$
Total Hard Costs - Units and Parking Total Development Costs 35,596,823$ Spaces Allocated to Aff. Units 25 Construction Loan
Structured Spaces (Aff. Units) 25 Tax Credit Rate 0.0%Tax Credit Price
Retail Developer FinancingRetail (sq. ft.) 13,000 Loan to Value Ratio 70%
Interest Rate 4.5%Period of Initial Loan (Months) 24Initial Construction Loan Fee (Points) 2.0%Average Outstanding Balance 60%Amount of Loan
Notes:(a) Based on comparable recent housing pro formas for the urban infill sites, as well as RS MEANS, 2017. (b) Source: modified by AECOM from Integra Reality Services, 2018. (c) Affordable rents calculated as 30% of monthly housing costs for a household at 55% of AMI, minus a utility allowance. Rent for one-bedroom units calculated based on two-person household. Rent for two-bedroom units calculatedbased on a three-person household. (d) Impact fees represent general estimate from AECOM.
8,090,000$ 8,090,000$
-$
18,130,000$

Family Court Development Site 60% AMI Affordable Alternative (4% Tax Credits + Bond)
Development Program Assumptions Revenue, Cost and Financing Assumptions Development Costs Gap AnalysisSite Area (Acres) 0.69 Residential Land Costs -$ Site Area (sq. ft.) 30,056 Hard Construction Costs (per sq. ft.) (a) 220$ Demolition Costs 2,200,000$ Gross Income 1,168,200$
Soft Costs as % of Hard Costs 25% Less: Operating Costs 467,280$ Multifamily Residential (gross sq. ft.) 87,688 Cap Rate (b) 5.00% Hard Costs: Less: Vacancy 58,410$
Number of Units (Total) 100 Land Cost/Acre -$ Residential 19,291,250$ One-Bedroom Units (affordable) 50 Parking 2,268,800$ Residential NOI 642,510$ Two-Bedroom Units (affordable) 50 Permits and Fees/unit 10,000$ Retail 2,217,600$ Debt Service 558,704$
Avg. Monthly Rent - One-Bedroom Units (c) 888$ Soft Costs 5,390,013$ Tax Exempt Bond 9,661,134$ Common Area Factor Avg. Monthly Rent - Two-Bedroom Units (c) 1,059$ Impact Fees 1,000,000$
Ratio Rentable Sq. Ft. to Gross Sq. Ft. 0.85 Annual Operating Costs (% of Gross Income) 40% Total: Hard and Soft Costs 30,167,663$ Tax Credit Equity 10,455,843$ Vacancy 5% Subsidy Sources 7,500,000$
Average Unit Size Cons. Loan (tax exempt bond): 21,117,364$ One-Bedroom Units (rentable sq. ft.) 700 Structured/Podium Parking Cost/Space 20,000$ Points 739,108$ Total Residential Sources 27,616,977$ Two-Bedroom Units (rentable sq. ft.) 825 Interest 844,695$
Developer Fee as a % of Hard & Soft Costs 10.0% RetailResidential Parking Developer Fee 3,016,766$ Gross Income 282,240$
Parking Ratio (spaces/res. Unit) 0.50 Tax Credit Financing Less: Vacancy (56,448)$
Total Spaces 50 Total Hard Costs - Units and Parking 20,291,250$ 33,166,829$ NOI 225,792$
Structured Spaces 50 Total Development Costs 33,166,829$ 331,668.29$ Capitalized Value - Retail 3,473,723$ LIHTC Basis 33,166,829$
Retail Assumptions Tax Credit Rate 3.3% Total Dev Costs 35,384,429$ Total Development Costs 33,166,829$ Retail (sq. ft.) 13,440 Tax Credit Price 0.97$ total Dev. Costs/Sq. Ft. $350Structured Spaces 13 Funding Gap 5,549,852$
Develoment Cost/Sq. Ft. 165$ Bond Financing Residual Land Value (5,549,852)$ Retail Lease Rate (NNN) $1.75 Loan to Value Ratio 70% Land Value/Unit (55,499)$
Retail Vacancy 20% Debt Service Coverage Ratio 1.15 Retail Cap Rate 6.5% Interest Rate 4.0%
Period of Initial Loan (before conversion ) 24Point/Fees 3.5%
Subsidy Sources Per Unit Total San Diego County Housing Trust Fund 50,000$ 5,000,000$ AHSC 25,000$ 2,500,000$ Source 3 -$ -$
Notes:(a) Source: RS Means, 2017. Includes cost escalation for San Diego. Integra Realty Resources, 2018. (c) Affordable rents calculated as 30% of monthly housing costs for a household at 55% of AMI, minus a utility allowance. Rent for one-bedroom units calculated based on two-person household. Rent for two-bedroom units calculatedbased on a three-person household.
Total Res. Development CostsTotal Res. Development Costs/Unit

Family Court Development Site 45% AMI Affordable Alternative (9% Tax Credits)
Development Program Assumptions Revenue, Cost and Financing Assumptions Development Costs Gap AnalysisSite Area (Acres) 0.69 Residential Land Costs -$ Site Area (sq. ft.) 30,056 Hard Construction Costs (per sq. ft.) (a) 220$ Demolition Costs 2,200,000$ Gross Income 942,600$
Soft Costs as % of Hard Costs 25% Less: Operating Costs 471,300$ Multifamily Residential (gross sq. ft.) 87,688 Cap Rate (b) 5.00% Hard Costs: Less: Vacancy 47,130$
Number of Units (Total) 100 Land Cost/Acre -$ Residential 19,291,250$ One-Bedroom Units (affordable) 50 Parking 2,240,000$ Residential NOI 424,170$ Two-Bedroom Units (affordable) 50 Permits and Fees/unit 10,000$ Retail 1,980,000$ Debt Service 368,843$
Avg. Monthly Rent - One-Bedroom Units (c) 717$ Soft Costs 5,382,813$ Perm Loan 5,360,677$ Common Area Factor Avg. Monthly Rent - Two-Bedroom Units (c) 854$ Impact Fees 1,000,000$
Ratio Rentable Sq. Ft. to Gross Sq. Ft. 0.85 Annual Operating Costs (% of Gross Income) 50% Total: Hard and Soft Costs 32,094,063$ Tax Credit Equity 24,469,090$ Vacancy 5% Subsidy Sources 4,500,000$
Average Unit Size Cons. Loan 24,070,547$ One-Bedroom Units (rentable sq. ft.) 700 Structured/Podium Parking Cost/Space 20,000$ Points 601,764$ Total Residential Sources 34,329,767$ Two-Bedroom Units (rentable sq. ft.) 825 Interest 1,083,175$
Developer Fee as a % of Hard & Soft Costs 10.0% RetailResidential Parking Developer Fee 3,209,406$ Gross Income 252,000$
Parking Ratio (spaces/res. Unit) 0.50 Tax Credit Financing Less: Vacancy (50,400)$ Total Spaces 50 Total Hard Costs - Units and Parking 20,291,250$ Total Res. Development Costs 33,323,469$ NOI 201,600$
Structured Spaces 50 Total Development Costs 33,323,469$ 333,235$ Capitalized Value - Retail 3,101,538$ LIHTC Basis 33,323,469$
Retail Assumptions Tax Credit Rate 7.6% Total Dev Costs 35,303,469$ Total Development Costs 33,323,469$ Retail (sq. ft.) 12,000 Tax Credit Price 0.97$ Total Dev. Costs/Sq. Ft. $354Structured Spaces 12 Funding Gap -$
Develoment Cost/Sq. Ft. 165$ Construction Loan Residual Land Value 1,006,298$ Retail Lease Rate (NNN) $1.75 Loan to Value Ratio 75% Land Value/Unit 10,063$
Retail Vacancy 20% Debt Service Coverage Ratio 1.15 Retail Cap Rate 6.5% Interest Rate 4.5%
Period of Initial Loan (before conversion ) 24Point/Fees 2.5%
Subsidy Sources Per Unit Total San Diego County Housing Trust Fund 20,000$ 2,000,000$ AHSC 25,000$ 2,500,000$ Source 3 -$ -$
Notes:(a) Source: RS Means, 2017. Includes cost escalation for San Diego. Integra Realty Resources, 2018. (c) Affordable rents calculated as 30% of monthly housing costs for a household at 45% of AMI, minus a utility allowance. Rent for one-bedroom units calculated based on two-person household. Rent for two-bedroom units calculatedbased on a three-person household.
Total Res. Development Costs / Unit

Family Court Development Mixed-Use/Mixed-Income Alternative
Development Program Assumptions Revenue, Cost and Financing Assumptions Development Costs Value AnalysisSite Area (Acres) 0.69 Residential Demolition Costs -$ Residential - Market RateSite Area (sq. ft.) 30,056 Hard Construction Costs (per sq. ft.) (a) 250$ Gross Income 3,052,500$
Soft Costs as % of Hard Costs 25% Residential Less: Operating Costs (915,750)$ Development Project Components Cap Rate (b) 4.50% Hard Costs: Less: Vacancy (106,838)$
Residential 42,550,000$ Residential Market Aff. (c) Parking 3,700,000$ Residential - AffordableMultifamily Residential (gross sq. ft.) 170,200 Permits and Fees/unit (d) 15,000$ 15,000$ Soft Costs 11,562,500$ Gross Income 1,080,585$
% Affordable 50% Avg. Monthly Rent - One-Bedroom Units 2,500$ 888$ Permits and Fees 2,775,000$ Less: Operating Costs (324,176)$ Sq Ft. Affordable 85,100 Avg. Monthly Rent - Two-Bedroom Units 3,000$ 1,059$ Total: Hard and Soft Costs 60,587,500$ Less: Vacancy (37,820)$
Residential FAR 5.7 Annual Operating Costs (% of Gross Income) 30% 30% Less: LIHTC Equity -$ Number of Units (Total) 185 Vacancy 5% 5% Residential NOI 2,748,502$
One-Bedroom Units (market rate) 46 Loan: 42,411,250$ Two-Bedroom Units (market rate) 46 Retail Points 848,225$ Capitalized Value - Residential 61,077,812$ One-Bedroom Units (affordable) 46 Hard Construction Costs (per sq. ft.) (a) 165$ Interest 2,290,208$ Two-Bedroom Units (affordable) 46 Soft Costs as % of Hard Costs 20% Subtotal Residential 63,725,933$ Retail
TI Allowance 25.00$ Residential/Unit 344,465$ Gross Income 273,000$ Common Area Factor Impact Fees/gross bldg. sq. ft. (d) 2.00$ Retail Less: Vacancy (54,600)$
Ratio Rentable Sq. Ft. to Gross Sq. Ft. 0.85 Rent (NNN/sq.ft./month) 1.75$ Hard Costs 2,145,000$ NOI 218,400$ Vacancy (% of gross income) 20% Soft Costs 429,000$ Capitalized Value - Retail 3,360,000$
Average Unit Size Cap Rate (b) 6.5% Impact Fees 26,000$ One-Bedroom Units (rentable sq. ft.) 750 TI Costs 325,000$ Residual Land ValueTwo-Bedroom Units (rentable sq. ft.) 850 Project-wide Costs Loan: 2,047,500$ Total Capitalized Value 64,437,812$
Demolition Costs (per sq.ft.) -$ Points 40,950$ Less: Total Dev Costs - Res. & Retail (75,152,753)$ Residential Parking Structured/Podium Parking Cost/Space 20,000$ Interest 110,565$ Residual Land Value (10,714,942)$
Parking Ratio (spaces/res. Unit) 1.00 Below Ground Parking Cost/Space 30,000$ Subtotal Retail 3,076,515$ Residual Land Value/Square Foot (356)$ Total Spaces 185 Developer Profit as a % of Hard & Soft Costs 12.5% Land Value/Unit (57,919)$ Structured Spaces 185Underground Spaces 0 Affordable Housing Financing Developer Profit 8,350,306$
Total Hard Costs - Units and Parking Total Development Costs 75,152,753$ Spaces Allocated to Aff. Units 37 Construction Loan
Structured Spaces (Aff. Units) 37 Tax Credit Rate 0.0%Tax Credit Price
Retail Developer FinancingRetail (sq. ft.) 13,000 Loan to Value Ratio 70%
Interest Rate 4.5%Period of Initial Loan (Months) 24Initial Construction Loan Fee (Points) 2.0%Average Outstanding Balance 60%Amount of Loan
Notes:(a) Based on comparable recent housing pro formas for the urban infill sites, as well as RS MEANS, 2017. (b) Source: modified by AECOM from Integra Reality Services, 2018. (c) Affordable rents calculated as 30% of monthly housing costs for a household at 55% of AMI, minus a utility allowance. Rent for one-bedroom units calculated based on two-person household. Rent for two-bedroom units calculatedbased on a three-person household. (d) Impact fees represent general estimate from AECOM.
22,015,000$ 22,015,000$
-$
44,458,750$

Family Court Development Site 60% AMI Affordable Alternative (4% Tax Credits + Bond)
Development Program Assumptions Revenue, Cost and Financing Assumptions Development Costs Gap AnalysisSite Area (Acres) 0.69 Residential Land Costs -$ Site Area (sq. ft.) 30,056 Hard Construction Costs (per sq. ft.) (a) 250$ Demolition Costs 2,200,000$ Gross Income 2,161,170$
Soft Costs as % of Hard Costs 25% Less: Operating Costs 864,468$ Multifamily Residential (gross sq. ft.) 162,222 Cap Rate (b) 5.00% Hard Costs: Less: Vacancy 108,059$
Number of Units (Total) 185 Land Cost/Acre -$ Residential 40,555,469$ One-Bedroom Units (affordable) 93 Parking 3,988,800$ Residential NOI 1,188,644$ Two-Bedroom Units (affordable) 93 Permits and Fees/unit 10,000$ Retail 2,217,600$ Debt Service 1,033,603$
Avg. Monthly Rent - One-Bedroom Units (c) 888$ Soft Costs 11,136,067$ Tax Exempt Bond 17,873,098$ Common Area Factor Avg. Monthly Rent - Two-Bedroom Units (c) 1,059$ Impact Fees 1,850,000$
Ratio Rentable Sq. Ft. to Gross Sq. Ft. 0.85 Annual Operating Costs (% of Gross Income) 40% Total: Hard and Soft Costs 61,947,936$ Tax Credit Equity 20,782,897$ Vacancy 5% Subsidy Sources 13,875,000$
Average Unit Size Cons. Loan (tax exempt bond): 43,363,555$ One-Bedroom Units (rentable sq. ft.) 700 Structured/Podium Parking Cost/Space 20,000$ Points 1,517,724$ Total Residential Sources 52,530,995$ Two-Bedroom Units (rentable sq. ft.) 825 Interest 1,734,542$
Developer Fee as a % of Hard & Soft Costs 10.0% RetailResidential Parking Developer Fee 6,194,794$ Gross Income 282,240$
Parking Ratio (spaces/res. Unit) 0.50 Tax Credit Financing Less: Vacancy (56,448)$ Total Spaces 93 Total Hard Costs - Units and Parking 42,415,469$ Total Res. Development Costs 65,925,130$ NOI 225,792$ Structured Spaces 93 Total Development Costs 65,925,130$ Total Res. Development Costs/ 356,352$ Capitalized Value - Retail 3,473,723$
LIHTC Basis 65,925,130$ Retail Assumptions Tax Credit Rate 3.3% Total Dev Costs 68,142,730$ Total Development Costs 65,925,130$
Retail (sq. ft.) 13,440 Tax Credit Price 0.97$ total Dev. Costs/Sq. Ft. $388Structured Spaces 13 Funding Gap 13,394,134$
Develoment Cost/Sq. Ft. 165$ Bond Financing Residual Land Value (13,394,134)$ Retail Lease Rate (NNN) $1.75 Loan to Value Ratio 70% Land Value/Unit (72,401)$
Retail Vacancy 20% Debt Service Coverage Ratio 1.15 Retail Cap Rate 6.5% Interest Rate 4.0%
Period of Initial Loan (before conversion ) 24Point/Fees 3.5%
Subsidy Sources Per Unit Total San Diego County Housing Trust Fund 50,000$ 9,250,000$ AHSC 25,000$ 4,625,000$ Source 3 -$ -$
Notes:(a) Source: RS Means, 2017. Includes cost escalation for San Diego. Integra Realty Resources, 2018. (c) Affordable rents calculated as 30% of monthly housing costs for a household at 55% of AMI, minus a utility allowance. Rent for one-bedroom units calculated based on two-person household. Rent for two-bedroom units calculatedbased on a three-person household.

Family Court Development Site 45% AMI Affordable Alternative (9% Tax Credits)
Development Program Assumptions Revenue, Cost and Financing Assumptions Development Costs Gap AnalysisSite Area (Acres) 0.69 Residential Land Costs -$ Site Area (sq. ft.) 30,056 Hard Construction Costs (per sq. ft.) (a) 250$ Demolition Costs 2,200,000$ Gross Income 1,743,810$
Soft Costs as % of Hard Costs 25% Less: Operating Costs 871,905$ Multifamily Residential (gross sq. ft.) 162,222 Cap Rate (b) 5.00% Hard Costs: Less: Vacancy 87,191$
Number of Units (Total) 185 Land Cost/Acre -$ Residential 40,555,469$ One-Bedroom Units (affordable) 93 Parking 3,960,000$ Residential NOI 784,715$ Two-Bedroom Units (affordable) 93 Permits and Fees/unit 10,000$ Retail 1,980,000$ Debt Service 682,360$
Avg. Monthly Rent - One-Bedroom Units (c) 717$ Soft Costs 11,128,867$ Perm Loan 9,917,253$ Common Area Factor Avg. Monthly Rent - Two-Bedroom Units (c) 854$ Impact Fees 1,850,000$
Ratio Rentable Sq. Ft. to Gross Sq. Ft. 0.85 Annual Operating Costs (% of Gross Income) 50% Total: Hard and Soft Costs 61,674,336$ Tax Credit Equity 48,361,639$ Vacancy 5% Subsidy Sources 8,325,000$
Average Unit Size Cons. Loan 46,255,752$ One-Bedroom Units (rentable sq. ft.) 700 Structured/Podium Parking Cost/Space 20,000$ Points 1,156,394$ Total Residential Sources 66,603,891$ Two-Bedroom Units (rentable sq. ft.) 825 Interest 2,081,509$
Developer Fee as a % of Hard & Soft Costs 10.0% RetailResidential Parking Developer Fee 6,167,434$ Gross Income 252,000$
Parking Ratio (spaces/res. Unit) 0.50 Tax Credit Financing Less: Vacancy (50,400)$ Total Spaces 93 Total Hard Costs - Units and Parking 42,415,469$ Total Res. Development Costs 65,861,770$ NOI 201,600$ Structured Spaces 93 Total Development Costs 65,861,770$ Total Res. Development Costs/Un 356,010$ Capitalized Value - Retail 3,101,538$
LIHTC Basis 65,861,770$ Retail Assumptions Tax Credit Rate 7.6% Total Dev Costs 67,841,770$ Total Development Costs 65,861,770$
Retail (sq. ft.) 12,000 Tax Credit Price 0.97$ Total Dev. Costs/Sq. Ft. $389Structured Spaces 12 Funding Gap -$
Develoment Cost/Sq. Ft. 165$ Construction Loan Residual Land Value 742,122$ Retail Lease Rate (NNN) $1.75 Loan to Value Ratio 75% Land Value/Unit 4,011$
Retail Vacancy 20% Debt Service Coverage Ratio 1.15 Retail Cap Rate 6.5% Interest Rate 4.5%
Period of Initial Loan (before conversion ) 24Point/Fees 2.5%
Subsidy Sources Per Unit Total San Diego County Housing Trust Fund 20,000$ 3,700,000$ AHSC 25,000$ 4,625,000$ Source 3 -$ -$
Notes:(a) Source: RS Means, 2017. Includes cost escalation for San Diego. Integra Realty Resources, 2018. (c) Affordable rents calculated as 30% of monthly housing costs for a household at 45% of AMI, minus a utility allowance. Rent for one-bedroom units calculated based on two-person household. Rent for two-bedroom units calculatedbased on a three-person household.

Crime Lab Development- Mixed-Use/Mixed-Income Alternative
Development Program Assumptions Revenue, Cost and Financing Assumptions Development Costs Value AnalysisSite Area (Acres) 4.09 Residential Demolition Costs 1,800,000$ Residential - Market RateSite Area (sq. ft.) 178,160 Hard Construction Costs (per sq. ft.) (a) 200$ Gross Income 1,566,000$
Soft Costs as % of Hard Costs 20% Residential Less: Operating Costs (469,800)$ Development Project Components Cap Rate (b) 5.00% Hard Costs: Less: Vacancy (54,810)$
Residential 22,011,000$ Residential Market Aff. (c) Parking 435,000$ Residential - AffordableMultifamily Residential (gross sq. ft.) 110,055 Impact Fees/unit (d) 10,000$ 10,000$ Soft Costs 4,489,200$ Gross Income 677,556$
% Affordable 50% Avg. Monthly Rent - One-Bedroom Units 2,000$ 888$ Impact Fees 1,160,000$ Less: Operating Costs (203,267)$ Sq Ft. Affordable 55,028 Avg. Monthly Rent - Two-Bedroom Units 2,500$ 1,059$ Total: Hard and Soft Costs 28,095,200$ Less: Vacancy (23,714)$
Annual Operating Costs (% of Gross Income) 30% 30% Less: LIHTC Equity -$ Number of Units (Total) 116 Vacancy 5% 5% Residential NOI 1,491,965$
One-Bedroom Units (market rate) 29 Loan: 28,095,200$ Two-Bedroom Units (market rate) 29 Retail Points -$ Capitalized Value - Residential 29,839,295$ One-Bedroom Units (affordable) 29 Hard Construction Costs (per sq. ft.) (a) 140$ Interest 1,517,141$ Two-Bedroom Units (affordable) 29 Soft Costs as % of Hard Costs 20% Subtotal Residential 29,612,341$ Retail
TI Allowance 25.00$ Residential Costs/Unit 255,279$ Gross Income 150,000$ Common Area Factor Impact Fees/gross bldg. sq. ft. (d) 2.00$ Retail Less: Vacancy (30,000)$
Ratio Rentable Sq. Ft. to Gross Sq. Ft. 0.85 Rent (NNN/sq.ft./month) 1.25$ Hard Costs 1,400,000$ NOI 120,000$ Vacancy (% of gross income) 20% Soft Costs 280,000$ Capitalized Value - Retail 1,714,286$
Average Unit Size Cap Rate (b) 7.0% Impact Fees 20,000$ One-Bedroom Units (rentable sq. ft.) 750 TI Costs 250,000$ Residual Land ValueTwo-Bedroom Units (rentable sq. ft.) 900 Project-wide Costs Loan: 1,176,000$ Total Capitalized Value 31,553,581$
Demolition Costs (per sq.ft.) -$ Points 23,520$ Less: Total Dev Costs - Res. & Retail (37,987,745)$ Residential Parking Surface Parking Cost/Space 2,500$ Interest 381,024$ Residual Land Value (6,434,165)$
Parking Ratio (spaces/res. Unit) 1.50 Strcutured Parking Cost/Space 20,000$ Subtotal Retail 2,354,544$ Residual Land Value/Square Foot (36.11)$ Total Spaces 174 Developer Profit as a % of Hard & Soft Costs 13% Land Value/Unit (55,467)$ Surface Parking 174Structred Spaces 0 Affordable Housing Financing Developer Profit 4,220,861$
Total Hard Costs - Units and Parking Total Development Costs 37,987,745$ Spaces Allocated to Aff. Units 35 Construction Loan
Tax Credit Rate 3.2%Tax Credit Price
RetailRetail (sq. ft.) 10,000 Developer Financing 19,666,640$
Loan to Cost Ratio 70%Interest Rate 4.5%Period of Initial Loan (Months) 24Initial Construction Loan Fee (Points) 2.0%Average Outstanding Balance 60%Amount of Loan -$
Notes:(a) Based on comparable recent housing pro formas for the urban infill sites, as well as RS MEANS, 2017. (b) Source: modified by AECOM from Integra Reality Services, 2018. (c) Affordable rents calculated as 30% of monthly housing costs for a household at 55% of AMI, minus a utility allowance. Rent for one-bedroom units calculated based on two-person household. Rent for two-bedroom units calculatedbased on a three-person household. (d) Impact fees represent general estimate from AECOM.
-$ -$
0.97$

Crime Lab Development Site 60% AMI Affordable Alternatives (4% Tax Credits+Bond)
Development Program Assumptions Revenue, Cost and Financing Assumptions Development Costs Gap AnalysisSite Area (Acres) 4.09 Residential Land Costs -$ Site Area (sq. ft.) 178,160 Hard Construction Costs (per sq. ft.) (a) 200$ Demolition Costs 1,800,000$ Gross Income 1,436,544$
Soft Costs as % of Hard Costs 20% Less: Operating Costs 574,618$ Multifamily Residential (gross sq. ft.) 110,055 Cap Rate (b) 5.00% Hard Costs: Less: Vacancy 71,827$
Number of Units (Total) 116 Land Cost/Acre 2,000,000$ Residential 22,011,000$ One-Bedroom Units (affordable) 58 Parking 290,000$ Residential NOI 790,099$ Two-Bedroom Units (affordable) 58 Impact Fees/unit 5,000$ Soft Costs 4,460,200$ Debt Service 687,043$
Avg. Monthly Rent - One-Bedroom Units (c) 938$ Impact Fees 580,000$ Tax Exempt Bond 11,880,367$ Common Area Factor Avg. Monthly Rent - Two-Bedroom Units (c) 1,126$ Total: Hard and Soft Costs 27,341,200$
Ratio Rentable Sq. Ft. to Gross Sq. Ft. 0.85 Annual Operating Costs (% of Gross Income) 40% Tax Credit Equity 10,440,873$ Vacancy 5% Cons. Loan (tax exempt bond) 19,138,840$ Subsidy Sources 5,800,000$
Average Unit Size Points 478,471$ One-Bedroom Units (rentable sq. ft.) 750 Structured/Podium Parking Cost/Space 2,500$ Interest 765,554$ Total Sources 28,121,240$ Two-Bedroom Units (rentable sq. ft.) 900
Developer Fee as a % of Hard & Soft Costs 10.0% Developer Fee 2,734,120$ Total Development Costs 33,119,345$ Residential Parking
Parking Ratio (spaces/res. Unit) 1.00 Tax Credit Financing Total Development Costs 33,119,345$ Funding Gap 4,998,105$ Total Spaces 116 Total Hard Costs - Units and Parking 22,301,000$ Total Development Costs/Un 285,512$ Residual Land Value (4,998,105)$ Surface Spaces 116 Total Development Costs 33,119,345$ Land Value/Unit (43,087)$
LIHTC Basis 33,119,345$ Tax Credit Rate 3.3%Tax Credit Price 0.97$
Bond Financing Loan to Value Ratio 70%Debt Service Coverage Ratio 1.15 Interest Rate 4.0%Period of Initial Loan (before conversion ) 24Point/Fees 2.5%
Subsidy Sources Per Unit Total San Diego County Housing Trust Fund 50,000$ 5,800,000$ AHSC -$ -$ Source 3 -$ -$
Notes:(a) Source: RS Means, 2017. Includes cost escalation for San Diego. Integra Realty Resources, 2018. (c) Affordable rents calculated as 30% of monthly housing costs for a household at 60% of AMI, minus a utility allowance. Rent for one-bedroom units calculated based on two-person household. Rent for two-bedroom units calculatedbased on a three-person household.

Crime Lab Development Site - 50% AMI Affordable
Development Program Assumptions Revenue, Cost and Financing Assumptions Development Costs Gap AnalysisSite Area (Acres) 4.09 Residential Land Costs $0Site Area (sq. ft.) 178,160 Hard Construction Costs (per sq. ft.) (a) 200$ Demolition Costs $1,800,000 Gross Income 1,224,264$
Soft Costs as % of Hard Costs 20% Less: Operating Costs 489,706$ Multifamily Residential (gross sq. ft.) 110,055 Cap Rate (b) 5.00% Hard Costs: Less: Vacancy 61,213$
Number of Units (Total) 116 Land Cost/Acre -$ Residential $22,011,000One-Bedroom Units (affordable) 58 Parking $0 Residential NOI 673,345$ Two-Bedroom Units (affordable) 58 Impact Fees/unit 5,000$ Soft Costs $4,402,200 Debt Service 585,518$
Avg. Monthly Rent - One-Bedroom Units (c) 803$ Impact Fees $580,000 Perm Loan 8,509,763$ Common Area Factor Avg. Monthly Rent - Two-Bedroom Units (c) 956$ Total: Hard and Soft Costs $26,993,200
Ratio Rentable Sq. Ft. to Gross Sq. Ft. 0.85 Annual Operating Costs (% of Gross Income) 40% Tax Credit Equity 24,098,341$ Vacancy 5% Cons. Loan $20,244,900 Subsidy Sources 2,900,000$
Average Unit Size Points $506,123One-Bedroom Units (rentable sq. ft.) 750 Surface Parking 2,500$ Interest $819,918 Total Sources 35,508,104$ Two-Bedroom Units (rentable sq. ft.) 900
Developer Fee as a % of Hard & Soft Costs 10.0% Developer Fee $2,699,320 Total Development Costs 32,818,561$ Residential Parking
Parking Ratio (spaces/res. Unit) 1.00 Tax Credit Financing Total Development Costs $32,818,561 Funding Gap -$ Surface Parking 116 Total Hard Costs - Units and Parking 22,301,000$ Total Development Costs/Un $282,919 Residual Land Value 2,689,543$ Structured Spaces 0 Total Development Costs 32,818,561$ Land Value/Unit 23,186$
LIHTC Basis 32,818,561$ Tax Credit Rate 7.6%Tax Credit Price 0.97$
Construction Loan Loan to Value Ratio 75%Debt Service Coverage Ratio 1.15 Interest Rate 4.5%Period of Initial Loan (before conversion ) 24Point/Fees 2.5%
Subsidy Sources Per Unit Total San Diego County Housing Trust Fund 20,000$ 2,320,000$ AHSC 5,000$ 580,000$ Source 3 -$ -$
Notes:(a) Source: RS Means, 2017. Includes cost escalation for San Diego. Integra Realty Resources, 2018. (c) Affordable rents calculated as 30% of monthly housing costs for a household at 50% of AMI, minus a utility allowance. Rent for one-bedroom units calculated based on two-person household. Rent for two-bedroom units calculatedbased on a three-person household.

Crime Lab Development Site - For-Sale Townhomes
PROJECT DETAILS DEVELOPMENT COSTSSite Size (Sq. Ft.) 178,160 Hard and Soft Costs
Demolition Costs $1,800,000Residential Assumptions On Site Improvements $890,802Density (DUA) 15 Residential Construction Costs $19,171,875% Affordable 25% Residential Fees $613,500Total Number of Units 61 Commercial Construction Costs $0
Market Rate 46 Commercial Impact Fees $0Affordable 15 Tenant Improvement Allowances $0
Avg. Unit Size (Sq. Ft.) 1,250 Common Area % - Parking CostsTotal Residential Sq. Ft. 76,688 Surface $0Parking Ratio - Podium $0
Number of Parking Spaces Other Soft Costs $178,160Surface - Podium 0 Financing Costs
Market Sale Price $575,000 Interest on Construction Loan $875,882Affordable Sale Price (2 Bdr Unit, 120% AMI) $362,832 Points on Construction Loan $291,961
Retail Assumptions Developer Profit $3,303,327Density (FAR) NACommercial Sq. Ft. 0 Total Development Cost $27,125,507Leasable % 90% Residential Cost $25,325,507Leaseable Area 0 Residential Cost / Unit $412,804Parking Ratio (spaces/1000 sq. ft.) 0.002 Commercial Cost $0
Number of Parking SpacesSurface 0Podium 0 Land Value Analysis
Lease Rate (Monthly/Sq. Ft. NNN) $1.25 Residential NOICap Rate 7.00% Gross Sales $32,022,131
Fees and Commissions 7.0% ($2,241,549)Commercial Sq. Ft. as % of Total Sq. Ft. 0.0%
Net Sales Revenues $29,780,581COST ASSUMPTIONSHard and Soft Costs (f) Rental Residential Construction Costs (per sq $250Retail Construction Costs (per sq. ft.) $150 Commercial NOIOn Site Improvements (psf) $5 Lease Revenue $0
Less Vacancy 5% $0Retail TI/Sq. Ft. $25 Less Operating Expenses 15% $0Retail Impact Fees (psf) $25 Net Operating Income $0Residential Fees (Unit) $10,000Commercial Impact Fees (per sq. ft.) Capitalized Value $0Cost/Parking Space
Surface $2,500Podium $20,000 Total Project Value $29,780,581
Other Soft Costs (as % of hard & site costs) 20% Less Development Costs $27,125,507Developer Profit (as % of Total Dev. Cost) 15% Residual Land Value $2,655,074
Land Value/Sq. Ft. $15Financing Costs Land Value/Unit $57,703Interest Rate 5.0%Period of Initial Loan (Months) 24Initial Construction Loan Fee (Points) 0.02Average Outstanding Balance 60%Loan to Cost Ratio 70%


