COUNTY OF ROCKBRIDGE VIRGINIA
190
COUNTY OF ROCKBRIDGE, VIRGINIA COMPREHENSIVE ANNUAL FINANCIAL REPORT FOR THE FISCAL YEAR ENDED JUNE 30, 2016
Transcript of COUNTY OF ROCKBRIDGE VIRGINIA

COUNTY OF ROCKBRIDGE, VIRGINIA
COMPREHENSIVE ANNUAL FINANCIAL REPORT
FOR THE FISCAL YEAR ENDED JUNE 30, 2016

COUNTY OF ROCKBRIDGE, VIRGINIA
COMPREHENSIVE ANNUAL FINANCIAL REPORT
FOR THE FISCAL YEAR ENDED JUNE 30, 2016
Prepared by
Steven Bolster, Director of Fiscal Services
County of Rockbridge, Virginia
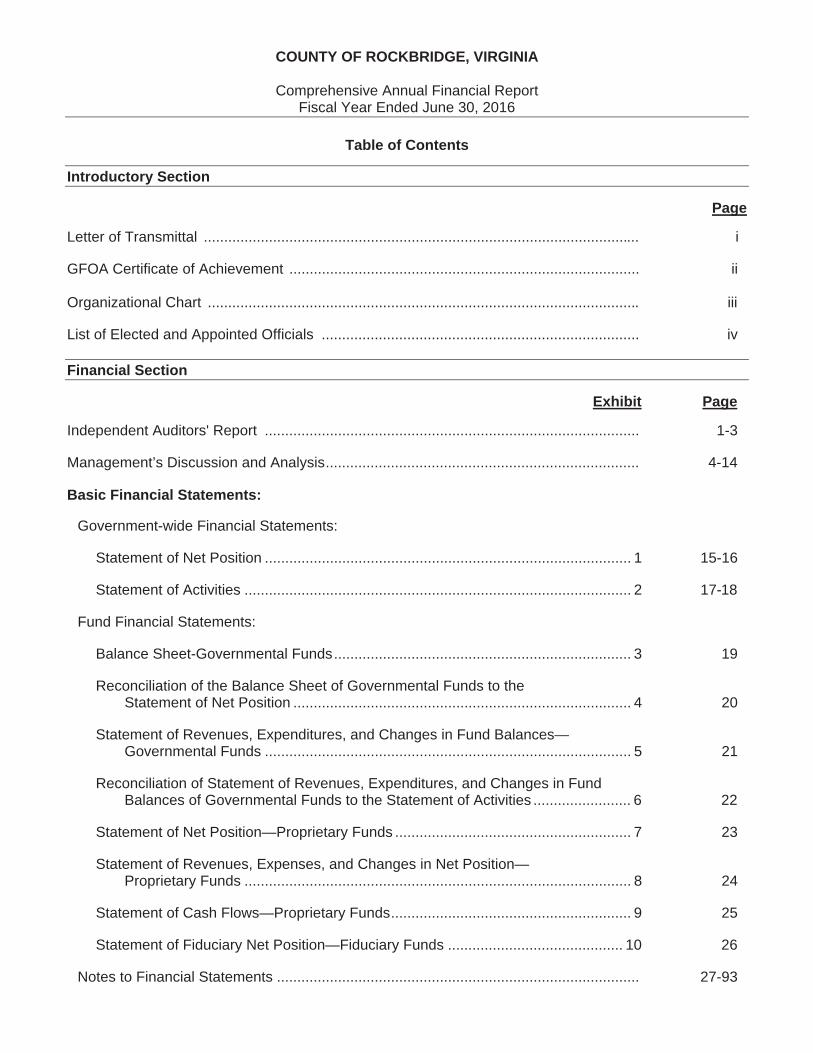
COUNTY OF ROCKBRIDGE, VIRGINIA
Comprehensive Annual Financial Report Fiscal Year Ended June 30, 2016
Table of Contents
Introductory Section
Page
Letter of Transmittal ........................................................................................................... i
GFOA Certificate of Achievement ...................................................................................... ii
Organizational Chart .......................................................................................................... iii
List of Elected and Appointed Officials .............................................................................. iv
Financial Section
Exhibit Page
Independent Auditors' Report ............................................................................................ 1-3
Management’s Discussion and Analysis ............................................................................. 4-14
Basic Financial Statements:
Government-wide Financial Statements:
Statement of Net Position .......................................................................................... 1 15-16
Statement of Activities ............................................................................................... 2 17-18
Fund Financial Statements:
Balance Sheet-Governmental Funds ......................................................................... 3 19
Reconciliation of the Balance Sheet of Governmental Funds to the Statement of Net Position ................................................................................... 4 20
Statement of Revenues, Expenditures, and Changes in Fund Balances— Governmental Funds .......................................................................................... 5 21
Reconciliation of Statement of Revenues, Expenditures, and Changes in Fund Balances of Governmental Funds to the Statement of Activities ........................ 6 22
Statement of Net Position—Proprietary Funds .......................................................... 7 23
Statement of Revenues, Expenses, and Changes in Net Position— Proprietary Funds ............................................................................................... 8 24
Statement of Cash Flows—Proprietary Funds ........................................................... 9 25
Statement of Fiduciary Net Position—Fiduciary Funds ........................................... 10 26
Notes to Financial Statements ......................................................................................... 27-93

COUNTY OF ROCKBRIDGE, VIRGINIA
Comprehensive Annual Financial Report Fiscal Year Ended June 30, 2016
Table of Contents (Continued)
Financial Section (Continued)
Exhibit PageRequired Supplementary Information:
Schedule of Revenues, Expenditures, and Changes in Fund Balances— Budget and Actual – General Fund ................................................................... 11 94
Schedule of Components of and Changes in Net Pension Liability and Related Ratios – Primary Government ........................................................................... 12 95
Schedule of Components of and Changes in Net Pension Liability and Related Ratios – Component Unit Rockbridge Regional Jail Commission .................... 13 96
Schedule of Components of and Changes in Net Pension Liability and Related Ratios – Component Unit School Board (nonprofessional) .............................. 14 97
Schedule of Employer’s Share of Net Pension Liability VRS Teacher Retirement Plan ................................................................................................ 15 98
Schedule of Employer Contributions ........................................................................ 16 99
Notes to Required Supplementary Information ........................................................ 17 100
Schedule of OPEB Funding Progress ...................................................................... 18 101
Other Supplementary Information:
Schedule of Revenues, Expenditures, and Changes in Fund Balances— Budget and Actual:
County Capital Projects Fund ............................................................................... 19 102
Other Capital Projects Fund ................................................................................. 20 103
Combining Statement of Fiduciary Net Position – Fiduciary Funds ................................ 21 104
Combining Statement of Changes in Assets and Liabilities – Agency Funds ................. 22 105
Discretely Presented Component Unit—School Board:
Combining Balance Sheet ....................................................................................... 23 106
Combining Statement of Revenues, Expenditures, and Changes in Fund Balances—Governmental Funds ...................................................................... 24 107
Schedule of Revenues, Expenditures, and Changes in Fund Balances—Budget and Actual .......................................................................... 25 108-109
Statement of Fiduciary Net Position – Fiduciary Fund ............................................. 26 110

COUNTY OF ROCKBRIDGE, VIRGINIA
Comprehensive Annual Financial Report Fiscal Year Ended June 30, 2016
Table of Contents (Continued)
Financial Section (Continued)
Exhibit PageOther Supplementary Information: (continued)
Discretely Presented Component Unit—School Board: (continued)
Statement of Changes in Fiduciary Net Position – Fiduciary Fund ......................... 27 111
Schedule PageSupporting Schedules:
Schedule of Revenues—Budget and Actual—Governmental Funds ............................ 1 112-116
Schedule of Expenditures—Budget and Actual—Governmental Funds ........................ 2 117-120
Statistical Section
Table Page
Net Position by Component .............................................................................................. 1 121-122
Changes in Net Position ................................................................................................... 2 123-126
Governmental Activities Tax Revenues by Source ........................................................... 3 127
Fund Balances of Governmental Funds ........................................................................... 4 128-129
Changes in Fund Balances of Governmental Funds ........................................................ 5 130-131
General Governmental Tax Revenues by Source ............................................................ 6 132
Assessed Value and Estimated Actual Value of Taxable Property ................................... 7 133-134
Property Tax Rates ........................................................................................................... 8 135
Property Tax Levies and Collections ................................................................................ 9 136
Principal Property Taxpayers .......................................................................................... 10 137
Ratios of Outstanding Debt by Type ............................................................................... 11 138-139
Ratio of Net General Bonded Debt to Assessed Value and Net Bonded Debt per Capita ................................................................................................................... 12 140
Pledged-Revenue Coverage ........................................................................................... 13 141
Demographic and Economic Statistics ........................................................................... 14 142
Principal Employers ........................................................................................................ 15 143
Full-time Equivalent County Government Employees by Function ................................. 16 144-145

COUNTY OF ROCKBRIDGE, VIRGINIA
Comprehensive Annual Financial Report Fiscal Year Ended June 30, 2016
Table of Contents (Continued)
Statistical Section (continued)
Table Page
Operating Indicators by Function .................................................................................... 17 146-147
Capital Asset Statistics by Function ................................................................................ 18 148-149
Schedule of the City of Lexington’s and Buena Vista’s Share of Certain General Government Expenditures .......................................................................................... 19 150-151
Compliance Section
Independent Auditors’ Report on Internal Control over Financial Reporting and on Compliance and Other Matters Based on an Audit of Financial Statements Performed in Accordance with Government Auditing Standards ..................................... 152-153
Independent Auditors’ Report on Compliance for Each Major Program and on Internal Control over Compliance Required by the Uniform Guidance .......................................... 154-155
Schedule of Expenditures of Federal Awards ..................................................................... 156-157
Schedule of Findings and Questioned Costs ...................................................................... 158

INTRODUCTORY SECTION


County of Rockbridge Organizational Chart
Revision Date 12/2015 *The Rockbridge County Solid Waste Authority is a blended component unit of the County
Board of Supervisors
Building
Permits
Erosion/Stormwater
Management
Building Maintenance
PreschoolFIre and EMS
Emergency/HazMat
Management
Fleet ServicesSolid Waste*
Landfill Operattions
Recycling
Community Outreach
Parks and RecreationFiscal Services
Information Technology
Central Accounting
Accounts Payable
Rental Assistance
Community Development
Planning and Zoning
GIS
Economic Development
Human Resources
County Attorney
County Administrator
Citizens
Constitutional Offices Clerk of Circuit Court
Commissioner of Revenue Commonwealth Attorney
Sheriff Treasurer
State and Local Offices Circuit Court
Cooperative Extension Electoral Board/Registrar
General District Court Health Department
Magistrate Probation Office Social Services
Environmental Sciences Public Library
Boards and Commissions
iii

COUNTY OF ROCKBRIDGE, VA
BOARD OF SUPERVISORS
John M. Higgins, ChairmanDavid W. Hinty, Jr., Vice Chairman
Ronnie R. CampbellRussell L. Ford
Albert W. Lewis, Jr.
ROCKBRIDGE COUNTY APPOINTED OFFICIALS
County Administrator……………………………………………………………………..…………………Spencer H. SuterCounty Attorney……………………………………………………………………………….………………Vickie L. Huffman
COUNTY SCHOOL BOARD
David B. McDaniel, ChairmanAlbert “Jay” Lewis II, Vice Chairman
Kevin BrooksLaura C. Hoofnagle
Laurie Strong
SCHOOL DIVISION APPOINTED OFFICIALS
Superintendent of Schools………………………………………………………………..…………………Dr. Jack DonaldClerk of the School Board………………………………………………………………………………Rhonda Humphries
LEGISLATIVE ELECTION
Judge of the Circuit Court…….…………………………………….……..…………………Honorable Anita D. FilsonJudge of the General District Court………………………………………………Honorable Gordon F. SaundersJudge of the Juvenile & Domestic District Court…………….…………………Honorable Laura L. Dascher
CONSTITUTIONAL OFFICERS
Clerk of the Circuit Court……………………………………………………………..…………………D. Bruce PattersonCommonwealth’s Attorney………………………….……………………………………………………….……Chris BilliasCommissioner of the Revenue………………….…………………………………..…………………David C. WhitesellSheriff…………………………………………………………………………………………………………Christopher J. BlalockTreasurer……………………………………………………………..………………………………………….…Betty S. Trovato
iv

FINANCIAL SECTION

1
ROBINSON, FARMER, COX ASSOCIATES CERTIFIED PUBLIC ACCOUNTANTS A PROFESSIONAL LIMITED LIABILITY COMPANY
INDEPENDENT AUDITORS' REPORT
TO THE HONORABLE MEMBERS OF THE BOARD OF SUPERVISORS COUNTY OF ROCKBRIDGE, VIRGINIA
Report on the Financial Statements
We have audited the accompanying financial statements of the governmental activities, the business-type activities, the discretely presented component units, each major fund and the aggregate remaining fund information of the County of Rockbridge, Virginia, as of and for the year ended June 30, 2016, and the related notes to the financial statements, which collectively comprise the County’s basic financial statements as listed in the table of contents.
Management’s Responsibility for the Financial Statements
Management is responsible for the preparation and fair presentation of these financial statements in accordance with accounting principles generally accepted in the United States of America; this includes the design, implementation, and maintenance of internal control relevant to the preparation and fair presentation of financial statements that are free from material misstatement, whether due to fraud or error.
Auditors’ Responsibility
Our responsibility is to express opinions on these financial statements based on our audit. We conducted our audit in accordance with auditing standards generally accepted in the United States of America; the standards applicable to financial audits contained in Government Auditing Standards, issued by the Comptroller General of the United States; and the Specifications for Audits of Counties, Cities, and Towns,issued by the Auditor of Public Accounts of the Commonwealth of Virginia. Those standards require that we plan and perform the audit to obtain reasonable assurance about whether the financial statements are free from material misstatement.
An audit involves performing procedures to obtain audit evidence about the amounts and disclosures in the financial statements. The procedures selected depend on the auditors’ judgment, including the assessment of the risks of material misstatement of the financial statements, whether due to fraud or error. In making those risk assessments, the auditor considers internal control relevant to the entity’s preparation and fair presentation of the financial statements in order to design audit procedures that are appropriate in the circumstances, but not for the purpose of expressing an opinion on the effectiveness of the entity’s internal control. Accordingly, we express no such opinion. An audit also includes evaluating the appropriateness of accounting policies used and the reasonableness of significant accounting estimates made by management, as well as evaluating the overall presentation of the financial statements.
We believe that the audit evidence we have obtained is sufficient and appropriate to provide a basis for our audit opinions.

2
Opinions
In our opinion, the financial statements referred to above present fairly, in all material respects, the respective financial position of the governmental activities, the business-type activities, the discretely presented component units, each major fund and the aggregate remaining fund information of the County of Rockbridge, Virginia, as of June 30, 2016, and the respective changes in financial position, and, where applicable cash flows thereof for the year then ended in accordance with accounting principles generally accepted in the United States of America.
Change in Accounting Principle
As described in Note 1 to the financial statements, in 2016, the County adopted new accounting guidance, GASB Statement 79 Certain External Investment Pools and Pool Participants, and No. 82 Pension Issues – an amendment of GASB Statements No. 67, No. 68, and No. 73. Our opinion is not modified with respect to this matter.
Other Matters
Required Supplementary Information
Accounting principles generally accepted in the United States of America require that the management’s discussion and analysis, budgetary comparison information, and schedules related to pension and OPEB funding on pages 4-14, 94, 95-101, respectively, be presented to supplement the basic financial statements. Such information, although not a part of the basic financial statements, is required by the Governmental Accounting Standards Board, who considers it to be an essential part of financial reporting for placing the basic financial statements in an appropriate operational, economic, or historical context. We have applied certain limited procedures to the required supplementary information in accordance with auditing standards generally accepted in the United States of America, which consisted of inquiries of management about the methods of preparing the information and comparing the information for consistency with management’s responses to our inquiries, the basic financial statements, and other knowledge we obtained during our audit of the basic financial statements. We do not express an opinion or provide any assurance on the information because the limited procedures do not provide us with sufficient evidence to express an opinion or provide any assurance. The budgetary comparison information has been subjected to the auditing procedures applied in the audit of the basic financial statements and, in our opinion, is fairly stated in all material respects in relation to the basic financial statements taken as a whole.
Other Information
Our audit was conducted for the purpose of forming opinions on the financial statements that collectively comprise the County of Rockbridge, Virginia’s basic financial statements. The introductory section, other supplementary information, and statistical section, are presented for purposes of additional analysis and are not a required part of the basic financial statements. The schedule of expenditures of federal awards is presented for purposes of additional analysis as required by Title 2 U.S. Code of Federal Regulations (CFR) Part 200, Uniform Administrative Requirements, Cost Principles, and Audit Requirements for Federal Awards(Uniform Guidance), and is also not a required part of the financial statements. The other supplementary information and the schedule of expenditures of federal awards are the responsibility of management and were derived from and relate directly to the underlying accounting and other records used to prepare the basic financial statements. Such information has been subjected to the auditing procedures applied in the audit of the basic financial statements and certain additional procedures, including comparing and reconciling such information directly to the underlying accounting and other records used to prepare the financial statements or to the basic financial statements themselves, and other additional procedures in accordance with auditing standards generally accepted in the United States of America. In our opinion, other supplementary information and the schedule of expenditures of federal awards are fairly stated in all material respects in relation to the basic financial statements as a whole.

3
The introductory and statistical sections have not been subjected to the auditing procedures applied in the audit of the basic financial statements and, accordingly, we do not express an opinion or provide any assurance on them.
Other Reporting Required by Government Auditing Standards
In accordance with Government Auditing Standards, we have also issued our report dated December 18, 2016, on our consideration of the County of Rockbridge, Virginia’s internal control over financial reporting and on our tests of its compliance with certain provisions of laws, regulations, contracts, and grant agreements and other matters. The purpose of that report is to describe the scope of our testing of internal control over financial reporting and compliance and the results of that testing, and not to provide an opinion on internal control over financial reporting or on compliance. That report is an integral part of an audit performed in accordance with Government Auditing Standards in considering the County of Rockbridge, Virginia’s internal control over financial reporting and compliance.
Staunton, Virginia December 18, 2016

4
Management’s Discussion and Analysis
As management of the County of Rockbridge, Virginia, we offer the readers of the County’s financial statements this narrative. The narrative provides an overview and analysis of our financial activities for the fiscal year ending June 30, 2016.
Financial Highlights
Government-wide Financial Statements
The combined total assets of the County of Rockbridge, Virginia exceeded its liabilities by $41,749,479 (net position) at the close of the most recent fiscal year. Of the total net position, $37,366,546 is associated with governmental activities and $4,382,933 is associated with business-type activities. Of the net governmental activities net position, $23,911,471 may be used to meet the government’s ongoing obligations to creditors and citizens. There is $232,779 presented under governmental activities which are restricted to ensure the availability of funds for specific functions, programs and anticipated liabilities (ex., capital projects and fire services). These restricted accounts are also displayed on the Balance Sheet of Government Funds. Of the business-type activities net position, $366,856 is unrestricted and available to meet the business-type activity’s obligations. For the year ending June 30, 2016, the governmental activities’ assets include $10,068,860 in taxes receivable while $9,364,953 is reflected as deferred inflows of resources. This is shown as part of compliance with GASB requirements. The $10,068,860 in taxes receivable are booked in the first half of calendar year 2016, but because of twice-a-year tax billing, second half real estate taxes of $8,874,382 are not due until December 2016, and are shown as a deferred revenue. When compared to the net position at year’s end June 30, 2015, the total combined net position increased by $1,837,493 (up 4.6%).
Fund Financial Statements
As of the close of the fiscal year June 30, 2016, the County’s governmental funds reported a combined ending fund balance of $27,192,421. This is an increase of $1,620,036 as compared with the previous fiscal year. The increase in fund balance is associated with collecting higher than estimated general property taxes, other local taxes, use of money and property revenue, and recovered costs. The total unassigned fund balance reported as $20,713,488, or 76.17%, is available for spending at the government’s discretion and for projected capital improvement projects.
At the fiscal year end, unassigned fund balance for the General Fund was $20,713,488 or 51.41% of total General Fund expenditures. This is a 3.28 percentage point decrease in fund balance to expenditure ratio compared to year ending June 30, 2015, but well within the County’s fund balance policy, which requires a 20% unassigned fund balance to expenditures ratio.
In FYE 2016, the Board of Supervisors authorized the re-designation of the Courthouse Construction Fund to the Construction Projects Fund. In an effort to proactively establish dedicated fund sources for existing and future projects, this capital fund, reflected under County Capital Projects Fund in exhibit 3, will account for new construction and major upgrades to County facilities that are approved or planned for in the Capital Improvement Program (CIP). During FYE 2016, the Board authorized the transfer of over $3M from the General Fund to the Construction Project Fund to source the purchase and renovation of a vacant building for a new regional 911 Center. The County will also use the fund balance to pay for approved FYE 2017 CIP projects (new staffed collection centers - $542.5K; County administration building HVAC upgrade - $350K; & Fleet Services facility improvements - $75K). Additionally, the Board approved the creation of a new Capital Purchases Fund to source and account for procurement of vehicles in FYE 2017 and beyond. The Board approved the transfer of nearly $520K into this new fund in FYE 2016. The Capital Purchases Fund is also included under County Capital Projects Fund in exhibit 3.
The School Capital Projects Fund and Broadband Technology Fund are combined under Other Capital Projects Fund in exhibit 3. The combined fund balance is down $235,434 compared to FYE 2015. Ninety-seven percent of the $199,105 balance can be used to source improvements to Maury River Middle School.

5
Overview of the Financial Statements
This discussion and analysis is intended to serve as an introduction to the County’s basic financial statements. These statements include three components: 1) government-wide financial statements, 2) fund financial statements, and 3) notes to the financial statements. This report also contains other supplementary information in addition to the basic financial statements themselves.
Local government accounting and financial reporting originally focused on funds that were designed to enhance and demonstrate fiscal accountability. Now, and in accordance with GASB 34, fund statements are accompanied by government-wide financial statements, to ensure objectives of operational accountability will also be met. These objectives will provide financial statement users with confirmation from the government that public monies have been used to comply with public decisions, and to confirm that operating objectives were met efficiently and effectively and can be met in the future.
Government-wide Financial Statements
Government-wide financial statements provide users with a general overview of County finances. The statements include all assets and liabilities using the accrual basis of accounting. All current year revenue and expenses are taken into account regardless of when cash is received or paid. Both the financial overview and accrual accounting factors are used in the reporting of a private-sector business. Two financial statements are used to present this information: 1) the statement of net position and 2) the statement of activities.
The statement of net position presents all of the County’s permanent account assets, liabilities and net position. The difference between assets and liabilities is reported as net position. Increases or decreases in net position may serve as a useful indicator of whether the financial position of the County is improving or deteriorating. Other non-financial factors such as changes in restricted accounts will also need to be considered to determine the overall financial position of the County.
The statement of activities presents information showing how the government’s net position changed during the fiscal year. The statement is focused on the gross and net cost of various government functions that are supported by general tax and other revenue. The statement of activities presents expenses before revenues, emphasizing that in government, revenues are generated for the express purpose of providing services rather than as an end in themselves.
The government-wide financial statements separate governmental activities and business-type activitiesof the County. Governmental activities are principally supported by taxes and intergovernmental revenues. They include general government administration; judicial administration; public safety; public works; health and welfare; parks, recreation and cultural; community development; and transfers to other funds. Business-type activities recover all or a significant portion of their costs through user fees and charges. The County shows the Rockbridge County Solid Waste Authority as a business-type activity.
The government-wide financial statements include, in addition to the primary government, five component units: 1) the Rockbridge County School Board, 2) the Rockbridge Area Social Services Board, 3) the Rockbridge Regional Jail Commission, and 4) the Rockbridge County Public Service Authority. Although the component units are legally separate entities, the County is accountable or financially accountable for them. A primary government is accountable for an organization if the primary government appoints a majority of the organization’s governing body. A primary government is financially accountable if, in addition, either the government is able to impose its will on the organization or the organization is capable of imposing specific financial burdens on the primary government. For example, the primary government may approve debt issuances, rate structures, and/or provide significant funding for operations of the component unit.

6
Fund Financial Statements
The fund financial statements present only major or significant funds. A fund is a group of related accounts used to maintain control over resources that are segregated for specific activities or objectives. Fund accounting is used to ensure and demonstrate compliance with finance-related legal requirements. The County’s funds can be divided into three categories: governmental funds, proprietary funds, and fiduciary funds.
Governmental funds
Governmental funds are used to account for essentially the same functions, or services, reported as governmental activities in the government-wide financial statements. Whereas the government-wide financial statements are prepared on the accrual basis of accounting, the governmental fund financial statements are prepared on the modified accrual basis of accounting. The focus of modified accrual reporting is on near-term inflows and outflows of financial resources and the balance of financial resources available at the end of the fiscal year. Since the governmental funds focus is narrower than that of the government-wide financial statements, reconciliation between the two methods is provided at the bottom of the governmental fund balance sheet and the governmental fund statement of revenues, expenditures, and changes in fund balances.
Proprietary funds
There are two types of proprietary funds: enterprise funds, which are established to account for the delivery of goods and services to the public and internal service funds that account for the delivery of goods and services to other departments or agencies of the government. Proprietary funds use accrual basis accounting, similar to private sector business.
The Rockbridge County Solid Waste Authority is a blended component unit/business-type activity of the County of Rockbridge. The Authority’s financial statements are shown as a proprietary/enterprise fund in the County’s fund financial statements. The Authority owns the only permitted landfill site within the County of Rockbridge. The Authority has a separate annual financial report that provides more financial details.
Fiduciary funds
Fiduciary funds account for assets held by the government as a trustee or agent for another organization or individual. The County is responsible for ensuring that the assets reported in these funds are used for their intended purposes. Fiduciary funds are not reflected in the government-wide financial statement because the funds are not available to support the County’s own activities.
Notes to the financial statements
These notes provide additional information that is needed to fully understand the data provided in the government-wide and fund financial statements.
Government-wide Financial Analysis
Net Position
As noted, net position may serve as a useful indicator of a government’s financial position. For the County of Rockbridge, combined total assets exceeded liabilities by $41,749,479 at the end of the fiscal year.
The County’s net position is divided into three categories: (1) invested in capital assets, net of related debt, (2) restricted, and (3) unrestricted. A comparative analysis has been provided below.

7
2015, 2015, 2015,2016 as restated 2016 as restated 2016 as restated
Current and other assets $ 38,875,554 $ 37,104,120 $ 11,699,642 $ 4,355,758 $ 50,575,196 $ 41,459,878Capital Assets 72,070,826 75,444,596 4,276,356 3,340,357 76,347,182 78,784,953Total Assets $ 110,946,380 $ 112,548,716 $ 15,975,998 $ 7,696,115 $ 126,922,378 $ 120,244,831
Deferred Outflowsof Resources $ 2,077,918 $ 1,636,013 $ 59,812 $ 54,022 $ 2,137,730 $ 1,690,035
Long-term liabilities $ 64,066,423 $ 65,548,154 $ 10,502,943 $ 3,442,104 $ 74,569,366 $ 68,990,258Other liabilities 2,226,376 2,431,797 1,105,017 783,199 3,331,393 3,214,996Total liabilities $ 66,292,799 $ 67,979,951 $ 11,607,960 $ 4,225,303 $ 77,900,759 $ 72,205,254
Deferred Inflowsof Resources $ 9,364,953 $ 9,714,767 $ 44,917 $ 102,859 $ 9,409,870 $ 9,817,626
Net Position:Net investment in
capital assets $ 13,222,296 $ 14,218,888 $ 2,592,481 $ 2,166,784 $ 15,814,777 $ 16,385,672Unrestricted (deficit) 23,911,471 21,080,229 366,856 44,453 24,278,327 21,124,682Restricted 232,779 1,190,894 1,423,596 1,210,738 1,656,375 2,401,632Total net position $ 37,366,546 $ 36,490,011 $ 4,382,933 $ 3,421,975 $ 41,749,479 $ 39,911,986
COUNTY OF ROCKBRIDGE'S NET POSITIONJune 30, 2016
Governmental Activities Business-type Activities Total
Governmental Activities
For the County, investment in capital assets (i.e., land, buildings, machinery, and equipment), net of related outstanding debt used to acquire those assets is $13,222,296 which represents 35.39% of total net position. The County uses these capital assets to provide services to citizens; therefore, these assets are not available for future spending. Although the County’s investment in its capital assets is reported net of related debt, it should be noted that the resources needed to repay this debt must be provided from other sources, since the capital assets themselves cannot be used to liquidate these liabilities. It is of note that a portion of the capital assets is used to encourage economic development and in turn may produce future revenue for operations in either fees or sale of property.
During the year ending June 30, 2016, total governmental liabilities decreased by $1,687,152. While accounts payable increased by $89,130, the remaining liability categories dropped when compared to FYE 2015. This results mainly from making scheduled debt-service payments.
The restricted net position represents resources that are subject to external or internal restrictions on how they may be used. The restricted net position for fiscal year 2016 included assets restricted by external constraints. For fiscal year 2016, the restricted assets meet the reserve requirements for debt service, and provide for capital improvements to the Maury River Middle School.
The unrestricted net position is $23,911,471, which is 63.99% of total net position, may be used to meet the government’s ongoing obligations to citizens and creditors.
At the end of the fiscal year, the County’s governmental activities realized decreases in two of the three categories of combined total net position. The changes in net position include a decrease in net investment in capital assets of $996,592. Restricted assets decreased in the amount of $958,115 while unrestricted assets were higher by $2,831,242. For the year ending June 30, 2016, the combined total net position increased by $876,535 from last fiscal year.
Business-type Activities
The business-type activities/enterprise fund (landfill and recycling) net position increased by $960,958 resulting from increased tipping fees generating additional cash for future landfill expansion procurement, funds from a revenue bond executed in June 2016, and the value of heavy-duty equipment purchased in

8
FYE 2016. The Authority’s total net position invested in capital assets at the end of the past three years has grown significantly with the procurement of heavy-duty equipment and the on-going stages of developing a new piggy-back lined landfill. The Authority uses capital assets to provide services to its customers, so these assets are not available for future spending.
Changes in Net Position
The following table presents the revenues and expenses of the governmental and business-type activities. Following the table is a brief highlight and discussion on key elements of Rockbridge County’s change in net position.
2015, 2015, 2015,2016 as restated 2016 as restated 2016 as restated
Revenues:Program revenues:Charges for services $ 2,165,018 $ 2,404,454 $ 2,098,447 1,578,750 $ 4,263,465 $ 3,983,204 Operating grants 2,381,742 2,424,462 23,300 23,046 2,405,042 2,447,508 Capital grants 41,945 273,913 - - 41,945 273,913 General Revenues:Property taxes 24,775,816 24,210,212 - - 24,775,816 24,210,212 Other taxes 9,009,065 8,619,694 - - 9,009,065 8,619,694 Use of money and property 113,017 57,337 11,162 3,413 124,179 60,750 Other 833,978 943,636 25,869 8,927 859,847 952,563 Grants and contributions not restricted to specific programs 2,749,809 2,732,823 - - 2,749,809 2,732,823 Total Revenues $ 42,070,390 $ 41,666,531 $ 2,158,778 $ 1,614,136 $ 44,229,168 $ 43,280,667
Expenses:GeneralGeneral Govt. Admin $ 2,888,023 $ 2,294,804 $ - $ - $ 2,888,023 $ 2,294,804 Judicial administration 1,363,768 1,283,097 - - 1,363,768 1,283,097 Public safety 7,165,176 6,492,719 - - 7,165,176 6,492,719 Public works 3,257,681 2,879,018 1,647,771 1,435,346 4,905,452 4,314,364 Health and welfare 1,641,027 1,330,106 - - 1,641,027 1,330,106 Education 15,794,029 14,980,144 - - 15,794,029 14,980,144 Parks, recreation, and culture 1,431,206 1,289,331 - - 1,431,206 1,289,331 Community development 2,933,943 3,088,793 - - 2,933,943 3,088,793 Non-departmental 1,780,693 1,757,409 - - 1,780,693 1,757,409 Interest on long-term debt 2,488,358 2,449,604 - - 2,488,358 2,449,604 Total expenses $ 40,743,904 $ 37,845,025 $ 1,647,771 $ 1,435,346 $ 42,391,675 $ 39,280,371
Increase (decrease) in netposition before transfers $ 1,326,486 $ 3,821,506 $ 511,007 $ 178,790 $ 1,837,493 $ 4,000,296
Transfers (449,951) (220,708) 449,951 220,708 - - Increase (decrease) net position $ 876,535 $ 3,600,798 $ 960,958 $ 399,498 $ 1,837,493 $ 4,000,296 Net position - beginning as restated 36,490,011 32,889,213 3,421,975 3,022,477 39,911,986 35,911,690 Net position - ending $ 37,366,546 $ 36,490,011 $ 4,382,933 $ 3,421,975 $ 41,749,479 $ 39,911,986
COUNTY OF ROCKBRIDGE'S CHANGES IN NET POSITIONJune 30, 2016
Governmental Activities Business-type Activities Total
Note: Net position as reported at June 30, 2015 is restated to record additional advances to/from participating entities. Specifically, the Rockbridge County General Fund transferred funding to the Rockbridge County Solid Waste Authority to source due diligence efforts associated with the lateral expansion of current operations.

9
Governmental Activities
Governmental activities increased the County’s net position by $876,535. Key elements relating to FYE 2016 activities compared to the prior fiscal year will be discussed below.
Revenues increased by $403,859. The following table provides a breakdown on the various revenues sources as of June 30, 2016.
Type Overall total % 1. Property taxes 58.89% 2. Other local taxes 21.41% 3. Non-restricted grants and contributions 6.54% 4. Operating and capital grants 5.76% 5. Charges for services 5.15% 6. Other general revenues 1.98% 7. Use of money and property 0.27%
Component changes from FYE 2015, as restated, to FYE 2016 include:
The largest source of revenues is general property taxes at $24,775,816. General property tax collections rose by $565,604. The Board approved a two-cent increase to the real property tax rate in calendar year 2016 contributing to higher revenues in the June 2016 billing cycle. In addition, public service corporation, personal property, and machinery and tools taxes increased as a result of higher value growth and/or collection levels.
Other local taxes increased by $389,371. Sales, meals, occupancy, and bank franchise taxes continued a positive trend in receipts collected, a reflection of on-going tourism and economic development efforts in the County.
Non-restricted grants or contributions increased by $16,986 as state-shared revenues for mobile home titling and motor vehicle rentals came in higher than projected.
Operating and capital grants dropped by $274,688. This reflects the final stages of a grant reimbursement linked to the completion of the Greenhouse Village water and sewer infrastructure system for a low-to-moderate income housing development began in FYE 2014.
Charges for services decreased by $239,436 due to the one-time permit fees collected in FYE 2015 for the Washington and Lee University housing and natatorium projects which generated over $300,000 in service revenues.
Other revenues were lower by $109,658 resulting from miscellaneous collections (sale of supplies, patron refunds/rebates, and loan proceeds) coming in lower than anticipated.
Use of money and property rose by $55,680. A combination of ongoing income from County property rentals and a new investment methodology by the Treasurer contributed to the revenue increase.
The following table reflects the distribution of FYE 2016 governmental expenditures. For the year, the Board of Supervisors’ expenditure priorities were to maintain improvements in education, public safety, public works, health and welfare, and economic development. In addition, the Board approved a 2% cost-of-living adjustment and step increases to eligible employees, effective July 1, 2015, with a goal of retaining and attracting a quality workforce via competitive compensation. Overall expenses increased by $2,898,879 over the same period in FYE 2015. As shown, education expenses account for 38.76% of total expenses. When combined with public safety, public works, health and welfare, and community development, expenditures for these five categories are 75.58% of the $40,743,904 in total expenses.

10
Type Overall total % 1. Education 38.76% 2. Public Safety 17.59% 3. Public Works 8.00% 4. Community Development 7.20% 5. General Government Administration 7.09% 6. Long-term debt interest 6.11% 7. Non-departmental 4.37% 8. Health and Welfare 4.03% 9. Parks, Recreation, and Cultural 3.51% 10. Judicial Administration 3.35%
Component changes from FYE 2015 to FYE 2016 include:
Education expenses increased by $813,885. The asset allocation from the General Fund to the School Fund was approximately $1.6 million more in FYE 2016 compared to FYE2015. The primary driver to the upward change is that debt service on school board debt financed assets rose by over $416K as a result of the financing of the Maury River Middle School renovation. Assets for the School Division are recorded by the County and then reclassified back to the School Division as the debt on the assets is paid. In FYE 2016, the net amount of assets/accumulated depreciation transferred back to the School Division was $2,701,922. While the asset allocation increased expenses by $1.6 million, the operating transfers to the School Board decreased by approximately $746,000.
Public Safety reflects an increase of $672,457. The County’s procurement of a vacant building ($375K) for renovation into a regional communications (911) and emergency operations center (EOC) occurred under this category. In addition, seven volunteer fire departments were approved for a 15% increase in the operational contribution while the variable pay amount was also increased by 15% (up a combined total of ~$82K). Furthermore, the Board funded $54K for contracted services to cover annual inspections of all fire apparatus pumps, aerial ladders, ground ladders, self contained breathing apparatus, and hoses. The Board also approved targeted increases for the contribution towards two volunteer rescue squads at 15% while two others received an additional 5% to account for additional consumables used at their respective facilities that are housing a contracted ambulance service. The overall squad contributions are up ~$52K. Lastly, the County cost-share costs for the regional jail function rose by ~$60K based on the number of Rockbridge County citizens housed in the facility each month and an increase in overall per capita incarceration costs.
Public Works increased by $378,663. This category pays the County’s cost-share for the landfill operation. The cost per ton tipping fee increased by approximately $14 per ton in FYE 2016 as part of two-year plan to build surplus cash to assist the Rockbridge County Solid Waste Authority with future capital procurement efforts and development of a budget stabilization fund. The combination of the higher tipping fee and actual tonnage generated this upward change.
Community Development decreased by $154,850. The County had previously secured a $262,650 community development grant to provide water and sewer infrastructure for a primarily low- and moderate-income person’s subdivision which was substantially completed in FYE 2015.
General government administration increased by $593,219. Approximately $303,000 of the increase is due to the completion of the general reassessment which began in FYE 2016. In addition, the County developed and funded all costs associated with a new human resources position ($78K). The Board also approved procuring hardware and software updates for the municipal financial management modules required for efficient operations and reporting. Lastly, professional engineering services linked to space-needs analysis, environmental assessment, and facility design for a new 911 center were accounted for in this category.
Long-term debt interest payments are up $38,754 based on current debt payment schedules. Non-departmental was up $23,284 resulting from an increase in the Modified Voluntary
Settlement of Annexation and Immunity payment from Rockbridge County to Lexington City.

11
Health and Welfare reflects an increase of $310,921 primarily because the County’s cost-share funding for the Comprehensive Services Act program was higher than the prior fiscal year due to increased cases involving Rockbridge County residents.
Parks, Recreation and Cultural increased by $141,875 due in part to the funding of higher cost-share for the regional library and talking books program for the elderly and disabled; converting a part-time parks and recreation position into full-time status; and providing the regional recreation organization with additional capital funding originally planned for FYE 2017.
Judicial Administration rose by $80,671 reflecting the unscheduled replacement of the courthouse security system (over $67K) and the full-year, County funding of a new position within the Clerk of the Circuit Court department.
Business-type Activities
The business-type activities/enterprise fund (landfill and recycling) net position increased by $960,958. Tipping fee revenues for FYE 2016 increased by $519,697 resulting from the final step in a 2-year plan to raise charges for services to generate additional surplus in FYEs 2015 and 2016. The additional surplus cash will offset future construction costs and equipment procurement related to cell 1 of the lateral expansion of the landfill. In addition, landfill staff continue to extract scrap metal from the working face of the active cell while recycling materials collected at staffed centers are compacted in preparation for transporting. Each commodity is sold on the recyclable materials market. The Authority realized nearly $12,450 in additional revenue from selling these resources during the fiscal year. Lastly, an improved methodology of investing closure/post-closure funds resulted in a $7,749 improvement in investment income compared to FYE 2015.
Expenditures realized a $212,425 increase compared to FYE 2015. The four primary drivers are: 1) interest expense and bond issue cost ($130,047), 2) depreciation ($71,447), 3) contractual services ($36,347), and 4) personnel costs ($29,658). These individual categories grew due to the following respective factors: 1) new revenue bond and lease-purchase financing, 2) depreciating additional equipment purchased later in FYE 2015 and earlier in FYE 2016, 3) new hauling contract which incorporated transporting recycling stream to buyers beyond County limits, and 4) compensation increases for full and part-time employees.
Transfers from the Rockbridge County General Fund supported the county recycling program accounted for under the Authority. The County transfers funding to subsidize the recycling program. During FYE 2016, the transfer to the Recycling Fund totaled $459,051. The RCSWA conveyed a 6.05 acre plat to the County for the purpose of building a law enforcement shooting range and training facility – resulting in a transfer out of $9,100.
Financial Analysis of the Government’s Funds
As previously mentioned, the County uses fund accounting to ensure and demonstrate compliance with finance-related legal requirements.
Governmental funds
The focus of the County’s governmental funds is to provide information on near-term inflows, outflows, and balances of financial resources. Such information is useful in assessing the County’s financing requirements. Unassigned fund balance may serve as a useful measure of a government’s net resources available for spending at the end of the fiscal year.
At the end of the fiscal year, the County’s total governmental funds reported combined ending fund balances of $27,192,421, an increase of $1,620,036 over the prior fiscal year. The increase is associated with assets growing by $1,792,330 when compared to FYE 2015. This total is impacted by positive changes in cash and cash equivalents (up $1,841,651), taxes receivables (up $276,920), and advances to other entities (up $566,177). In addition, due to other government liabilities dropped $63,337 compared to FYE 2015. Lastly, school carryover increased by $167,393 as a result of unexpended funds and were restricted to source future School Board capital projects.

12
The General Fund is the chief operating fund of the County. As of June 30, 2016, unassigned fund balance of the General Fund was $20,713,488. This is a decrease in unassigned fund balance of $1,143,081 compared with the previous fiscal year. The total fund balance of the General Fund is $22,903,794. This is a decrease over the previous year by $2,234,052, a result of the aforementioned transfer of previously gained surplus to fund planned capital projects.
As a measure of the General Fund’s liquidity, it is useful to compare both unassigned fund balance and total fund balance to total fund expenditures. Unassigned fund balance represents 51.41% of total General Fund expenditures, which includes transfers to the School Board component unit of $12,998,898 for operational support. The Board of Supervisors financial policy is to maintain a minimum of 20% unassigned fund balance to expenditures ratio. Total fund balance represents 56.84% of total General Fund expenditures.
Proprietary funds
The County’s proprietary fund statements provide the same type of information found in the government-wide financial statements, but in more detail.
The Rockbridge County Solid Waste Authority (RCSWA) owns and the County operates a permitted landfill that was targeted for closure on December 31, 2014. A 2014 request for permit extension to June 30, 2017 received Virginia Department of Environmental Quality (VA DEQ) approval. Part of the fund balance will be used to meet landfill closure requirements of the VA DEQ. The net funds associated with financing these requirements are restricted. This restricted fund balance will support landfill operations and equipment purchases as needed. Other factors concerning the finances of this fund were discussed in the County’s business-type activities section of this summary. Net position of the landfill fund at the end of the year was $4,324,996 while the recycling fund net position is $57,937. Additional detail is provided in the RCSWA financial report.
General Fund Budgetary Highlights
The difference between the original budgeted appropriations and the final, amended-budget appropriations was a $399,263 increase. This is 0.96% of the total original budget. The actual expenditures were $1,513,334 below the final appropriation total. This total is 3.62% below the final budget. The major components of these appropriation changes are:
Carryover funding from FYE 2015 CIP projects that remained in progress at the start of FYE 2016.
The Board of Supervisors authorized funding a space-needs analysis related to constructing a co-located, regional communications (911) and emergency operations center (EOC).
The Board approved the first-year request to fund the Dabney S. Lancaster Community College “The Dabney Promise” scholarship program, which supports eligible, County residents in meeting their educational needs.
The Board authorized funding an environmental assessment, and later design development, of a vacant building procured for a new 911 Center and EOC.
A Virginia Community Development Block Grant approved to support the completion of an infrastructure project for a low-to-moderate income family housing project carried over into FYE 2016 for final completion.
Capital Asset and Debt Administration
Capital assets The County’s investment in capital assets for its governmental activities as of June 30, 2016 was $72,070,826 (net of accumulated depreciation). This investment in capital assets includes land, buildings and systems, and machinery and equipment. This is a decrease of $3,373,770 from the previous fiscal year, or 4.47%. The primary change in capital assets is the result of depreciation.

13
The County’s investment in capital assets for its proprietary funds is $4,276,356, an increase of $935,999 from the previous year. This is a result of the completion of a new office building, procurement of additional heavy-duty equipment, and on-going, lateral expansion efforts at the landfill during the fiscal year.
2016 2015 2016 2015 2016 2015
Land $ 2,342,101 $ 2,393,836 $ 531,037 $ 540,137 $ 2,873,138 $ 2,933,973Buildings and systems 68,945,110 72,354,978 1,515,727 1,396,494 70,460,837 73,751,472Machinery & equipment 661,482 657,812 1,309,114 615,088 1,970,596 1,272,900Construction in progress 122,133 37,970 920,478 788,638 1,042,611 826,608 Total $ 72,070,826 $ 75,444,596 $ 4,276,356 $ 3,340,357 $ 76,347,182 $ 78,784,953
Governmental Activities Business-type Activities Total
COUNTY OF ROCKBRIDGE'S CAPITAL ASSETSNet of Depreciation
Additional information on the County’s capital assets can be found in the Note 14 to the financial statements.
Long-term debt
At the end of fiscal year 2016, the County had the following outstanding debt:
2016 2015 2016 2015 2016 2015
General Obligation Bonds $ 42,453,194 $ 43,604,236 $ - $ - $ 42,453,194 $ 43,604,236Revenue Bonds 16,745,000 17,390,000 7,264,710 724,462 24,009,710 18,114,462Literary Loans 1,075,000 1,255,000 - - 1,075,000 1,255,000Capital Leases - - 916,590 449,111 916,590 449,111Compensated Absences 335,203 301,028 36,716 32,291 371,919 333,319Net pension liability 3,292,026 2,849,890 301,416 260,935 3,593,442 3,110,825OPEB Obligation 166,000 148,000 3,000 3,000 169,000 151,000Landfill closure liability - - 1,980,511 1,972,305 1,980,511 1,972,305Total long-term obligations $ 64,066,423 $ 65,548,154 $ 10,502,943 $ 3,442,104 $ 74,569,366 $ 68,990,258
COUNTY OF ROCKBRIDGE'S LONG-TERM OBLIGATIONS
Governmental Activities Business-type Activities Total
The County’s total long-term debt includes the Rockbridge County School Board debt and the business-type activities debt. For the year, the total, combined long-term debt increased by $5,579,108. The County completed an advance refunding of the former 2007 courthouse loan, which generated an estimated net present value savings of $613,354, an 11.96% change. On May 25, 2016, the Solid Waste Authority executed a revenue bond of $5,710,000, with $856,329 premium, to finance the development of a new landfill cell. In addition, the Authority completed a $681,832 lease-purchase of an articulated haul truck and excavator as part of planned CIP efforts. The governmental and business-type activities’ compensated absences, net pension liability, and OPEB obligation and are included in the long-term debt to meet GASB requirements. These categories changed as follows: 1) compensated absences (rose $38,600); 2) net pension liability (increased $482,617); and 3) OPEB obligation (grew $18,000).
Additional information on the County’s long-term debt can be found in Note 7 to the financial statements.

14
Economic Factors and Next Year’s Budgets and Rates
The Rockbridge County population was 22,307 as of the April 1, 2010 U.S. Census. The Weldon Cooper Institute’s July 1, 2015 population estimate reflects 22,163, a decrease of 144 (0.65%). Minimal change in population has occurred over the past decade and no substantial change is anticipated in the next fiscal year.
For the fiscal year ending June 30, 2016, the unemployment rate for the Commonwealth and Rockbridge County were 4.0% and 4.5% respectively. During the progress of this management discussion and analysis report, the October 2016 unemployment rate rose to 4.1% for the state and 4.8% in the County. Overall, local efforts by the Board of Supervisors to fund a variety of economic development initiatives continue in an effort to generate new business inquiries and interest.
The Board of Supervisors fiscal year 2017 budget priorities include limiting overall expenditures in all areas except education, “safety net” programs, public safety, solid waste management, emergency communications, and economic development. These activities may require increased funding compared to prior years. Additionally and primarily, the Board’s goals include meeting all mandates, debt services, and legal obligations.
In FYE 2016 the Board of Supervisors continued its annual support of educational programs. The County student population continues to remain consistent at approximately 2,600. The County’s restricted funding which sourced the local supplement to offset increasing Virginia Retirement System increases over the past several years was depleted at FYE 2016. The Board committed to increase the local operational transfer in FY 2017 by $232,000 (or one penny on the real estate tax rate).
The County continues to tackle capital improvement projects through long-term planning and funding. Projects include the ongoing efforts to construct a new regional 911 center, development of additional staffed collection center sites, completion of major upgrades to the County’s administration building, building a Sheriff Office shooting range classroom facility, and procuring new voting equipment. Additionally, debt service commitments will involve financing a “piggyback” lined landfill and the next phase of a regional radio system upgrade (subscriber units). Decisions on these and other funding decisions were guided by the Board’s mission, vision and values statements, which drive strategic plans and funding priorities.
The County’s commitment to improve the regional Central Dispatch operations involves a cost-share (with our regional governmental partners) commitment to replace the 911 Center’s computer aided dispatch system. This one-time capital improvement within the 911 Center budget, in addition to other approved expenditures, increased the County’s contribution to this critical service by $238,201.
The Board of Supervisors chose to use $427,250 in unassigned fund balance and $147,450 in restricted accounts to fund one-time and carryover capital efforts to provide a limited level of budget stabilization. As result of increased debt service, expanded public safety services, and higher personnel costs, the real property tax rate was increased to $0.735 per $100.00 of assessed valuation i.e. a two cent increase). The personal property rate of $4.25 remained unchanged from the prior year.
All of these factors were considered in preparing the County’s budget for the 2017 fiscal year.
Requests for Information
This financial report is designed to provide readers with a general overview of the County of Rockbridge finances. Questions concerning any of the information provided in this report or requests for additional financial information should be addressed to the Rockbridge County Administrator, 150 S. Main Street, Lexington, Virginia 24450.

BASIC FINANCIAL STATEMENTS

GOVERNMENT-WIDE FINANCIAL STATEMENTS

County of Rockbridge, VirginiaStatement of Net Position
Governmental Business-typeActivities Activities Total
ASSETSCash and cash equivalents $ 21,084,279 $ 1,614,827 $ 22,699,106 Investments - - - Receivables (net of allowance for uncollectibles):
Taxes receivable 10,068,860 - 10,068,860 Accounts receivable 725,451 67,360 792,811
Internal balances (115,923) 115,923 - Due from component units 2,016,342 - 2,016,342 Due from other governmental units 993,921 - 993,921 Inventories 104,915 - 104,915 Advances to other entities 3,819,848 - 3,819,848 Prepaid items - - - Restricted assets:
Cash and cash equivalents 177,861 9,901,532 10,079,393 Net pension asset - - - Capital assets (net of accumulated depreciation):
Land 2,342,101 531,037 2,873,138 Buildings and improvements 68,945,110 1,515,727 70,460,837 Machinery and equipment 661,482 1,309,114 1,970,596 Utility plant and equipment - - - Construction in progress 122,133 920,478 1,042,611
Total assets $ 110,946,380 $ 15,975,998 $ 126,922,378
DEFERRED OUTFLOWS OF RESOURCESDeferred charge on refunding $ 1,424,664 $ - $ 1,424,664 Items related to measurement of net pension liability 38,832 3,556 42,388 Pension contributions subsequent to measurement date 614,422 56,256 670,678
Total deferred outflows of resources $ 2,077,918 $ 59,812 $ 2,137,730
LIABILITIESAccounts payable $ 365,590 $ 33,828 $ 399,418 Advances from participating entities - 74,292 74,292 Capital advances from Rockbridge County - 957,773 957,773 Accrued interest payable 810,327 39,124 849,451 Due to primary government - - - Performance deposits 149,187 - 149,187 Due to other governments 899,741 - 899,741 Unearned revenue 1,531 - 1,531 Deposits payable - - - Long-term liabilities:
Due within one year 2,313,339 347,744 2,661,083 Due in more than one year 61,753,084 10,155,199 71,908,283
Total liabilities $ 66,292,799 $ 11,607,960 $ 77,900,759
DEFERRED INFLOWS OF RESOURCESDeferred revenue-property taxes $ 8,874,382 $ - $ 8,874,382 Items related to measurement of net pension liability 490,571 44,917 535,488
Total deferred inflows of resources $ 9,364,953 $ 44,917 $ 9,409,870
NET POSITIONNet investment in capital assets $ 13,222,296 $ 2,592,481 $ 15,814,777 Restricted
Fire funds 53,912 - 53,912 Rental assistance 1,006 - 1,006 Capital projects 168,890 - 168,890 Debt service 8,971 1,423,596 1,432,567
Unrestricted 23,911,471 366,856 24,278,327 Total net position $ 37,366,546 $ 4,382,933 $ 41,749,479
The notes to the financial statements are an integral part of this statement.
Primary Government
June 30, 2016
15

Exhibit 1
Component ComponentComponent Unit Unit
Unit Rockbridge Rockbridge Component Rockbridge Regional Public
Unit Area Social Jail ServiceSchool Board Services Commission Authority
$ 140,179 $ 398,186 $ 200 $ 4,045,992 - - - 1,017,863
- - - - 51,474 7,928 15,392 429,659
- - - - - - - -
814,451 517,406 332,289 - 36,137 - - 59,380
- - - - 590,751 3,385 - -
- - - 59,920 - 3,237 - 40,528
117,555 - - 389,259 18,089,990 - 3,154,991 67,698
1,875,090 14,342 33,408 173,830 - - - 23,720,661- - - 129,349
$ 21,715,627 $ 944,484 $ 3,536,280 $ 30,134,139
$ - $ - $ - $ - 20,617 - 13,166 -
2,327,179 94,393 208,323 30,013 $ 2,347,796 $ 94,393 $ 221,489 $ 30,013
$ 141,954 $ 228,650 $ 43,410 $ 348,718 - - - - - - - - - - - -
1,310,941 633,801 71,600 - - - - - - 64,454 - - - - - - - - - 59,920
42,458 16,781 42,223 918,550 28,477,540 50,344 1,306,847 11,251,529
$ 29,972,893 $ 994,030 $ 1,464,080 $ 12,578,717
$ - $ - $ - $ - 2,742,379 218,796 166,330 56,937
$ 2,742,379 $ 218,796 $ 166,330 $ 56,937
$ 20,082,635 $ 14,342 $ 3,188,399 $ 12,370,263
- - - - - - - - - - - - - - - -
(28,734,484) (188,291) (1,061,040) 5,158,235 $ (8,651,849) $ (173,949) $ 2,127,359 $ 17,528,498
16
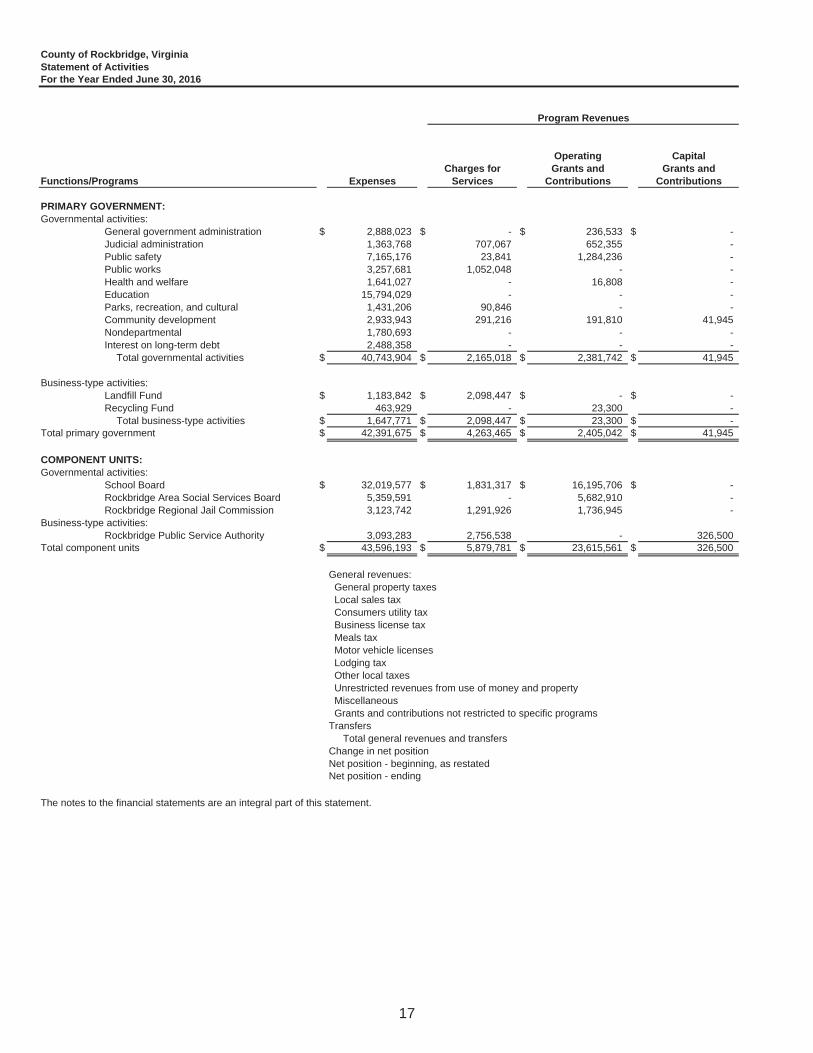
County of Rockbridge, VirginiaStatement of ActivitiesFor the Year Ended June 30, 2016
Operating CapitalCharges for Grants and Grants and
Functions/Programs Expenses Services Contributions Contributions
PRIMARY GOVERNMENT:Governmental activities:
General government administration $ 2,888,023 $ - $ 236,533 $ - Judicial administration 1,363,768 707,067 652,355 - Public safety 7,165,176 23,841 1,284,236 - Public works 3,257,681 1,052,048 - - Health and welfare 1,641,027 - 16,808 - Education 15,794,029 - - - Parks, recreation, and cultural 1,431,206 90,846 - - Community development 2,933,943 291,216 191,810 41,945 Nondepartmental 1,780,693 - - - Interest on long-term debt 2,488,358 - - -
Total governmental activities $ 40,743,904 $ 2,165,018 $ 2,381,742 $ 41,945
Business-type activities:Landfill Fund $ 1,183,842 $ 2,098,447 $ - $ - Recycling Fund 463,929 - 23,300 -
Total business-type activities $ 1,647,771 $ 2,098,447 $ 23,300 $ - Total primary government $ 42,391,675 $ 4,263,465 $ 2,405,042 $ 41,945
COMPONENT UNITS:Governmental activities:
School Board $ 32,019,577 $ 1,831,317 $ 16,195,706 $ - Rockbridge Area Social Services Board 5,359,591 - 5,682,910 - Rockbridge Regional Jail Commission 3,123,742 1,291,926 1,736,945 -
Business-type activities:Rockbridge Public Service Authority 3,093,283 2,756,538 - 326,500
Total component units $ 43,596,193 $ 5,879,781 $ 23,615,561 $ 326,500
General revenues: General property taxes Local sales tax Consumers utility tax Business license tax Meals tax Motor vehicle licenses Lodging tax Other local taxes Unrestricted revenues from use of money and property Miscellaneous Grants and contributions not restricted to specific programsTransfers
Total general revenues and transfersChange in net positionNet position - beginning, as restatedNet position - ending
The notes to the financial statements are an integral part of this statement.
Program Revenues
17

Exhibit 2
Net (Expense) Revenue andChanges in Net Position
Component Unit Component Unit Component Unit Component UnitRockbridge Rockbridge Rockbridge
Area Regional PublicGovernmental Business-type School Social Jail Service
Activities Activities Total Board Services Commission Authority
$ (2,651,490) $ - $ (2,651,490) $ - $ - $ - $ - (4,346) - (4,346) - - - -
(5,857,099) - (5,857,099) - - - - (2,205,633) - (2,205,633) - - - - (1,624,219) - (1,624,219) - - - -
(15,794,029) - (15,794,029) - - - - (1,340,360) - (1,340,360) - - - - (2,408,972) - (2,408,972) - - - - (1,780,693) - (1,780,693) - - - - (2,488,358) - (2,488,358) - - - -
$ (36,155,199) $ - $ (36,155,199) $ - $ - $ - $ -
$ - $ 914,605 $ 914,605 $ - $ - $ - $ - - (440,629) (440,629) - - - -
$ - $ 473,976 $ 473,976 $ - $ - $ - $ - $ (36,155,199) $ 473,976 $ (35,681,223) $ - $ - $ - $ -
$ - $ - $ - $ (13,992,554) $ - $ - $ - - - - - 323,319 - - - - - - - (94,871) -
- - - - - - (10,245) $ - $ - $ - $ (13,992,554) $ 323,319 $ (94,871) $ (10,245)
$ 24,775,816 $ - $ 24,775,816 $ - $ - $ - $ - 2,720,814 - 2,720,814 - - - - 1,488,723 - 1,488,723 - - - -
849,796 - 849,796 - - - - 1,439,665 - 1,439,665 - - - -
540,217 - 540,217 - - - - 1,636,776 - 1,636,776 - - - -
333,074 - 333,074 - - - - 113,017 11,162 124,179 97 - 19 39,671 833,978 25,869 859,847 82,127 - 14,028 34,298
2,749,809 - 2,749,809 15,710,645 - - 185,342 (449,951) 449,951 - - - - -
$ 37,031,734 $ 486,982 $ 37,518,716 $ 15,792,869 $ - $ 14,047 $ 259,311 876,535 960,958 1,837,493 1,800,315 323,319 (80,824) 249,066
36,490,011 3,421,975 39,911,986 (10,452,164) (497,268) 2,208,183 17,279,432 $ 37,366,546 $ 4,382,933 $ 41,749,479 $ (8,651,849) $ (173,949) $ 2,127,359 $ 17,528,498
Primary Government
18

FUND FINANCIAL STATEMENTS

County of Rockbridge, Virginia Exhibit 3Balance SheetGovernmental Funds
County OtherCapital Capital
General Projects ProjectsFund Fund Fund Total
ASSETSCash and cash equivalents $ 16,908,595 $ 4,143,632 $ 32,052 $ 21,084,279Receivables (net of allowance
for uncollectibles):Taxes receivable 10,068,860 - - 10,068,860Accounts receivable 725,451 - - 725,451
Advances to other entities 3,819,848 - - 3,819,848Due from other funds 1,837 - - 1,837Due from component units 2,016,342 - - 2,016,342Due from other governmental units 993,921 - - 993,921Inventories 104,915 - - 104,915Restricted assets:
Cash and cash equivalents 8,971 - 168,890 177,861Total assets $ 34,648,740 $ 4,143,632 $ 200,942 $ 38,993,314
LIABILITIESAccounts payable $ 311,480 $ 54,110 $ - $ 365,590Due to other governments 899,741 - - 899,741Due to other funds 115,923 - 1,837 117,760Performance deposits 149,187 - - 149,187Unearned revenue 1,531 - - 1,531
Total liabilities $ 1,477,862 $ 54,110 $ 1,837 $ 1,533,809
DEFERRED INFLOWS OF RESOURCESUnavailable revenue-property taxes $ 10,267,084 $ - $ - $ 10,267,084
FUND BALANCESNonspendable:
Inventories $ 104,915 $ - $ - $ 104,915Total nonspendable $ 104,915 $ - $ - $ 104,915
Restricted:Debt service and bond covenants $ 8,971 $ - $ - $ 8,971Capital projects - - 168,890 168,890Rental assistance 1,006 - - 1,006Fire program 53,912 - - 53,912
Total restricted $ 63,889 $ - $ 168,890 $ 232,779Assigned:
Garage $ 165,469 $ - $ - $ 165,469Industrial property 603,193 - - 603,193School carryover 607,395 - - 607,395Convenience centers 12,075 - - 12,075Partnership 82,097 - - 82,097Recreation 10,000 - - 10,000Revenue recovery 541,273 - - 541,273Capital projects funds - 4,089,522 30,215 4,119,737
Total assigned $ 2,021,502 $ 4,089,522 $ 30,215 $ 6,141,239
Unassigned $ 20,713,488 $ - $ - $ 20,713,488Total unassigned $ 20,713,488 $ - $ - $ 20,713,488
Total fund balances $ 22,903,794 $ 4,089,522 $ 199,105 $ 27,192,421Total liabilities, deferred inflows of resources and fund balances $ 34,648,740 $ 4,143,632 $ 200,942 $ 38,993,314
The notes to the financial statements are an integral part of this statement.
June 30, 2016
19

County of Rockbridge, Virginia Exhibit 4
Amounts reported for governmental activities in the statement of net position are different because:
Total fund balances per Exhibit 3 - Balance Sheet - Governmental Funds $ 27,192,421
72,070,826
902,131
614,422
(63,413,254)
Net position of governmental activities $ 37,366,546
The notes to the financial statements are an integral part of this statement.
Capital assets used in governmental activities are not financial resources and, therefore, arenot reported in the funds.
Other long-term assets are not available to pay for current-period expenditures and, therefore,are deferred in the funds.
Long-term liabilities, including bonds payable, are not due and payable in the current periodand, therefore, are not reported in the funds.
Reconciliation of the Balance Sheet of Governmental FundsTo the Statement of Net PositionJune 30, 2016
Pension contributions subsequent to the measurement date will be a reduction to the net pension liability in the next fiscal year and, therefore, are not reported in the funds.
20

County of Rockbridge, Virginia Exhibit 5
County OtherCapital Capital
Projects ProjectsGeneral Fund Fund Total
REVENUESGeneral property taxes $ 24,843,541 $ - $ - $ 24,843,541Other local taxes 9,009,065 - - 9,009,065Permits, privilege fees,
and regulatory licenses 275,060 - - 275,060Fines and forfeitures 445,370 - - 445,370Revenue from the use of
money and property 112,157 - 860 113,017Charges for services 1,444,588 - - 1,444,588Miscellaneous 833,978 - - 833,978Recovered costs 469,735 - - 469,735Intergovernmental:
Commonwealth 4,965,583 - - 4,965,583Federal 207,913 - - 207,913
Total revenues $ 42,606,990 $ - $ 860 $ 42,607,850
EXPENDITURESCurrent:
General government administration $ 2,117,583 $ - $ - $ 2,117,583Judicial administration 1,472,432 - - 1,472,432Public safety 7,403,041 - - 7,403,041Public works 3,312,600 - - 3,312,600Health and welfare 1,639,246 - - 1,639,246Education 13,082,282 - - 13,082,282Parks, recreation, and cultural 1,427,654 - - 1,427,654Community development 2,808,451 - - 2,808,451Nondepartmental 1,780,693 - - 1,780,693
Capital projects - 477,000 9,825 486,825Debt service:
Principal retirement 2,502,118 - - 2,502,118Interest and other fiscal charges 2,746,012 - - 2,746,012
Total expenditures $ 40,292,112 $ 477,000 $ 9,825 $ 40,778,937
Excess (deficiency) of revenues over(under) expenditures $ 2,314,878 $ (477,000) $ (8,965) $ 1,828,913
OTHER FINANCING SOURCES (USES)Transfers in $ 9,100 $ 4,566,522 $ - $ 4,575,622Transfers out (4,799,104) - (226,469) (5,025,573)Issuance of refunding bonds 4,985,000 - - 4,985,000Premium on refunding bonds issued 835,950 - - 835,950Payment to refunded bond escrow agent (5,579,876) - - (5,579,876)
Total other financing sources (uses) $ (4,548,930) $ 4,566,522 $ (226,469) $ (208,877)
Net change in fund balances $ (2,234,052) $ 4,089,522 $ (235,434) $ 1,620,036Fund balances - beginning, as restated 25,137,846 - 434,539 25,572,385Fund balances - ending $ 22,903,794 $ 4,089,522 $ 199,105 $ 27,192,421
The notes to the financial statements are an integral part of this statement.
Statement of Revenues, Expenditures, and Changes in Fund BalancesGovernmental FundsFor the Year Ended June 30, 2016
21

County of Rockbridge, Virginia Exhibit 6
Net change in fund balances - total governmental funds $ 1,620,036
(3,177,114)
The net effect of various miscellaneous transactions involving capital assets (i.e., sales, trade-ins, anddonations) is to increase (decrease) net position. (196,656)
565,113
2,377,178
(312,022)
Change in net position of governmental activities $ 876,535
The notes to the financial statements are an integral part of this statement.
Some expenses reported in the statement of activities do not require the use of current financial resources and,therefore are not reported as expenditures in governmental funds.
For the Year Ended June 30, 2016
Reconciliation of Statement of Revenues, Expenditures, and Changes in Fund Balances of Governmental Fundsto the Statement of Activities
Amounts reported for governmental activities in the statement of activities are different because:
Governmental funds report capital outlays as expenditures. However, in the statement of activities the cost ofthose assets is allocated over their estimated useful lives and reported as depreciation expense. This is theamount by which the capital outlays exceeded depreciation in the current period.
Revenues in the statement of activities that do not provide current financial resources are not reported asrevenues in the funds.
The issuance of long-term debt (e.g. bonds, leases) provides current financial resources to governmentalfunds, while the repayment of the principal of long-term debt consumes the current financial resources ofgovernmental funds. Neither transaction, however, has any effect on net position. Also, governmental fundsreport the effect of premiums, discounts, and similar items when debt is first issued, whereas these amountsare deferred and amortized in the statement of activities. This amount is the net effect of these differences inthe treatment of long-term debt and related items.
22

County of Rockbridge, Virginia Exhibit 7Statement of Net PositionProprietary Funds
Enterprise EnterpriseFund Fund
Landfill RecyclingFund Fund Total
ASSETSCurrent assets:
Cash and cash equivalents $ 1,614,827 $ - $ 1,614,827 Accounts receivable 67,360 - 67,360 Due from other funds 115,923 - 115,923
Total current assets $ 1,798,110 $ - $ 1,798,110 Noncurrent assets:
Restricted assets:Cash and cash equivalents $ 9,901,532 $ - $ 9,901,532 Total restricted assets $ 9,901,532 $ - $ 9,901,532
Capital assets, net of accumulated depreciation:Land $ 531,037 $ - $ 531,037 Buildings and improvements 1,391,744 123,983 1,515,727 Machinery and equipment 1,255,612 53,502 1,309,114 Construction in progress 920,478 - 920,478 Total capital assets $ 4,098,871 $ 177,485 $ 4,276,356 Total noncurrent assets $ 14,000,403 $ 177,485 $ 14,177,888Total assets $ 15,798,513 $ 177,485 $ 15,975,998
DEFERRED OUTFLOWS OF RESOURCESItems related to measurement of net pension liability $ 2,278 $ 1,278 $ 3,556 Pension contributions subsequent to measurement date 36,039 20,217 56,256
Total deferred outflows of resources $ 38,317 $ 21,495 $ 59,812
LIABILITIESCurrent liabilities:
Accounts payable $ 28,340 $ 5,488 $ 33,828 Initial advances from participating entities 74,292 - 74,292 Capital advances from Rockbridge County 957,773 - 957,773 Accrued interest payable 39,124 - 39,124 Bonds payable - current portion 65,334 - 65,334 Capital lease payable - current portion 273,231 - 273,231 Compensated absences-current portion 6,406 2,773 9,179
Total current liabilities $ 1,444,500 $ 8,261 $ 1,452,761Noncurrent liabilities:
Compensated absences - net of current portion $ 19,220 $ 8,317 $ 27,537 Net OPEB obligation 3,000 - 3,000 Net pension liability 193,094 108,322 301,416 Closure and post-closure liability 1,980,511 - 1,980,511 Bonds payable - net of current portion 7,199,376 - 7,199,376 Capital lease payable - net of current portion 643,359 - 643,359
Total noncurrent liabilities $ 10,038,560 $ 116,639 $ 10,155,199Total liabilities $ 11,483,060 $ 124,900 $ 11,607,960
DEFERRED INFLOWS OF RESOURCESItems related to measurement of net pension liability $ 28,774 $ 16,143 $ 44,917
Total deferred intflows of resources $ 28,774 $ 16,143 $ 44,917
NET POSITIONNet investment in capital assets $ 2,414,996 $ 177,485 $ 2,592,481 Restricted for debt service 1,423,596 - 1,423,596 Unrestricted 486,404 (119,548) 366,856
Total net position $ 4,324,996 $ 57,937 $ 4,382,933
The notes to the financial statements are an integral part of this statement.
June 30, 2016
23

County of Rockbridge, Virginia Exhibit 8Statement of Revenues, Expenses, and Changes in Net PositionProprietary FundsFor the Year Ended June 30, 2016
Enterprise EnterpriseFund Fund
Landfill RecyclingFund Fund Total
OPERATING REVENUESCharges for services:
Landfill Rockbridge County $ 1,427,065 $ - $ 1,427,065 Landfill City of Lexington 442,747 - 442,747 Landfill City of Buena Vista 228,635 - 228,635 Sale of recycles - 7,697 7,697 Miscellaneous 14,994 3,178 18,172
Total operating revenues $ 2,113,441 $ 10,875 $ 2,124,316
OPERATING EXPENSESPersonal services $ 309,588 $ 250,954 $ 560,542 Fringe benefits 107,051 60,008 167,059 Contractual services 163,633 87,913 251,546 Other charges 187,689 32,910 220,599 Rent 9,969 - 9,969 Depreciation 227,486 32,144 259,630
Total operating expenses $ 1,005,416 $ 463,929 $ 1,469,345
Operating income (loss) $ 1,108,025 $ (453,054) $ 654,971
NONOPERATING REVENUES (EXPENSES)Investment income $ 11,162 $ - $ 11,162 Commonwealth of Virginia-litter control grant - 23,300 23,300 Bond issuance cost (124,141) - (124,141) Interest expense (46,079) - (46,079) Landfill closure costs and post-closure liability (8,206) - (8,206)
Total nonoperating revenues (expenses) $ (167,264) $ 23,300 $ (143,964) Income before transfers $ 940,761 $ (429,754) $ 511,007
Transfers in $ - $ 459,051 $ 459,051 Transfers out (9,100) - (9,100)
Change in net position $ 931,661 $ 29,297 $ 960,958
Total net position - beginning, as restated 3,393,335 28,640 3,421,975 Total net position - ending $ 4,324,996 $ 57,937 $ 4,382,933
The notes to the financial statements are an integral part of this statement.
24

County of Rockbridge, Virginia Exhibit 9Statement of Cash FlowsProprietary FundsFor the Year Ended June 30, 2016
Enterprise EnterpriseFund Fund
Landfill RecyclingFund Fund Total
CASH FLOWS FROM OPERATING ACTIVITIESReceipts from customers and users $ 2,108,494 $ 10,875 $ 2,119,369 Payments to suppliers (347,106) (116,161) (463,267) Payments to employees (426,005) (320,422) (746,427)
Net cash provided by (used for) operating activities $ 1,335,383 $ (425,708) $ 909,675
CASH FLOWS FROM NONCAPITAL FINANCING ACTIVITIESCommonwealth of Virginia-litter control grant $ - $ 23,300 $ 23,300 Operating transfer from general fund - 459,051 459,051
Net cash provided by (used for) noncapital financingactivities $ - $ 482,351 $ 482,351
CASH FLOWS FROM CAPITAL AND RELATED FINANCINGACTIVITIESPurchase of capital assets $ (1,148,086) $ (56,643) $ (1,204,729) Proceeds from capital leases issue 681,832 - 681,832 Proceeds from revenue bonds issue 6,566,329 - 6,566,329 Principal paid on capital debt (234,353) - (234,353) Bond issuance cost (124,141) - (124,141) Interest expense (18,064) - (18,064) Capital advances Rockbridge County 268,875 - 268,875
Net cash provided by (used for) capital and relatedfinancing activities $ 5,992,392 $ (56,643) $ 5,935,749
CASH FLOWS FROM INVESTING ACTIVITIESInterest income $ 11,162 $ - $ 11,162
Net increase (decrease) in cash and cash equivalents $ 7,338,937 $ - $ 7,338,937
Cash and cash equivalents - beginning - including restricted 4,177,422 - 4,177,422 Cash and cash equivalents - ending - including restricted $ 11,516,359 $ - $ 11,516,359
Reconciliation of operating income (loss) to net cash provided by (used for) operating activities:Operating income (loss) $ 1,108,025 $ (453,054) $ 654,971 Adjustments to reconcile operating income (loss) to net cash
provided by (used for) operating activities:Depreciation 227,486 32,144 259,630 (Increase) decrease in accounts receivable 15,949 - 15,949 (Increase) decrease in due from other funds (20,896) - (20,896) (Increase) decrease in deferred outflows of resources (3,960) (1,830) (5,790) Increase (decrease) in accounts payable 14,185 4,662 18,847 Increase (decrease) in compensated absences 5,781 (1,356) 4,425 Increase (decrease) in net pension liability 25,933 14,548 40,481 Increase (decrease) in deferred inflows of resources (37,120) (20,822) (57,942)
Net cash provided by (used for) operating activities $ 1,335,383 $ (425,708) $ 909,675
Schedule of non-cash capital and related financing activities:Landfill closure and post-closure costs $ 8,206 $ - $ 8,206 Capital assets transferred to the governmental activities (9,100) - (9,100)
Total non-cash capital and related financing activities $ (894) $ - $ (894)
The notes to the financial statements are an integral part of this statement.
25

County of Rockbridge, Virginia Exhibit 10Statement of Fiduciary Net PositionFiduciary Funds
PrimaryGovernment
AgencyFunds
ASSETSCash and cash equivalents $ 3,653,057
Total assets $ 3,653,057
LIABILITIESAccounts payable $ (65,416) Amounts held for payroll deductions 69,896 Amounts held for veterans memorial 9,781 Amounts held for drug enforcement 102,289 Amounts held for employee benefits 2,164 Amounts held for commonwealth attorney forfeitures 10,656 Amounts held for regional public safety communications center 3,523,687
Total liabilities $ 3,653,057
The notes to the financial statements are an integral part of this statement.
June 30, 2016
26

COUNTY OF ROCKBRIDGE, VIRGINIA
Notes to Financial Statements June 30, 2016
27
NOTE 1—SUMMARY OF SIGNIFICANT ACCOUNTING POLICIES:
The financial statements of the County conform to generally accepted accounting principles (GAAP) applicable to governmental units promulgated by the Governmental Accounting Standards Board (GASB). The following is a summary of the more significant policies:
A. Financial Reporting Entity
The County of Rockbridge, Virginia (government) is a municipal corporation governed by an elected five-member Board of Supervisors. The accompanying financial statements present the government and its component units, entities for which the government is considered to be financially accountable. Blended component units, although legally separate entities, are, in substance, part of the government’s operations. Each discretely presented component unit is reported in a separate column in the government-wide financial statements (see note below for description) to emphasize that it is legally separate from the government.
Blended component units - The Rockbridge Solid Waste Authority has been determined to be a component unit of Rockbridge County in accordance with Governmental Accounting Standards Board Statement 14. The Authority is a legally separate organization whose Board members are composed of the Rockbridge County Board of Supervisors. The primary government has a financial benefit and burden relationship with the Authority and is able to impose its will on the Authority. The Authority is a component unit of Rockbridge County. Complete financial statements for the Authority may be obtained at the Authority’s administrative office at 150 South Main Street, Lexington, Virginia 24450.
Discretely Presented Component Units:
Rockbridge County School Board: The School Board members are elected and are responsible for the operations of the County's School System within the County boundaries. The School Board is fiscally dependent on the County. The County has the ability to approve its budget and any amendments. The primary local sources of funding are from the General Fund of the County. The School Board does not issue a separate financial report. The financial statements of the School Board are presented as a discrete presentation in the County financial statements for the fiscal year ended June 30, 2016.
Rockbridge County Regional Jail Commission:The Rockbridge County Regional Jail Commission is a regional board organized to manage and confine prisoners from the localities of Lexington City, Buena Vista City and Rockbridge County. The Rockbridge County Board of Supervisors appoints two (2) members to the Commission, while the City of Lexington and the City of Buena Vista each appoint one member respectively. The County of Rockbridge serves as the fiscal agent for the Jail Commission. The Jail Commission is included in these financial statements because of the County’s ability to designate the management and exercise significant control over the operations of the entity. The financial statements of the Commission are presented as a discrete presentation in the County financial statements for the fiscal year ended June 30, 2016. Complete financial statements of the Rockbridge County Regional Jail Commission are available at the Rockbridge County Jail, 258 Greenhouse Road, Lexington, Virginia 24450.

COUNTY OF ROCKBRIDGE, VIRGINIA
Notes to Financial Statements (Continued) June 30, 2016
28
NOTE 1—SUMMARY OF SIGNIFICANT ACCOUNTING POLICIES: (CONTINUED)
A. Financial Reporting Entity (continued)
Discretely Presented Component Units: (Continued)
Rockbridge County Public Service Authority:The Rockbridge County Public Service Authority is organized to provide water and sewer services to customers located in the County. The Authority is a legally separate entity from the County. The County is financially accountable for the Authority in that the County appoints the Authority's Board of Directors and has a financial indebtedness burden related to the Authority. The financial statements of the Authority are presented as a discrete presentation in the County financial statements for the fiscal year ended June 30, 2016. Complete financial statements of the Rockbridge County Public Service Authority are available at the Authority's office: 150 South Main Street, Lexington, Virginia 24450.
Rockbridge Area Social Services Board:The Rockbridge Area Social Services Board is a regional board organized to provide social services to Rockbridge County, and the Cities of Lexington and Buena Vista. All three participating entities appoint members of the Board. The Rockbridge County Treasurer serves as the fiscal agent for the Comprehensive Services Act programs administered by under the Rockbridge Area Social Services operation. The Board is a legally separate organization, however the Board is included in the reporting entity because of the nature and significance of its relationship with the County of Rockbridge. Virginia. The financial statements of the Board are presented as a discrete presentation in the County financial statements for the fiscal year ended June 30, 2016. Complete financial statements of the Rockbridge Area Social Services Board are available at the Rockbridge Area Social Services office: 20 East Preston Street, Lexington, Virginia 24450.
B. Other Organizations
Included in the County's Financial Report: None
Excluded from the County's Financial Report:
Rockbridge County Industrial Development Authority:The County created the Industrial Development Authority to attract industry to the County and to provide financing for such industries. The Authority is comprised of seven members appointed by the Board of Supervisors. The Authority was created by resolution pursuant to state statute, and it is legally separate from the County. The County cannot impose its will on the Authority since it does not have the ability to modify or approve the budget or overrule or modify the decisions of the Authority. The Authority is fiscally independent, and there is no financial benefit or burden relationship with the County. Therefore, it is not included in the County's financial statements.
Rockbridge County Economic Development Authority:The County created the Economic Development Authority to assist with economic endeavors. The Authority is comprised of seven members appointed by the Board of Supervisors. The Authority was created by resolution pursuant to state statute, and it is legally separate from the County. The County cannot impose its will on the Authority since it does not have the ability to modify or approve the budget or overrule or modify the decisions of the Authority. The Authority is fiscally independent, and there is no financial benefit or burden relationship with the County. Therefore, it is not included in the County's financial statements.

COUNTY OF ROCKBRIDGE, VIRGINIA
Notes to Financial Statements (Continued) June 30, 2016
29
NOTE 1—SUMMARY OF SIGNIFICANT ACCOUNTING POLICIES: (CONTINUED)
B. Other Organizations (continued)
Rockbridge Area Community Services Board:The Rockbridge Area Community Services Board is considered an intergovernmental (joint) venture and therefore its operations are not included in the County’s financial statements. The Cities of Lexington and Buena Vista and the County of Rockbridge provide the financial support for the Board and appoint its governing Board in which is vested the ability to execute contracts and to budget and expend funds. No one locality contributes more than 50% of the Board’s funding or has oversight responsibility over its operations. Summary financial information is included in Note 4 of these financial statements. Complete financial statements can be obtained from the Rockbridge Area Community Services Board offices: 241 Greenhouse Road, Lexington, Virginia 24450.
Maury Service Authority:The Maury Service Authority is responsible for acquiring, financing, constructing, and maintaining facilities for the improvement, treatment, storage and transmission of potable water. The Maury Service Authority is considered an intergovernmental (joint) venture and therefore its operations are not included in the County’s financial statements. The County of Rockbridge and the Cities of Lexington and Buena Vista appoint the Authority’s Board of Directors. The City of Lexington and the Rockbridge Public Service Authority provide substantially all of the Authority’s revenues. Summary financial information is included in Note 4 of these financial statements. Complete financial statements of the Maury Service Authority are available at the Authority’s office at 130 Osage Lane, Lexington, Virginia 24450.
Rockbridge Regional Public Safety Communications Center: The Rockbridge Regional Public Safety Communications Center is organized for the purpose of establishing a mutually beneficial basis for the use and operation of a consolidated public safety dispatch center for the County of Rockbridge and Cities of Lexington and Buena Vista, Virginia. The Cities of Buena Vista and Lexington and the County of Rockbridge appoint the Board of Directors and each provides substantially all of the Center’s revenues. The City of Lexington serves as fiscal agent for the Center. The Center is not included in these financial statements because the County does not have ability to designate the management and exercise significant control over the operations of the entity. Summary financial information is included in Note 4 of these financial statements. Complete financial statements of the Rockbridge Regional Public Safety Communications Center are available at the Center’s office at 300 E. Washington St., Lexington, Virginia 24450
C. Government-wide and fund financial statements
The government-wide financial statements (i.e., the Statement of Net Position and the Statement of Activities) report information on all of the nonfiduciary activities of the primary government and its component units. For the most part, the effect of interfund activity has been removed from these statements. Governmental activities, which normally are supported by taxes and intergovernmental revenues, are reported separately from business-type activities, which rely to a significant extent on fees and charges for support. Likewise, the primary government is reported separately from certain legally separate component units for which the primary government is financially accountable.
The Statement of Net Position is designed to display financial position of the primary government (governmental and business-type activities) and its discretely presented component units. Governments will report all capital assets in the government-wide Statement of Net Position and will report depreciation expenses – the cost of “using up” capital assets – in the Statement of Activities. The net position of a government will be broken down into three categories – 1) net investment in capital assets, 2) restricted; and 3) unrestricted.

COUNTY OF ROCKBRIDGE, VIRGINIA
Notes to Financial Statements (Continued) June 30, 2016
30
NOTE 1—SUMMARY OF SIGNIFICANT ACCOUNTING POLICIES: (CONTINUED)
C. Government-wide and fund financial statements (continued)
The Statement of Activities demonstrates the degree to which the direct expenses of a given function or segment are offset by program revenues. Direct expenses are those that are clearly identifiable with a specific function or segment. Program revenues include 1) charges to customers or applicants who purchase, use, or directly benefit from goods, services, or privileges provided by a given function or segment and 2) operating grants and contributions, and 3) capital grants and contributions, including special assessments. Taxes and other items not properly included among program revenues are reported instead as general revenues.Separate financial statements are provided for governmental funds, proprietary funds, and fiduciary funds, even though the latter are excluded from the government-wide financial statements. Major individual governmental funds and major individual enterprise funds are reported as separate columns in the fund financial statements.
D. Measurement focus, basis of accounting, and financial statement presentation
The government-wide financial statements are reported using the economic resources measurement focus and the accrual basis of accounting, as are the proprietary fund financial statements. Revenues are recorded when earned and expenses are recorded when a liability is incurred, regardless of the timing of related cash flows. Property taxes are recognized as revenues in the year for which they are levied. Grants and similar items are recognized as revenue as soon as all eligibility requirements imposed by the provider have been met.
Governmental fund financial statements are reported using the current financial resources measurement focus and the modified accrual basis of accounting. Revenues are recognized as soon as they are both measurable and available. Revenues are considered to be available when they are collectible within the current period or soon enough thereafter to pay liabilities of the current period. For this purpose, the government considers revenues to be available if they are collected within 60 days of the end of the current fiscal period. Expenditures generally are recorded when a liability is incurred, as under accrual accounting. However, debt service expenditures, as well as expenditures related to compensated absences and claims and judgments, are recorded only when payment is due.
Property taxes, franchise taxes, licenses, and interest associated with the current fiscal period are all considered to be susceptible to accrual and so have been recognized as revenues of the current fiscal period. Accordingly, real and personal property taxes are recorded as revenues and receivables when billed, net of allowances for uncollectible amounts. Property taxes not collected within 60 days after year-end are reflected as unavailable revenues. Sales and utility taxes, which are collected by the state or utilities and subsequently remitted to the County, are recognized as revenues and receivables upon collection by the state or utility, which is generally in the month preceding receipt by the County.
Licenses, permits, fines and rents are recorded as revenues when received. Intergovernmental revenues, consisting primarily of federal, state and other grants for the purpose of funding specific expenditures, are recognized when earned or at the time of the specific expenditure. Revenues from general purpose grants are recognized in the period to which the grant applies. All other revenue items are considered to be measurable and available only when cash is received by the government.

COUNTY OF ROCKBRIDGE, VIRGINIA
Notes to Financial Statements (Continued) June 30, 2016
31
NOTE 1—SUMMARY OF SIGNIFICANT ACCOUNTING POLICIES: (CONTINUED)
D. Measurement focus, basis of accounting, and financial statement presentation (continued)
The government reports the following major governmental funds:
The general fund is the government’s primary operating fund. It accounts for and reports all financial resources of the general government, except those required to be accounted for in another fund. The general fund includes the activities of the central stores and the South River flood mitigation funds.
Special revenue funds account for and report the proceeds of the specific revenue sources (other than major capital projects) that are legally restricted to expenditures for specified purposes. The County does not have any special revenue funds to report for fiscal year 2016.
The capital projects funds account for and report financial resources to be used for the acquisition or construction of major capital facilities, other than those financed by proprietary funds. Capital project funds consist of the County Capital Projects fund and the Other Capital Projects fund.
The government reports the following major proprietary funds:
The landfill and recycling funds account for and report the activities of the Rockbridge County Solid Waste Authority, a blended component unit of the government. The County operates the landfill and recycling operations of the Authority.
Additionally, the government reports the following fund types:
Fiduciary (Trust and Agency) funds account for assets held by the government in a trustee capacity or as agent or custodian for individuals, private organizations, other governmental units, or other funds. Agency funds include the Payroll Deduction, Drug, Veterans Memorial, Employee Benefit, Commonwealth Attorney Forfeitures Funds and the Rockbridge Regional Public Safety Communications Center.
As a general rule the effect of interfund activity has been eliminated from the government-wide financial statements. Exceptions to this general rule are other charges between the government’s landfill and recycling funds and various other functions of the government. Elimination of these charges would distort the direct costs and program revenues reported for the various functions concerned.
Amounts reported as program revenues include 1) charges to customers or applicants for goods, services, or privileges provided, 2) operating grants and contributions, and 3) capital grants and contributions, including special assessments. Internally dedicated resources are reported as general revenues rather than as program revenues. Likewise, general revenues include all taxes.
Proprietary funds distinguish operating revenues and expenses from nonoperating items. Operating revenues and expenses generally result from providing services and producing and delivering goods in connection with a proprietary fund’s principal ongoing operations. The principal operating revenues of the Authority enterprise fund are charges to customers for sales and services. Operating expenses for enterprise funds and internal service funds include the cost of sales and services, administrative expense, and depreciation on capital assets. All revenues and expenses not meeting this definition are reported as nonoperating revenues and expenses.

COUNTY OF ROCKBRIDGE, VIRGINIA
Notes to Financial Statements (Continued) June 30, 2016
32
NOTE 1—SUMMARY OF SIGNIFICANT ACCOUNTING POLICIES: (CONTINUED)
E. Assets, liabilities, deferred outflows/inflows of resources and net position/fund balance
1. Cash and cash equivalents
The government’s cash and cash equivalents are considered to be cash on hand, demand deposits, and short-term investments with original maturities of three months or less from the date of acquisition.
2. Receivables and payables
Activities between funds that are representative of lending/borrowing arrangements outstanding at the end of the fiscal year are referred to as either due to/from other funds (i.e., the current portion of interfund loans). All other outstanding balances between funds are reported as “Advances to/from other funds” (i.e. the noncurrent portion of interfund loans). Any residual balances outstanding between the governmental activities and business-type activities are reported in the government-wide financial statements as internal balances.
Advances between funds, as reported in the fund financial statements, are offset by a fund balance nonspendable account in applicable governmental funds to indicate that they are not available for appropriation and are not expendable available financial resources.
3. Inventories and prepaid items
All inventories are valued at cost using the first-in/first-out (FIFO) method. Inventories of governmental funds are recorded as expenditures when consumed rather than when purchased. Quantities on hand at year-end are considered immaterial and have not been recorded, except in the School Cafeteria Fund and Discretely Presented Component Unit-Rockbridge Public Service Authority where it can be easily measured.
Certain payments to vendors reflect costs applicable to future accounting periods and are recorded as prepaid items in both government-wide and fund financial statements.
4. Property taxes
Property is assessed at its value on January 1. Property taxes attach as an enforceable lien on property as of January 1. Real estate taxes are payable in two installments on June 5th and December 5th. Personal property taxes are due and collectible annually on December 5th. The County bills and collects its own property taxes. The County calculates its allowance for uncollectible accounts using historical collection data and, in certain cases, specific account analysis. The allowance amounted to approximately $384,062 at June 30, 2016 and is comprised solely of property taxes.
5. Restricted assets
The governmental funds maintain restricted cash for debt service, garage, fire funds, industrial property, and the discretely presented component unit-school board. The Landfill fund maintains restricted assets invested in the Local Government Investment Pool. These funds are restricted for the payment of future closure and post-closure costs associated with the County’s landfill. Additionally, the Landfill fund has restricted unspent bond proceeds of $6,497,425. The Discretely Presented Component Unit Rockbridge Public Service Authority maintains restricted assets that are limited by applicable bond covenants.

COUNTY OF ROCKBRIDGE, VIRGINIA
Notes to Financial Statements (Continued) June 30, 2016
33
NOTE 1—SUMMARY OF SIGNIFICANT ACCOUNTING POLICIES: (CONTINUED)
E. Assets, liabilities, deferred outflows/inflows of resources and net position/fund balance (continued)
6. Capital assets
Capital assets, which include property, plant, equipment, and infrastructure assets (e.g., roads, bridges, sidewalks, and similar items), are reported in the applicable governmental or business-type activities columns in the government-wide financial statements. Capital assets are defined by the government as assets with an initial, individual cost of more than $5,000 (amount not rounded) and an estimated useful life in excess of one year. Such assets are recorded at historical cost or estimated historical cost if purchased or constructed. Donated capital assets are recorded at acquisition value at the date of donation.
The cost of normal maintenance and repairs that do not add to the value of the asset or materially extend the asset’s life are not capitalized.
Major outlays for capital assets and improvements are capitalized as projects are constructed. Interest incurred during the construction phase of capital assets of business-type activities is included as part of the capitalized value of the assets constructed. During the current year $31,838 in interest was capitalized in the Landfill fund. No interest was capitalized during the previous year.
Property, plant, and equipment and infrastructure of the primary government, as well as the component units, are depreciated using the straight line method over the following estimated useful lives:
Assets Years Buildings 40 Building improvements 40 Machinery and equipment 5-10 Utility, plant and equipment 5-30
7. Compensated absences
It is the government’s policy to permit employees to accumulate earned but unused vacation and sick pay benefits. All sick and vacation pay is accrued when incurred in the government-wide and proprietary fund financial statements. A liability for these amounts is reported in governmental funds only if they have matured, for example, as a result of employee resignations and retirements.
8. Long-term obligations
In the government-wide financial statements, and proprietary fund types in the fund financial statements, long-term obligations are reported as liabilities in the applicable governmental activities, business-type activities, or proprietary fund type statement of net position. Bond premiums and discounts are deferred and amortized over the life of the bonds using the effective interest method. Bonds payable are reported net of the applicable bond premium or discount.
In the fund financial statements, governmental fund types recognize bond premiums and discount, during the current period. The face amount of debt issued is reported as other financing sources. Premiums received on debt issuances are reported as other financing sources while discounts on debt issuances are reported as other financing uses.

COUNTY OF ROCKBRIDGE, VIRGINIA
Notes to Financial Statements (Continued) June 30, 2016
34
NOTE 1—SUMMARY OF SIGNIFICANT ACCOUNTING POLICIES: (CONTINUED)
E. Assets, liabilities, deferred outflows/inflows of resources and net position/fund balance (continued)
9. Fund equity The County reports fund balance in accordance with GASB Statement 54, Fund Balance Reporting and Governmental Fund Type Definitions. The following classifications describe the relative strength of the spending constraints placed on the purposes for which resources can be used: Nonspendable fund balance – amounts that are not in spendable form (such as inventory and
prepaids) or are required to be maintained intact (corpus of a permanent fund); Restricted fund balance – amounts constrained to specific purposes by their providers (such as
grantors, bondholders, and higher levels of government), through constitutional provisions, or by enabling legislation;
Committed fund balance – amounts constrained to specific purposes by a government itself, using its highest level of decision-making authority (the Board of Supervisors); to be reported as committed, amounts cannot be used for any other purpose unless the government takes the same highest level action to remove or change the constraint;
Assigned fund balance – amounts a government intends to use for a specific purpose; intent can be expressed by the governing body or by an official or body to which the governing body delegates the authority;
Unassigned fund balance – amounts that are available for any purpose; positive amounts are only reported in the general fund.
When fund balance resources are available for a specific purpose in more than one classification, it is the County’s policy to use the most restrictive funds first in the following order: restricted, committed, assigned, and unassigned as they are needed. The County establishes (and modifies or rescinds) fund balance commitments by passage of an ordinance. This is typically done through adoption and amendment of the budget. A fund balance commitment is further indicated in the budget document as a designation or commitment of the fund (such as for special incentives). Assigned fund balance is established by the Board of Supervisors through adoption or amendment of the budget as intended for specific purpose (such as the purchase of capital assets, construction, debt service, or for other purposes).
10. Net position Net position is the difference between (a) assets and deferred outflows of resources and (b) liabilities and deferred inflows of resources. Net investment in capital assets represents capital assets, less accumulated depreciation, less any outstanding debt related to the acquisition, construction or improvement of those assets. Deferred outflows of resources and deferred inflows of resources that are attributable to the acquisition, construction, or improvement of those assets or related debt are also included in this component of net position.
11. Net position flow assumption Sometimes the County will fund outlays for a particular purpose from both restricted (e.g. restricted bond and grant proceeds) and unrestricted resources. In order to calculate the amounts to report as restricted – net position and unrestricted – net position in the financial statements, a flow assumption must be made about the order in which the resources are considered to be applied. It is the County’s policy to consider restricted – net position to have been depleted before unrestricted – net position is applied.
12. Reclassifications Certain amounts presented in the prior year data have been reclassified in order to be consistent with the current year’s presentation.

COUNTY OF ROCKBRIDGE, VIRGINIA
Notes to Financial Statements (Continued) June 30, 2016
35
NOTE 1—SUMMARY OF SIGNIFICANT ACCOUNTING POLICIES: (CONTINUED)
F. Investments Money market investments, participating interest-earning investment contracts (repurchase agreements) that have a remaining maturity at time of purchase of one year or less, nonparticipating interest-earning investment contracts (nonnegotiable certificates of deposit (CDs) and external investment pools are measured at amortized cost. All other investments are reported at fair value.
G. Use of Estimates The preparation of financial statements in conformity with generally accepted accounting principles requires management to make estimates and assumptions that affect certain reported amounts and disclosures. Accordingly, actual results could differ from those estimates.
H. Deferred Outflows/Inflows of Resources In addition to assets, the statement of financial position will sometimes report a separate section for deferred outflows of resources. This separate financial statement element, deferred outflows of resources, represents a consumption of net position that applies to a future period(s) and so will not be recognized as an outflow of resources (expenditure) until then. The Primary Government has two items that qualify for reporting in this category. The Primary Government shows a deferred charge on refunding reported in to government-wide statement of net position. A deferred charge on refunding results from the difference in the carrying value of refunded debt and its reacquisition price. This amount is deferred and amortized over the shorter of the life of the refunded or refunding debt. Additionally, the Primary Government shows deferred outflows which are comprised of certain items related to the measurement of the net pension liability. These include differences between expected and actual experience, and contributions to the pension plan made during the current year and subsequent to the net pension liability measurement date, which will be recognized as a reduction of the net pension liability next fiscal year. For more detailed information on this item, reference the pension note. In addition to liabilities, the statement of financial position will sometimes report a separate section for deferred inflows of resources. This separate financial statement element, deferred inflows of resources, represents an acquisition of net position that applies to a future period(s) and so will not be recognized as an inflow of resources (revenue) until that time. The Primary Government has two types of items that qualify for reporting in this category. Under a modified accrual basis of accounting, unavailable revenue representing property taxes receivable is reported in the governmental funds balance sheet. This amount is comprised of uncollected property taxes due prior to June 30, 2nd half installments levied during the fiscal year but due after June 30th, and amounts prepaid on the 2nd half installments and is deferred and recognized as an inflow of resources in the period that the amount becomes available. Under the accrual basis, 2nd half installments levied during the fiscal year but due after June 30th and amounts prepaid on the 2nd half installments are reported as deferred inflows of resources. In addition, certain items related to the measurement of the net pension liability are reported as deferred inflows of resources. These include differences between expected and actual experience, change in assumptions, the net differences between projected and actual earnings on pension plan investments, and changes in proportion and differences between employer contributions and proportionate share of contributions. For more detailed information on these items, reference the pension note.
I. PensionsFor purposes of measuring the net pension liability, deferred outflows of resources and deferred inflows of resources related to pensions, and pension expense, information about the fiduciary net position of the Primary Government’s Retirement Plan and the additions to/deductions from the Primary Government’s Retirement Plan’s net fiduciary position have been determined on the same basis as they were reported by the Virginia Retirement System (VRS). For this purpose, benefit payments (including refunds of employee contributions) are recognized when due and payable in accordance with the benefit terms. Investments are reported at fair value.

COUNTY OF ROCKBRIDGE, VIRGINIA
Notes to Financial Statements (Continued) June 30, 2016
36
NOTE 1—SUMMARY OF SIGNIFICANT ACCOUNTING POLICIES: (CONTINUED)
J. Adoption of Accounting Principles
Governmental Accounting Standards Board Statement No. 82, Pension Issues – an amendment of GASB Statements No. 67, No. 68, and No. 73 The County early implemented provisions of the above Statement during the fiscal year ended June 30, 2016. The objective of this Statement is to address certain issues that have been raised with respect to Statements No. 67, Financial Reporting for Pension Plans, No. 68, Accounting and Financial Reporting for Pensions, and No. 73, Accounting and Financial Reporting for Pensions and Related Assets That Are Not within the Scope of GASB Statement 68, and Amendments to Certain Provisions of GASB Statements 67 and 68. Specifically, this Statement addresses issues regarding (1) the presentation of payroll-related measures in required supplementary information, (2) the selection of assumptions and the treatment of deviations from the guidance in an Actuarial Standard of Practice for financial reporting purposes, and (3) the classification of payments made by employers to satisfy employee (plan member) contribution requirements. No restatement was required as a result of this implementation.
Governmental Accounting Standards Board Statement No. 79, Certain External Investment Pools and Pool Participants The County implemented the provisions of the above Statement during the fiscal year ended June 30, 2016. This Statement addresses accounting and financial reporting for certain external investment pools and pool participants. Specifically, it establishes criteria for an external investment pool to qualify for making the election to measure all of its investments at amortized cost for financial reporting purposes. An external investment pool qualifies for that reporting if it meets all of the applicable criteria established in this Statement. There was no material impact on the County’s financial statement as a result of the implementation of Statement No. 79. All required disclosures are located in Note 12.
K. Restatement of Beginning Fund Balance/Net Position
Beginning fund balance has been restated in the financial statements as detailed below:
General LandfillFund Fund
Fund balances as reported at June 30, 2015 $ 24,366,332 $ 4,082,233 To record additional advances to/from participating entities as of June 30, 2015 771,514 (688,898) Fund Balances as restated at June 30, 2015 $ 25,137,846 $ 3,393,335
Fund Financial Statements
Beginning net position has been restated in the financial statements as detailed below:
Governmental Business-type Total PrimaryActivities Activities Government
Net Position as reported at June 30, 2015 $ 35,718,497 $ 4,110,873 $ 39,829,370 To record additional advances to/from participating entities as of June 30, 2015 771,514 (688,898) 82,616 Net Position as restated at June 30, 2015 $ 36,490,011 $ 3,421,975 $ 39,911,986
Government-wide Financial Statements

COUNTY OF ROCKBRIDGE, VIRGINIA
Notes to Financial Statements (Continued) June 30, 2016
37
NOTE 2—RECONCILIATION OF GOVERNMENT-WIDE AND FUND FINANCIAL STATEMENTS:
A. Explanation of certain differences between the governmental fund balance sheet and the government-wide statement of net position
The governmental fund balance sheet includes a reconciliation between fund balance-total governmental funds and net position-governmental activities as reported in the government-wide statement of net position. One element of that reconciliation explains that long-term liabilities, including bonds payable, are not due and payable in the current period and therefore are not reported in the funds. The details of these ($63,413,254) and ($28,499,381) differences for the primary government and discretely presented component unit, respectively, are as follows:
Primary Component UnitGovernment School Board
Bonds and loans payable $ (56,815,726) $ -Unamortized premium on debt (3,457,468) -Accrued interest payable (810,327) -Deferred charge on refunding 1,424,664 -Net OPEB obligation (166,000) (1,593,000)Items related to measurement of net pension liability 38,832 20,617Net pension liability (3,292,026) (26,757,165)Compensated absences (335,203) (169,833)Net adjustment to reduce fund balance-totalgovernmental funds to arrive at net position-governmental activities $ (63,413,254) $ (28,499,381)
B. Explanation of certain differences between the governmental fund statement of revenues, expenditures, and changes in fund balances and the government-wide statement of activities
The governmental fund statement of revenues, expenditures, and changes in fund balances includes a reconciliation between net changes in fund balances-total governmental funds and changes in net position of governmental activities as reported in the government-wide statement of activities. One element of that reconciliation explains that Governmental funds report capital outlays as expenditures. However, in the statement of activities the cost of those assets is allocated over their estimated useful lives and reported as depreciation expense. The details of these $(3,177,114) and $1,199,278 differences for the primary government and discretely presented component unit, respectively, are as follows:
Primary Component UnitGovernment School Board
Capital outlay $ 873,126 $ 827,597 Depreciation expense (1,348,318) (2,330,241) Allocation of debt financed school assetsbased on current year repayments (2,701,922) 2,701,922 Net adjustment to increase (decrease) net changes in fund balances-total governmentalfunds to arrive at changes in net position ofgovernmental activities $ (3,177,114) $ 1,199,278

COUNTY OF ROCKBRIDGE, VIRGINIA
Notes to Financial Statements (Continued) June 30, 2016
38
NOTE 2—RECONCILIATION OF GOVERNMENT-WIDE AND FUND FINANCIAL STATEMENTS: (CONTINUED)
B. Explanation of certain differences between the governmental fund statement of revenues, expenditures, and changes in fund balances and the government-wide statement of activities (continued)
Another element of that reconciliation states that the issuance of long-term debt (e.g., bonds, leases) provides current financial resources to governmental funds, while the repayment of the principal of long-term debt consumes the current financial resources of governmental funds. Neither transaction, however, has any effect on net position. Also, governmental funds report the effect of premiums, discounts, and similar items when debt is first issued, whereas these amounts are deferred and amortized in the statement of activities. The details of this $2,377,178 difference in the primary government are as follows:
Debt issued or incurred:Revenue bonds $ (4,985,000)Premium on bonds (835,950)Deferred charge on refunding 449,876
Principal repayments:General obligation bonds 2,002,118Revenue bonds 5,630,000Amortization of deferred charge on refunding (48,740)
Amortization of premium on general obligation bonds 164,874Net adjustment to increase (decrease) net changes infund balances-total governmental funds to arrive atchanges in net position of governmental activities $ 2,377,178
Another element of that reconciliation states that some expenses reported in the statement of activities do not require the use of current financial resources and therefore are not reported as expenditures in governmental funds. The details of these ($312,022) and ($1,530,549) differences for the primary government and discretely presented component unit, respectively, are as follows:
Primary Component UnitGovernment School Board
Compensated absences $ (34,175) $ (67,609)Net OPEB obligation (18,000) (208,000)Net pension liability (442,136) (1,206,852)Deferred outflows related to pension payments subsequent to the measurement date 1,937 (68,705)Deferred outflows related to measurement of net pension liability 38,832 20,617Accrued interest payable 141,520 -
Net adjustment to increase (decrease) net changesin fund balances-total governmental funds to arriveat changes in net position of governmental activities $ (312,022) $ (1,530,549)

COUNTY OF ROCKBRIDGE, VIRGINIA
Notes to Financial Statements (Continued) June 30, 2016
39
NOTE 3—STEWARDSHIP, COMPLIANCE, AND ACCOUNTABILITY:
A. Budgetary information
The following procedures are used by the County in establishing the budgetary data reflected in the financial statements:
1. Prior to March 30, the County Administrator submits to the Board of Supervisors a proposed operating and capital budget for the fiscal year commencing the following July 1. The operating and capital budget includes proposed expenditures and the means of financing them.
2. Public hearings are conducted to obtain citizen comments.
3. Prior to June 30, the budget is legally enacted through passage of an Appropriations Resolution.
4. The Appropriations Resolution places legal restrictions on expenditures at the department level or category level. The Board of Supervisors has authorized the County Administrator to revise appropriations for each department or category as needed to meet actual operational expenditures. The County Administrator is also authorized to transfer budgeted amounts within general government departments; however, the School Board is authorized to transfer budgeted amounts within the school system's categories.
5. Formal budgetary integration is employed as a management control device during the year for the General Fund.
6. All budgets are adopted on a basis consistent with generally accepted accounting principles (GAAP).
7. Appropriations lapse on June 30, for all County units.
8. All budgetary data presented in the accompanying financial statements is the revised budget as of June 30.
B. Excess of expenditures over appropriations:
For the year ended June 30, 2016, the following funds that had expenditures exceeding appropriations.
Excess ofExpenditures
overFund Appropriations
County Capital Projects Fund $ 53,978
C. Deficit fund equity
At June 30, 2016, there were no funds that showed deficit equity.

COUNTY OF ROCKBRIDGE, VIRGINIA
Notes to Financial Statements (Continued) June 30, 2016
40
NOTE 4—JOINT VENTURES:
As described in Note 1-B, the following boards are construed as operating as joint ventures between the Cities of Lexington and Buena Vista, and the County of Rockbridge. Summary financial information for the Boards at June 30, 2016 is provided below:
Rockbridge RegionalMaury Rockbridge Area Public Safety
Service Community Communications Authority Services Board Center
Total assets and deferred outflows of resources $ 40,045,761 $ 8,387,808 $ 5,948,150 Total liabilities and deferred inflows of resources 15,702,707 5,262,836 5,783,228 Total net position $ 24,343,054 $ 3,124,972 $ 164,922 For the year ended June 30, 2016
Operating revenue $ 2,816,879 $ 4,290,086 $ 236,493 Operating expenses (3,265,818) (7,349,343) (1,330,177) Nonoperating income (expense) 1,225,263 3,312,570 1,095,760 Change in net position $ 776,324 $ 253,313 $ 2,076
Net position at beginning of year 23,566,730 2,871,659 162,846 Net position at end of year $ 24,343,054 $ 3,124,972 $ 164,922
NOTE 5—DUE FROM OTHER GOVERNMENTAL UNITS:
Due from other governments consists of payments due from federal, state, and local governmental units at June 30, 2016 as follows:
ComponentComponent Unit
Unit Component RockbridgeGovernmental School Unit Jail Area Social
Activities Board Commission Services BoardCommonwealth of Virginia:
State sales taxes $ - $ 544,754 $ - $ - Local sales taxes 492,422 - - - Public assistance grants - - - 63,043 Comprehensive services act - - - 345,464 Communications tax 147,400 - - - Shared expenses 165,987 - 118,106 - Fire program funds 64,592 - - - Other 98,360 207,182 96,044 -
Federal Government:Violence against women 13,350 - - - DHCD 6,635 - - - Other 5,175 62,515 - 108,899
Other Governmental Units:City of Lexington - - 14,892 - City of Buena Vista - - 41,782 - County of Rockbridge - - 61,465 -
Totals $ 993,921 $ 814,451 $ 332,289 $ 517,406

COUNTY OF ROCKBRIDGE, VIRGINIA
Notes to Financial Statements (Continued) June 30, 2016
41
NOTE 6—INTERFUND OBLIGATIONS:
The purpose of interfund obligations due to/from component unit is to report the balance of local appropriations unspent at year-end due back to the respective funds. The purpose of interfund obligations due to/from other funds is to repay the general fund for expenditures related to the landfill and school capital projects.
Due From Due ToComponent Component
Due From Due To Unit/Primary Unit/PrimaryFund Other Funds Other Funds Government GovernmentGeneral $ 1,837 $ 115,923 $ 2,016,342 $ - Landfill Fund 115,923 - - - Other Capital Projects Fund - 1,837 - - Component Unit Rockbridge Regional Jail Commission - - - 71,600 Component Unit Rockbridge
Area Social Services - - - 633,801 Component Unit School Board - - - 1,310,941 Total $ 117,760 $ 117,760 $ 2,016,342 $ 2,016,342
NOTE 7—LONG-TERM OBLIGATIONS:
Primary Government – Governmental Activities Indebtedness:
Changes in Long-Term Obligations:
The following is a summary of long-term obligations transactions of the County for the year ended June 30, 2016:
Balance BalanceJuly 1, Additions/ Decreases/ June 30,2015 Issuances Retirements 2016
Governmental Activities:General obligation bonds $ 40,817,844 $ - $ 1,822,118 $ 38,995,726 Revenue bonds 17,390,000 4,985,000 5,630,000 16,745,000 Bond premium 2,786,392 835,950 164,874 3,457,468 Literary loan funds 1,255,000 - 180,000 1,075,000 Compensated absences 301,028 310,056 275,881 335,203 Net pension liability 2,849,890 2,088,698 1,646,562 3,292,026 Net OPEB obligation 148,000 31,000 13,000 166,000
Total Governmental Activities $ 65,548,154 $ 8,250,704 $ 9,732,435 $ 64,066,423
Business-type Activities:Revenue bonds $ 615,000 $ 5,710,000 $ 20,000 $ 6,305,000 Bond premium 109,462 856,329 6,081 959,710 Capital leases 449,111 681,832 214,353 916,590 Compensated absences 32,291 32,841 28,416 36,716 Net OPEB obligation 3,000 1,000 1,000 3,000 Net pension liability 260,935 191,239 150,758 301,416 Landfill closure and post-closure care 1,972,305 8,206 - 1,980,511
Total Business-type Activities $ 3,442,104 $ 7,481,447 $ 420,608 $ 10,502,943 Total Long-Term Obligations $ 68,990,258 $ 15,732,151 $ 10,153,043 $ 74,569,366

COUNTY OF ROCKBRIDGE, VIRGINIA
Notes to Financial Statements (Continued) June 30, 2016
42
NOTE 7—LONG-TERM OBLIGATIONS: (Continued)
Primary Government – Governmental Activities Indebtedness: (continued)
Annual requirements to amortize long-term debt and related interest are as follows:
Year EndingJune 30, Principal Interest Principal Interest Principal Interest
2017 $ - $ 713,423 $ 1,884,665 $ 1,602,878 $ 180,000 $ 45,2932018 305,000 720,089 1,952,709 1,523,642 180,000 38,0032019 435,000 703,677 2,015,553 1,444,548 175,000 30,8142020 585,000 680,724 2,082,446 1,368,716 180,000 22,7252021 650,000 651,071 2,154,438 1,286,916 180,000 13,6352022 675,000 623,967 2,227,270 1,195,869 180,000 4,5452023 705,000 595,518 2,195,254 1,106,851 - -2024 735,000 560,443 2,183,391 1,025,326 - -2025 775,000 525,255 1,950,000 957,604 - -2026 805,000 490,242 2,005,000 899,189 - -2027 840,000 453,821 1,780,000 844,779 - -2028 880,000 415,486 1,835,000 787,088 - -2029 925,000 375,627 1,895,000 723,456 - -2030 960,000 334,355 1,160,000 681,125 - -2031 1,010,000 290,696 1,185,000 498,036 - -2032 1,055,000 244,402 815,000 314,185 - -2033 1,095,000 197,011 840,000 288,946 - -2034 1,145,000 149,919 865,000 262,945 - -2035 1,190,000 102,176 890,000 236,181 - -2036 1,240,000 52,436 920,000 208,579 - -2037 360,000 20,425 950,000 180,061 - -2038 375,000 6,900 980,000 150,629 - -2039 - - 1,010,000 119,650 - -2040 - - 1,040,000 87,106 - -2041 - - 1,075,000 53,531 - -2042 - - 1,105,000 18,233 - -
Total $ 16,745,000 $ 8,907,663 $ 38,995,726 $ 17,866,069 $ 1,075,000 $ 155,015
Revenue Bonds General Obligation Bonds Literary Loans

COUNTY OF ROCKBRIDGE, VIRGINIA
Notes to Financial Statements (Continued) June 30, 2016
43
NOTE 7—LONG-TERM OBLIGATIONS: (CONTINUED)
Primary Government – Governmental Activities Obligations: (continued)
Details of Long-Term Obligations:
AmountTotal Due Within
Amount One YearRevenue bonds:
$11,760,000, issued June 5, 2013 at a premium of $1,771,014,payable in semi-annual installments of principal and interest onOctober 1, and April 1, variable interest at 4.261%-4.823% throughApril 1, 2036 $ 11,760,000 $ -
$4,985,000, issued May 25, 2016 at a premium of $835,950, payablein semi-annual installments of principal and interest on October 1, andApril 1, variable interest at 3.796%-5.125%, through April 1, 2038 4,985,000 -
Total revenue bonds $ 16,745,000 $ -
General obligation bonds:$1,500,000 issue dated May 17, 2001, payable in various annualprincipal installments, interest payable semi-annually at 4.79% onJanuary 15, and July 15, through January 2022 $ 615,000 $ 90,000
$1,000,000 issue dated October 1, 2002 due in various annualprincipal installments, interest payable semi-annually at rates varyingfrom 2.6% to 4.95% through January 15, 2023 445,000 55,000
$10,625,000 issued October 6, 2003 at a premium of $378,615, duein various annual principal installments, interest payable semi-annually at interest rates varying from 3.1% to 5.35% through July 15, 2028 7,460,000 415,000
$5,514,484 issued October 6, 2003 at a premium of $360,006 due invarious annual principal installments, interest payable semi-annuallyat interest rates varying from 3.1% to 5.35% through January 15,2024 2,310,726 279,665

COUNTY OF ROCKBRIDGE, VIRGINIA
Notes to Financial Statements (Continued) June 30, 2016
44
NOTE 7—LONG-TERM OBLIGATIONS: (CONTINUED)
Primary Government – Governmental Activities Obligations: (continued)
Details of Long-Term Details of Obligations: (continued)
AmountTotal Due Within
Amount One YearGeneral obligation bonds: (continued)
$3,590,000 issued May 12, 2005 at a premium of $213,677 due invarious annual principal installments, interest payable semi-annuallyat interest rates varying from 3.1% to 5.1% through July 15, 2025 $ 2,230,000 $ 175,000
$7,500,000 School tax credit bonds issued December 15, 2011 due invarious annual principal installments, interest payable semi-annuallyat an interest rate of 4.25% through June 30, 2031 5,925,000 395,000
$20,460,000 VPSA bonds issued November 15, 2012 at a premium of$540,453, due in various annual principal installments, interestpayable semi-annually at variable interest rates through November 15,2042 20,010,000 475,000Total general obligation bonds $ 38,995,726 $ 1,884,665
Literary loans:$1,435,000 issue dated May 9, 2013, payable in various annualprincipal and interest installments, interest rates varying from 3.05%-4% through January 15, 2021 $ 1,075,000 $ 180,000
Unamortized bond premium $ 3,457,468 $ 164,873
Net pension liability (payable from the General Fund) $ 3,292,026 $ -
Net OPEB obligation (payable from the General Fund) $ 166,000 $ -
Compensated absences (payable from the General Fund) $ 335,203 $ 83,801Total long-term obligations $ 64,066,423 $ 2,313,339

COUNTY OF ROCKBRIDGE, VIRGINIA
Notes to Financial Statements (Continued) June 30, 2016
45
NOTE 7—LONG-TERM OBLIGATIONS: (CONTINUED)
Primary Government – Business-type Activities Obligations:
Annual requirements to amortize long-term debt and related interest are as follows:
Landfill FundYear Ending
June 30, Principal Interest Principal Interest2017 $ 25,000 $ 272,475 $ 273,231 $ 21,9942018 515,000 277,803 269,027 14,0982019 535,000 254,172 172,279 7,6482020 560,000 228,638 141,831 3,6682021 590,000 200,019 60,222 4022022 625,000 168,959 - -2023 655,000 136,259 - -2024 120,000 116,425 - -2025 130,000 110,019 - -2026 135,000 103,378 - -2027 140,000 96,731 - -2028 150,000 90,000 - -2029 155,000 83,359 - -2030 160,000 76,338 - -2031 170,000 68,756 - -2032 180,000 60,537 - -2033 185,000 52,484 - -2034 140,000 45,957 - -2035 145,000 40,503 - -2036 150,000 34,868 - -2037 155,000 29,053 - -2038 160,000 23,056 - -2039 170,000 16,775 - -2040 175,000 10,209 - -2041 180,000 3,439 - -Total $ 6,305,000 $ 2,600,212 $ 916,590 $ 47,810
Revenue Bonds Capital Leases

COUNTY OF ROCKBRIDGE, VIRGINIA
Notes to Financial Statements (Continued) June 30, 2016
46
NOTE 7—LONG-TERM OBLIGATIONS: (CONTINUED)
Primary Government – Business-type Activities Obligations: (Continued)
Details of long-term obligations:
AmountTotal Due Within
Amount One Year
Revenue bonds:VRA 2012A Revenue Bond totaling $655,000. The obligation isdue in varying annual principal installments, and semi-annualinterest payments with interest from 3.625% to 5.125% beginningOctober 1, 2012 through April 1, 2033. $ 595,000 $ 25,000
VRA 2016A Revenue Bond totaling $5,710,000, issued at apremium of $856,329. The obligation is due in varying annualprincipal installments, and semi-annual interest payments withinterest from 3.792% to 5.125% beginning October 1, 2017 throughApril 1, 2041. 5,710,000 -
Total revenue bonds $ 6,305,000 $ 25,000Capital leases:
$309,436 Issued April 13, 2013 for a track loader, due in monthlypayments of $5,588 through April 15, 2018, interest at 4.550% $ 118,314 $ 64,172
$381,677 Issued August 15, 2013 for a compactor, due in monthlypayments of $6,899 November 15, 2018, interest at 2.89% 192,734 78,133$681,832 issued December 15, 2015 for a vehicle and anexcavator, due in monthly payments of $12,125 through November25, 2020, interest at 2.67%. 605,542 130,926 Total capital leases $ 916,590 $ 273,231
Unamortized bond premium $ 959,710 $ 40,334Landfill closure and post-closure liability $ 1,980,511 $ -Net pension liability $ 301,416 $ -Net OPEB obligation $ 3,000 $ -Compensated absences $ 36,716 $ 9,179Total long-term obligations $ 10,502,943 $ 347,744

COUNTY OF ROCKBRIDGE, VIRGINIA
Notes to Financial Statements (Continued) June 30, 2016
47
NOTE 7—LONG-TERM OBLIGATIONS: (CONTINUED)
Component Unit – Rockbridge County Public Service Authority:
Changes in long-term Obligations:
Balance Additions/ Decreases/ BalanceJuly 1, 2015 Issuances Retirements June 30, 2016
Water Fund:Revenue bonds $ 694,070 $ - $ 228,398 $ 465,672Rural development bond 1,893,238 - 39,414 1,853,824Net OPEB obligation 9,120 420 530 9,010 Compensated Absences 22,435 114 - 22,549
Total water fund $ 2,618,863 $ 534 $ 268,342 $ 2,351,055Sewer Fund:
Revenue bonds $ 7,936,343 $ - $ 690,116 $ 7,246,227Advances 2,247,509 297,302 - 2,544,811Net OPEB obligation 6,880 1,580 470 7,990 Compensated absences 19,895 101 - 19,996
Total sewer fund $ 10,210,627 $ 298,983 $ 690,586 $ 9,819,024Totals $ 12,829,490 $ 299,517 $ 958,928 $ 12,170,079
Annual requirements to amortize the long-term bonds payable and the related interest are as follows:
Year EndingJune 30, Principal Interest
2017 $ 876,005 $ 57,9682018 791,145 52,0622019 791,973 48,3242020 797,818 44,4192021 798,680 40,242
2022-2026 3,751,948 156,8062027-2031 600,733 128,9252032-2036 282,541 102,0592037-2041 312,230 72,0102042-2046 345,039 39,5612047-2049 217,611 6,570
Total $ 9,565,723 $ 748,946
Revenue Bonds
Operating contributions from Rockbridge County consisted of the following:
Principal and interest payments on the 2001 Water Revenue Refunding Bond $ 117,106Principal and interest payments on the Route 60 Project 69,339
Total $ 186,445

COUNTY OF ROCKBRIDGE, VIRGINIA
Notes to Financial Statements (Continued) June 30, 2016
48
NOTE 7—LONG-TERM OBLIGATIONS: (CONTINUED)
Component Unit – Rockbridge County Public Service Authority: (continued)
Details of long-term obligations: Amount
Total Due WithinAmount One Year
Water Fund:Revenue Bonds:
$1,266,223 Water Revenue Refunding Bond dated March 1, 2001,payable in semi-annual installments through October 1, 2016. Interestrate of 4.74%. Payments on this bond are anticipated to be made byRockbridge County. $ 57,762 $ 57,762$767,900 Water Revenue Obligation issued through the Buena VistaIndustrial Development Authority (Authority portion of $1,400,000 issue),dated August 1, 1996, payable semi-annually through July 14, 2016,average interest rate of approximately 6.3%. Payments on this bond areanticipated to be made by Rockbridge County. 32,910 32,910$940,000 Infrastructure Revenue Bonds (Series 2002A) issued throughthe Virginia Resources Authority, dated June 6, 2002, payable annuallythrough April 1, 2022, interest payable semi-annually at rates rangingfrom 3.1% to 5.35%. 375,000 55,000$2,081,000 Water System Revenue Bonds (Series 2012) issued throughthe United States Department of Agriculture, dated June 28, 2012,payable annually through June 28, 2052, stated interest rate of 2.0%. 1,853,824 40,216Total Bonds $ 2,319,496 $ 185,888
Compensated absences $ 22,549 $ 22,549Net OPEB obligation 9,010 -
Total Water Fund $ 2,351,055 $ 208,437Sewer Fund:Revenue Bonds:
$14,700,000 Sewer System Revenue Bonds, Series 2005 issued throughthe Virginia Revolving Loan Fund payable through December 31, 2027 inequal installments with no interest. Amount advanced and outstanding atyear-end. $ 7,246,227 $ 690,117
Advances:Loan from Rockbridge County, dated September 1, 2010. No agreedupon repayment terms. 2,544,811 -
Compensated absences 19,996 19,996Net OPEB obligation 7,990 -
Total Sewer Fund $ 9,819,024 $ 710,113Total long-term obligations $ 12,170,079 $ 918,550

COUNTY OF ROCKBRIDGE, VIRGINIA
Notes to Financial Statements (Continued) June 30, 2016
49
NOTE 7—LONG-TERM OBLIGATIONS: (CONTINUED)
Component Unit – Rockbridge County Regional Jail Commission:
Changes in long-term Obligations:
Balance Additions/ Decreases/ BalanceJuly 1, 2015 Issuances Retirements June 30, 2016
Net OPEB Obligation (payable from Rockbridge County Regional Jail Commission) $ 55,000 $ 11,000 $ 2,000 $ 64,000Net pension liability (payable from Rockbridge County Regional Jail Commission) 966,272 708,185 558,277 1,116,180Compensated Absences (payable from Rockbridge County Regional Jail Commission) 167,652 43,151 41,913 168,890Total Long-Term Obligations $ 1,188,924 $ 762,336 $ 602,190 $ 1,349,070
Details of long-term obligations:
AmountTotal Due Within
Amount One YearNet pension liability $ 1,116,180 $ - Net OPEB obligation $ 64,000 $ - Compensated absences $ 168,890 $ 42,223 Total obligations $ 1,349,070 $ 42,223
Component Unit – Rockbridge Area Social Services Board:
Changes in long-term Obligations:
Balance Additions/ Decreases/ BalanceJuly 1, 2015 Issuances Retirements June 30, 2016
Compensated Absences (payable from Rockbridge Area Social Services Board) $ 102,488 $ 76,866 $ 112,229 $ 67,125Total Long-Term Obligations $ 102,488 $ 76,866 $ 112,229 $ 67,125

COUNTY OF ROCKBRIDGE, VIRGINIA
Notes to Financial Statements (Continued) June 30, 2016
50
NOTE 7—LONG-TERM OBLIGATIONS: (CONTINUED)
Component Unit – Rockbridge Area Social Services Board: (continued)
Details of long-term obligations:
AmountTotal Due Within
Amount One Year
Compensated absences $ 67,125 $ 16,781
Total obligations $ 67,125 $ 16,781
Component Unit-School Board:
The following is a summary of long-term obligation transactions of the School Board Component Unit for the year ended June 30, 2016:
Balance Additions/ Deductions/ BalanceJuly 1, 2015 Issuances Retirements June 30, 2016
Net pension liability $ 25,550,313 $ 6,936,903 $ 5,730,051 $ 26,757,165Net OPEB obligation 1,385,000 373,000 165,000 1,593,000Compensated absences 102,224 128,944 61,335 169,833Total $ 27,037,537 $ 7,438,847 $ 5,956,386 $ 28,519,998
Details of long-term obligations:
AmountTotal Due Within
Amount One YearNet pension liability (payable from the School Fund) $ 26,757,165 $ -Net OPEB obligation 1,593,000 -Compensated absences (payable from the School Fund) 169,833 42,458
Total long-term obligations $ 28,519,998 $ 42,458

COUNTY OF ROCKBRIDGE, VIRGINIA
Notes to Financial Statements (Continued) June 30, 2016
51
NOTE 8—PENSION PLAN:
Plan Description
All full-time, salaried permanent employees of the County and (nonprofessional) employees of public school divisions are automatically covered by VRS Retirement Plan upon employment. This is an agent multiple-employer plan administered by the Virginia Retirement System (the System) along with plans for other employer groups in the Commonwealth of Virginia. Members earn one month of service credit for each month they are employed and for which they and their employer pay contributions to VRS. Members are eligible to purchase prior service, based on specific criteria as defined in the Code of Virginia, as amended. Eligible prior service that may be purchased includes prior public service, active military service, certain periods of leave, and previously refunded service.
The System administers three different benefit structures for covered employees – Plan 1, Plan 2, and, Hybrid. Each of these benefit structures has different eligibility criteria. The specific information for each plan and the eligibility for covered groups within each plan are set out in the table below:
RETIREMENT PLAN PROVISIONS PLAN 1 PLAN 2 HYBRID RETIREMENT PLAN
About Plan 1Plan 1 is a defined benefit plan. The retirement benefit is based on a member’s age, creditable service and average final compensation at retirement using a formula. Employees are eligible for Plan 1 if their membership date is before July 1, 2010, and they were vested as of January 1, 2013.
About Plan 2Plan 2 is a defined benefit plan. The retirement benefit is based on a member’s age, creditable service and average final compensation at retirement using a formula. Employees are eligible for Plan 2 if their membership date is on or after July 1, 2010, or their membership date is before July 1, 2010, and they were not vested as of January 1, 2013.
About the Hybrid Retirement Plan The Hybrid Retirement Plan combines the features of a defined benefit plan and a defined contribution plan. Most members hired on or after January 1, 2014 are in this plan, as well as Plan 1 and Plan 2 members who were eligible and opted into the plan during a special election window. (see “Eligible Members”)
• The defined benefit is based on a member’s age, creditable service and average final compensation at retirement using a formula.
• The benefit from the defined contribution component of the plan depends on the member and employer contributions made to the plan and the investment performance of those contributions.

COUNTY OF ROCKBRIDGE, VIRGINIA
Notes to Financial Statements (Continued) June 30, 2016
52
NOTE 8—PENSION PLAN: (Continued)
Plan Description (Continued)
RETIREMENT PLAN PROVISIONS (CONTINUED)PLAN 1 PLAN 2 HYBRID RETIREMENT PLAN
About Plan 1 (Cont.) About Plan 2 (Cont.) About the Hybrid Retirement Plan (Cont.)
• In addition to the monthly benefit payment payable from the defined benefit plan at retirement, a member may start receiving distributions from the balance in the defined contribution account, reflecting the contributions, investment gains or losses, and any required fees.
Eligible MembersEmployees are in Plan 1 if their membership date is before July 1, 2010, and they were vested as of January 1, 2013.
Hybrid Opt-In Election VRS non-hazardous duty covered Plan 1 members were allowed to make an irrevocable decision to opt into the Hybrid Retirement Plan during a special election window held January 1 through April 30, 2014.
The Hybrid Retirement Plan’s effective date for eligible Plan 1 members who opted in was July 1, 2014.
If eligible deferred members returned to work during the election window, they were also eligible to opt into the Hybrid Retirement Plan.
Eligible MembersEmployees are in Plan 2 if their membership date is on or after July 1, 2010, or their membership date is before July 1, 2010, and they were not vested as of January 1, 2013.
Hybrid Opt-In Election Eligible Plan 2 members were allowed to make an irrevocable decision to opt into the Hybrid Retirement Plan during a special election window held January 1 through April 30, 2014.
The Hybrid Retirement Plan’s effective date for eligible Plan 2 members who opted in was July 1, 2014.
If eligible deferred members returned to work during the election window, they were also eligible to opt into the Hybrid Retirement Plan.
Eligible MembersEmployees are in the Hybrid Retirement Plan if their membership date is on or after January 1, 2014. This includes:
• Political subdivision employees*
• School division employees • Members in Plan 1 or Plan
2 who elected to opt into the plan during the election window held January 1-April 30, 2014; the plan’s effective date for opt-in members was July 1, 2014.
*Non-Eligible MembersSome employees are not eligible to participate in the Hybrid Retirement Plan. They include:
• Political subdivision employees who are covered by enhanced benefits for hazardous duty employees.

COUNTY OF ROCKBRIDGE, VIRGINIA
Notes to Financial Statements (Continued) June 30, 2016
53
NOTE 8—PENSION PLAN: (Continued)
Plan Description (Continued)
RETIREMENT PLAN PROVISIONS (CONTINUED) PLAN 1 PLAN 2 HYBRID RETIREMENT PLAN
Hybrid Opt-In Election (Cont.) Members who were eligible for an optional retirement plan (ORP) and had prior service under Plan 1 were not eligible to elect the Hybrid Retirement Plan and remain as Plan 1 or ORP.
Hybrid Opt-In Election (Cont.) Members who were eligible for an optional retirement plan (ORP) and have prior service under Plan 2 were not eligible to elect the Hybrid Retirement Plan and remain as Plan 2 or ORP.
*Non-Eligible Members (Cont.)Those employees eligible for an optional retirement plan (ORP) must elect the ORP plan or the Hybrid Retirement Plan. If these members have prior service under Plan 1 or Plan 2, they are not eligible to elect the Hybrid Retirement Plan and must select Plan 1 or Plan 2 (as applicable) or ORP.
Retirement ContributionsEmployees contribute 5% of their compensation each month to their member contribution account through a pre-tax salary reduction. Some political subdivisions and school divisions elected to phase in the required 5% member contribution but all employees will be paying the full 5% by July 1, 2016. However, the Board of Supervisors of the County opted to make the transition in a single fiscal year rather than phasing in the requirement. Member contributions are tax-deferred until they are withdrawn as part of a retirement benefit or as a refund. The employer makes a separate actuarially determined contribution to VRS for all covered employees. VRS invests both member and employer contributions to provide funding for the future benefit payment.
Retirement Contributions Employees contribute 5% of their compensation each month to their member contribution account through a pre-tax salary reduction. Some political subdivisions and school divisions elected to phase in the required 5% member contribution but all employees will be paying the full 5% by July 1, 2016. However, the Board of Supervisors of the County opted to make the transition in a single fiscal year rather than phasing in the requirement.
Retirement Contributions A member’s retirement benefit is funded through mandatory and voluntary contributions made by the member and the employer to both the defined benefit and the defined contribution components of the plan. Mandatory contributions are based on a percentage of the employee’s creditable compensation and are required from both the member and the employer. Additionally, members may choose to make voluntary contributions to the defined contribution component of the plan, and the employer is required to match those voluntary contributions according to specified percentages.

COUNTY OF ROCKBRIDGE, VIRGINIA
Notes to Financial Statements (Continued) June 30, 2016
54
NOTE 8—PENSION PLAN: (Continued)
Plan Description (Continued)
RETIREMENT PLAN PROVISIONS (CONTINUED) PLAN 1 PLAN 2 HYBRID RETIREMENT PLAN
Creditable Service Creditable service includes active service. Members earn creditable service for each month they are employed in a covered position. It also may include credit for prior service the member has purchased or additional creditable service the member was granted. A member’s total creditable service is one of the factors used to determine their eligibility for retirement and to calculate their retirement benefit. It also may count toward eligibility for the health insurance credit in retirement, if the employer offers the health insurance credit.
Creditable Service Same as Plan 1.
Creditable Service Defined Benefit Component: Under the defined benefit component of the plan, creditable service includes active service. Members earn creditable service for each month they are employed in a covered position. It also may include credit for prior service the member has purchased or additional creditable service the member was granted. A member’s total creditable service is one of the factors used to determine their eligibility for retirement and to calculate their retirement benefit. It also may count toward eligibility for the health insurance credit in retirement, if the employer offers the health insurance credit.
Defined Contributions Component:Under the defined contribution component, creditable service is used to determine vesting for the employer contribution portion of the plan.

COUNTY OF ROCKBRIDGE, VIRGINIA
Notes to Financial Statements (Continued) June 30, 2016
55
NOTE 8—PENSION PLAN: (Continued)
Plan Description (Continued)
RETIREMENT PLAN PROVISIONS (CONTINUED) PLAN 1 PLAN 2 HYBRID RETIREMENT PLAN
VestingVesting is the minimum length of service a member needs to qualify for a future retirement benefit. Members become vested when they have at least five years (60 months) of creditable service. Vesting means members are eligible to qualify for retirement if they meet the age and service requirements for their plan. Members also must be vested to receive a full refund of their member contribution account balance if they leave employment and request a refund.
Members are always 100% vested in the contributions that they make.
VestingSame as Plan 1.
VestingDefined Benefit Component: Defined benefit vesting is the minimum length of service a member needs to qualify for a future retirement benefit.Members are vested under the defined benefit component of the Hybrid Retirement Plan when they reach five years (60 months) of creditable service.Plan 1 or Plan 2 members with at least five years (60 months) of creditable service who opted into the Hybrid Retirement Plan remain vested in the defined benefit component.
Defined Contributions Component:Defined contribution vesting refers to the minimum length of service a member needs to be eligible to withdraw the employer contributions from the defined contribution component of the plan.
Members are always 100% vested in the contributions that they make.

COUNTY OF ROCKBRIDGE, VIRGINIA
Notes to Financial Statements (Continued) June 30, 2016
56
NOTE 8—PENSION PLAN: (Continued)
Plan Description (Continued)
RETIREMENT PLAN PROVISIONS (CONTINUED)PLAN 1 PLAN 2 HYBRID RETIREMENT PLAN
Vesting (Cont.) Vesting (Cont.) Vesting (Cont.) Defined Contributions Component: (Cont.)Upon retirement or leaving covered employment, a member is eligible to withdraw a percentage of employer contributions to the defined contribution component of the plan, based on service.
• After two years, a member is 50% vested and may withdraw 50% of employer contributions.
• After three years, a member is 75% vested and may withdraw 75% of employer contributions.
• After four or more years, a member is 100% vested and may withdraw 100% of employer contributions.
Distribution is not required by law until age 70½.
Calculating the Benefit The Basic Benefit is calculated based on a formula using the member’s average final compensation, a retirement multiplier and total service credit at retirement. It is one of the benefit payout options available to a member at retirement.
Calculating the Benefit See definition under Plan 1.
Calculating the Benefit Defined Benefit Component: See definition under Plan 1

COUNTY OF ROCKBRIDGE, VIRGINIA
Notes to Financial Statements (Continued) June 30, 2016
57
NOTE 8—PENSION PLAN: (Continued)
Plan Description (Continued)
RETIREMENT PLAN PROVISIONS (CONTINUED) PLAN 1 PLAN 2 HYBRID RETIREMENT PLAN
Calculating the Benefit (Cont.)An early retirement reduction factor is applied to the Basic Benefit if the member retires with a reduced retirement benefit or selects a benefit payout option other than the Basic Benefit.
Calculating the Benefit (Cont.) Calculating the Benefit (Cont.)Defined Contribution Component:The benefit is based on contributions made by the member and any matching contributions made by the employer, plus net investment earnings on those contributions.
Average Final Compensation A member’s average final compensation is the average of the 36 consecutive months of highest compensation as a covered employee.
Average Final Compensation A member’s average final compensation is the average of their 60 consecutive months of highest compensation as a covered employee.
Average Final Compensation Same as Plan 2. It is used in the retirement formula for the defined benefit component of the plan.
Service Retirement Multiplier VRS: The retirement multiplier is a factor used in the formula to determine a final retirement benefit. The retirement multiplier for non-hazardous duty members is 1.70%.
Sheriffs and regional jail superintendents: Theretirement multiplier for sheriffs and regional jail superintendents is 1.85%.
Political subdivision hazardous duty employees: The retirement multiplier of eligible political subdivision hazardous duty employees other than sheriffs and regional jail superintendents is 1.70% or 1.85% as elected by the employer.
Service Retirement Multiplier VRS: Same as Plan 1 for service earned, purchased or granted prior to January 1, 2013. For non-hazardous duty members the retirement multiplier is 1.65% for creditable service earned, purchased or granted on or after January 1, 2013.
Sheriffs and regional jail superintendents: Same as Plan 1.
Political subdivision hazardous duty employees: Same as Plan 1.
Service Retirement Multiplier Defined Benefit Component: VRS: The retirement multiplier for the defined benefit component is 1.00%.
For members who opted into the Hybrid Retirement Plan from Plan 1 or Plan 2, the applicable multipliers for those plans will be used to calculate the retirement benefit for service credited in those plans.
Sheriffs and regional jail superintendents: Notapplicable.
Political subdivision hazardous duty employees: Not applicable.
Defined Contribution Component:Not applicable.

COUNTY OF ROCKBRIDGE, VIRGINIA
Notes to Financial Statements (Continued) June 30, 2016
58
NOTE 8—PENSION PLAN: (Continued)
Plan Description (Continued)
RETIREMENT PLAN PROVISIONS (CONTINUED) PLAN 1 PLAN 2 HYBRID RETIREMENT PLAN
Normal Retirement Age VRS: Age 65.
Political subdivisions hazardous duty employees: Age 60.
Normal Retirement Age VRS: Normal Social Security retirement age.
Political subdivisions hazardous duty employees: Same as Plan 1.
Normal Retirement Age Defined Benefit Component: VRS: Same as Plan 2.
Political subdivisions hazardous duty employees: Not applicable.
Defined Contribution Component:Members are eligible to receive distributions upon leaving employment, subject to restrictions.
Earliest Unreduced Retirement Eligibility VRS: Age 65 with at least five years (60 months) of creditable service or at age 50 with at least 30 years of creditable service.
Political subdivisions hazardous duty employees: Age 60 with at least five years of creditable service or age 50 with at least 25 years of creditable service.
Earliest Unreduced Retirement Eligibility VRS: Normal Social Security retirement age with at least five years (60 months) of creditable service or when their age and service equal 90.
Political subdivisions hazardous duty employees: Same as Plan 1.
Earliest Unreduced Retirement Eligibility Defined Benefit Component: VRS: Normal Social Security retirement age and have at least five years (60 months) of creditable service or when their age and service equal 90.
Political subdivisions hazardous duty employees: Not applicable.
Defined Contribution Component:Members are eligible to receive distributions upon leaving employment, subject to restrictions.
Earliest Reduced Retirement EligibilityVRS: Age 55 with at least five years (60 months) of creditable service or age 50 with at least 10 years of creditable service.
Earliest Reduced Retirement Eligibility VRS: Age 60 with at least five years (60 months) of creditable service.
Earliest Reduced Retirement Eligibility Defined Benefit Component: VRS: Members may retire with a reduced benefit as early as age 60 with at least five years (60 months) of creditable service.

COUNTY OF ROCKBRIDGE, VIRGINIA
Notes to Financial Statements (Continued) June 30, 2016
59
NOTE 8—PENSION PLAN: (Continued)
Plan Description (Continued)
RETIREMENT PLAN PROVISIONS (CONTINUED)PLAN 1 PLAN 2 HYBRID RETIREMENT PLAN
Earliest Reduced Retirement Eligibility (Cont.)
Political subdivisions hazardous duty employees: 50with at least five years of creditable service.
Earliest Reduced Retirement Eligibility (Cont.)
Political subdivisions hazardous duty employees: Same as Plan 1.
Earliest Reduced Retirement Eligibility (Cont.)
Political subdivisions hazardous duty employees: Not applicable.
Defined Contribution Component:Members are eligible to receive distributions upon leaving employment, subject to restrictions.
Cost-of-Living Adjustment (COLA) in Retirement The Cost-of-Living Adjustment (COLA) matches the first 3% increase in the Consumer Price Index for all Urban Consumers (CPI-U) and half of any additional increase (up to 4%) up to a maximum COLA of 5%.
Eligibility: For members who retire with an unreduced benefit or with a reduced benefit with at least 20 years of creditable service, the COLA will go into effect on July 1 after one full calendar year from the retirement date.
For members who retire with a reduced benefit and who have less than 20 years of creditable service, the COLA will go into effect on July 1 after one calendar year following the unreduced retirement eligibility date.
Cost-of-Living Adjustment (COLA) in Retirement The Cost-of-Living Adjustment (COLA) matches the first 2% increase in the CPI-U and half of any additional increase (up to 2%), for a maximum COLA of 3%.
Eligibility: Same as Plan 1.
Cost-of-Living Adjustment (COLA) in Retirement Defined Benefit Component: Same as Plan 2.
Defined Contribution Component:Not applicable.
Eligibility: Same as Plan 1 and Plan 2.

COUNTY OF ROCKBRIDGE, VIRGINIA
Notes to Financial Statements (Continued) June 30, 2016
60
NOTE 8—PENSION PLAN: (Continued)
Plan Description (Continued)
RETIREMENT PLAN PROVISIONS (CONTINUED)PLAN 1 PLAN 2 HYBRID RETIREMENT PLAN
Cost-of-Living Adjustment (COLA) in Retirement (Cont.)
Exceptions to COLA Effective Dates:The COLA is effective July 1 following one full calendar year (January 1 to December 31) under any of the following circumstances:
• The member is within five years of qualifying for an unreduced retirement benefit as of January 1, 2013.
• The member retires on disability.
• The member retires directly from short-term or long-term disability under the Virginia Sickness and Disability Program (VSDP).
• The member is involuntarily separated from employment for causes other than job performance or misconduct and is eligible to retire under the Workforce Transition Act or the Transitional Benefits Program.
• The member dies in service and the member’s survivor or beneficiary is eligible for a monthly death-in-service benefit. The COLA will go into effect on July 1 following one full calendar year (January 1 to December 31) from the date the monthly benefit begins.
Cost-of-Living Adjustment (COLA) in Retirement (Cont.)
Exceptions to COLA Effective Dates:Same as Plan 1.
Cost-of-Living Adjustment (COLA) in Retirement (Cont.)
Exceptions to COLA Effective Dates:Same as Plan 1 and Plan 2.

COUNTY OF ROCKBRIDGE, VIRGINIA
Notes to Financial Statements (Continued) June 30, 2016
61
NOTE 8—PENSION PLAN: (Continued)
Plan Description (Continued)
RETIREMENT PLAN PROVISIONS (CONTINUED) PLAN 1 PLAN 2 HYBRID RETIREMENT PLAN
Disability Coverage Members who are eligible to be considered for disability retirement and retire on disability, the retirement multiplier is 1.7% on all service, regardless of when it was earned, purchased or granted.
VSDP members are subject to a one-year waiting period before becoming eligible for non-work-related disability benefits.
Disability Coverage Members who are eligible to be considered for disability retirement and retire on disability, the retirement multiplier is 1.65% on all service, regardless of when it was earned, purchased or granted.
VSDP members are subject to a one-year waiting period before becoming eligible for non-work related disability benefits.
Disability Coverage Employees of political subdivisions and School divisions (including Plan 1 and Plan 2 opt-ins) participate in the Virginia Local Disability Program (VLDP) unless their local governing body provides an employer-paid comparable program for its members.
Hybrid members (including Plan 1 and Plan 2 opt-ins) covered under VLDP are subject to a one-year waiting period before becoming eligible for non-work-related disability benefits.
Purchase of Prior Service Members may be eligible to purchase service from previous public employment, active duty military service, an eligible period of leave or VRS refunded service as creditable service in their plan. Prior creditable service counts toward vesting, eligibility for retirement and the health insurance credit. Only active members are eligible to purchase prior service. When buying service, members must purchase their most recent period of service first. Members also may be eligible to purchase periods of leave without pay.
Purchase of Prior Service Same as Plan 1.
Purchase of Prior Service Defined Benefit Component: Same as Plan 1, with the following exceptions:
Hybrid Retirement Plan members are ineligible for ported service.
The cost for purchasing refunded service is the higher of 4% of creditable compensation or average final compensation.
Plan members have one year from their date of hire or return from leave to purchase all but refunded prior service at approximate normal cost. After that one-year period, the rate for most categories of service will change to actuarial cost.
Defined Contribution Component:Not applicable.

COUNTY OF ROCKBRIDGE, VIRGINIA
Notes to Financial Statements (Continued) June 30, 2016
62
NOTE 8—PENSION PLAN: (Continued)
Plan Description (Continued)
The System issues a publicly available comprehensive annual financial report (CAFR) that includes financial statements and required supplementary information for the plans administered by VRS. A copy of the most recent report may be obtained from the VRS website at http://www.varetire.org/Pdf/Publications/2015-annual-report.pdf or by writing to the System’s Chief Financial Officer at P.O. Box 2500, Richmond, VA, 23218-2500.
Employees Covered by Benefit Terms
As of the June 30, 2014 actuarial valuation, the following employees were covered by the benefit terms of the pension plan:
Component UnitPrimary School Board
Government (1) NonprofessionalInactive members or their beneficiaries currently
receiving benefits 83 99Inactive members:
Vested inactive members 18 15
Non-vested inactive members 22 37
Inactive members active elsewhere in VRS 44 20Total inactive members 84 72
Active members 145 90Total covered employees 312 261
(1) Includes Component Unit Rockbridge Regional Jail Commission
Contributions
The contribution requirement for active employees is governed by §51.1-145 of the Code of Virginia, as amended, but may be impacted as a result of funding options provided to political subdivisions by the Virginia General Assembly. Employees are required to contribute 5.00% of their compensation toward their retirement. Prior to July 1, 2012, all or part of the 5.00% member contribution may have been assumed by the employer. Beginning July 1, 2012, new employees were required to pay the 5% member contribution. In addition, for existing employees, employers were required to begin making the employee pay the 5.00% member contribution. This could be phased in over a period of up to 5 years and the employer is required to provide a salary increase equal to the amount of the increase in the employee-paid member contribution.The Board of Supervisors opted to make the transition in a single fiscal year rather than phasing in the requirement.The Primary Government’s contractually required contribution rate for the year ended June 30, 2016 was 14.03% of covered employee compensation. This rate was based on an actuarially determined rate from an actuarial valuation as of June 30, 2013. This rate, when combined with employee contributions, was expected to finance the costs of benefits earned by employees during the year, with an additional amount to finance any unfunded accrued liability. Contributions to the pension plan from the County were $670,679 and $646,121 for the years ended June 30, 2016 and June 30, 2015, respectively.The Component Unit Rockbridge Regional Jail Commission’s contractually required contribution rate for the year ended June 30, 2016 was 14.03% of covered employee compensation. This rate was based on an actuarially determined rate from an actuarial valuation as of June 30, 2013.

COUNTY OF ROCKBRIDGE, VIRGINIA
Notes to Financial Statements (Continued) June 30, 2016
63
NOTE 8—PENSION PLAN: (Continued)
Contributions (continued)
This rate, when combined with employee contributions, was expected to finance the costs of benefits earned by employees during the year, with an additional amount to finance any unfunded accrued liability. Contributions to the pension plan from the Component Unit Rockbridge Regional Jail Commission were $208,323 and $200,696 for the years ended June 30, 2016 and June 30, 2015, respectively.
The Component Unit School Board’s contractually required contribution rate for nonprofessional employees for the year ended June 30, 2016 was 8.51% of covered employee compensation. This rate was based on an actuarially determined rate from an actuarial valuation as of June 30, 2013.
This rate, when combined with employee contributions, was expected to finance the costs of benefits earned by employees during the year, with an additional amount to finance any unfunded accrued liability. Contributions to the pension plan from the Component Unit School Board’s nonprofessional employees were $123,093 and $131,850 for the years ended June 30, 2016 and June 30, 2015, respectively.
Net Pension Liability
The Primary Government’s, Component Unit Rockbridge Regional Jail Commission’s and Component Unit School Board’s (nonprofessional) net pension liabilities were measured as of June 30, 2015. The total pension liabilities used to calculate the net pension liabilities were determined by an actuarial valuation performed as of June 30, 2014, using updated actuarial assumptions, applied to all periods included in the measurement and rolled forward to the measurement date of June 30, 2015.
Actuarial Assumptions – General Employees
The total pension liability for General Employees in the Primary Government’s, Component Unit Rockbridge Regional Jail Commission’s, and Component Unit School Board’s (nonprofessional) Retirement Plan was based on an actuarial valuation as of June 30, 2014, using the Entry Age Normal actuarial cost method and the following assumptions, applied to all periods included in the measurement and rolled forward to the measurement date of June 30, 2015.
Inflation 2.5%
Salary increases, including inflation 3.5% – 5.35%
Investment rate of return 7.0%, net of pension plan investmentexpense, including inflation*
* Administrative expenses as a percent of the market value of assets for the last experience study were found to be approximately 0.06% of the market assets for all of the VRS plans. This would provide an assumed investment return rate for GASB purposes of slightly more than the assumed 7.0%. However, since the difference was minimal, and a more conservative 7.0% investment return assumption provided a projected plan net position that exceeded the projected benefit payments, the long-term expected rate of return on investments was assumed to be 7.0% to simplify preparation of pension liabilities.

COUNTY OF ROCKBRIDGE, VIRGINIA
Notes to Financial Statements (Continued) June 30, 2016
64
NOTE 8—PENSION PLAN: (Continued)
Actuarial Assumptions – General Employees (continued)
Mortality rates: 14% of deaths are assumed to be service related
Largest 10 – Non-LEOS:Pre-Retirement:
RP-2000 Employee Mortality Table Projected with Scale AA to 2020 with males set forward 4 years and females set back 2 years
Post-Retirement:RP-2000 Combined Mortality Table Projected with Scale AA to 2020 with males set forward 1 year
Post-Disablement:RP-2000 Disability Life Mortality Table Projected to 2020 with males set back 3 years and no provision for future mortality improvement.
All Others (Non 10 Largest) – Non-LEOS:Pre-Retirement:RP-2000 Employee Mortality Table Projected with Scale AA to 2020 with males set forward 4 years and females set back 2 years
Post-Retirement:RP-2000 Combined Mortality Table Projected with Scale AA to 2020 with males set forward 1 year
Post-Disablement:RP-2000 Disability Life Mortality Table Projected to 2020 with males set back 3 years and no provision for future mortality improvement
The actuarial assumptions used in the June 30, 2014 valuation were based on the results of an actuarial experience study for the period from July 1, 2008 through June 30, 2012. Changes to the actuarial assumptions as a result of the experience study are as follows:
Largest 10 – Non-LEOS:- Update mortality table - Decrease in rates of service retirement
- Decrease in rates of disability retirement - Reduce rates of salary increase by 0.25% per year
All Others (Non 10 Largest) – Non-LEOS: - Update mortality table - Decrease in rates of service retirement - Decrease in rates of disability retirement - Reduce rates of salary increase by 0.25% per year
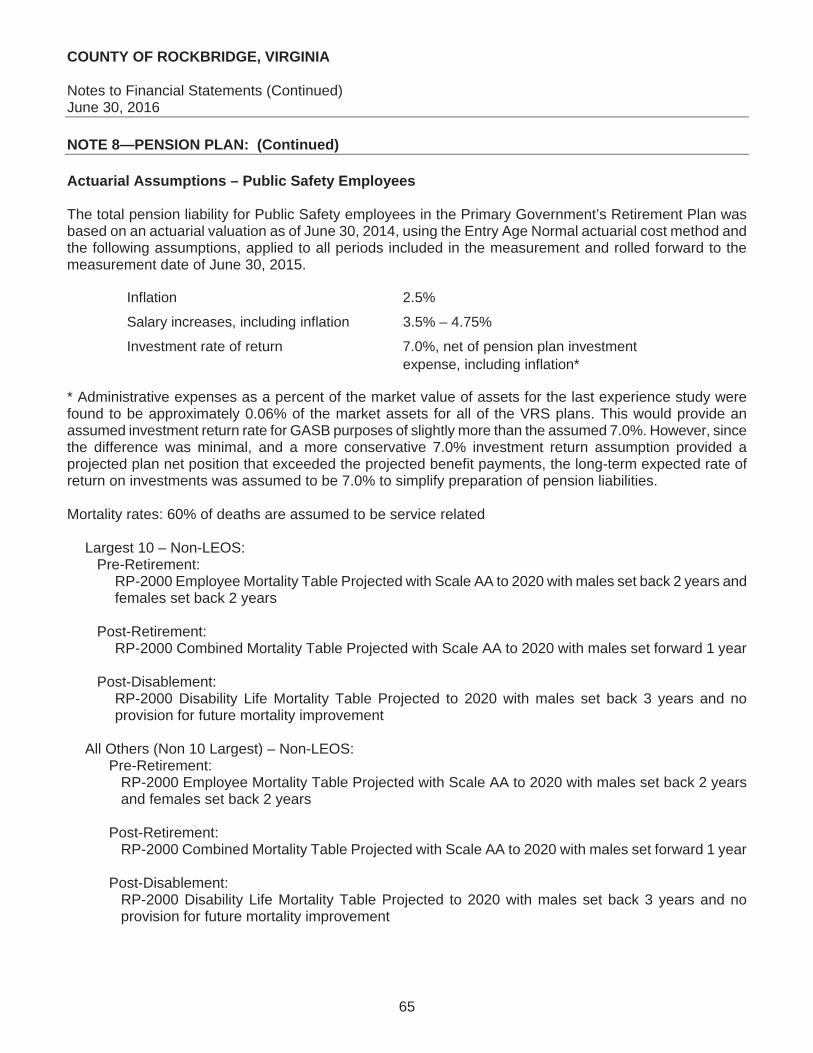
COUNTY OF ROCKBRIDGE, VIRGINIA
Notes to Financial Statements (Continued) June 30, 2016
65
NOTE 8—PENSION PLAN: (Continued)
Actuarial Assumptions – Public Safety Employees
The total pension liability for Public Safety employees in the Primary Government’s Retirement Plan was based on an actuarial valuation as of June 30, 2014, using the Entry Age Normal actuarial cost method and the following assumptions, applied to all periods included in the measurement and rolled forward to the measurement date of June 30, 2015.
Inflation 2.5%
Salary increases, including inflation 3.5% – 4.75%
Investment rate of return 7.0%, net of pension plan investmentexpense, including inflation*
* Administrative expenses as a percent of the market value of assets for the last experience study were found to be approximately 0.06% of the market assets for all of the VRS plans. This would provide an assumed investment return rate for GASB purposes of slightly more than the assumed 7.0%. However, since the difference was minimal, and a more conservative 7.0% investment return assumption provided a projected plan net position that exceeded the projected benefit payments, the long-term expected rate of return on investments was assumed to be 7.0% to simplify preparation of pension liabilities.
Mortality rates: 60% of deaths are assumed to be service related
Largest 10 – Non-LEOS:Pre-Retirement:
RP-2000 Employee Mortality Table Projected with Scale AA to 2020 with males set back 2 years and females set back 2 years
Post-Retirement:RP-2000 Combined Mortality Table Projected with Scale AA to 2020 with males set forward 1 year
Post-Disablement:RP-2000 Disability Life Mortality Table Projected to 2020 with males set back 3 years and no provision for future mortality improvement
All Others (Non 10 Largest) – Non-LEOS:Pre-Retirement:
RP-2000 Employee Mortality Table Projected with Scale AA to 2020 with males set back 2 years and females set back 2 years
Post-Retirement:RP-2000 Combined Mortality Table Projected with Scale AA to 2020 with males set forward 1 year
Post-Disablement:RP-2000 Disability Life Mortality Table Projected to 2020 with males set back 3 years and no provision for future mortality improvement

COUNTY OF ROCKBRIDGE, VIRGINIA
Notes to Financial Statements (Continued) June 30, 2016
66
NOTE 8—PENSION PLAN: (Continued)
Actuarial Assumptions – Public Safety Employees (continued)
The actuarial assumptions used in the June 30, 2014 valuation were based on the results of an actuarial experience study for the period from July 1, 2008 through June 30, 2012. Changes to the actuarial assumptions as a result of the experience study are as follows:
Largest 10 – LEOS:- Update mortality table - Decrease in male rates of disability
All Others (Non 10 Largest) – LEOS: - Update mortality table - Adjustments to rates of service retirement for females - Increase in rates of withdrawal - Decrease in male and female rates of disability
Long-Term Expected Rate of Return
The long-term expected rate of return on pension System investments was determined using a log-normal distribution analysis in which best-estimate ranges of expected future real rates of return (expected returns, net of pension System investment expense and inflation) are developed for each major asset class. These ranges are combined to produce the long-term expected rate of return by weighting the expected future real rates of return by the target asset allocation percentage and by adding expected inflation. The target asset allocation and best estimate of arithmetic real rates of return for each major asset class are summarized in the following table:
WeightedArithmetic AverageLong-Term Long-Term
Target Expected ExpectedAsset Class (Strategy) Allocation Rate of Return Rate of Return
U.S. Equity 19.50% 6.46% 1.26%Developed Non U.S. Equity 16.50% 6.28% 1.04%Emerging Market Equity 6.00% 10.00% 0.60%Fixed Income 15.00% 0.09% 0.01%Emerging Debt 3.00% 3.51% 0.11%Rate Sensitive Credit 4.50% 3.51% 0.16%Non Rate Sensitive Credit 4.50% 5.00% 0.23%Convertibles 3.00% 4.81% 0.14%Public Real Estate 2.25% 6.12% 0.14%Private Real Estate 12.75% 7.10% 0.91%Private Equity 12.00% 10.41% 1.25%Cash 1.00% -1.50% -0.02%
Total 100.00% 5.83%
Inflation 2.50%*Expected arithmetic nominal return 8.33%

COUNTY OF ROCKBRIDGE, VIRGINIA
Notes to Financial Statements (Continued) June 30, 2016
67
NOTE 8—PENSION PLAN: (Continued)
Long-Term Expected Rate of Return (continued)
* Using stochastic projection results provides an expected range of real rates of return over various time horizons. Looking at one year results produces an expected real return of 8.33% but also has a high standard deviation, which means there is high volatility. Over larger time horizons the volatility declines significantly and provides a median return of 7.44%, including expected inflation of 2.50%.
Discount Rate
The discount rate used to measure the total pension liability was 7.00%. The projection of cash flows used to determine the discount rate assumed that System member contributions will be made per the VRS Statutes and the employer contributions will be made in accordance with the VRS funding policy at rates equal to the difference between actuarially determined contribution rates adopted by the VRS Board of Trustees and the member rate. Through the fiscal year ending June 30, 2018, the rate contributed by the employer for the County and Component Unit School Board (nonprofessional) Retirement Plans will be subject to the portion of the VRS Board-certified rates that are funded by the Virginia General Assembly. From July 1, 2018 on, participating employers are assumed to contribute 100% of the actuarially determined contribution rates. Based on those assumptions, the pension plan’s fiduciary net position was projected to be available to make all projected future benefit payments of current active and inactive employees. Therefore the long-term expected rate of return was applied to all periods of projected benefit payments to determine the total pension liability.
Changes in Net Pension Liability
Total Plan NetPension Fiduciary PensionLiability Net Position Liability
(a) (b) (a) - (b)
Balances at June 30, 2014 $ 23,253,394 $ 20,142,569 $ 3,110,825
Changes for the year:Service cost $ 621,092 $ - $ 621,092 Interest 1,589,147 - 1,589,147 Differences between expected
and actual experience 56,853 - 56,853 Contributions - employer - 646,121 (646,121) Contributions - employee - 229,869 (229,869) Net investment income - 921,330 (921,330) Benefit payments, including refunds
of employee contributions (1,102,599) (1,102,599) - Administrative expenses - (12,651) 12,651 Other changes - (194) 194
Net changes $ 1,164,493 $ 681,876 $ 482,617
Balances at June 30, 2015 $ 24,417,887 $ 20,824,445 $ 3,593,442
Increase (Decrease)Primary Government

COUNTY OF ROCKBRIDGE, VIRGINIA
Notes to Financial Statements (Continued) June 30, 2016
68
NOTE 8—PENSION PLAN: (Continued)
Changes in Net Pension Liability (Continued)
Total Plan NetPension Fiduciary PensionLiability Net Position Liability
(a) (b) (a) - (b)
Balances at June 30, 2014 $ 7,222,876 $ 6,256,604 $ 966,272
Changes for the year:Service cost $ 192,921 $ - $ 192,921 Interest 493,614 - 493,614 Differences between expected
and actual experience 17,662 - 17,662 Contributions - employer - 200,696 (200,696) Contributions - employee - 71,401 (71,401) Net investment income - 286,180 (286,180) Benefit payments, including refunds
of employee contributions (342,487) (342,487) - Administrative expenses - (3,929) 3,929 Other changes - (59) 59
Net changes $ 361,710 $ 211,802 $ 149,908
Balances at June 30, 2015 $ 7,584,586 $ 6,468,406 $ 1,116,180
Component Unit Rockbridge Regional Jail CommissionIncrease (Decrease)
Total Plan NetPension Fiduciary PensionLiability Net Position Liability
(a) (b) (a) - (b)
Balances at June 30, 2014 $ 7,357,164 $ 7,116,851 $ 240,313
Changes for the year:Service cost $ 152,653 $ - $ 152,653 Interest 497,766 - 497,766 Differences between expected
and actual experience 8,852 - 8,852 Contributions - employer - 131,850 (131,850) Contributions - employee - 76,599 (76,599) Net investment income - 317,602 (317,602) Benefit payments, including refunds
of employee contributions (492,430) (492,430) - Administrative expenses - (4,567) 4,567 Other changes - (65) 65
Net changes $ 166,841 $ 28,989 $ 137,852
Balances at June 30, 2015 $ 7,524,005 $ 7,145,840 $ 378,165
Increase (Decrease)Component Unit School Board (nonprofessional)

COUNTY OF ROCKBRIDGE, VIRGINIA
Notes to Financial Statements (Continued) June 30, 2016
69
NOTE 8—PENSION PLAN: (Continued)
Sensitivity of the Net Pension Liability to Changes in the Discount Rate
The following presents the net pension liability of the Primary Government, Component Unit Rockbridge Regional Jail Commission and Component Unit School Board (nonprofessional) using the discount rate of 7.00%, as well as what the Primary Government’s and Component Unit School Board’s (nonprofessional) net pension liability would be if it were calculated using a discount rate that is one percentage point lower (6.00%) or one percentage point higher (8.00%) than the current rate:
(6.00%) (7.00%) (8.00%)
CountyNet Pension Liability (Asset) $ 6,686,491 $ 3,593,442 $ 1,004,685
Component Unit Rockbridge Regional Jail CommissionNet Pension Liability (Asset) $ 2,076,930 $ 1,116,180 $ 312,071
Component Unit School Board (nonprofessional)Net Pension Liability (Asset) $ 1,168,495 $ 378,165 $ (290,518)
Rate
Pension Expense and Deferred Outflows of Resources and Deferred Inflows of Resources Related to Pensions
For the year ended June 30, 2016, the Primary Government, Component Unit Rockbridge Regional Jail Commission and Component Unit School Board (nonprofessional) recognized pension expense of $395,570, $122,871 and $18,783, respectively. At June 30, 2016, the Primary Government, Component Unit Rockbridge Regional Jail Commission and Component Unit School Board (nonprofessional) reported deferred outflows of resources and deferred inflows of resources related to pensions from the following sources:
Deferred Deferred Deferred Deferred Deferred DeferredOutflows of Inflows of Outflows of Inflows of Outflows of Inflows ofResources Resources Resources Resources Resources Resources
Differences between expected and actual experience $ 42,388 $ - $ 13,166 $ - $ 4,617 $ -
Net difference between projected and actualearnings on pension plan investments - 535,488 - 166,330 - 193,379
Employer contributions subsequent to themeasurement date 670,678 - 208,323 - 123,093 -
Total $ 713,066 $ 535,488 $ 221,489 $ 166,330 $ 127,710 $ 193,379
Primary Government Board (nonprofessional)Component Unit SchoolComponent Unit Rockbridge
Regional Jail Commission
$670,678, $208,323 and $123,093 reported as deferred outflows of resources related to pensions resulting from the Primary Government’s, Component Unit Regional Jail Commission’s and Component Unit School Board’s (nonprofessional) contributions, respectively, subsequent to the measurement date will be recognized as a reduction of the Net Pension Liability in the year ended June 30, 2017.

COUNTY OF ROCKBRIDGE, VIRGINIA
Notes to Financial Statements (Continued) June 30, 2016
70
NOTE 8—PENSION PLAN: (Continued)
Pension Expense and Deferred Outflows of Resources and Deferred Inflows of Resources Related to Pensions (continued)
Other amounts reported as deferred outflows of resources and deferred inflows of resources related to pensions will be recognized in pension expense as follows:
Component Unit Component UnitPrimary Rockbridge Regional School Board
Year ended June 30, Government Jail Commission (nonprofessional)
2017 $ (196,045) $ (60,895) $ (71,590) 2018 (196,045) (60,895) (75,443) 2019 (197,061) (61,210) (75,826) 2020 96,051 29,835 34,097
Thereafter - - -
Component Unit School Board (professional)
Plan Description
All full-time, salaried permanent (professional) employees of public school divisions are automatically covered by the VRS Teacher Retirement Plan upon employment. This is a cost-sharing multiple employer plan administered by the Virginia Retirement System (the system). Additional information regarding the plan description can be found in the first section of this note.
Contributions
The contribution requirement for active employees is governed by §51.1-145 of the Code of Virginia, as amended, but may be impacted as a result of funding options provided to political subdivisions by the Virginia General Assembly. Employees are required to contribute 5.00% of their compensation toward their retirement. Prior to July 1, 2012, all or part of the 5.00% member contribution may have been assumed by the employer. Beginning July 1, 2012, new employees were required to pay the 5% member contribution. In addition, for existing employees, employers were required to begin making the employee pay the 5.00% member contribution. This could be phased in over a period of up to 5 years and the employer is required to provide a salary increase equal to the amount of the increase in the employee-paid member contribution.
Each School Division’s contractually required contribution rate for the year ended June 30, 2016 was 14.50% of covered employee compensation. This rate was based on an actuarially determined rate from an actuarial valuation as of June 30, 2013. The actuarial rate for the Teacher Retirement Plan was 18.20%. This rate, when combined with employee contributions, was expected to finance the costs of benefits earned by employees during the year, with an additional amount to finance any unfunded accrued liability. Based on the provisions of §51.1-145 of the Code of Virginia, as amended the contributions were funded at 79.69% of the actuarial rate for the year ended June 30, 2016. Contributions to the pension plan from the School Board were $2,204,086 and $2,259,447 for the years ended June 30, 2016 and June 30, 2015, respectively.

COUNTY OF ROCKBRIDGE, VIRGINIA
Notes to Financial Statements (Continued) June 30, 2016
71
NOTE 8—PENSION PLAN: (Continued)
Component Unit School Board (professional) (continued)
Pension Liabilities, Pension Expense, and Deferred Outflows of Resources and Deferred Inflows of Resources Related to Pensions
At June 30, 2016, the school division reported a liability of $26,379,000 for its proportionate share of the Net Pension Liability. The Net Pension Liability was measured as of June 30, 2015 and the total pension liability used to calculate the Net Pension Liability was determined by an actuarial valuation as of that date. The school division’s proportion of the Net Pension Liability was based on the school division’s actuarially determined employer contributions to the pension plan for the year ended June 30, 2015 relative to the total of the actuarially determined employer contributions for all participating employers. At June 30, 2015, the school division’s proportion was .20958% as compared to .20944% at June 30, 2014.
For the year ended June 30, 2016, the school division recognized pension expense of $1,769,000. Since there was a change in proportionate share between June 30, 2014 and June 30, 2015, a portion of the pension expense was related to deferred amounts from changes in proportion and from differences between employer contributions and the proportionate share of employer contributions.
At June 30, 2016, the school division reported deferred outflows of resources and deferred inflows of resources related to pensions from the following sources:
Deferred Outflows Deferred Inflowsof Resources of Resources
Differences between expected and actual experience $ - $ 363,000
Net difference between projected and actualearnings on pension plan investments - 1,616,000
Changes in proportion and differences betweenemployer contributions and proportionateshare of contributions 16,000 570,000
Employer contributions subsequent to themeasurement date 2,204,086 -
Total $ 2,220,086 $ 2,549,000
$2,204,086 reported as deferred outflows of resources related to pensions resulting from the school division’s contributions subsequent to the measurement date will be recognized as a reduction of the Net Pension Liability in the year ended June 30, 2017. Other amounts reported as deferred outflows of resources and deferred inflows of resources related to pensions will be recognized in pension expense as follows:
Year ended June 30,
2017 (878,000)2018 (878,000)2019 (878,000)2020 140,000
Thereafter (39,000)

COUNTY OF ROCKBRIDGE, VIRGINIA
Notes to Financial Statements (Continued) June 30, 2016
72
NOTE 8—PENSION PLAN: (Continued)
Component Unit School Board (professional) (continued)
Actuarial Assumptions
The total pension liability for the VRS Teacher Retirement Plan was based on an actuarial valuation as of June 30, 2014, using the Entry Age Normal actuarial cost method and the following assumptions, applied to all periods included in the measurement and rolled forward to the measurement date of June 30, 2015.
Inflation 2.5%
Salary increases, including inflation 3.5% – 5.95%
Investment rate of return 7.0%, net of pension plan investmentexpense, including inflation*
* Administrative expenses as a percent of the market value of assets for the last experience study were found to be approximately 0.06% of the market assets for all of the VRS plans. This would provide an assumed investment return rate for GASB purposes of slightly more than the assumed 7.0%. However, since the difference was minimal, and a more conservative 7.0% investment return assumption provided a projected plan net position that exceeded the projected benefit payments, the long-term expected rate of return on investments was assumed to be 7.0% to simplify preparation of pension liabilities.
Mortality rates:
Pre-Retirement:RP-2000 Employee Mortality Table Projected with Scale AA to 2020 with males set back 3 years and females set back 5 years
Post-Retirement:RP-2000 Combined Mortality Table Projected with Scale AA to 2020 with males set back 2 years and females set back 3 years
Post-Disablement:RP-2000 Disability Life Mortality Table Projected to 2020 with males set back 1 year and no provision for future mortality improvement
The actuarial assumptions used in the June 30, 2013 valuation were based on the results of an actuarial experience study for the period from July 1, 2008 through June 30, 2012. Changes to the actuarial assumptions as a result of the experience study are as follows:
- Update mortality table - Adjustments to the rates of service retirement - Decrease in rates of withdrawals for 3 through 9 years of service - Decrease in rates of disability - Reduce rates of salary increase by 0.25% per year
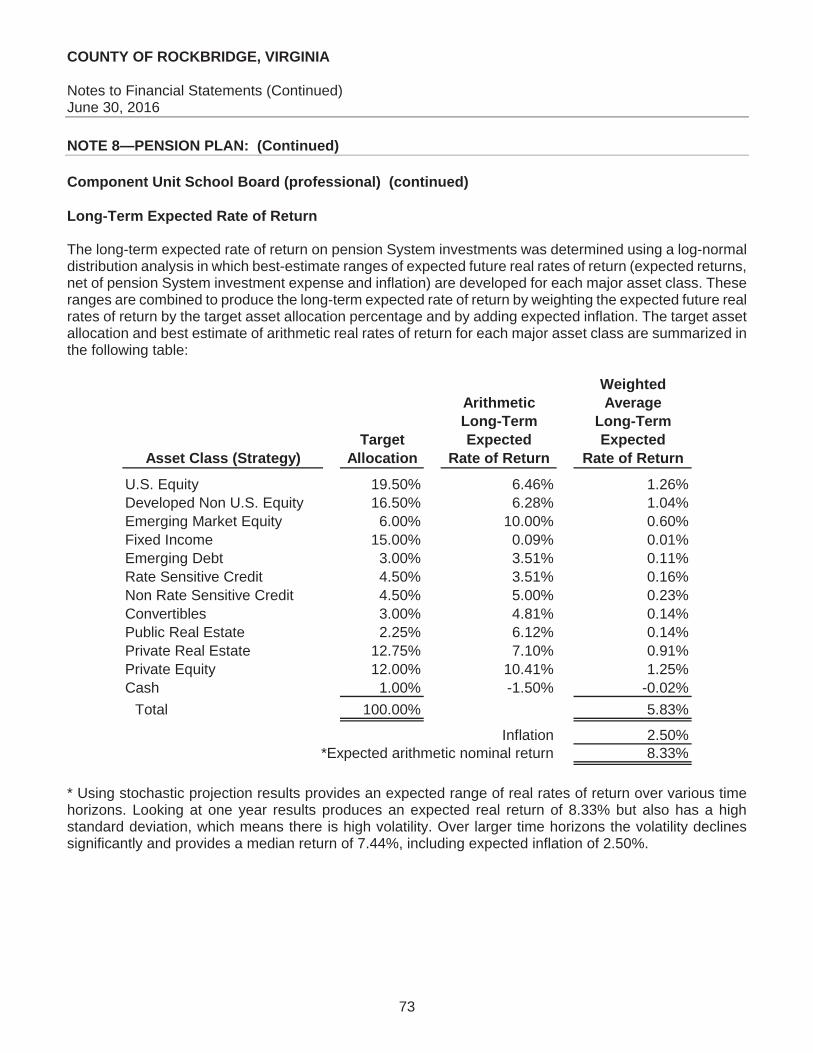
COUNTY OF ROCKBRIDGE, VIRGINIA
Notes to Financial Statements (Continued) June 30, 2016
73
NOTE 8—PENSION PLAN: (Continued)
Component Unit School Board (professional) (continued)
Long-Term Expected Rate of Return
The long-term expected rate of return on pension System investments was determined using a log-normal distribution analysis in which best-estimate ranges of expected future real rates of return (expected returns, net of pension System investment expense and inflation) are developed for each major asset class. These ranges are combined to produce the long-term expected rate of return by weighting the expected future real rates of return by the target asset allocation percentage and by adding expected inflation. The target asset allocation and best estimate of arithmetic real rates of return for each major asset class are summarized in the following table:
WeightedArithmetic AverageLong-Term Long-Term
Target Expected ExpectedAsset Class (Strategy) Allocation Rate of Return Rate of Return
U.S. Equity 19.50% 6.46% 1.26%Developed Non U.S. Equity 16.50% 6.28% 1.04%Emerging Market Equity 6.00% 10.00% 0.60%Fixed Income 15.00% 0.09% 0.01%Emerging Debt 3.00% 3.51% 0.11%Rate Sensitive Credit 4.50% 3.51% 0.16%Non Rate Sensitive Credit 4.50% 5.00% 0.23%Convertibles 3.00% 4.81% 0.14%Public Real Estate 2.25% 6.12% 0.14%Private Real Estate 12.75% 7.10% 0.91%Private Equity 12.00% 10.41% 1.25%Cash 1.00% -1.50% -0.02%
Total 100.00% 5.83%
Inflation 2.50%*Expected arithmetic nominal return 8.33%
* Using stochastic projection results provides an expected range of real rates of return over various time horizons. Looking at one year results produces an expected real return of 8.33% but also has a high standard deviation, which means there is high volatility. Over larger time horizons the volatility declines significantly and provides a median return of 7.44%, including expected inflation of 2.50%.

COUNTY OF ROCKBRIDGE, VIRGINIA
Notes to Financial Statements (Continued) June 30, 2016
74
NOTE 8—PENSION PLAN: (Continued)
Component Unit School Board (professional) (continued)
Discount Rate
The discount rate used to measure the total pension liability was 7.00%. The projection of cash flows used to determine the discount rate assumed that member contributions will be made per the VRS Statutes and the employer contributions will be made in accordance with the VRS funding policy at rates equal to the difference between actuarially determined contribution rates adopted by the VRS Board of Trustees and the member rate. Through the fiscal year ending June 30, 2018, the rate contributed by the school division for the VRS Teacher Retirement Plan will be subject to the portion of the VRS Board-certified rates that are funded by the Virginia General Assembly. From July 1, 2018 on, school divisions are assumed to contribute 100% of the actuarially determined contribution rates. Based on those assumptions, the pension plan’s fiduciary net position was projected to be available to make all projected future benefit payments of current active and inactive employees. Therefore the long-term expected rate of return was applied to all periods of projected benefit payments to determine the total pension liability.
Sensitivity of the School Division’s Proportionate Share of the Net Pension Liability to Changes in the Discount Rate
The following presents the school division’s proportionate share of the net pension liability using the discount rate of 7.00%, as well as what the school division’s proportionate share of the net pension liability would be if it were calculated using a discount rate that is one percentage point lower (6.00%) or one percentage point higher (8.00%) than the current rate:
(6.00%) (7.00%) (8.00%)
School division's proportionateshare of the VRS TeacherEmployee Retirement PlanNet Pension Liability (Asset) $ 38,602,000 $ 26,379,000 $ 16,316,000
Rate
Pension Plan Fiduciary Net Position
Detailed information about the VRS Teacher Retirement Plan’s Fiduciary Net Position is available in the separately issued VRS 2015 Comprehensive Annual Financial Report (CAFR). A copy of the 2015 VRS CAFR may be downloaded from the VRS website at http://www.varetire.org/Pdf/Publications/2015-annual-report.pdf, or by writing to the System’s Chief Financial Officer at P.O. Box 2500, Richmond, VA, 23218-2500.

COUNTY OF ROCKBRIDGE, VIRGINIA
Notes to Financial Statements (Continued) June 30, 2016
75
NOTE 9—OTHER POSTEMPLOYMENT BENEFITS:
County and Other Participating Entities:
Beginning in fiscal year 2009, the County implemented Governmental Accounting Standards Board (GASB) Statement No. 45 for other postemployment benefits (OPEB) offered to retirees. This standard addresses how local governments should account for and report their costs related to postemployment health care and other non-pension benefits. Historically, the plan subsidy was funded on a pay-as-you-go basis, but GASB Statement No. 45 requires that the County accrue the cost of other postemployment benefits during the period of the employees’ active employment, while the benefits are being earned, and disclose the unfunded actuarial accrued liability in order to accurately account for the total future costs of postemployment benefits and the financial impact on the County. This funding methodology mirrors the funding approach used for pension benefits.
A. Plan Description
The County offers its employees the option to participate in the group health insurance program offered to other employees upon retirement, through a single-employer defined benefit plan. Employees must meet the age and service criteria for reduced VRS retirement and be a current employee at least 50 years of age and have been employed by the County in a benefits-eligible position for 10 of the last 13 years prior to retirement are eligible to remain enrolled in the health insurance group plan and continue to have the premiums paid for health insurance coverage subject to specific terms. Spouses and dependents listed for coverage by the employee prior to retirement may remain in the group program. Once the employee has retired, only the deletion or termination of coverage will be permitted. Full cost of dependent coverage will be the responsibility of the retired employee. Eligibility for this benefit terminates at the time the retiree obtains other health coverage or reaches the age of 65. Should an employee be granted full retirement by VRS and/or Social Security because of disability, he/she will be eligible to receive the payments made by the County for retirees regardless of age if he/she has been employed by the County for at least 10 years immediately prior to the disability. The County reserves the right to change the terms of the retirees’ health insurance coverage at any time, including the right to terminate any or all coverage provided to retirees.
The Rockbridge Landfill and Component Units Rockbridge Regional Jail Commission and Rockbridge Public Service Authority (herein are referred to as Other Participating Entities) are included in this plan.
B. Funding Policy
The Rockbridge County Government establishes employer medical contribution rates for all medical plan participants as part of the budgetary process each year. The County also determines how the plan will be funded each year, whether it will partially fund the plan or fully fund the plan. Retirees pay 100% of spousal premiums. Coverage ceases when retirees reach the age of 65. Surviving spouses are not allowed access to the plan.
C. Annual OPEB Cost and Net OPEB Obligation
The annual cost of other postemployment benefits (OPEB) under GASB 45 is based on the annual required contribution or ARC. The estimated pay as you go cost for OPEB benefits is presented in the following table for fiscal year 2015. The County has elected not to pre-fund OPEB liabilities. The County is required to contribute the annual required contribution of the employer (ARC), an amount actuarially determined in accordance with the parameters of GASB Statement 45. The ARC represents a level of funding that, if paid on an ongoing basis, is projected to cover normal cost each year and amortize any unfunded actuarial liabilities (of funding excess) over a period not to exceed thirty years.

COUNTY OF ROCKBRIDGE, VIRGINIA
Notes to Financial Statements (Continued) June 30, 2016
76
NOTE 9—OTHER POSTEMPLOYMENT BENEFITS: (CONTINUED)
County and Other Participating Entities: (continued)
C. Annual OPEB Cost and Net OPEB Obligation (continued)
The following table shows the components of the County and Other Participating entities’ annual OPEB cost for the year, the estimated contribution to the Plan, and changes in the County and Other Participating Entities’ net OPEB obligation to the Plan:
RockbridgeRockbridge Rockbridge Public Service
County Regional Jail Landfill AuthorityAnnual Required Contribution (ARC) $ 31,000 $ 11,000 $ 1,000 $ 2,000 Interest on OPEB Obligation 6,000 2,000 - 1,000 Adjustment to ARC (6,000) (2,000) - (1,000) Annual OPEB Cost $ 31,000 $ 11,000 $ 1,000 $ 2,000 Contributions Made (13,000) (2,000) (1,000) (1,000) Increase in Net OPEB Obligation $ 18,000 $ 9,000 $ - $ 1,000 Net OPEB Obligation -beginning of year 148,000 55,000 3,000 16,000 Net OPEB Obligation - end of year $ 166,000 $ 64,000 $ 3,000 $ 17,000
For fiscal year 2016, the County’s expected cash payment of $13,000 was $18,000 short of the OPEB cost.
For fiscal year 2016, the Rockbridge Regional Jail Commission’s expected cash payment of $2,000 was $9,000 short of the OPEB cost.
For fiscal year 2016, the Rockbridge Landfill’s expected cash payment of $1,000 was equal to the OPEB cost.
For fiscal year 2016, the Rockbridge Public Service Authority’s expected cash payment of $1,000 was $1,000 short of the OPEB cost.
THIS SPACE LEFT BLANK INTENTIONALLY

COUNTY OF ROCKBRIDGE, VIRGINIA
Notes to Financial Statements (Continued) June 30, 2016
77
NOTE 9—OTHER POSTEMPLOYMENT BENEFITS: (CONTINUED)
County and Other Participating Entities: (continued)
C. Annual OPEB Cost and Net OPEB Obligation (continued)
The plan’s annual OPEB cost, the percentage of annual OPEB cost contributed to the plan, and the net OPEB obligation for 2015 and the two preceding years are as follows:
Annual OPEB Cost: Percentageof Annual
Fiscal Annual OPEB NetYear OPEB Cost OPEB
Ended Cost Contributed ObligationCounty June 30, 2016 $ 31,000 41.94% $ 166,000
June 30, 2015 28,000 39.29% 148,000June 30, 2014 38,000 71.05% 131,000
Rockbridge Regional Jail June 30, 2016 11,000 18.18% 64,000June 30, 2015 11,000 9.09% 55,000June 30, 2014 12,000 16.67% 45,000
Rockbridge Landfill June 30, 2016 1,000 0.00% 3,000June 30, 2015 1,000 0.00% 3,000June 30, 2014 2,000 0.00% 2,000
Rockbridge PublicService Authority June 30, 2016 1,000 0.00% 17,000
June 30, 2015 3,000 0.00% 16,000June 30, 2014 2,000 50.00% 13,000
D. Funded Status and Funding Progress
The funded status of the plan as of June 30, 2014, the most recent actuarial valuation date, is as follows:
Actuarial accrued liability (AAL) $ 459,000 Actuarial value of plan assets $ - Unfunded actuarial accrued liability $ 459,000 Funded ratio (actuarial value of plan assets/AAL) 0%Covered payroll (active plan members) $ 7,544,000 UAAL as a percentage of covered payroll 6.08%
Actuarial valuations of an ongoing plan involve estimates of the value of reported amounts and assumptions about the probability of occurrence of events far into the future. Examples include assumptions about future employment, mortality, and the healthcare cost trend. Amounts determined regarding the funded status of the plan and the annual required contributions of the employer are subject to continual revisions as actual results are compared with past expectations and new estimates are made about the future.

COUNTY OF ROCKBRIDGE, VIRGINIA
Notes to Financial Statements (Continued) June 30, 2016
78
NOTE 9—OTHER POSTEMPLOYMENT BENEFITS PROGRAM: (CONTINUED)
County and Other Participating Entities: (continued)
D. Funded Status and Funding Progress (continued)
The schedule of funding progress, presented as required supplementary information following the notes to the financial statements, presents multiyear trend information about whether the actuarial value of plan assets is increasing or decreasing over time relative to the actuarial accrued liabilities for benefits.
E. Actuarial Methods and Assumptions
Projections of benefits for financial reporting purposes are based on the substantive plan (the plan as understood by the employer and the plan members) and include the types of benefits provided at the time of each valuation and the historical pattern of sharing of benefit costs between the employer and plan members to that point. The actuarial methods and assumptions used include techniques that are designed to reduce the effects of short-term volatility in actuarial accrued liabilities and the actuarial value of assets, consistent with the long-term perspective of the calculations.
Cost Method
The Entry Age Normal cost method is used to determine the Plan’s funding liabilities and costs. Under this method, the actuarial present value of projected benefits of every active Participant as if the Plan’s provisions on the valuation date had always been in effect, is determined as a level percentage of expected annual earnings for each future year of expected service. A normal cost for each year from the assumed entry date is determined by applying this level percentage of pay to the assumed earnings for that year (or if benefits are not pay related, the level amount for each year). Under this method, inactive Participants have no normal cost, and the actuarial liability is the present value of the plan benefits to which they and their beneficiaries are entitled. The Plan’s total annual normal cost and actuarial liability are the sum of the individual Participant amounts. An experience gain or loss is a decrease or increase in the unfunded actuarial liability attributable to actual experience that differed from that expected by the actuarial assumptions. Such gains or losses are explicitly recognized under this method. Data is net of any retiree contributions. The UAAL is being amortized on an open basis. The remaining amortization at July 1, 2014 was 30 years.
Interest Assumptions Not fundedDiscount rate 4%Payroll growth 2.50%
School Board Health Insurance Plan
A. Plan Description
The Rockbridge County School Board offers its employees the option to participate in the group health insurance program offered to other employees upon retirement, through a single-employer defined benefit plan. Employees must meet the age and service criteria for reduced VRS retirement and be a current employee at least 50 years of age and have been employed by the School Board in a benefits-eligible position for 10 of the last 13 years prior to retirement are eligible to remain enrolled in the health insurance group plan and continue to have the premiums paid for health insurance coverage subject to specific terms. Spouses and dependents listed for coverage by the employee prior to retirement may remain in the group program. Once the employee has retired, only the deletion or termination of coverage will be permitted.

COUNTY OF ROCKBRIDGE, VIRGINIA
Notes to Financial Statements (Continued) June 30, 2016
79
NOTE 9—OTHER POSTEMPLOYMENT BENEFITS PROGRAM: (CONTINUED)
School Board Health Insurance Plan (continued)
A. Plan Description (continued)
Full cost of dependent coverage will be the responsibility of the retired employee. Eligibility for this benefit terminates at the time the retiree obtains other health coverage or reaches the age of 65. Should an employee be granted full retirement by VRS and/or Social Security because of disability, he/she will be eligible to receive the payments made by the School Board for retirees regardless of age if he/she has been employed by the School Board for at least 10 years immediately prior to the disability. The School Board reserves the right to change the terms of the retirees’ health insurance coverage at any time, including the right to terminate any or all coverage provided to retirees.
B. Funding Policy
The Rockbridge County School Board establishes employer medical contribution rates for all medical plan participants as part of the budgetary process each year. The School Board also determines how the plan will be funded each year, whether it will partially fund the plan or fully fund the plan. Retirees pay 100% of spousal premiums. Coverage ceases when retirees reach the age of 65. Surviving spouses are not allowed access to the plan.
The annual cost of other postemployment benefits (OPEB) under GASB 45 is based on the annual required contribution or ARC. The estimated pay as you go cost for OPEB benefits is $373,000 for fiscal year 2016. The School Board has elected not to pre-fund OPEB liabilities. The School Board is required to contribute the annual required contribution of the employer (ARC), an amount actuarially determined in accordance with the parameters of GASB Statement 45. The ARC represents a level of funding that, if paid on an ongoing basis, is projected to cover normal cost each year and amortize any unfunded actuarial liabilities (of funding excess) over a period not to exceed thirty years.
The following table shows the components of the School Board’s annual OPEB cost for the year, the estimated contributions to the Plan, and changes in the School Board’s net OPEB obligation to the Plan:
SchoolBoard
Annual Required Contribution (ARC) $ 376,000Interest on OPEB Obligation 55,000 Adjustment to ARC (58,000)Annual OPEB Cost $ 373,000Contributions Made (165,000)Increase in Net OPEB Obligation $ 208,000Net OPEB Obligation - beginning of year 1,385,000Net OPEB Obligation - end of year $ 1,593,000

COUNTY OF ROCKBRIDGE, VIRGINIA
Notes to Financial Statements (Continued) June 30, 2016
80
NOTE 9—OTHER POSTEMPLOYMENT BENEFITS PROGRAM: (CONTINUED)
School Board Health Insurance Plan (continued)
B. Funding Policy (continued)
Annual OPEB Cost. for 2016, the School Board’s expected cash payment of $165,000 is $208,000 less than the OPEB cost (expense) of $373,000. The Government’s annual OPEB cost, the percentage of annual OPEB cost contributed to the plan, and the net OPEB obligation for 2016 and the two preceding years are as follows:
Fiscal Annual Percentage of NetYear OPEB Annual OPEB OPEB
Ended Cost Cost Contributed ObligationJune 30, 2016 $ 373,000 44% $ 1,593,000 June 30, 2015 361,000 38% 1,385,000 June 30, 2014 342,000 42% 1,161,000
C. Funded Status and Funding Progress
The funded status of the plan as of June 30, 2015, the most recent actuarial valuation date, is as follows:
Actuarial accrued liability (AAL) $ 4,679,000Actuarial value of plan assets $ -Unfunded actuarial accrued liability $ 4,679,000Funded ratio (actuarial value of plan assets/AAL) 0%Covered payroll (active plan members) $ 16,088,000UAAL as a percentage of covered payroll 29.08%
Actuarial valuations of an ongoing plan involve estimates of the value of reported amounts and assumptions about the probability of occurrence of events far into the future. Examples include assumptions about future employment, mortality, and the healthcare cost trend. Amounts determined regarding the funded status of the plan and the annual required contributions of the employer are subject to continual revisions as actual results are compared with past expectations and new estimates are made about the future.
The schedule of funding progress, presented as required supplementary information following the notes to the financial statements, presents multiyear trend information about whether the actuarial value of plan assets is increasing or decreasing over time relative to the actuarial accrued liabilities for benefits.
D. Actuarial Methods and Assumptions
Projections of benefits for financial reporting purposes are based on the substantive plan (the plan as understood by the employer and the plan members) and include the types of benefits provided at the time of each valuation and the historical pattern of sharing of benefit costs between the employer and plan members to that point. The actuarial methods and assumptions used include techniques that are designed to reduce the effects of short-term volatility in actuarial accrued liabilities and the actuarial value of assets, consistent with the long-term perspective of the calculations.

COUNTY OF ROCKBRIDGE, VIRGINIA
Notes to Financial Statements (Continued) June 30, 2016
81
NOTE 9—OTHER POSTEMPLOYMENT BENEFITS PROGRAM: (CONTINUED)
School Board Health Insurance Plan (continued)
D. Actuarial Methods and Assumptions (continued)
Cost Method
The Entry Age Normal cost method is used to determine the Plan’s funding liabilities and costs. Under this method, the actuarial present value of projected benefits of every active Participant as if the Plan’s provisions on the valuation date had always been in effect, is determined as a level percentage of expected annual earnings for each future year of expected service. A normal cost for each year from the assumed entry date is determined by applying this level percentage of pay to the assumed earnings for that year (or if benefits are not pay related, the level amount for each year). Under this method, inactive Participants have no normal cost, and the actuarial liability is the present value of the plan benefits to which they and their beneficiaries are entitled. The Plan’s total annual normal cost and actuarial liability are the sum of the individual Participant amounts. An experience gain or loss is a decrease or increase in the unfunded actuarial liability attributable to actual experience that differed from that expected by the actuarial assumptions. Such gains or losses are explicitly recognized under this method. Data is net of any retiree contributions. The UAAL is being amortized on an open basis. The remaining amortization at July 1, 2014 was 30 years.
Interest Assumptions Not fundedDiscount rate 4%Payroll growth 2.50%
VRS Health Insurance Credit Program
A. Plan Description
The School Board participates in the Health Insurance Credit Program, a plan designed to assist retirees with the cost of health insurance coverage. This program is a cost sharing, multiple-employer defined benefit plan administered by the Virginia Retirement System (VRS). The Virginia General Assembly established the dollar amount of the health insurance credit for each year of creditable service. The credit amount and eligibility differs for state, school division, political subdivision, local officer, local social services department and general registrar retirees.
A teacher, who retires under VRS with at least 15 years of total creditable service under the System and is enrolled in a health insurance plan, is eligible to receive a monthly health insurance credit of $4 per year of creditable service. However, such credit shall not exceed the health insurance premium for the retiree. Disabled retirees automatically receive a monthly health insurance credit of $4 multiplied by the smaller of (i) twice the amount of their creditable service of (ii) the amount of creditable service they would have completed at 60 if they had remained in service to that age.
Benefit provisions and eligibility requirements are established by Title 51.1, Chapter 14 of the Code of Virginia. The VRS actuarially determines the amount necessary to fund all credits provided, reflects the cost of such credits in the applicable employer contribution rate pursuant to §51.1-145, and prescribes such terms and conditions as are necessary to carry out the provisions of the health insurance credit program. VRS issues separate financial statements as previously discussed in Note 8.

COUNTY OF ROCKBRIDGE, VIRGINIA
Notes to Financial Statements (Continued) June 30, 2016
82
NOTE 9—OTHER POSTEMPLOYMENT BENEFITS: (CONTINUED)
VRS Health Insurance Credit Program (continued)
B. Funding Policy
The School Board is required to contribute, at an actuarially determined rate, the entire amount necessary to fund participation in the program. The current rate is 1.06% of annual covered payroll. The School Board’s contributions to VRS for the years ended June 30, 2016, 2015, and 2014 were $154,844, $164,604, and $170,037, respectively and equaled the required contributions for each year.
NOTE 10—DEFERRED/UNAVAILABLE REVENUE PROPERTY TAXES & INFLOWS/OUTFLOWS OF RESOURCES:
Unavailable revenue represents amounts for which asset recognition criteria have been met, but for which revenue recognition criteria have not been met. Deferred and unavailable revenue in the government-wide and fund financial statements totaling $8,874,382 and $10,267,084 respectively, is comprised of the following:
A. Prepaid Property Taxes: Property taxes due subsequent to June 30, 2016 but paid in advance by taxpayers totaled $463,579 at June 30, 2016.
B. Unbilled Property Taxes: Property taxes for the second half of 2016 that had not been billed as of June 30, 2016 amounted to $8,410,803.
C. Unavailable Property Taxes: Uncollected tax billings not available for funding of current expenditures totaled $1,392,702 at June 30, 2016.
Unearned revenue of the Primary Government is comprised of prepaid Department of Motor Vehicle fees in the amount of $1,531.
NOTE 11—CONTINGENT LIABILITIES:
Federal programs in which the County participates were audited in accordance with the Uniform Guidance. Pursuant to the provisions of this circular all major programs and certain other programs were tested for compliance with applicable grant requirements.
While no matters of noncompliance were disclosed by audit, the federal government may subject grant programs to additional compliance tests which may result in disallowed expenditures. In the opinion of management, any future disallowances of current grant program expenditures, if any, would be immaterial.
NOTE 12—DEPOSITS AND INVESTMENTS:
Deposits:Deposits with banks are covered by the Federal Deposit Insurance Corporation (FDIC) and collateralized in accordance with the Virginia Security for Public Deposits Act (the “Act”) Section 2.2-4400 et. seq. of the Code of Virginia. Under the Act, banks and savings institutions holding public deposits in excess of the amount insured by the FDIC must pledge collateral to the Commonwealth of Virginia Treasury Board. Financial Institutions may choose between two collateralization methodologies and depending upon that choice, will pledge collateral that ranges in the amounts from 50% to 130% of excess deposits. Accordingly, all deposits are considered fully collateralized.

COUNTY OF ROCKBRIDGE, VIRGINIA
Notes to Financial Statements (Continued) June 30, 2016
83
NOTE 12—DEPOSITS AND INVESTMENTS: (CONTINUED)
Investments: Statutes authorize the County and its discretely component units to invest in obligations of the United States or agencies thereof, obligations of the Commonwealth of Virginia or political subdivisions thereof, obligations of the International Bank for Reconstruction and Development (World Bank), the Asian Development Bank, the African Development Bank, prime quality commercial paper and certain corporate notes, banker’s acceptances, repurchase agreements, and State Treasurer’s Local Government Investment Pool (LGIP).
Credit Risk of Debt Securities The County investment policy for credit risk is consistent with the investments allowed by statutes as detailed above.
The County and its discretely presented component units rated debt investments as of June 30, 2016 were rated by Standard & Poor’s and the ratings are presented below using the Standard & Poor’s rating scale.
Rated Debt InvestmentsAAAm
Local Government Investment Pool $ 19,508,218 SNAP External Investment Pool 168,890
Total $ 19,677,108
County's Rated Debt Investments' ValuesFair Quality Ratings
External Investment Pool The State Non-Arbitrage Pool (SNAP) is an open-end management investment company registered with the Securities and Exchange Commission. In May 2016, the Board voted to convert the SNAP fund to an LGIP structure, which would be managed in conformance with GASB 79. On October 3, 2016, the Prime Series became a government money market fund and the name was changed to Government Select Series. The Government Select Series has a policy of investing at least 99.5% of its assets in cash, U.S. government securities (including securities issued or guaranteed by the U.S. government or its agencies or instrumentalities) and/or repurchase agreements that are collateralized fully.
The fair value of the positions in the external investment pools (Local Government Investment Pool and State Non-Arbitrage Pool) is the same as the value of the pool shares. As LGIP is not SEC registered, regulatory oversight of the pool rests with the Virginia State Treasury. LGIP and SNAP are amortized cost basis portfolios under the provisions of GASB Statement No. 79. There are no withdrawal limitations or restrictions imposed on participants.
Interest Rate Risk All County investments must be in securities maturing within five years. Maturities of the County’s investments are as follows:
Investments Fair Value MaturityLess than 1 year
Local Government Investment Pool $ 19,508,218 $ 19,508,218SNAP External Investment Pool 168,890 168,890
Total $ 19,677,108 $ 19,677,108
NOTE 13—RISK MANAGEMENT:
The County is exposed to various risks of loss related to torts; theft of, damage to, and destruction of assets; errors and omissions; injuries to employees; and natural disasters. The County carries commercial insurance for all of these risks of loss. Settled claims resulting from these risks have not exceeded commercial insurance coverage in any of the past three fiscal years.
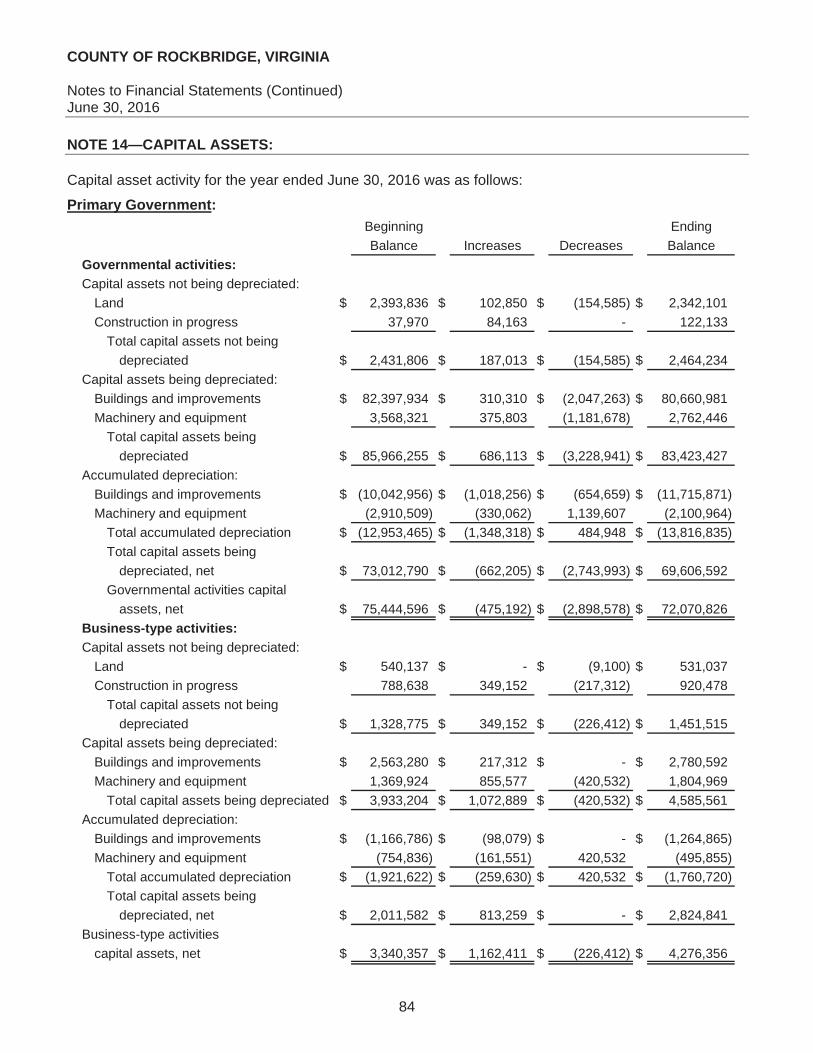
COUNTY OF ROCKBRIDGE, VIRGINIA
Notes to Financial Statements (Continued) June 30, 2016
84
NOTE 14—CAPITAL ASSETS:
Capital asset activity for the year ended June 30, 2016 was as follows:
Primary Government:Beginning EndingBalance Increases Decreases Balance
Governmental activities:Capital assets not being depreciated:
Land $ 2,393,836 $ 102,850 $ (154,585) $ 2,342,101Construction in progress 37,970 84,163 - 122,133
Total capital assets not being depreciated $ 2,431,806 $ 187,013 $ (154,585) $ 2,464,234
Capital assets being depreciated:Buildings and improvements $ 82,397,934 $ 310,310 $ (2,047,263) $ 80,660,981Machinery and equipment 3,568,321 375,803 (1,181,678) 2,762,446
Total capital assets being depreciated $ 85,966,255 $ 686,113 $ (3,228,941) $ 83,423,427
Accumulated depreciation:Buildings and improvements $ (10,042,956) $ (1,018,256) $ (654,659) $ (11,715,871)Machinery and equipment (2,910,509) (330,062) 1,139,607 (2,100,964)
Total accumulated depreciation $ (12,953,465) $ (1,348,318) $ 484,948 $ (13,816,835)Total capital assets being
depreciated, net $ 73,012,790 $ (662,205) $ (2,743,993) $ 69,606,592Governmental activities capital
assets, net $ 75,444,596 $ (475,192) $ (2,898,578) $ 72,070,826Business-type activities:Capital assets not being depreciated:
Land $ 540,137 $ - $ (9,100) $ 531,037Construction in progress 788,638 349,152 (217,312) 920,478
Total capital assets not beingdepreciated $ 1,328,775 $ 349,152 $ (226,412) $ 1,451,515
Capital assets being depreciated:Buildings and improvements $ 2,563,280 $ 217,312 $ - $ 2,780,592Machinery and equipment 1,369,924 855,577 (420,532) 1,804,969
Total capital assets being depreciated $ 3,933,204 $ 1,072,889 $ (420,532) $ 4,585,561Accumulated depreciation:
Buildings and improvements $ (1,166,786) $ (98,079) $ - $ (1,264,865)Machinery and equipment (754,836) (161,551) 420,532 (495,855)
Total accumulated depreciation $ (1,921,622) $ (259,630) $ 420,532 $ (1,760,720)Total capital assets being
depreciated, net $ 2,011,582 $ 813,259 $ - $ 2,824,841Business-type activities
capital assets, net $ 3,340,357 $ 1,162,411 $ (226,412) $ 4,276,356

COUNTY OF ROCKBRIDGE, VIRGINIA
Notes to Financial Statements (Continued) June 30, 2016
85
NOTE 14—CAPITAL ASSETS: (CONTINUED)
Primary Government: (continued)
Depreciation expense was charged to functions/programs of the primary government as follows:
Governmental activities:General government administration $ 1,063,760Judicial administration 12,288Public safety 245,851Public works 14,057Parks, recreation, and cultural 10,620Community Development 1,742
Total depreciation expense-governmental activities $ 1,348,318Business-type activities:
Solid Waste Authority $ 259,630Total depreciation expense-business-type activities $ 259,630
Discretely Presented Component Unit-School Board:
Capital asset activity for the School Board for the year ended June 30, 2016 was as follows:
Beginning EndingBalance Increases Decreases Balance
Capital assets not being depreciated:Land $ 117,555 $ - $ - $ 117,555
Total capital assets not beingdepreciated $ 117,555 $ - $ - $ 117,555
Capital assets being depreciated:Buildings and improvements $ 34,573,404 $ 2,140,835 $ - $ 36,714,239Machinery and equipment 5,402,691 734,025 (411,189) 5,725,527
Total capital assets beingdepreciated $ 39,976,095 $ 2,874,860 $ (411,189) $ 42,439,766
Accumulated depreciation:Buildings and improvements $ (17,466,783) $ (1,812,125) $ 654,659 $ (18,624,249)Machinery and equipment (3,730,710) (518,116) 398,389 (3,850,437)
Total accumulated depreciation $ (21,197,493) $ (2,330,241) $ 1,053,048 $ (22,474,686)Total capital assets being
depreciated, net $ 18,778,602 $ 544,619 $ 641,859 $ 19,965,080School Board capital assets, net $ 18,896,157 $ 544,619 $ 641,859 $ 20,082,635
Depreciation expense for the year ended June 30, 2016 was $2,330,241.

COUNTY OF ROCKBRIDGE, VIRGINIA
Notes to Financial Statements (Continued) June 30, 2016
86
NOTE 14—CAPITAL ASSETS: (CONTINUED)
Discretely Presented Component Unit-School Board: (continued)
Legislation enacted during the year ended June 30, 2002, Section 15.2-1800.1 of the Code of Virginia, 1950, as amended, changed the reporting of local school capital assets and related debt for financial statement purposes. Historically, debt incurred by local government on-behalf of school boards was reported in the school board’s discrete column along with the related capital assets. Under the new law, local governments have a tenancy in common with the school board whenever the locality incurs any financial obligation for any school property which is payable over more than one fiscal year. For financial reporting purposes, the legislation permits the locality to report the portion of school property related to any outstanding financial obligation eliminating any potential deficit from capitalizing assets financed with debt. The effect on the County of Rockbridge, Virginia for the year ended June 30, 2016, is that school financed assets in the amount of $40,302,565 are reported in the Primary Government for financial reporting purposes.
Discretely Presented Component Unit—Rockbridge Area Social Services Board:
Capital asset activity for the Social Services Board for the year ended June 30, 2016 was as follows:
Beginning EndingBalance Additions Balance
Capital assets being depreciated:Equipment $ 99,596 $ - $ 99,596Vehicle 73,036 - 73,036Furniture and fixtures 8,857 - 8,857
Total capital assets being depreciated $ 181,489 $ - $ 181,489Accumulated depreciation:
Equipment $ (74,493) $ (1,200) $ (75,693)Vehicle (77,816) (4,781) (82,597)Furniture and fixtures (8,857) - (8,857)
Total accumulated depreciation $ (161,166) $ (5,981) $ (167,147)Net capital assets $ 20,323 $ (5,981) $ 14,342
Depreciation expense for the year ended June 30, 2016 was $5,981.

COUNTY OF ROCKBRIDGE, VIRGINIA
Notes to Financial Statements (Continued) June 30, 2016
87
NOTE 14—CAPITAL ASSETS: (CONTINUED)
Component Unit—Rockbridge Regional Jail Commission:
A summary of capital assets is summarized below:
Beginning EndingBalance Increases Decreases Balance
Capital assets being depreciated:Buildings and improvements $ 6,000,624 $ - $ - $ 6,000,624Machinery and equipment 517,065 - - 517,065
Total capital assets beingdepreciated $ 6,517,689 $ - $ - $ 6,517,689
Accumulated depreciation:Buildings and improvements $ (2,695,617) $ (150,016) $ - $ (2,845,633)Machinery and equipment (471,707) (11,950) - (483,657)
Total accumulated depreciation $ (3,167,324) $ (161,966) $ - $ (3,329,290)Total capital assets being
depreciated, net $ 3,350,365 $ (161,966) $ - $ 3,188,399Jail Commission capital assets, net $ 3,350,365 $ (161,966) $ - $ 3,188,399
Depreciation expense for the year ended June 30, 2016 totaled $161,966.
THIS SPACE LEFT BLANK INTENTIONALLY

COUNTY OF ROCKBRIDGE, VIRGINIA
Notes to Financial Statements (Continued) June 30, 2016
88
NOTE 14—CAPITAL ASSETS: (CONTINUED)
Component Unit—Rockbridge County Public Service Authority:
A summary of changes in capital assets for the year ended June 30, 2016 follows:
Beginning EndingBalance Increases Decreases Balance
Capital assets not being depreciated:Land $ 381,259 $ 8,000 $ - $ 389,259 Construction in progress 126,966 4,437 (2,054) 129,349
Total capital assets not beingdepreciated $ 508,225 $ 12,437 $ (2,054) $ 518,608
Capital assets being depreciated:Buildings and improvements $ 176,866 $ - $ - $ 176,866 Machinery and equipment 700,325 50,001 (35,858) 714,468 Utility plant and equipment 36,680,677 201,486 - 36,882,163
Capital assets being depreciated $ 37,557,868 $ 251,487 $ (35,858) $ 37,773,497Accumulated depreciation
Buildings and improvements $ (104,746) $ (4,422) $ - $ (109,168) Machinery and equipment (496,603) (79,893) 35,858 (540,638) Utility plant and equipment (12,293,308) (868,194) - (13,161,502)Total accumulated depreciation $ (12,894,657) $ (952,509) $ 35,858 $ (13,811,308)
Capital assets being depreciated, net $ 24,663,211 $ (701,022) $ - $ 23,962,189Capital assets, net Public Service Authority $ 25,171,436 $ (688,585) $ (2,054) $ 24,480,797
Depreciation expense for the fiscal year totaled $952,509.
NOTE 15—ADVANCES TO/FROM PARTICIPATING ENTITIES:
The general fund has established an asset for advances to other entities in the amount of $3,819,848. This is comprised of advances to the component unit Rockbridge Public Service Authority, Rockbridge Area Net Authority and the Solid Waste Authority in the amounts of $2,544,811, $253,785 and $1,021,252, respectively.
The Solid Waste Authority has established a liability for advances from participating localities as follows:
Balance BalanceJuly 1, 2015, Increase June 30,As restated (Decrease) 2016
City of Lexington $ 5,303 $ - $ 5,303City of Buena Vista 5,510 - 5,510Rockbridge County 752,377 268,875 1,021,252Total $ 763,190 $ 268,875 $ 1,032,065

COUNTY OF ROCKBRIDGE, VIRGINIA
Notes to Financial Statements (Continued) June 30, 2016
89
NOTE 16—LANDFILL CLOSURE AND POST-CLOSURE CARE COST:
The Solid Waste Authority owns the only permitted landfill site within the County of Rockbridge. The Cities of Lexington and Buena Vista also use the landfill site. Landfill costs are prorated to each jurisdiction based on tonnage of solid waste accepted each month. The County of Rockbridge is responsible for the management and operation of the landfill. Rockbridge County’s share of tonnage has historically been approximately 70%, the City of Lexington’s share has been approximately 20%, and Buena Vista’s approximately 10%.
State and federal laws and regulations require the Solid Waste Authority to place a final cover on the landfill site when it is filled to capacity or stops accepting waste and to perform certain maintenance and monitoring functions at the site for thirty years after closure. Although closure and post-closure care costs will be paid only near or after the date that the landfill stops accepting waste, the Solid Waste Authority reports a portion of these closure and post-closure care costs as an operating expense in each period based on landfill capacity at each balance sheet date.
The landfill began operation during 1972 and currently has an estimated capacity to last until the year 2017. The $1,980,511 reported as accrued closure and post-closure liability at June 30, 2016 represents the cumulative amount reported based on the estimated number of years remaining (one). The Authority expects to close the landfill in the year 2017. The estimated total current cost of the landfill closure and post-closure care of $1,980,511 is based on the amount that would be paid if all equipment, facilities and services required to close, monitor and maintain the landfill were acquired as of June 30, 2016. Actual costs may be higher due to inflation, changes in technology, or changes in regulations. The Solid Waste Authority intends to fund these costs from tipping revenues and from any funds derived and accumulated for this purpose in the upcoming years.
The County demonstrated financial assurance requirements for closure, post-closure care, and corrective action costs through the submission of a Local Government Financial Assurance Test to the Virginia Department of Environmental Quality in accordance with Section 9VA C20-70 of the Virginia Administrative Code.
NOTE 17—DUE TO OTHER GOVERNMENTS:
During fiscal year 2013 the County entered into an agreement with the City of Buena Vista, Virginia and the City of Lexington, Virginia in order to fund certain renovation improvements to the Rockbridge County Regional Jail. The agreement stipulates that each locality shall be responsible for a portion of the debt issued to finance the project. The City of Lexington serves as fiscal agent for the project and as such, will pay the annual debt service through April 2028. The participating localities will reimburse the City of Lexington for the debt service. As of June 30, 2016 the portion of the debt allocable to the County of Rockbridge, Virginia amounted to $899,741.
The Component Unit Rockbridge Area Social Services Board reported a balance due to the Cities of Buena Vista and Lexington of $64,454 as of June 30, 2016, which represents the net balance owed to the two Cities. The balance due to the Cities consists of administrative costs due from the Cities of $20,246 and CSA pool reimbursements due to the Cities of $84,700.

COUNTY OF ROCKBRIDGE, VIRGINIA
Notes to Financial Statements (Continued) June 30, 2016
90
NOTE 18—SURETY BONDS:
The County had the following surety bonds on hand at June 30, 2016:
Department of Treasury - Division of Rick ManagementD. Bruce Patterson, Clerk of the Circuit Court $ 230,000 Betty S. Trovato, Treasurer 400,000 David C. Whitesell, Commissioner of the Revenue 3,000 Christopher J. Blalock, Sheriff 30,000 Above constitutional officers' employees-blanket bond 50,000
VACORPRhonda Humprhies, Clerk of the School Board 10,000 Blanket position - all employees 250,000
Amount
NOTE 19—INTERFUND TRANSFERS:
Interfund transfers for the year ended June 30, 2016 consisted of the following:
Fund Transfers In Transfers OutPrimary Government:
General Fund $ 9,100 $ 4,799,104 Other Capital Projects Fund - 226,469 County Capital Projects Fund 4,566,522 Landfill Fund - 9,100 Recycling Fund 459,051 -
Total $ 5,034,673 $ 5,034,673
Transfers are used to (1) move revenues from the fund that statute or budget requires to collect them to the fund that statute or budget requires to expend them and (2) use unrestricted revenues collected in the General Fund to finance various programs accounted for in other funds in accordance with budgeting authorization. The County Capital Projects Fund was established during fiscal year 2016 and $4,566,522 in funds assigned for capital projects were transferred from the General and the Other Capital Projects Funds to the newly established fund. Transfers from the general fund to the recycling fund were necessary to subsidize operations in the recycling fund. The Landfill contributed real property with a cost of $9,100 to the General Fund for the creation of a shooting range.
NOTE 20—SEGMENT INFORMATION FOR BUSINESS-TYPE ACTIVITIES:
TotalLandfill Recycling EnterpriseFund Fund Funds
Operating revenue $ 2,113,441 $ 10,875 $ 2,124,316
Depreciation and amortization 227,486 32,144 259,630 Operating income (loss) 1,108,025 (453,054) 654,971 Property, plant and equipment
additions, net of retirements (726,454) (48,643) (775,097) Net working capital 353,610 (8,261) 345,349 Total assets 15,798,513 177,485 15,975,998Long-term liabilities 10,038,560 116,639 10,155,199Net position 4,324,996 57,937 4,382,933

COUNTY OF ROCKBRIDGE, VIRGINIA
Notes to Financial Statements (Continued) June 30, 2016
91
NOTE 21—CAPITAL LEASES:
The government has financed the acquisition of landfill equipment and emergency communications equipment by means of capital leases. These lease agreements qualify as capital leases for accounting purposes and therefore, have been recorded at their present values of their future minimum lease payments as of the inception date.
The assets acquired through capital leases are as follows:
Business-typeActivities
Assets:Machinery and equipment $ 1,376,251Accumulated depreciation (288,031)Total $ 1,088,220
The future minimum lease obligations and the net present value of minimum lease payments as of June 30, 2016, are as follows:
Year Ended Business-typeJune 30, Activities2017 $ 295,2242018 283,1252019 179,9272020 145,4992021 60,625Amount representing interest (47,810)Present value of minimum lease payments $ 916,590
NOTE 22—COMMITMENTS AND CONTINGENCIES:
The County and the City of Lexington entered into a modified voluntary settlement of Annexation and Immunity Agreement on May 6, 1986. This agreement is based on real estate assessed values and on non- property local taxes. The amount due the City of Lexington is payable on January 1 of each year. Included in these financial statements is the payment for the year ended June 30, 2015 in the amount of $1,769,854. The amount to be paid on January 1, 2017, and which is not included in the financial statements, totals $1,797,985 for the fiscal year ended June 30, 2016.
The County has guaranteed debt issued by the Maury Service Authority (MSA) for the construction and upgrades of its current wastewater treatment plant. The MSA’s debt totaled $6,654,633 as of June 30, 2016 and is scheduled to be completely retired by June 2031. The County paid $704,330 to the MSA in fiscal year 2016 for half of the debt service, the City of Lexington pays an equal assessment. An annual assessment of $704,330 per year is scheduled through fiscal year 2018. The annual assessment will be reduced to $161,504 for fiscal years 2019 to 2031.

COUNTY OF ROCKBRIDGE, VIRGINIA
Notes to Financial Statements (Continued) June 30, 2016
92
NOTE 22—COMMITMENTS AND CONTINGENCIES: (CONTINUED)
The County along with the Cities of Lexington and Buena Vista, have entered into an agreement with the Rockbridge Regional Public Safety Communications Center, for the purpose of providing contributions for the payment of debt associated with its radio upgrade project through June 30, 2030. Each locality will contribute a percentage of the total cost of the upgrade based upon its annual assessed value of real estate. TheCounty of Rockbridge is serving as fiscal agent for the radio upgrade project. The amount owed by the Rockbridge Regional Public Safety Communications Center on the capital lease obligation at June 30, 2016 was $4,945,909 and an annual payment of $435,427 will be paid by the Center through June 2030.
Lexington City has committed to partnering with Rockbridge County on the landfill’s lateral expansion project. The County and Lexington City continue with negotiations to create a new solid waste management agreement that is linked to the landfill expansion. The final agreement will include provisions to amend and restate solid waste disposal that involves a successor regional solid waste authority. The existing Rockbridge County Solid Waste Authority shall be re-constituted as the Blue Ridge Resource Authority with Rockbridge County and the City of Lexington as members. The successor regional Authority Board shall consist of seven members, with five members appointed from the County Board of Supervisors, and two members appointed by the Lexington City Council, from among the Mayor and the City Council members. Although Buena Vista City opted to contract with a third party to begin managing their solid waste in FY 2018, the future landfill cells have the capacity to handle their refuse should they request to participate as a customer in the Authority’s solid waste system.
The County Recycling Program is currently accounted for in the RCSWA Recycling Fund. County and Authority leadership, as recommended by staff, will transition this function to the County of Rockbridge General Fund beginning on July 1, 2017 (FY 2018).
NOTE 23—UPCOMING PRONOUNCEMENTS:
Statement No. 74, Financial Reporting for Postemployment Benefit Plans Other Than Pension Plans,improves the usefulness of information about postemployment benefits other than pensions (other postemployment benefits or OPEB) included in the general purpose external financial reports of state and local governmental OPEB plans for making decisions and assessing accountability. This Statement replaces Statements No. 43, Financial Reporting for Postemployment Benefit Plans Other Than Pension Plans, as amended, and No. 57, OPEB Measurements by Agent Employers and Agent Multiple Employer Plans. It also includes requirements for defined contribution OPEB plans that replace the requirements for those OPEB plans in Statement No. 25, Financial Reporting for Defined Benefit Pension Plans and Note Disclosures for Defined Contribution Plans, as amended, Statement 43, and Statement No. 50, Pension Disclosures. This Statement is effective for financial statements for fiscal years beginning after June 15, 2016.
Statement No. 75, Accounting and Financial Reporting for Postemployment Benefits Other Than Pension, improves accounting and financial reporting by state and local governments for postemployment benefits other than pensions (other postemployment benefits or OPEB). This Statement replaces the requirements of Statements No. 45, Accounting and Financial Reporting by Employers for Postemployment Benefits Other Than Pensions, as amended, and No. 57, OPEB Measurements by Agent Employers and Agent Multiple Employer Plans, for OPEB. Statement No. 74, Financial Reporting for Postemployment Benefit Plans Other Than Pension Plans, establishes new accounting and financial reporting requirements for OPEB plans. This Statement is effective for fiscal years beginning after June 15, 2017.

COUNTY OF ROCKBRIDGE, VIRGINIA
Notes to Financial Statements (Continued) June 30, 2016
93
NOTE 23—UPCOMING PRONOUNCEMENTS: (CONTINUED)
Statement No. 77, Tax Abatement Disclosures, will increase the disclosure of tax abatement agreements to disclose information about the agreements. The requirements of this Statement improve financial reporting by giving users of financial statements essential information that is not consistently or comprehensively reported to the public at present. The requirements of this Statement are effective for financial statements for periods beginning after December 15, 2015.
Statement No. 78, Pensions Provided through Certain Multiple-Employer Defined Benefit Pension Plans,addresses a practice issue regarding the scope and applicability of Statement No. 68, Accounting and Financial Reporting for Pensions. This issue is associated with pensions provided through certain multiple-employer defined benefit pension plans and to state or local governmental employers whose employees are provided with such pensions. The requirements of this Statement are effective for reporting periods beginning after December 15, 2015.
Statement No. 80, Blending Requirements for Certain Component Units—an amendment of GASB Statement No. 14, improves financial reporting by clarifying the financial statement presentation requirements for certain component units. This Statement amends the blending requirements established in paragraph 53 of Statement No. 14, The Financial Reporting Entity, as amended. The requirements of this Statement are effective for reporting periods beginning after June 15, 2016.
Statement No. 81, Irrevocable Split-Interest Agreements, improves accounting and financial reporting for irrevocable split-interest agreements by providing recognition and measurement guidance for situations in which a government is a beneficiary of the agreement. The requirements of this Statement are effective for financial statements for periods beginning after December 15, 2016, and should be applied retroactively.
Management is currently evaluating the impact these standards will have on the financial statements when adopted.
NOTE 24—LITIGATION:
At June 30, 2016, there were no matters of litigation involving the County for which would materially affect the County’s financial position should any court decisions on pending matters not be favorable to the County.
NOTE 25—ADVANCE REFUNDING:
The government issued $4,985,000 in revenue bonds at interest rates ranging from 3.796% to 5.125%. The proceeds were used to advance refund $5,130,000 of outstanding 2007 Series E bonds which had an interest rate of 4.58%. The net proceeds of $5,659,557 (including a $835,950 premium, and after payment of $161,393 in underwriting fees, and other issuance costs) were deposited in an irrevocable trust with an escrow agent to provide funds for the future debt services payment on the refunding bonds. As a result, the 2007 Series E revenue bonds are considered defeased and the liability for those bonds has been removed from the statement of net position.
The reacquisition price exceeded the net carrying amount of the old debt by $449,876. This amount is being amortized over the remaining life of the refunding debt. The government advance refunded the 2007 Series E revenue bonds to obtain an economic gain (difference between the present values of the debt service payments on the old and new debt) of $613,354.

REQUIRED SUPPLEMENTARY INFORMATION

County of Rockbridge, Virginia Exhibit 11General FundSchedule of Revenues, Expenditures, and Changes in Fund Balances - Budget and ActualFor the Year Ended June 30, 2016
Variance withFinal Budget -
Actual PositiveOriginal Final Amounts (Negative)
REVENUESGeneral property taxes $ 23,944,570 $ 23,937,870 $ 24,843,541 $ 905,671 Other local taxes 8,378,000 8,377,300 9,009,065 631,765 Permits, privilege fees, and regulatory licenses 209,020 209,020 275,060 66,040 Fines and forfeitures 400,550 400,550 445,370 44,820 Revenue from the use of money and property 53,046 53,046 112,157 59,111 Charges for services 1,526,350 1,526,350 1,444,588 (81,762) Miscellaneous 788,386 788,386 833,978 45,592 Recovered costs 371,059 371,059 469,735 98,676 Intergovernmental:
Commonwealth 5,017,818 5,017,818 4,965,583 (52,235) Federal 103,900 103,900 207,913 104,013
Total revenues $ 40,792,699 $ 40,785,299 $ 42,606,990 $ 1,821,691
EXPENDITURESCurrent:
General government administration $ 2,071,314 $ 2,238,791 $ 2,117,583 $ 121,208 Judicial administration 1,460,939 1,513,057 1,472,432 40,625 Public safety 7,679,051 7,772,670 7,403,041 369,629 Public works 3,700,768 3,633,931 3,312,600 321,331 Health and welfare 1,273,932 1,281,558 1,639,246 (357,688) Education 13,723,191 13,738,191 13,082,282 655,909 Parks, recreation, and cultural 1,420,050 1,444,289 1,427,654 16,635 Community development 3,223,016 3,344,108 2,808,451 535,657 Nondepartmental 1,834,525 1,819,484 1,780,693 38,791
Debt service:Principal retirement 2,502,117 2,502,118 2,502,118 - Interest and other fiscal charges 2,517,280 2,517,249 2,746,012 (228,763)
Total expenditures $ 41,406,183 $ 41,805,446 $ 40,292,112 $ 1,513,334
Excess (deficiency) of revenues over (under)expenditures $ (613,484) $ (1,020,147) $ 2,314,878 $ 3,335,025
OTHER FINANCING SOURCES (USES)Transfers in $ - $ - $ 9,100 $ 9,100 Transfers out (474,409) (5,083,339) (4,799,104) 284,235 Refunding bonds issued - - 4,985,000 4,985,000 Premium on refunding bonds issued - - 835,950 835,950 Payment to refunded bond escrow agent - - (5,579,876) (5,579,876)
Total other financing sources (uses) $ (474,409) $ (5,083,339) $ (4,548,930) $ 534,409
Net change in fund balances $ (1,087,893) $ (6,103,486) $ (2,234,052) $ 3,869,434 Fund balances - beginning, as restated 1,087,893 6,103,486 25,137,846 19,034,360 Fund balances - ending $ - $ - $ 22,903,794 $ 22,903,794
Budgeted Amounts
94

County of Rockbridge, Virginia Exhibit 12
Schedule of Components of and Changes in Net Pension Liability and Related RatiosPrimary GovernmentYear Ended June 30, 2016
2015 2014Total pension liabilityService cost $ 621,092 $ 574,316 Interest 1,589,147 1,511,082 Differences between expected and actual experience 56,853 - Benefit payments, including refunds of employee contributions (1,102,599) (837,782) Net change in total pension liability $ 1,164,493 $ 1,247,616 Total pension liability - beginning 23,253,394 22,005,778 Total pension liability - ending (a) $ 24,417,887 $ 23,253,394
Plan fiduciary net positionContributions - employer $ 646,121 $ 615,640 Contributions - employee 229,869 230,640 Net investment income 921,330 2,750,491 Benefit payments, including refunds of employee contributions (1,102,599) (837,782) Administrative expense (12,651) (14,663) Other (194) 145 Net change in plan fiduciary net position $ 681,876 $ 2,744,471 Plan fiduciary net position - beginning 20,142,569 17,398,098 Plan fiduciary net position - ending (b) $ 20,824,445 $ 20,142,569
County's net pension liability - ending (a) - (b) $ 3,593,442 $ 3,110,825
Plan fiduciary net position as a percentage of the totalpension liability 85.28% 86.62%
Covered payroll $ 4,611,013 $ 4,612,066
County's net pension liability as a percentage of covered payroll 77.93% 67.45%
Schedule is intended to show information for 10 years. Information prior to the 2014 valuation is not available.However, additional years will be included as they become available.
95

County of Rockbridge, Virginia Exhibit 13
Schedule of Components of and Changes in Net Pension Liability and Related RatiosComponent Unit Rockbridge Regional Jail CommissionYear Ended June 30, 2016
2015 2014Total pension liabilityService cost $ 192,921 $ 178,392 Interest 493,614 469,366 Differences between expected and actual experience 17,662 - Benefit payments, including refunds of employee contributions (342,487) (260,228) Net change in total pension liability $ 361,710 $ 387,530 Total pension liability - beginning 7,222,876 6,835,346Total pension liability - ending (a) $ 7,584,586 $ 7,222,876
Plan fiduciary net positionContributions - employer $ 200,696 $ 191,228 Contributions - employee 71,401 71,641 Net investment income 286,180 854,346 Benefit payments, including refunds of employee contributions (342,487) (260,228) Administrative expense (3,929) (4,555) Other (59) 45 Net change in plan fiduciary net position $ 211,802 $ 852,477 Plan fiduciary net position - beginning 6,256,604 5,404,127Plan fiduciary net position - ending (b) $ 6,468,406 $ 6,256,604
County's net pension liability - ending (a) - (b) $ 1,116,180 $ 966,272
Plan fiduciary net position as a percentage of the totalpension liability 85.28% 86.62%
Covered payroll $ 1,430,478 $ 1,435,202
County's net pension liability as a percentage of covered payroll 78.03% 67.33%
Schedule is intended to show information for 10 years. Information prior to the 2014 valuation is not available.However, additional years will be included as they become available.
96

County of Rockbridge, Virginia Exhibit 14
Schedule of Components of and Changes in Net Pension Liability and Related RatiosComponent Unit School Board (nonprofessional)Year Ended June 30, 2016
2015 2014Total pension liabilityService cost $ 152,653 $ 164,187 Interest 497,766 486,051 Differences between expected and actual experience 8,852 - Benefit payments, including refunds of employee contributions (492,430) (473,306) Net change in total pension liability $ 166,841 $ 176,932 Total pension liability - beginning 7,357,164 7,180,232 Total pension liability - ending (a) $ 7,524,005 $ 7,357,164
Plan fiduciary net positionContributions - employer $ 131,850 $ 129,936 Contributions - employee 76,599 77,165 Net investment income 317,602 988,120 Benefit payments, including refunds of employee contributions (492,430) (473,306) Administrative expense (4,567) (5,498) Other (65) 52 Net change in plan fiduciary net position $ 28,989 $ 716,469 Plan fiduciary net position - beginning 7,116,851 6,400,382 Plan fiduciary net position - ending (b) $ 7,145,840 $ 7,116,851
School Division's net pension liability - ending (a) - (b) $ 378,165 $ 240,313
Plan fiduciary net position as a percentage of the totalpension liability 94.97% 96.73%
Covered payroll $ 1,574,193 $ 1,544,639
School Division's net pension liability as a percentage of covered payroll 24.02% 15.56%
Schedule is intended to show information for 10 years. Information prior to the 2014 valuation is not available. However, additional years will be included as they become available.
97

County of Rockbridge, Virginia Exhibit 15
Schedule of Employer's Share of Net Pension Liability VRS Teacher Retirement PlanYear Ended June 30, 2016
2015 2014
Employer's Proportion of the Net Pension Liability 0.20958% 0.20944%
Employer's Proportionate Share of the Net Pension Liability $ 26,379,000 $ 25,310,000
Employer's Covered Payroll $ 15,582,993 $ 15,316,106
Employer's Proportionate Share of the Net Pension Liability as a Percentage of its Covered Payroll 169% 165%
Plan Fiduciary Net Position as a Percentage of the Total Pension Liability 70.88% 70.88%
Schedule is intended to show information for 10 years. Information prior to the 2014 valuation is not available. However,additional years will be included as they become available.
98

County of Rockbridge, Virginia Exhibit 16
Schedule of Employer ContributionsYear Ended June 30, 2016
Contributions inRelation to Contributions
Contractually Contractually Contribution Employer's as a % ofRequired Required Deficiency Covered Covered
Contribution Contribution (Excess) Payroll PayrollDate (1) (2) (3) (4) (5)
Primary Government2016 $ 670,679 $ 670,679 $ - $ 4,780,323 14.03%2015 646,121 646,121 - 4,611,013 14.01%2014 615,249 615,249 - 4,612,066 13.34%2013 579,970 579,970 - 4,347,599 13.34%2012 380,317 380,317 - 3,485,953 10.91%2011 375,377 375,377 - 3,440,667 10.91%2010 354,062 354,062 - 3,590,890 9.86%2009 359,999 359,999 - 3,651,104 9.86%2008 441,833 441,833 - 4,314,994 10.24%2007 411,601 411,601 - 4,019,542 10.24%
Component Unit Rockbridge Regional Jail Commission2016 $ 208,323 $ 208,323 $ - $ 1,484,840 14.03%2015 200,696 200,696 - 1,430,478 14.03%2014 191,456 191,456 - 1,435,202 13.34%2013 182,280 182,280 - 1,366,417 13.34%2012 200,659 200,659 - 1,839,221 10.91%2011 213,292 213,292 - 1,955,014 10.91%2010 201,864 201,864 - 2,047,302 9.86%2009 201,402 201,402 - 2,042,617 9.86%2008 125,177 125,177 - 1,222,432 10.24%2007 132,672 132,672 - 1,295,625 10.24%
Component Unit School Board (nonprofessional)2016 $ 123,093 $ 123,093 $ - $ 1,446,451 8.51%2015 131,850 131,850 - 1,574,193 8.38%2014 123,262 123,262 - 1,544,639 7.98%2013 128,535 128,535 - 1,610,712 7.98%2012 67,071 67,071 - 1,510,607 4.44%2011 65,100 65,100 - 1,466,226 4.44%2010 66,774 66,774 - 1,474,046 4.53%2009 71,210 71,210 - 1,571,963 4.53%2008 43,810 43,810 - 1,593,095 2.75%2007 43,635 43,635 - 1,586,730 2.75%
Component Unit School Board (professional)2016 $ 2,204,086 $ 2,204,086 $ - $ 15,676,290 14.06%2015 2,259,447 2,259,447 - 15,582,993 14.50%2014 1,785,858 1,785,858 - 15,316,106 11.66%2013 1,807,378 1,807,378 - 15,500,669 11.66%2012 943,498 943,498 - 14,905,182 6.33%2011 577,090 577,090 - 14,684,224 3.93%2010 976,426 976,426 - 14,777,541 6.61%2009 1,364,997 1,364,997 - 15,493,723 8.81%2008 1,544,653 1,544,653 - 14,996,631 10.30%2007 928,910 928,910 - 14,031,873 6.62%
Current year contributions are from County records and prior year contributions are from the VRS actuarial valuationperformed each year.
99

County of Rockbridge, Virginia Exhibit 17
Notes to Required Supplementary InformationYear Ended June 30, 2016
Largest 10 – Non-LEOS:- Update mortality table- Decrease in rates of service retirement- Decrease in rates of disability retirement- Reduce rates of salary increase by 0.25% per year
Largest 10 – LEOS:- Update mortality table- Decrease in male rates of disability
All Others (Non 10 Largest) – Non-LEOS:- Update mortality table- Decrease in rates of service retirement- Decrease in rates of disability retirement- Reduce rates of salary increase by 0.25% per year
All Others (Non 10 Largest) – LEOS:- Update mortality table- Adjustments to rates of service retirement for females- Increase in rates of withdrawal- Decrease in male and female rates of disability
Component Unit School Board - Professional Employees- Update mortality table- Adjustments to the rates of service retirement- Decrease in rates of withdrawals for 3 through 9 years of service- Decrease in rates of disability retirement- Reduce rates of salary increase by 0.25% per year
Changes of benefit terms – There have been no actuarially material changes to the System benefit provisionssince the prior actuarial valuation. The 2014 valuation includes Hybrid Retirement Plan members for the first time.The hybrid plan applies to most new employees hired on or after January 1, 2014 and not covered by enhancedhazardous duty benefits. Because this was a new benefit and the number of participants was relatively small, theimpact on the liabilities as of the measurement date of June 30, 2015 are not material.
Changes of assumptions – The following changes in actuarial assumptions were made effective June 30, 2013based on the most recent experience study of the System for the four-year period ending June 30, 2012:
In 2015, Covered Employee Payroll (as defined by GASB 68) included the total payroll for employees covered underthe pension plan whether that payroll is subject to pension coverage or not. This definition was modified in GASBStatement No. 82 and now is the payroll on which contributions to a pension plan are based. The ratios presenteduse the same measure.
100

County of Rockbridge, Virginia Exhibit 18
PRIMARY GOVERNMENT:
UnfundedActuarial Actuarial UAAL as
Actuarial Accrued Accrued % ofActuarial Value of Liability Liability Funded Covered CoveredValuation Assets (AAL) (UAAL) Ratio Payroll Payroll
Date ( a ) ( b ) ( b-a ) ( a/b ) ( c ) ( (b-a)/c )
06/30/14 $ - $ 459,000 $ 459,000 0.00% $ 7,544,000 6.08%06/30/12 - 448,000 448,000 0.00% 6,655,000 6.73%06/30/10 - 547,000 547,000 0.00% 6,387,000 8.56%
DISCRETELY PRESENTED COMPONENT UNIT:
School Board Other Postemployment Benefit Program
Actuarial Actuarial UAAL asActuarial Accrued Accrued % of
Actuarial Value of Liability Liability Funded Covered CoveredValuation Assets (AAL) (UAAL) Ratio Payroll Payroll
Date ( a ) ( b ) ( b-a ) ( a/b ) ( c ) ( (b-a)/c )
06/30/14 $ - $ 4,679,000 $ 4,679,000 0.00% $ 16,088,000 29.08%06/30/12 - 4,290,000 4,290,000 0.00% 16,081,000 26.68%06/30/10 - 4,406,000 4,406,000 0.00% 16,143,000 27.29%
Schedule of OPEB Funding ProgressJune 30, 2016
County Other Postemployment Benefit Program (includes Rockbridge Regional Jail Commission, Landfill, and Rockbridge County Public Service Authority)
101

OTHER SUPPLEMENTARY INFORMATION

County of Rockbridge, Virginia Exhibit 19
Variance withFinal Budget -
Actual PositiveOriginal Final Amounts (Negative)
REVENUESRevenue from the use of money and property $ - $ - $ - $ -
Total revenues $ - $ - $ - $ -
EXPENDITURESCapital projects $ - $ 423,022 $ 477,000 $ (53,978)
Total expenditures $ - $ 423,022 $ 477,000 $ (53,978)
Excess (deficiency) of revenues over (under)expenditures $ - $ (423,022) $ (477,000) $ (53,978)
OTHER FINANCING SOURCES (USES)Transfers in $ - $ - $ 4,566,522 $ 4,566,522
Total other financing sources (uses) $ - $ - $ 4,566,522 $ 4,566,522
Net change in fund balances $ - $ (423,022) $ 4,089,522 $ 4,512,544 Fund balances - beginning - 423,022 - (423,022) Fund balances - ending $ - $ - $ 4,089,522 $ 4,089,522
Budgeted Amounts
County Capital Projects FundSchedule of Revenues, Expenditures, and Changes in Fund Balances - Budget and ActualFor the Year Ended June 30, 2016
102

County of Rockbridge, Virginia Exhibit 20
Variance withFinal Budget -
Actual PositiveOriginal Final Amounts (Negative)
REVENUESRevenue from the use of money and property $ - $ - $ 860 $ 860
Total revenues $ - $ - $ 860 $ 860
EXPENDITURESCapital projects $ - $ 64,975 $ 9,825 $ 55,150
Total expenditures $ - $ 64,975 $ 9,825 $ 55,150
Excess (deficiency) of revenues over (under)expenditures $ - $ (64,975) $ (8,965) $ 56,010
OTHER FINANCING SOURCES (USES)Transfers out $ - $ - $ (226,469) $ (226,469)
Total other financing sources (uses) $ - $ - $ (226,469) $ (226,469)
Net change in fund balances $ - $ (64,975) $ (235,434) $ (170,459) Fund balances - beginning - 64,975 434,539 369,564 Fund balances - ending $ - $ - $ 199,105 $ 199,105
Budgeted Amounts
Other Capital Projects FundSchedule of Revenues, Expenditures, and Changes in Fund Balances - Budget and ActualFor the Year Ended June 30, 2016
103

County of Rockbridge, Virginia Exhibit 21Combining Statement of Fiduciary Net PositionFiduciary Funds
Agency FundsRockbridge
Commonwealth Regional Payroll Veterans Employee Attorney Public Safety
Deduction Drug Memorial Benefit Forfeitures CommunicationsFund Fund Fund Fund Fund Center Total
ASSETSCash and cash equivalents $ - $ 103,769 $ 9,781 $ 2,164 $ 13,656 $ 3,523,687 $ 3,653,057
Total assets $ - $ 103,769 $ 9,781 $ 2,164 $ 13,656 $ 3,523,687 $ 3,653,057
LIABILITIESAccounts payable $ (69,896) $ 1,480 $ - $ - $ 3,000 $ - $ (65,416) Amounts held for payroll deduction 69,896 - - - - - 69,896 Amounts held for veterans memorial - - 9,781 - - - 9,781 Amounts held for drug enforcement - 102,289 - - - - 102,289 Amounts held for employee benefits - - - 2,164 - - 2,164
- - - - 10,656 - 10,656
- - - - - 3,523,687 3,523,687Total liabilities $ - $ 103,769 $ 9,781 $ 2,164 $ 13,656 $ 3,523,687 $ 3,653,057
June 30, 2016
Amounts held for regional public safety communications center
Amounts held for commonwealth attorney forfeitures
104

County of Rockbridge, Virginia Exhibit 22
Combining Statement of Changes in Assets and LiabilitiesAgency FundsFor the Year Ended June 30, 2016
Balance BalanceBeginning End
of Year Additions Deletions of Year
Payroll Deduction Fund:LIABILITIESAccounts payable $ (69,278) $ 267,885 $ 268,503 $ (69,896) Amounts held for payroll deduction 69,278 (267,885) (268,503) 69,896
Total liabilities $ - $ - $ - $ -
Drug Fund:ASSETSCash and cash equivalents $ 142,229 $ 4,910 $ 43,370 $ 103,769
Total assets $ 142,229 $ 4,910 $ 43,370 $ 103,769
LIABILITIESAccounts payable $ 1,961 $ - $ (11,628) $ 13,589 Amounts held for drug enforcement 140,268 4,910 54,998 90,180
Total liabilities $ 142,229 $ 4,910 $ 43,370 $ 103,769
Veterans Memorial Fund:ASSETSCash and cash equivalents $ 10,018 $ - $ 237 $ 9,781
Total assets $ 10,018 $ - $ 237 $ 9,781
LIABILITIESAmounts held for veterans memorial $ 10,018 $ - $ 237 $ 9,781
Total liabilities $ 10,018 $ - $ 237 $ 9,781
Employee Benefit Fund:ASSETSCash and cash equivalents $ 2,164 $ - $ - $ 2,164
Total assets $ 2,164 $ - $ - $ 2,164
LIABILITIESAmounts held for employee benefits $ 2,164 $ - $ - $ 2,164
Total liabilities $ 2,164 $ - $ - $ 2,164
Commonwealth Attorney Forfeitures Fund:ASSETSCash and cash equivalents $ 21,031 $ 309 $ 7,684 $ 13,656
Total assets $ 21,031 $ 309 $ 7,684 $ 13,656
LIABILITIESAccounts payable $ - $ - $ (3,000) $ 3,000 Amounts held for commonwelath's attorney forfeitures 21,031 309 10,684 10,656
Total liabilities $ 21,031 $ 309 $ 7,684 $ 13,656
Rockbridge Regional Public Safety Communications Center:ASSETSCash and cash equivalents $ 4,439,935 $ 2,076 $ 918,324 $ 3,523,687
Total assets $ 4,439,935 $ 2,076 $ 918,324 $ 3,523,687
LIABILITIESAmounts held for regional public safety communications center $ 4,439,935 $ 2,076 $ 918,324 $ 3,523,687
Total liabilities $ 4,439,935 $ 2,076 $ 918,324 $ 3,523,687
Totals - All Agency Funds:ASSETS
Cash and cash equivalents $ 4,615,377 $ 7,295 $ 969,615 $ 3,653,057
Total assets $ 4,615,377 $ 7,295 $ 969,615 $ 3,653,057
LIABILITIESAccounts payable $ (67,317) $ 267,885 $ 253,875 $ (53,307) Amounts held for payroll deduction 69,278 (267,885) (268,503) 69,896 Amounts held for drug enforcement 140,268 4,910 54,998 90,180 Amounts held for veterans memorial 10,018 - 237 9,781 Amounts held for employee benefits 2,164 - - 2,164 Amounts held for commonwelath's attorney forfeitures 21,031 309 10,684 10,656 Amounts held for regional public safety communications center 4,439,935 2,076 918,324 3,523,687
Total liabilities $ 4,615,377 $ 7,295 $ 969,615 $ 3,653,057
105

DISCRETELY PRESENTED COMPONENT UNIT –SCHOOL BOARD

County of Rockbridge, Virginia Exhibit 23Combining Balance SheetDiscretely Presented Component Unit - School Board
School School Permanent TotalOperating Cafeteria Scholarship Governmental
Fund Fund Fund Funds
ASSETSCash and cash equivalents $ 200 $ 103,041 $ 36,938 $ 140,179 Receivables (net of allowance
for uncollectibles):Accounts receivable 51,474 - - 51,474
Due from other governmental units 814,451 - - 814,451 Inventories - 36,137 - 36,137 Prepaid items 586,137 4,614 - 590,751
Total assets $ 1,452,262 $ 143,792 $ 36,938 $ 1,632,992
LIABILITIES AND FUND BALANCESLiabilities:
Accounts payable $ 141,321 $ 633 $ - $ 141,954 Due to primary government 1,310,941 - - 1,310,941
Total liabilities $ 1,452,262 $ 633 $ - $ 1,452,895
Fund balances:Nonspendable:
Inventory $ - $ 36,137 $ - $ 36,137 Prepaid items 586,137 4,614 - 590,751 Endowments - - 36,938 36,938
Committed:Special revenue funds - 102,408 - 102,408
Unassigned (586,137) - - (586,137)Total fund balances $ - $ 143,159 $ 36,938 $ 180,097 Total liabilities and fund balances $ 1,452,262 $ 143,792 $ 36,938 $ 1,632,992
Amounts reported for governmental activities in the statement of net position (Exhibit 1) are different because:
Total fund balances per above $ 180,097
Capital assets used in governmental activities are not financial resources and, therefore,are not reported in the funds. 20,082,635
Other long-term assets are not available to pay for current-period expenditures and,therefore, are deferred in the funds. (2,742,379)
2,327,179
Long-term liabilities, including compensated absences, are not due and payable in the currentperiod and, therefore, are not reported in the funds. (28,499,381)
Net position of governmental activities $ (8,651,849)
June 30, 2016
Pension contributions subsequent to the measurement date will be a reduction to the net pension liability in the next fiscal year and, therefore, are not reported in the funds.
106

County of Rockbridge, Virginia Exhibit 24Combining Statement of Revenues, Expenditures, and Changes in Fund BalancesGovernmental Funds - Discretely Presented Component Unit - School BoardFor the Year Ended June 30, 2016
School School Permanent TotalOperating Cafeteria Scholarship Governmental
Fund Fund Fund FundsREVENUESRevenue from the use of money and property $ - $ 82 $ 15 $ 97 Charges for services 1,434,427 396,890 - 1,831,317 Miscellaneous 82,127 - - 82,127 Intergovernmental:
Local government 12,998,898 - - 12,998,898 Commonwealth 13,499,601 15,489 - 13,515,090 Federal 1,562,501 714,115 - 2,276,616
Total revenues $ 29,577,554 $ 1,126,576 $ 15 $ 30,704,145
EXPENDITURESCurrent:
Education $ 29,575,761 $ 1,166,507 $ 1,000 $ 30,743,268 Debt service:
Interest and other fiscal charges 1,793 - - 1,793 Total expenditures $ 29,577,554 $ 1,166,507 $ 1,000 $ 30,745,061
Excess (deficiency) of revenues over (under)expenditures $ - $ (39,931) $ (985) $ (40,916)
Net change in fund balances $ - $ (39,931) $ (985) $ (40,916) Fund balances - beginning - 183,090 37,923 221,013 Fund balances - ending $ - $ 143,159 $ 36,938 $ 180,097
Amounts reported for governmental activities in the statement of activities (Exhibit 2) are different because:
Net change in fund balances - total governmental funds - per above $ (40,916)
Governmental funds report capital outlays as expenditures. However, in the statement ofactivities the cost of those assets is allocated over their estimated useful lives and reported as depreciation expense. This is the amount by which the depreciation exceeded capital outlays in the current period. 1,199,278
The net effect of various miscellaneous transactions involving capital assets (I.e., sales, trade-ins, anddonations) is to increase (decrease) net assets. (12,800)
Revenues in the statement of activities that do not provide current financial resources arenot reported as revenues in the funds. 2,185,302
Some expenses reported in the statement of activities do not require the use of currentfinancial resources and, therefore are not reported as expenditures in governmental funds. (1,530,549)
Change in net position of governmental activities $ 1,800,315
107

(THIS PAGE LEFT BLANK INTENTIONALLY)

County of Rockbridge, VirginiaSchedule of Revenues, Expenditures, and Changes in Fund Balances - Budget and ActualDiscretely Presented Component Unit - School BoardFor the Year Ended June 30, 2016
Variance withFinal Budget
PositiveOriginal Final Actual (Negative)
REVENUESRevenue from the use of money and property $ - $ - $ - $ - Charges for services 1,400,000 1,400,000 1,434,427 34,427 Miscellaneous 4,625 4,625 82,127 77,502 Intergovernmental:
Local government 13,659,384 14,788,854 12,998,898 (1,789,956) Commonwealth 13,314,796 13,314,796 13,499,601 184,805 Federal - 1,500,000 1,562,501 62,501
Total revenues $ 28,378,805 $ 31,008,275 $ 29,577,554 $ (1,430,721)
EXPENDITURESCurrent:
Education $ 28,374,255 $ 31,003,725 $ 29,575,761 $ 1,427,964 Debt service:
Interest and other fiscal charges 4,550 4,550 1,793 2,757 Total expenditures $ 28,378,805 $ 31,008,275 $ 29,577,554 $ 1,430,721
Excess (deficiency) of revenues over (under)expenditures $ - $ - $ - $ -
Net change in fund balances $ - $ - $ - $ - Fund balances - beginning - - - - Fund balances - ending $ - $ - $ - $ -
School Operating Fund
Budgeted Amounts
108
Exhibit 25
Variance withFinal Budget
PositiveOriginal Final Actual (Negative)
$ 100 $ 100 $ 82 $ (18) 613,917 613,917 396,890 (217,027)
- - - - -
- - - - 19,258 19,258 15,489 (3,769)
575,538 575,538 714,115 138,577 $ 1,208,813 $ 1,208,813 $ 1,126,576 $ (82,237)
$ 1,208,813 $ 1,208,813 $ 1,166,507 $ 42,306
- - - - $ 1,208,813 $ 1,208,813 $ 1,166,507 $ 42,306
$ - $ - $ (39,931) $ (39,931)
$ - $ - $ (39,931) $ (39,931) - - 183,090 183,090
$ - $ - $ 143,159 $ 143,159
School Cafeteria Fund
Budgeted Amounts
109

Exhibit 26County of Rockbridge, VirginiaStatement of Fiduciary Net PositionFiduciary Fund - Discretely Presented Component Unit School Board
ScholarshipPrivate-Purpose
Trust
ASSETSCash and cash equivalents $ 13,791
NET POSITIONHeld in trust for scholarships $ 13,791
June 30, 2016
110

County of Rockbridge, Virginia Exhibit 27Statement of Changes in Fiduciary Net PositionFiduciary Fund - Discretely Presented Component Unit School BoardFor the Year Ended June 30, 2016
ScholarshipPrivate-Purpose
TrustADDITIONSInvestment earnings:
Interest $ 3 Total additions $ 3
Change in net position $ 3
Net position - beginning 13,788 Net position - ending $ 13,791
111

SUPPORTING SCHEDULES

County of Rockbridge, Virginia Schedule 1Schedule of Revenues - Budget and Actual Page 1 of 5Governmental FundsFor the Year Ended June 30, 2016
Variance withFinal Budget -
Original Final PositiveBudget Budget Actual (Negative)
General Fund:Revenue from local sources:
General property taxes:Real property taxes $ 17,686,170 $ 17,686,170 $ 17,681,917 $ (4,253) Real and personal public service corporation taxes 975,000 975,000 1,237,365 262,365 Personal property taxes 4,460,000 4,453,300 5,038,076 584,776 Mobile home taxes 34,400 34,400 43,079 8,679 Machinery and tools taxes 362,000 362,000 388,704 26,704 Penalties 267,000 267,000 293,139 26,139 Interest 160,000 160,000 161,261 1,261
Total general property taxes $ 23,944,570 $ 23,937,870 $ 24,843,541 $ 905,671
Other local taxes:Local sales and use taxes $ 2,450,000 $ 2,450,000 $ 2,720,814 $ 270,814 Consumers' utility taxes 1,527,500 1,527,500 1,488,723 (38,777) Business license taxes 870,000 870,000 849,796 (20,204) Motor vehicle licenses 538,000 537,300 540,217 2,917 Bank stock taxes 95,000 95,000 151,095 56,095 Taxes on recordation and wills 200,000 200,000 181,979 (18,021) Lodging tax 1,417,500 1,417,500 1,636,776 219,276 Meals tax 1,280,000 1,280,000 1,439,665 159,665
Total other local taxes $ 8,378,000 $ 8,377,300 $ 9,009,065 $ 631,765
Permits, privilege fees, and regulatory licenses:Animal licenses $ 10,500 $ 10,500 $ 11,589 $ 1,089 Land use application fees 1,800 1,800 1,580 (220) Transfer fees 720 720 765 45 Permits and other licenses 196,000 196,000 261,126 65,126
Total permits, privilege fees, and regulatory licenses $ 209,020 $ 209,020 $ 275,060 $ 66,040
Fines and forfeitures:Court fines and forfeitures $ 400,550 $ 400,550 $ 445,370 $ 44,820
Revenue from use of money and property:Revenue from use of money $ 24,000 $ 24,000 $ 74,733 $ 50,733 Revenue from use of property 29,046 29,046 37,424 8,378
Total revenue from use of money and property $ 53,046 $ 53,046 $ 112,157 $ 59,111
Charges for services:Sheriff's fees $ 10,000 $ 10,000 $ 11,806 $ 1,806 Charges for courthouse maintenance 57,000 57,000 55,654 (1,346) Courthouse security fees 205,000 205,000 200,075 (4,925) Charges for Commonwealth's Attorney 4,000 4,000 5,968 1,968 Charges for garage services 615,000 615,000 431,026 (183,974) Charges for sanitation and waste removal 516,500 516,500 621,022 104,522 Charges for parks and recreation 88,650 88,650 90,846 2,196 Erosion Sediment Control Fee 30,000 30,000 27,745 (2,255) DNA Fee 200 200 446 246
Total charges for services $ 1,526,350 $ 1,526,350 $ 1,444,588 $ (81,762)
Fund, Major and Minor Revenue Source
112

County of Rockbridge, Virginia Schedule 1Schedule of Revenues - Budget and Actual Page 2 of 5Governmental FundsFor the Year Ended June 30, 2016 (Continued)
Variance withFinal Budget -
Original Final PositiveBudget Budget Actual (Negative)
General Fund: (Continued)Revenue from local sources: (Continued)
Miscellaneous:Miscellaneous $ 788,386 $ 788,386 $ 833,978 $ 45,592
Total miscellaneous $ 788,386 $ 788,386 $ 833,978 $ 45,592
Recovered costs:Lexington contribution-court building $ 8,400 $ 8,400 $ 10,107 $ 1,707 Joint services City of Lexington 190,000 190,000 210,513 20,513 Charges for hazard materials cleanup 5,000 5,000 15,911 10,911 Fiscal agent fees 48,888 48,888 50,888 2,000 Other recovered costs 118,771 118,771 182,316 63,545
Total recovered costs $ 371,059 $ 371,059 $ 469,735 $ 98,676
Total revenue from local sources $ 35,670,981 $ 35,663,581 $ 37,433,494 $ 1,769,913
Intergovernmental:Revenue from the Commonwealth:
Noncategorical aid:Motor vehicle carriers' tax $ 74,000 $ 74,000 $ 65,937 $ (8,063) Mobile home titling tax 15,000 15,000 19,179 4,179 Timber sales 2,000 2,000 1,800 (200) Motor vehicle rental tax 46,000 46,000 54,194 8,194 State recordation tax 60,000 60,000 51,390 (8,610) Personal property tax relief funds 2,449,624 2,449,624 2,449,624 -
Total noncategorical aid $ 2,646,624 $ 2,646,624 $ 2,642,124 $ (4,500)
Categorical aid:Shared expenses:
Commonwealth's attorney $ 353,633 $ 353,633 $ 350,733 $ (2,900) Sheriff 1,157,633 1,157,633 1,126,343 (31,290) Commissioner of revenue 105,528 105,528 104,201 (1,327) Treasurer 87,212 87,212 86,279 (933) Registrar/electoral board 34,680 34,680 46,053 11,373 Clerk of the Circuit Court 263,630 263,630 269,857 6,227 Total shared expenses $ 2,002,316 $ 2,002,316 $ 1,983,466 $ (18,850)
Other categorical aid:Emergency medical services $ 7,500 $ 7,500 $ 7,481 $ (19) Victim-witness grant 30,840 30,840 31,765 925 Fire program 55,000 55,000 64,592 9,592 NBSWCD support 135,051 135,051 140,609 5,558 Four for life 23,400 23,400 24,379 979 Rental assistance 43,000 43,000 50,759 7,759 Other 74,087 74,087 20,408 (53,679) Total other categorical aid $ 368,878 $ 368,878 $ 339,993 $ (28,885)
Total categorical aid $ 2,371,194 $ 2,371,194 $ 2,323,459 $ (47,735)
Total revenue from the Commonwealth $ 5,017,818 $ 5,017,818 $ 4,965,583 $ (52,235)
Fund, Major and Minor Revenue Source
113

County of Rockbridge, Virginia Schedule 1Schedule of Revenues - Budget and Actual Page 3 of 5Governmental FundsFor the Year Ended June 30, 2016 (Continued)
Variance withFinal Budget -
Original Final PositiveBudget Budget Actual (Negative)
General Fund: (Continued)Intergovernmental: (Continued)Revenue from the federal government:
Noncategorical aid:Payments in lieu of taxes $ 102,000 $ 102,000 $ 107,685 $ 5,685
Categorical aid:Ground transportation grant $ - $ - $ 20,015 $ 20,015 Domestic violence - - 37,826 37,826 Other 1,900 1,900 42,387 40,487
Total categorical aid $ 1,900 $ 1,900 $ 100,228 $ 98,328
Total revenue from the federal government $ 103,900 $ 103,900 $ 207,913 $ 104,013
Total General Fund $ 40,792,699 $ 40,785,299 $ 42,606,990 $ 1,821,691
Capital Projects Funds:Other Capital Projects Fund:Revenue from local sources:
Revenue from use of money and property:Revenue from the use of property $ - $ - $ 860 $ 860
Total School Capital Projects Fund $ - $ - $ 860 $ 860
Total Primary Government $ 40,792,699 $ 40,785,299 $ 42,607,850 $ 1,822,551
Fund, Major and Minor Revenue Source
114

County of Rockbridge, Virginia Schedule 1Schedule of Revenues - Budget and Actual Page 4 of 5Governmental FundsFor the Year Ended June 30, 2016 (Continued)
Variance withFinal Budget -
Original Final PositiveBudget Budget Actual (Negative)
Discretely Presented Component Unit - School Board:School Operating Fund:Revenue from local sources:
Charges for services:Tuition -private day school $ - $ - $ 8,300 $ 8,300 Tuition-City of Lexington, Buena Vista 1,400,000 1,400,000 1,426,127 26,127
Total charges for services $ 1,400,000 $ 1,400,000 $ 1,434,427 $ 34,427
Miscellaneous:Other miscellaneous $ 4,625 $ 4,625 $ 82,127 $ 77,502
Total revenue from local sources $ 1,404,625 $ 1,404,625 $ 1,516,554 $ 111,929
Intergovernmental:Revenues from local governments:
Contribution from County of Rockbridge, Virginia $ 13,659,384 $ 14,788,854 $ 12,998,898 $ (1,789,956) Total revenues from local governments $ 13,659,384 $ 14,788,854 $ 12,998,898 $ (1,789,956)
Revenue from the Commonwealth:Categorical aid:
Share of state sales tax $ 3,033,178 $ 3,033,178 $ 3,049,350 $ 16,172 Basic school aid 6,771,665 6,771,665 6,808,614 36,949 Remedial summer education - - 6,606 6,606 Regular foster care - - 5,322 5,322 Gifted and talented 62,670 62,670 63,072 402 Remedial education 194,678 194,678 195,927 1,249 Special education 801,379 801,379 806,520 5,141 Textbook payment 128,301 128,301 129,124 823 Vocational standards of quality payments 176,010 176,010 177,139 1,129 Social security fringe benefits 380,022 380,022 382,459 2,437 Retirement fringe benefits 752,043 752,043 756,867 4,824 Early reading intervention 41,695 41,695 40,027 (1,668) Dropout prevention - - 20,727 20,727 Homebound education 12,823 12,823 11,911 (912) Vocational education other 42,931 42,931 48,616 5,685 At risk payments 168,808 168,808 169,958 1,150 Standards of learning algebra readiness 22,268 22,268 22,184 (84) Reduced class size 248,911 248,911 242,068 (6,843) Group life insurance 24,001 24,001 24,155 154 Technology grant 206,000 206,000 206,000 - At risk four-year olds 94,680 94,680 94,680 - Compensation supplement 111,850 111,850 112,527 677 English as a second language 17,307 17,307 16,654 (653) Adult Ed GED 23,576 23,576 28,461 4,885 Youth development academy - - 67,817 67,817 Other state funds - - 12,816 12,816
Total categorical aid $ 13,314,796 $ 13,314,796 $ 13,499,601 $ 184,805 Total revenue from the Commonwealth $ 13,314,796 $ 13,314,796 $ 13,499,601 $ 184,805
Fund, Major and Minor Revenue Source
115
County of Rockbridge, Virginia Schedule 1Schedule of Revenues - Budget and Actual Page 5 of 5Governmental FundsFor the Year Ended June 30, 2016 (Continued)
Variance withFinal Budget -
Original Final PositiveBudget Budget Actual (Negative)
Discretely Presented Component Unit - School Board: (Continued)School Operating Fund: (Continued)Intergovernmental: (Continued)Revenue from the federal government:
Categorical aid:Federal land use $ - $ 68,377 $ 71,226 $ 2,849 Adult literacy - 123,093 128,222 5,129 Title I - 473,989 493,739 19,750 Title VI-B, special education flow-through - 574,821 598,772 23,951 Vocational education - 45,022 46,898 1,876 Title VI-B, special education pre-school - 13,574 14,140 566 Title II, Part A - 63,442 66,085 2,643 Twenty-first century community learning centers - 101,788 106,029 4,241 Total action against poverty - 35,186 36,652 1,466AP Test fee - 708 738 30
Total categorical aid $ - $ 1,500,000 $ 1,562,501 $ 62,501
Total revenue from the federal government $ - $ 1,500,000 $ 1,562,501 $ 62,501
Total School Operating Fund $ 28,378,805 $ 31,008,275 $ 29,577,554 $ (1,430,721)
School Cafeteria Fund:Revenue from local sources:
Revenue from use of money and property:Revenue from the use of money $ 100 $ 100 $ 82 $ (18)
Charges for services:Cafeteria sales $ 613,917 $ 613,917 $ 396,890 $ (217,027)
Total revenue from local sources $ 614,017 $ 614,017 $ 396,972 $ (217,045)
Intergovernmental:Revenue from the Commonwealth:
Categorical aid:School food program grant $ 19,258 $ 19,258 $ 15,489 $ (3,769)
Revenue from the federal government:Categorical aid:
School food program grant $ 575,538 $ 575,538 $ 631,676 $ 56,138 Commodities - - 78,148 78,148 Schoo food equipment grant - - 4,291 4,291
Total categorical aid $ 575,538 $ 575,538 $ 714,115 $ 138,577
Total revenue from the federal government $ 575,538 $ 575,538 $ 714,115 $ 138,577
Total School Cafeteria Fund $ 1,208,813 $ 1,208,813 $ 1,126,576 $ (82,237)
Total Discretely Presented Component Unit - School Board $ 29,587,618 $ 32,217,088 $ 30,704,130 $ (1,512,958)
Fund, Major and Minor Revenue Source
116

County of Rockbridge, Virginia Schedule 2Schedule of Expenditures - Budget and Actual Page 1 of 4Governmental FundsFor the Year Ended June 30, 2016
Variance withFinal Budget -
Original Final PositiveBudget Budget Actual (Negative)
General Fund:General government administration:
Legislative:Board of Supervisors $ 103,498 $ 146,741 $ 123,612 $ 23,129
General and financial administration:County administrator $ 211,244 $ 209,799 $ 199,759 $ 10,040 Legal services 169,128 169,128 162,362 6,766 Commissioner of the revenue 274,983 274,983 261,973 13,010 Reassessment 232,500 269,895 303,308 (33,413) Land use 1,200 1,200 15 1,185 Treasurer 340,343 340,343 311,773 28,570 Central accounting 92,915 92,915 90,320 2,595 Human resources 71,020 79,969 78,194 1,775 Data processing 152,685 155,585 144,323 11,262 Director of fiscal services 264,537 343,872 254,314 89,558 Central stores - - 40,567 (40,567)
Total general and financial administration $ 1,810,555 $ 1,937,689 $ 1,846,908 $ 90,781
Board of elections:Electoral board and officials $ 157,261 $ 154,361 $ 147,063 $ 7,298
Total board of elections $ 157,261 $ 154,361 $ 147,063 $ 7,298
Total general government administration $ 2,071,314 $ 2,238,791 $ 2,117,583 $ 121,208
Judicial administration:Courts:
Circuit court $ 66,607 $ 66,607 $ 62,546 $ 4,061 County court 21,325 22,572 21,104 1,468 Victim witness coordinator 59,227 59,227 58,515 712 Clerk of the circuit court 426,146 432,165 414,189 17,976 Courthouse security 411,018 455,870 442,733 13,137
Total courts $ 984,323 $ 1,036,441 $ 999,087 $ 37,354
Commonwealth's attorney:Commonwealth's attorney $ 476,616 $ 476,616 $ 473,345 $ 3,271
Total Commonwealth's attorney $ 476,616 $ 476,616 $ 473,345 $ 3,271
Total judicial administration $ 1,460,939 $ 1,513,057 $ 1,472,432 $ 40,625
Public safety:Law enforcement and traffic control:
Sheriff $ 2,710,003 $ 2,802,978 $ 2,743,394 $ 59,584
Fire and rescue services:Fire prevention $ 1,137,824 $ 1,129,001 $ 977,375 $ 151,626 Emergency management 61,762 69,276 65,234 4,042 Rescue services 1,287,251 1,292,652 1,152,421 140,231 Consolidated dispatch 1,169,788 1,088,839 1,159,034 (70,195)
Total fire and rescue services $ 3,656,625 $ 3,579,768 $ 3,354,064 $ 225,704
Correction and detention:Contribution to Component Unit Jail Commission $ 854,012 $ 930,962 $ 866,748 $ 64,214 Probation office 5,950 5,950 5,903 47 Juvenile probation and detention 25,177 25,177 25,176 1
Total correction and detention $ 885,139 $ 962,089 $ 897,827 $ 64,262
Fund, Function, Activity and Elements
117

County of Rockbridge, Virginia Schedule 2Schedule of Expenditures - Budget and Actual Page 2 of 4Governmental FundsFor the Year Ended June 30, 2016 (Continued)
Variance withFinal Budget -
Original Final PositiveBudget Budget Actual (Negative)
General Fund: (Continued)Public safety: (Continued)
Inspections:Building $ 233,717 $ 234,268 $ 214,904 $ 19,364
Other protection:Animal control $ 20,402 $ 20,402 $ 19,810 $ 592 Other protective services 173,165 173,165 173,042 123
Total other protection $ 193,567 $ 193,567 $ 192,852 $ 715
Total public safety $ 7,679,051 $ 7,772,670 $ 7,403,041 $ 369,629
Public works:Maintenance of highways, streets, bridges and sidewalks:
Road maintenance $ 8,900 $ 10,001 $ 10,083 $ (82) Total maintenance of highways, streets, bridges & sidewalks $ 8,900 $ 10,001 $ 10,083 $ (82)
Sanitation and waste removal:County pickup $ 1,875,900 $ 1,882,475 $ 1,915,944 $ (33,469) Special enforcement-litter control 117,175 114,927 102,810 12,117
Total sanitation and waste removal $ 1,993,075 $ 1,997,402 $ 2,018,754 $ (21,352)
Maintenance of general buildings and grounds:General properties $ 649,888 $ 689,808 $ 548,944 $ 140,864 Central garage 1,048,905 936,720 734,819 201,901
Total maintenance of general buildings and grounds $ 1,698,793 $ 1,626,528 $ 1,283,763 $ 342,765
Total public works $ 3,700,768 $ 3,633,931 $ 3,312,600 $ 321,331
Health and welfare:Health:
Supplement of local health department $ 195,323 $ 193,247 $ 168,638 $ 24,609 Other contributions 81,177 82,773 82,773 -
Total health $ 276,500 $ 276,020 $ 251,411 $ 24,609
Mental health and mental retardation:Community services board $ 168,201 $ 168,201 $ 168,201 $ -
Welfare:Contribution to Rockbridge Area Social Services Board $ 783,875 $ 785,969 $ 960,367 $ (174,398) Other public assistance and welfare administration 45,356 51,368 51,217 151 Tax relief for the elderly - - 208,050 (208,050)
Total welfare $ 829,231 $ 837,337 $ 1,219,634 $ (382,297)
Total health and welfare $ 1,273,932 $ 1,281,558 $ 1,639,246 $ (357,688)
Education:Other instructional costs:
Community colleges/other programs $ 68,384 $ 83,384 $ 83,384 $ - Contribution to County School Board 13,654,807 13,654,807 12,998,898 655,909
Total education $ 13,723,191 $ 13,738,191 $ 13,082,282 $ 655,909
Fund, Function, Activity and Elements
118

County of Rockbridge, Virginia Schedule 2Schedule of Expenditures - Budget and Actual Page 3 of 4Governmental FundsFor the Year Ended June 30, 2016 (Continued)
Variance withFinal Budget -
Original Final PositiveBudget Budget Actual (Negative)
General Fund: (Continued)Parks, recreation, and cultural:
Parks and recreation:Parks and recreation $ 695,377 $ 715,859 $ 699,838 $ 16,021 Preschool 114,874 118,631 118,017 614
Total parks and recreation $ 810,251 $ 834,490 $ 817,855 $ 16,635 Library:
Contribution to county libraries $ 609,799 $ 609,799 $ 609,799 $ -
Total parks, recreation, and cultural $ 1,420,050 $ 1,444,289 $ 1,427,654 $ 16,635 Community development:
Planning and community development:Planning and zoning $ 307,472 $ 307,425 $ 290,742 $ 16,683 Geographic information system 171,375 171,270 163,353 7,917 Rental assistance 81,117 82,068 80,338 1,730 Economic development 1,140,273 1,255,280 1,084,732 170,548 Other community development 773,065 773,067 773,065 2 Contribution to Public Service Authority 426,236 422,340 117,108 305,232
Total planning and community development $ 2,899,538 $ 3,011,450 $ 2,509,338 $ 502,112 Environmental management:
NBSWCD support $ 149,972 $ 156,617 $ 156,438 $ 179 Other environmental management 87,179 89,714 77,813 11,901
Total environmental management $ 237,151 $ 246,331 $ 234,251 $ 12,080 Cooperative extension program:
Extension office $ 86,327 $ 86,327 $ 64,862 $ 21,465 Total community development $ 3,223,016 $ 3,344,108 $ 2,808,451 $ 535,657
Nondepartmental:Miscellaneous $ 64,525 $ 49,484 $ 10,839 $ 38,645 Annexation payment 1,770,000 1,770,000 1,769,854 146
Total nondepartmental $ 1,834,525 $ 1,819,484 $ 1,780,693 $ 38,791 Debt service:
Principal retirement $ 2,502,117 $ 2,502,118 $ 2,502,118 $ - Interest and other fiscal charges 2,517,280 2,517,249 2,746,012 (228,763)
Total debt service $ 5,019,397 $ 5,019,367 $ 5,248,130 $ (228,763) Total General Fund $ 41,406,183 $ 41,805,446 $ 40,292,112 $ 1,513,334
Capital Projects Funds:Other Capital Projects Fund:
Capital projects expenditures:Capital projects $ - $ 64,975 $ 9,825 $ 55,150
Total capital projects $ - $ 64,975 $ 9,825 $ 55,150 Total School Capital Projects Fund $ - $ 64,975 $ 9,825 $ 55,150
County Capital Projects Fund:Capital projects expenditures:
Capital projects expenditures $ - $ 423,022 $ 477,000 $ (53,978) Total capital projects $ - $ 423,022 $ 477,000 $ (53,978)
Total Construction Project Fund $ - $ 423,022 $ 477,000 $ (53,978)
Total Primary Government $ 41,406,183 $ 42,293,443 $ 40,778,937 $ 1,514,506
Fund, Function, Activity and Elements
119

County of Rockbridge, Virginia Schedule 2Schedule of Expenditures - Budget and Actual Page 4 of 4Governmental FundsFor the Year Ended June 30, 2016 (Continued)
Variance withFinal Budget -
Original Final PositiveBudget Budget Actual (Negative)
Discretely Presented Component Unit - School Board:School Operating Fund:Education:
Administration of schools:Instruction $ 20,581,527 $ 23,145,516 $ 22,132,474 $ 1,013,042 Administration, attendance and health 1,326,508 1,360,508 1,304,329 56,179 Pupil transportation 2,277,932 2,277,932 2,214,277 63,655 Operation and maintenance 3,094,061 3,094,061 3,006,810 87,251 Facilities 1,094,227 1,125,708 917,871 207,837
Total education $ 28,374,255 $ 31,003,725 $ 29,575,761 $ 1,427,964
Debt service:Interest and other fiscal charges $ 4,550 $ 4,550 $ 1,793 $ 2,757
Total debt service $ 4,550 $ 4,550 $ 1,793 $ 2,757
Total School Operating Fund $ 28,378,805 $ 31,008,275 $ 29,577,554 $ 1,430,721
School Cafeteria Fund:Education:
School food services:Administration of school food program $ 1,208,813 $ 1,208,813 $ 1,166,507 $ 42,306
Total School Cafeteria Fund $ 1,208,813 $ 1,208,813 $ 1,166,507 $ 42,306
Total Discretely Presented Component Unit - School Board $ 29,587,618 $ 32,217,088 $ 30,744,061 $ 1,473,027
Fund, Function, Activity and Elements
120

STATISTICAL SECTION

Contents Tables
Financial Trends
These tables contain trend information to help the reader understand howthe County's financial performance and well-being have changed over time.
1-5
Revenue Capacity
These tables contain information to help the reader assess the factorsaffecting the County's ability to generate its property and sales taxes.
6-10
Debt Capacity
These tables present information to help the reader assess the affordabilityof the County's current levels of outstanding debt and the County's ability to issue additional debt in the future.
11-13
Demographic and Economic Information
These tables offer demographic and economic indicators to help the readerunderstand the environment within which the County's financial activitiestake place and to help make comparisons over time and with othergovernments. 14-15
Operating Information
These tables contain information about the County's operations andresources to help the reader understand how the County's financialinformation relate to the services the County provides and the activities itperforms.
16-19
Sources:
STATISTICAL SECTION
Unless otherwise noted, the information in these tables is derived from the comprehensiveannual financial reports for the relevant year.

COUNTY OF ROCKBRIDGE, VIRGINIA
Net Position by ComponentLast Ten Fiscal Years(accrual basis of accounting)
2007 2008 2009 2010Governmental activities Net investment in capital assets $ 4,760,174 $ 9,678,247 $ 12,942,462 $ 12,355,645 Restricted 1,990,486 1,441,943 935,021 935,021 Unrestricted 12,595,832 13,004,039 17,260,280 16,443,020
Total governmental activities net position $ 19,346,492 $ 24,124,229 $ 31,137,763 $ 29,733,686
Business-type activities Net investment in capital assets $ 1,458,874 $ 1,373,896 $ 1,421,280 $ 1,427,172 Restricted - - - - Unrestricted 400,752 575,480 875,031 1,201,435
Total business-type activities net position $ 1,859,626 $ 1,949,376 $ 2,296,311 $ 2,628,607
Primary government Net investment in capital assets $ 6,219,048 $ 11,052,143 $ 14,363,742 $ 13,782,817 Restricted 1,990,486 1,441,943 935,021 935,021 Unrestricted 12,996,584 13,579,519 18,135,311 17,644,455
Total primary government net position $ 21,206,118 $ 26,073,605 $ 33,434,074 $ 32,362,293
Fiscal Year
121

Table 1
2011 2012 2013 2014 2015 2016
$ 11,866,668 $ 12,943,272 $ 10,937,946 $ 14,100,533 $ 14,218,888 $ 13,222,296960,040 1,002,603 5,459,836 1,332,295 1,190,894 232,779
17,653,362 17,197,916 21,297,930 21,113,574 20,308,715 23,911,471
$ 30,480,070 $ 31,143,791 $ 37,695,712 $ 36,546,402 $ 35,718,497 $ 37,366,546
$ 1,338,861 $ 1,086,965 $ 1,397,575 $ 1,712,920 $ 2,166,784 $ 2,592,481 - 1,176,854 1,002,249 1,002,249 1,210,738 1,423,596
1,570,098 881,152 924,040 642,159 733,351 366,856
$ 2,908,959 $ 3,144,971 $ 3,323,864 $ 3,357,328 $ 4,110,873 $ 4,382,933
$ 13,205,529 $ 14,030,237 $ 12,335,521 $ 15,813,453 $ 16,385,672 $ 15,814,777960,040 2,179,457 6,462,085 2,334,544 2,401,632 1,656,375
19,223,460 18,079,068 22,221,970 21,755,733 21,042,066 24,278,327
$ 33,389,029 $ 34,288,762 $ 41,019,576 $ 39,903,730 $ 39,829,370 $ 41,749,479
Fiscal Year
122

COUNTY OF ROCKBRIDGE, VIRGINIA
Changes in Net PositionLast Ten Fiscal Years(accrual basis of accounting)
2007 2008 2009 2010Expenses Governmental activities: General government administration $ 1,516,336 $ 1,398,329 $ 2,170,904 $ 2,332,278 Judicial administration 573,554 4,699,190 2,725,181 1,211,172 Public safety 4,518,686 4,658,008 4,926,453 5,364,665 Public works 2,547,356 3,001,287 2,856,775 3,040,215 Health and welfare 1,429,744 1,471,189 1,527,149 1,459,423 Education 12,426,048 14,126,792 14,178,044 14,437,698 Parks, recreation and cultural 1,131,484 1,236,686 1,358,529 1,361,665 Community development 2,250,998 1,699,223 1,831,694 2,109,085 Interest on long-term debt 1,469,578 2,087,610 1,733,021 1,932,209 Nondepartmental 2,035,190 1,698,751 2,060,962 1,944,765
Total governmental activities expenses $ 29,898,974 $ 36,077,065 $ 35,368,712 $ 35,193,175
Business-type activities: Landfill $ 1,336,355 $ 1,215,648 $ 1,058,560 $ 969,972 Recycling 871,600 1,059,036 1,001,618 954,393
Total business-type activities expenses $ 2,207,955 $ 2,274,684 $ 2,060,178 $ 1,924,365
Total primary government expenses $ 32,106,929 $ 38,351,749 $ 37,428,890 $ 37,117,540
Program Revenues Governmental activities: Charges for services: General government administration $ 17,550 $ 23,400 $ 35,100 $ 11,700 Judicial administration 264,441 443,137 388,462 346,456 Public safety 13,424 17,878 16,838 15,584 Public works 793,320 1,153,570 1,028,928 1,154,832 Parks, recreation and cultural 84,576 113,061 84,892 90,891 Community development 390,853 350,169 190,262 204,569 Operating grants and contributions 2,550,447 2,416,922 2,398,519 2,165,017 Capital grants and contributions 53,776 46,189 4,260,000 -
Total governmental activities program revenues $ 4,168,387 $ 4,564,326 $ 8,403,001 $ 3,989,049
Fiscal Year
123

Table 2
2011 2012 2013 2014 2015 2016
$ 2,333,275 $ 2,335,818 $ 2,011,030 $ 2,497,472 $ 2,294,804 $ 2,888,023 1,186,366 1,021,390 1,267,789 1,282,388 1,283,097 1,363,768 5,160,253 5,406,165 5,700,091 7,551,214 6,492,719 7,165,176 2,824,461 2,949,751 3,052,847 2,522,400 2,879,018 3,257,681 1,498,930 1,505,526 1,414,009 1,411,742 1,330,106 1,641,027
13,085,583 16,631,591 16,126,417 14,081,158 14,980,144 15,794,029 1,267,868 1,299,526 1,442,669 1,246,800 1,289,331 1,431,206 2,585,270 2,369,189 2,246,495 2,635,939 3,171,409 2,933,943 1,862,608 1,730,059 1,718,759 1,749,577 1,757,409 1,780,693 1,747,190 1,969,401 2,833,978 2,513,613 2,449,604 2,488,358
$ 33,551,804 $ 37,218,416 $ 37,814,084 $ 37,492,303 $ 37,927,641 $ 40,743,904
$ 862,292 $ 825,011 $ 960,797 $ 1,207,978 $ 962,151 $ 1,183,842 983,111 1,159,742 1,156,498 461,888 473,195 463,929
$ 1,845,403 $ 1,984,753 $ 2,117,295 $ 1,669,866 $ 1,435,346 $ 1,647,771
$ 35,397,207 $ 39,203,169 $ 39,931,379 $ 39,162,169 $ 39,362,987 $ 42,391,675
$ 23,400 $ 23,400 $ 23,400 $ - $ - $ - 437,863 510,896 457,916 709,282 765,411 707,067
5,840 6,317 22,078 10,282 21,465 23,841 958,805 1,236,913 1,122,809 1,180,837 1,043,742 1,052,048
96,748 95,487 85,038 84,607 80,237 90,846 181,875 192,207 178,734 236,124 493,599 291,216
2,426,783 2,257,672 2,412,618 2,438,107 2,424,462 2,381,742 303,653 1,993,245 5,816,685 598,412 273,913 41,945
$ 4,434,967 $ 6,316,137 $ 10,119,278 $ 5,257,651 $ 5,102,829 $ 4,588,705
Fiscal Year
124

COUNTY OF ROCKBRIDGE, VIRGINIA
Changes in Net PositionLast Ten Fiscal Years(accrual basis of accounting)
2007 2008 2009 2010 Business-type activities: Charges for services: Landfill $ 1,261,870 $ 1,184,892 $ 1,266,573 $ 1,213,411 Recycling 85,533 189,307 101,959 104,549 Operating grants and contributions 19,626 23,798 23,013 18,913
Total business-type activities program revenues $ 1,367,029 $ 1,397,997 $ 1,391,545 $ 1,336,873
Total primary government program revenues $ 5,535,416 $ 5,962,323 $ 9,794,546 $ 5,325,922
Net (expense) / revenue Governmental activities $ (25,730,587) $ (31,512,739) $ (26,965,711) $ (31,204,126) Business-type activities (840,926) (876,687) (668,633) (587,492)
Total primary government net expense $ (26,571,513) $ (32,389,426) $ (27,634,344) $ (31,791,618)
General Revenues and Other Changes in Net Position Governmental activities: Taxes Property taxes $ 17,743,425 $ 19,225,297 $ 20,100,078 $ 19,737,346 Local sales and use taxes 2,486,192 2,484,176 2,337,807 2,238,747 Motor vehicle licenses taxes 567,994 565,841 556,865 547,407 Consumer utility taxes 1,326,139 1,616,873 1,529,343 1,538,143 Business licenses taxes 740,306 831,582 855,953 723,687 Other local taxes 3,057,021 2,777,979 2,579,150 2,662,945 Unrestricted grants and contributions 2,822,212 2,669,612 2,895,242 2,766,489 Unrestricted revenues from use of money and property 1,467,557 1,461,742 462,662 240,641 Miscellaneous 1,962,010 8,211,798 3,643,804 272,957 Transfers (767,116) (890,124) (981,659) (948,313)
Total governmental activities $ 31,405,740 $ 38,954,776 $ 33,979,245 $ 29,780,049
Business-type activities: Unrestricted revenues from use of money and property $ 143,976 $ 76,310 $ 32,743 $ 6,505 Miscellaneous - 3 1,166 117 Transfers 767,116 890,124 981,659 948,313
Total business-type activities $ 911,092 $ 966,437 $ 1,015,568 $ 954,935
Total primary government $ 32,316,832 $ 39,921,213 $ 34,994,813 $ 30,734,984
Change in Net Position Governmental activities $ 5,675,153 $ 7,442,037 $ 7,013,534 $ (1,424,077) Business-type activities 70,166 89,750 346,935 367,443
Total primary government $ 5,745,319 $ 7,531,787 $ 7,360,469 $ (1,056,634)
Fiscal Year
125

Table 2
2011 2012 2013 2014 2015 2016
$ 1,116,260 $ 1,063,507 $ 1,034,968 $ 936,243 $ 1,578,750 $ 2,098,447 77,872 23,714 - - - - 21,503 18,461 26,161 23,076 23,046 23,300
$ 1,215,635 $ 1,105,682 $ 1,061,129 $ 959,319 $ 1,601,796 $ 2,121,747
$ 5,650,602 $ 7,421,819 $ 11,180,407 $ 6,216,970 $ 6,704,625 $ 6,710,452
$ (29,116,837) $ (30,902,279) $ (27,694,806) $ (32,234,652) $ (32,824,812) $ (36,155,199) (629,768) (879,071) (1,056,166) (710,547) 166,450 473,976
$ (29,746,605) $ (31,781,350) $ (28,750,972) $ (32,945,199) $ (32,658,362) $ (35,681,223)
$ 19,903,929 $ 20,241,098 $ 22,519,602 $ 23,009,779 $ 24,210,212 $ 24,775,816 2,226,190 2,292,809 2,392,591 2,439,476 2,561,164 2,720,814
542,034 537,280 537,855 535,776 531,093 540,217 1,541,967 1,520,806 1,522,050 1,514,494 1,509,304 1,488,723
775,021 851,571 913,827 882,478 873,386 849,796 2,642,418 2,687,544 2,791,478 2,922,491 3,144,747 3,409,515 2,706,042 2,761,428 2,741,009 2,760,419 2,732,823 2,749,809
145,518 74,448 78,229 58,003 57,337 113,017 239,873 1,710,031 743,278 1,213,388 943,636 833,978
(859,771) (1,111,015) (1,234,972) (735,930) (909,606) (449,951)
$ 29,863,221 $ 31,566,000 $ 33,004,947 $ 34,600,374 $ 35,654,096 $ 37,031,734
$ 4,938 $ 4,000 $ 4,676 $ 3,018 $ 3,413 $ 11,162 10,264 68 3,815 5,063 8,927 25,869
859,771 1,111,015 1,234,972 735,930 909,606 449,951
$ 874,973 $ 1,115,083 $ 1,243,463 $ 744,011 $ 921,946 $ 486,982
$ 30,738,194 $ 32,681,083 $ 34,248,410 $ 35,344,385 $ 36,576,042 $ 37,518,716
$ 746,384 $ 663,721 $ 5,310,141 $ 2,365,722 $ 2,829,284 $ 876,535 245,205 236,012 187,297 33,464 1,088,396 960,958
$ 991,589 $ 899,733 $ 5,497,438 $ 2,399,186 $ 3,917,680 $ 1,837,493
Fiscal Year
126

COUNTY OF ROCKBRIDGE, VIRGINIA Table 3
Governmental Activities Tax Revenues by SourceLast Ten Fiscal Years(accrual basis of accounting)
MotorLocal sales Consumer Vehicle Record- Business
Fiscal Property and use Utility License ation and LicenseYear Tax Tax Tax Tax Wills Tax Tax Total
2016 $ 24,775,816 $ 2,720,814 $ 1,488,723 $ 540,217 $ 181,979 $ 849,796 $ 30,557,345 2015 24,210,212 2,561,164 1,509,304 531,093 184,098 873,386 29,869,257 2014 23,009,779 2,439,476 1,514,494 535,776 208,339 882,478 28,590,342 2013 22,519,602 2,392,591 1,522,050 537,855 191,861 913,827 28,077,786 2012 20,241,098 2,292,809 1,520,806 537,280 199,362 851,571 25,642,926 2011 19,903,929 2,226,190 1,541,967 542,034 182,274 775,021 25,171,415 2010 19,737,346 2,238,747 1,538,143 547,407 192,183 723,687 24,977,513 2009 20,100,078 2,337,807 1,529,343 556,865 208,782 855,953 25,588,828 2008 19,225,297 2,484,176 1,616,873 565,841 298,742 831,582 25,022,511 2007 17,743,425 2,486,192 1,326,139 567,994 335,290 740,306 23,199,346
127

(THIS PAGE LEFT BLANK INTENTIONALLY)

COUNTY OF ROCKBRIDGE, VIRGINIA
Fund Balances of Governmental FundsLast Ten Fiscal Years(modified accrual basis of accounting)
2007 2008 2009 2010 2011 (1)
General fund Reserved $ 1,549,574 $ 1,404,760 $ 1,863,469 $ 2,531,217 $ - Unreserved 13,409,914 14,292,634 15,037,799 13,602,863 - Nonspendable - - - - 102,799 Restricted - - - - 1,018,434 Committed - - - - 856,172 Assigned - - - - 1,259,523 Unassigned - - - - 14,124,282
Total general fund $ 14,959,488 $ 15,697,394 $ 16,901,268 $ 16,134,080 $ 17,361,210
All other governmental funds Restricted $ - $ - $ - $ - $ - Assigned, reported in:
Capital projects funds - - - - 278,115 Unassigned, reported in: Special revenue funds - - - - (90,345) Capital projects funds 10,582,108 6,620,625 535,995 314,661 -
Total all other governmental funds $ 10,582,108 $ 6,620,625 $ 535,995 $ 314,661 $ 187,770
(1) The County implemented GASB 54 in fiscal year 2011, the fund balances for previous years have not been restated per GASB 54 classifications.
Fiscal Year
128

Table 4
2012 2013 2014 2015 2016
$ - $ - $ - $ - $ - - - - - -
121,348 116,671 112,861 111,886 104,915 1,002,603 1,075,361 1,000,439 988,933 63,889
646,172 707,419 385,973 175,973 - 2,061,918 1,934,997 2,194,043 2,004,485 2,021,502
15,284,213 17,219,353 18,317,586 21,085,055 20,713,488
$ 19,116,254 $ 21,053,801 $ 22,010,902 $ 24,366,332 $ 22,903,794
$ - $ 4,384,475 $ 331,856 $ 201,961 $ 168,890
5,434,345 254,255 260,564 232,578 4,119,737
(947,976) (229,603) - - - - - - - -
$ 4,486,369 $ 4,409,127 $ 592,420 $ 434,539 $ 4,288,627
Fiscal Year
129
COUNTY OF ROCKBRIDGE, VIRGINIA
Changes in Fund Balances of Governmental FundsLast Ten Fiscal Years(modified accrual basis of accounting)
2007 2008 2009 2010 2011Revenues General property taxes $ 17,167,695 $ 19,267,635 $ 19,905,850 $ 19,568,375 $ 19,778,269 Other local taxes 8,177,652 8,276,451 7,859,118 7,710,929 7,727,630 Permits, privilege fees and regulatory licenses 377,199 335,529 188,491 202,087 181,875 Fines and forfeitures 80,978 196,529 177,259 153,837 223,673 Revenue from use of money and property 1,467,557 1,461,742 462,662 240,641 145,518 Charges for services 1,105,987 1,569,157 1,378,732 1,468,108 1,298,983 Miscellaneous 537,870 657,112 363,416 257,616 239,873 Recovered costs 1,748,308 8,187,010 3,798,055 359,866 343,712 Intergovernmental: Commonwealth 5,038,154 4,904,117 4,686,608 4,652,229 4,935,567 Federal 388,281 228,606 607,153 299,277 500,911
Total revenues $ 36,089,681 $ 45,083,888 $ 39,427,344 $ 34,912,965 $ 35,376,011
Expenditures General government administration $ 1,609,206 $ 1,592,669 $ 1,592,002 $ 1,774,607 $ 1,642,181 Judicial administration 1,156,273 1,149,258 1,292,358 1,199,478 1,183,984 Public safety 4,863,985 5,081,176 5,144,522 5,334,327 5,198,378 Public works 2,413,698 2,853,198 2,709,261 2,911,708 2,944,557 Health and welfare 1,429,744 1,471,189 1,527,091 1,459,363 1,498,725 Education 10,596,063 12,166,930 12,259,269 12,565,769 11,514,555 Parks, recreation and cultural 1,124,798 1,230,352 1,248,904 1,257,674 1,170,665 Community development 2,258,256 2,093,877 1,838,680 2,101,876 2,998,230Non-Departmental 1,469,578 1,698,751 1,733,021 1,932,209 1,747,190 Capital projects 5,056,909 17,915,845 9,482,489 62,263 36,677 Debt service: Principal 2,795,373 3,923,340 2,326,302 2,320,388 1,758,226 Interest and other fiscal charges 2,153,457 2,040,141 2,172,542 2,033,512 1,939,473 Bond issue costs - - - - -
Total expenditures $ 36,927,340 $ 53,216,726 $ 43,326,441 $ 34,953,174 $ 33,632,841
Excess of revenues over (under) expenditures $ (837,659) $ (8,132,838) $ (3,899,097) $ (40,209) $ 1,743,170
Other financing sources (uses) Transfers in $ 750,000 $ 1,750,000 $ - $ 175,135 $ - Transfers out (1,517,116) (2,640,124) (981,659) (1,123,448) (859,771) Issuance of refunding bonds - - - - - Bonds issued - 6,000,000 - - - Premium on bonds issued - - - - - Capital leases 150,314 157,000 - - 216,840 Payment to refunded bond escrow agent - - - - -
Total other financing sources (uses) $ (616,802) $ 5,266,876 $ (981,659) $ (948,313) $ (642,931)
Net change in fund balances $ (1,454,461) $ (2,865,962) $ (4,880,756) $ (988,522) $ 1,100,239
Debt service as a percentage of noncapital expenditures 15.53% 16.89% 13.29% 12.48% 11.01%
Fiscal Year
130

Table 5
2012 2013 2014 2015 2016
$ 20,928,182 $ 22,414,930 $ 23,372,482 $ 24,016,493 $ 24,843,5417,890,010 8,157,801 8,294,715 8,619,694 9,009,065
192,207 172,766 210,464 432,008 275,060 284,725 235,024 451,140 521,412 445,370
74,448 78,229 58,003 57,337 113,017 1,588,288 1,482,185 1,559,528 1,451,034 1,444,5882,150,539 2,471,378 1,213,388 943,636 833,978
303,718 350,799 272,277 317,364 469,735
4,733,732 4,847,109 4,910,801 4,955,261 4,965,5832,278,613 4,416,673 886,137 475,937 207,913
$ 40,424,462 $ 44,626,894 $ 41,228,935 $ 41,790,176 $ 42,607,850
$ 1,612,340 $ 1,588,585 $ 1,667,257 $ 1,586,194 $ 2,117,5831,188,236 1,278,954 1,295,768 1,381,899 1,472,4325,535,432 5,784,020 7,683,885 6,492,485 7,403,0412,956,944 3,082,574 2,506,757 2,893,763 3,312,6001,503,694 1,413,425 1,412,588 1,329,207 1,639,246
12,848,581 14,216,366 13,747,740 13,829,192 13,082,2821,197,527 1,345,586 1,243,472 1,442,883 1,427,6546,177,505 7,337,211 2,633,159 3,185,514 2,808,4511,730,059 1,723,096 1,749,577 1,757,409 1,780,6932,335,173 21,849,069 4,579,992 130,640 486,825
1,854,205 3,674,994 2,107,993 2,053,317 2,502,1182,026,423 2,311,965 2,724,423 2,600,518 2,746,012
- 287,772 - - -
$ 40,966,119 $ 65,893,617 $ 43,352,611 $ 38,683,021 $ 40,778,937
$ (541,657) $ (21,266,723) $ (2,123,676) $ 3,107,155 $ 1,828,913
$ 1,087,294 $ - $ 28,328 $ 27,786 $ 4,575,622(2,198,309) (1,234,972) (764,258) (937,392) (5,025,573)
- 11,760,000 - - 4,985,0007,500,000 21,895,000 - - -
- 2,533,876 - - 835,950 206,315 - - - -
- (13,086,006) - - (5,579,876)
$ 6,595,300 $ 21,867,898 $ (735,930) $ (909,606) $ (208,877)
$ 6,053,643 $ 601,175 $ (2,859,606) $ 2,197,549 $ 1,620,036
10.05% 13.59% 12.59% 12.12% 13.15%
Fiscal Year
131

COUNTY OF ROCKBRIDGE, VIRGINIA Table 6
General Governmental Tax Revenues by SourceLast Ten Fiscal Years(modified accrual basis of accounting)
MotorLocal sales Consumer Vehicle Record- Business
Fiscal Property and use Utility License ation and LicenseYear Tax Tax Tax Tax Wills Tax Tax Total
2016 $ 24,843,541 $ 2,720,814 $ 1,488,723 $ 540,217 $ 181,979 $ 849,796 $ 30,625,070 2015 24,016,493 2,561,164 1,509,304 531,093 184,098 873,386 29,675,538 2014 23,372,482 2,439,476 1,514,494 535,776 208,339 882,478 28,953,045 2013 22,414,930 2,392,591 1,522,050 537,855 191,861 913,827 27,973,114 2012 20,928,182 2,292,809 1,520,806 537,280 199,362 851,571 26,330,010 2011 19,778,269 2,226,190 1,541,967 542,034 182,274 775,021 25,045,755 2010 19,568,375 2,238,747 1,538,143 547,407 192,183 723,687 24,808,542 2009 19,905,850 2,337,807 1,529,343 556,865 208,782 855,953 25,394,600 2008 19,267,635 2,484,176 1,616,873 565,841 298,742 831,582 25,064,849 2007 17,167,695 2,486,192 1,326,139 567,994 335,290 740,306 22,623,616
132

(THIS PAGE LEFT BLANK INTENTIONALLY)

COUNTY OF ROCKBRIDGE, VIRGINIA
Assessed Value and Estimated Actual Value of Taxable PropertyLast Ten Fiscal Years
Machinery Total TaxableFiscal Real Personal Mobile and Public AssessedYear Estate (1) Property Homes Tools Service (2) Value
2016 $ 2,439,031,715 $ 193,324,971 $ 6,606,563 $ 15,010,380 $ 179,117,907 $ 2,833,091,536 2015 2,427,102,558 185,452,684 6,526,117 14,293,472 158,517,874 2,791,892,705 2014 2,409,180,980 182,796,656 6,654,724 14,745,031 146,349,769 2,759,727,160 2013 2,406,225,814 181,627,780 6,529,754 14,352,182 130,966,279 2,739,701,809 2012 2,393,006,606 174,030,130 6,943,019 13,415,023 118,289,855 2,705,684,633 2011 2,381,260,966 168,167,630 9,112,766 10,822,737 113,384,467 2,682,748,566 2010 2,436,189,073 161,297,226 9,172,343 11,287,004 92,656,310 2,710,601,956 2009 2,403,426,774 185,101,529 9,042,587 11,098,157 85,950,278 2,694,619,325 2008 2,361,326,219 178,824,784 9,418,745 11,110,174 99,002,561 2,659,682,483 2007 2,329,760,003 176,096,685 9,629,610 10,784,021 104,485,747 2,630,756,066
Source: Commissioner of the Revenue
(1) Real estate is assessed at 100% of market value.(2) Assessed values are established by the State Corporation Commission(3) Source: Virginia Department of Taxation
133

Table 7
Estimated StateActual Sales Total
Taxable Assessment DirectValue Ratio (3) Rate
$ 2,872,735,283 98.62% $ 8.26 2,788,824,998 100.11% 8.24 2,848,309,588 96.89% 8.19 2,827,641,458 96.89% 8.14 2,792,532,390 96.89% 8.08 2,697,042,893 99.47% 8.02 2,668,966,085 101.56% 7.98 2,930,845,470 91.94% 7.98 3,041,375,052 87.45% 7.94 3,254,677,800 80.83% 7.70
134

COUNTY OF ROCKBRIDGE, VIRGINIA Table 8
Property Tax Rates (1)Direct and Overlapping GovernmentsLast Ten Fiscal Years
Direct Rates
TotalTax Real Personal Mobile Machinery DirectYear Estate Property Homes and Tools Rate
2016 $ 0.735 $ 4.25 $ 0.72 $ 2.55 $ 8.262015 0.715 4.25 0.72 2.55 8.242014 0.715 4.25 0.67 2.55 8.192013 0.67 4.25 0.67 2.55 8.142012 0.64 4.25 0.64 2.55 8.082011 0.61 4.25 0.61 2.55 8.022010 0.59 4.25 0.59 2.55 7.982009 0.59 4.25 0.59 2.55 7.982008 0.59 4.25 0.55 2.55 7.942007 0.55 4.25 0.55 2.35 7.70
Source: Commissioner of the Revenue
(1) Per $100 of assessed value.
135

COUNTY OF ROCKBRIDGE, VIRGINIA Table 9
Property Tax Levies and CollectionsLast Ten Fiscal Years
Collected within the FiscalTotal Tax Year of the Levy Collections Total Collections to Date
Fiscal Levy for Percentage in Subsequent PercentageYear Fiscal Year (1) Amount of Levy Years (2) Amount of Levy
2016 $ 26,614,006 $ 25,756,651 96.78% $ - $ 25,756,651 96.78%2015 25,839,111 24,786,530 95.93% 685,695 25,472,225 98.58%2014 25,571,272 24,997,455 97.76% 288,467 25,285,922 98.88%2013 23,894,710 23,332,287 97.65% 402,581 23,734,868 99.33%2012 23,041,039 22,189,814 96.31% 729,918 22,919,732 99.47%2011 21,983,597 21,203,088 96.45% 682,708 21,885,796 99.56%2010 21,601,653 20,791,246 96.25% 787,142 21,578,388 99.89%2009 22,272,956 21,510,651 96.58% 744,540 22,255,191 99.92%2008 21,315,874 20,582,879 96.56% 720,376 21,303,255 99.94%2007 20,300,479 18,785,345 92.54% 1,506,398 20,291,743 99.96%
Source: Commissioner of the Revenue, Treasurer's office.
(1) Exclusive of penalties and interest, includes Commonwealth of Virginia PPTRA reimbursement.(2) Does not include land redemptions.
136

COUNTY OF ROCKBRIDGE, VIRGINIA Table 10
Principal Property TaxpayersCurrent Year and the Period Nine Years Prior
2016 % of Total 2007 % of TotalType Assessed Assessed Assessed Assessed
Taxpayer Business Valuation Valuation Valuation Valuation
Virginia Elec. & Power Company Utility $ 105,665,465 3.730% n/a n/aLexington Retirement Community, Inc. Health Provider 27,726,900 0.979% $ 18,834,000 0.716%White's/Lee Hi/Berkstresser Industry & Service 23,353,200 0.824% 10,913,600 0.415%BARC Electric Utility 21,511,530 0.759% n/a n/aStonewall/Medusa/CWB&S/Barger Real Estate & Industry 21,166,800 0.747% 14,319,700 0.544%Virginia Conservation Legacy* Hospitality 9,579,300 0.338% 8,431,700 0.321%Wal-Mart Real Estate Business Trust Retail 8,992,900 0.317% 8,556,300 0.325%Aladdin Manufacturing Corporation Industry 8,978,700 0.317% 8,959,700 0.341%Elmech, Inc. (Wingate Hotel) Hospitality 8,415,600 0.297% 7,826,300 0.297%Lowe's Home Center Retail 7,912,500 0.279% 7,711,700 0.293%Laurie Jeanne Landeau Individual 3,634,600 0.151% 6,716,700 0.455%
$ 246,937,495 8.716% $ 92,269,700 3.507%
*Formerly associated with Natural Bridge of Virginia, LCC in FY 2007
Source: Commissioner of Revenue
Fiscal Year 2016 Fiscal Year 2007
137

(THIS PAGE LEFT BLANK INTENTIONALLY)

COUNTY OF ROCKBRIDGE, VIRGINIA
Ratios of Outstanding Debt by TypeLast Ten Fiscal Years
Governmental Activities Business-type ActivitiesGeneral General
Fiscal Obligation Revenue Literary Notes Capital Obligation CapitalYear Bonds Bonds Fund Loans Payable Leases Bonds Leases
2016 $ 42,453,194 $ 16,745,000 $ 1,075,000 $ - $ - $ 7,264,710 $ 916,590 2015 43,604,236 17,390,000 1,255,000 - - 724,462 449,111 2014 45,109,146 17,870,000 1,435,000 - 53,280 750,543 583,060 2013 46,590,095 18,359,697 1,635,000 - 173,515 776,624 317,405 2012 24,907,549 19,055,719 2,000,000 - 330,643 776,624 - 2011 18,537,312 19,523,530 2,200,000 - 226,105 - - 2010 19,638,305 19,967,851 2,400,000 - 67,323 - - 2009 21,079,658 20,474,555 2,600,000 - 284,800 - - 2008 22,466,568 20,924,192 2,800,000 - 619,700 - - 2007 23,799,252 17,046,376 3,000,000 - 776,317 - -
Note: Details regarding the County's outstanding debt can be found in the notes to thefinancial statements.(1) See the Schedule of Demographic and Economic Statistics-Table 14.
138

Table 11
Total PercentagePrimary of Personal Per
Government Income (1) Capita (1)
$ 68,454,494 5.43% $ 3,089 63,422,809 5.03% 2,862 65,801,029 5.22% 2,939 67,852,336 5.44% 3,038 47,070,535 3.94% 2,131 40,486,947 3.57% 1,827 42,073,479 3.72% 1,886 44,439,013 3.85% 1,975 46,810,460 4.13% 2,085 44,621,945 4.12% 2,000
139

COUNTY OF ROCKBRIDGE, VIRGINIA Table 12Ratio of Net General Bonded Debt toAssessed Value and Net Bonded Debt Per CapitaLast Ten Fiscal Years
Gross Ratio ofand Debt Net Bonded NetNet Service Net Debt to Bonded
Fiscal Assessed Bonded Monies Bonded Assessed Debt perYear Population (1) Value (2) Debt (3) Available Debt Value Capita
2016 22,163 $ 2,439,031,715 $ 43,528,194 $ - $ 43,528,194 1.78% $ 1,964 2015 22,163 2,427,102,558 44,859,236 - 44,859,236 1.85% $ 2,024 2014 22,390 2,409,180,980 46,544,146 - 46,544,146 1.93% 2,079 2013 22,338 2,406,225,814 48,225,095 - 48,225,095 2.00% 2,159 2012 22,090 2,393,006,606 26,907,549 - 26,907,549 1.12% 1,218 2011 22,155 2,381,260,966 20,963,417 - 20,963,417 0.88% 946 2010 22,307 2,436,189,073 22,038,305 - 22,038,305 0.90% 988 2009 22,498 2,403,426,774 23,679,657 - 23,679,657 0.99% 1,053 2008 22,450 2,361,326,219 25,266,568 - 25,266,568 1.07% 1,125 2007 22,313 2,329,760,003 26,799,252 - 26,799,252 1.15% 1,201
(1) www.coopercenter.org; See the Schedule of Demographic and Economic Statistics - Table 14(2) See the Schedule of Assessed Value and Estimated Actual Value of Taxable Property- Table 7(3) Includes all long-term general obligation bonded debt, bonded anticipation notes, and literary fund loans. Excludes revenue bonds, landfill closure/post-closure care liability, capital leases, and compensated absences.
Less:
140

COUNTY OF ROCKBRIDGE, VIRGINIA Table 13
Pledged-Revenue CoverageLast Ten Fiscal Years
Landfill Revenue BondsLandfill Less: Net
Fiscal Charges Operating Available Debt ServiceYear and Other Expenses Revenue Principal Interest Coverage
2016 $ 2,113,441 1,005,416 $ 1,108,025 $ 20,000 $ 29,656 2231.40%2015 1,583,311 892,831 690,480 20,000 40,173 1147.49%2014 936,618 1,138,798 (202,180) 20,000 31,456 -392.92%2013 1,035,112 892,364 142,748 - 28,107 507.87%2012 1,063,575 825,011 238,564 - - N/A2011 1,126,524 862,292 264,232 - - N/A2010 1,213,528 969,972 243,556 - - N/A2009 1,267,734 1,058,560 209,174 - - N/A2008 1,184,895 1,215,648 (30,753) - - N/A2007 1,261,870 1,336,355 (74,485) - - N/A
Note: Landfill charges and other include landfill charges and miscellaneous revenues but not investment earnings or capital contributions.
141
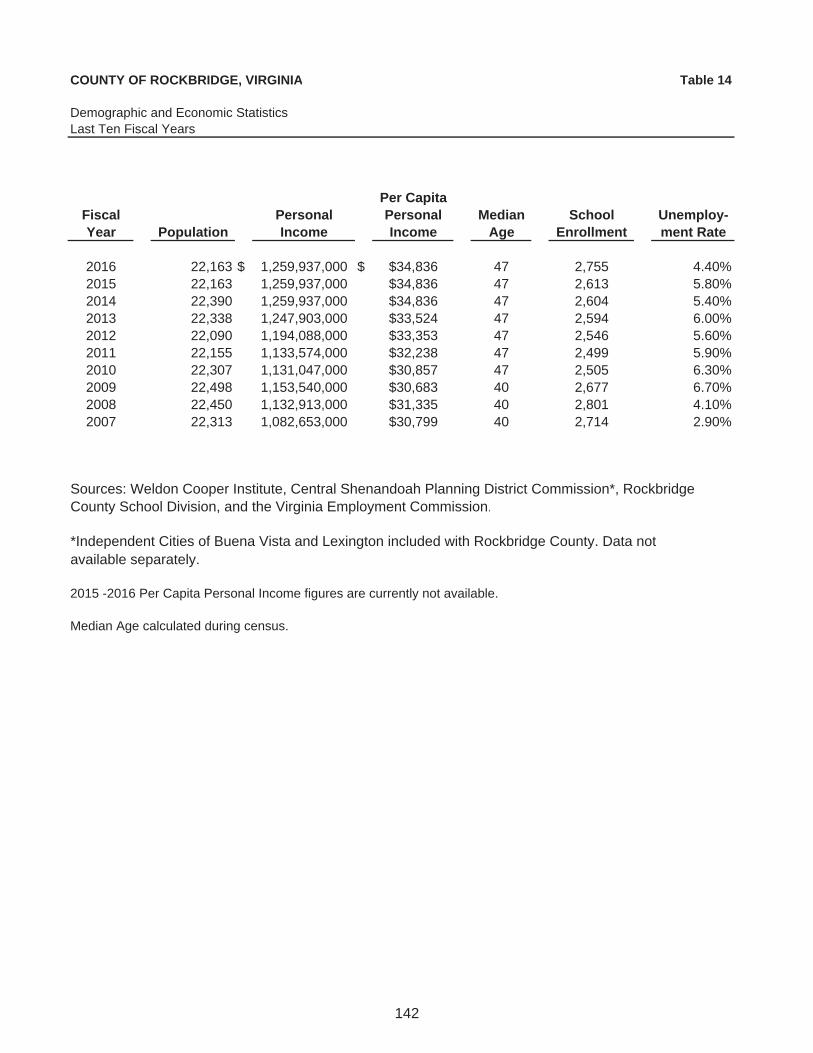
COUNTY OF ROCKBRIDGE, VIRGINIA Table 14
Demographic and Economic StatisticsLast Ten Fiscal Years
Per CapitaFiscal Personal Personal Median School Unemploy-Year Population Income Income Age Enrollment ment Rate
2016 22,163 $ 1,259,937,000 $ $34,836 47 2,755 4.40%2015 22,163 1,259,937,000 $34,836 47 2,613 5.80%2014 22,390 1,259,937,000 $34,836 47 2,604 5.40%2013 22,338 1,247,903,000 $33,524 47 2,594 6.00%2012 22,090 1,194,088,000 $33,353 47 2,546 5.60%2011 22,155 1,133,574,000 $32,238 47 2,499 5.90%2010 22,307 1,131,047,000 $30,857 47 2,505 6.30%2009 22,498 1,153,540,000 $30,683 40 2,677 6.70%2008 22,450 1,132,913,000 $31,335 40 2,801 4.10%2007 22,313 1,082,653,000 $30,799 40 2,714 2.90%
*Independent Cities of Buena Vista and Lexington included with Rockbridge County. Data notavailable separately.
2015 -2016 Per Capita Personal Income figures are currently not available.
Median Age calculated during census.
Sources: Weldon Cooper Institute, Central Shenandoah Planning District Commission*, Rockbridge County School Division, and the Virginia Employment Commission.
142

COUNTY OF ROCKBRIDGE, VIRGINIA Table 15
Principal EmployersCurrent Year and Nine Years Ago
% of Total % of TotalCounty County
Employer Employees Rank Employment Employees Rank Employment
Mohawk Industries, Inc. 730 1 7.57% 1,150 1 16.36%Walmart 252 2 2.61% n/a n/a n/aWhite's Travel Center 248 3 2.57% 120 2 1.71%Kendall 175 4 1.82% n/a n/a n/aVesuvius Corporation 123 5 1.28% 90 8 1.28%Lowes 113 5 1.17% n/a n/a n/aByers, Inc. 87 5 0.90% 90 8 1.28%Natural Bridge Hotel/Caverns 84 6 0.87% 90 9 0.82%Devils Backbone 73 7 0.76% n/a n/a n/aStella Jones (BPBC) 54 8 0.56% 105 5 1.49%Totals 1,939 20.11% n/a n/a
unable to provide requested information or were not in business at that time.
Sources: Individual company human resource departments.Note: Excludes government, schools, and state/local agencies.
Fiscal Year 2016 Fiscal Year 2007
Businesses with 2007 employment figure marked 'n/a' do not maintain their records that far back, were
143

COUNTY OF ROCKBRIDGE, VIRGINIA
Full-time Equivalent County Government Employees by FunctionLast Ten Fiscal Years
Function 2007 2008 2009 2010
General government 25 25 22 22 Judicial administration 13 13 12 12 Public safety Sheriffs department 38 38 36 38 Building inspections 4 4 5 4 Animal control 2 2 2 2 Public works General maintenance 6 6 6 6 Landfill 16 16 15 15 Engineering 1 1 1 - Health and welfare Department of social services 25 25 25 25 Culture and recreation Parks and recreation 3 3 3 3 Community development Planning 4 4 5 5
Totals 137 137 132 132
Source: Individual County departments
Fiscal Year
144

Table 16
2011 2012 2013 2014 2015 2016
21 21 21 21 22 23 12 12 12 12 13 13
38 38 38 39 39 39 4 4 4 4 4 4 2 2 2 2 2 2
6 6 6 6 6 6 10 10 10 11 11 11
- - - - - -
25 25 25 23 26 26
3 3 3 3 3 4
5 5 5 5 5 5
126 126 126 126 131 133
Fiscal Year
145

COUNTY OF ROCKBRIDGE, VIRGINIA
Operating Indicators by FunctionLast Ten Fiscal Years
Function 2007 2008 2009 2010 2011
Fire and rescue: Number of calls answered 3,829 4,962 4,876 4,876 4,983 Building inspections: Permits issued 688 409 281 294 310 Landfill: Refuse collected (tons/day) 167 113 110 97 138 Recycling (tons/day) 15 15 16 13 11
Health and welfare Department of Social Services: Caseload 2,412 2,850 2,931 3,622 6,714
*Calls dispatched; excludes Lexington and Buena Vista Fire and Rescue**Tons per day based on 310 work days***Includes Lexington City, excludes Buena Vista City and private enterprises
Source: Individual County departments--only information that is currently available.
Fiscal Year
146

Table 17
2012 2013 2014 2015 2016
5,636 4791* 5582* 5475* 5580*
274 310 522 529 535
138 141 141 141 144**11 13 15 17 13***
6,714 6,366 6,275 6,286 6,239
Fiscal Year
147

COUNTY OF ROCKBRIDGE, VIRGINIA
Capital Asset Statistics by FunctionLast Ten Fiscal Years
Function 2007 2008 2009 2010 2011
General government Administration buildings 1 1 1 1 1Public safety Building inspections/maintenance: Vehicles 4 4 4 4 3 Animal control: Vehicles 2 2 2 2 2 Landfill: Sites 1 1 1 1 1Health and welfare Department of Social Services: Vehicles 1 1 1 1 4Culture and recreation Parks and recreation: Vehicles 3 3 3 3 3 Swimming pools 2 2 2 2 2Community development Planning: Vehicles 3 3 3 3 3Sheriff (Law Enforcement): Vehicles 37 37 38 38 39
Source: Individual County departments--only information that is currently available
Fiscal Year
148

Table 18
2012 2013 2014 2015 2016
1 1 1 1 1
3 3 3 4 4
2 2 2 2 2
1 1 1 1 1
4 4 4 5 5
3 3 3 2 32 2 2 2 2
3 3 3 3 3
39 39 39 38 40
Fiscal Year
149

COUNTY OF ROCKBRIDGE, VIRGINIA
Schedule of the City of Lexington's and Buena Vista's Share of Certain General Government ExpendituresYear Ended June 30, 2016
Total State and Cost to Other Net County
the County Reimbursement Cost % Used Total Cost
Clerk of the Circuit Court $ 414,189 $ 269,857 $ 144,332 24.95% $ 36,011
Circuit Court - Expenses 62,546 - 62,546 24.95% 15,605
General District and J&D Court 21,104 - 21,104 24.95% 5,265
Courthouse Maintenance 327,874 - 327,874 24.95% 81,805
Administration Building, 150 S. Main Street 152,984 - 152,984 5.90% 9,026
25th Court Services Unit-Juvenile Probation 5,903 - 5,903 20.37% 1,202
Commonwealth's Attorney 473,345 350,733 122,612 24.95% 30,592
Sheriff's Salary 116,642 87,322 29,320 24.95% 7,315
Advancement of Agriculture (City Agent) 156,438 - 156,438 15.00% 23,466
Totals $ 1,731,025 $ 707,912 $ 1,023,113 $ 210,287
City of Lexington Share
Description
150

Table 19
% Used Total Cost
- $ -
- -
- -
- -
- -
18.34% 1,083
- -
- -
- -
$ 1,083
City of Buena Vista Share
151

COMPLIANCE SECTION

ROBINSON, FARMER, COX ASSOCIATES CERTIFIED PUBLIC ACCOUNTANTS A PROFESSIONAL LIMITED LIABILITY COMPANY
INDEPENDENT AUDITORS’ REPORT ON INTERNAL CONTROL OVER FINANCIAL REPORTING AND ON COMPLIANCE AND OTHER MATTERS BASED ON AN AUDIT OF FINANCIAL STATEMENTS PERFORMED IN
ACCORDANCE WITH GOVERNMENT AUDITING STANDARDS
TO THE HONORABLE MEMBERS OF THE BOARD OF SUPERVISORS COUNTY OF ROCKBRIDGE, VIRGINIA
We have audited, in accordance with the auditing standards generally accepted in the United States of America; the standards applicable to financial audits contained in Government Auditing Standards, issued by the Comptroller General of the United States; and the Specifications for Audits of Counties, Cities, and Towns, issued by the Auditor of Public Accounts of the Commonwealth of Virginia, the financial statements of the governmental activities, the business-type activities, the discretely presented component units, each major fund and the aggregate remaining fund information of the County of Rockbridge, Virginia, as of and for the year ended June 30, 2016, and the related notes to the financial statements, which collectively comprise the County of Rockbridge, Virginia’s basic financial statements, and have issued our report thereon dated December 18, 2016.
Internal Control over Financial Reporting
In planning and performing our audit of the financial statements, we considered County of Rockbridge, Virginia’s internal control over financial reporting (internal control) to determine the audit procedures that are appropriate in the circumstances for the purpose of expressing our opinions on the financial statements, but not for the purpose of expressing an opinion on the effectiveness of County of Rockbridge, Virginia’s internal control. Accordingly, we do not express an opinion on the effectiveness of County of Rockbridge, Virginia’s internal control.
A deficiency in internal control exists when the design or operation of a control does not allow management or employees, in the normal course of performing their assigned functions, to prevent, or detect and correct, misstatements on a timely basis. A material weakness is a deficiency, or a combination of deficiencies, in internal control, such that there is a reasonable possibility that a material misstatement of the entity’s financial statements will not be prevented, or detected and corrected on a timely basis. A significantdeficiency is a deficiency, or a combination of deficiencies, in internal control that is less severe than a material weakness, yet important enough to merit attention by those charged with governance.
Our consideration of internal control was for the limited purpose described in the first paragraph of this section and was not designed to identify all deficiencies in internal control that might be material weaknesses or, significant deficiencies. Given these limitations, during our audit we did not identify any deficiencies in internal control that we consider to be material weaknesses. However, material weaknesses may exist that have not been identified.
Compliance and Other Matters
As part of obtaining reasonable assurance about whether County of Rockbridge, Virginia’s financial statements are free from material misstatement, we performed tests of its compliance with certain provisions of laws, regulations, contracts, and grant agreements, noncompliance with which could have a direct and material effect on the determination of financial statement amounts. However, providing an opinion on compliance with those provisions was not an objective of our audit, and accordingly, we do not express such an opinion. The results of our tests disclosed no instances of noncompliance or other matters that are required to be reported under Government Auditing Standards.
152

Purpose of this Report
The purpose of this report is solely to describe the scope of our testing of internal control and compliance and the results of that testing, and not to provide an opinion on the effectiveness of the entity’s internal control or on compliance. This report is an integral part of an audit performed in accordance with Government Auditing Standards in considering the entity’s internal control and compliance. Accordingly, this communication is not suitable for any other purpose.
Staunton, Virginia December 18, 2016
153

ROBINSON, FARMER, COX ASSOCIATESCERTIFIED PUBLIC ACCOUNTANTS A PROFESSIONAL LIMITED LIABILITY COMPANY
INDEPENDENT AUDITORS’ REPORT ON COMPLIANCE FOR EACH MAJOR PROGRAM AND ON INTERNAL CONTROL OVER COMPLIANCE REQUIRED BY THE UNIFORM GUIDANCE
TO THE HONORABLE MEMBERS OF THE BOARD OF SUPERVISORS COUNTY OF ROCKBRIDGE, VIRGINIA
Report on Compliance for Each Major Federal Program
We have audited County of Rockbridge, Virginia’s compliance with the types of compliance requirements described in the OMB Circular Compliance Supplement that could have a direct and material effect on each of County of Rockbridge, Virginia’s major federal programs for the year ended June 30, 2016. County of Rockbridge, Virginia’s major federal programs are identified in the summary of auditors’ results section of the accompanying schedule of findings and questioned costs.
Management’s Responsibility
Management is responsible for compliance with federal statutes, regulations, and the terms and conditions of its federal awards applicable to its federal programs.
Auditors’ Responsibility
Our responsibility is to express an opinion on compliance for each of County of Rockbridge, Virginia’s major federal programs based on our audit of the types of compliance requirements referred to above. We conducted our audit of compliance in accordance with auditing standards generally accepted in the United States of America; the standards applicable to financial audits contained in Government Auditing Standards,issued by the Comptroller General of the United States; and the audit requirements of Title 2 U.S. Code of Federal Regulations Part 200, Uniform Administrative Requirements, Cost Principles, and Audit Requirements for Federal Awards (Uniform Guidance). Those standards and the Uniform Guidance require that we plan and perform the audit to obtain reasonable assurance about whether noncompliance with the types of compliance requirements referred to above that could have a direct and material effect on a major federal program occurred. An audit includes examining, on a test basis, evidence about County of Rockbridge, Virginia’s compliance with those requirements and performing such other procedures as we considered necessary in the circumstances.
We believe that our audit provides a reasonable basis for our opinion on compliance for each major federal program. However, our audit does not provide a legal determination of County of Rockbridge, Virginia’s compliance.
Opinion on Each Major Federal Program
In our opinion, County of Rockbridge, Virginia complied, in all material respects, with the types of compliance requirements referred to above that could have a direct and material effect on each of its major federal programs for the year ended June 30, 2016.
154

Report on Internal Control over Compliance
Management of County of Rockbridge, Virginia is responsible for establishing and maintaining effective internal control over compliance with the types of compliance requirements referred to above. In planning and performing our audit of compliance, we considered County of Rockbridge, Virginia’s internal control over compliance with the types of requirements that could have a direct and material effect on each major federal program to determine the auditing procedures that are appropriate in the circumstances for the purpose of expressing an opinion on compliance for each major federal program and to test and report on internal control over compliance in accordance with the Uniform Guidance, but not for the purpose of expressing an opinion on the effectiveness of internal control over compliance. Accordingly, we do not express an opinion on the effectiveness of County of Rockbridge, Virginia’s internal control over compliance.
A deficiency in internal control over compliance exists when the design or operation of a control over compliance does not allow management or employees, in the normal course of performing their assigned functions, to prevent, or detect and correct, noncompliance with a type of compliance requirement of a federal program on a timely basis. A material weakness in internal control over compliance is a deficiency, or combination of deficiencies, in internal control over compliance, such that there is a reasonable possibility that material noncompliance with a type of compliance requirement of a federal program will not be prevented, or detected and corrected, on a timely basis. A significant deficiency in internal control over compliance is a deficiency, or a combination of deficiencies, in internal control over compliance with a type of compliance requirement of a federal program that is less severe than a material weakness in internal control over compliance, yet important enough to merit attention by those charged with governance.
Our consideration of internal control over compliance was for the limited purpose described in the first paragraph of this section and was not designed to identify all deficiencies in internal control over compliance that might be material weaknesses or significant deficiencies. We did not identify any deficiencies in internal control over compliance that we consider to be material weaknesses. However, material weaknesses may exist that have not been identified.
The purpose of this report on internal control over compliance is solely to describe the scope of our testing of internal control over compliance and the results of that testing based on the requirements of the Uniform Guidance. Accordingly, this report is not suitable for any other purpose.
Staunton, Virginia December 18, 2016
155

Pass-throughFederal Entity
Federal Grantor/State Pass - Through Grantor/ CFDA Identifying FederalProgram or Cluster Title Number Number Expenditures
Department of Agriculture: Pass Through Payments:
Child Nutrition Cluster Department of Agriculture: Food Distribution 10.555 40623 $ 78,148
Department of Education: National School Lunch Program 10.555 40623 560,410
Total School Lunch Program $ 638,558
School Breakfast Program 10.553 40591 $ 71,266
Total Child Nutrition Cluster $ 709,824
Child Nutrition Discretionary Grants Limited Availability 10.579 86804 $ 4,291
Schools and Roads - Grants to States 10.665 43841 71,226
Total Department of Agriculture $ 785,341
Environmental Protection Agency: Pass Through Payments: Department of Environmental Quality: DEQ Royalty Grants 66.000 515002 $ 442
Department of Housing and Urban Development: Pass Through Payments: Department of Housing and Community Development: Community Development Block Grants/State's Program and Non-
Entitlement Grants in Hawaii 14.228 HCD50790 $ 36,502
Total Department of Housing and Urban Development $ 36,502
Department of Justice: Pass Through Payments: Department of Criminal Justice Service: Violence Against Women Formula Grants 16.588 CJS86515 $ 37,826
Department of Transportation: Pass Through Payments: Department of Motor Vehicles: Alcohol Open Container Requirements 20.607 Not available $ 12,545 Highway Planning and Construction 20.205 Not available 5,443 State and Community Highway Safety 20.600 SC-2010 50364 3984 7,470
Total Department of Transportation $ 25,458
County of Rockbridge, VirginiaSchedule of Expenditures of Federal AwardsFor the Year Ended June 30, 2016
156

Federal Pass-throughFederal Grantor/State Pass - Through Grantor/ CFDA Identifying Federal
Program or Cluster Title Number Number Expenditures
Department of Education: Pass Through Payments: Department of Education: Adult Education-Basic Grants to States 84.002 42801 $ 128,222
Title I: Grants to Local Educational Agencies 84.010 42901 493,739 Special Education Cluster:
Special Education Grants to States 84.027 43071 598,772 Special Education Preschool Grants 84.173 62521 14,140
Total Special Education Cluster $ 612,912
Career and Technical Education - Basic Grants to States 84.048 61095 $ 46,898 Supporting Effective Instruction State Grant 84.367 61480 66,085 Twenty-First Century Community Learning Centers 84.287 60565 106,029 Action Against Poverty 84.000 Not available 36,652 Advanced Placement Program 84.330 60957 738
Total Department of Education $ 1,491,275
Total Expenditures of Federal Awards $ 2,376,844
Notes to Schedule of Expenditures of Federal Awards:
NOTE 1-BASIS OF PRESENTATION
NOTE 2-SUMMARY OF SIGNIFICANT ACCOUNTING POLICIES
NOTE 3-FOOD DISTRIBUTION
NOTE 4 - RELATIONSHIP TO FINANCIAL STATEMENTS
Intergovernmental federal revenues per the basic financial statements: Primary government: Governmental funds
General fund $ 207,913 Department of the Interior - Payment in Lieu of Taxes (107,685)
Total primary government $ 100,228
Discretely presented component unit - School Board: School operating fund $ 1,562,501 School cafeteria fund 714,115 Total discretely presented component unit - School Board $ 2,276,616
Total federal expenditures per the Schedule of Expenditures of Federal awards $ 2,376,844
(1) Expenditures reported on the Schedule are reported on the accrual basis of accounting. Such expenditures are recognizedfollowing the cost principles contained in the Uniform Guidance, wherein certain types of expenditures are not allowable or arelimited as to reimbursement.
Schedule of Expenditures of Federal Awards (Continued)
(2) County of Rockbridge, Virginia has elected to use the 10 percent de minimis indirect cost rate as allowed under the UniformGuidance.
Federal expenditures, revenues, and capital contributions are reported in the County's basic financial statements as follows:
The accompanying schedule of expenditures of federal awards (the Schedule) includes the federal award activity of the County ofRockbridge, Virginia under programs of the federal government for the year ended June 30, 2016. The information in thisSchedule is presented in accordance with the requirements of Title 2 U.S. Code of Federal Regulations Part 200, UniformAdministrative Requirements, Cost Principles, and Audit Requirements for Federal Awards (Uniform Guidance). Because theSchedule presents only a selected portion of the operations of the County of Rockbridge, Virginia, it is not intended to and doesnot present the financial position, changes in net position, or cash flows of the County of Rockbridge, Virginia.
Nonmonetary assistance is reported in the schedule at the fair market value of the commodities received and disbursed. At June30, 2016, the County had food commodities totaling $7,080 in inventory. The value of food commodities expended during the yearended June 30, 2016 amounted to $78,148.
For the Year Ended June 30, 2016
(3) Pass-through entity identifying numbers are presented where available.
County of Rockbridge, Virginia
157

Financial Statements
Type of auditors' report issued
Internal control over financial reporting:- Material weakness(es) identified? yes x no- Significant deficiency(ies) identified? yes x none reported
Noncompliance material to financial statements noted? yes x no
Federal Awards
Internal control over major programs:- Material weakness(es) identified? yes x no- Significant deficiency(ies) identified? yes x
Type of auditors' report issued on compliance for major programs
Any audit findings disclosed that are required to be reportedin accordance with 2 CFR section 200.516(a)? yes x no
Identification of major programs:
CFDA Numbers Name of Federal Program or ClusterChild Nutrition Cluster:
10.553 …………………School Breakfast Program10.555 …………………National School Lunch Program10.555 …………………Food Distribution
Dollar threshold used to distinguish between type A and type B programs:
Auditee qualified as low-risk auditee? x yes no
There are no financial statement findings to report.
There are no federal award findings and questioned costs to report.
There were no prior year findings.
COUNTY OF ROCKBRIDGE, VIRGINIASchedule of Findings and Questioned Costs
For the Year Ended June 30, 2016
Section I-Summary of Auditors' Results
Section IV-Summary of Prior Year Findings
unmodified
none reported
unmodified
$750,000
Section II-Financial Statement Findings
Section III-Federal Award Findings and Questioned Costs
158