County Capital Improvements Program (CIP) Cost & Schedule ...
34
CountyStat County Capital Improvements Program (CIP) Cost & Schedule Estimates Transportation-Road Projects Department of Transportation August 5, 2008
Transcript of County Capital Improvements Program (CIP) Cost & Schedule ...

CountyStat
County Capital Improvements Program (CIP)
Cost & Schedule Estimates
Transportation-Road Projects
Department of Transportation
August 5, 2008

CountyStat
CountyStat Principles
Require Data-Driven Performance
Promote Strategic Governance
Increase Government Transparency
Foster a Culture of Accountability

CountyStat
Agenda
Welcome and Introductions
Goals of Initial CountyStat Involvement
CIP Road Project Process
– Process Overview
– Cost Estimating• Comparison of Escalation Methodology (OMB, OLO, and FWHA)
• Inflation Indexes Used by Other AAA-Rated Jurisdictions
– Schedule Estimating
– Relationship Between Project Scheduling and Cost Estimating
– Areas for Improvement• Facility Planning
• Project Monitoring
Follow-up items
Wrap-up
8/5/2008CIP Cost & Schedule Estimates

CountyStat
Goals of Initial CountyStat Involvement
CountyStat approach
– Assess current Capital Improvement Program (CIP) estimating process for
road projects
– Analyze cost estimation methodology
– Analyze schedule estimation
– Identify the relationship between costs and scheduling
– Determine areas for improvement
8/5/2008CIP Cost & Schedule Estimates
This is the first of to be regularly scheduled CIP meetings. Moving forward,
CountyStat will examine cost and time associated with the CIP program in order to
determine where efficiencies can be implemented.

CountyStat
Agenda
Welcome and Introductions
Goals of Initial CountyStat Involvement
CIP Road Project Process
– Process Overview
– Cost Estimating• Comparison of Escalation Methodology (OMB, OLO, and FWHA)
• Inflation Indexes Used by Other AAA-Rated Jurisdictions
– Schedule Estimating
– Relationship Between Project Scheduling and Cost Estimating
– Areas for Improvement• Facility Planning
• Project Monitoring
Follow-up items
Wrap-up
8/5/2008CIP Cost & Schedule Estimates

CountyStat
CIP Road Project Process: Overview
Source: County Executive’s FY09 Recommended Capital Budget and FY09-14 Capital Improvement Program (CIP) January 2008, p. 4-3 (adapted)
8/5/2008
CIP Budget
Facility Planning
Budget
Project Concepts
Developed in Response
to Need Identification
•Master Plans
•Program Development
•Mandates
•Executive/Council Initiatives
•Citizen ideas
•Citizens’ Advisory Board
Initiatives
•M-NCPPC Priorities
Facility Planning
Phase 1:
Conceptual Planning
Department or
Agency Makes
Decision to Submit
Under Review
EXEC CCOMB
Competition for resources
Included in Approved CIP
Final Close-
Out
Pending Close-
Out
Construction
Completed
Design
Appropriation
Given
Open to
Traffic/
Finishing Work
Construction
StartsDesign
Completed
EXECOMB
Outside Forces
DPS , USCOE, MDE, M-NCPPC
Procurement, Legal issues, Etc.
Phase 2:
Preliminary Design
Right of Way
Acquisition
CIP Cost & Schedule Estimates

CountyStat
CIP Road Project Process: Facility Planning
Phase 1: Conceptual Planning Determine project need and features
Identify environmental and social impacts
Identify design options and alternatives
Produce concept plans
Investigate preliminary impacts:
– Traffic, environment, community, noise, historical,
etc.
Recommend preferred alternative
Phase 2: Preliminary Design
Develop 35% project design
Develop stormwater management and sediment
control management plan
Determine environmental and noise impacts and
mitigation measures
Estimate land acquisition and utility relocation costs
Establish preliminary cost estimates and possible
schedules
By the end of Phase 2, a project has completed approximately 35% of design
and refined the cost and schedule estimates that become part of the CIP.
Project Abandoned Continue to Phase 2
8/5/2008CIP Cost & Schedule Estimates
CountyStat
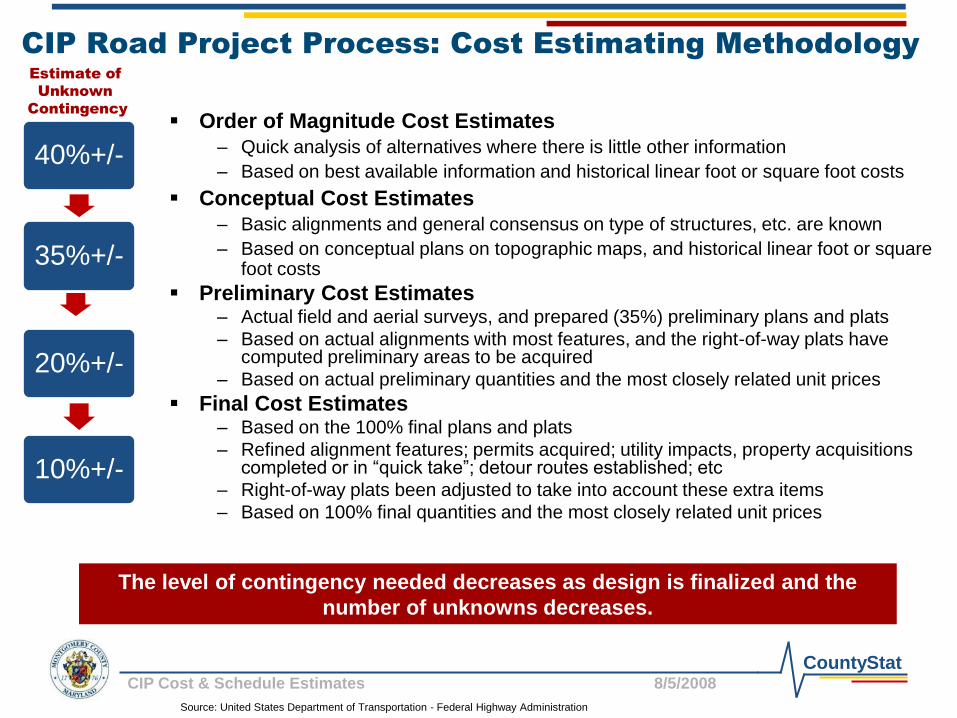
CIP Road Project Process: Cost Estimating Methodology
Order of Magnitude Cost Estimates
– Quick analysis of alternatives where there is little other information
– Based on best available information and historical linear foot or square foot costs
Conceptual Cost Estimates
– Basic alignments and general consensus on type of structures, etc. are known
– Based on conceptual plans on topographic maps, and historical linear foot or square foot costs
Preliminary Cost Estimates– Actual field and aerial surveys, and prepared (35%) preliminary plans and plats
– Based on actual alignments with most features, and the right-of-way plats have computed preliminary areas to be acquired
– Based on actual preliminary quantities and the most closely related unit prices
Final Cost Estimates– Based on the 100% final plans and plats
– Refined alignment features; permits acquired; utility impacts, property acquisitions completed or in “quick take”; detour routes established; etc
– Right-of-way plats been adjusted to take into account these extra items
– Based on 100% final quantities and the most closely related unit prices
Source: United States Department of Transportation - Federal Highway Administration
40%+/-
35%+/-
20%+/-
10%+/-
Estimate of
Unknown
Contingency
The level of contingency needed decreases as design is finalized and the
number of unknowns decreases.
8/5/2008CIP Cost & Schedule Estimates

CountyStat
Agenda
Welcome and Introductions
Goals of Initial CountyStat Involvement
CIP Road Project Process
– Process Overview
– Cost Estimating• Comparison of Escalation Methodology (OMB, OLO, and FWHA)
• Inflation Indexes Used by Other AAA-Rated Jurisdictions
– Schedule Estimating
– Relationship Between Project Scheduling and Cost Estimating
– Areas for Improvement• Facility Planning
• Project Monitoring
Follow-up items
Wrap-up
8/5/2008CIP Cost & Schedule Estimates

CountyStat
Cost Estimating: Comparison of Escalation Methodology
OMB Methodology for Cost Escalation
– Past CIP guidance• Consumer Price Index (CPI) rates estimated by Finance are used as a guideline
• Escalated to year 2 of the 6-year program
• Inflationary factors should be applied as appropriate to project expenditures (for contracts that have not yet been awarded)
– FY09 CIP guidance• CPI rates estimated by Finance are used as a guideline
- Standard inflation rates for the FY09-14 CIP were 2.8% for FY09 and 2.7% for FY10
- In development of the FY09-14 CIP, road projects were inflated 5-7% annually to the first year of construction
• Escalated to year 2 of the 6-year program
• Inflationary factors should be applied as appropriate to project expenditures (for contracts that have not yet been awarded)
• Departments can use “extraordinary” inflation rates (i.e. adjustments needed due to current market environment)
OLO Methodology for Cost Escalation
– Utilized a composite of the following indexes to determine escalation of different cost elements
• Engineering News-Record (ENR) Construction Cost Index for the Baltimore Region: Construction element
• U.S. Bureau of Labor Statistics, Consumer Price Index (CPI-U) for Washington-Baltimore Region:
• Land Price Escalation (10% year):
Federal Highway Administration (FHWA) Methodology for Cost Escalation
– Utilized a composite bid price index to determine escalation of construction cost element
8/5/2008CIP Cost & Schedule Estimates
CountyStat
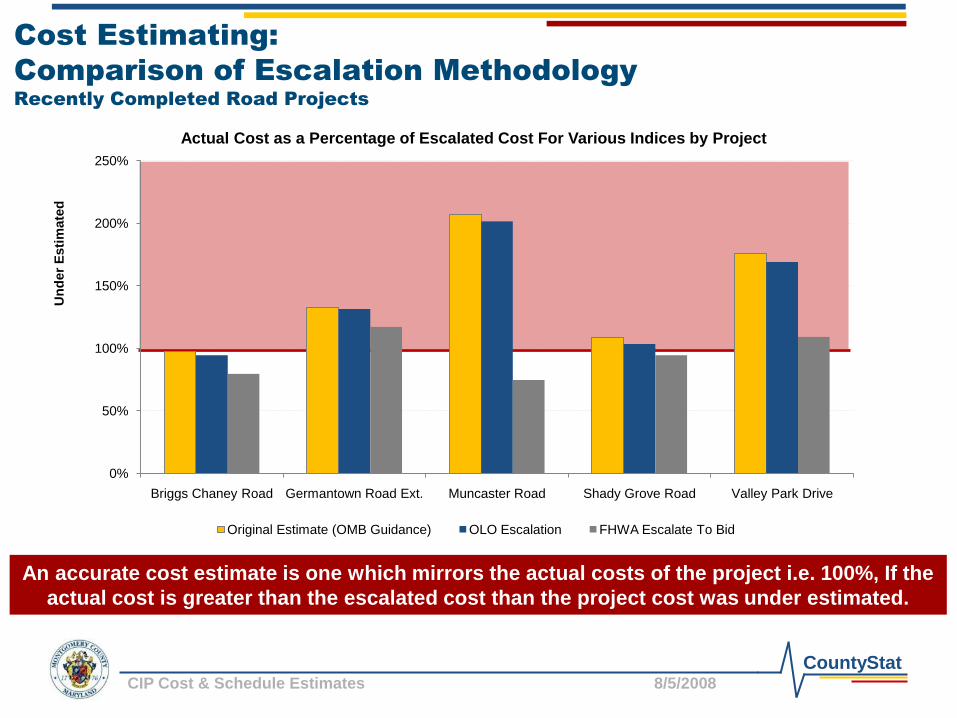
Cost Estimating:
Comparison of Escalation Methodology
Recently Completed Road Projects
An accurate cost estimate is one which mirrors the actual costs of the project i.e. 100%, If the
actual cost is greater than the escalated cost than the project cost was under estimated.
Un
der
Esti
mate
d
0%
50%
100%
150%
200%
250%
Briggs Chaney Road Germantown Road Ext. Muncaster Road Shady Grove Road Valley Park Drive
Actual Cost as a Percentage of Escalated Cost For Various Indices by Project
Original Estimate (OMB Guidance) OLO Escalation FHWA Escalate To Bid
8/5/2008CIP Cost & Schedule Estimates

CountyStat
Cost Estimating:
Comparison of Escalation Methodology
Pros
OMB– FY09 CIP
• CPI rates estimated by Finance are a guideline
• Departments can use discretion based on
“extraordinary” inflation rates and current market
conditions
OLO– Uses actual inflation costs that occurred to
determine accuracy of original estimate, if
given complete information
– Uses separate indexes for each cost element
FHWA– Index concentrates on the construction cost
element specifically for roads which represent
60-70% of the costs associated with a road
project
Cons OMB
– OMB offers guidance but implementation
varies by project
– Ability to perform comparative analysis of
projects is limited
OLO– Asphalt is the major material used in
construction of roads and is not fully
represented by the ENR index used to
escalate the construction cost element
– Assumes 10% land cost escalation per year
FHWA– Significant data quality issues
– FHWA officials are concerned about reliability
of bid price data due to underreporting and
self-reporting
– Data collection for the index may be
discontinued in the near future
– Does not take into account escalation of
planning, design, site improvement, utilities,
and land
8/5/2008CIP Cost & Schedule Estimates

CountyStat
Cost Estimating: Inflation Indexes Used by Other
AAA-rated Jurisdictions
JurisdictionInflation factor used in budgeting road
projects
FY09
Transportation
Montgomery County, MD*
FY09-14 CIP, projects were generally inflated 5%
annually to the mid-point of construction (with some
variation)
$174,465,000
Prince Georges County, MDDoes not use an escalation rate, recalculates yearly
based on current costs$65,350,000
Fairfax County, VA Between 3.5-4% to the mid-point of construction $247,341,000
Howard County, MDUses State Highway Authority as a base
5-6% $47,097,000
DOT needs to coordinate with OMB and other parties to determine the optimal
method for determining cost estimates.
*Two year CIP budget cycle
8/5/2008CIP Cost & Schedule Estimates

CountyStat
Agenda
Welcome and Introductions
Goals of Initial CountyStat Involvement
CIP Road Project Process
– Process Overview
– Cost Estimating• Comparison of Escalation Methodology (OMB, OLO, and FWHA)
• Inflation Indexes Used by Other AAA-Rated Jurisdictions
– Schedule Estimating
– Relationship Between Project Scheduling and Cost Estimating
– Areas for Improvement• Facility Planning
• Project Monitoring
Follow-up items
Wrap-up
8/5/2008CIP Cost & Schedule Estimates

CountyStat
Project Scheduling: Definitions
Project Description Form (PDF) - a document in the CIP which
provides information on:
– Project number, title, estimated expenditures, funding schedules, annual
operating budget impact, description, justification, etc.
Year first appropriated – the year money was earmarked for a
project to begin in the original PDF
8/5/2008CIP Cost & Schedule Estimates
For the purpose of CountyStat meetings and measuring DOT time estimates, project
scheduling estimates begin at the date of first appropriation in the original Project
Description Form (PDF)

CountyStat
The critical path is the longest sequence of activities in a project plan. An activity
on the critical path cannot be started until its predecessor activity is complete;
any delay will create subsequent delays.
Project Scheduling: Critical Path Model
8/5/2008CIP Cost & Schedule Estimates
Critical Step (Design)
Critical Step
(Permitting)
Non-Critical Step
(Example)
Critical Step
(Right-of-way; utility relocation)
Critical Step
(Advertising)
Day 0 Day 5 Day 10 Day 15 Day 20 Day 25

CountyStat
Current
Projects
Estimate based
on Year Money is
Appropriated in
Original PDF
FY08
Estimate
Original PDF
and FY08
Estimate
Difference
Cause for Delay
Burtonsville 4 Years 6 Years 2 Years Coordination with DHCA
Citadel 3 Years 6 Years 3 YearsRetaining wall on WMATA property, relocate 66” water
main
Fairland 6 Years 6 Years 0 YearsCoordinated utility relocation with construction resulted
in zero delay
Greencastle 4 Years 6 Years 2 YearsChange scope to add bike path length, underground
SWM, coordinate with developers
Montrose 7 Years 7 Years 0 Years 6 month delay for permit acquisition
Nebel 3 Years 7 Years 4 Years Property acquisitions involving existing buildings
Redland 3 Years 11 Years 8 Years Scope change re: reversible lanes, dam retrofit
Stringtown 5 Years 5 Years 0 YearsCoordination with developers, relocation of historical
marker, intersection construction
Woodfield 5 Years 11 Years 6 YearsChange consultant, scope change, environmental
permitting, historical conflicts
Project Scheduling: Analysis of Overall Delays
Delays can occur outside of the critical path and impact the project schedule. Moving
forward, monitoring these delays and those that occurred in critical path steps will be the
subject of regular CountyStat meetings
8/5/2008CIP Cost & Schedule Estimates

CountyStat
The critical path does not account for all schedule delays. DOT should determine how to document total delay and disaggregate based on cause i.e. community input, weather,
court challenges, unforeseen permitting issues, etc.
Source: Report, Capital Improvement Program FY08 Progress Ending 04/08
Note: Five of the projects analyzed by OLO do not have data in the current project management tracking system
and are not represented here
Project Scheduling: Analysis of Critical Path Delays
8/5/2008CIP Cost & Schedule Estimates
Current Projects: Number of Days Off Schedule from Projected Date
Projects in DesignProperty
Acquisition
To Be
Advertised Under Construction
Burtonsville
Access
Road
Woodfield
RoadNebel Street
Redland
Road
Fairland
Road
Greencastle
Road
Montrose
Parkway
Stringtown
Road
Citadel
Avenue
Present Cost
Estimate $ 6,252,000 $ 11,443,000 $ 12,011,000 $ 4,965,000 $ 10,945,000 $ 3,507,000 $ 68,135,000 $ 8,810,000 $ 5,407,000
Final Plans/Specs &
Estimate (100%) 204 0 0 0 0 25 0 0 -420
Advertise for Bids 0 111 0 58 0 -18 0 0 -88
Right-of-Way Clear 0 125 0 0 0 8 168 27 180
Utility Relocation 0 165 0 201 0 0 0 0 0
Permitting Total 0 881 0 0 0 0 137 137 0
Start Construction 0 95 0 78 162 0 0 0 5

CountyStat
DOT’s new project management software (Primavera) tracks and analyzes project
schedules and will facilitate improvements to DOT’s schedule estimating.
8/5/2008CIP Cost & Schedule Estimates
Project Scheduling: DOT Project Management

CountyStat
Agenda
Welcome and Introductions
Goals of Initial CountyStat Involvement
CIP Road Project Process
– Process Overview
– Cost Estimating• Comparison of Escalation Methodology (OMB, OLO, and FWHA)
• DOT Follow-Up
• Inflation Indexes Used by Other AAA-Rated Jurisdictions
– Schedule Estimating
• Relationship Between Project Scheduling and Cost Estimating
• Areas for Improvement
- Facility Planning
- Project Monitoring
Follow-up items
Wrap-up
8/5/2008CIP Cost & Schedule Estimates

CountyStat
Relationship Between Project Scheduling and
Cost Estimating: Cost of Delay
Cost of delay
– Prior to construction, the cost of delay is escalation
• For each $1,000,000 at 5%
- One year delay = $50,000
- One month delay = $4,167
- One week delay = $1,000 (approximately)
– During construction
• Owner-caused delay adds direct costs to contractor price
- Field office overhead
- Extended home office overhead
- Escalated material and fuel costs
- Idle crews and equipment
- Remobilization
• Contractor-caused delay results in contractor paying owner liquidated
damages
The County can best achieve cost savings by limiting project duration
through identification of process efficiencies.
8/5/2008CIP Cost & Schedule Estimates

CountyStat
Relationship Between Project Scheduling and
Cost Estimating: Construction Cost Escalation
Even minor scheduling delays have a significant impact on
construction costs.
$0
$100
$200
$300
$400
$500
$600
$700
$800
03-Feb-04 05-Jan-05 02-Nov-05 07-Sep-06 03-Jul-07 02-May-07 5-Feb-08
Asphalt Cement Price Index
8/5/2008CIP Cost & Schedule Estimates

CountyStat
Agenda
Welcome and Introductions
Goals of Initial CountyStat Involvement
CIP Road Project Process
– Process Overview
– Cost Estimating• Comparison of Escalation Methodology (OMB, OLO, and FWHA)
• Inflation Indexes Used by Other AAA-Rated Jurisdictions
– Schedule Estimating
• Relationship Between Project Scheduling and Cost Estimating
• Areas for Improvement
- Facility Planning
- Project Monitoring
Follow-up items
Wrap-up
8/5/2008CIP Cost & Schedule Estimates

CountyStat
Identified Areas for Impacting Time
Determine the optimal level of facility planning
Project monitoring
8/5/2008CIP Cost & Schedule Estimates

CountyStat
Areas for Improvement:
Facility Planning Categorization
OLO recommended that projects go through facility planning in order to minimize delays in scheduling and cost estimation
DOT believes that Facility Planning Phase 1: Concept Design can be eliminated for some simple projects
CountyStat has worked with DOT to categorize their road projects into groups based on complexity
This grouping can help determine what extent of facility planning is necessary– Simple projects – No Facility Planning Phase 1
– Intermediate projects – Some Facility Planning Phase 1
– Complex projects – Extensive Facility Planning Phase 1
8/5/2008CIP Cost & Schedule Estimates

CountyStat
Area for Improvement: Facility Planning
Road projects that complete facility planning have more accurate initial cost
schedule estimates, and shorter delay periods than projects that do not
complete facility planning.
All
Projects
Completed
Facility
Planning
Not
Completed
Facility
Planning
Average Cost
Increase
(Constant dollars)54% 28% 80%
Average Cost
Increase
(Adjusted for
Inflation)
42% 12% 72%
All ProjectsCompleted
Facility
Planning
Not Completed
Facility
Planning
Average Delay
Beyond Initial
Schedule2.8 years 2.1 years 3.4 years
Source: OLO Report 2008-4 “A Study of County Road Project Cost and Schedule Estimates
Correlation between Facility Planning and accuracy of cost and
schedule estimates
Cost EstimatesSchedule Estimates
8/5/2008CIP Cost & Schedule Estimates

CountyStat
Area of Improvement:
Facility Planning
0
2
4
6
8
10
12
Years
Comparison of Original Estimate and Actual Years to Completion for Projects that Did Not Complete Facility Planning
Source: OLO Report 2008-4 “A Study of County Road Project Cost and Schedule Estimates
Projects completing Facility Planning are more likely to be completed on schedule.
0
2
4
6
8
10
12
Comparison of Original Estimate and Actual Years to Completion for Projects that Completed Facility
Planning
Original Estimate
Actual
26 8/5/2008CIP Cost & Schedule Estimates

CountyStat
Time
– Facility Planning takes 8 months to 2 years to complete
Cost versus Benefit
– Cost of Facility Planning stage 1: Concept Design yields minimal additional
benefit for simple projects, the benefit increases with project complexity
Purpose and Need
– There is no need for an extensive Purpose and Need Document for very obvious projects
Areas for Improvement:
Facility Planning Categorization
The costs and benefits of Facility Planning vary by project type.
8/5/2008CIP Cost & Schedule Estimates

CountyStat
Areas for Improvement:
Facility Planning Categorization
DOT is in the process of formalizing Facility Planning categorization
into the standard operating procedures.
8/5/2008CIP Cost & Schedule Estimates
FY
09 P
roje
ct
Project Criteria
Project
Length
Complexity of
Topography
Environmental &
Historic Permits
ROW
Requirements
Utility
RelocationLocation
Facility
Planning
Category
Locbury Drive X Simple
Central Avenue Sidewalk X Simple
MD 355 Sidewalk X X X X Intermediate
Oak Drive/MD 27 Sidewalk X X X X Intermediate
East Gude Dr Widening X X X X X Complex
Bradley Boulevard Bikeway X X X X X Complex

CountyStat
Simple Project
Locbury Drive
Intermediate Projects
Seminary Road
Complex Projects
Montrose Parkway West
8/5/2008CIP Cost & Schedule Estimates

CountyStat
Area for Improvement:
Project Monitoring (Under Development)
Cost/Scheduling
Road project Original Cost
Original Time
Estimate
Current Cost
Estimate
Current Schedule
Estimate
Reasons for
Variation
Hypothetical Project 1
Hypothetical Project 2
Hypothetical Project 3
Preliminary Criteria
Proposed DOT framework would monitor and report project
cost and schedule information to CAO.
Participate in quarterly briefing meetings with the CAO to provide status reports on
cost and scheduling issues
Allow for executive level monitoring and problem solving
8/5/2008CIP Cost & Schedule Estimates

CountyStat
Agenda
8/5/2008CIP Cost & Schedule Estimates
Welcome and Introductions
Goals of Initial CountyStat Involvement
CIP Road Project Process
– Process Overview
– Cost Estimating• Comparison of Escalation Methodology (OMB, OLO, and FWHA)
• Inflation Indexes Used by Other AAA-Rated Jurisdictions
– Schedule Estimating
• Relationship Between Project Scheduling and Cost Estimating
• Areas for Improvement
- Facility Planning
- Project Monitoring
Follow-up items
Wrap-up

CountyStat
Follow-up Items
Cost estimating
– DOT will coordinate with OMB and other parties to determine the
optimal method for determining cost estimates.
Project scheduling
– Identify efficiencies in:
• Land acquisition in right-of-ways
• Permitting
• Procurement
• Utility relocation (Memoranda of Understanding (MOU) with Utilities)

CountyStat
Wrap-Up
Confirmation of follow-up items
Time frame for next meeting
8/5/2008CIP Cost & Schedule Estimates