Countryside Survey: Soils Report from 2007
194
www.countrysidesurvey.org.uk Soils Report from 2007 Countryside Survey:
Transcript of Countryside Survey: Soils Report from 2007
wwwcountrysidesurveyorguk
Soils Report from 2007Countryside Survey
1
Countryside Survey Soils Report from 2007
1 Centre for Ecology amp Hydrology Maclean Building Benson Lane Crowmarsh Gifford Wallingford
Oxfordshire OX10 8BB 2
Formerly Centre for Ecology amp Hydrology 3
Formerly Centre for Ecology amp Hydrology Now Environment Agency Wales
CS Technical Report No 907
Soils Report from 2007
Emmett BA1 Reynolds B
1 Chamberlain PM
2
Rowe E1 Spurgeon D
1 Brittain SA
1 Frogbrook Z
3
Hughes S1 Lawlor AJ
1 Poskitt J
1 Potter E
1
Robinson DA1 Scott A
1 Wood C
1 Woods C
1
Centre for Ecology amp Hydrology
(Natural Environment Research Council)
January 2010 (revised 23 February 2010)
2
Countryside Survey Soils Report from 2007
Acknowledgements
The Countryside Survey of 2007 is funded by a partnership of nine government funded bodies led by the Natural Environment Research Council (NERC) and the Department for Environment Food and Rural Affairs (Defra) The completion of the survey has only been made possible by the support and advice of many dedicated individuals from these and other organisations who provided their time and valuable advice to the project board the project steering group and the pro ject advisory groups The project Partners would like to thank all the landowners farmers and other land managers who gave permission for the field surveyors to collect data and samples from their land Without such cooperation scientific field studies like Countryside Survey would not be possible The Countryside Survey Partners would like to thank all those who contributed to the work presented in this report largely in NERC‟s Centre for Ecology amp Hydrology (CEH) Field surveyors regional coordinators and QA teams Nik Aspey Boris Assyov Maurice Bailey Dave Bennett Caroline Boffey Katja Busch Anne Butler Luciana Carotenuto Paul Chamberlain Rebecca Chance Jake Chant Hannah Chivers David Cole Ceirios Davies Kathryn Dawson Jan Dick Mit zi de Ville Martin Duncan Claire Edwards Richard Ellis Fiona Everingham Angus Garbutt Iain Gunn Anne Harvey Adrianna Hawczak Stuart Hedley Lynn Heeley Gale Hodges Nik Hudson Sarah Hulmes Gwilym Jones Ursula Jones Jana Kahl Emma Koblizek W endy MacFarlane Lindsay Maskell Alain Mauric Elaine McClymont Sebastian Meis Bruce Miller Ruth Mitchell Lindsay Moore Lila Morris Mike Morecroft Owen Mountford John Murphy Emma Nicklin Lisa Norton Peter Nuttall Judith O‟Hare Martin Page De nise Pallett Hristo Pedashenko Jodey Peyton Alison Pike Hannah Price Maria Ramirez -Jimenez Amy Rees Brian Reynolds Nicola Rivett Glenn Roberts Liz Roberts Patrick Home Robertson Rob Rose Martin Rossall Ed Rowe Frank Ryan Stephen Ryder Pete Scarlett Dave Scott Robert Seaton Luke Sidebottom Louise Slack Simon Smart Tom Smith Jon Steele Peter Steward Michelle Taylor Sam Thomas Nicola Thompson Will Thomson Annie Truscott Linda Turner Jackie Ullyett Kiril Vasilev Katy Walker Ke vin Walker Alistair Watson Trevor West James Whiteford Michael Wilcox Lorna Wilkie Geoffrey Wilkinson Claire Wood Statistical analytical technical and data management support Annie Brittain Mike Brown Paul Chamberlain Kathy Chandler Jackie Chaplow Jenny Clapham Ralph Clarke Andy Crowe Zoe Frogbrook Steve Hughes Alan Lawlor Jan Poskitt Elaine Potter Annabel Rice Phil Rowland Andy Scott Rod Scott Rick Stuart Nicola Thomson Colin Vincent Mike Wilson John Watkins Ruth Watts Claire Wood Clive Woods and Simon Wright Advice and training Colin Barr Helaina Black Bob Bunce Zoe Frogbrook Dave Howard Mike Hornung Steve Marshall Steve Moss and Dave Wilson Project management and administration Mark Bailey Mike Brown Peter Carey Julie Delve Bridget Emmett Les Firbank Julie Grimshaw Lindsay Maskell John Murphy Lisa Norton Dan Osborn Terry Parr Ian Simpson Simon Smart and John Watkins
3
Countryside Survey Soils Report from 2007
Contents
Executive Summary p4 1) Field Sampling and Bulk Density p9 2) Carbon p18 3) Soil pH p47 4) Total nitrogen and CN p71 5) Mineralisable-N p89 6) Olsen P p108 7) Soil metal concentrations p129 8) Soil invertebrates p167
4
Countryside Survey Soils Report from 2007
Executive Summary
Executive Summary
Countryside Survey is a unique study or bdquoaudit‟ of the natural resources of the UK‟s countryside The Survey
has been carried out at regular intervals since 1978 The countryside is sampl ed and studied using rigorous
scientific methods allowing us to compare results from 2007 with those from previous surveys In this way
we can detect the gradual and subtle changes that occur in the countryside over time A series of reports
have been published outlining the main findings for UK and individual countries which included results for two
soil variables namely soil carbon and acidity This report outlines the major findings for all soil variables
measured as part of the survey in 2007
Key policy questions to be answered in 2007 were
Can we confirm the loss of soil carbon (0-15cm) as reported by Bellamy et al 2005
Has the recovery from acidification detected by Countryside Survey in 1998 between 1978 and 1998
continued
Can the trend of eutrophication of the countryside detected in the vegetation be detected in the soil
using the mean total nitrogen concentration
Can the trend of eutrophication of the countryside detected in the vegetation be detected in the soil as
well using a more sensitive soil process method for nitrogen
Can the trend of increasing P status in intensive grasslands be confirmed and is it matched in other
habitats
Is the decline in atmospheric deposition of heavy metals as reported by the Heavy Metals Monitoring
Network reflected in soil metal concentrations measured in Countryside Survey
Does Countryside Survey provide any evidence to indicate that there has been a loss of soil
biodiversity as has been stated by the European Union
Soils have been part of Countryside Survey since it‟s inception in 1978 The rationale for their inclusion was
originally to provide many of the explanatory variables which contribute to the understanding of vegetation
distribution and change which are the central core of the survey More recently soils have been recognised
as a valuable resource in their own right due to their importance for delivering a range of ecosystem services
Consequently the number of variables have increased over time from soil organic matter and pH in 1978 to
nutrients contaminants and biodiversity in 1998 and soil physical measurements and biogeochemical fluxes
in the latest survey in 2007
The soil variables were selected for inclusion in the 2007 survey according to a range of criteria including
relevance to policy needs scientific questions uniqueness of Countryside Survey soils data both in isolation
and when combined with other Countryside Survey variables value for money and links and compatibility
with other soil monitoring programmes It should be noted that with the exception of soil invertebrates many
Countryside Survey soil variables are currently included in the list of recommended primary indicators of soil
quality by the UK Soil Indicator Consortium namely soil organic matter soil organic carbon bulk density soil
acidity (pH) mean total nitrogen concentration an indicator of phosphorus availabil ity (Olsen-P) an indicator
of nitrogen availability (mineralisable-N) total copper zinc cadmium and nickel All variables with the
exception of soil invertebrates are measured in the top 15cm of the soil profile only Soil invertebrates are
recorded for the top 8cm of soil This focus on the top 15cm of soil mirrors the focus of several other soil
monitoring programmes as it is thought the top soil horizons are the most susceptible to change over time as
they are more immediately affected by land management activities and environmental change Ideally future
soil monitoring should include lower soil horizons as important stocks of carbon supply of nutrients filtering
and storage of contaminants and soil biota occur below the top 15cm
Countryside Survey uses a sampling approach which samples one-kilometre squares randomly located within
different land class in GB The original 1978 survey consisted of 256 1-km squares and collected five soil
samples per square where possible taken from random co-ordinates in five segments of the square Detailed
vegetation and other biophysical measurements were taken at the same location In total the 1978 survey
collected 1197 soil samples for analysis During 1998 surveyors collected soil samples from the plots used
5
Countryside Survey Soils Report from 2007
Executive Summary
for soil sampling in the original 1978 squares and 1098 samples were returned for analysis Plots were re-
located using maps andor markers placed in the 1978 survey In 2007 591 1-km squares were sampled with
a total of 2614 samples returned for analysis More samples were therefore taken in 2007 than collectively in
1978 and 1998 This increase in sample over time has been driven by the requirement to provide individual
country level reports first for Scotland in 1998 and then Wales in 2007 Statistical methods are used to
enable this increase in sample number over time to be taken into account when estimating change over time
The limited number of sampling sites in Wales in 1978 and 1998 have limited the number of vegetation and
soil categories where change can be reported However the data provides an important expanded baseline
for reporting a wider range of changes in future surveys
Full details on all methods used are available from the Countryside Survey website (Emmett et al 2008
available at httpwwwcountrysidesurveyorgukpdfreports2007CS_UK_2007_TR3pdf)
Results are reported by three major categories for Great Britain and individual countries
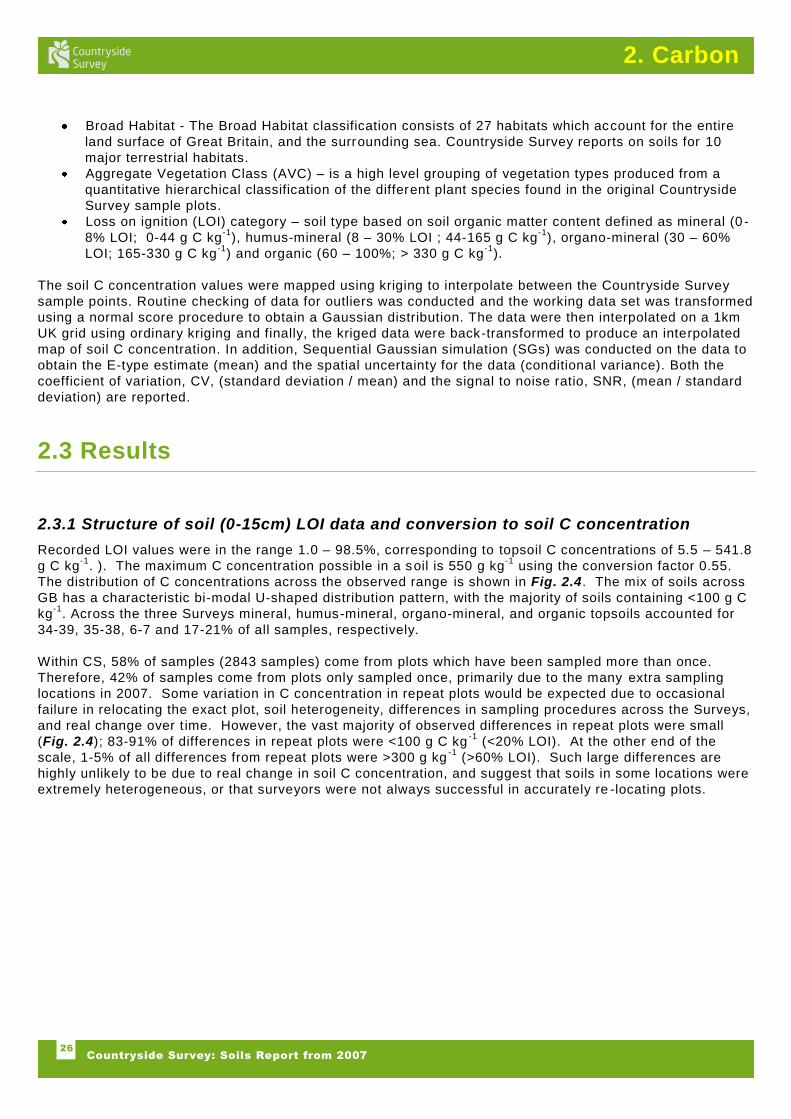
Broad Habitat - The Broad Habitat classification consists of 27 habitats which account for the entire
land surface of Great Britain and the surrounding sea Countryside Survey reports on soils for 10
major terrestrial habitats
Aggregate Vegetation Class (AVC) ndash is a high level grouping of vegetation types produced from a
quantitative hierarchical classification of the different plant species found in the original Countryside
Survey sample plots Soil organic matter category - Mineral humus mineral organo-mineral and organic soils
Significant results relate to statistical significance with their ecological and policy relevance highlighted
where appropriate
Key findings from the soils component of the Countryside Survey in 2007 are
Bulk Density
A total of 2614 samples were sampled from 591 1km squares from across G reat Britain during the Countryside Survey field survey in 2007
Topsoil bulk density measurements were carried out on all individual samples collected in 20 07 Values ranged from 002 to 195 g cm
-3 and were negatively correlated with soil C concentration
Mineral soils exhibited the highest bulk density values and organic soils the lowest Average topsoil bulk density across Aggregate Vegetation Class and Broad Habitat classes varied between 02 and 12 g cm
-3 and was lowest in Bog soils and highest in Arable and Horticulture soils
A new transfer function between bulk density and C has been defined which significantly changes past estimates of soil carbon densities and stocks (0-15cm) of organic soils previously published for other surveys
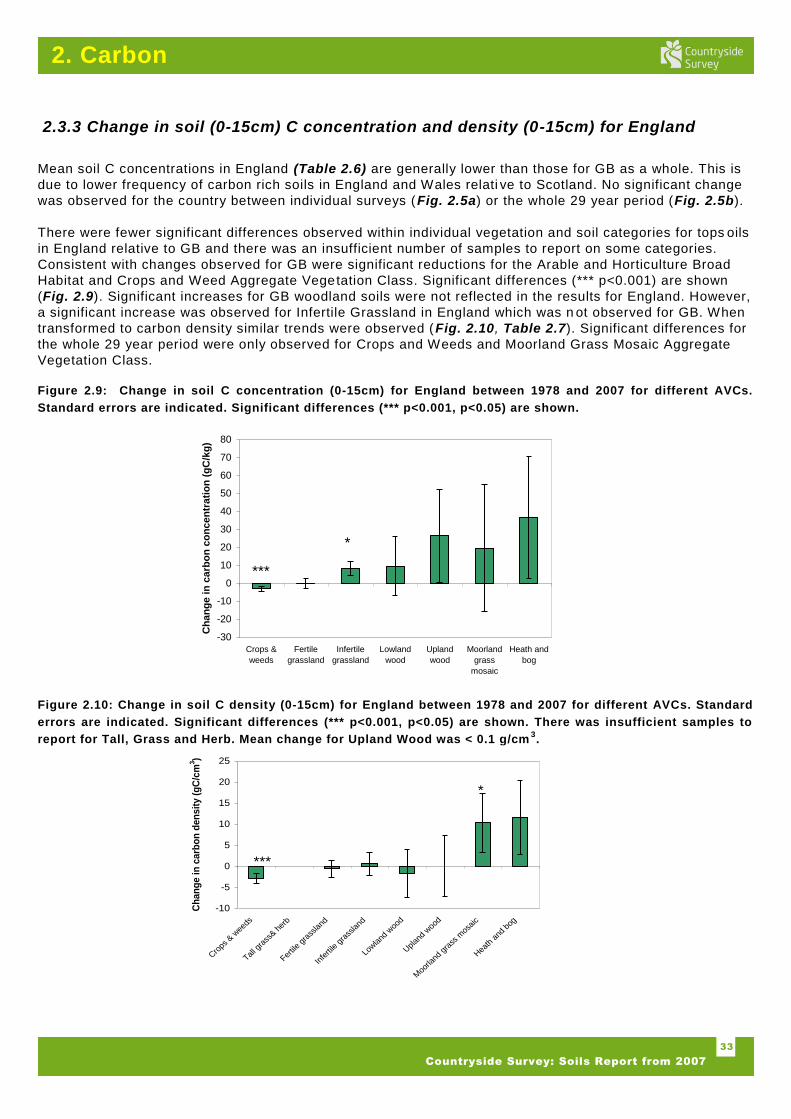
Carbon
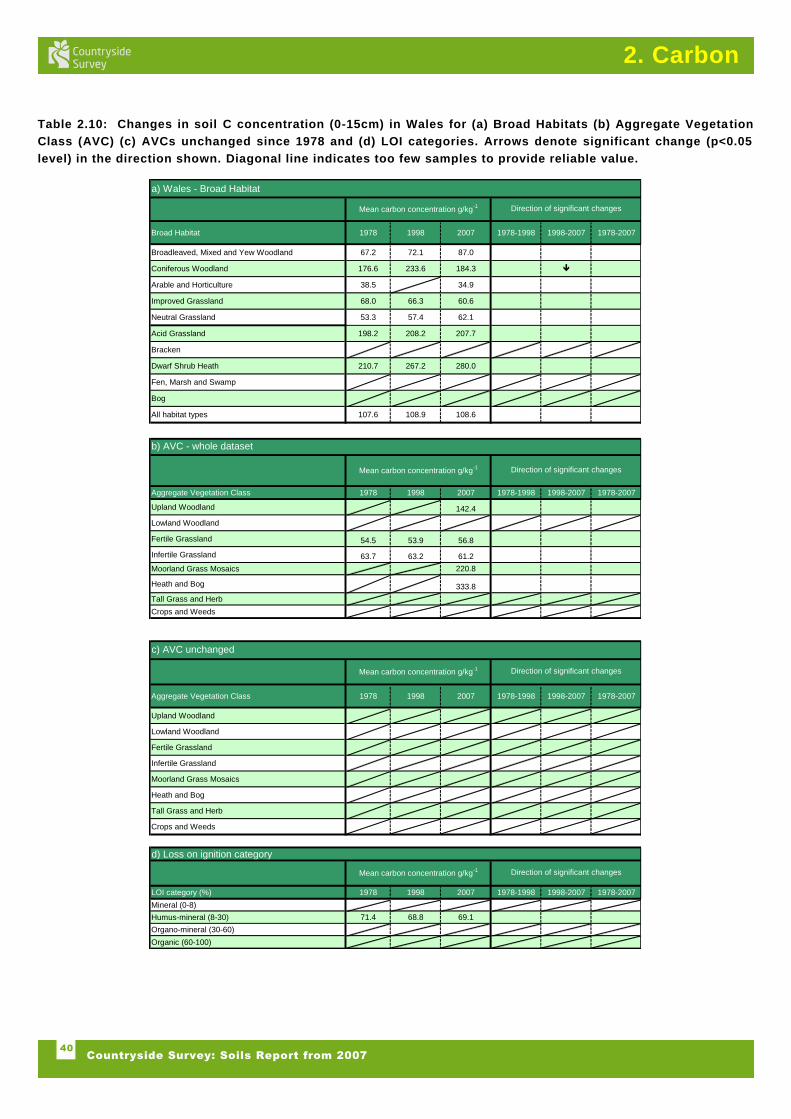
Carbon concentration in the soil (0-15 cm) increased in Great Britain between 1978 and 1998 and decreased between 1998 and 2007 Overall there was no change in carbon concentration in the soil (0-15 cm) in Great Britain between 1978 and 2007 and cannot confirm the loss reported by the National Soil Inventory
The one consistent exception is loss of carbon (0 -15cm) from the intensively managed Arable and Horticulture Broad Habitat Crops and Weeds Aggregate Vegetation Class This suggests that current policies in place to limit soil degradation are not maintaining soil quality in cropped land
The mean soil (0-15cm) carbon density across Great Britain in 2007 was calculated to be 69 tha ranging between a mean of 47 tha in the Arable and Horticulture Broad Habitat to a mean of 91 tha in Acid Grassland Peat soils do not contain the highest density in topsoil due to low bulk densities The new transfer function between bulk density and C significantly changes past estimates of soil carbon densities stocks and change (0-15cm) of organic soils previously published for other surveys
6
Countryside Survey Soils Report from 2007
Executive Summary
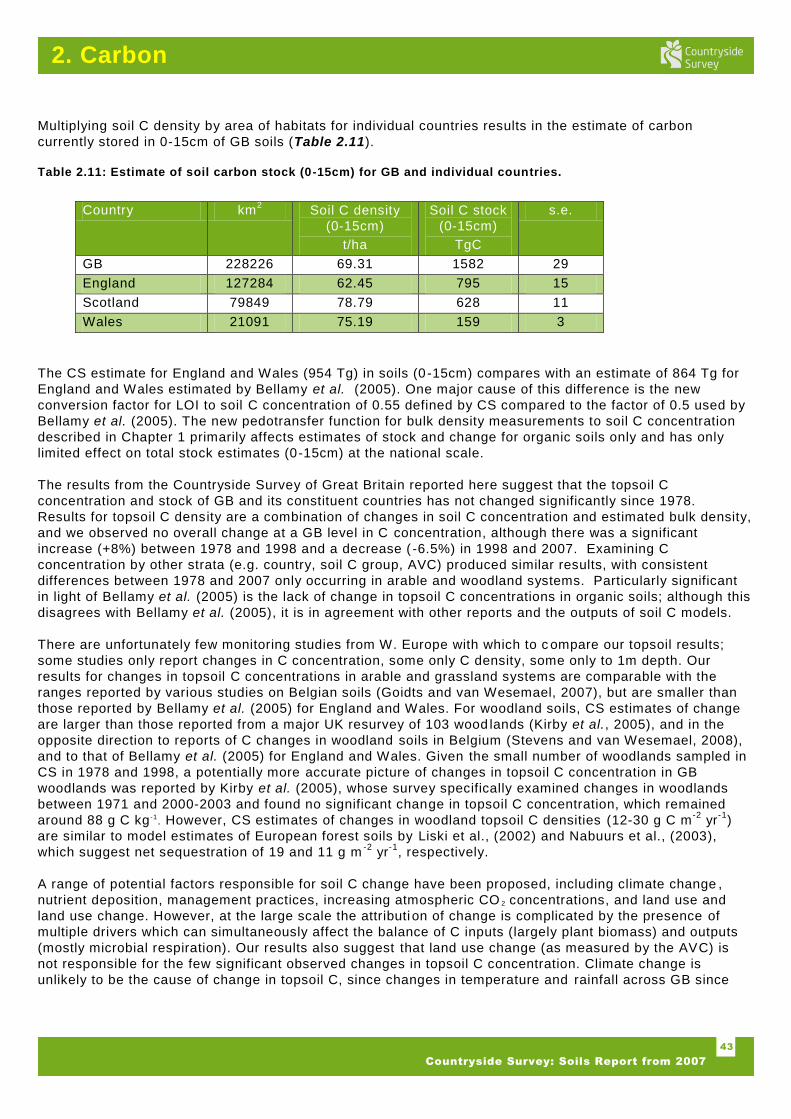
Area estimates for each Broad Habitat were used to convert soil carbon densities to soil (0-15cm) carbon stock for GB and individual countries Soil (0 -15cm) values were 1582 TgC for GB and 795TgC 628 TgC and 159 TgC for England Scotland and Wales in 2007 respectively It must be emphasised this significantly underestimates the tota l carbon stock in soils due to the large carbon stores at depth particularly in peat soils This has greatest impact for estimates for Scotland However topsoil carbon stocks may be most vulnerable to land management activities and environmental change
pH
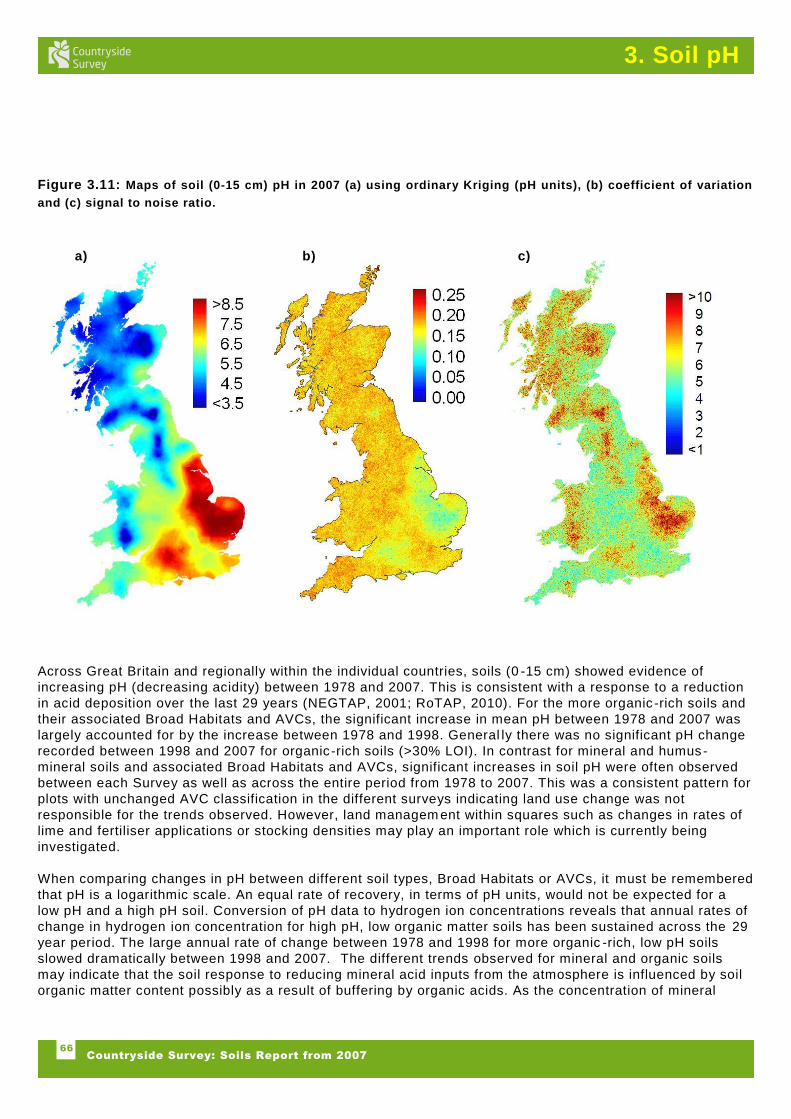
The mean pH of soils (0-15cm) increased in less acidic soils across Great Britain (GB) between 1998 and 2007 continuing a trend observed between 1978 and 1998 These soils are associated with Broadleaved Woodland Arable and Horticulture Improved Grassland and Neutral Grassland Broad Habitats This increase in pH is consistent with the expected benefit of continued reductions in sulphur emissions
There was no significant change in mean soil (0-15 cm) pH in more acidic organic-rich soils across Great Britain between 1998 and 2007 This will affect Broad Habitats such as Bog Dwarf Shrub Heath and Acid Grassland Data analysis is ongoing to determine if the lower su lphur reductions in the north and west of the Great Britain or other drivers of change such as nitrogen deposition and land management are responsible in the organic soils where pH did not significantly increase between 1998 and 2007 Conversion between land uses between surveys was not responsible for this as similar trends were observed in soils with or without conversion
One exception with no apparent trends between any time period was Coniferous Woodland It is possible the acidification of soils associated with intensive forestry due to base cation uptake and enhanced capture of acidic pollutants by the tree canopy may be offsetting the effects of reduced sulphur emissions
The results for individual countries broadly reflected those for Great Britain as a whole with continued increase in soil pH only observed in less acidic soils Insu fficient sample size for some habitat types with lower area in individual countries prevented significant trends being identified in some cases
The implications of these findings are that current emission control policies combined with current policies to protect soil through sustainable land management practices have had some major benefits but they may not be sufficient to promote continued recovery from acidification in organic -rich soils
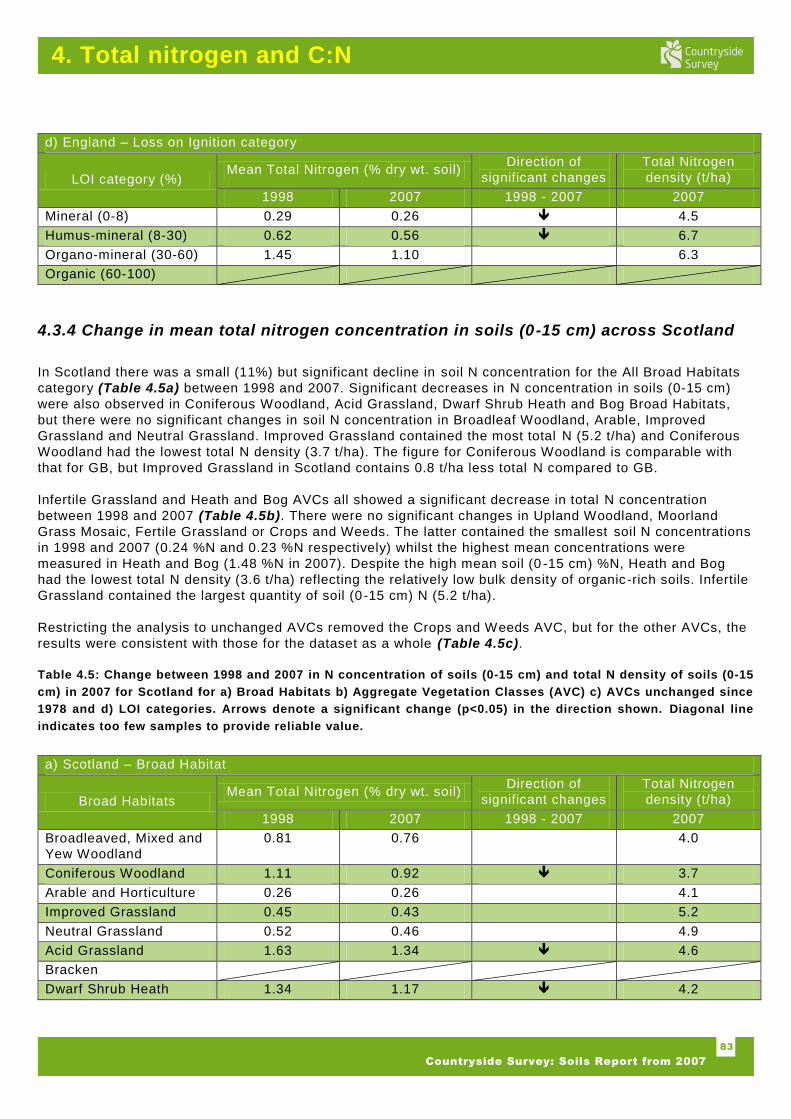
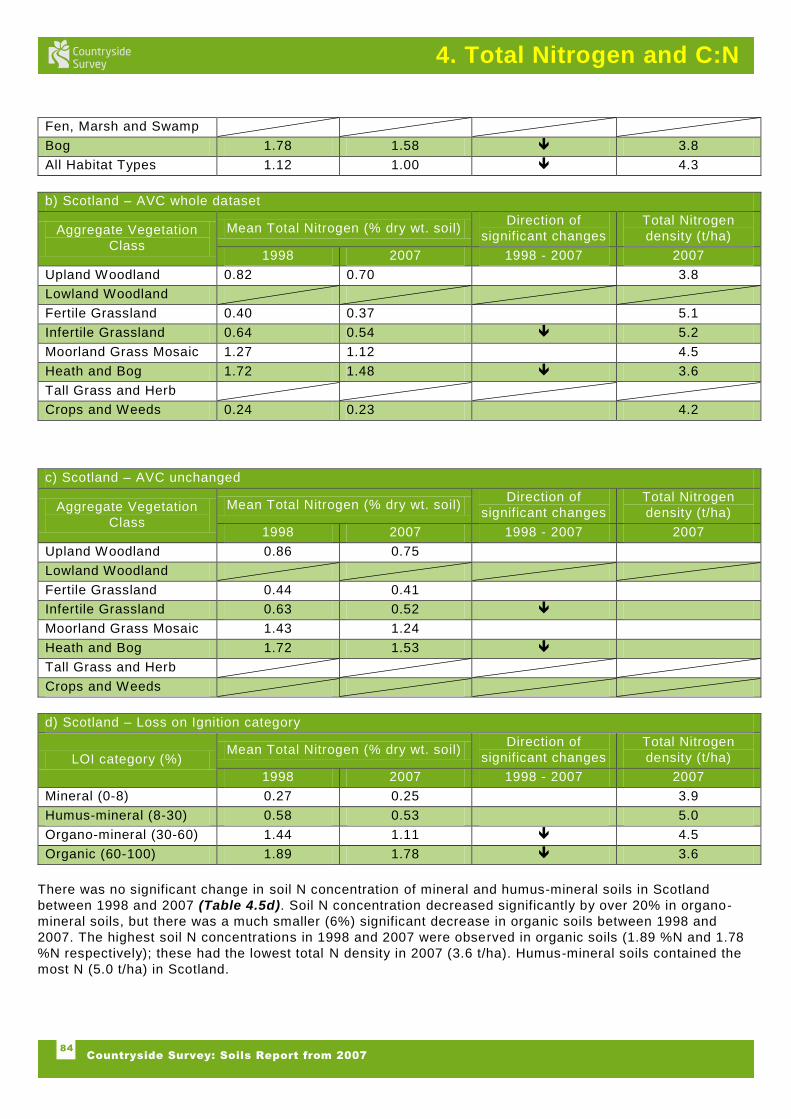
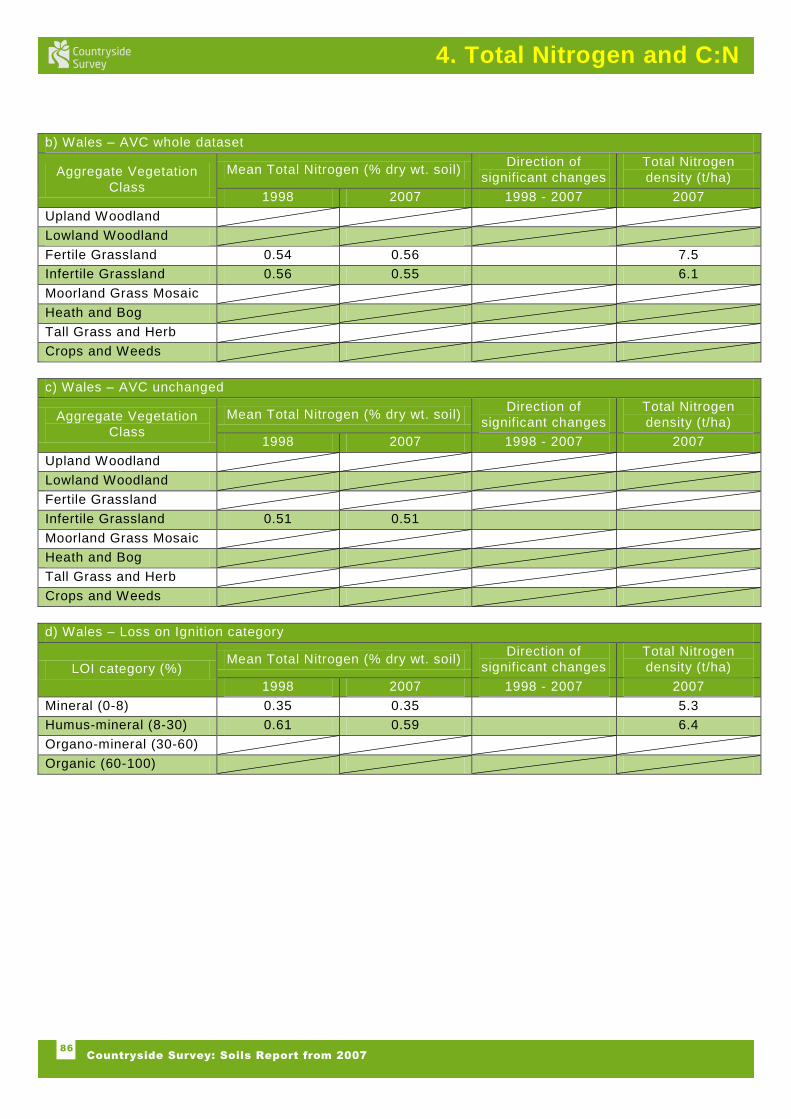
Nitrogen
There were small but significant decreases in mean so il (0-15 cm) total nitrogen concentration between 1998 and 2007 in many Broad Habitats and Aggregate Vegetation Classes across Great Britain and the individual countries no reporting category recorded an increase in mean soil (0 -15 cm) total nitrogen concentration
For semi-natural and woodland soils continued input of nitrogen deposition at 20 -30 kgNhayr for many parts of Great Britain has not caused the expected average increase of 3 -4 in this basic soil property Instead the decreases observed combined with a trend for an increase in total carbon to nitrogen ratio suggest there may be increased nitrogen loss or uptake possibly combined with a trend for increased carbon density as reported for some soils in Chapter 2 The effects of one or both of these processes would be to effectively bdquodilute‟ the soil (0 -15cm) nitrogen concentration signal Both processes (increased nitrogen loss and increased carbon fixation by plants leading to storage in soil) are known possible consequences of nitrogen enrichment which can result in vegetation composition change and thus this parameter may not be a sensitive indicator of eutrophication from atmospheric nitrogen deposition
There was no change or a small significant decline in mean soil total nitrogen concentrati ons in improved and fertile grassland categories between 1998 and 2007 across Great Britain and within individual countries despite major reductions in fertiliser use As there is no change in the soil (0 -15cm) total carbon to nitrogen ratio this indicates farmers have maintained soil nitrogen status in managed grassland systems despite a reduction in mineral fertiliser use possibly due to use of alternative organic sources of nitrogen such as slurry and organic waste products
7
Countryside Survey Soils Report from 2007
Executive Summary
In cropland systems a significant decline in soil (0-15cm) total nitrogen concentrations and total carbon to nitrogen ratios was observed between 1998 and 2007 for Great Britain and England A significant decline in soil (0-15cm) total carbon concentrations was also reported (Chapte r 2) As there is only a small decline in fertiliser use in these systems and there is evidence of combined carbon and nitrogen loss deep ploughing erosion or increased decomposition rates may be the most likely explanation of this trend
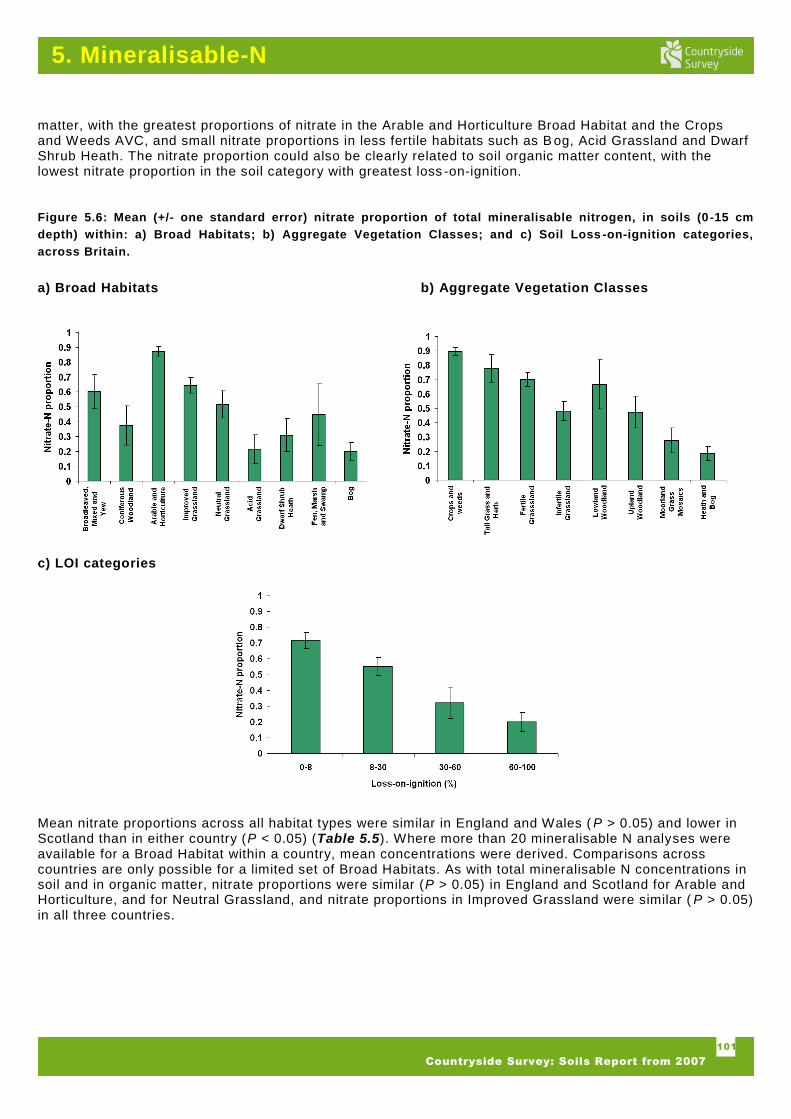
Mineralisable-N
Mineralisable-N stock (kgN ha) in soil (0-15cm) was a sensitive indicator of recognised differences in nitrogen availability between different vegetation types suggesting it is a promising indicator of eutrophication of the countryside
Initial investigations testing the link between mineralisable-N and occurrence of plant species in 45 test sites suggests it provides additional information to mean total nitrogen concentration data (N) possibly linked to short term changes in nitrogen availability or specific vegetation or soil types
There were strong geographical trends in the proportion of mineralised -N transformed to the mobile form nitrate which suggest a close relationship to broad-scale climatic or soil parameters
Future analyses will separate out the inherent variability associated with climate vegetation and soil type to identify spatial patterns which can be linked to atmospheric deposition and changes in management
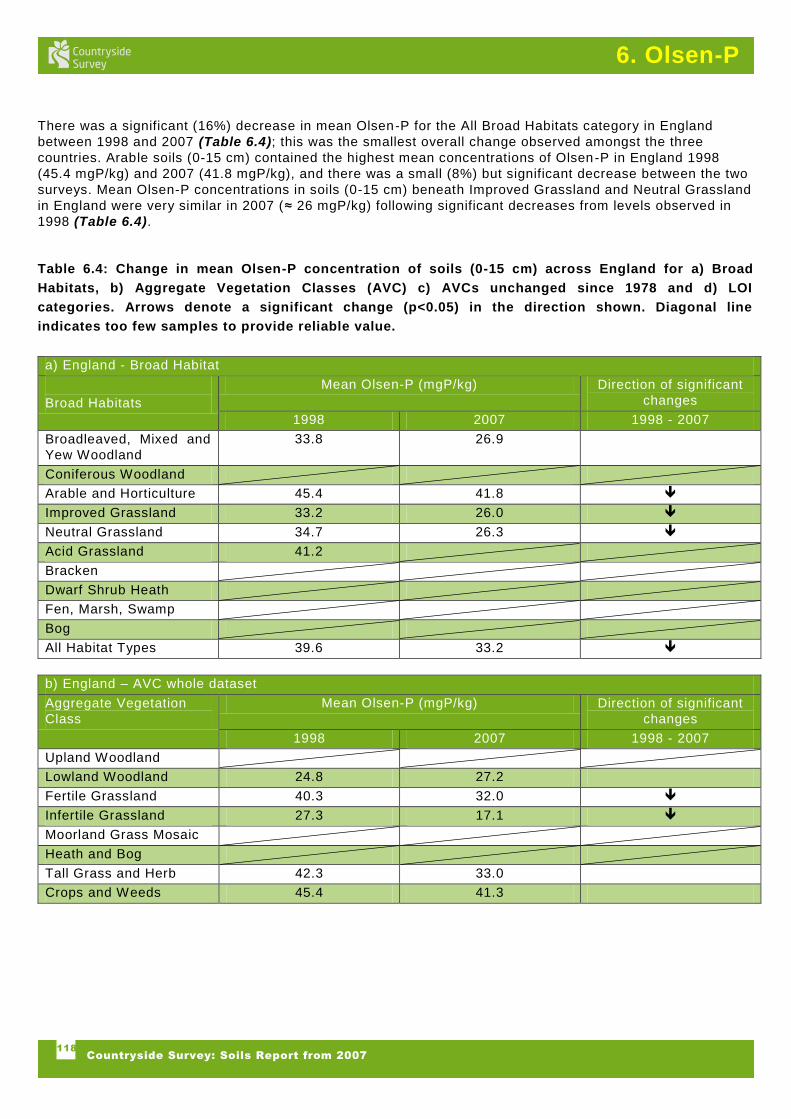
Olsen-P
Mean Olsen-P concentrations in soil (0-15cm) is an index of the fertility of agricultural soils It‟s use and relevance in semi-natural and organic soils is less certain Soils collected during Countryside Survey in 1998 and 2007 indicated there had been a significant decrease in Olsen-P concentrations in soil (0-15cm) in most Broad Habitats or Aggregate Vegetation Classes across Great Britain and within individual countries
Olsen-P concentrations in soil (0-15cm) decreased significantly in all soil organic matter categories across Great Britain and within individual countries between 1998 and 2007 apart from humus-mineral soils in Scotland where no change was observed
The data do not confirm a trend of increasing P status in intensive grasslands or any other habitat soils (0-15cm) but indicate a loss of available phosphorus between 1998 and 2007 across a wide range of habitats and soil types This is likely to be linked to the large reductions in phosphorus fertiliser use over the same period
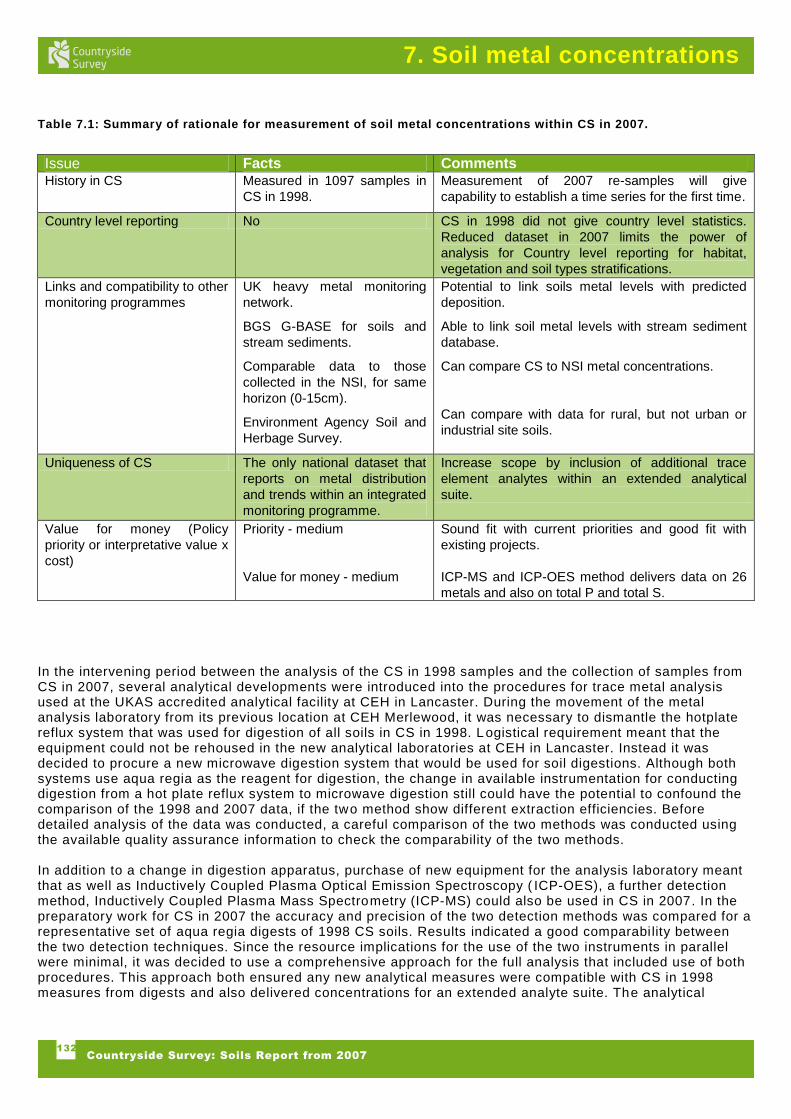
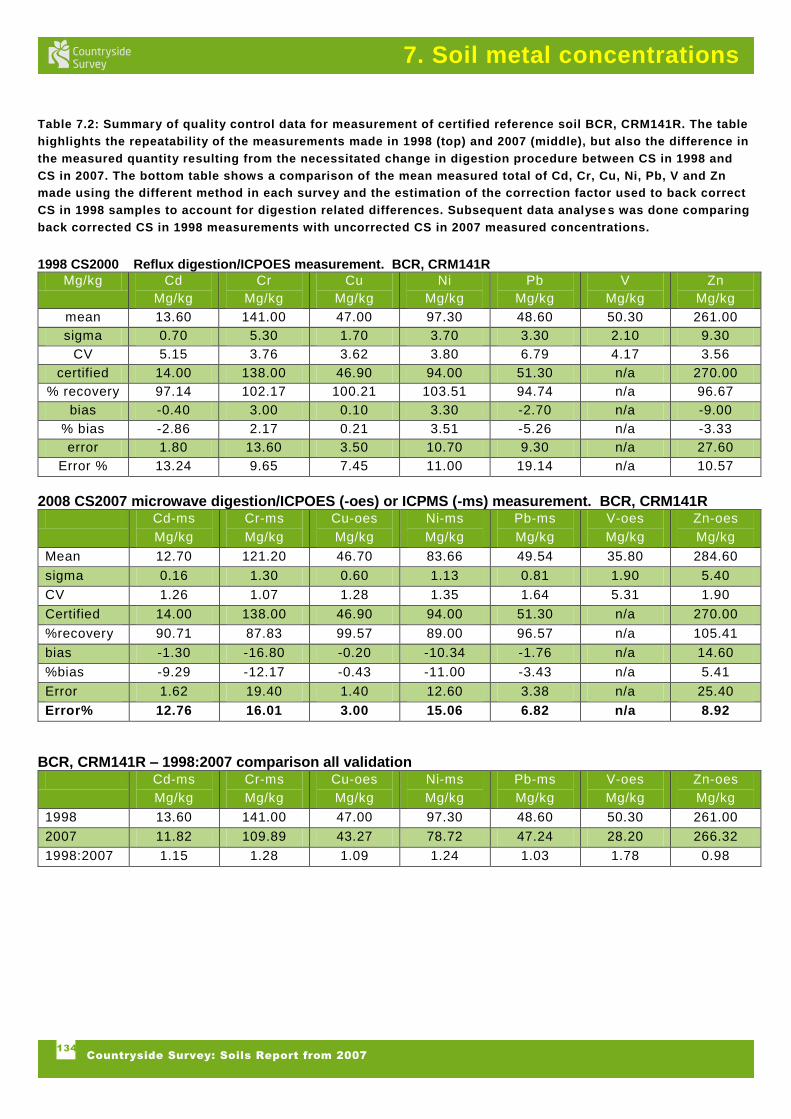
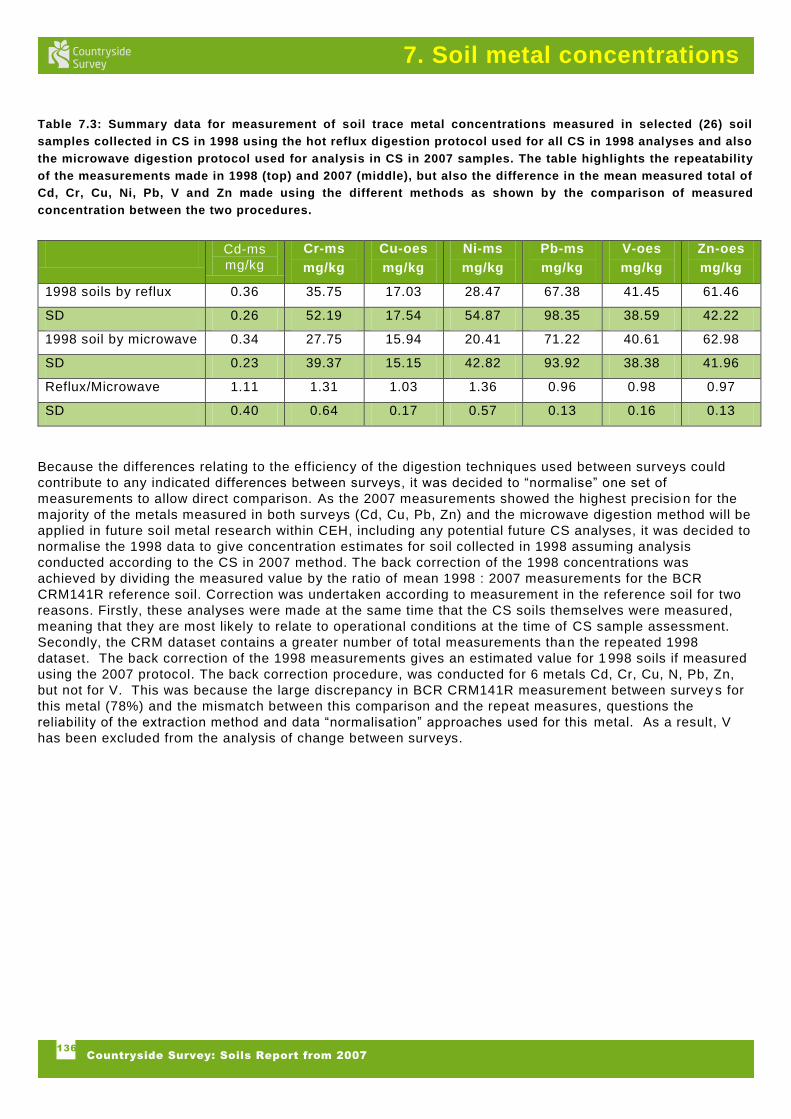
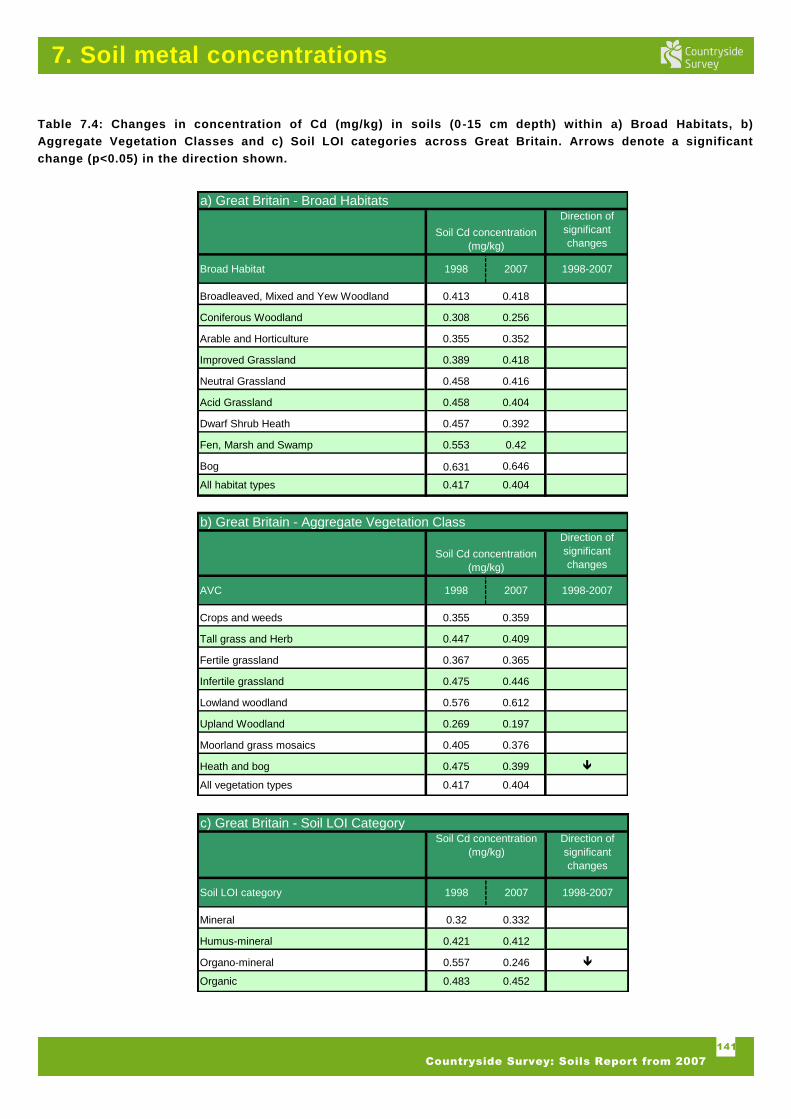
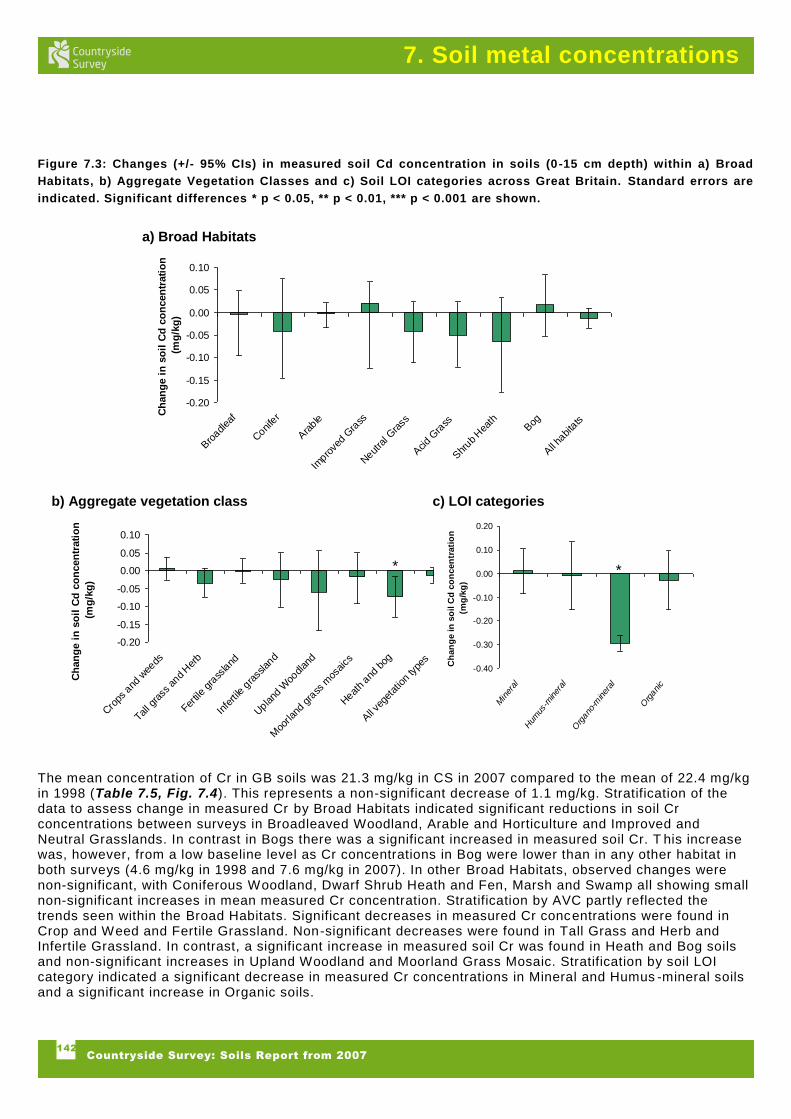
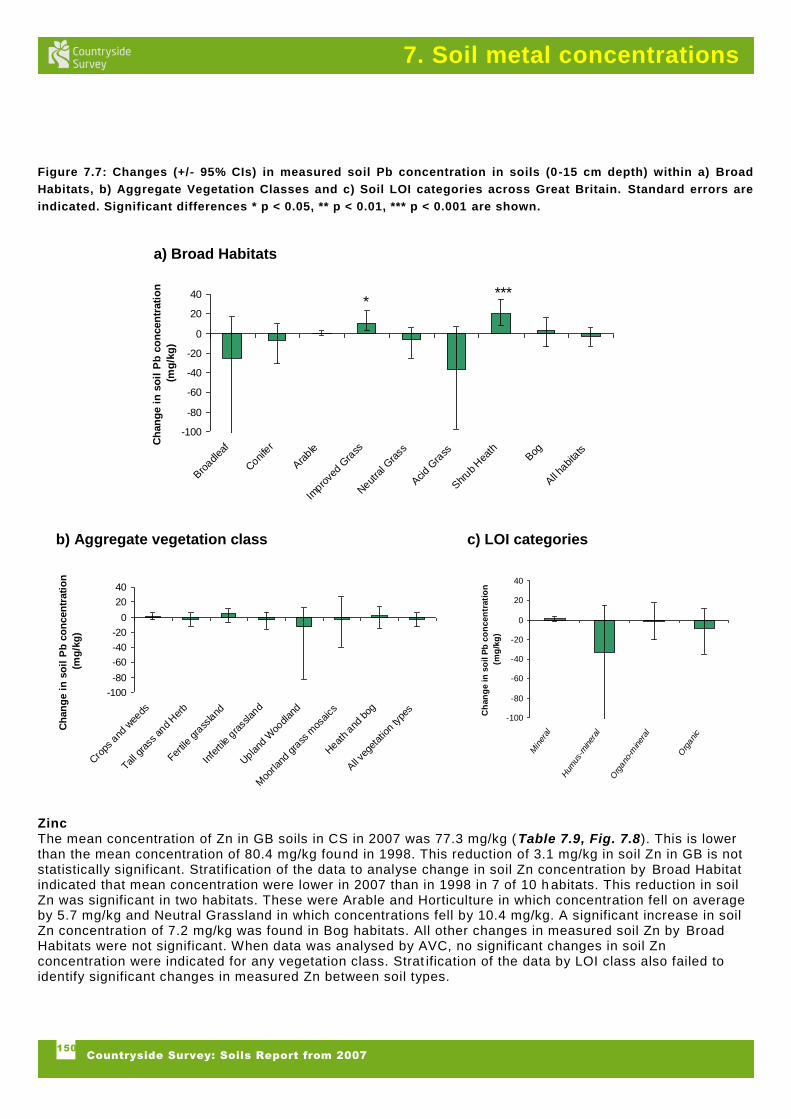
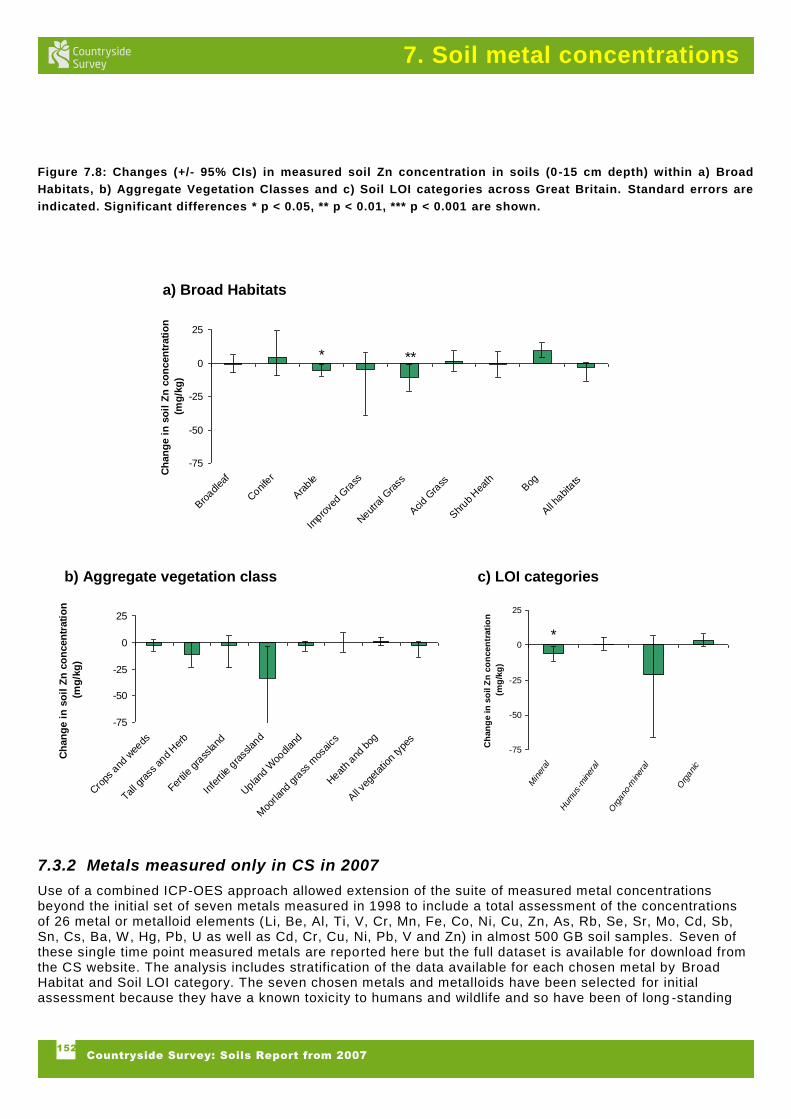
Metals
A comparison of back corrected Countryside Survey soils (0 -15cm) analyses for 1998 and 2007 samples indicated that as would be expected only relative small changes in soil trace metal concentrations occurred between surveys despite reported declines in atmospheric deposition due to the long residence time of metals in soils
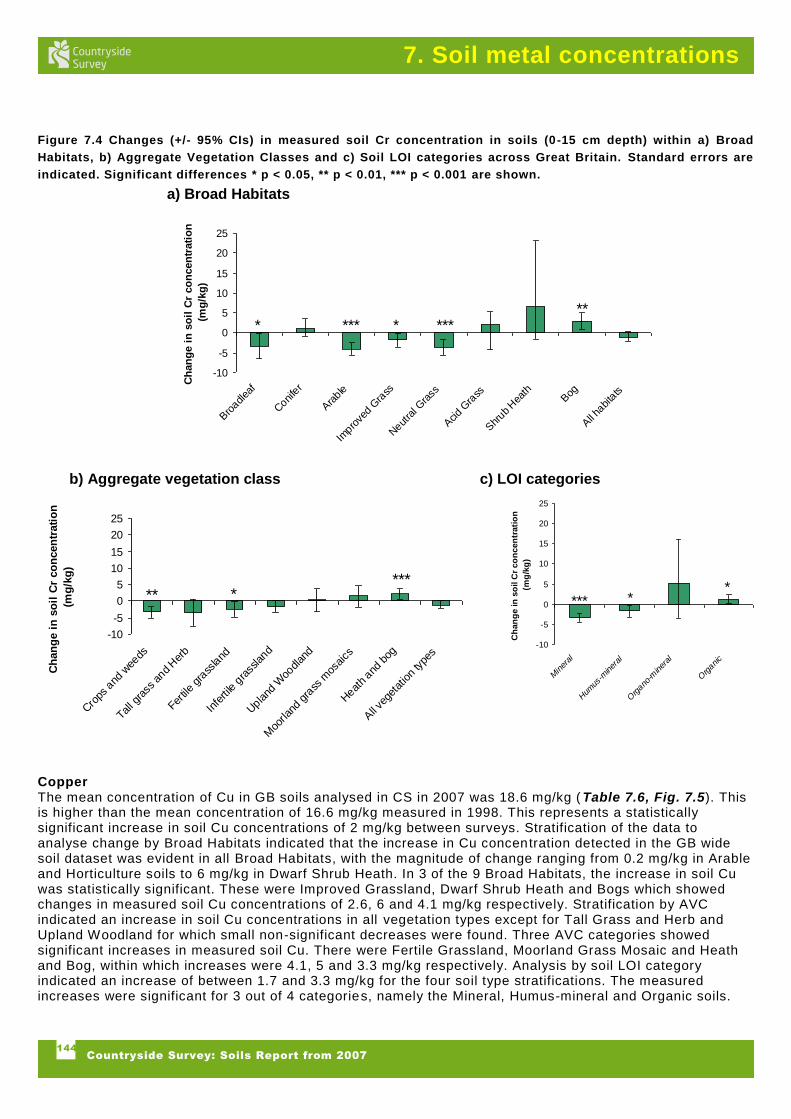
Of seven metals for which repeat measurement were made during the 2007 survey only for one Cu was a statistically significant difference in soil (0 -15cm) concentrations (an increase) found at the GB level
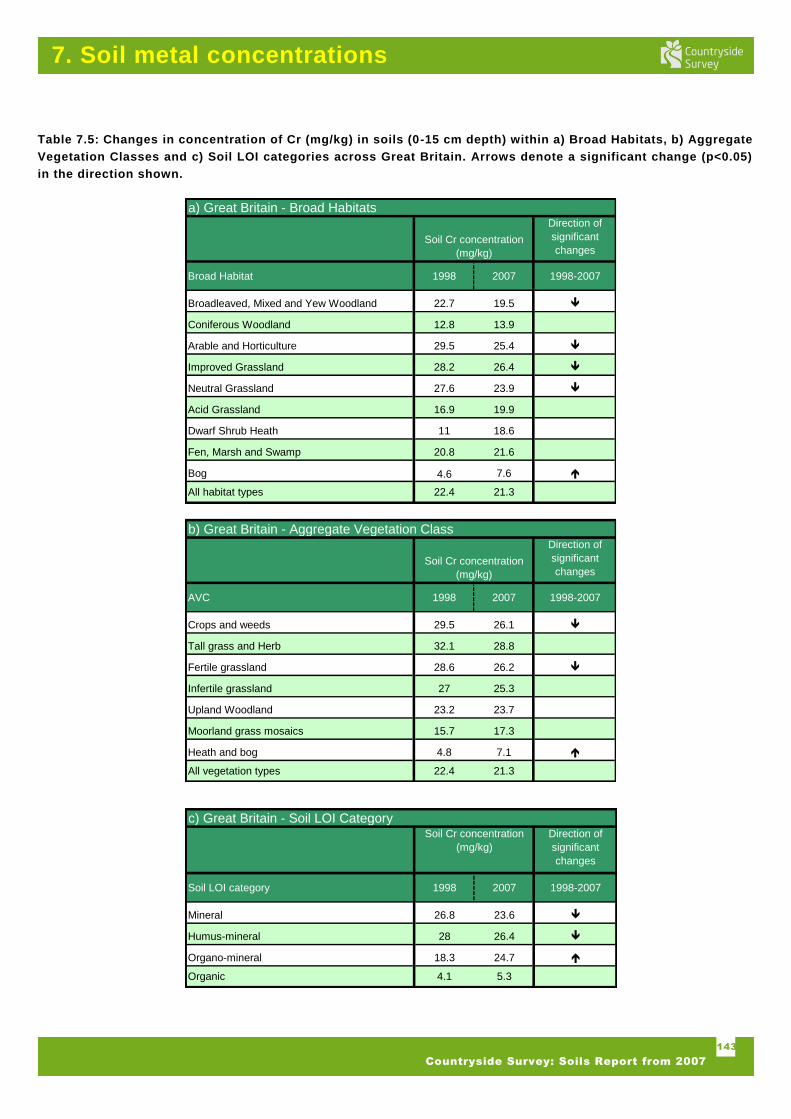
When the data for repeat metal measurements were stratified by Broad Habitat Aggregate Vegetation Class and soil organic matter category further statistically significant differences were seen For Cu generally significant increases were observed whilst for two metals Cd and Pb changes were small and idiosyncratic between stratifications For three metals Cr Ni Zn changes were generally characterised by reduction in crop lands and no change or slight increases in less managed habitats
For some metals such as Cu and Cd it is likely that additional sources (animal manures and possibly sewage sludge manures and compost for Cu and fertiliser for Cd) beyond atmospheric inputs are important in maintaining or even increasing soil concentrations principally in managed areas For the remaining metals especially Cr Ni and Zn there is some suggestion that in areas where cropping takes place output fluxes may now exceed inputs enabling soil concentrations to decline
8
Countryside Survey Soils Report from 2007
Executive Summary
Managed landscape where intensive cropping takes place but sewage sludge a nimal manures and composts are rarely applied may be among the first habitats to return from their slight -moderately elevated states to their pre-industrial background concentrations and could be a focus for future monitoring
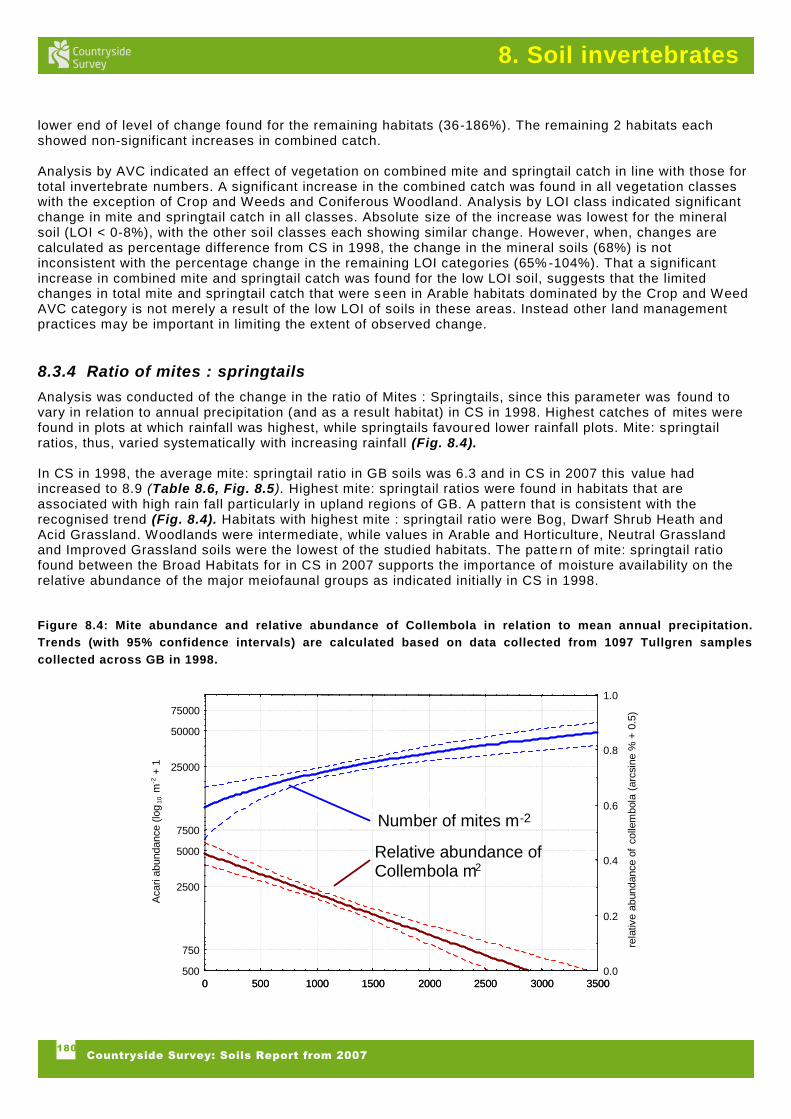
Soil Invertebrates
There were an estimated 128 quadrillion (128x1016
) soil invertebrates present in the top 8 cm of Great Britain soils during the time of Countryside Survey sampling in 2007 Comparing these results with those from the survey in 1998 has enable change in soil b iodiversity to be estimated at a national scale
A significant increase in total invertebrate catch in samples from soils (0-8cm) from all Broad Habitats Aggregate Vegetation Classes and soil organic matter categories except for agricultural areas on mineral soils was found in Countryside Survey in 2007 The increase in invertebrate catch was mainly the result of an increase in the catch of mites in 2007 samples This resulted in an increase in the mite springtail ratio but a decreased Shannon diversit y due to the dominance of mites in Countryside Survey in 2007 cores
A small reduction in the number of soil invertebrate broad taxa (0 -8cm) was recorded which is not inconsistent with reported declines in soil biodiversity However repeat sampling is required to ensure this is not linked to different seasonal conditions in the two sampling years Further analysis through focussed study may be needed to assess whether the changes in soil chemistry land management annual weather patterns or merely natural population variation can explain observed soil invertebrate community changes
Preliminary results from the soils work were presented in the Countryside Survey UK Results from 2007
report (Carey et al 2008 ab) and the country Reports published for England Scotland and Wales in 2009
(httpwwwcountrysidesurveyorgukreports2007html )
Data for the Countryside Survey in 2007 and earlier years have previously been released via the project web
site (httpwwwcountrysidesurveyorgukdatahtml)
The policy implications of trends observed are outlined in each chapter of the report together with a
discussion of possible causes of the changes observed Ongoing data analysis is focussed on identifying the
links between soil variables measured between soil and vegetation and water quality changes reported in
other Countryside Survey reports and between trends in soil variables and the intended and unintended
change of our environment from man‟s activities such as land use and management air pollution and climate
change A subset of the results from these analyses will be reported in the Countryside Survey Integrated
Assessment Report later in 2010 with the remainder in the scientific peer-review literature
9
Countryside Survey Soils Report from 2007
1 Field sampling and Bulk Density
Summary
A total of 2614 samples were collected from 591 1km squares across GB during the CS field survey
in 2007
Topsoil bulk density measurements were carried out on all individual samples collected in 2007
Values ranged from 002 to 195 g cm-3
and were negatively correlated with soil C concentration
Mineral soils exhibited the highest bulk density values and organic soils the lowest Average
topsoil bulk density across Aggregate Vegetation Class and Broad Habitat classes varied between
02 and 12 g cm-3
and was lowest in bog soils and highest in arable and horticultural soils
A new transfer function between bulk density and C has been defined which significa ntly changes
past estimates of soil carbon densities and stocks (0-15cm) of organic soils previously published
for other surveys
11 Introduction
Countryside Survey (CS) is an integrated survey of the GB countryside and soils have been part of CS since
its inception in 1978 The rationale for their inclusion was originally to provide many of the explanatory
variables which contribute to the understanding of vegetation distribution and change which are the central
core of the survey
The sampling strategy used for CS is based on a rigorous statistical approach as an audit of the entire GB
countryside combining monitoring of habitat vegetation soils and waters would be prohibitively expensive
and impractical to run CS uses a sample based approach to collect information at the level of detail required
for national reporting whilst providing the benefits of integrated monitoring It is important to remember that
the results of CS are therefore calculated estimates and not absolute numbers derived from a complete
coverage of the country
Great Britain was stratified first into Land Classes based on the major environmental gradients across the
countryside This permitted the sample to be structured to give reliable national statistics and also ensured
that the sample is representative of the range of different environments found in Great Britain (England
Scotland and Wales) The sample consists of a set of bdquosample squares‟ measuring 1km x 1km selected
randomly from the Ordnance Survey grid within the various Land Classes Altogether 591 sample squares
were surveyed in 2007 289 were in England 107 in Wales and 195 in Scotland Sufficient sample squares
were selected from each geographical region to enable reliable statistical reporting for Great Br itain as a
whole and for each separate country (Table 11) As far as possible the same squares are resampled each
time CS is repeated but in addition each successive CS has included greater numbers of sample squares
The estimates of change presented in this report use a statistical modelling technique to infer missing values
so that changes between each year of the survey can be made using the maximum data available - see the
CS Statistical report (Scott 2008) For full information about CS and methodology employed in square and
plot selection and the field survey see the main GB report (Carey et al 2008 available at
httpwwwcountrysidesurveyorgukreports2007html)
10
Countryside Survey Soils Report from 2007
1 Field sampling and Bulk Density
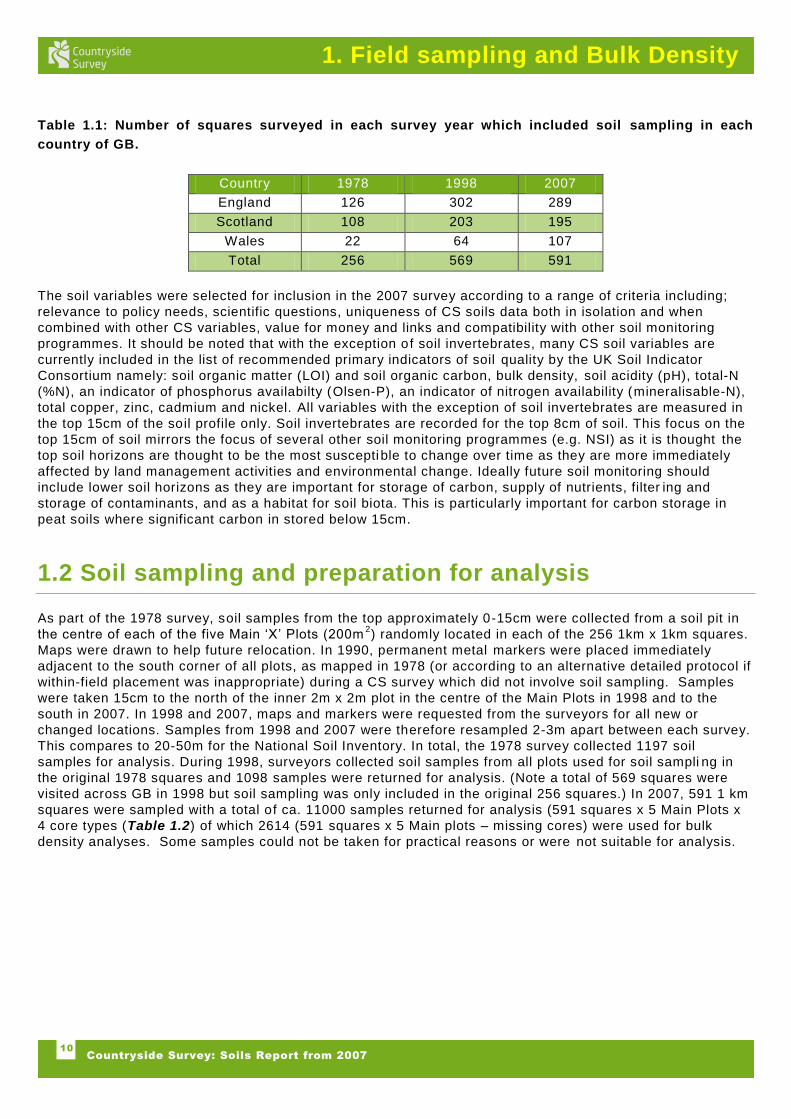
Table 11 Number of squares surveyed in each survey year which included soil sampling in each
country of GB
Country 1978 1998 2007
England 126 302 289
Scotland 108 203 195
Wales 22 64 107
Total 256 569 591
The soil variables were selected for inclusion in the 2007 survey according to a range of criteria including
relevance to policy needs scientific questions uniqueness of CS soils data both in isolation and when
combined with other CS variables value for money and links and compatibility with other soil monitoring
programmes It should be noted that with the exception of soil invertebrates many CS soil variables are
currently included in the list of recommended primary indicators of soil quality by the UK Soil Indicator
Consortium namely soil organic matter (LOI) and soil organic carbon bulk density soil acidity (pH) total-N
(N) an indicator of phosphorus availabilty (Olsen-P) an indicator of nitrogen availability (mineralisable-N)
total copper zinc cadmium and nickel All variables with the exception of soil invertebrates are measured in
the top 15cm of the soil profile only Soil invertebrates are recorded for the top 8cm of soil This focus on the
top 15cm of soil mirrors the focus of several other soil monitoring programmes (eg NSI) as it is thought the
top soil horizons are thought to be the most susceptible to change over time as they are more immediately
affected by land management activities and environmental change Ideally future soil monitoring should
include lower soil horizons as they are important for storage of carbon supply of nutrients filter ing and
storage of contaminants and as a habitat for soil biota This is particularly important for carbon storage in
peat soils where significant carbon in stored below 15cm
12 Soil sampling and preparation for analysis
As part of the 1978 survey soil samples from the top approximately 0-15cm were collected from a soil pit in
the centre of each of the five Main bdquoX‟ Plots (200m2) randomly located in each of the 256 1km x 1km squares
Maps were drawn to help future relocation In 1990 permanent metal markers were placed immediately
adjacent to the south corner of all plots as mapped in 1978 (or according to an alternative detailed protocol if
within-field placement was inappropriate) during a CS survey which did not involve soil sampling Samples
were taken 15cm to the north of the inner 2m x 2m plot in the centre of the Main Plots in 1998 and to the
south in 2007 In 1998 and 2007 maps and markers were requested from the surveyors for all new or
changed locations Samples from 1998 and 2007 were therefore resampled 2-3m apart between each survey
This compares to 20-50m for the National Soil Inventory In total the 1978 survey collected 1197 soil
samples for analysis During 1998 surveyors collected soil samples from all plots used for soil sampli ng in
the original 1978 squares and 1098 samples were returned for analysis (Note a total of 569 squares were
visited across GB in 1998 but soil sampling was only included in the original 256 squares) In 2007 591 1 km
squares were sampled with a total of ca 11000 samples returned for analysis (591 squares x 5 Main Plots x
4 core types (Table 12) of which 2614 (591 squares x 5 Main plots ndash missing cores) were used for bulk
density analyses Some samples could not be taken for practical reasons or were not suitable for analysis
11
Countryside Survey Soils Report from 2007
1 Field sampling and Bulk Density
Table 12 Description of CS soil cores
Core No Colour and length Core measurements Comments
1 Black 15cm pH LOI Bulk density
N Olsen P metals
Insufficient sample for all analyses if soil
was peaty Core 4 was used in that
situation
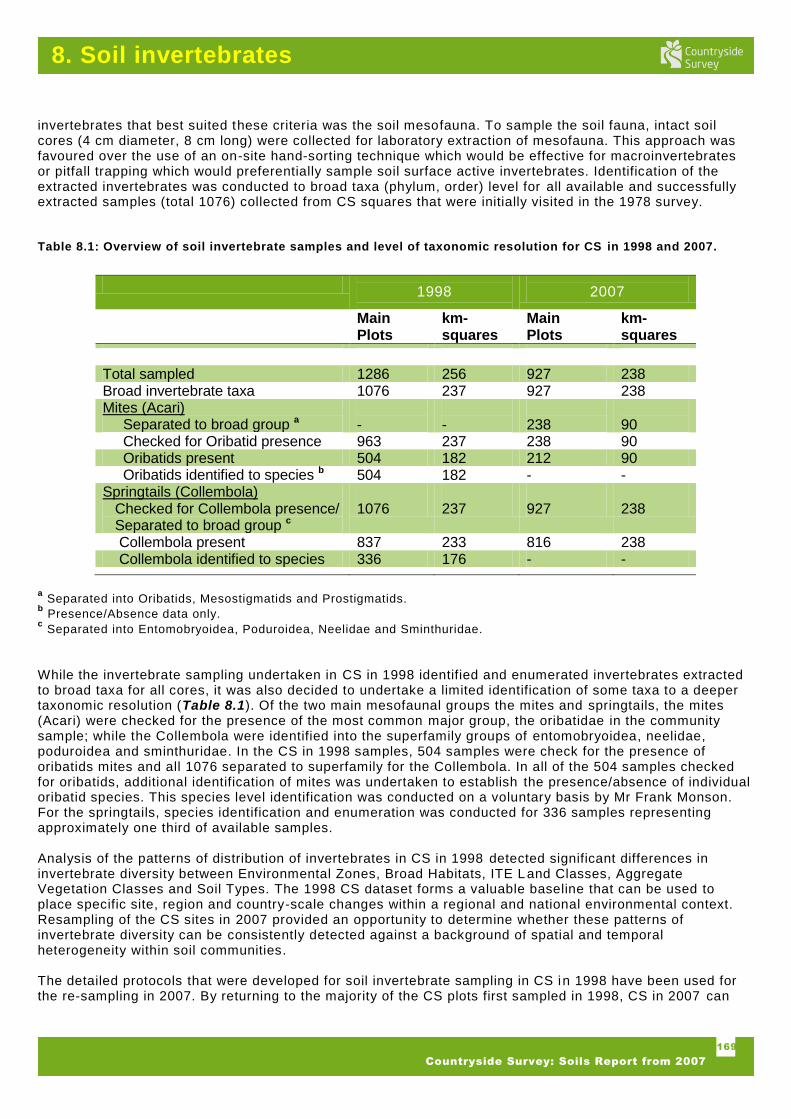
2 White 8cm Invertebrate diversity
3 White 15cm Microbial diversity
Persistent organic
pollutants (POPs)
Frozen on arrival Microbial diversity
analyses are part of a NERC funded
project and are not reported as part of CS
POP analysis was not funded but sampled
preserved in case funding becomes
available
4 White 15cm Mineralisable-N Samples also used for metals and Olsen P
if insufficient sample in Core 1
The soil (0-15cm) samples enable changes in several key topsoil characteristics to be studied including pH
soil carbon and nitrogen concentrations and content a measure of available phosphorus heavy metal
concentrations and soil biota In addition measurements of potentially mineralisable nitrogen and bulk
density were made for the first time Three soil samples only were collected from each Main Plot from the top
15cm of the soil profile and a fourth for the invertebrate sample from the top 8cm only In 1998 and 2007 this
was carried out using a plastic corer hammered into the soil and then pulled out with the sample intact The
plastic was grey or black ABS (acrylonitrile butadiene styrene) water pipe In 1978 a soil pit was dug and soil
was collected from the top 15 cm of the profile in the side of the pit In all t hree years loose vegetation and
fresh litter were cleared from the soil surface before the sample was taken Samples were stored in cold
boxes and posted back to the laboratory for analysis On arrival at the laboratory all soil cores were logged
in the core extruded from the plastic tube a digital photograph taken and basic core dimensions taken
before processing began For full information on methodology and Standard Operating Procedures for all
variables see the CS Soils Manual (Emmett et al 2008 available at
httpwwwcountrysidesurveyorguktech_reportshtml)
13 Bulk density
Soil bulk density (BD) is the single most useful parameter of soil physical structure It is a direct measure of
soil compaction (or loosening) and is essential to assess total available pore space within a soil (that is total
porosity) Soil pore space occupies roughly half of the soils volume and is essential for the sustainable use
of soils since the pores hold air water and soil biodiversity Bulk density is an excellent measure of a most
important contemporary form of soil degradation that which occurs due to ill -timed cultivation compaction by
vehicles and stocking and also affects soil biodiversity since increased BD means reduced macropore
volume which is associated with decreases in microbial biomass and activity The rationale for measurement
is outlined in Table 13
The BD of a soil is also essential in the estimation of soil carbon (C) densities where it is necessary to
convert from soil organic carbon (SOC) to SOC per unit volume (eg g cm-3
) Soil carbon stocks (0-15cm)
can then be calculated by combining carbon densities with area of Broad Habitat Changes to soil C density
and stocks represent a major component of UK greenhouse gas emissions and under the Kyoto Protocol the
UK is required to make estimates of net carbon emissions to the atmosphere Changes in soil C stock will
12
Countryside Survey Soils Report from 2007
1 Field sampling and Bulk Density
need to be included in inventories and reporting if these estimates are to be meaningful To date our
knowledge of soil C stocks and changes is limited recent work by National Soil Resources Institute (Bellamy
et al 2005) indicates that large changes have occurred recently but these changes can only be related to
broad habitat types Determinations of soil BD in CS in 2007 will allow the calculation of topsoil C stocks and
change from 1998 whilst relating these observed changes to potential pressures and drivers such as land
use change climate change and atmospheric deposition
We assessed the different methods of extracting soil from the ground for BD determination including coring
and digging a soil pit Five different cores were tested 10 cm long x 5 cm diameter round core 15 cm x 64
cm round core 10 cm long x 5 cm square metal core 10 cm long x 8 cm s quare metal core 8 cm long x 4 cm
diameter round core The soil pit method involved digging a pit then filling the resulting hole with a plastic
bag and using water to measure the volume
Five field sites were visited to allow the comparison of 5 dif ferent soil types Soils tested were clayey soil
sandy soil peaty soil stony soil and a woodland loam Three replicates per extraction method (both coring
and pit extraction) per soil type were taken (excepting sand and clayey sand as it was deci ded that the
soils were uniform enough for just one sample to be taken) In the laboratory samples were weighed
separated out onto a tray and dried at 105degC Once dry the soils were sieved and stones and soil separated
All components were weighed and the BD calculated excluding stones and other debris
Table 13 Bulk density rationale for measurement
Facts Comments
History in CS
None
Links and compatibility to other monitoring programmes
National Soil Inventory - England amp Wales (NSI EampW) Bulk density estimated from original survey measurements National Soil Inventory (NSI Scotland) - Scotland Some bulk density values available Environmental Change Network Sample soils at 12 terrestrial sites every 5- and 20- years Bulk density measured every 20 years to depth of 120cm or bedrock
Obvious links to NSI EampW and NSI Scotland particularly in the 2007 Scottish resurvey which will happen at the same time as CS in 2007 However BD estimation methods differ and will need to be compared with caution Only one 20-year sampling has been made ndash next due in 2013 High intensity measurements on limited number of sites will complement CS data
Uniqueness of CS
No national dataset to estimate bulk density on every soil sample measured for C
Value for money (Policy priority or interpretative value X cost)
High High policy and interpretative value low cost Cheap reliable way of assessing soil physical structure Pedotransfer functions highly relevant for other survey and monitoring programmes
13
Countryside Survey Soils Report from 2007
1 Field sampling and Bulk Density
Overall the different core types tested gave fairly consistent BD values across soil types and no one core
type gave consistently higherlower BD values (Emmett et al 2008) The values of BD estimated from cores
and pits were similar and were within the ranges of typical values expected for each of the soil types
However any methods used for sampling in CS must take into account the time available in the field the
capacity of the field team to carry equipment and the logistics of t he survey The recommendations for BD
measurements in CS were as follows
The pit extraction method is not feasible due to the amount of heavy equipment needed and the
complexity of the task
Although the metal square cores tended to hammer in more easily they tended to distort easily in
difficult soils making their use limited In bdquosticky‟ soils some of the sample was left in the corners
of the core They are also heavier to transport by post
Taking the above into account the coring method is the only method which can be realistically
carried out in a consistent manner on such a large scale
The black 15 cm cores used in the 1998 are acceptable to use for measuring bulk density in the
majority of soils on the condition that surveyorslab personnel follow careful instructions
provided in the CS Field Handbook
Thus in 2007 CS soils were sampled using the 15 cm long x 5 cm diameter core hammered into the ground
and removed using pliers as in the 1998 soil survey
Bulk density was estimated for each soil sample by making detailed weight measurements throughout the soil
processing procedure Briefly the exact dimensions of the sampled soil core were recorded before the soil
was extruded from the plastic tube and the soil was then weighed homo genised reweighed before drying at
room temperature for up to two weeks At the end of this period the soil was again weighed and then sieved
to 2 mm and the weight and volume of the debris remaining (largely composed of stones and plant material
and called unsieved debris) recorded A sub-sample of 10 g of soil was then accurately weighed and dried
overnight at 105 degC before LOI determination The moisture loss at each stage of the process was used to
estimate the initial moisture content of the soil and from that the initial dry weight of the soil Bulk density
was then estimated using the equation
Data were analysed using the standard mixed model analysis appropriate to CS measurements The
statistical approach used for analys is for change involved bootstrapping which allows for non-normality in the
data without the necessity of knowing details of actual distribution As such it provides a more accurate
measurement of significance Annex F of Emmett et al (2008) provides a background document describing
this approach
14 Results
Results are presented for three major categories Broad Habitats Aggregate Vegetation Class and Loss on
Ignition Category
Broad Habitat - The Broad Habitat classification consists of 27 habitats which account for the entire
land surface of Great Britain and the surrounding sea Countryside Survey reports on 10 major
terrestrial habitats
Aggregate Vegetation Class (AVC) ndash is a high level grouping of vegetation types produced from a
quantitative hierarchical classification of the different plant species found in the original Countryside
Survey sample plots
( debris) unsieved of volume - collected core of volume
debris) unsieved of weight- soil of t(dry weigh )cm (gdensity Bulk 3-
14
Countryside Survey Soils Report from 2007
1 Field sampling and Bulk Density
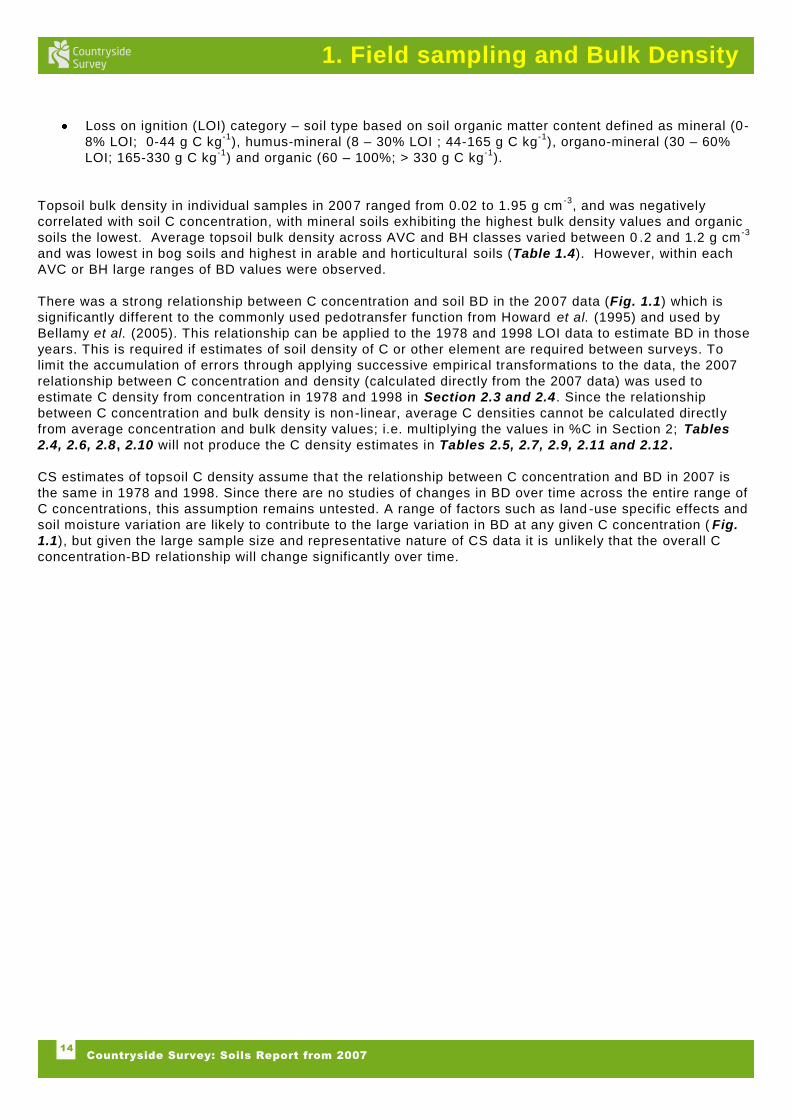
Loss on ignition (LOI) category ndash soil type based on soil organic matter content defined as mineral (0-
8 LOI 0-44 g C kg-1
) humus-mineral (8 ndash 30 LOI 44-165 g C kg-1
) organo-mineral (30 ndash 60
LOI 165-330 g C kg-1
) and organic (60 ndash 100 gt 330 g C kg-1
)
Topsoil bulk density in individual samples in 2007 ranged from 002 to 195 g cm-3
and was negatively
correlated with soil C concentration with mineral soils exhibiting the highest bulk density values and organic
soils the lowest Average topsoil bulk density across AVC and BH classes varied between 0 2 and 12 g cm-3
and was lowest in bog soils and highest in arable and horticultural soils (Table 14) However within each
AVC or BH large ranges of BD values were observed
There was a strong relationship between C concentration and soil BD in the 20 07 data (Fig 11) which is
significantly different to the commonly used pedotransfer function from Howard et al (1995) and used by
Bellamy et al (2005) This relationship can be applied to the 1978 and 1998 LOI data to estimate BD in those
years This is required if estimates of soil density of C or other element are required between surveys To
limit the accumulation of errors through applying successive empirical transformations to the data the 2007
relationship between C concentration and density (calculated directly from the 2007 data) was used to
estimate C density from concentration in 1978 and 1998 in Section 23 and 24 Since the relationship
between C concentration and bulk density is non-linear average C densities cannot be calculated directly
from average concentration and bulk density values ie multiplying the values in C in Section 2 Tables
24 26 28 210 will not produce the C density estimates in Tables 25 27 29 211 and 212
CS estimates of topsoil C density assume that the relationship between C concentration and BD in 2007 is
the same in 1978 and 1998 Since there are no studies of changes in BD over time across the entire range of
C concentrations this assumption remains untested A range of factors such as land -use specific effects and
soil moisture variation are likely to contribute to the large variation in BD at any given C concentration ( Fig
11) but given the large sample size and representative nature of CS data it is unlikely that the overall C
concentration-BD relationship will change significantly over time
15
Countryside Survey Soils Report from 2007
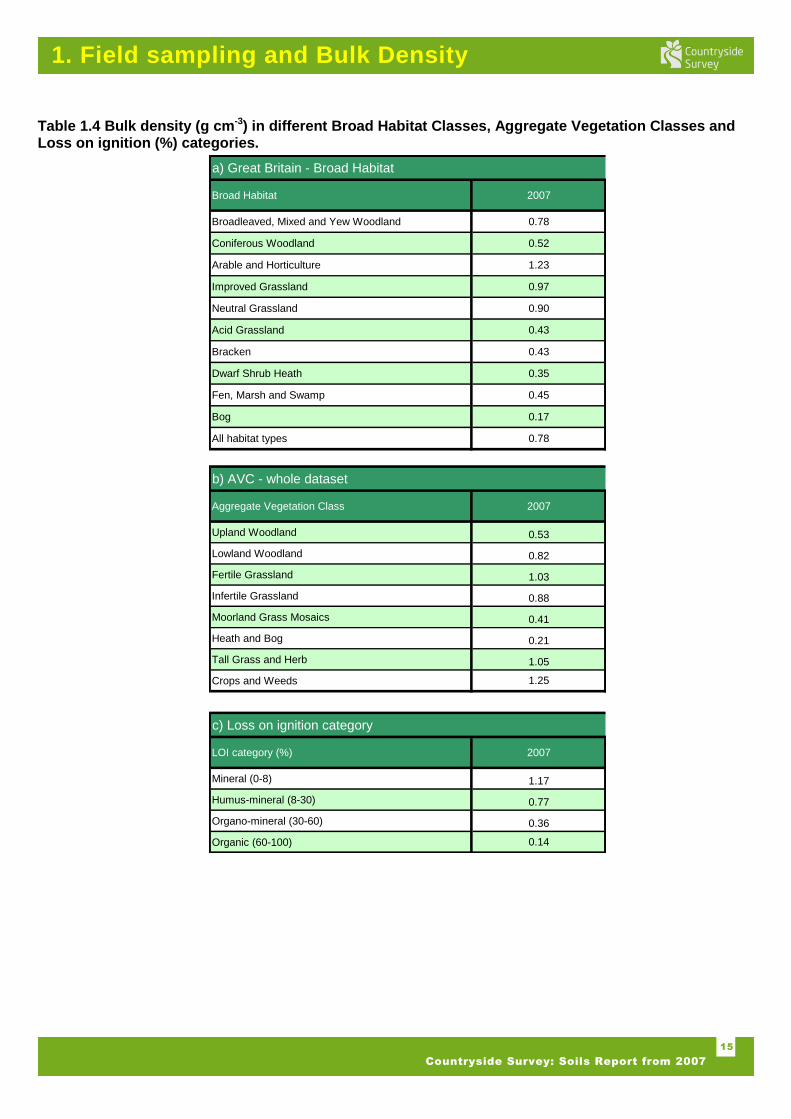
1 Field sampling and Bulk Density
Table 14 Bulk density (g cm-3) in different Broad Habitat Classes Aggregate Vegetation Classes and Loss on ignition () categories
a) Great Britain - Broad Habitat
Broad Habitat 2007
Broadleaved Mixed and Yew Woodland 078
Coniferous Woodland 052
Arable and Horticulture 123
Improved Grassland 097
Neutral Grassland 090
Acid Grassland 043
Bracken 043
Dwarf Shrub Heath 035
Fen Marsh and Swamp 045
Bog 017
All habitat types 078
b) AVC - whole dataset
Aggregate Vegetation Class 2007
Upland Woodland 053
Lowland Woodland 082
Fertile Grassland 103
Infertile Grassland 088
Moorland Grass Mosaics 041
Heath and Bog 021
Tall Grass and Herb 105
Crops and Weeds 125
c) Loss on ignition category
LOI category () 2007
Mineral (0-8) 117
Humus-mineral (8-30) 077
Organo-mineral (30-60) 036
Organic (60-100) 014
16
Countryside Survey Soils Report from 2007
1 Field sampling and Bulk Density
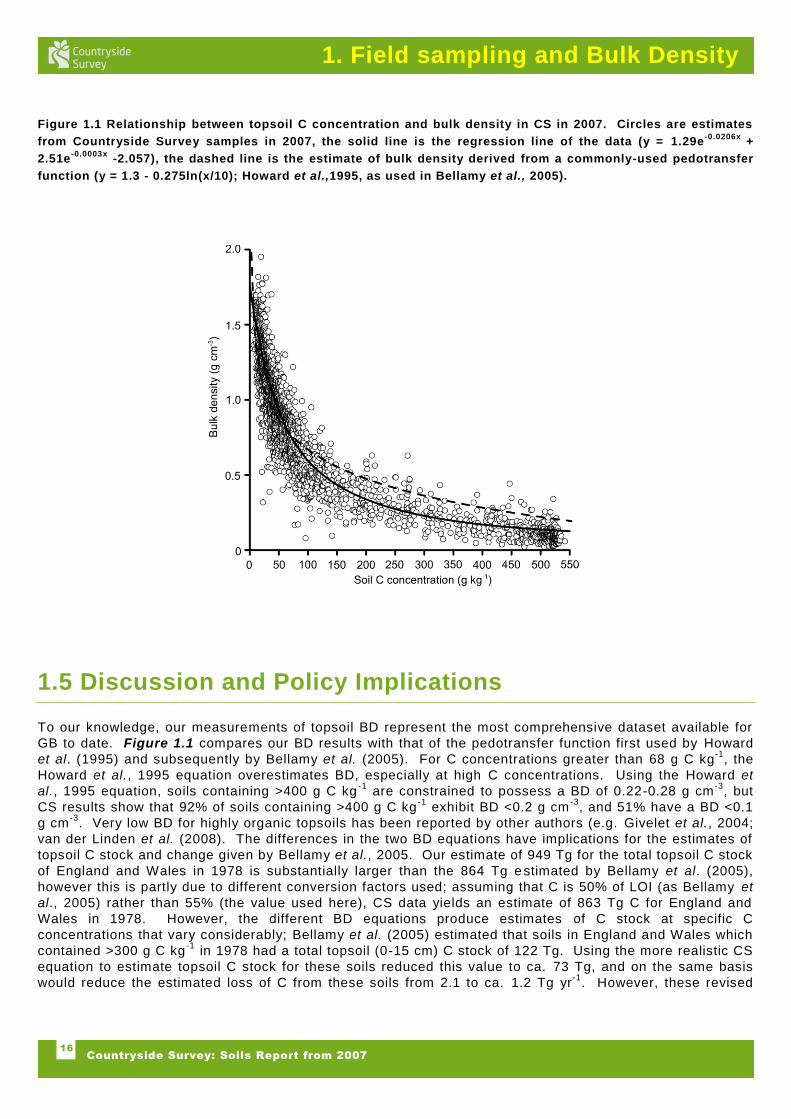
Figure 11 Relationship between topsoil C concentration and bulk density in CS in 2007 Circles are estimates
from Countryside Survey samples in 2007 the solid line is the regression line of the data (y = 129e-00206x
+
251e-00003x
-2057) the dashed line is the estimate of bulk density derived from a commonly-used pedotransfer
function (y = 13 - 0275ln(x10) Howard et al1995 as used in Bellamy et al 2005)
15 Discussion and Policy Implications
To our knowledge our measurements of topsoil BD represent the most comprehensive dataset available for
GB to date Figure 11 compares our BD results with that of the pedotransfer function first used by Howard
et al (1995) and subsequently by Bellamy et al (2005) For C concentrations greater than 68 g C kg-1
the
Howard et al 1995 equation overestimates BD especially at high C concentrations Using the Howard et
al 1995 equation soils containing gt400 g C kg-1
are constrained to possess a BD of 022-028 g cm-3
but
CS results show that 92 of soils containing gt400 g C kg-1
exhibit BD lt02 g cm-3
and 51 have a BD lt01
g cm-3
Very low BD for highly organic topsoils has been reported by other authors (eg Givelet et al 2004
van der Linden et al (2008) The differences in the two BD equations have implications for the estimates of
topsoil C stock and change given by Bellamy et al 2005 Our estimate of 949 Tg for the total topsoil C stock
of England and Wales in 1978 is substantially larger than the 864 Tg estimated by Bellamy et al (2005)
however this is partly due to different conversion factors used assuming that C is 50 of LOI (as Bellamy et
al 2005) rather than 55 (the value used here) CS data yields an estimate of 863 Tg C for England and
Wales in 1978 However the different BD equations produce estimates of C stock at specific C
concentrations that vary considerably Bellamy et al (2005) estimated that soils in England and Wales which
contained gt300 g C kg-1
in 1978 had a total topsoil (0-15 cm) C stock of 122 Tg Using the more realistic CS
equation to estimate topsoil C stock for these soils reduced this value to ca 73 Tg and on the same basis
would reduce the estimated loss of C from these soils from 21 to ca 12 Tg yr-1
However these revised
17
Countryside Survey Soils Report from 2007
1 Field sampling and Bulk Density
estimates of topsoil C stocks do not explain the substantial differences between our results and those of
Bellamy et al 2005 in terms of change in topsoil C concentration and stock Reasons for this continue to be
explored The importance of the modified transfer function is less important when bulk density is used as an
indicator of soil quality associated with land management practices as change rather than absolute value in
these situations is usually of greater interest
16 References
Bellamy PH Loveland PJ Bradley RI Lark RM and Kirk GJD 2005 Carbon losses from all soils
across England and Wales 1978-2003 Nature 437 245-248
Carey PD Wallis S Chamberlain PM Cooper A Emmett BA Maskell LC McCann T Murphy J
Norton LR Reynolds B Scott WA Simpson IC Smart SM Ullyett JM 2008 Countryside Survey
UK Results from 2007 NERCCentre for Ecology amp Hydrology 105pp (CEH Project Number C03259)
Emmett BA Frogbrook ZLChamberlain PM Griffiths R Pickup R Poskitt J Reynolds B Rowe
E Rowland P Spurgeon D Wilson J Wood CM 2008 Countryside Survey Soils Manual Countryside
Survey Technical Report No0407
Givelet N Le Roux G Cheburkin A Chen B Frank J Goodsite M E Kempter H Krachler M
Noernberg T Rausch N Rheinberger S Roos-Barraclough F Sapkota A Scholz C and Shotyk W
2004 Suggested protocol for collecting handling and preparing peat cores and peat samples for physical
chemical mineralogical and isotopic analyses J Environ Monit 6 481-492 2004
Howard PJA Loveland PJ Bradley RI Dry FT Howard DM Howard DC 1995 The carbon
content of soil and its geographic distribution in Great Britain Soil Use and Management 11 9-15
Scott WA 2008 Countryside Survey Statistical Report Countryside Survey Technical Report No407
NERCCentre for Ecology amp Hydrology and Pond Conservation 15pp (CEH Project Number C03259)
van der Linden M Barke J Vickery E Charman D J and van Geel B2008 Late Holocene human
impact and climate change recorded in a North Swedish peat deposit Palaeogeography Palaeoclimatology
Palaeoecology 258 1-27
18
Countryside Survey Soils Report from 2007
2 Carbon
Summary
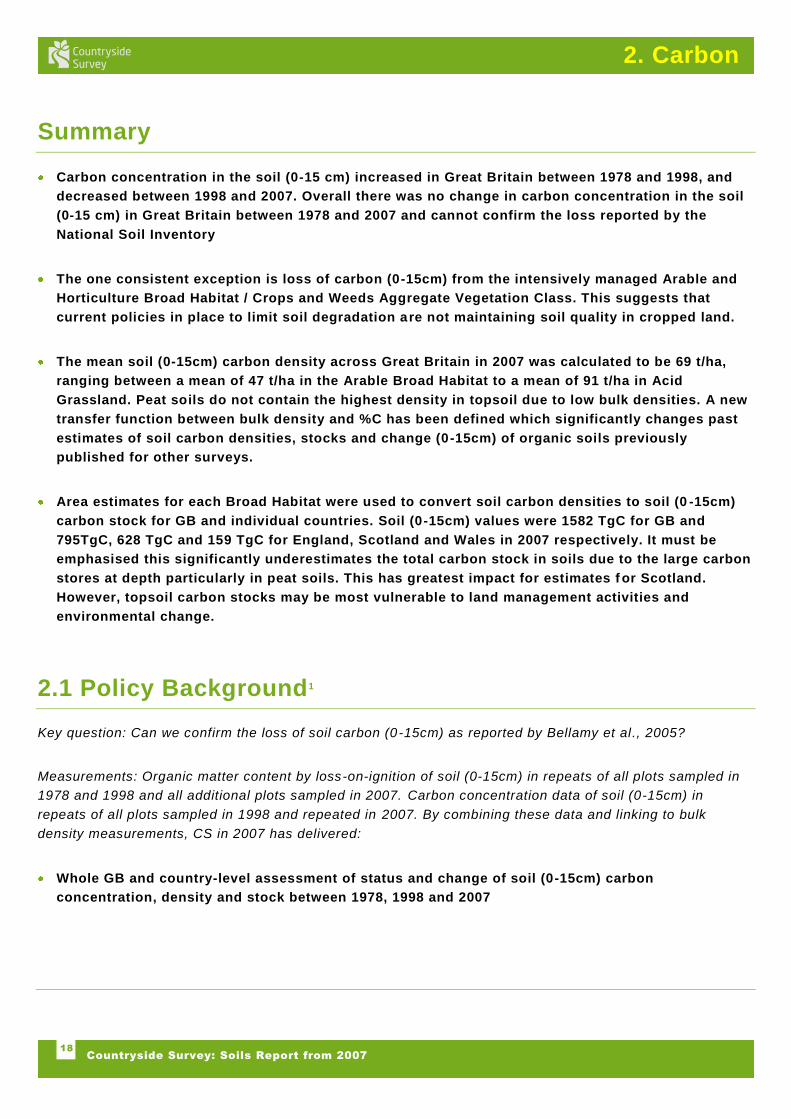
Carbon concentration in the soil (0-15 cm) increased in Great Britain between 1978 and 1998 and
decreased between 1998 and 2007 Overall there was no change in carbon concentration in the soil
(0-15 cm) in Great Britain between 1978 and 2007 and cannot confirm the loss reported by the
National Soil Inventory
The one consistent exception is loss of carbon (0-15cm) from the intensively managed Arable and
Horticulture Broad Habitat Crops and Weeds Aggregate Vegetation Class This suggests that
current policies in place to limit soil degradation are not maintaining soil quality in cropped land
The mean soil (0-15cm) carbon density across Great Britain in 2007 was calculated to be 69 tha
ranging between a mean of 47 tha in the Arable Broad Habitat to a mean of 91 tha in Acid
Grassland Peat soils do not contain the highest density in topsoil due to low bulk densities A new
transfer function between bulk density and C has been defined which significantly changes past
estimates of soil carbon densities stocks and change (0-15cm) of organic soils previously
published for other surveys
Area estimates for each Broad Habitat were used to convert soil carbon densities to soil (0 -15cm)
carbon stock for GB and individual countries Soil (0-15cm) values were 1582 TgC for GB and
795TgC 628 TgC and 159 TgC for England Scotland and Wales in 2007 respectively It must be
emphasised this significantly underestimates the total carbon stock in soils due to the large carbon
stores at depth particularly in peat soils This has greatest impact for estimates f or Scotland
However topsoil carbon stocks may be most vulnerable to land management activities and
environmental change
21 Policy Background1
Key question Can we confirm the loss of soil carbon (0-15cm) as reported by Bellamy et al 2005
Measurements Organic matter content by loss-on-ignition of soil (0-15cm) in repeats of all plots sampled in
1978 and 1998 and all additional plots sampled in 2007 Carbon concentration data of soil (0-15cm) in
repeats of all plots sampled in 1998 and repeated in 2007 By combining these data and linking to bulk
density measurements CS in 2007 has delivered
Whole GB and country-level assessment of status and change of soil (0-15cm) carbon
concentration density and stock between 1978 1998 and 2007
19
Countryside Survey Soils Report from 2007
2 Carbon
Soil organic C (SOC) is one of the headline indictors of soil quality and there is a wide acceptance that
carbon is fundamental to soil functioning as it is the primary energy source in soils and has a critical role in
maintaining soil structural condition and resil ience and water retention All soils therefore need to retain
carbon However soil C changes are measured against large background stocks and high spatial
heterogeneity and more information is needed to be able to manage this resource better Specific policy
requirements which require improved information on the status and change of soil carbon content include UK
and EU legislation soil protection measures that will help to conserve soil carbon The reformed Common
Agriculture Policy requires all farmers in receipt of the single payment to take measures to protect their soil
from erosion organic matter decline and structural damage Changes to soil C content also represent a major
component of UK greenhouse gas emissions and under the Kyoto Protocol the UK is required to make
estimates of net carbon emissions to the atmosphere However knowledge of soil C stocks and changes is
limited recent work by the NSRI (Bellamy et al 2005) indicates that large changes have occurred recently
but there has been some debate concerning possible causes (Smith et al 2007) In addition if stocks could
be related to more detailed vegetation and other environmental data this would al low better mitigation
targeting Whereas above ground carbon cycling is well understood there are great uncertainties in climate
impacts on soil carbon cycling CS soil C data will contribute to knowledge of how soil C is changing how
this relates to vegetation change and land use and management and provide evidence of the effectiveness of
soil protection legislation
Soil samples taken for Countryside Survey in 2007 will be the third in a time series of samples from 1978 and
1998 this will be the first national soil time-series in Europe and possibly globally Analyses of topsoil C in
2007 will allow further quantification of topsoil C contents and change across all major UK land uses and
crucially through the link to other CS and spatially relevant information will allow the assignment of
pressures and drivers to the observed changes be they climate change land use and management or
atmospheric deposition This link to drivers of change will be reported in the CS Integrated Assessment
Report and peer-reviewed literature
22 Methods
221 Proof of concept
Loss-on-ignition (LOI) is a simple and inexpensive method for determining soil organic matter and estimating
soil organic carbon concentration (hereafter called soil C concentration) using an appropriate conversion
equation An analysis of the benefits of including the measurement in the 2007 survey is summarised in
Table 21
LOI values were determined for 1197 plots within 256 1km squares in 1978 1098 plots within 256 squares in
1998 and 2614 plots within 591 squares in 2007 The increase in sample number was necessary to provide
adequate statistical power to detect change within all three GB countries Power analysis of the exist ing CS
dataset (1978 amp 1998) was performed to determine the number of squares needed in 2007 to give adequate
reporting power for soils in Wales and greater power for soils in Scotland and England For further
information see Emmett et al (2008) Essentially sampling within CS can determine significant differences in
soil C concentration if these are greater than 8 of previous estimates
In 1978 and 1998 LOI was performed on 10 g soil at 375degC for 16 hours and on 1 g soil at 550degC for 3 hours
respectively In the preparation phase for CS in 2007 it was identified that the 1998 LOI method had resulted
in higher values of LOI across the enti re soil organic matter range relative to the 1978 method and it was
decided that all available 1998 soils would be reanalysed using the 1978 method Additionally it was
decided to use the 1978 LOI method in 2007 as 1) this would yield a consistent dataset across 1978 1998
and 2007 and 2) the use of 10 g soil for LOI is preferable since it is more representative than 1 g
Alongside LOI measurements soil C concentration was determined by elemental analyser analysis in 1998
and again in 2007 This measurement complements the LOI data since it is an actual measurement of C
20
Countryside Survey Soils Report from 2007
2 Carbon
concentration in soil however in soils with high amounts of carbonates the soil C concentration may be
considerably larger than the organic C concentration Soil C concentration cannot replace LOI as a method
of measuring soil C because 1978 samples were only analysed by LOI and not by soil C concentration
A conversion factor of 05 from the literature has been used to convert LOI to soil C concentration for CS
reports to date The completed analysis of the combined analysis of 1998 and 2007 data for LOI has
indicated a different value of 055 which is now being used in all estimates of soil C concentration and
carbon density
To calculate topsoil carbon density on a g cm-3
basis a measurement of C per unit volume is needed
Combining bulk density measurements reported in Chapter 1 for the 2007 samples with LOIsoil C
concentration values result in estimates of topsoil C density on an area basis This in turn can be combined
with Broad Habitat area estimates from the CS surveys leading to the first national survey assessment of
topsoil carbon stock (0-15cm) derived from co-located measured variables
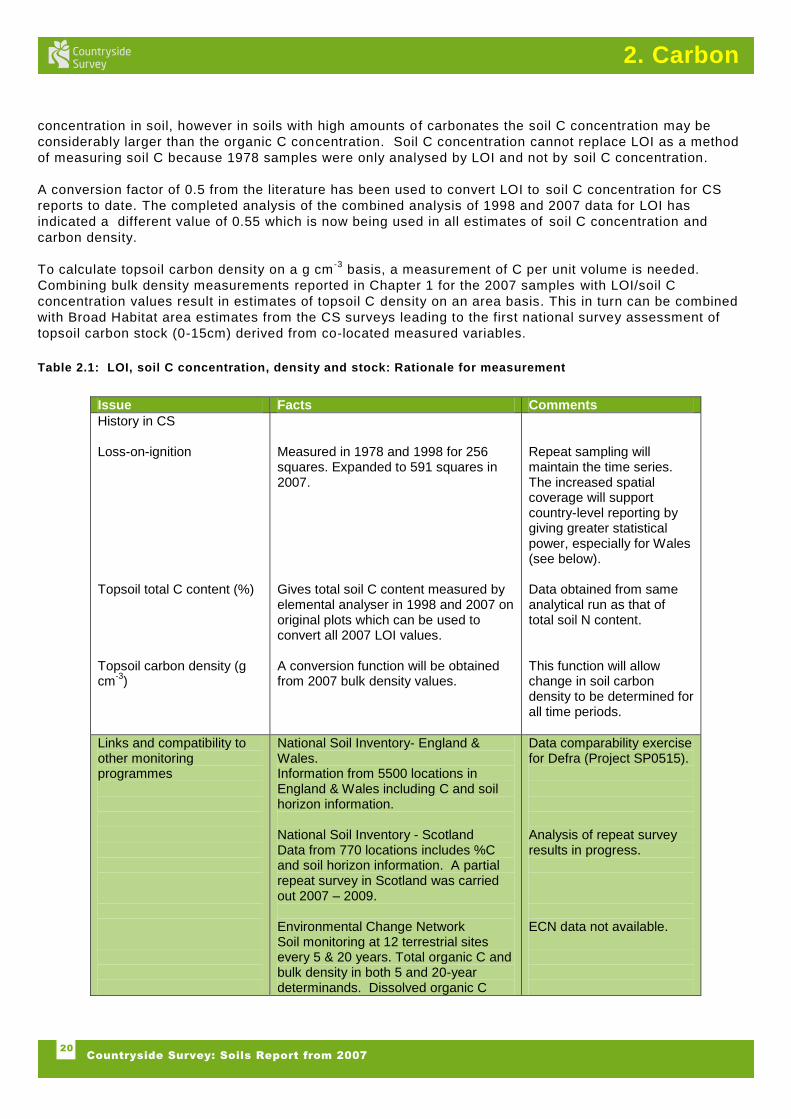
Table 21 LOI soil C concentration density and stock Rationale for measurement
Issue Facts Comments
History in CS Loss-on-ignition Topsoil total C content () Topsoil carbon density (g cm
-3)
Measured in 1978 and 1998 for 256 squares Expanded to 591 squares in 2007 Gives total soil C content measured by elemental analyser in 1998 and 2007 on original plots which can be used to convert all 2007 LOI values A conversion function will be obtained from 2007 bulk density values
Repeat sampling will maintain the time series The increased spatial coverage will support country-level reporting by giving greater statistical power especially for Wales (see below) Data obtained from same analytical run as that of total soil N content This function will allow change in soil carbon density to be determined for all time periods
Links and compatibility to other monitoring programmes
National Soil Inventory- England amp Wales Information from 5500 locations in England amp Wales including C and soil horizon information National Soil Inventory - Scotland Data from 770 locations includes C and soil horizon information A partial repeat survey in Scotland was carried out 2007 ndash 2009 Environmental Change Network Soil monitoring at 12 terrestrial sites every 5 amp 20 years Total organic C and bulk density in both 5 and 20-year determinands Dissolved organic C
Data comparability exercise for Defra (Project SP0515) Analysis of repeat survey results in progress ECN data not available
21
Countryside Survey Soils Report from 2007
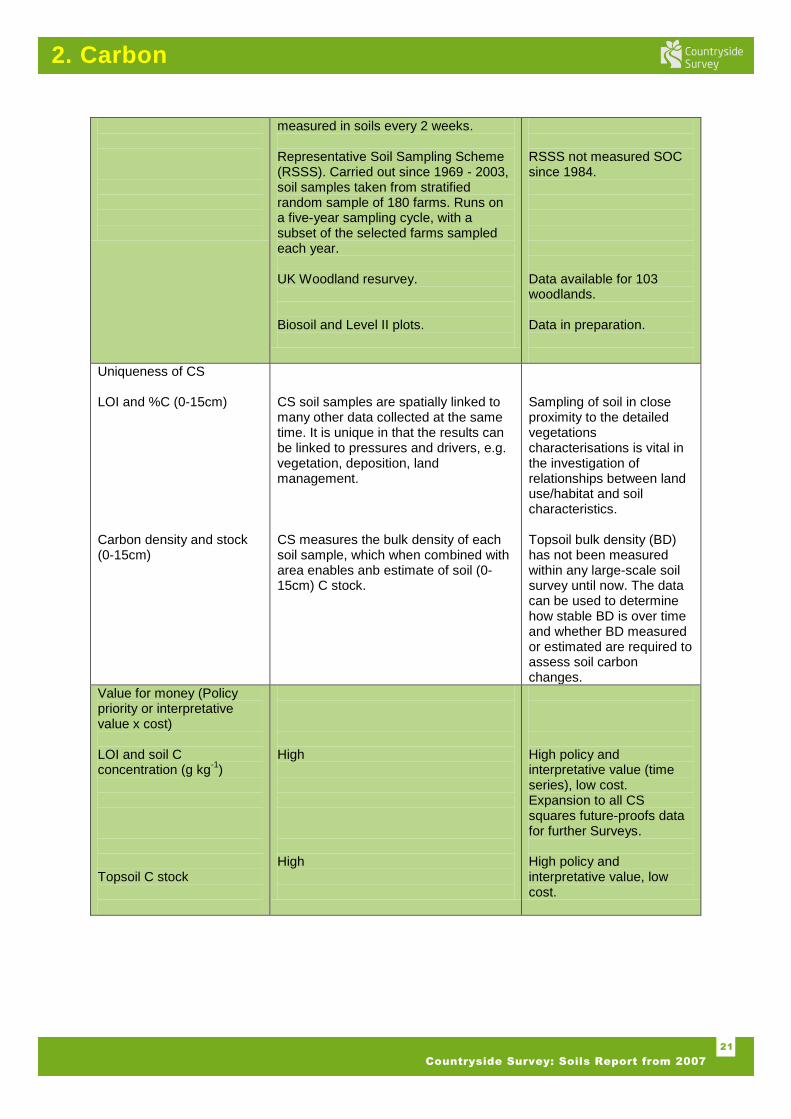
2 Carbon
measured in soils every 2 weeks Representative Soil Sampling Scheme (RSSS) Carried out since 1969 - 2003 soil samples taken from stratified random sample of 180 farms Runs on a five-year sampling cycle with a subset of the selected farms sampled each year UK Woodland resurvey Biosoil and Level II plots
RSSS not measured SOC since 1984 Data available for 103 woodlands Data in preparation
Uniqueness of CS LOI and C (0-15cm) Carbon density and stock (0-15cm)
CS soil samples are spatially linked to many other data collected at the same time It is unique in that the results can be linked to pressures and drivers eg vegetation deposition land management CS measures the bulk density of each soil sample which when combined with area enables anb estimate of soil (0-15cm) C stock
Sampling of soil in close proximity to the detailed vegetations characterisations is vital in the investigation of relationships between land usehabitat and soil characteristics Topsoil bulk density (BD) has not been measured within any large-scale soil survey until now The data can be used to determine how stable BD is over time and whether BD measured or estimated are required to assess soil carbon changes
Value for money (Policy priority or interpretative value x cost) LOI and soil C concentration (g kg
-1)
Topsoil C stock
High High
High policy and interpretative value (time series) low cost Expansion to all CS squares future-proofs data for further Surveys High policy and interpretative value low cost
22
Countryside Survey Soils Report from 2007
2 Carbon
222 Laboratory analysis
Samples for LOI were collected using the 15cm long by 5cm diameter black plastic core following the field
protocol described in Chapter 1 and in more detail in Emmett et al (2008) LOI was measured on a 10 g air
dried sub-sample taken after sieving to 2 mm The sub-sample was dried at 105degC for 16 hours to remove
moisture weighed then combusted at 375degC for 16 hours The cooled sample was then weighed and the
loss-on-ignition () calculated Soil C concentration was determined using a total elemental analyser for the
original 256 squares The method used was CEH Lancaster UKAS accredited method SOP3102 Details of
the method are given in Emmett et al (2008)
223 Quality Assurance and Quality Control
The DefraNERC Joint Codes of Practice were followed throughout
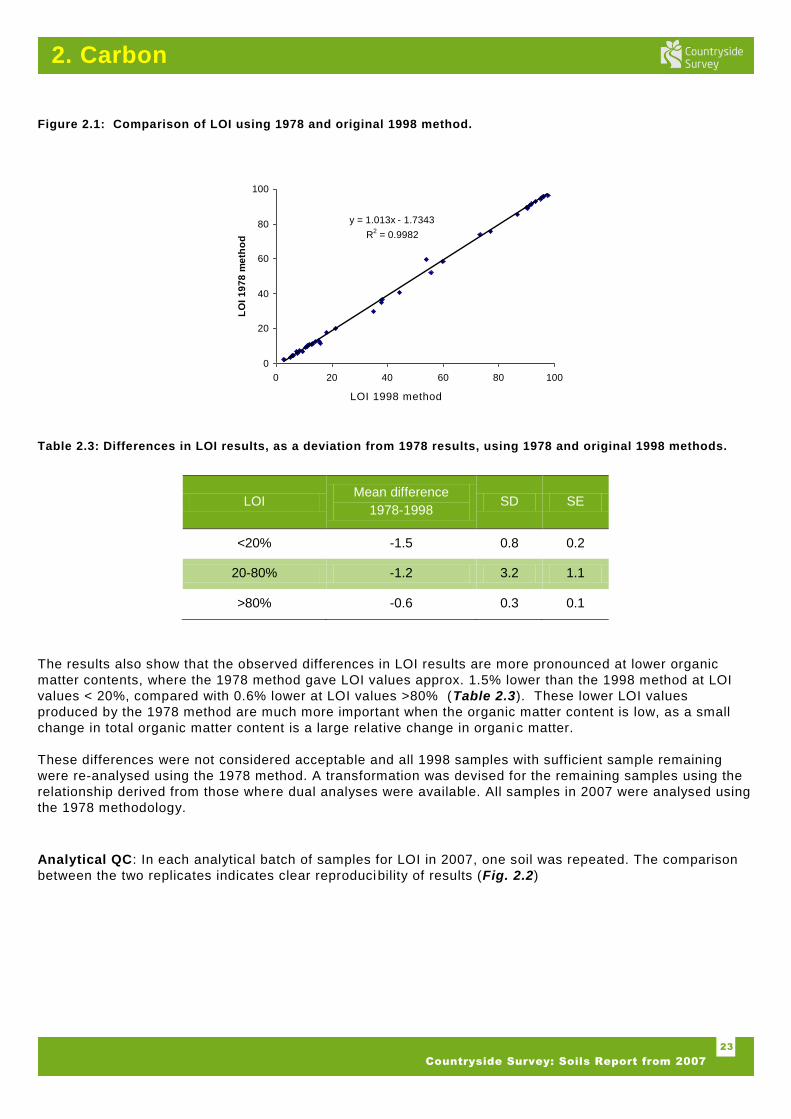
Method comparability A selection of 40 soils from 1998 were analysed by LOI using the methodologies
used in the 1978 and 1998 surveys (Table 22) Results gave good agreement over the whole range of LOI
values (Fig 21) but across the whole dataset mean LOI values were significantly lower (-12) using the
1978 method compared to the 1998 method (Table 23) This difference in the results using the 1978 method
was present regardless of whether the soils were heated for 2frac14 or 3 hr (mean decrease -114 and -143
respectively
Table 22 LOI method conditions in 1978 and original 1998 method
Survey Amount of soil (g) Temp (degC) Time (hr)
1978 10 375 16
1998 1 550 Not less than 2
23
Countryside Survey Soils Report from 2007
2 Carbon
Figure 21 Comparison of LOI using 1978 and original 1998 method
y = 1013x - 17343
R2 = 09982
0
20
40
60
80
100
0 20 40 60 80 100
LOI CS2000 method
LO
I 1
97
8 m
eth
od
Table 23 Differences in LOI results as a deviation from 1978 results using 1978 and original 1998 methods
LOI Mean difference
1978-1998 SD SE
lt20 -15 08 02
20-80 -12 32 11
gt80 -06 03 01
The results also show that the observed differences in LOI results are more pronounced at lower organic
matter contents where the 1978 method gave LOI values approx 15 lower than the 1998 method at LOI
values lt 20 compared with 06 lower at LOI values gt80 (Table 23) These lower LOI values
produced by the 1978 method are much more important when the organic matter content is low as a small
change in total organic matter content is a large relative change in organi c matter
These differences were not considered acceptable and all 1998 samples with sufficient sample remaining
were re-analysed using the 1978 method A transformation was devised for the remaining samples using the
relationship derived from those where dual analyses were available All samples in 2007 were analysed using
the 1978 methodology
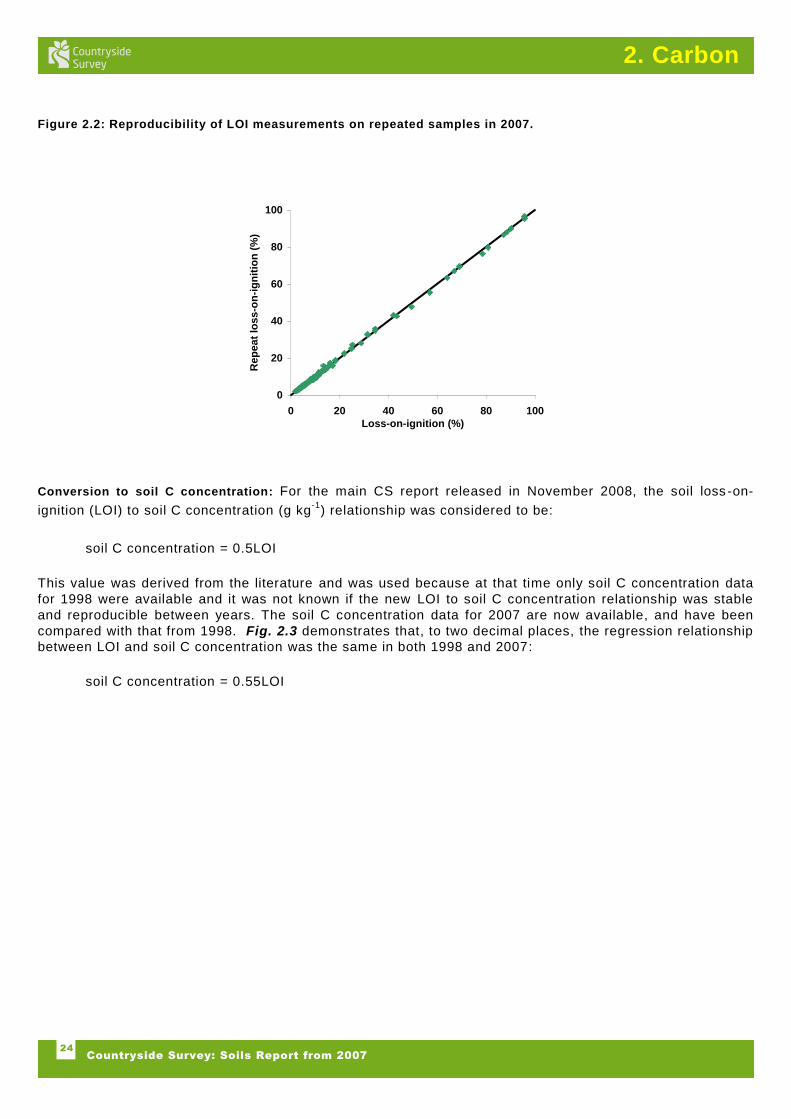
Analytical QC In each analytical batch of samples for LOI in 2007 one soil was repeated The comparison
between the two replicates indicates clear reproducibility of results (Fig 22)
LOI 1998 method
24
Countryside Survey Soils Report from 2007
2 Carbon
Figure 22 Reproducibility of LOI measurements on repeated samples in 2007
0
20
40
60
80
100
0 20 40 60 80 100
Loss-on-ignition ()
Re
pe
at
los
s-o
n-i
gn
itio
n (
)
Conversion to soil C concentration For the main CS report released in November 2008 the soil loss -on-
ignition (LOI) to soil C concentration (g kg-1
) relationship was considered to be
soil C concentration = 05LOI
This value was derived from the literature and was used because at that time only soil C concentration data
for 1998 were available and it was not known if the new LOI to soil C concentration relationship was stable
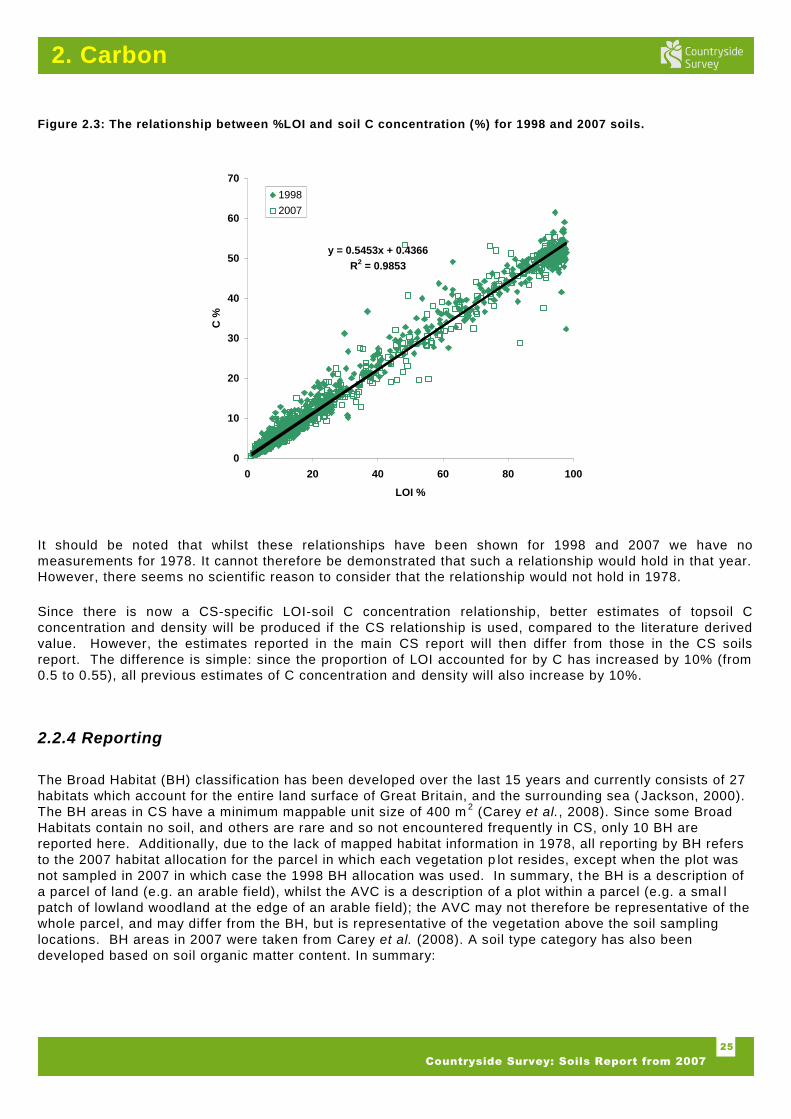
and reproducible between years The soil C concentration data for 2007 are now available and have been
compared with that from 1998 Fig 23 demonstrates that to two decimal places the regression relationship
between LOI and soil C concentration was the same in both 1998 and 2007
soil C concentration = 055LOI
25
Countryside Survey Soils Report from 2007
2 Carbon
Figure 23 The relationship between LOI and soil C concentration () for 1998 and 2007 soils
y = 05453x + 04366
R2 = 09853
0
10
20
30
40
50
60
70
0 20 40 60 80 100
LOI
C
1998
2007
It should be noted that whilst these relationships have been shown for 1998 and 2007 we have no
measurements for 1978 It cannot therefore be demonstrated that such a relationship would hold in that year
However there seems no scientific reason to consider that the relationship would not hold in 1978
Since there is now a CS-specific LOI-soil C concentration relationship better estimates of topsoil C
concentration and density will be produced if the CS relationship is used compared to the literature derived
value However the estimates reported in the main CS report will then differ from those in the CS soils
report The difference is simple since the proportion of LOI accounted for by C has increased by 10 (from
05 to 055) all previous estimates of C concentration and density will also increase by 10
224 Reporting
The Broad Habitat (BH) classification has been developed over the last 15 years and currently consists of 27
habitats which account for the entire land surface of Great Britain and the surrounding sea ( Jackson 2000)
The BH areas in CS have a minimum mappable unit size of 400 m2 (Carey et al 2008) Since some Broad
Habitats contain no soil and others are rare and so not encountered frequently in CS only 10 BH are
reported here Additionally due to the lack of mapped habitat information in 1978 all reporting by BH refers
to the 2007 habitat allocation for the parcel in which each vegetation p lot resides except when the plot was
not sampled in 2007 in which case the 1998 BH allocation was used In summary t he BH is a description of
a parcel of land (eg an arable field) whilst the AVC is a description of a plot within a parcel (eg a smal l
patch of lowland woodland at the edge of an arable field) the AVC may not therefore be representative of the
whole parcel and may differ from the BH but is representative of the vegetation above the soil sampling
locations BH areas in 2007 were taken from Carey et al (2008) A soil type category has also been
developed based on soil organic matter content In summary
26
Countryside Survey Soils Report from 2007
2 Carbon
Broad Habitat - The Broad Habitat classification consists of 27 habitats which account for the entire
land surface of Great Britain and the surrounding sea Countryside Survey reports on soils for 10
major terrestrial habitats
Aggregate Vegetation Class (AVC) ndash is a high level grouping of vegetation types produced from a
quantitative hierarchical classification of the different plant species found in the original Countryside
Survey sample plots Loss on ignition (LOI) category ndash soil type based on soil organic matter content defined as mineral (0 -
8 LOI 0-44 g C kg-1
) humus-mineral (8 ndash 30 LOI 44-165 g C kg-1
) organo-mineral (30 ndash 60
LOI 165-330 g C kg-1
) and organic (60 ndash 100 gt 330 g C kg-1
) The soil C concentration values were mapped using kriging to interpolate between the Countryside Survey
sample points Routine checking of data for outliers was conducted and the working data set was transformed
using a normal score procedure to obtain a Gaussian distribution The data were then interpolated on a 1km
UK grid using ordinary kriging and finally the kriged data were back-transformed to produce an interpolated
map of soil C concentration In addition Sequential Gaussian simulation (SGs) was conducted on the data to
obtain the E-type estimate (mean) and the spatial uncertainty for the data (conditional variance) Both the
coefficient of variation CV (standard deviation mean) and the signal to noise ratio SNR (mean standard
deviation) are reported
23 Results
231 Structure of soil (0-15cm) LOI data and conversion to soil C concentration
Recorded LOI values were in the range 10 ndash 985 corresponding to topsoil C concentrations of 55 ndash 5418
g C kg-1
) The maximum C concentration possible in a soil is 550 g kg-1
using the conversion factor 055
The distribution of C concentrations across the observed range is shown in Fig 24 The mix of soils across
GB has a characteristic bi-modal U-shaped distribution pattern with the majority of soils containing lt100 g C
kg-1
Across the three Surveys mineral humus-mineral organo-mineral and organic topsoils accounted for
34-39 35-38 6-7 and 17-21 of all samples respectively
Within CS 58 of samples (2843 samples) come from plots which have been sampled more than once
Therefore 42 of samples come from plots only sampled once primarily due to the many extra sampling
locations in 2007 Some variation in C concentration in repeat plots would be expected due to occasional
failure in relocating the exact plot soil heterogeneity differences in sampling procedures across the Surveys
and real change over t ime However the vast majority of observed differences in repeat plots were small
(Fig 24) 83-91 of differences in repeat plots were lt100 g C kg-1
(lt20 LOI) At the other end of the
scale 1-5 of all differences from repeat plots were gt300 g kg-1
(gt60 LOI) Such large differences are
highly unlikely to be due to real change in soil C concentration and suggest that soils in some locations were
extremely heterogeneous or that surveyors were not always successful in accurately re -locating plots
27
Countryside Survey Soils Report from 2007
2 Carbon
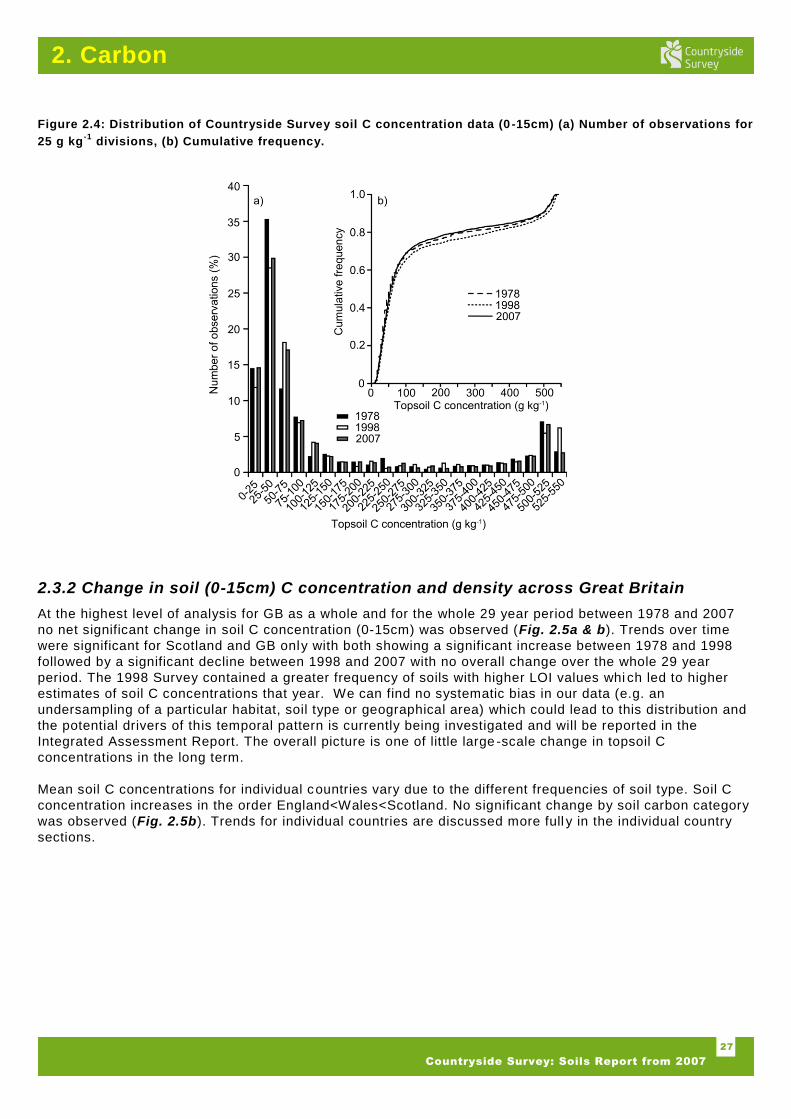
Figure 24 Distribution of Countryside Survey soil C concentration data (0 -15cm) (a) Number of observations for
25 g kg-1
divisions (b) Cumulative frequency
232 Change in soil (0-15cm) C concentration and density across Great Britain
At the highest level of analysis for GB as a whole and for the whole 29 year period between 1978 and 2007
no net significant change in soil C concentration (0-15cm) was observed (Fig 25a amp b) Trends over time
were significant for Scotland and GB only with both showing a significant increase between 1978 and 1998
followed by a significant decline between 1998 and 2007 with no overall change over the whole 29 year
period The 1998 Survey contained a greater frequency of soils with higher LOI values whi ch led to higher
estimates of soil C concentrations that year We can find no systematic bias in our data (eg an
undersampling of a particular habitat soil type or geographical area) which could lead to this distribution and
the potential drivers of this temporal pattern is currently being investigated and will be reported in the
Integrated Assessment Report The overall picture is one of little large -scale change in topsoil C
concentrations in the long term
Mean soil C concentrations for individual countries vary due to the different frequencies of soil type Soil C
concentration increases in the order EnglandltWalesltScotland No significant change by soil carbon category
was observed (Fig 25b) Trends for individual countries are discussed more full y in the individual country
sections
28
Countryside Survey Soils Report from 2007
2 Carbon
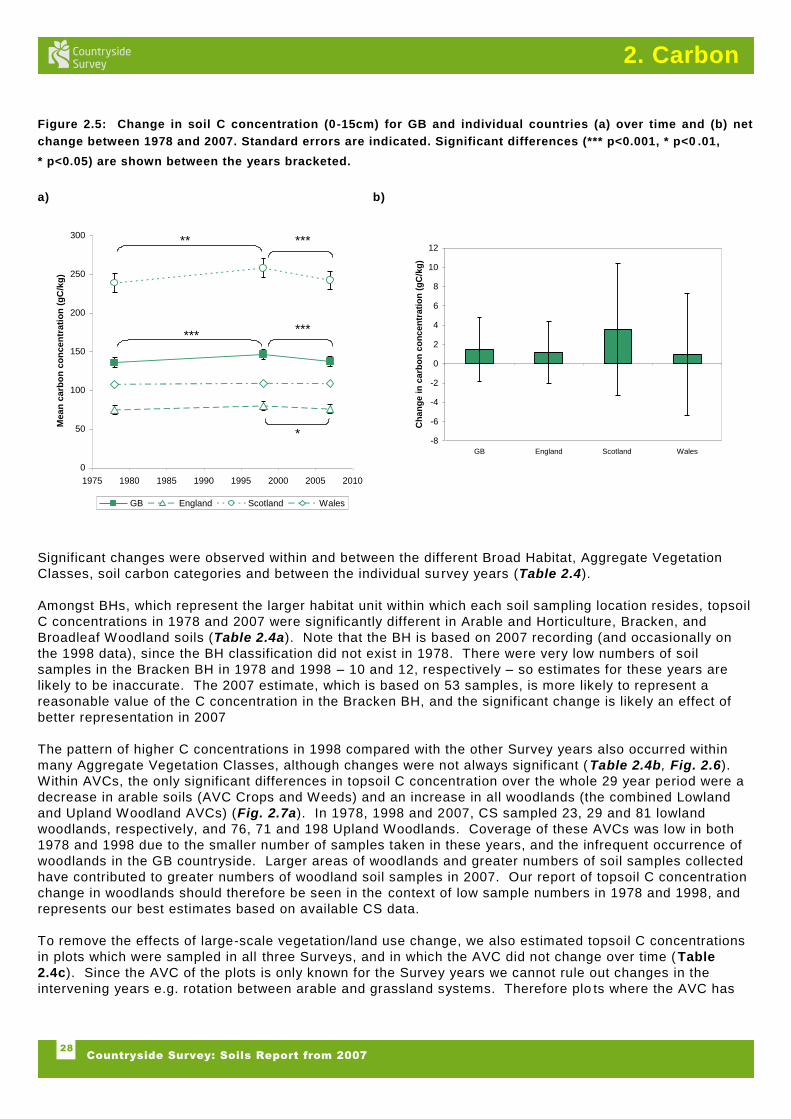
Figure 25 Change in soil C concentration (0-15cm) for GB and individual countries (a) over time and (b) net
change between 1978 and 2007 Standard errors are indicated Significant differences ( plt0001 plt0 01
plt005) are shown between the years bracketed
a) b)
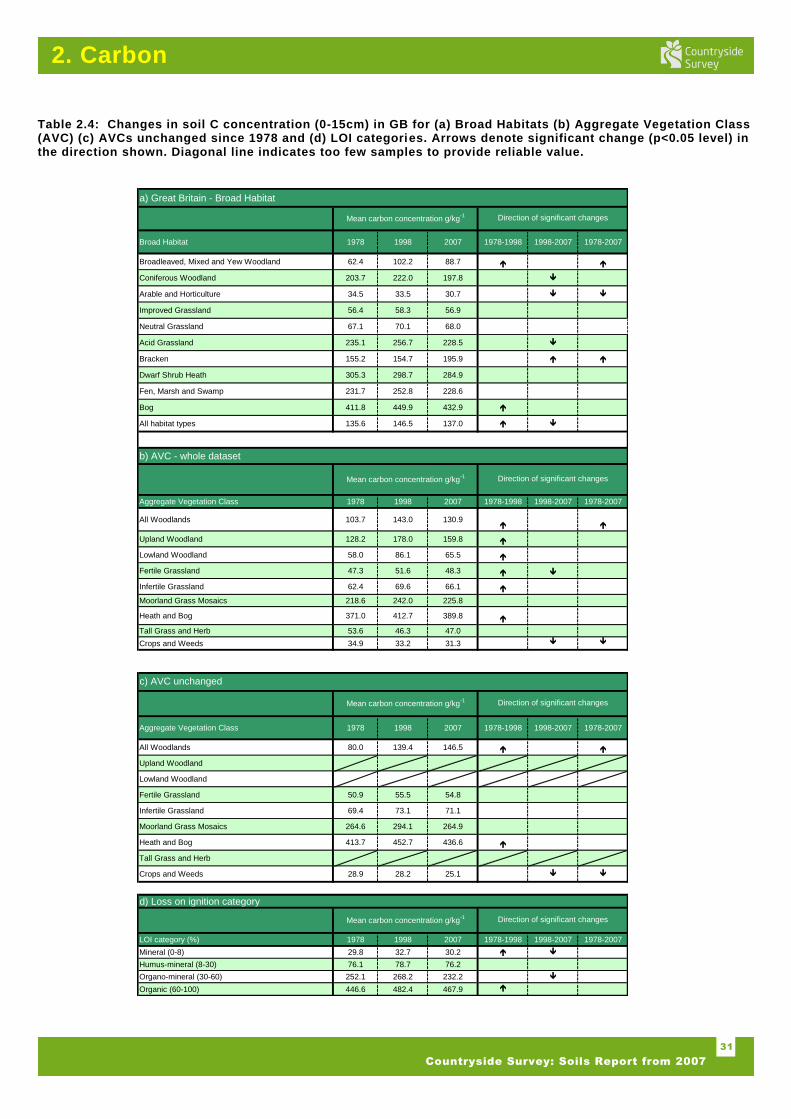
Significant changes were observed within and between the different Broad Habitat Aggregate Vegetation
Classes soil carbon categories and between the individual su rvey years (Table 24)
Amongst BHs which represent the larger habitat unit within which each soil sampling location resides topsoil
C concentrations in 1978 and 2007 were significantly different in Arable and Horticulture Bracken and
Broadleaf Woodland soils (Table 24a) Note that the BH is based on 2007 recording (and occasionally on
the 1998 data) since the BH classification did not exist in 1978 There were very low numbers of soil
samples in the Bracken BH in 1978 and 1998 ndash 10 and 12 respectively ndash so estimates for these years are
likely to be inaccurate The 2007 estimate which is based on 53 samples is more likely to represent a
reasonable value of the C concentration in the Bracken BH and the significant change is likely an effect of
better representation in 2007
The pattern of higher C concentrations in 1998 compared with the other Survey years also occurred within
many Aggregate Vegetation Classes although changes were not always significant ( Table 24b Fig 26)
Within AVCs the only significant differences in topsoil C concentration over the whole 29 year period were a
decrease in arable soils (AVC Crops and Weeds) and an increase in all woodlands (the combined Lowland
and Upland Woodland AVCs) (Fig 27a) In 1978 1998 and 2007 CS sampled 23 29 and 81 lowland
woodlands respectively and 76 71 and 198 Upland Woodlands Coverage of these AVCs was low in both
1978 and 1998 due to the smaller number of samples taken in these years and the infrequent occurrence of
woodlands in the GB countryside Larger areas of woodlands and greater numbers of soil samples collected
have contributed to greater numbers of woodland soil samples in 2007 Our report of topsoil C concentration
change in woodlands should therefore be seen in the context of low sample numbers in 1978 and 1998 and
represents our best estimates based on available CS data
To remove the effects of large-scale vegetationland use change we also estimated topsoil C concentrations
in plots which were sampled in all three Surveys and in which the AVC did not change over time ( Table
24c) Since the AVC of the plots is only known for the Survey years we cannot rule out changes in the
intervening years eg rotation between arable and grassland systems Therefore plo ts where the AVC has
-8
-6
-4
-2
0
2
4
6
8
10
12
GB England Scotland Wales
Ch
an
ge
in
ca
rbo
n c
on
ce
ntr
ati
on
(g
Ck
g)
0
50
100
150
200
250
300
1975 1980 1985 1990 1995 2000 2005 2010
Me
an
ca
rbo
n c
on
ce
ntr
ati
on
(g
Ck
g)
GB England Scotland Wales
29
Countryside Survey Soils Report from 2007
2 Carbon
not changed are plots in which the vegetation composition has been largely consistent in 1978 1998 and
2007 Only 405 plots had consistent AVCs in the three Surveys and because of this there were insufficient
samples in the Tall Grass and Herb AVC and soils in this category were ignored Additionally the lowland
and Upland Woodland AVCs were grouped into one category all woodlands due to the small number of
samples in each category individually Nevertheless trends in these plo ts were broadly consistent with those
observed for the whole dataset suggesting that shifts in AVC (ie land use change) are unlikely to be a major
factor in determining soil C concentration changes over time
Within soil C group categories there were significant increases in soil C concentration between 1978 and
1998 for mineral and organic soils however subsequent declines in the period 1998 to 2007 led to no
significant changes between 1978 and 2007 (Table 24d Fig 27b)
When soil C concentration (0-15cm) was converted to carbon density using the bulk density transfer function
the significant reduction in Broad Habitat Arable and Horticulture and AVC Crops and Weeds categories was
again apparent (Fig 28 Table 25) This appears the most consistent of all trends identified by CS in 2007
whether expressed as C concentration or density
Figure 26 The change in soil C concentrations (0-15cm) between 1978 1998 and 2007 across AVC
classifications characterised by (a) low ndash medium topsoil C concentrations and (b) high topsoil C
concentrations Significant changes are indicated in Table 24
a) b)
0
50
100
150
200
250
300
350
400
450
1975 1980 1985 1990 1995 2000 2005 2010
Me
an
ca
rbo
n c
on
ce
ntr
ati
on
(g
Ck
g)
Upland Woodland Moorland grass mosaic
Heath and Bog
0
10
20
30
40
50
60
70
80
90
100
1975 1980 1985 1990 1995 2000 2005 2010
Mean
carb
on
co
ncen
trati
on
(g
Ck
g)
Crops and Weeds Tall grass and herbs
Fertile grassland Infertile grassland
Lowland woodland
30
Countryside Survey Soils Report from 2007
2 Carbon
Figure 27 Overall change in soil C concentrations (0-15cm) between 1978 and 2007 (a) across AVC categories
and (b) LOI categories Standard errors are indicated Significant differences ( plt0001) are shown
a) b)
Figure 28 Overall change in soil C density (0-15cm) between 1978 and 2007 (a) across AVC categories and (b)
LOI categories Standard errors are indicated Significant differences ( plt005) are shown
a) b)
-6
-4
-2
0
2
4
6
8
Mineral Humus-mineral Organo-mineral Organic
Ch
an
ge
in
ca
rbo
n d
en
sit
y (
gC
cm
3)
-50
-40
-30
-20
-10
0
10
20
30
40
Mineral Humus-mineral Organo-mineral Organic
Ch
an
ge
in
ca
rbo
n c
on
ce
ntr
ati
on
(g
Ck
g)
-20
-10
0
10
20
30
40
50
60
Cro
ps amp
wee
ds
Tall g
rass
and
her
b
Fertile
gras
slan
d
Infe
rtile g
rass
land
Lowland
woo
dlan
d
Upl
and
woo
dlan
d
Moo
rland
gra
ss m
osaics
Hea
th a
nd b
ogCh
an
ge
in
ca
rbo
n c
on
ce
ntr
ati
on
(g
Ck
g)
-10
-5
0
5
10
15
Cro
ps amp
wee
ds
Tall g
rass
and
her
b
Fertile
gras
slan
d
Infe
rtile g
rass
land
Lowland
woo
dlan
d
Upl
and
woo
dlan
d
Moo
rland
gra
ss m
osaics
Hea
th a
nd b
og
Ch
an
ge
in
ca
rbo
n d
en
sit
y (
gC
cm
3)
31
Countryside Survey Soils Report from 2007
2 Carbon
Table 24 Changes in soil C concentration (0-15cm) in GB for (a) Broad Habitats (b) Aggregate Vegetation Class (AVC) (c) AVCs unchanged since 1978 and (d) LOI categories Arrows denote significant change (plt005 level) in the direction shown Diagonal line indicates too few samples to provide reliable value
a) Great Britain - Broad Habitat
Broad Habitat 1978 1998 2007 1978-1998 1998-2007 1978-2007
Broadleaved Mixed and Yew Woodland 624 1022 887
Coniferous Woodland 2037 2220 1978
Arable and Horticulture 345 335 307
Improved Grassland 564 583 569
Neutral Grassland 671 701 680
Acid Grassland 2351 2567 2285
Bracken 1552 1547 1959
Dwarf Shrub Heath 3053 2987 2849
Fen Marsh and Swamp 2317 2528 2286
Bog 4118 4499 4329
All habitat types 1356 1465 1370
b) AVC - whole dataset
Aggregate Vegetation Class 1978 1998 2007 1978-1998 1998-2007 1978-2007
All Woodlands 1037 1430 1309
Upland Woodland 1282 1780 1598
Lowland Woodland 580 861 655
Fertile Grassland 473 516 483
Infertile Grassland 624 696 661
Moorland Grass Mosaics 2186 2420 2258
Heath and Bog 3710 4127 3898
Tall Grass and Herb 536 463 470
Crops and Weeds 349 332 313
Aggregate Vegetation Class 1978 1998 2007 1978-1998 1998-2007 1978-2007
All Woodlands 800 1394 1465
Upland Woodland
Lowland Woodland
Fertile Grassland 509 555 548
Infertile Grassland 694 731 711
Moorland Grass Mosaics 2646 2941 2649
Heath and Bog 4137 4527 4366
Tall Grass and Herb
Crops and Weeds 289 282 251
d) Loss on ignition category
LOI category () 1978 1998 2007 1978-1998 1998-2007 1978-2007
Mineral (0-8) 298 327 302
Humus-mineral (8-30) 761 787 762
Organo-mineral (30-60) 2521 2682 2322
Organic (60-100) 4466 4824 4679
Mean carbon concentration gkg-1 Direction of significant changes
Mean carbon concentration gkg-1 Direction of significant changes
Mean carbon concentration gkg-1 Direction of significant changes
Mean carbon concentration gkg-1 Direction of significant changes
c) AVC unchanged
32
Countryside Survey Soils Report from 2007
2 Carbon
Table 25 Changes in soil C density (0-15cm) in GB for (a) Broad Habitats (b) Aggregate Vegetation Class (AVC)
(c) AVCs unchanged since 1978 and (d) LOI categories Arrows denote significant change (plt005 level) in the
direction shown Diagonal line indicates too few samples to provide reliable value
a) Great Britain - Broad Habitat
Broad Habitat 1978 1998 2007 1978-1998 1998-2007 1978-2007
Broadleaved Mixed and Yew Woodland 659 769 729
Coniferous Woodland 837 840 814
Arable and Horticulture 530 518 473
Improved Grassland 657 679 672
Neutral Grassland 655 717 686
Acid Grassland 916 889 906
Bracken 743 992 847
Dwarf Shrub Heath 842 839 899
Fen Marsh and Swamp 857 821 828
Bog 834 813 856
All habitat types 687 706 693
Aggregate Vegetation Class 1978 1998 2007 1978-1998 1998-2007 1978-2007
All Woodlands 722 796 796
Upland Woodland 761 835 847
Lowland Woodland 649 707 683
Fertile Grassland 608 659 626
Infertile Grassland 690 736 716
Moorland Grass Mosaics 869 897 898
Heath and Bog 824 835 844
Tall Grass and Herb 596 604 581
Crops and Weeds 509 512 479
Aggregate Vegetation Class 1978 1998 2007 1978-1998 1998-2007 1978-2007
All Woodlands 662 905 784
Upland Woodland
Lowland Woodland
Fertile Grassland 628 690 699
Infertile Grassland 711 738 729
Moorland Grass Mosaics 817 919 807
Heath and Bog 847 846 788
Tall Grass and Herb
Crops and Weeds 515 488 462
d) Loss on ignition category
LOI category () 1978 1998 2007 1978-1998 1998-2007 1978-2007
Mineral (0-8) 506 541 513
Humus-mineral (8-30) 750 777 763
Organo-mineral (30-60) 988 974 997
Organic (60-100) 834 809 849
b) AVC - whole dataset
Mean Carbon Density (tha) Direction of significant changes
Mean Carbon Density (tha) Direction of significant changes
Mean Carbon Density (tha) Direction of significant changes
c) AVC unchanged
Mean Carbon Density (tha) Direction of significant changes
33
Countryside Survey Soils Report from 2007
2 Carbon
233 Change in soil (0-15cm) C concentration and density (0-15cm) for England
Mean soil C concentrations in England (Table 26) are generally lower than those for GB as a whole This is
due to lower frequency of carbon rich soils in England and Wales relati ve to Scotland No significant change
was observed for the country between individual surveys (Fig 25a) or the whole 29 year period (Fig 25b)
There were fewer significant differences observed within individual vegetation and soil categories for tops oils
in England relative to GB and there was an insufficient number of samples to report on some categories
Consistent with changes observed for GB were significant reductions for the Arable and Horticulture Broad
Habitat and Crops and Weed Aggregate Vegetation Class Significant differences ( plt0001) are shown
(Fig 29) Significant increases for GB woodland soils were not reflected in the results for England However
a significant increase was observed for Infertile Grassland in England which was n ot observed for GB When
transformed to carbon density similar trends were observed (Fig 210 Table 27) Significant differences for
the whole 29 year period were only observed for Crops and Weeds and Moorland Grass Mosaic Aggregate
Vegetation Class
Figure 29 Change in soil C concentration (0-15cm) for England between 1978 and 2007 for different AVCs
Standard errors are indicated Significant differences ( plt0001 plt005) are shown
Figure 210 Change in soil C density (0-15cm) for England between 1978 and 2007 for different AVCs Standard
errors are indicated Significant differences ( plt0001 plt005) are shown There was insufficient samples to
report for Tall Grass and Herb Mean change for Upland Wood was lt 01 gcm3
-10
-5
0
5
10
15
20
25
Cro
ps amp
wee
ds
Tall g
rass
amp her
b
Fertile
gras
slan
d
Infe
rtile
gra
ssla
nd
Lowla
nd w
ood
Upl
and
woo
d
Moo
rland
gra
ss m
osai
c
Hea
th a
nd b
og
Ch
an
ge
in
ca
rbo
n d
en
sit
y (
gC
cm
3)
-30
-20
-10
0
10
20
30
40
50
60
70
80
Crops amp
weeds
Fertile
grassland
Infertile
grassland
Lowland
wood
Upland
wood
Moorland
grass
mosaic
Heath and
bog
Ch
an
ge in
ca
rbo
n c
on
ce
ntr
ati
on
(g
Ck
g)
34
Countryside Survey Soils Report from 2007
2 Carbon
Table 26 Changes in soil C concentration (0-15cm) in England for (a) Broad Habitats (b) Aggregate Vegetation
Class (AVC) (c) AVCs unchanged since 1978 and (d) LOI categories Arrows denote significant change (plt005
level) in the direction shown Diagonal line indicates too few samples to provide reliable value
a) England - Broad Habitat
Broad Habitat 1978 1998 2007 1978-1998 1998-2007 1978-2007
Broadleaved Mixed and Yew Woodland 546 804 687
Coniferous Woodland 1173 1578 1312
Arable and Horticulture 339 328 300
Improved Grassland 503 542 531
Neutral Grassland 601 693 648
Acid Grassland 1970 2006 2098
Bracken 1150 1273 1535
Dwarf Shrub Heath 2980 2275 2292
Fen Marsh and Swamp 2888 2789 2738
Bog 1978 4313 3985
All habitat types 744 797 756
Aggregate Vegetation Class 1978 1998 2007 1978-1998 1998-2007 1978-2007
Upland Woodland 1050 1625 1313
Lowland Woodland 596 876 691
Fertile Grassland 450 501 446
Infertile Grassland 546 667 630
Moorland Grass Mosaics 1980 1898 2174
Heath and Bog 3022 3544 3390
Tall Grass and Herb 434 433
Crops and Weeds 340 323 307
Aggregate Vegetation Class 1978 1998 2007 1978-1998 1998-2007 1978-2007
Upland Woodland
Lowland Woodland
Fertile Grassland 521 550 557
Infertile Grassland 633 741 723
Moorland Grass Mosaics
Heath and Bog
Tall Grass and Herb
Crops and Weeds 282 275 249
d) Loss on ignition category
LOI category () 1978 1998 2007 1978-1998 1998-2007 1978-2007
Mineral (0-8) 290 318 292
Humus-mineral (8-30) 684 742 705
Organo-mineral (30-60) 3454 2349 2101
Organic (60-100)
b) AVC - whole dataset
Mean carbon concentration gkg-1 Direction of significant changes
Mean carbon concentration gkg-1 Direction of significant changes
Mean carbon concentration gkg-1 Direction of significant changes
c) AVC unchanged
Mean carbon concentration gkg-1 Direction of significant changes
35
Countryside Survey Soils Report from 2007
2 Carbon
Table 27 Changes in soil C density (0-15cm) in England for (a) Broad Habitats (b) Aggregate Vegetation Class
(AVC) (c) AVCs unchanged since 1978 and (d) LOI categories Arrows denote s ignificant change (plt005 level) in
the direction shown Diagonal line indicates too few samples to provide reliable value
a) England - Broad Habitat
Broad Habitat 1978 1998 2007 1978-1998 1998-2007 1978-2007
Broadleaved Mixed and Yew Woodland 578 761 688
Coniferous Woodland 896 760 779
Arable and Horticulture 491 498 469
Improved Grassland 629 685 646
Neutral Grassland 624 656 659
Acid Grassland 766 720 955
Bracken 959 728 941
Dwarf Shrub Heath 771 1018 966
Fen Marsh and Swamp 819 941 967
Bog 1060 1198 852
All habitat types 696 715 702
Aggregate Vegetation Class 1978 1998 2007 1978-1998 1998-2007 1978-2007
Upland Woodland 814 684 814
Lowland Woodland 698 718 681
Fertile Grassland 616 639 609
Infertile Grassland 688 708 693
Moorland Grass Mosaics 777 898 880
Heath and Bog 796 857 912
Tall Grass and Herb 554 613 585
Crops and Weeds 497 501 469
Aggregate Vegetation Class 1978 1998 2007 1978-1998 1998-2007 1978-2007
Upland Woodland
Lowland Woodland
Fertile Grassland 631 690 687
Infertile Grassland 745 760 795
Moorland Grass Mosaics
Heath and Bog
Tall Grass and Herb
Crops and Weeds 498 476 439
d) Loss on ignition category
LOI category () 1978 1998 2007 1978-1998 1998-2007 1978-2007
Mineral (0-8) 504 523 496
Humus-mineral (8-30) 754 783 744
Organo-mineral (30-60) 1172 1011 885
Organic (60-100)
Mean Carbon Density (tha) Direction of significant changes
b) AVC - whole dataset
Mean Carbon Density (tha) Direction of significant changes
Mean Carbon Density (tha) Direction of significant changes
c) AVC unchanged
Mean Carbon Density (tha) Direction of significant changes
36
Countryside Survey Soils Report from 2007
2 Carbon
234 Change in soil (0-15cm) C concentration and density (0-15cm) across Scotland
Mean soil C concentrations in Scotland are generally higher than that for GB as a whole This is due to
higher frequency of carbon rich soils relative to England and Wales A significant increase was observed
between 1978 and 1998 and a significant decline between 1998 and 2007 which was mirrored in the GB
trends (Fig 25a) There was no significant change over the whole 29 year period (Fig 25b)
There were fewer significant differences for individual vegetation and soil categories for topsoils in Scotland
relative to GB and there was insufficient number of samples to report on some categories (Table 28)
Consistent with changes observed for GB were a significant increase for the Broadleaved Mixed and Yew
Woodland Broad Habitat and a significant decline in Crops and Weed Aggregate Vegetation Class (Fig
211) Significant increases for the GB Bracken Broad Habitat was not observed for Scotland Transformation
to carbon density confirmed a significant decline in soil carbon status of the Crops and Weeds Aggregate
Vegetation Class (Fig 212 Table 29)
Figure 211 Change in soil C concentration (0-15cm) for Scotland between 1978 and 2007 for different AVCs
Standard errors are indicated Standard errors are indicated Significant differences ( plt005) are shown
Figure 212 Change in soil C density for Scotland (0-15cm) between 1978 and 2007 for different AVCs Standard
errors are indicated Standard errors are indicated Significant differences ( plt0005) are shown
-20
-10
0
10
20
30
40
50
60
70
Crops amp
weeds
Fertile
grassland
Infertile
grassland
Upland wood Moorland
grass
mosaic
Heath and
bog
Ch
an
ge
in
ca
rbo
n c
on
ce
ntr
ati
on
(g
Ck
g)
-15
-10
-5
0
5
10
Crops amp
weeds
Fertile
grassland
Infertile
grassland
Upland wood Moorland
grass
mosaic
Heath and
bog
Ch
an
ge
in
ca
rbo
n c
on
ce
ntr
ati
on
(g
Ck
g)
37
Countryside Survey Soils Report from 2007
2 Carbon
Table 28 Changes in soil C concentration (0-15cm) in Scotland for (a) Broad Habitats (b) Aggregate Vegetation
Class (AVC) (c) AVCs unchanged since 1978 and (d) LOI categories Arrows denote significant change (plt005
level) in the direction shown Diagonal line indicates too few samples to provide reliable value
a) Scotland - Broad Habitat
Broad Habitat 1978 1998 2007 1978-1998 1998-2007 1978-2007
Broadleaved Mixed and Yew Woodland 889 1719 1451
Coniferous Woodland 2385 2456 2289
Arable and Horticulture 358 356 323
Improved Grassland 646 640 650
Neutral Grassland 911 842 835
Acid Grassland 2628 2919 2479
Bracken 2383 2312 2932
Dwarf Shrub Heath 3189 3310 3138
Fen Marsh and Swamp 2145 2700 2282
Bog 4242 4539 4382
All habitat types 2385 2578 2420
Aggregate Vegetation Class 1978 1998 2007 1978-1998 1998-2007 1978-2007
Upland Woodland 1441 1888 1847
Lowland Woodland
Fertile Grassland 470 525 492
Infertile Grassland 840 895 827
Moorland Grass Mosaics 2236 2541 2293
Heath and Bog 3926 4329 4097
Tall Grass and Herb
Crops and Weeds 369 371 322
Aggregate Vegetation Class 1978 1998 2007 1978-1998 1998-2007 1978-2007
Upland Woodland
Lowland Woodland
Fertile Grassland
Infertile Grassland 779 759 703
Moorland Grass Mosaics 2804 3202 2881
Heath and Bog 4168 4574 4409
Tall Grass and Herb
Crops and Weeds
d) Loss on ignition category
LOI category () 1978 1998 2007 1978-1998 1998-2007 1978-2007
Mineral (0-8) 305 336 314
Humus-mineral (8-30) 877 882 859
Organo-mineral (30-60) 2558 2888 2329
Organic (60-100) 4475 4820 4686
b) AVC - whole dataset
Mean carbon concentration gkg-1 Direction of significant changes
Mean carbon concentration gkg-1 Direction of significant changes
Mean carbon concentration gkg-1 Direction of significant changes
c) AVC unchanged
Mean carbon concentration gkg-1 Direction of significant changes
38
Countryside Survey Soils Report from 2007
2 Carbon
Table 29 Changes in soil C density (0 -15cm) in Scotland for (a) Broad Habitats (b) Aggregate Vegetation Class
(AVC) (c) AVCs unchanged since 1978 and (d) LOI categories Arrows denote significant change (plt005 level) in
the direction shown Diagonal line indicates too few samples to provide reliable value
a) Scotland - Broad Habitat
Broad Habitat 1978 1998 2007 1978-1998 1998-2007 1978-2007
Broadleaved Mixed and Yew Woodland 752 629 776
Coniferous Woodland 874 793 804
Arable and Horticulture 536 526 523
Improved Grassland 688 724 701
Neutral Grassland 728 713 739
Acid Grassland 938 937 884
Bracken 682 944 874
Dwarf Shrub Heath 881 821 900
Fen Marsh and Swamp 930 948 766
Bog 834 883 833
All habitat types 776 780 787
Aggregate Vegetation Class 1978 1998 2007 1978-1998 1998-2007 1978-2007
Upland Woodland 878 799 818
Lowland Woodland 00 00 00
Fertile Grassland 661 697 655
Infertile Grassland 690 779 728
Moorland Grass Mosaics 926 916 904
Heath and Bog 853 836 826
Tall Grass and Herb
Crops and Weeds 563 583 507
Aggregate Vegetation Class 1978 1998 2007 1978-1998 1998-2007 1978-2007
Upland Woodland
Lowland Woodland
Fertile Grassland
Infertile Grassland 682 678 720
Moorland Grass Mosaics 897 903 878
Heath and Bog 852 869 816
Tall Grass and Herb
Crops and Weeds
d) Loss on ignition category
LOI category () 1978 1998 2007 1978-1998 1998-2007 1978-2007
Mineral (0-8) 499 522 520
Humus-mineral (8-30) 778 806 815
Organo-mineral (30-60) 1009 931 899
Organic (60-100) 858 775 853
Mean Carbon Density (tha) Direction of significant changes
b) AVC - whole dataset
Mean Carbon Density (tha) Direction of significant changes
Mean Carbon Density (tha) Direction of significant changes
c) AVC unchanged
Mean Carbon Density (tha) Direction of significant changes
39
Countryside Survey Soils Report from 2007
2 Carbon
235 Change in soil (0-15cm) C concentration and density (0-15cm) across Wales
Mean soil C concentrations (0-15cm) in Wales are intermediate relative to England and Scotland No
significant change between surveys or over the whole 29 year period was observed ( Fig 25 a amp b)
There was only one significant difference observed within individual categories a decrease for the
Coniferous Woodland Broad Habitat (Table 210) There was no significant change with the two Aggregate
Vegetation Classes we are able to report either for soil (0 -15cm) concentration or density (Fig 213 amp 214
Table 210 amp 211) The low number of reporting categories are due to the lower number of sampl es for
Wales relative to England and Scotland which were sampled in 1978 Reporting change over the full 29 year
reporting period is therefore only possible for Fertile and Infertile Grasslands which have the largest number
of sample squares The increase in sample number in 2007 survey will ensure this improves in future surveys
as we now have baseline measurements for 7 Broad Habitat categories
Figure 213 Change in soil C concentration (0-15cm) for Wales between 1978 and 2007 for the AVC categories
with sufficient sample number to allow reporting for the full 29 year reporting period No significant change was
observed
Figure 214 Change in soil C density (0-15cm) for Wales between 1978 and 2007 for the AVC categories with
sufficient sample number to allow reporting for the full 29 year reporting period Standard error bars are
indicated No significant change was observed
-10
-8
-6
-4
-2
0
2
4
6
8
Fertile grassland Infertile grassland
Ch
an
ge
in
ca
rbo
n c
on
ce
ntr
ati
on
(g
Ck
g)
-12
-10
-8
-6
-4
-2
0
2
Fertile grassland Infertile grassland
Ch
an
ge i
n c
arb
on
den
sit
y (
gC
cm
3)
40
Countryside Survey Soils Report from 2007
2 Carbon
Table 210 Changes in soil C concentration (0-15cm) in Wales for (a) Broad Habitats (b) Aggregate Vegetation
Class (AVC) (c) AVCs unchanged since 1978 and (d) LOI categories Arrows denote significant change (plt005
level) in the direction shown Diagonal line indicates too few samples to provide reliable value
a) Wales - Broad Habitat
Broad Habitat 1978 1998 2007 1978-1998 1998-2007 1978-2007
Broadleaved Mixed and Yew Woodland 672 721 870
Coniferous Woodland 1766 2336 1843
Arable and Horticulture 385 349
Improved Grassland 680 663 606
Neutral Grassland 533 574 621
Acid Grassland 1982 2082 2077
Bracken
Dwarf Shrub Heath 2107 2672 2800
Fen Marsh and Swamp
Bog
All habitat types 1076 1089 1086
Aggregate Vegetation Class 1978 1998 2007 1978-1998 1998-2007 1978-2007
Upland Woodland 1424
Lowland Woodland
Fertile Grassland 545 539 568
Infertile Grassland 637 632 612
Moorland Grass Mosaics 2208
Heath and Bog 3338
Tall Grass and Herb
Crops and Weeds
Aggregate Vegetation Class 1978 1998 2007 1978-1998 1998-2007 1978-2007
Upland Woodland
Lowland Woodland
Fertile Grassland
Infertile Grassland
Moorland Grass Mosaics
Heath and Bog
Tall Grass and Herb
Crops and Weeds
d) Loss on ignition category
LOI category () 1978 1998 2007 1978-1998 1998-2007 1978-2007
Mineral (0-8)
Humus-mineral (8-30) 714 688 691
Organo-mineral (30-60)
Organic (60-100)
b) AVC - whole dataset
Mean carbon concentration gkg-1 Direction of significant changes
Mean carbon concentration gkg-1 Direction of significant changes
Mean carbon concentration gkg-1 Direction of significant changes
c) AVC unchanged
Mean carbon concentration gkg-1 Direction of significant changes
41
Countryside Survey Soils Report from 2007
2 Carbon
Table 211 Changes in soil C density (0-15cm) in Wales for (a) Broad Habitats (b) Aggregate Vegetation Class
(AVC) (c) AVCs unchanged since 1978 and (d) LOI categories Arrows denote significant change (plt005 level) in
the direction shown Diagonal line indicates too few samples to provide reliable value
a) Wales - Broad Habitat
Broad Habitat 1978 1998 2007 1978-1998 1998-2007 1978-2007
Broadleaved Mixed and Yew Woodland 772 614 790
Coniferous Woodland 657 940 762
Arable and Horticulture 708 560
Improved Grassland 726 690 681
Neutral Grassland 644 671 694
Acid Grassland 892 928 838
Bracken
Dwarf Shrub Heath 1341 1068 1033
Fen Marsh and Swamp
Bog
All habitat types 765 802 752
Aggregate Vegetation Class 1978 1998 2007 1978-1998 1998-2007 1978-2007
Upland Woodland
Lowland Woodland
Fertile Grassland 731 714 686
Infertile Grassland 718 663 697
Moorland Grass Mosaics
Heath and Bog
Tall Grass and Herb
Crops and Weeds
Aggregate Vegetation Class 1978 1998 2007 1978-1998 1998-2007 1978-2007
Upland Woodland
Lowland Woodland
Fertile Grassland
Infertile Grassland
Moorland Grass Mosaics
Heath and Bog
Tall Grass and Herb
Crops and Weeds
d) Loss on ignition category
LOI category () 1978 1998 2007 1978-1998 1998-2007 1978-2007
Mineral (0-8)
Humus-mineral (8-30) 718 795 800
Organo-mineral (30-60)
Organic (60-100)
Mean Carbon Density (tha) Direction of significant changes
b) AVC - whole dataset
Mean Carbon Density (tha) Direction of significant changes
Mean Carbon Density (tha) Direction of significant changes
c) AVC unchanged
Mean Carbon Density (tha) Direction of significant changes
42
Countryside Survey Soils Report from 2007
2 Carbon
24 Discussion
It is estimated that European soils contain 75-79Pg C (Schils et al 2008) of which UK soils store 6-7 Pg
The top 15 cm of soils in GB (ie the UK without Northern Ireland) store ca 16 Pg C (Table 211) Soils are
the largest terrestrial pool of C There is a need to track and understand trends in soil C and to optimise
future soil C storage through land management and use Although measurements of topsoil organic C are
available in all member EU countries very few countries have repeated sampling campaigns (Saby et al
2008) and to our knowledge Countryside Survey is the first survey in Europe to sample soils three times
The approach to monitoring programs in Europe has been reviewed by Kibblewhite et al (2008) Morvan et
al (2008) and Schils et al (2008) current national monitoring programs are criticised because of lack of soil
BD measurements insufficient sample numbers and lack of repeated explanatory measurements
Countryside Survey particularly the 2007 Survey addresses these particular issues for GB
The mapped distributions of soil C concentrations (as ) in 2007 ( Fig 215a) follows the anticipated pattern
with high concentrations in upland peatland areas such as NW Scotland N England and upland areas of
Wales The coefficient of variation (CV standard deviation mean an indicator of the spread of the data
around the mean value) is lowest in areas dominated by either low carbon soils which are intensively
managed or high carbon soils in upland areas where there is little variation (Fig 215b) Conversely the
signal to noise ratio (SNR mean standard deviation) indicates that for values above 1 the signal is stronger
than the noise High SNR‟s are consistent with managed arable areas acros s Eastern England and the
upland and peat areas across the UK but especially in N Scotland (Fig 215c) This may occur because the
soil management leads to greater uniformity of carbon levels across these areas In areas less intensively
managed natural variation in soil carbon levels across the landscape may lead to the low SNR‟s observed
Figure 215 Maps of soil C concentration (0-15cm) in 2007(a) using ordinary Kriging (C) (b) coefficient of
variation and (c) signal to noise ratio
43
Countryside Survey Soils Report from 2007
2 Carbon
Multiplying soil C density by area of habitats for individual countries results in the estimate of carbon
currently stored in 0-15cm of GB soils (Table 211)
Table 211 Estimate of soil carbon stock (0-15cm) for GB and individual countries
Country km2 Soil C density
(0-15cm)
tha
Soil C stock
(0-15cm)
TgC
se
GB 228226 6931 1582 29
England 127284 6245 795 15
Scotland 79849 7879 628 11
Wales 21091 7519 159 3
The CS estimate for England and Wales (954 Tg) in soils (0 -15cm) compares with an estimate of 864 Tg for
England and Wales estimated by Bellamy et al (2005) One major cause of this difference is the new
conversion factor for LOI to soil C concentration of 055 defined by CS compared to the factor of 05 used by
Bellamy et al (2005) The new pedotransfer function for bulk density measurements to soil C concentration
described in Chapter 1 primarily affects estimates of stock and change for organic soils only and has only
limited effect on total stock estimates (0-15cm) at the national scale
The results from the Countryside Survey of Great Britain reported here suggest that the topsoil C
concentration and stock of GB and its constituent countries has not changed significantly since 1978
Results for topsoil C density are a combination of changes in soil C concentration and estimated bulk density
and we observed no overall change at a GB level in C concentration although there was a significant
increase (+8) between 1978 and 1998 and a decrease ( -65) in 1998 and 2007 Examining C
concentration by other strata (eg country soil C group AVC) produced similar results with consistent
differences between 1978 and 2007 only occurring in arable and woodland systems Particularly significant
in light of Bellamy et al (2005) is the lack of change in topsoil C concentrations in organic soils although this
disagrees with Bellamy et al (2005) it is in agreement with other reports and the outputs of soil C models
There are unfortunately few monitoring studies from W Europe with which to c ompare our topsoil results
some studies only report changes in C concentration some only C density some only to 1m depth Our
results for changes in topsoil C concentrations in arable and grassland systems are comparable with the
ranges reported by various studies on Belgian soils (Goidts and van Wesemael 2007) but are smaller than
those reported by Bellamy et al (2005) for England and Wales For woodland soils CS estimates of change
are larger than those reported from a major UK resurvey of 103 wood lands (Kirby et al 2005) and in the
opposite direction to reports of C changes in woodland soils in Belgium (Stevens and van Wesemael 2008)
and to that of Bellamy et al (2005) for England and Wales Given the small number of woodlands sampled in
CS in 1978 and 1998 a potentially more accurate picture of changes in topsoil C concentration in GB
woodlands was reported by Kirby et al (2005) whose survey specifically examined changes in woodlands
between 1971 and 2000-2003 and found no significant change in topsoil C concentration which remained
around 88 g C kg -1 However CS estimates of changes in woodland topsoil C densities (12-30 g C m
-2 yr
-1)
are similar to model estimates of European forest soils by Liski et al (2002) and Nabuurs et al (2003)
which suggest net sequestration of 19 and 11 g m-2
yr-1
respectively
A range of potential factors responsible for soil C change have been proposed including climate change
nutrient deposition management practices increasing atmospheric CO 2 concentrations and land use and
land use change However at the large scale the attributi on of change is complicated by the presence of
multiple drivers which can simultaneously affect the balance of C inputs (largely plant biomass) and outputs
(mostly microbial respiration) Our results also suggest that land use change (as measured by the AVC) is
not responsible for the few significant observed changes in topsoil C concentration Climate change is
unlikely to be the cause of change in topsoil C since changes in temperature and rainfall across GB since
44
Countryside Survey Soils Report from 2007
2 Carbon
1978 have been insufficient to cause large-scale changes in mineral soil C concentration or density (Smith et
al 2007) Model estimates of climate change-related variation in C density for England Scotland and Wales
are -001 +003 and +001 yr -1 respectively if changes in net primary productivity (NPP) are included
(Smith et al 2007) CS estimates of change are much larger than these -009 to -021 +01 to +013 and
+018 to +039 yr -1 for all arable grassland and forest soils respectively across GB Since land use change
and climate change may be excluded as primary drivers of change and trends differ between habitat types
other habitat-specific drivers must be responsible for the long-term changes observed in arable and woodland
soils The most consistent finding from CS in 2007 is the reduction in soil C (0-15cm) concentration and
density in cropland A reduction in mean total N concentration as well (Chapter 4) suggests processes such
as erosion deep ploughing (which brings soil with lower CN ratio soil to the surface) and or increased
decomposition may be responsible for this trend Intensification of farming practices are often thought to be
the dominant factor (Stoate et al 2001) In Broadleaved Woodland where a significant increase was
observed changes in tree age structure and reduced harvesting are likely to be the main drivers of soil C
concentration increases (Liski et al 2002 De Vries et al 2006) Efforts to attribute the observed soil (0-
15cm) C changes in CS are ongoing and will be reported in the CS Integr ated Assessment Report
25 Policy Implications
The results from CS in 2007 do not confirm the widespread loss of soil carbon (0-15cm) as reported by
Bellamy et al (2005) for soils (0-15cm) as part of the National Soils Inventory monitoring programme in
England and Wales between 1978 and 2003 The one consistent exception is loss of carbon (0-15cm) from
the intensively managed Arable and Horticulture Broad Habitat Crops and Weeds Aggregate Vegetation
Class soils This suggests that current policies in place to limit soil degradation are not maintaining soil
quality in cropped land
The stability in soil carbon measurements in other land use types could be a combination of a complex mix of
factors some of which may increase soil (0-15cm) C concentration eg increased carbon inputs from plants
due to nitrogen deposition and increased carbon dioxide in the atmosphere whilst some may reduce soil C
concentration eg intensive land management Only by further analysis of the spatial patterns within the CS
datasets in combination with experimental and survey data from other studies and modelling approaches will
it be possible to advise on the likely future trends of soil carbon and indeed help to explain the general trend
of an increase between 1978 and decrease from 1998 to 2007 It should also be remembered these are
results for soil 0-15cm only and not the whole soil profile It does not include soil lost by erosion although a
reduction in soil C concentration would be expected if the latter was widespread as soil decreases in soil C
concentration down the soil profile
A major change for CS in 2007 was the introduction of data which enables calculation of carbon stock (0 -
15cm) This takes into account not only the soil C concentration of soil in the top 15cm but also the amount of
soil The amount of soil may change due to changes in the compaction of the soil for example due to the use
of heavy machinery or increased animal numbers The increased information this provides has resulted in
greater confidence in the reduction in soil carbon for intensively managed arable and crop soils as this trend
is observed in both soil C concentration and C density results and is the most consistent result within
individual categories By combining C density data wi th areas of Broad Habitats a national estimate of the
topsoil (0-15cm) carbon stock from co-located bulk density and soil C concentration measurements is now
available for the first time
The data provide an evidence base for monitoring the protection o f soil carbon stores highlighted as a priority
within the new Soils Strategy for England the Environment Strategy in Wales and Scottish Soil Framework
The new data have now been selected as an indicator of soil quality for State of the Environment Repor ting
45
Countryside Survey Soils Report from 2007
2 Carbon
26 References
Bellamy PH Loveland PJ Bradley RI Lark RM Kirk GJD 2005 Carbon losses from all soils
across England and Wales 1978-2003 Nature 437 245-248
Carey PD Wallis S Chamberlain PM Cooper A Emmett BA Maskell LC McCann T Murphy J
Norton LR Reynolds B Scott WA Simpson IC Smart SM Ullyett JM 2008 Countryside Survey
UK Results from 2007 NERCCentre for Ecology amp Hydrology 105pp (CEH Project Number C03259)
De Vries W Reinds GJ Gundersen P Sterba H 2006 The impact of nitrogen deposition on carbon
sequestration in European forests and forest soils Global Change Biology 12 1151-1173
Emmett BA Frogbrook ZL Chamberlain PM Griffiths R Pickup R Poskitt J Reynolds B Rowe
E Spurgeon D Rowland P Wilson J and Wood CM 2008 CS Technical Report No 307 Soils
Manual NERCCentre for Ecology amp Hydrology 180 pp (CEH Project Number C03259)
Goidts E van Wesemael B 2007 Regional assessment of soil organic carbon changes under agriculture in
Southern Belgium (1955-2005) Geoderma 141 341-354
Jackson DL 2000 Guidance on the interpretation of the Biodiversity Broad Habitat Classification (terrestrial
and freshwater types) Definitions and the relationship with other classifications JNCC Peterborough UK
Kibblewhite MG Jones RJA Baritz R Huber S Arrouays D Micheli E Stephens M 2008
ENVASSO Final Report Part I Scientific and Technical Activ ities ENVASSO Project (Contract 022713)
coordinated by Cranfield University UK for Scientific Support to Policy European Commission 6th
Framework Research Programme
Kirby KJ Smart SM Black HIJ Bunce RGH Corney PM Smithers RJ 2005 Long term
ecological change in British woodlands (1971-2001) English Nature Peterborough UK
Liski J Perruchoud D Karjalainen T 2002 Increasing carbon stocks in the forest soils of western Europe
Forest Ecology and Management 169 159-175
Morvan X Saby NPA Arrouays D Le Bas C Jones RJA Verheijen FGA Bellamy PH
Stephens M Kibblewhite MG 2008 Soil monitoring in Europe A review of existing systems and
requirements for harmonisation Science of the Total Environment 391 1-12
Nabuurs G J Schelhaas M J Mohren G M J and Field C B 2003 Temporal evolution of the
European forest sector carbon sink from 1950 to 1999 Global Change Biol 9 152-160
Saby NPA Bellamy PH Morvan X Arrouays D Jones RJA Verheijen FGA Kibblewhite MG
Verdoodt A Berenyiuveges J Freudenschuss A Simota C 2008 Will European soil-monitoring networks
be able to detect changes in topsoil organic carbon content Global Change Biology 14 2432-2442
Schils R Kuikman P Liski J van Oijen M Smith P Webb J Alm J Somogyi Z van den Akker J
Billett M Emmett BA Evans C Lindner M Palosuo T Bellamy P Jandl R Hiederer R 2008
Review of existing information on the interrelations between soil and climate change European Commission
Brussels
Smith P Chapman SJ Scott WA Black HIJ Wattenbach M Milne R Campbell CD Lilly A
Ostle N Levy PE Lumsdon DG Millard P Towers W Zaehle S amp Smith JU (2007) Climate
change cannot be entirely responsible for soil carbon loss observed in England and Wales 1978 -2003
Global Change Biology 13 2605-2609
46
Countryside Survey Soils Report from 2007
2 Carbon
Stevens Avan Wesemael B 2008 Soil organic carbon dynamics at the regional scale as influenced by
land use history a case study in forest soils from southern Belgium Soil Use and Management 24 69-79
Stoate C Boatman ND Borralho RJ Carvalho CR de Snoo GR Eden P 2001 Ecological impacts
of arable intensification in Europe Journal of Environmental Management 63 337-365
47
Countryside Survey Soils Report from 2007
3 Soil pH
Summary
The mean pH of soils (0-15cm) increased in less acidic soils across Great Britain (GB) between
1998 and 2007 continuing a trend observed between 1978 and 1998 These soils are associated with
Broadleaved Woodland Arable and Horticulture Improved Grassland and Neutral Grassland Broad
Habitats This increase in pH is consistent with the expected b enefit of continued reductions in
sulphur emissions
There was no significant change in mean soil (0-15 cm) pH in more acidic organic-rich soils across
Great Britain between 1998 and 2007 This will affect Broad Habitats such as Bog Dwarf Shrub
Heath and Acid Grassland Data analysis is ongoing to determine if the lower sulphur reductions in
the north and west of the Great Britain or other drivers of change such as nitrogen deposition and
land management are responsible in the organic soils where pH did not significantly increase
between 1998 and 2007 Conversion between land uses between surveys was not responsible as
similar trends were observed in soils with or without conversion
One exception with no apparent trends between any time period was Coniferous Woodland It is
possible the acidification of soils associated with intensive forestry due to base cation uptake and
enhanced capture of acidic pollutants by the tree canopy may be offsetting the effects of reduced
sulphur emissions
The results for individual countries broadly reflected those for Great Britain as a whole with
continued increase in soil pH only observed in less acidic soils Insufficient sample size for some
habitat types with lower area in individual countries prevented significant trends being identified in
some cases
The implications of these findings are that current emission control policies combined with current
policies to protect soil through sustainable land management practices have had some major
benefits but they may not be sufficient to promote continued recovery from acidification i n organic-
rich soils
31 Policy background
Key question Has the recovery from acidification detected by Countryside Survey between 1978 and 1998
continued
Measurements The pH of soils (0-15 cm) from all plots sampled in 1978 and 1998 and all additional plots
sampled in 2007
Soil pH is probably the most commonly measured soil chemical parameter It gives an indication of soil
acidity and therefore has direct policy relevance in a number of areas primarily recovery from acidification
and impacts on biodiversity Soil pH is a key variable for predicting the mobility and bioavailability of metals
in soils and helps determine the response of plant species to changes in atmospheric nitrogen and acid
deposition It is currently estimated that 58 of ter restrial semi-natural habitats across GB receive acidic
deposition in excess of their buffering capacity thus potentially causing long term damage according to the
critical load methodology (RoTAP 2010)
The soil pH data from the Countryside Survey in 1998 provided unique nationwide evidence of soil pH change
(0-15 cm) since the first measurements in 1978 Preliminary data were incorporated within the report of the
National Expert Group on Transboundary Air Pollution (NEGTAP 2001) as providing evidence of a possible
48
Countryside Survey Soils Report from 2007
3 Soil pH
response to the reduction in acid deposition over the twenty year period between the two surveys The MASQ
report (Monitoring and Assessing of Soil Quality Black et al 2000) provided a more complete analysis of the
Countryside Survey soils data and confirmed an increase in soil pH (0-15 cm) between 1978 and 2000 in all
but Coniferous Woodlands Broad Habitat irrespective of whether the data were analysed by Environmental
Zone Broad Habitat ITE Land Class Aggregate Vegetation Class (AVC) or major soil group More
importantly the vegetation survey indicated a change in vegetation structure towards more nitrophilous less
acid tolerant species from 1990 to 1998 (Haines-Young et al 2000) providing corroboration for the soil data
and an excellent example of the power of the Countryside Survey approach in combining co-located
synchronous data collection of a wide range of variables A new review of changes in soil pH is due to be
published later in 2010 Review of Transboundary Air Pollution (RoTAP) and current indications are that
trends identified by CS are mirrored in other surveys (RoTAP 2010)
The rationale for including measurement of soil pH at 0-15 cm depth in the survey in 2007 is summarised in
Table 31 Measurement of soil (0-15 cm) pH will deliver
An extended time series of soil pH from 1978
Increased reporting power for individual countries (especially Wales) by making measurements in all
squares sampled during Countryside Survey in 2007 (591)
An assessment as to whether the decrease in soil acidity across all major soil groups and the majority of
Broad Habitats observed between 1978 and 1998 has continued
Improved prediction of plant species composition change using linked biogeochemical plant species
models
49
Countryside Survey Soils Report from 2007
3 Soil pH
Table 31 Rationale for measurement of soil (0-15 cm) pH
Issue Facts Comments
History in Countryside Survey
Measured on soils collected from Main Plots in the original 256 squares which formed the ldquoITE Ecological Survey of the UKrdquo Countryside Survey in 1998 re-measured pH from the same 256 squares
256 squares essential to maintain time series data 591 squares will provide better spatial information Soil pH is a critical interpretative variable
Country level reporting Power analysis has indicated only 256 squares are needed to quantify pH change at country level based on change between 1978 and 1998
It is unlikely that the pH change between Countryside Survey in 1998 and Countryside Survey in 2007 will be as great or consistent as between 1978 and Countryside Survey in 1998 The time period is shorter and the deposition change has been less Soil pH is a critical parameter for interpretation of plant species change (Ellenberg pH) bioavailability of P N and metals Recommendation is therefore for soil pH (0-15 cm) to be measured in all 591 squares
Links and compatibility to other monitoring programmes
Comparable data to those collected in the National Soil Inventory (NSI) Representative Soil Sampling Scheme (RSSS) for same horizon (0-15cm) Environmental Change Network (ECN) provides more information to depth and more frequent monitoring of soil solution but from few sites
Countryside Survey will provide data for three time points There were partial resurveys of the NSI in 19945 19956 and 2003 RSSS have data reported to 2001 Soil pH was measured at many ECN sites in 1993 1998 and 2003 Countryside Survey in 2007 will provide the only update for spatially extensive data on soil pH (0-15 cm) in Great Britain A comparison of these surveys was reported in Defra project SP0515 (Defra 2003)
Uniqueness of Countryside Survey
Time series is unique The integrated approach enabling links to vegetation management and water quality change is unique
Value for money (Policy priority or interpretative value x cost)
Very high High policy and interpretative value low cost
50
Countryside Survey Soils Report from 2007
3 Soil pH
32 Methods
321 Proof of concept
The measurement of soil pH in a suspension of de-ionised water is a very well established technique and was
used in both 1978 and for Countryside Survey in 1998 However measurements of pH in water are subject to
a number of uncertainties some of which are fundamentally related to the effects of changes in the ionic
strength of the soil-water suspension on ions sorbed to the soil particles One of the main consequences of
this is the so called dilution effect whereby different pH values are measured depending on the soilwater
ratio in the suspension A solution of 001M Calcium Chloride (CaCl2) has approximately the same ionic
strength as the soil solution in fertilised temperate soils and has been recommended as a more appropriate
medium for soil pH measurement (Schofield and Taylor 1955) Measurement of pH in CaCl2 yields more
consistent results the pH value in CaCl2 is lower than measured in water but closer to the value observed
under equilibrium conditions using repeated extractions (White 1969) The relationship between soil pH
measured in water and CaCl2 is not consistent For example over a wide pH range in lowland grassland soils
(Fig 31) soil pH in CaCl2 was approximately 08 pH units lower than the corresponding measurements in
deionised water There was also considerable scatter in the relationship particularly for more acid soils
In the 1978 Ecological Survey soil pH in water was measured at ITE Bangor using a modified version of the
method used by the Soil Survey of England and Wales (Avery and Bascomb 1974) In 1998 soil pH was
measured at CEH Merlewood using the protocol described in Allen et al (1989) The latter resulted in a
suspension with a soil to water ratio of approximately 12 by weight compared to the 1978 analyses with a
soil to water ratio of 125 by weight It is unlikely that this small difference in ratio result ed in a significant
difference in pH between the two methods As soil pH in CaCl2 was to be measured in 2007 in addition to pH
in water the original method used in 1978 was chosen Soil pH in CaCl2 can easily be measured using the
1978 method by adding a few millilitres of concentrated CaCl2 solution to the water pH suspension This
saves the time required to re-weigh and mix a second sample and conserves valuable soil for other analyses
The comparability of the 1978 and 1998 methods was checked prior to the survey in 1998 using archive soils
taken in 1971 from woodland habitats across Great Britain (Black et al 2000) The method used in 1971 was
the same as that used in 1978 and the re-analysis on dried archived soils used the 1998 method No
statistically significant differences were found between pH values measured on dried archive soils from 1971
using the 1998 method and the original data obtained from field moist soils in 1971
Figure 31 Soil pH (0-15 cm) measured in deionised water and 001M CaCl2 for a range of lowland
grassland soils (unpublished data CEH Bangor and CCW)
y = 101x - 080
R2 = 0953
3
4
5
6
7
8
9
3 4 5 6 7 8
Soil pH in water
So
il p
H i
n C
aC
l 2
11 line
51
Countryside Survey Soils Report from 2007
3 Soil pH
322 Laboratory analysis
Samples for soil pH measurement were collected using the 15 cm long by 5 cm diameter black plastic core
following the field protocol described in the Soils Manual (Emmett et al 2008)
The pH of fresh soil in water was measured using 10 g of field -moist soil in a 50 ml plastic beaker to which 25
ml of deionised water was added giving a ratio of soil to water of 125 by weight The suspension was stirred
thoroughly and left to stand for 30 minutes after which time the pH electrode was inserted into the
suspension and a reading taken after a further 30 seconds Following the measurement of soil pH in water 2
ml of 0125M CaCl2 were added to the suspension which on dilution with the 25 ml of water resulted in a
solution concentration of approximately 001M CaCl 2 The suspension was stirred thoroughly and left for 10
minutes after which time the pH electrode was inserted into the suspension and a reading taken after a
further 30 seconds Measurements of soil pH in water and CaCl 2 were repeated on all samples using 10 g of
air dried lt 2mm sieved soil
The fresh soil pH measurements were made as soon as possible after the sample was opened Care was
taken to ensure that the temperature of the buffer solutions used to calibrate the pH meter differed by no
more than 1degC from the temperature of the soil suspensions The pH electrode was carefully rinsed and dried
between each measurement Particular care was taken to clean the electrode following calibration with buffer
solutions
323 Quality Assurance and Quality Control
The DefraNERCBBSRC Joint Codes of Practice were followed
Method comparability Soil pH measurements in deionised water were made on a subset of
approximately 200 soils taken from the 1998 soil sample archive to check the comparability of the method
used in 2007 with that used in 1998
Figure 32 Results of repeat soil pH measurements on archived air dried soil samples collected in
1998
A plot of the repeated measurements from 1998 survey (Fig 32) shows close agreement between the two
datasets with no discernible bias and points clustering along the 11 line From these data it was concluded
that the difference between the methods used in 1998 and 2007 1978 would not bias the pH time series
data However it was noted that in 1978 soil pH was reported to 005 pH units whereas in 1998 and 2007
data were reported to 001 pH units
y = 103x - 023
R2 = 0955
2
4
6
8
10
2 4 6 8 10
Dry soil pH in 1998
Re
peat
dry
so
il p
H in
2007
1 1 line
52
Countryside Survey Soils Report from 2007
3 Soil pH
Analytical Quality Control The calibration of the pH meter was checked after a batch of 25 samples
using pH 4 and pH 7 buffer solutions If either of the buffer solution calibration values differed by more than
002 pH units from the expected value the meter was re-calibrated A standard soil a certified reference soil
and a duplicate analysis was performed on every batch of 25 samples (Fig 33) Soil pH in water and CaCl2
was reported to 001 pH units
Figure 33 Results for batch repeats of pH measurements in a) water and b) CaCl 2
324 Reporting
Soil pH data (0-15 cm) have been analysed to provide information on the state of soil acidity in 2007 and the
change in soil acidity since 1978 The statistical approach used for analysing the data for change involved
bootstrapping which allows for non-normality in the data without the necessity of knowing de tails of the actual
distribution As such it provides a more accurate measurement of significance Annex F of Emmett et al
(2008) provides a background document describing this approach
Prior to the 2007 survey a power analysis was undertaken of the sampling requirements to reliably detect
change in soil pH (0-15 cm) at the country level and details of the outcome are included in Emmett et al
(2008) The resulting increase in the number of squares for Countryside Survey in 2007 to 591 has enabled
reporting of soil pH by Broad Habitat at the Great Britain level (Carey et al 2008) and at the level of the
individual countries (Smart et al 2009 for Wales Norton et al 2009 for Scotland Countryside Survey 2009
for England)
The data in this report describe soil acidity in 2007 and change since 1978 by Broad Habitat Aggregate
Vegetation Class and Loss-on-Ignition (LOI) class In summary
Broad Habitat - The Broad Habitat classification consists of 27 habitats which account for the entire
land surface of Great Britain and the surrounding sea Countryside Survey reports on soils for 10
major terrestrial habitats
Aggregate Vegetation Class (AVC) ndash is a high level grouping of vegetation types produced from a
quantitative hierarchical classification of the different plant species found in the original Countryside
Survey sample plots Loss on ignition (LOI) category ndash soil type based on soil organic matter content defined as minera l (0-
8 LOI 0-44 g C kg-1
) humus-mineral (8 ndash 30 LOI 44-165 g C kg-1
) organo-mineral (30 ndash 60
LOI 165-330 g C kg-1
) and organic (60 ndash 100 gt 330 g C kg-1
)
y = 102x - 012
R2 = 0969
3
4
5
6
7
8
9
3 4 5 6 7 8 9
Sample pH
Re
peat
sam
ple
pH
1 1 line
a) pH in water
y = 102x - 008
R2 = 0976
2
3
4
5
6
7
8
9
2 3 4 5 6 7 8 9
Sample pH
Re
peat
sam
ple
pH
1 1 line
b) pH in CaCl2
53
Countryside Survey Soils Report from 2007
3 Soil pH
The soil pH data were mapped using kriging to interpolate between the Countryside Survey sample points
Routine checking of data for outliers was conducted and the working dataset was transformed using a normal
score procedure to obtain a Gaussian distribution The data were then interpolated on a 1km UK grid using
ordinary kriging and finally the kriged data were back-transformed to produce an interpolated map of soil pH Prior to the 2007 survey data were too sparse to give meaningful and statistically valid interpolation in space and thus no maps of change are presented This will be poss ible in future surveys due to the enhanced baseline
33 Results
331 Structure of the soil pH data
The measured soil pH (0-15 cm) across the three surveys ranged between pH 320 and pH 915 The
distributions of pH values changed with each survey revea ling a progressive reduction in the frequency of
acid values (pHlt5) and an increase in the frequency of values in the range pH 58 to 62 The frequency of
values gt pH 8 also increased across the surveys (Fig 34)
Figure 34 Histograms showing distribution of soil pH (0-15 cm) measurements for a) 1978 b) 1998 c)
2007 and d) cumulative frequency Histogram frequencies normalised to percentage of total number of
samples analysed in each survey
a) 1978
00
20
40
60
80
100
33
64
24
85
4 66
67
27
88
4 9
Soil (0-15 cm) pH
No
o
f o
bserv
ati
on
s (
)
b) 1998
00
20
40
60
80
33
64
24
85
4 66
67
27
88
4 9
Soil (0-15 cm) pH
No
o
f o
bserv
ati
on
s (
)
c) 2007
00
20
40
60
80
33
64
24
85
4 66
67
27
88
4 9
Soil (0-15 cm) pH
No
o
f o
bserv
ati
on
s (
)
d)
00
02
04
06
08
10
3 5 7 9
Soil (0-15 cm) pH
Cu
mu
lati
ve
freq
uen
cy (
)
1978 1998 2007
54
Countryside Survey Soils Report from 2007
3 Soil pH
Approximately 42 of plots were sampled only once in the three surveys (Table 32) reflecting the large
increase in the number of plots in sampled 2007 For plots with repeat measurements an increase of 02 pH
units or more was recorded for an average 66 of plots 11 of plots s howed no change and 22 showed a
decrease in pH of 02 pH units or more (Table 33) This reflects the range of variability always seen in large
scale surveys such as CS Statistical significance in the categories of interest however are the critical issue
Table 32 Number of plots recording a measurement of soil pH (0-15 cm) in each Countryside Survey
Table 33 Percentage of samples from repeat plots in each Countryside Survey showing a decrease in
pH of 02 units or more (ΔpH-ve) no change in pH (ΔpH 0) or an increase in pH of 02 units or more
(ΔpH +ve)
332 Change in mean soil pH (0-15 cm) across Great Britain
The state and change in soil pH across Great Britain over the three Countryside Surveys is summarised in
Table 34 Soils beneath Broad Habitats in Great Britain covered a wide range of pH the most acid soils
comprised those beneath Coniferous Woodland Bog and Dwarf Shrub Heath Broad Habitats where mean pH
in 2007 was asymp 45 whilst the least acid soils (0-15 cm) were those in the enclosed farmland Broad Habitats
with mean pH values ranging between 63 and 72 in 2007
With the exception of Coniferous Woodlands mean soil pH (0-15 cm) increased significantly in all Broad
Habitats over the 29 years from the first survey in 1978 Mean soil pH beneath Coniferous Woodland
remained unchanged over the 29 year period whilst beneath Bracken Broad Habitat the only significant
increase in mean pH was between 1978 and 2007 No significant increases in mean pH were observed
amongst the more acid (1978 mean pH lt 5) and organic -rich Broad Habitats between 1998 and 2007 In
contrast mean soil pH increased between each Countryside Survey in those Broad Habitats with a 1978
mean pH gt5
Analysis of the data in relation to AVC broad ly reflected the results by Broad Habitat In the less acid AVCs
(Fertile and Infertile Grassland and Crops and Weeds mean pH 2007 gt 6) there was a significant increase in
mean soil pH between all three surveys For those AVCs with a mean pH in 2007 of 5 or less there was no
significant change in mean soil pH between 1998 and 2007 but a significant increase was observed between
1978 and 1998 which largely accounted for the increase between 1978 and 2007 There were no significant
changes in mean soil pH in the Tall Grass and Herb AVC and in Lowland Woodlands the only significant soil
pH increase occurred between 1978 and 2007
ΔpH -veΔ p H 0
Δ p H + v e
1978-1998 27 9 64
1998-2007 23 14 63
1978-2007 19 9 72
Mean 23 11 66
No of sites
1978 1998 2007
1978 only 274 274
1998 only 160 160
2007 only 1719 1719
1978 amp1998 only 111 111 222
1998 amp 2007 only 173 173 346
1978 amp 2007 only 179 179 358
1978 amp 1998 amp 2007 688 688 688 2064
Total number of plots 1252 1132 2759 5143
Total number of
samples
Survey years
55
Countryside Survey Soils Report from 2007
3 Soil pH
Table 34 Changes in mean soil pH (0-15 cm) across Great Britain for a) Broad Habitats b) Aggregate
Vegetation Classes (AVC) c) AVCs unchanged since 1978 and d) LOI categories Arrows denote a
significant change (plt005) in the direction shown Diagonal line indicates too few samples to provide
reliable value
a) Great Britain - Broad Habitat
Broad Habitat 1978 1998 2007 1978-1998 1998-2007 1978-2007
Broadleaved Mixed and Yew Woodland 509 547 575
Coniferous Woodland 432 439 450
Arable and Horticulture 659 681 720
Improved Grassland 579 606 627
Neutral Grassland 552 599 614
Acid Grassland 444 472 478
Bracken 414 447 464
Dwarf Shrub Heath 419 450 455
Fen Marsh and Swamp 464 535 545
Bog 429 449 451
All habitat types 539 567 587
Mean pH Direction of significant changes
Aggregate Vegetation Class 1978 1998 2007 1978-1998 1998-2007 1978-2007
All Woodland 452 487 501
Upland Woodland 417 453 459
Lowland Woodland 506 531 566
Fertile Grassland 605 623 645
Infertile Grassland 549 586 610
Moorland Grass Mosaic 440 477 477
Heath and Bog 426 442 444
Tall Grass and Herb 645 685 689
Crops and Weeds 657 679 725
b) Great Britain - AVC whole dataset
Mean pH Direction of significant changes
Aggregate Vegetation Class 1978 1998 2007 1978-1998 1998-2007 1978-2007
All Woodlands 421 454 482
Upland Woodland
Lowland Woodland
Fertile Grassland 600 608 643
Infertile Grassland 549 581 619
Moorland Grass Mosaic 439 476 478
Heath and Bog 435 457 457
Tall Grass and Herb
Crops and Weeds 701 694 738
Mean pH Direction of significant changes
c) Great Britain - AVC unchanged
56
Countryside Survey Soils Report from 2007
3 Soil pH
In order to remove the effects of vegetation land use change statistical analysis was performed on a subset
of the plots which had been sampled in all three Surveys and for which the AVC had remained unchanged
over time AVC is only recorded at the time of each Countryside Survey so change in the intervening years
cannot be ruled out but the plots for which AVC has not changed will have a vegetation composition that has
remained largely consistent in 1978 1998 and 2007
Restricting the analysis to plots where AVC has remained unchanged since 1978 resulted in three Classes
having insufficient data for analysis (Upland and Lowland Woodland and Tall Grass and Herb) Amongst the
remaining unchanged AVCs the only differences in the results were for Fertile Grass land and Crops and
Weeds where the significant increase in mean soil pH between 1978 and 1998 was lost For Fertile
Grassland the mean soil pH values recorded for the whole dataset and for the AVC unchanged data were
very similar suggesting that significance was lost due to a reduction in the number of samples In contrast
for Crops and Weeds the 1978 mean values differ by 044 units between the two datasets suggesting that
restricting the analysis to unchanged plots has eliminated some that were either mis-classified in 1978 or
were responding to changes in landuse vegetation prior to 1978
In all three surveys the most acid soils corresponded to those with the highest organic matter content (Table
34) reflecting the broad inverse relationship between soil pH and LOI (Fig 35) The lower boundary pH
values to this relationship decreased approximately linearly from pH 4 to pH 34 across the full range of LOI
values The upper boundary value decreased more steeply from pH 915 at less than 1 LOI to pH 496 at
96 LOI Mineral soils therefore had a much wider pH range (eg pH 394 to 86 at 4 LOI) compared with
organic soils (eg pH 35 to 51 at 95 LOI) Due to the logarithmic pH scale the range in hydrogen ion
concentrations was actually greater in organic soils (equivalent to 771 μEq kg at 95 LOI) compared to
mineral soils (equivalent to 287 μEq kg at 4 LOI)
Mean soil pH increased significantly across all three Countryside Surveys in mineral soils with an LOI less
than 30 (Table 34) There was no significant change in mean soil pH for organo-mineral and organic soils
between 1998 and 2007 although there was a significant increase in mean pH between 1978 and 1998 which
largely accounted for the significant increase between 1978 and 2007 (Fig 36)
d) Great Britain - Loss on ignition category
LOI category () 1978 1998 2007 1978-1998 1998-2007 1978-2007
Mineral (0-8) 619 643 674
Humus-mineral (8-30) 530 567 590
Organo-mineral (30-60) 458 495 496
Organic (60-100) 425 445 444
Mean pH Direction of significant changes
57
Countryside Survey Soils Report from 2007
3 Soil pH
Figure 35 The relationship between soil pH (0-15 cm) and Loss on Ignition in 2007
Figure 36 The change in the mean pH of soils (0-15 cm) for mineral soils (0-8 LOI) and organic soils
(60-100 LOI) between 1978 and 2007 Significant changes ( plt0001) are show between the dates
bracketed 95 CI are shown for each data point
333 Change in mean soil pH (0-15 cm) across England
Mean soil pH (0-15 cm) values in the All Broad Habitats category for England were approximately 05 pH
units higher compared to Great Britain as a whole (Fig 37) with significant increases observed between
each survey and over the 29 year period since 1978 (Table 35 and Fig 38)
2
3
4
5
6
7
8
9
10
0 10 20 30 40 50 60 70 80 90 100
LOI ()
pH
300
400
500
600
700
800
1973 1978 1983 1988 1993 1998 2003 2008
pH
LOI category 0-8 LOI category 60-100
58
Countryside Survey Soils Report from 2007
3 Soil pH
Figure 37 Differences between England and Great Britain in mean soil pH (0-15 cm) for all Broad
Habitats
Soils beneath enclosed farmland Broad Habitats were the least acid in England with mean pH values gt 65 in
2007 and significant increases in mean soil pH between each survey Mean soil pH (0 -15 cm) in English
enclosed farmland was asymp 025 pH units higher than for Great Britain as a whole (Fig 37) In contrast to
Great Britain Bog soils were the most acid in England (2007 mean pH 401) and no significant changes in
mean pH were recorded across the 29 year period of Countryside Survey Apart from Bog Fen Marsh and
Swamp and Coniferous Woodland all other Broad Habitats showed a significant increase in mean soil pH
between 1978 and 2007 In contrast to Great Britain as whole mean soil pH in Bracken and Dwarf Shrub
Heath Broad Habitats increased significantly between 1998 and 2007 but not between 1978 and 1998 the
mean pH of Acid Grassland soils increased significantly between all three surveys
With the exception of Heath and Bog AVC where no significant changes were observed a nd Crops and
Weeds where there were too few samples for statistical analysis the mean soil pH (0 -15 cm) increased
significantly in all AVCs between 1978 and 2007 in England (Table 35) This broadly reflects the results for
analysis by Broad Habitat except that soil pH increased significantly in the Upland Woodland AVC but not in
Coniferous Forest Broad Habitat possibly due to the inclusion of some broadleaf woodland within the Upland
Woodland AVC and exclusion of lowland coniferous woodland Mean soil pH increased significantly between
1998 and 2007 in Moorland Grass Mosaic in England in contrast to Great Britain where no significant change
was recorded over this period Restricting statistical analysis to unchanged AVCs eliminated several classes
due to small sample numbers Significance was lost for the change in mean soil pH between 1978 and 1998
for Infertile Grassland and Crops and Weeds This may be due to a reduction in sample numbers but for
Crops and Weeds the mean soil pH for the unchanged dataset (pH 709) was approximately 03 pH units
higher than for the whole dataset Restricting the analysis to unchanged plots may have eliminated some
plots that were either mis-classified in 1978 or responding to changes in landuse vegetation prior to 19 78
For England the most organic-rich (60-100 LOI category Table 35) soils were not represented in
sufficient numbers for statistical analysis Mean soil pH (0 -15 cm) was highest in the mineral category (2007
pH 702) and lowest in the organo-mineral soils (2007 pH 502) Mean soil pH increased significantly between
each Survey and across the 29 years since 1978 in soils with less than 30 LOI For organo-mineral soils
(30-60 LOI) mean soil pH increased significantly between 1978 and 1998 which large ly accounted for the
significant increase between 1978 and 2007 These results were consistent with those for Great Britain as a
whole
-060
-040
-020
000
020
040
060
080B
roa
dle
ave
d
Mix
ed
an
d
Ye
wC
on
ife
rou
s
Wo
od
lan
d
Ara
ble
an
d
Ho
rtic
ultu
re
Imp
rove
d
Gra
ssla
nd
Ne
utr
al
Gra
ssla
nd
Acid
Gra
ssla
nd
Bra
cke
n
Dw
arf
Sh
rub
He
ath
Fe
n M
ars
h
an
d S
wa
mp
Bo
g
All
ha
bita
t
typ
es
Dif
fere
nc
e in
me
an
pH
59
Countryside Survey Soils Report from 2007
3 Soil pH
Figure 38 The change in the mean pH of soils (0-15 cm) for across all Broad Habitats in England and
Great Britain between 1978 and 2007 Significant changes ( plt0001) are show between the dates
bracketed 95 CI are shown for each data point
Table 35 Changes in mean soil pH (0-15 cm) across England for a) Broad Habitats b) Aggregate
Vegetation Classes (AVC) c) AVCs unchanged since 1978 and d) LOI categories Arrows denote a
significant change (plt005) in the direction shown Diagonal line indicates too few samples to provide
reliable value
a) England - Broad Habitat
Broad Habitat 1978 1998 2007 1978-1998 1998-2007 1978-2007
Broadleaved Mixed and Yew Woodland 523 583 607
Coniferous Woodland 431 413 444
Arable and Horticulture 671 702 743
Improved Grassland 614 629 658
Neutral Grassland 572 618 641
Acid Grassland 404 451 474
Bracken 411 408 489
Dwarf Shrub Heath 400 412 440
Fen Marsh and Swamp 515 583 548
Bog 409 409 401
All habitat types 589 619 651
Mean pH Direction of significant changes
300
400
500
600
700
800
1973 1978 1983 1988 1993 1998 2003 2008
pH
England Great Britain
60
Countryside Survey Soils Report from 2007
3 Soil pH
d) England - Loss on ignition category
LOI category () 1978 1998 2007 1978-1998 1998-2007 1978-2007
Mineral (0-8) 640 670 702
Humus-mineral (8-30) 573 601 640
Organo-mineral (30-60) 449 504 502
Organic (60-100)
Mean pH Direction of significant changes
334 Change in mean soil pH (0-15 cm) across Scotland
There was a significant increase in mean soil pH in the All Broad Habitats category for Scotland from 1998 to
2007 (Table 36) Earlier increases in pH between 1978 and 1998 and overall from 1978 to 2007 were also
significant (Table 35) Overall mean soil pH was more acid in Scotland compared to Great Britain as a
whole most notably for the enclosed farmland Broad Habitats and for Broadleaved Woodland and Neutral
Grassland (Fig 39)
b) England - AVC whole dataset
Aggregate Vegetation Class 1978 1998 2007 1978-1998 1998-2007 1978-2007
Upland Woodland 401 434 457
Lowland woodland 518 539 572
Fertile grassland 624 640 672
Infertile grassland 575 610 630
Moorland grass mosaics 405 438 465
Heath and Bog 398 416 424
Tall grass and Herb 700 706
Crops and weeds 672 703 750
Mean pH Direction of significant changes
Aggregate Vegetation Class 1978 1998 2007 1978-1998 1998-2007 1978-2007
Upland Woodland
Lowland woodland
Fertile grassland 619 628 666
Infertile grassland 582 609 637
Moorland grass mosaic
Heath and Bog
Tall grass and Herb
Crops and weeds 709 705 753
Mean pH Direction of significant changes
c) England - AVC unchanged
61
Countryside Survey Soils Report from 2007
3 Soil pH
Figure 39 Differences between Scotland and Great Britain in mean soil pH (0-15 cm) for all Broad
Habitats
Soils beneath the Arable Broad Habitat were the least acidic in Scotlan d (2007 mean pH 628) and this was
the only Broad Habitat to record a significant increase in mean soil pH between 1998 (pH 598) and 2007 (pH
628) Mean soil pH in the Arable Broad Habitat did not increase significantly between 1978 and 1998 or
across the entire period from 1978 to 2007
There was no significant change in mean soil pH beneath woodland Broad Habitats in Scotland between
1998 and 2007 or between 1978 and 1998 or between 1978 and 2007 There was a significant increase in
soil pH between 1978 and 1998 for Improved Grassland Neutral Grassland Dwarf Shrub Heath Fen Marsh
and Swamp and Bog Broad Habitats which largely accounted for the significant increase in mean soil pH over
the entire period from 1978 to 2007 in these Broad Habitats Mean soil pH beneath Acid Grassland increased
significanly between 1978 (pH 461) and 2007 (pH 482) but not between 1978 and 1998 or between 1998
and 2007 Bracken was the most acidic Broad Habitat in Scotland in 2007 (mean pH 451) but there were no
significant changes in mean soil pH between any of the Surveys or over the 29 year period from 1978
Infertile Grassland and Crops and Weeds were the only AVCs in Scotland to record a significant increase in
mean soil pH between 1997 and 2007 For Infertile Grassland this continued the trend of significant mean
soil pH increase between 1978 and 1998 and across the entire period from 1978 to 2007 No other significant
changes in mean soil pH were observed for Crops and Weeds There was a significant increase in mean soil
pH for Moorland Mosaics and Heath and Bog between 1978 and 1998 which largely accounted for the
significant increases between 1978 and 2007 For Upland Woodland there was a significant increase in mean
soil pH between 1978 and 2007 but no other significant changes were observed
Restricting the statistical analysis to unchanged AVCs eliminated all but three classes due to small sample
numbers The only difference in the results for the remaining AVCs was the loss of significance for the
increase in mean soil pH in Infertile Grassland between 1978 and 1998 The mean pH values for 1978 and
1998 and the differences between 1978 and 1998 are similar for the unchanged and the whole Infertile
Grassland dataset indicating that a reduction in sample numbers may have caused the loss of significance
-100
-080
-060
-040
-020
000
020B
roadle
aved
Mix
ed a
nd
Yew
Co
nifero
us
Woodla
nd
Ara
ble
and
Ho
rtic
ulture
Impro
ved
Gra
ssla
nd
Ne
utr
al
Gra
ssla
nd
Acid
Gra
ssla
nd
Bra
cken
Dw
arf
Shru
b
He
ath
Fen M
ars
h
and S
wam
p
Bog
All
habitat
types
Dif
fere
nce in
mean
pH
62
Countryside Survey Soils Report from 2007
3 Soil pH
Table 36 Changes in mean soil pH (0-15 cm) across Scotland for a) Broad Habitats b) Aggregate
Vegetation Classes (AVC) c) AVCs unchanged since 1978 and d) LOI categories Arrows denote a
significant change (plt005) in the direction shown Diagonal line indicates too few samples to provide
reliable value
a) Scotland - Broad Habitat
Broad Habitat 1978 1998 2007 1978-1998 1998-2007 1978-2007
Broadleaved Mixed and Yew Woodland 500 485 526
Coniferous Woodland 442 452 461
Arable and Horticulture 614 598 628
Improved Grassland 544 584 595
Neutral Grassland 531 571 572
Acid Grassland 461 483 482
Bracken 442 481 451
Dwarf Shrub Heath 431 463 466
Fen Marsh and Swamp 459 524 531
Bog 434 453 459
All habitat types 481 502 509
Mean pH Direction of significant changes
b) Scotland - AVC whole dataset
Aggregate Vegetation Class 1978 1998 2007 1978-1998 1998-2007 1978-2007
Upland Woodland 432 464 470
Lowland woodland
Fertile grassland 575 594 608
Infertile grassland 535 567 589
Moorland grass mosaics 451 490 487
Heath and Bog 434 450 453
Tall grass and Herb
Crops and weeds 607 578 616
Mean pH Direction of significant changes
Aggregate Vegetation Class 1978 1998 2007 1978-1998 1998-2007 1978-2007
Upland Woodland
Lowland woodland
Fertile grassland
Infertile grassland 525 554 593
Moorland grass mosaic 451 486 489
Heath and Bog 440 461 461
Tall grass and Herb
Crops and weeds
Mean pH Direction of significant changes
c) Scotland - AVC unchanged
63
Countryside Survey Soils Report from 2007
3 Soil pH
In 2007 the mean soil pH in mineral and humus-mineral soils in Scotland was approximately 05 pH units
lower compared to the equivalent soils across Great Britain as a whole (Tables 34 and 36) In contrast the
mean soil pH of the organic-rich soils (gt 30 LOI) was approximately the same in Scotland and across Great
Britain in 2007 For soils in all LOI categories there was a significant increase in mean pH between 1978 and
2007 but the patterns of change with respect to LOI category for other periods were much less consistent in
Scotland compared to Great Britain as a whole Mineral so ils were the only category to record a significant
increase in mean soil pH between 1998 and 2007 The mean pH of humus -mineral and organic soils
increased significantly between 1978 and 1998 which largely accounted for the increase in mean soil pH
between 1978 and 2007 For organo-mineral soils (30-60 LOI) there were no significant changes in mean
soil pH between 1978 and 1998 or between 1998 and 2007
335 Change in mean soil pH (0-15 cm) across Wales
The most acid soils in Wales in 2007 were those beneath Coniferous Woodland (pH 414) whilst soils
beneath enclosed farmland Broad Habitats were the least acid (Table 37) There were no significant
changes in mean soil pH for any of the Broad Habitats in Wales between 1998 and 2007 The mean pH of
soils beneath Broadleaved Woodland Improved Grassland and Neutral Grassland increased significantly
between 1978 and 1998 and this accounted for much of the significant increase in mean soil pH between
1978 and 2007 in these Broad Habitats For Coniferous Woodland Acid Grassland and Dwarf Shrub Heath
there were no significant changes in mean soil pH between any of the Surveys or across the entire period
between 1978 and 2007 Mean soil pH was more acid in Wales for all Broad Habitats relative to mean values
for Great Britain (Fig 310)
Figure 310 Differences between Wales and Great Britain in mean soil pH (0-15 cm) for all Broad
Habitats
-080
-070
-060
-050
-040
-030
-020
-010
000
Bro
ad
lea
ve
d
Mix
ed
an
d
Ye
wC
on
ife
rou
s
Wo
od
lan
d
Ara
ble
an
d
Ho
rtic
ultu
re
Imp
rove
d
Gra
ssla
nd
Ne
utr
al
Gra
ssla
nd
Acid
Gra
ssla
nd
Bra
cke
n
Dw
arf
Sh
rub
He
ath
Fe
n M
ars
h
an
d S
wa
mp
Bo
g
All
ha
bita
t
typ
es
Dif
fere
nc
e in
me
an
pH
d) Scotland - Loss on ignition category
LOI category () 1978 1998 2007 1978-1998 1998-2007 1978-2007
Mineral (0-8) 575 582 605
Humus-mineral (8-30) 496 535 545
Organo-mineral (30-60) 464 487 496
Organic (60-100) 430 451 450
Mean pH Direction of significant changes
64
Countryside Survey Soils Report from 2007
3 Soil pH
Infertile Grassland and Fertile Grassland were the only AVCs to have sufficient data to report st ate and
change for all three Countryside Surveys (Table 37) The mean pH of soils beneath Fertile Grassland did not
change significantly between any of the Surveys or across the period from 1978 to 2007 For Infertile
Grassland there was a significant increase in mean soil pH between 1998 and 2007 between 1978 and 1998
and across the entire period from 1978 to 2007 Restricting the statistical analysis to unchanged AVCs
eliminated all but Infertile Grassland which showed very similar results to the AVC d ataset as a whole It is
unlikely therefore that the changes observed in mean soil pH for Infertile Grassland in Wales resulted from a
change in land use or vegetation composition
There was no significant change in the mean soil pH of mineral or humus -mineral soils in Wales between
1998 and 2007 and there were too few data to report on state and change in mean soil pH for organo -mineral
and organic soils (Table 37) The mean pH of mineral soils (0-15 cm) did not change significantly between
any of the surveys or across the entire period from 1978 to 2007 There was a significant increase in the
mean pH of humus mineral soils (0-15 cm) between 1978 and 1998 and this largely accounted for the
significant increase in mean soil pH between 1978 and 2007
Table 37 Changes in mean soil pH (0-15 cm) across Wales for a) Broad Habitats b) Aggregate
Vegetation Classes (AVC) c) AVCs unchanged since 1978 and d) LOI categories Arrows denote a
significant change (plt005) in the direction shown Diagonal line indicates too few samples to provide
reliable value
a) Wales - Broad Habitat
Broad Habitat 1978 1998 2007 1978-1998 1998-2007 1978-2007
Broadleaved Mixed and Yew Woodland 453 524 540
Coniferous Woodland 373 422 414
Arable and Horticulture 500 648
Improved Grassland 536 574 594
Neutral Grassland 506 585 582
Acid Grassland 434 441 474
Bracken
Dwarf Shrub Heath 413 453 440
Fen Marsh and Swamp
Bog
All habitat types 500 543 556
Mean pH Direction of significant changes
b) Wales - AVC whole dataset
Aggregate Vegetation Class 1978 1998 2007 1978-1998 1998-2007 1978-2007
Upland Woodland 441
Lowland woodland
Fertile grassland 585 608 608
Infertile grassland 507 554 590
Moorland grass mosaics 464
Heath and Bog 429
Tall grass and Herb
Crops and weeds
Mean pH Direction of significant changes
65
Countryside Survey Soils Report from 2007
3 Soil pH
34 Discussion and Policy Implications
Soils (0-15 cm) in Great Britain and regionally within individual countries covered a wide range of pH in 2007
from a minimum of pH 32 to a maximum of pH 915 Organic soils were consistently the most acid whilst the
highest pH values were encountered in mineral soils which also showed the widest range in soil pH The
least acidic soils with a mean pH in excess of 6 were generally found in moderate to intensively managed
agricultural land such as Arable and Improved Grassland Broad Habitats and Fertile Grassland and Crops
and Weeds AVCs Acidic soils with a mean pH less than 5 were associated with Coniferous Woodland Acid
Grassland Dwarf Shrub Heath and Bog Broad Habitats and the Upland Woodland Moorland Grass Mosaic
and Heath and Bog AVCs These generally had organic -rich soils whereas managed agricultural land was
associated with soils with a low organic matter content (Chapter 2)
The mapped distribution of soil pH in 2007 (Fig 311) followed the anticipated pattern with lower pH soils in
the upland areas of Wales Pennines and much of Scotland The coefficient of variation (CV standard
deviation mean an indicator of the spread of the data around the mean value) was lowest in areas
dominated by either high pH soils which are intensively managed or low pH soils in upland areas where there
is little variation Conversely the signal to noise ratio (SN R mean standard deviation) indicated that for
values above 1 the signal was stronger than the noise High SNRs were observed across managed arable
areas in eastern England and agricultural land in southern central England This may occur because soil
management leads to greater uniformity of pH values across these areas High SNRs in the uplands reflect
the presence of acidic peaty and peaty mineral soils in Acid Grassland Dwarf Shrub Heath Bog and
Coniferous Woodland Broad Habitats For England and Wales the broad patterns in the soil pH data (Fig
311) correspond well to maps originating from the National Soil Inventory dataset (NSI McGrath and
Loveland 1992) and the Representative Soil Sampling Scheme (RSSS Baxter et al 2006) although the
latter are restricted to managed agricultural land
d) Wales - Loss on ignition category
LOI category () 1978 1998 2007 1978-1998 1998-2007 1978-2007
Mineral (0-8) 554 588 613
Humus-mineral (8-30) 487 547 555
Organo-mineral (30-60)
Organic (60-100)
Mean pH Direction of significant changes
Aggregate Vegetation Class 1978 1998 2007 1978-1998 1998-2007 1978-2007
Upland Woodland
Lowland woodland
Fertile grassland
Infertile grassland 505 550 609
Moorland grass mosaic
Heath and Bog
Tall grass and Herb
Crops and weeds
c) Wales - AVC unchanged
Mean pH Direction of significant changes
66
Countryside Survey Soils Report from 2007
3 Soil pH
Figure 311 Maps of soil (0-15 cm) pH in 2007 (a) using ordinary Kriging (pH units) (b) coefficient of variation
and (c) signal to noise ratio
Across Great Britain and regionally within the individual countries soils (0 -15 cm) showed evidence of
increasing pH (decreasing acidity) between 1978 and 2007 This is consistent with a response to a reduction
in acid deposition over the last 29 years (NEGTAP 2001 RoTAP 2010) For the more organic -rich soils and
their associated Broad Habitats and AVCs the significant increase in mean pH between 1978 and 2007 was
largely accounted for by the increase between 1978 and 1998 General ly there was no significant pH change
recorded between 1998 and 2007 for organic-rich soils (gt30 LOI) In contrast for mineral and humus-
mineral soils and associated Broad Habitats and AVCs significant increases in soil pH were often observed
between each Survey as well as across the entire period from 1978 to 2007 This was a consistent pattern for
plots with unchanged AVC classification in the different surveys indicating land use change was not
responsible for the trends observed However land managem ent within squares such as changes in rates of
lime and fertiliser applications or stocking densities may play an important role which is currently being
investigated
When comparing changes in pH between different soil types Broad Habitats or AVCs it must be remembered
that pH is a logarithmic scale An equal rate of recovery in terms of pH units would not be expected for a
low pH and a high pH soil Conversion of pH data to hydrogen ion concentrations reveals that annual rates of
change in hydrogen ion concentration for high pH low organic matter soils has been sustained across the 29
year period The large annual rate of change between 1978 and 1998 for more organic -rich low pH soils
slowed dramatically between 1998 and 2007 The different trends observed for mineral and organic soils
may indicate that the soil response to reducing mineral acid inputs from the atmosphere is influenced by soil
organic matter content possibly as a result of buffering by organic acids As the concentration of mineral
a)
)
b)
)
c)
)
67
Countryside Survey Soils Report from 2007
3 Soil pH
acids in the soil declines and soil solution pH rises organic acids will come into solution and de -protonate
providing a buffering mechanism to further pH change In addition organic -rich soils are broadly located in
the north and west of the British Is les where initial pollution levels were lowest and reductions in acid
deposition have been smaller than anticipated given the size of the emission reductions and less than in
regions such as central England which are closer to the main emission sources ( Fig 312 NEGTAP 2001
RoTAP 2010)
Figure 312 a) The regional grouping of sites in the UK precipitation chemistry network used in the statistical
analysis of trends B) Trends in SO2 over the last 20 years in the four groups of monitoring stations
a) b)
Identifying the relative influence of these factors is important to assessing the ldquosuccessrdquo of emission control
policy for acid deposition and will be the subject of further analysis Thus in semi -natural systems on the
more organic-rich soils the implications for biodiversity and metal mobilisation are not clear until further
analysis determines the cause of the lack of change in soil pH Current risk assessment tools using the
critical load methodology indicate the majority of these systems remain at risk from acidic deposition and
thus the lack of further increases in soil pH needs to be investigated closely (RoTAP 2010) One possibility
is the variability in initial acidic deposition inputs and subsequent tre nds (Fig 312)
The significant increase in mean soil pH between 1978 and 2007 observed for managed agricultural land will
be influenced by farming practice such as moves towards deeper cultivation bringing relatively unweathered
chalk parent material to the soil surface In England many areas of arable and arable ley or short term
grassland are located in areas close to emission sources and will have experienced relatively large
reductions in acid deposition loading especially from dry deposition of S O2 (NEGTAP 2001) compared to
areas further west where wet deposition dominates inputs
Group=4
Group=3
Group=2
Group=1
Years since 1986
25
30
0
10 5
10
20
15 0
15
-5
5
20
SO2 concentration (microgm-3)
68
Countryside Survey Soils Report from 2007
3 Soil pH
The influence of agricultural management is difficult to separate from external factors and the evidence from
other soil surveys is contradictory The RSSS (Skinner et al 1992) is exclusively focussed on soils under
agricultural management Re-analysis of the RSSS data (Oliver et al 2006) showed that the temporal
change in agricultural soil pH was small between 1971 and 2001 Spatial disaggregation of the RSSS dat a
indicated that soil pH declined in areas of permanent grassland such as the west of England and Wales
possibly because farmers did not maintain lime inputs following the loss of subsidy in 1976 (Skinner and
Todd 1998 Baxter et al 2006) The RSSS data also showed that soil pH had changed little over time in
arable and arable ley systems with the interpretation that arable farmers have maintained optimal pH levels
for crop production (Oliver et al 2006) Selective re-sampling of arable arable-ley and permanent
(managed) grassland sites of the National Soil Inventory showed an increase in soil pH of between 01 and
03 pH units between the early 1980s and 199596 (Defra 2003) The NSI data corroborate the results from
Countryside Survey for England and Wales between 1978 and 1998 mean pH values for equivalent land use
types are also similar Currently there are no other published national -scale datasets to provide evidence of
pH change in agricultural soils between 1998 and 2007
The soil pH data show an increase over time in the frequency of pH values in excess of pH 85 In 2007
approximately two thirds of the 54 plots with pH gt 85 were in the Arable Broad Habitat with values
approaching pH 9 in some plots Soil pH values in excess of 83 indicat e that calcium carbonate solubility is
no longer controlling soil pH and there is an influence from sodium salts accumulating in the soil Two of the
sample points with the highest pH values are very close to the coast and are mapped as Littoral Sediment o r
Supra-littoral Sediment Broad Habitats where sodium will be abundant Several sample sites are located in
the fens of East Anglia and again there may be abundant sodium in these soils The remaining sites are
further west in Oxfordshire and may be influenced by irrigation which can lead to sodium accumulation in the
soil
Across Great Britain and within individual countries Coniferous Woodland was consistently amongst the most
acidic of the Broad Habitats and showed no significant temporal changes in m ean soil pH Whilst sample
numbers were relatively low in England and Wales (c40) Broad Habitats with fewer samples have shown
significant pH increases and samples numbers in Scotland (125) and across Great Britain as a whole (207)
were easily sufficient to detect change The implication from Countryside Survey is that soils beneath
Coniferous Woodlands are either responding very slowly to changes in acid deposition or other factors such
as accumulation of acidic organic matter are controlling soil pH in these systems Large areas of conifer
forest are located at relatively high altitude in the north and west of Britain where annual rainfall is high wet
deposition enhanced by seeder-feeder effects dominates atmospheric inputs (Dore et al 1992) and forest
canopies are frequently enveloped in cloud which even now can contain high concentrations of atmospheric
pollutants Given this environment and the ability of conifer canopies to efficiently scavenge air pollutants
from the atmosphere (Fowler et al 1989) the positive effects of emission reductions may be attenuated in
Coniferous Woodland There is also a known interaction between forest age or maturity and atmospheric
nitrogen deposition which can potentially acidify forest soils through ldquonitrogen sa turationrdquo (Emmett et al
2003 Emmett and Reynolds 1996) Atmospheric nitrogen deposition has changed little over the past 29
years whilst conifer plantations have grown older as trees planted in the 1960s reach maturity The ongoing
effects of nitrogen deposition may therefore offset the benefits of lower sulphur deposition Aside from
external influences the build up of acidic forest floor and accumulation of base cations into standing
biomass especially in those areas with a naturally ldquoacidicrdquo geolog y and soils may also be contributing to the
sustained acidity of surface soils in Coniferous Woodland The policy consequences of these results are
more likely to affect the aquatic rather than the terrestrial environment In Wales for example surface w ater
acidification in afforested headwater catchments and the persistence of acid episodes has already been
identified as a significant threat to achieving compliance to the Water Framework Directive in some upland
water bodies
69
Countryside Survey Soils Report from 2007
3 Soil pH
341 Policy implications
The increased soil pH observed for the more mineral soils is consistent with the expected benefit of
continued reductions in sulphur emissions Data analysis is ongoing to determine if other drivers of change
such as nitrogen deposition or land management is slowing recovery in the organic soils where pH did not
significantly increase between 1998 and 2007 Conversion from one land use to another does not seem to be
an important factor Land management may be affecting soil pH in more intensively managed agricultural
land and further work is required to separate this influence from the response to reduced acid and nitrogen
deposition The implications of these findings are that current emission control policies combined with current
policies to protect soil through sustainable land management practices may not currently be sufficient to
promote continued recovery from acidification in organic -rich soils
35 References
Allen SE (ed) 1989 Chemical analysis of ecological materials Blackwell Scientific Publications Oxford
368 pp
Avery BW Bascomb CL 1974 Soil Survey Laboratory Methods Soil Survey Technical Monograph No 6
Harpenden
Baxter SJ Oliver MA Archer JR 2006 The Representative Soil Sampling Scheme of England and
Wales the spatial variation of topsoil nutrient status and pH between 1971 and 2001 Soil Use and
Management 22 383-392
Black HIJ Garnet JS Ainsworth G Coward PA Creamer R Ellwood S Horne J Hornung M
Kennedy VH Monson F Raine L Osborn D Parekh NR Parrington J Poskitt JM Potter E
Reeves N Rowland AP Self P Turner S Watkins J Woods C Wright J 2000 MASQ Monitoring
and Assessing Soil Quality in Great Britain Countryside Survey Module 6 Soils and Pollution RampD
Technical Report E1-063TR Environment Agency Bristol
Carey PD Wallis S Chamberlain PM Cooper A Emmett BA Maskell LC McCann T Murphy J
Norton LR Reynolds B Scott WA Simpson IC Smart SM Ullyett JM 2008 Countryside Survey
UK Results from 2007 NERCCentre for Ecology amp Hydrology 105pp (CEH Project Number C03259)
Countryside Survey 2009 England Results from 2007 (published September 2009) NERCCentre for Ecology
amp Hydrology Department for Environment Food and Rural Affairs Natural England 119pp (CEH Project
Number C03259)
Defra 2003 Comparability of soil properties derived from different data sources Report by National Soil
Resources Institute Defra Project SP0515
Dore AJ Choularton TW Fowler D 1992 An improved wet deposition map of the United Kingdom
incorporating the seeder-feeder effect over mountainous terrrain Atmospheric Environment 26 1375-1381
Emmett BA Frogbrook ZL Chamberlain PM Griffiths R Pickup R Poskitt J Reynolds B Rowe
E Spurgeon D Rowland P Wilson J and Wood CM 2008 CS Technical Report No 307 Soils
Manual NERCCentre for Ecology amp Hydrology 180 pp (CEH Project Number C03259)
Emmett BA Reynolds B Stevens PA Norris DA Hughes S Gorres J Lubrecht I 1993 Nitrate
leaching from afforested Welsh catchments - interactions between stand age and nitrogen deposition Ambio
22 386-394
70
Countryside Survey Soils Report from 2007
3 Soil pH
Emmett BA Reynolds B 1996 Nitrogen critical loads for spruce plantations in Wales is there too much
nitrogen Forestry 69 205-214
Fowler D Cape JN and Unsworth MH 1989 Deposition of atmospheric pollutants on forests
Philosophical Transactions of the Royal Society B 324 247-265
Fowler D Coyle M Apsimon HM Ashmore MR Bareham SA Battarbee RW Derwent RG
Erisman JW Goodwin J Grennfelt P Hornung M Irwin J Jenkins A Metcalfe SE Ormerod SJ
Reynolds B Woodin S 2001 Transboundary Air pollution Acidification Eutrophication and Ground -Level
Ozone in the UK NEGTAP 2001 314pp DEFRA Contract No EPG 13153
Haines-Young RH Barr CJ Black HIJ Briggs DL Bunce RGH Clarke RT Cooper A Dawson
FH Firbank LG Fuller RM Furse MT Gillespie MK Hill R Hornung M Howard DC McCann
T Morecroft MD Petit S Sier ARJ Smart SM Smith GM Stott AP Stuart RC and Watkins
JW 2000 Accounting for nature assessing habitats in the UK countryside Centre for Ecology and
Hydrology Department of the Environment Transport and the Regions 134 pp
McGrath SP Loveland PJ 1992 The Soil Geochemical Atlas of England and Wales Blackie Academ ic
and Professional
NEGTAP 2001 Transboundary Air Pollution Acidification Eutrophication and Ground -Level Ozone in the
UK Prepared by the National Expert Group on Transboundary Air Pollution on behalf of the UK Department
for Environment Food and Rural Affairs (DEFRA) and the Devolved Administrations 314 pp
Norton LR Murphy J Reynolds B Marks S Mackey EC 2009 Countryside Survey Scotland Results
from 2007 NERCCentre for Ecology amp Hydrology The Scottish Government Scottish Natural Heritage
83pp (CEH Project Number C03259)
Oliver MA Archer JR Baxter SJ Todd AD Skinner RJ 2006 The Representative Soil Sampling
Scheme of England and Wales a statistical analysis of topsoil nutrient status and pH between 197 1 and
2001 Soil Use and Management 22 372-382
RoTAP 2010 Review of Transboundary Air Pollution Acidification Eutrophication Ground Level Ozone and
Heavy Metals in the UK Defra
Schofield RK Taylor AW1955 The measurement of soil pH Soil Science Society of America Journal 19
164-167
Skinner RJ Todd AD 1998 Twenty-five years of monitoring pH and nutrient status of soils in Enlgand and
Wales Soil Use and Management 14 162-169
Skinner RJ Church BM Kershaw CD 1992 Recent trends in soil pH and nutrient status in England and
Wales Soil Use and Management 8 16-20
Smart SM Allen D Murphy J Carey PD Emmett BA Reynolds B Simpson IC Evans RA
Skates J Scott WA Maskell LC Norton LR Rossall MJ Wood C 2009 Countryside Survey Wales
Results from 2007 NERCCentre for Ecology amp Hydrology Welsh Assembly Government Countryside
Council for Wales 94pp (CEH Project Number C03259)
White RE 1969 On the measurement of so il pH Journal of the Australian Institute of Agricultural Science
35 3-14
71
Countryside Survey Soils Report from 2007
4 Total nitrogen and CN
Summary
There were small but significant decreases in mean soil (0-15 cm) total nitrogen concentration
between 1998 and 2007 in many Broad Habitats and Aggregate Vegetation Classes across Great
Britain and the individual countries no reporting category recorded an increase in mean soil (0 -15
cm) total nitrogen concentration
For semi-natural and woodland soils continued input of nitrogen deposition at 20-30 kgNhayr for
many parts of Great Britain has not caused the expected average increase of 3 -4 in this basic soil
property Instead the decreases observed combined with a trend for an increase in total carbon to
nitrogen ratio suggest there may be increased nitrogen loss or uptake possibly combined with a
trend for increased carbon density as reported for some soils in Chapter 2 The effects of one or
both of these processes would be to effectively bdquodilute‟ the soil (0 -15cm) nitrogen concentration
signal Both processes (increased nitrogen loss and increased carbon fixation by plants leading to
storage in soil) are known possible consequences of nitrogen enrichment which can result in
vegetation composition change and thus this parameter may not be a sensitive indicator of
eutrophication from atmospheric nitrogen deposition
There was no change or a small significant decline in mean soil total nitrogen concentrations in
improved and fertile grassland categories between 1998 and 2007 across Great Britain and within
individual countries despite major reductions in fertiliser use As there is no change in the soil (0 -
15cm) total carbon to nitrogen ratio this indicates farmers have maintained soil nitrogen status in
managed grassland systems despite a reduction in mineral fertiliser use possibly due to use of
alternative organic sources of nitrogen such as slurry and organic waste products
In cropland systems a significant decline in soil (0-15cm) total nitrogen concentrations and total
carbon to nitrogen ratios was observed between 1998 and 2007 for Great Britain and England A
significant decline in soil (0-15cm) total carbon concentrations was also reported (Chapter 2) As
there is only a small decline in fertiliser use in these systems and there is evidence of combined
carbon and nitrogen loss deep ploughing erosion or increased decomposition rates may be the
most likely explanation of this trend
41 Introduction
Key question Can the trend of eutrophication of the countryside be detected in the soil as well as the
vegetation using this basic soil property
Measurements Repeat measurement of soil (0-15 cm) total nitrogen concentration measured in all plots
sampled in 1998
Soil total nitrogen concentration (hereafter called soil N concentration) and stock are basic fundame ntal
measurements of soil fertility They are relatively insensitive to short -term changes but over a longer time
period give an overall indication of trends in soil fertility and changes in nutrient status in relation to other
parameters such as carbon (C) Changes in plant species composition were observed following the
Countryside Survey (CS) in 1998 (Haines-Young 2000) and these were ascribed to ecosystem eutrophication
following enhanced deposition of atmospheric N compounds
In response to the key question soil N concentration data can be used to provide
72
Countryside Survey Soils Report from 2007
4 Total Nitrogen and CN
National and country-level assessments of soil N concentration and change in soil N concentration
since 1998
Attribution of change in and form of soil N in response to pressures and drivers
Attribution of change in plant species composition in relation to internal N status versus
atmospheric N deposition
Assessment of soil N in relation to changes in soil C status
The deliverables for total soil (0-15 cm) N from CS in 2007 will be
National and country-level assessments of status and change in soil (0-15 cm) total N concentration
and stock since 1998
Assessment of soil N in relation to changes in soil C status
411 Rationale for measurement
The rationale for the measurement of soil total N concentration and stock is given in Table 41 Total N has
not been measured in surveys of soil quality in England and Wales apart from forest and woodland systems
in the BIOSOIL and British Woodland Survey It is a parameter within the National Soil In ventory for Scotland
(NSIS) and is included in the soil measurements at Environmental Change Network sites
Table 41 Total N rationale for measurement
Facts Comments History in CS Total N measured in CS
in 1998
Maintain time series Enables stock and change
Links and compatibility to other monitoring programmes
Not measured in NSI
Total N has been measured in the NSIS (Scotland) BIOSOIL and the British Woodland Survey
Uniqueness of CS No other known national datasets
Only integrated sample which can be linked to vegetation and land management
Value for money (Policy priority or interpretative value x cost)
High High policy and interpretative value low cost
42 Methods
The soil used for total N analysis was taken from the bdquoBlack core‟ and there were no specific sampling
requirements beyond those normally employed for collecting these samples (See Emmett et al 2008 Annex
1)
One thousand and twenty four samples were analysed at CEH Lancaster for total N in 2007 using the UKAS
accredited method SOP3102 Samples were analysed using an Elementar Vario -EL elemental analyser
(Elementaranalysensysteme GmbH Hanau Germany) The Vario EL is a fully automated analytical
instrument working on the principle of oxidative combustion followed by thermal conductivity detection
Following combustion in the presence of excess oxygen the oxides of N and C flow through a reduction
column which removes excess oxygen C is trapped on a column whilst N is carried to a detector C is then
73
Countryside Survey Soils Report from 2007
4 Total nitrogen and CN
released from the trap and detected separately Sample weights are usually 15 mg for peat and 15 -60 mg for
mineral soil samples
The concentration of total N is expressed in dry weight of soil which is abbreviated in the text to N
To calculate topsoil total N density a measurement of N content per unit volume is needed Combining bulk
density measurements reported in Chapter 1 for the 2007 samples with soil N concentration values result in
estimates of topsoil (0-15 cm) N density on an area basis expressed in units of tha
421 Quality Assurance and Quality Control
The DefraNERCBBSRC Joint Codes of Practice were followed
Due to the fully automated nature of the instrument calibration was performed infrequently with daily runs
being factorised to the instrument calibration through the use of a certified standard (acetanilide) Quality
control was achieved by using two in-house reference materials analysed with each batch of samples and by
the analysis of duplicate samples
Results of the analysis of standard reference materials (SRM) SR3 and SR8 which cover a range of soil N
concentration values are shown using Shewhart charts (Fig 41a and Fig 41b) The same standards were
used in the sample batches from 1998 and 2007 and the relative performance of the a nalysis can be
compared
Figure 41 Shewhart QC charts for total N analysis () of standard reference materials a) SR3 and b) SR8
a) SR3 - QC ChartMean = 065 limits +- 2 SD of mean
050
055
060
065
070
075
0 50 100 150 200 250
Arbitrary sample no
N
1998 2007 Mean Upper limit Lower limit
b) SR8 - QC ChartMean = 030 limits +- 2 SD of mean
025
028
030
033
035
0 20 40 60 80 100 120 140 160 180 200
Arbitrary sample no
N
1998 2007 Mean Upper limit Lower limit ISO median
74
Countryside Survey Soils Report from 2007
4 Total Nitrogen and CN
The Quality Control charts provide evidence of acceptable results for the analyses under taken in 1998 for
both SRMs More points fall outside the 2SD limit for both SRMs in 2007 For SR3 there is an upward trend
in the results whereas a downward trend is suggested for SR8 with values falling closer to the ISO median
value of 029 N Taken overall the values for the repeated SRM analyses fall within acceptable Quality
Control limits and there is no evidence to indicate a consistent bias in the results
422 Reporting
Soil N concentration data (0-15 cm) have been analysed to provide information on the state of soil N
concentration in 2007 and the change since 1998 The statistical approach used for analysing the data for
change involved bootstrapping which allows for non-normality in the data without the necessity of knowing
details of the actual distribution As such it provides a more accurate measurement of significance Annex F
of Emmett et al (2008) provides a background document describing this approach
The data in this report describe mean soil N concentrations in soils (0-15 cm) in 2007 and change since 1998
by Broad Habitat Aggregate Vegetation Class (AVC) and Loss-on-Ignition (LOI) category for Great Britain
(GB) and for the individual countries In summary these are defined as
Broad Habitat - The Broad Habitat classification consists of 27 habitats which account for the entire
land surface of Great Britain and the surrounding sea Countryside Survey reports on soils for 10
major terrestrial habitats
Aggregate Vegetation Class (AVC) ndash is a high level grouping of vegetation types produced from a
quantitative hierarchical classification of the different plant species found in the original Countryside
Survey sample plots Loss on ignition (LOI) category ndash soil type based on soil organic matter content defined as mineral (0 -
8 LOI 0-44 g C kg-1
) humus-mineral (8 ndash 30 LOI 44-165 g C kg-1
) organo-mineral (30 ndash 60
LOI 165-330 g C kg-1
) and organic (60 ndash 100 gt 330 g C kg-1
)
To remove the effects of large-scale vegetation and or land use change mean soil N concentrations have
also been estimated for plots where the AVC has not changed over time The AVC is only known for the
survey years and may change during intervening periods for example due to arable -grassland rotation The
plots where the AVC has not changed can therefore be regarded as plots where the vegetation has been
largely consistent in 1978 1998 and 2007
Soil (0-15 cm) total N density (tha) has been estimated for 2007 using the total N concentration and the bulk
density data These values are reported using the same categories for GB and individual countries Total N
density has not been estimated for AVC unchanged as change in density cannot be reported
43 Results
431 Structure of the total nitrogen concentration data
Total N concentration was measured in samples from 1024 plots in 2007 and from 1110 plots in 1998 75 of
plots sampled in 2007 had also been sampled in 1998 Concentrations of total N measured in soils (0-15 cm)
in 2007 ranged between 004 and 277N compared to a range of values betw een 008 and 322 N in 1998
The common practice in agricultural soils to determine N on a volume basis (mglitre) makes comparison
difficult particularly when combined with different depth of 0 -75cm compared to 0-15cm in CS for grassland
soils although ranges for CS soils seem broadly comparable
75
Countryside Survey Soils Report from 2007
4 Total nitrogen and CN
Between 1998 and 2007 the proportion of samples with a total N concentration of 1N or less increased
from 71 to 80 whilst the proportion of samples with greater than 2N decreased from 9 to 54
Overall there was evidence of a downward shift in total N concentrations across the entire range of values
between 1998 and 2007 (Fig 42) The populations in 1998 and 2007 were skewed and slightly bimodal
Figure 42 Distribution of soil (0-15cm) N concentrations a) Histogram for 1998 and 2007 b) Cumulative
frequency for 1998 and 2007 Histogram frequencies normalised to percentage of total number of samples
analysed in each survey
Soil N concentration was strongly and positively correlated to loss on ignition (r2 = 089) although there was
more scatter in both datasets at higher values of LOI and total N (Fig 43a) Total N concentration decreased
with increasing bulk density in a logarithmic relationship (r2 = 079 Fig 43b) and together the results show
not unexpectedly that peaty soils with low bulk density contain the highest concentrations of N Below pH
55 soil N concentrations varied across the full range of values measured (04 to 28N) whilst abov e pH 6
the majority of samples contained between 01 and 06 N (Fig 43c) There was no clear relationship
0
3
6
9
12
15
18
01 05 09 13 17 21 25 29 33
Total N ( dry wt of soil)
Fre
qu
en
cy
1998 2007
a)
0
20
40
60
80
100
0 1 2 3 4
Total N ( dry wt of soil)
Cu
mu
lati
ve
fre
qu
en
cy
1998 2007
b)
76
Countryside Survey Soils Report from 2007
4 Total Nitrogen and CN
between total N concentration and Olsen-P (Fig 43d) A wide range of total N values were encountered at
Olsen-P concentrations below 50 mgP kg-1
although samples with very high Olsen-P values in excess of
150 mgP kg-1
generally had low total N concentrations (lt05 N)
Figure 43 Relationships between soil N concentration in 2007 and a) Loss-on-ignition b) bulk density c) soil
pH and d) Olsen-P concentration
Figure 44 Plots of soil N concentration change between 1998 and 2007 (Delta soil N concentration) and 2007
values for a) Loss-on-ignition b) bulk density c) soil pH and d) Olsen-P concentration
-3
-2
-1
0
1
2
3
0 20 40 60 80 100 120
2007 LOI ( dry wt soil)
Delt
a
N
a)
-3
-2
-1
0
1
2
3
0 05 1 15 2
2007 Bulk density (gcm3)
Delt
a
N
b)
-3
-2
-1
0
1
2
3
3 4 5 6 7 8 9
2007 pH
Delt
a
N
c)
-3
-2
-1
0
1
2
3
0 50 100 150 200 250
2007 Olsen-P (mgPkg)
Delt
a
N
d)
0
1
2
3
0 100 200 300 400
Olsen P (mgkg)
To
tal
N (
d
ry w
t s
oil
) d)
0
1
2
3
3 5 7 9
pH
To
tal
N (
d
ry w
t s
oil
)
c)
y = -06385Ln(x) + 03753
R2 = 07927
0
1
2
3
0 05 1 15 2
Bulk density (gcm3)
To
tal
N (
d
ry w
t s
oil
) b)y = 00758x
07302
R2 = 0891
0
1
2
3
0 20 40 60 80 100
LOI ( dry wt soil)
To
tal
N (
d
ry w
t s
oil
) a)
77
Countryside Survey Soils Report from 2007
4 Total nitrogen and CN
Changes in soil N concentration between 1998 and 2007 occurred across the full range of LOI
concentrations (Fig 44a) whereas large changes were more prevalent in soils with a bulk density below asymp07
gcm3 and pH less than 55 (Figs 44b and 44c) Soils with relatively low Olsen-P concentrations (lt20 mgP
kg-1
) showed the largest decrease in total N concentration (Fig 44d) with decreases of up to 2N
432 Change in mean total nitrogen concentration in soils (0-15 cm) across Great
Britain
There was a significant approximately 10 decrease in soil (0-15 cm) N concentration between 1998 and
2007 across GB as a whole (Table 42) This was reflected in many Broad Habitats The magnitude of
change varied between Broad Habitats with the smallest significant decrease (7 ) measured in Arable which
also had the lowest soil N concentrations in 1998 (027 N) and 2007 (025 N) The biggest percentage
decrease between the surveys (21) occurred in Coniferous Woodland The highest soil N concentrations in
both surveys were measured in soils in the Bog Broad Habitat (178 N in 1998 and 159 N in 2007) The
soil N concentration in soils (0-15 cm) beneath Broadleaved Woodland Improved Grassland Bracken and
Fen Marsh and Swamp did not change significantly between 1998 and 2007
The largest total N density (60 tha) was measured in Improved Grassland reflecting the intermediate mean
N concentration and relatively high bulk density Despite having the highest mean total N concentration soils
in the Bog and Coniferous Woodland had the lowest N densities (38 tha) due to the low bulk density values
in these Broad Habitats
There was a significant decrease in soil N concentration in all AVCs except Lowland Woodland Tall Grass
and Herb and Crops and Weeds between 1998 and 2007 (Table 42b) The lowest soil N concentrations were
observed in Crops and Weeds in 1998 (026 N) and 2007 (025 N) whilst Heath and Bog AVC had the
highest mean values in 1998 (17 N) and 2007 (147 N) The soil N concentrations in soils (0-15 cm) for
plots in which the AVC did not change (Table 42c) were broadly consistent with the dataset as a whole
(Table 42b) Significant changes were only observed in Heath and Bog and Infertile Grassland for the
unchanged dataset This suggests that some of the significant change in soil N concentrations observed in
the dataset as a whole may have arisen because of a change in land use between the surveys
Heath and Bog AVC had the lowest total N density in 2007 (38 tha) and Fertile Grassland the highest (59
tha) These values compare closely with values measured in Bog and Improved Grassland Broad Habitats
respectively
Soil N concentrations decreased significantly across all LOI categories (Table 42d Fig 45) with the
largest change observed in organo-mineral soils where mean total N in soils (0-15 cm) declined by more than
20 In both surveys the highest soil N concentrations were observed in organic soils which accounted for
the high concentrations measured in Broad Habitats and AVCs with organic -rich soils (Dwarf Shrub Heath
and Bog Broad Habitats Moorland Grass Mosaic and Heath and Bog AVCs) Organic soils had the lowest
total N density (38 tha) while the highest density was observed in humus -mineral soils (60 tha)
The soil N concentration data were combined with C data to calculate changes in soil CN ratio (0-15cm) The
CN variable provides information on the relative change in C and N storage in soils The general trend
across all Broad Habitats is for no change or an increase in CN rat io (Table 43)
78
Countryside Survey Soils Report from 2007
4 Total Nitrogen and CN
Table 42 Change between 1998 and 2007 in N concentration of soils (0-15 cm) and total N density of soils (0-15
cm) in 2007 for GB for a) Broad Habitats b) Aggregate Vegetation Classes (AVC) c) AVCs unchanged since 1978
and d) LOI categories Arrows denote a significant change (plt005) in the direction shown Diagonal line
indicates too few samples to provide reliable value
a) Great Britain ndash Broad Habitat
Broad Habitats Mean Total Nitrogen ( dry wt soil)
Direction of
significant changes
Total Nitrogen
density (tha)
1998 2007 1998 - 2007 2007
Broadleaved Mixed and
Yew Woodland
070 065 51
Coniferous Woodland 112 088 38
Arable and Horticulture 027 025 43
Improved Grassland 047 045 60
Neutral Grassland 052 047 56
Acid Grassland 149 123 51
Bracken 084 095
Dwarf Shrub Heath 131 114 47
Fen Marsh and Swamp 122 108 48
Bog 178 159 38
All Habitat Types 079 071 49
b) Great Britain ndash AVC whole dataset
Aggregate Vegetation
Class
Mean Total Nitrogen ( dry wt soil) Direction of
significant changes
Total Nitrogen
density (tha)
1998 2007 1998 - 2007 2007
Upland Woodland 091 073 40
Lowland Woodland 060 058 51
Fertile Grassland 044 041 59
Infertile Grassland 057 052 58
Moorland Grass Mosaic 128 113 48
Heath and Bog 170 147 38
Tall Grass and Herb 036 036 48
Crops and Weeds 026 025 43
c) Great Britain ndash AVC unchanged
Aggregate Vegetation
Class
Mean Total Nitrogen ( dry wt soil) Direction of
significant changes
Total Nitrogen
density (tha)
1998 2007 1998 - 2007 2007
Upland Woodland 090 072
Lowland Woodland 065 067
Fertile Grassland 047 044
Infertile Grassland 059 053
Moorland Grass Mosaic 138 124
Heath and Bog 170 151
Tall Grass and Herb 032 032
Crops and Weeds 025 024
79
Countryside Survey Soils Report from 2007
4 Total nitrogen and CN
d) Great Britain ndash Loss on Ignition category
LOI category () Mean Total Nitrogen ( dry wt soil)
Direction of
significant changes
Total Nitrogen
density (tha)
1998 2007 1998 - 2007 2007
Mineral (0-8) 029 027 44
Humus-mineral (8-30) 060 056 60
Organo-mineral (30-60) 146 114 51
Organic (60-100) 191 180 38
Figure 45 Change in soil (0-15 cm) N concentration across LOI categories in Great Britain between 1998 and
2007 Significant changes are shown as plt0001 plt001 plt005 95 CI are shown for each bar
-06
-05
-04
-03
-02
-01
0
Mineral Humus-mineral Organo-mineral Organic
Soil LOI categories
Dif
fere
nce
1998-2
007
(
N)
80
Countryside Survey Soils Report from 2007
4 Total Nitrogen and CN
Table 43 Change in CN ratio of soils (0-15 cm) across Great Britain for a) Broad Habitats b) Aggregate
Vegetation Classes (AVC) c) AVCs unchanged since 1978 and d) LOI categories Arrows denote a significant
change (plt005) in the direction shown
a) Great Britain ndash Broad Habitat
Broad Habitats Mean CN ratio
Direction of
significant changes
1998 2007 1998 - 2007
Broadleaved Mixed and
Yew Woodland
140 142
Coniferous Woodland 201 215
Arable and Horticulture 117 113
Improved Grassland 118 120
Neutral Grassland 123 127
Acid Grassland 177 182
Bracken 152 165
Dwarf Shrub Heath 229 231
Fen Marsh and Swamp 164 177
Bog 262 282
All Habitat Types 156 160
b) Great Britain ndash AVC whole dataset
Aggregate Vegetation
Class
Mean CN ratio Direction of
significant changes
1998 2007 1998 - 2007
Upland Woodland 179 193
Lowland Woodland 134 142
Fertile Grassland 117 121
Infertile Grassland 124 130
Moorland Grass Mosaic 189 196
Heath and Bog 260 268
Tall Grass and Herb 117 118
Crops and Weeds 118 113
c) Great Britain ndash AVC unchanged
Aggregate Vegetation
Class
Mean CN ratio Direction of
significant changes
1998 2007 1998 - 2007
Upland Woodland 171 183
Lowland Woodland 140 150
Fertile Grassland 117 122
Infertile Grassland 124 130
Moorland Grass Mosaic 190 199
Heath and Bog 273 294
Tall Grass and Herb 115 120
Crops and Weeds 117 112
81
Countryside Survey Soils Report from 2007
4 Total nitrogen and CN
d) Great Britain ndash Loss on Ignition category
LOI category () Mean CN ratio
Direction of
significant changes
1998 2007 1998 - 2007
Mineral (0-8) 117 116
Humus-mineral (8-30) 134 142
Organo-mineral (30-60) 194 204
Organic (60-100) 266 278
433 Change in mean total nitrogen concentration in soils (0-15 cm) across England
Total N concentration was measured only on the Main Plots within the original 256 squares sampled in 1978
giving a maximum potential sample number of 1281 of which 1024 were sampled in 2007 and 1110 in 1998
For this reason sample numbers decline rapidly in country-level data analysis A minimum cut-off of 20
samples was applied for country-level analysis of total N concentration by Broad Habitat AVC and LOI
Category As a result there are several gaps in the results Missing data are denoted by a horizontal line
across the cell in the table
There was a relatively small (115) but significant decrease in soil N concentration across the All Broad
Habitats category in England between 1998 and 2007 (Table 44a) Arable soils (0-15 cm) contained the
lowest soil N concentrations in England in 1998 (027 N) and 2007 (025 N) and there was a small (7)
but significant decrease between the two surveys Soil N concentrations in soils (0-15 cm) beneath Improved
Grassland and Neutral Grassland in England were very similar in 2007 ( asymp 048 N) and a significant
decrease in concentration was observed in the latter between 1998 and 2007 (Table 44a) No significant
changes were observed in N concentrations in soils (0-15 cm) beneath Broadleaved Mixed and Yew
Woodland and Acid Grassland in England between 1998 and 2007 There were insufficient samples to make
a valid estimate of the mean and change in N concentration in soils (0-15 cm) in the remaining Broad
Habitats in England
Total N density was lowest in the Arable Broad Habitat (4 4 tha) and highest in Improved Grassland (61
tha) these figures were very similar to the data for these Broad Habitats across GB (Table 42a)
There were significant decreases in soil N concentration in Fertile Grassland and Infertile Grassland AVCs in
England between 1998 and 2007 (Table 44b) Of the AVCs with sufficient data to provide a valid estimate of
the mean the highest concentrations in 1998 and 2007 were measured in soils (0-15 cm) beneath Moorland
Grass Mosaic (109 N) The highest total N density was measured in Infertile Grassland AVC (61 tha)
whilst Upland Woodland and Crops and Weeds jointly had the lowest total N density (43 tha)
Restricting the analysis to plots where AVC remained unchanged resulted in only three AVCs having
sufficient samples for statistically valid estimates of the mean (Table 44c) Infertile Grassland was the only
AVC showing a significant reduction in mean soil N concentration between 1998 and 2007 Mean values for
Fertile Grassland and Crops and Weeds for the unchanged dataset were very similar to those for the dataset
as a whole
There was small (asymp10) but significant decrease in soil N concentration in mineral and humus-mineral soils
in England between 1998 and 2007 (Table 44d) Organo-mineral soils did not change significantly between
the surveys and there were insufficient data to provide valid estimates for organic soils in England The
lowest total N density was observed in mineral soils (45 tha) and humus-mineral soils contained the most
total N (67 tha)
82
Countryside Survey Soils Report from 2007
4 Total Nitrogen and CN
Table 44 Change between 1998 and 2007 in N concentration of soils (0-15 cm) and total N density of soils (0-15
cm) in 2007 for England for a) Broad Habitats b) Aggregate Vegetation Classes (AVC) c) AVCs unchanged since
1978 and d) LOI categories Arrows denote a significant change (plt005) in the direction shown Diagonal line
indicates too few samples to provide reliable estimate
a) England ndash Broad Habitat
Broad Habitats Mean Total Nitrogen ( dry wt soil)
Direction of
significant changes
Total Nitrogen
density (tha)
1998 2007 1998 - 2007 2007
Broadleaved Mixed and
Yew Woodland
064 058 56
Coniferous Woodland
Arable and Horticulture 027 025 44
Improved Grassland 047 045 61
Neutral Grassland 052 046 59
Acid Grassland 110 092 54
Bracken
Dwarf Shrub Heath
Fen Marsh and Swamp
Bog
All Habitat Types 052 046 53
b) England ndash AVC whole dataset
Aggregate Vegetation
Class
Mean Total Nitrogen ( dry wt soil) Direction of
significant changes
Total Nitrogen
density (tha)
1998 2007 1998 - 2007 2007
Upland Woodland 106 089 43
Lowland Woodland 061 060 53
Fertile Grassland 045 039 59
Infertile Grassland 056 051 61
Moorland Grass Mosaic 109 109 58
Heath and Bog
Tall Grass and Herb 036 037 49
Crops and Weeds 027 025 43
c) England ndash AVC unchanged
Aggregate Vegetation
Class
Mean Total Nitrogen ( dry wt soil) Direction of
significant changes
Total Nitrogen
density (tha)
1998 2007 1998 - 2007 2007
Upland Woodland
Lowland Woodland
Fertile Grassland 049 045
Infertile Grassland 060 055
Moorland Grass Mosaic
Heath and Bog
Tall Grass and Herb
Crops and Weeds 025 024
83
Countryside Survey Soils Report from 2007
4 Total nitrogen and CN
d) England ndash Loss on Ignition category
LOI category () Mean Total Nitrogen ( dry wt soil)
Direction of
significant changes
Total Nitrogen
density (tha)
1998 2007 1998 - 2007 2007
Mineral (0-8) 029 026 45
Humus-mineral (8-30) 062 056 67
Organo-mineral (30-60) 145 110 63
Organic (60-100)
434 Change in mean total nitrogen concentration in soils (0-15 cm) across Scotland
In Scotland there was a small (11) but significant decline in soil N concentration for the All Broad Habitats
category (Table 45a) between 1998 and 2007 Significant decreases in N concentration in soils (0-15 cm)
were also observed in Coniferous Woodland Acid Grassland Dwarf Shrub Heath and Bog Broad Habitats
but there were no significant changes in soil N concentration in Broadleaf Woodland Arable Improved
Grassland and Neutral Grassland Improved Grassland contained the most total N (52 tha) and Coniferous
Woodland had the lowest total N density (37 tha) The figure for Coniferous Woodland is comparable with
that for GB but Improved Grassland in Scotland contains 08 tha less total N compared to GB
Infertile Grassland and Heath and Bog AVCs all showed a significant decrease in total N concentration
between 1998 and 2007 (Table 45b) There were no significant changes in Upland Woodland Moorland
Grass Mosaic Fertile Grassland or Crops and Weeds The latter contained the smallest soil N concentrations
in 1998 and 2007 (024 N and 023 N respectively) whilst the highest mean concentrations were
measured in Heath and Bog (148 N in 2007) Despite the high mean soil (0 -15 cm) N Heath and Bog
had the lowest total N density (36 tha) reflecting the relatively low bulk density of organic -rich soils Infertile
Grassland contained the largest quantity of soil (0 -15 cm) N (52 tha)
Restricting the analysis to unchanged AVCs removed the Crops and Weeds AVC but for the other AVCs the
results were consistent with those for the dataset as a whole (Table 45c)
Table 45 Change between 1998 and 2007 in N concentration of soils (0-15 cm) and total N density of soils (0-15
cm) in 2007 for Scotland for a) Broad Habitats b) Aggregate Vegetat ion Classes (AVC) c) AVCs unchanged since
1978 and d) LOI categories Arrows denote a significant change (plt005) in the direction shown Diagonal line
indicates too few samples to provide reliable value
a) Scotland ndash Broad Habitat
Broad Habitats Mean Total Nitrogen ( dry wt soil)
Direction of
significant changes
Total Nitrogen
density (tha)
1998 2007 1998 - 2007 2007
Broadleaved Mixed and
Yew Woodland
081 076 40
Coniferous Woodland 111 092 37
Arable and Horticulture 026 026 41
Improved Grassland 045 043 52
Neutral Grassland 052 046 49
Acid Grassland 163 134 46
Bracken
Dwarf Shrub Heath 134 117 42
84
Countryside Survey Soils Report from 2007
4 Total Nitrogen and CN
Fen Marsh and Swamp
Bog 178 158 38
All Habitat Types 112 100 43
b) Scotland ndash AVC whole dataset
Aggregate Vegetation
Class
Mean Total Nitrogen ( dry wt soil) Direction of
significant changes
Total Nitrogen
density (tha)
1998 2007 1998 - 2007 2007
Upland Woodland 082 070 38
Lowland Woodland
Fertile Grassland 040 037 51
Infertile Grassland 064 054 52
Moorland Grass Mosaic 127 112 45
Heath and Bog 172 148 36
Tall Grass and Herb
Crops and Weeds 024 023 42
c) Scotland ndash AVC unchanged
Aggregate Vegetation
Class
Mean Total Nitrogen ( dry wt soil) Direction of
significant changes
Total Nitrogen
density (tha)
1998 2007 1998 - 2007 2007
Upland Woodland 086 075
Lowland Woodland
Fertile Grassland 044 041
Infertile Grassland 063 052
Moorland Grass Mosaic 143 124
Heath and Bog 172 153
Tall Grass and Herb
Crops and Weeds
d) Scotland ndash Loss on Ignition category
LOI category () Mean Total Nitrogen ( dry wt soil)
Direction of
significant changes
Total Nitrogen
density (tha)
1998 2007 1998 - 2007 2007
Mineral (0-8) 027 025 39
Humus-mineral (8-30) 058 053 50
Organo-mineral (30-60) 144 111 45
Organic (60-100) 189 178 36
There was no significant change in soil N concentration of mineral and humus-mineral soils in Scotland
between 1998 and 2007 (Table 45d) Soil N concentration decreased significantly by over 20 in organo-
mineral soils but there was a much smaller (6) significant decrease in organic soils between 1998 and
2007 The highest soil N concentrations in 1998 and 2007 were observed in organic soils (189 N and 178
N respectively) these had the lowest total N density in 2007 (36 tha) Humus-mineral soils contained the
most N (50 tha) in Scotland
85
Countryside Survey Soils Report from 2007
4 Total nitrogen and CN
435 Change in mean total nitrogen concentration in soils (0-15 cm) across Wales
The small number of samples from Wales placed a major restriction on data analysis with only seven
reporting categories having sufficient data to report valid statistics for status and change in soil N
concentration (Table 46) There was no significant change in soil N concentration across Wales as a whole
between 1998 and 2007 (Table 46a) Improved Grassland was the only Broad Habitat to have sufficient data
to provide stock and change statistics in Wales and this showed no significant change in soil N concentration
between 1998 and 2007 Total N density in Improved Grassland in Wales in 2007 (72 tha) was relatively
high compared with other countries and with GB as a whole For Wales as a whole total N density was 61
tha in 2007 which was a comparatively high figure and reflected the pre-dominance in Wales of samples
from Improved Grassland (43 of samples) and the virtual absence of samples from Broad Habitats with
more organic-rich soils which have a lower total N density
Infertile Grassland and Fertile Grassland were the only AVCs in Wales to have sufficient sample points to
provide valid statistics for stock and change (Tables 46 b and 46c) Mean concentrations of total N did not
change significantly between 1998 and 2007 in either AVC The largest total N density was measured in
Fertile Grassland (75 tha) this was the highest value for this AVC of all three countries Restricting the
dataset to unchanged AVCs (Table 46c) reduced the number of reporting categories to Infertile Grass land
and mean soil N concentration did not change between 1998 and 2007
There were no significant changes in mean soil N concentrations in mineral and humus -mineral soils in Wales
between 1998 and 2007 (Table 46d) These were the only soil LOI categories to have sufficient samples to
report status and change Total N densities in 2007 in mineral and humus-mineral soils were 53 tha and 64
tha respectively
Table 46 Change between 1998 and 2007 in N concentration of soils (0-15 cm) and total N density of soils (0-15
cm) in 2007 for Wales for a) Broad Habitats b) Aggregate Vegetation Classes (AVC) c) AVCs unchanged since
1978 and d) LOI categories Absence of arrows denote no significant change (plt005) were observed Diagonal
line indicates too few samples to provide reliable value
a) Wales ndash Broad Habitat
Broad Habitats Mean Total Nitrogen ( dry wt soil)
Direction of
significant changes
Total Nitrogen
density (tha)
1998 2007 1998 - 2007 2007
Broadleaved Mixed and
Yew Woodland
Coniferous Woodland
Arable and Horticulture
Improved Grassland 057 057 72
Neutral Grassland
Acid Grassland
Bracken
Dwarf Shrub Heath
Fen Marsh and Swamp
Bog
All Habitat Types 074 070 61
86
Countryside Survey Soils Report from 2007
4 Total Nitrogen and CN
b) Wales ndash AVC whole dataset
Aggregate Vegetation
Class
Mean Total Nitrogen ( dry wt soil) Direction of
significant changes
Total Nitrogen
density (tha)
1998 2007 1998 - 2007 2007
Upland Woodland
Lowland Woodland
Fertile Grassland 054 056 75
Infertile Grassland 056 055 61
Moorland Grass Mosaic
Heath and Bog
Tall Grass and Herb
Crops and Weeds
c) Wales ndash AVC unchanged
Aggregate Vegetation
Class
Mean Total Nitrogen ( dry wt soil) Direction of
significant changes
Total Nitrogen
density (tha)
1998 2007 1998 - 2007 2007
Upland Woodland
Lowland Woodland
Fertile Grassland
Infertile Grassland 051 051
Moorland Grass Mosaic
Heath and Bog
Tall Grass and Herb
Crops and Weeds
d) Wales ndash Loss on Ignition category
LOI category () Mean Total Nitrogen ( dry wt soil)
Direction of
significant changes
Total Nitrogen
density (tha)
1998 2007 1998 - 2007 2007
Mineral (0-8) 035 035 53
Humus-mineral (8-30) 061 059 64
Organo-mineral (30-60)
Organic (60-100)
87
Countryside Survey Soils Report from 2007
4 Total nitrogen and CN
44 Discussion and Policy Implications
The policy question which led to the inclusion of this parameter in the CS in 2007 was ldquoCan the
eutrophication trend in the countryside be detected in the soil as well as the vegetation using this basic soil
propertyrdquo As there were no significant increases in mean soil N concentration in any reporting category in
GB or in the individual countries between 1998 and 2007 the conclusion must be a negative Instead
significant decreases in soil N concentration were detected for many reporting categories The decreases for
woodlands and semi-natural habitats were generally small (5-10 of 1998 levels) with a maximum of 21 in
Coniferous Woodland In intensively managed soils the question of in terest although not specified would
have been ldquoCan the decline in fertiliser use in improved grassland and cropland be detected in the soil using
this basic soil property ldquo There is not as clear evidence for this as might have been expected with no
change or a small decline (4-7 of 1998 levels) observed
For semi-natural and woodland systems the results imply that sustained levels of atmospheric N deposition
over the decade from 1998 to 2007 have not resulted in measurable increases in soil (0 -15 cm) N
concentration as expected Average inputs across GB are ca 20 kgNhayr which is equivalent to 018tNha
This translates to a potential increase of ca 3-4 in soil nitrogen concentrations (0-15cm) In contrast to the
expected increase in soil N concentration there was a significant decline in many habitats The trend for
increased CN ratios (significant for Coniferous Woodland and Neutral Grassland) indicates that there is
either increased removal of N from the soil by vegetation leaching or gas eous pathways and or greater
inputs and storage of C due to increased plant productivity Change in plant fixation of C and uptake of N
may be driven by the combined and possibly interactive effects of N deposition and climate change on plant
productivity No significant increase in soil (0-15cm) carbon density was observed for any semi-natural
habitat or woodland (Chapter 2) although there were positive trends observed for Acid Grassland Dwarf
Shrub Heath and Bog (Table 25)
For managed grasslands the overall trend is not clear Whilst there was no change over this period in soil (0 -
15cm) nitrogen concentrations for Improved Grassland Broad Habitat there was a significant decline for the
Fertile Grassland AVC for GB No significant change in CN was o bserved for either category The relatively
small signal observed is unexpected as fertiliser application rates to grassland declined dramatically by asymp
40 to 65 kgNha between 1998 and 2007 (BSFP 2008) Taking England as an example combined land use
and fertiliser statistics showed a reduction in total use of N fertilisers between 1998 and 2007 of 33 for
grassland The grassland statistic for England combined the effects of a reduction in application rate (by
c40) and a small (12) increase in land area under grassland (June Agricultural Census data for 1998 and
2007) This result could imply either that livestock farmers are using alternative sour ces of N such as farm
yard manure slurries and other organic waste products to maintain N levels in managed grassland soils or
soil (0-15 cm) N is an insensitive indicator of soil response to changes in fertiliser use
For cropped systems a decline in N and CN ratios was observed suggesting the loss of soil C (0 -15cm)
reported in Chapter 2 is matched by a loss of N (9 and 75 respectively between 1998 and 2007) As there
was only a small decline in N fertiliser application rates to tilled land acro ss GB between 1998 and 2007 (eg
in England 6 drop for tilled land) it is most likely that processes which would remove C and N in equal
proportions may be responsible eg erosion or deep ploughing resulting in lower soil horizons characterised
by lower CN coming to the surface
441 Policy implications
In semi-natural systems the decline in N is contrary to expectations due to the ongoing input of N
atmospheric deposition across the GB landscape at an average of ca 20-30kgNhayr (RoTAP 2010) There
may be either increased removal of N from the soil by vegetation leaching or gaseous pathways and or
greater inputs and storage of C due to increased plant productivity Increased loss of N is known to be linked
to N inputs although evidence for this is currently limited for GB (RoTAP 2010) Change in plant uptake of C
88
Countryside Survey Soils Report from 2007
4 Total Nitrogen and CN
and N may be driven by the combined and possible interactive effects of N deposition and climate change on
plant productivity Increased plant productivity is one of the primary dri vers of vegetation composition change
in semi-natural systems (NEGTAP 2001 RoTAP 2010) This apparent bdquodilution‟ of the N signal in the soil
may also have major implications for current soil and pollution monitoring programmes which rely on the
gross soil measurements such as N and CN to indicate the impact of N deposition in semi -natural systems
A more sensitive indicator of plant available-N such as Mineralisable-N (Chapter 5) may need to be
combined with plant productivity and vegetation composition change in the future Ongoing analysis will help
resolve the links between the changes in the C and N storage rates and the possible underlying drivers
In improved grassland systems the lack of any clear decline in N despite a major reduction in N fe rtiliser
use over the same period suggests farmers are using alternative sources of N such as slurry and other
organic waste solids and or that N is an insensitive indicator of change in fertiliser use If indeed farmers
are continuing to maintain total soil N concentrations in managed grassland whilst reducing use of mineral N
fertiliser this would be a positive outcome as the energy costs associated with mineral fertiliser use will have
been reduced without detriment to soil N status Fertiliser use is one of the indicators used by Defra to gauge
progress in reducing the environmental cost of the food chain under the Sustainable Farming and Food
Strategy N fertiliser has been chosen because N contributes to diffuse pollution and fertiliser production has
a high energy cost However there is a risk that the maintenance of soil N status possibly through other
sources of N may limit the intended benefits of reduced fertiliser use for diffuse pollution control
In cropped soils the loss of soil C (0-15cm) reported in Chapter 2 combined with the reported decline in soil
N concentrations here suggest erosion deep ploughing or increased decomposition may be responsible for
the 7-9 reduction for C and N as there is little change in fertiliser application rates This suggests that
policies in place to protect soils in cropped system may not be adequate
45 References
BSFP 2008 The British Survey of Fertiliser Practice Report for 2008 httpwwwdefragovuk
Emmett BA Frogbrook ZL Chamberlain PM Griffiths R Pickup R Poskitt J Reynolds B Rowe
E Spurgeon D Rowland P Wilson J and Wood CM 2008 CS Technical Report No 307 Soils
Manual NERCCentre for Ecology amp Hydrology 180 pp (CEH Project Number C03259)
Haines-Young RH Barr CJ Black HIJ Briggs DL Bunce RGH Clarke RT Cooper A Dawson
FH Firbank LG Fuller RM Furse MT Gillespie MK Hill R Hornung M Howard DC McCann
T Morecroft MD Petit S Sier ARJ Smart SM Smith GM Stott AP Stuart RC and Watkins
JW 2000 Accounting for nature assessing habitats in the UK countryside Department of the Environment
Transport and the Regions Centre for Ecology and Hydrology 134pp
Smith J Smith P Wattenbach M Zaehle S Hiederer R Jones RJA Montanarella L Rounsevell
MDA Reginster I Ewert F 2005 Projected changes in mineral soil carbon of European croplands and
grasslands 1990-2080 Global Change Biology 11 2141 ndash 2152
89
Countryside Survey Soils Report from 2007
5 Mineralisable-N
Summary
Mineralisable-N stock (kgN ha) in soil (0-15cm) was a sensitive indicator of recognised differences
in nitrogen availability between different vegetation types suggesting it is a promising indicator of
eutrophication of the countryside
Initial investigations testing the link between mineralisable-N and occurrence of plant species in 45
test sites suggests it provides additional information to mean total nitrogen concentration data
(N) possibly linked to short term changes in nitrogen availability or specific vegetation or soil
types
There were strong geographical trends in the proportion of mineralised-N transformed to the mobile
form nitrate which suggest a close relationship to broad-scale climatic or soil parameters
Future analyses will separate out the inherent variability associated with climate vegetation and
soil type to identify spatial patterns which can be linked to atmospheric deposition and changes in
management
51 Policy background
Policy question Can the trend of eutrophication of the countryside be detected in the soil as well as the vegetation using this sensitive soil process method
Measurements Concentrations of ammonium- and nitrate-N in soil (0-15cm) after a standard incubation The
measurement was carried out for the first time in 2007 Soils were collected from plots included in the original
1978 survey Countryside Survey (CS) in 2007 has provided
Whole GB and country-level assessment of soil mineralisable N status in 2007
Explanatory data to contribute to the analysis of other CS datasets such as those describing changes in plant species composition
Data likely to decrease uncertainty in model chains used to predict impacts of N deposition on biodiversity
Changes in plant species composition observed following CS in 1998 have been ascribed to eutrophication
following increased deposition of atmospheric nitrogen (N) compounds (Braithwaite et al 2006 Maskell et al
2010) This eutrophication is unlikely to be closely linked to changes in soil total N and total CN since the
soil N stock is large in relation to annual fluxes and contains much N that is not available to plants The
purpose of the measurement of mineralisable N within CS in 2007 is to develop a simple but robust index of
plant-available N This will help determine causal drivers of change in species composition by linking
measures of soil N status with plant species composition across a wide range of Broad Habitats
geographical locations and soil types Mineralisable N measurements will also be used to improve models of
soil biogeochemistry used at national scale to predict carbon (C) and N cycling and the effects of N pollution
on biodiversity The data will also be useful in identifying one aspect of nutrient cycling at a national scale
between different habitats and the relationship to different drivers Nutrient cycling is one of the ecosystem
supporting services currently under review as part of the National Ecosystem Assessment
Several types of analyses have been proposed to measure plant -available N including measurements of net
N mineralisation flux gross mineralisation flux and proxies such as near-infra-red absorption analysis
Plants are able to take up N even from soils with no net mineralisation flux (eg Dyck et al 1987) due to
interception of available N before it can be re-immobilised Such temporarily-available N pools can be
measured using isotopic dilution or by adsorption onto strong ion-exchange resins but these measurements
probably overestimate plant-available N (Fierer et al 2001) While net mineralisation measurements
90
Countryside Survey Soils Report from 2007
5 Mineralisable-N
underestimate plant-available N in low-N systems particularly where plants take up a substantial proportion
of N in dissolved organic form net N mineralisation remains useful to distinguish soils across a range of N
availability (Schimel and Bennett 2004)
Plant species may vary in their preference for dissolved organic reduced or oxidised N (Miller and Bowman
2003) species typical of infertile habitats are more likely to use dissolved organic N whereas species typical
of fertile habitats are more likely to be adapted for nitrate assimilation Thus while mineralisable N is an index
of plant available-N the two concepts do not correspond directly since some plants use dissolved organic N
directly and also since plants exert some contro l over mineralisation and therefore N availability within the
rhizosphere The relative availability of ammonium and nitrate may be more important than gross fluxes for
explaining species occurrence (Bengtson et al 2006) A measure of net nitrification during incubation was
also included to assess whether this distinguished soil types more clearly and to provide extra information for
plant species occurrence models
Policy decisions concerned with the abatement o f atmospheric emissions of sulphur dioxide and oxidised and
reduced forms of N are currently informed through the critical load approach The general definition of the
critical load is ldquoa quantitative estimate of an exposure to one or more pollutants belo w which significant
harmful effects on specified sensitive elements of the environment do not occur according to present
knowledgerdquo (UNECE 2004) Critical loads for N are calculated using either empirical or steady-state mass
balance approaches (UNECE 2004) Empirical approaches rely on data from experiments with critical loads
for each habitat agreed by consensus at an EUUNECE level However neither of these approaches allows a
timescale of changes to be identified and so dynamic models are being developed to improve forecasting of
both soil and plant species change Hitherto soil total N and total C have been used as the abiotic indicators
of N availability that link biogeochemical and floristic parts of these models These bulk measures only
explain around 60 of the variation in mean Ellenberg N (a floristic indicator of eutrophication) Abiotic
measurement of N status are thought to be the major source of uncertainty in such model chains (Wamelink
et al 2002) A more sensitive measurement of available N is required to provide a better indication of
excessive N deposition and a more accurate predictor of floristic change and improve the accuracy of model
chains used to develop policy in relation to the UNECE process
52 Methods
521 Proof of concept
Net mineralisation flux has generally been measured by comparing the amounts of extractable nitrate and
ammonium before and after a period of incubation using paired soil samples eg (Keeney 1980 Waring and
Bremner 1964) Soil disturbance can change mineralisation and immobilisation rates so methods that keep
the core intact are preferred (Raison et al 1987) However the established method may be unsuitable for
large surveys in which the transit of cores to the laboratory cannot be completely contro lled since
mineralisation in transit is likely to lead to large variation in mineral N contents on arrival at the laboratory
which inevitably increases error in the calculation of net flux For this reason a new method was developed
during the CS in 2007 pilot study in which soils were flushed through with approximately four pore -volumes
of an artificial rain solution to remove any accumulation of mineral N during transit
Water tension during incubation affects the mineralisation rate and nitrification and denitrification fluxes and
hence the ratio of ammonium to nitrate Measuring water tension is time -consuming and so calculating the
amount of water that needs to be added or evaporated to reach a particular proportion of water -holding
capacity for a given soil is not straightforward Instead water tension was standardised to approximately that
at field capacity by applying suction to the saturated soil to drain the larger pores
A pilot study showed that the new mineralisable N measurement greatly improved the prediction of floristic
composition as represented by mean Ellenberg N score (Rowe et al in prep) The method was applied to a
large set of cores taken in CS in 2007 A full description of the m ethod is given in the CS in 2007 Soils
91
Countryside Survey Soils Report from 2007
5 Mineralisable-N
Manual (Emmett et al 2008) Three of the five Main Plots were selected for analysis at random from each of
the original 256 CS squares Access restrictions to some of the CS plots prevented collection of some c ores
and 699 of the planned 768 analyses were carried out
Three metrics were chosen to express measurements of mineral N ie ammonium and nitrate contents The
total mineral N per g soil reflects availability to plants but gives the impression of lar ge available N contents
in organic sols with low bulk density Total mineral N per g organic matter may provide a better index of N
availability since large carbon contents are likely to inhibit the net release of mineral N from organic matter
Nitrate content after incubation is a measure of net nitrification (since N is initially released from organic
matter in reduced forms) To separate this signal from that of overall quantity of mineral N nitrate -N content
was expressed as a proportion of total mineral N
The rationale for including mineralisable N within the CS measurement suite is summarised in Table 51
Table 51 Summary of rationale for measurement of soil mineralisable nitrogen within CS in 2007
Issue Facts Comments History in CS No measurements previously
made Better measure of plant-available N than total or soluble N
Country level reporting No Dataset confined to 1978 CS squares which limits the power of analysis for Country level reporting for habitat vegetation and soil types stratifications
Links and compatibility to other monitoring programmes
No known datasets at national scale
Linked to N storage and turnover hence to water quality and floristic monitoring eg Environmental Change Network
Uniqueness of CS No known datasets at national scale
Only integrated sample which can be linked to vegetation and land management
Value for money (Policy priority or interpretative value x cost)
Medium High policy and interpretative value medium cost
522 Analytical method
An extra soil core was taken in 2007 in addition to those taken in previous surveys for mineralisable N analyses A 15 cm long by 5 cm diameter plastic pipe was knocked into the ground to obtain this core according to the detailed field protocol set out in (Emmett et al 2008 Chapter 1) Once extracted and logged the long white cores were returned by mail to CEH Bangor Cores were stored at 4
oC until a
sufficient number had been received for an analytical batch
The lab protocol is set out in detail in (Emmett et al 2008) In short the plastic sampling pipe was split open
and the intact soil core laid on a perforated rack The core was misted repeatedly with a solution with the
same concentrations of major ions as UK rain in 2007 as estimate d using the FRAME model (except with
zero N concentrations) until approximately 150 ml solution had passed through Suction was applied using a
vacuum line to drain larger pores of solution The core was wrapped in a thin plastic bag to restrict aeration
and incubated for four weeks at 10 oC After the full 4 week incubation period the core was carefully
homogenised and a subsample extracted using a 1-molar solution of potassium chloride (KCl) for analysis of
ammonium and nitrate content Mineralisable N was expressed in mg N kg dry soil
92
Countryside Survey Soils Report from 2007
5 Mineralisable-N
523 Quality assurance
Replicate cores were not available but replicate subsamples were taken after incubation for KCl extraction and analysis from two cores per batch of approximately 30 samples Two standard re ference soils (CEH Bangor Reference Soils 1 and 2) were also analysed per batch Several steps were taken to minimise potential artefacts by standardising sample collection flushing incubation and analysis Initial mineral contents were standardised by f lushing with a minus-N solution A standard amount of solution was passed through each core This took less time for coarse -textured soils than for fine clay and peat soils To standardise temperature conditions during the flushing step all cores were retained in the flushing room at 4
oC for the same length of time
Incubation took place under standard conditions of temperature and aeration and for a standard time
The duplicate analyses undertaken on replicate subsamples were very consistent for nitr ate (R2 = 98 ) but
not as good for ammonium (R2 = 63 ) (Fig 51) Since duplicate samples were only separated during
subsampling after incubation the likely cause of this inconsistency was the incomplete homogenisation of
cores before subsampling The effect was worse for ammonium presumably due to localised production of
ammonium in anaerobic microsites together with lower rates of diffusion for ammonium ions than for the more
weakly-adsorbed nitrate ions
Figure 51 Consistency of ammonium and nitrate analyses between duplicate subsamples
NO3
0
001
002
003
004
005
0 001 002 003 004 005
Duplicate 1 nitrate concentration mg NO3-N
g dry soil
Du
plicate
1 n
itra
te c
on
cen
trati
on
mg
NO
3-N
g
dry
so
il
NH4
0
001
002
003
004
005
0 001 002 003 004 005
Duplicate 2 ammonium concentration mg
NH4-N g dry soil
Du
plicate
1 a
mm
on
ium
co
ncen
trati
on
m
g N
H4-N
g
dry
so
il
Analyses of reference samples showed some variation between batches but there was no evidence of systematic bias (Fig 52) The coefficient of variation (cv) for nitrate was somewhat greater for the low -N BS2 standard (15) than for the high-N BS1 standard (9) The cv for ammonium was similar (12) for the low-N and high-N standards
93
Countryside Survey Soils Report from 2007
5 Mineralisable-N
Figure 52 Nitrate (a amp c) and ammonium (b amp d) contents in high-N (BS1 a amp b) and low-N (BS2 c amp d)
reference soils included with sample batches during CS in 2007 mineralisable N analyses
a) b)
BS1 NO3-N
0
50
100
150
200
250
300
350
400
17607 6807 25907 141107 3108 22208
Date
BS1 NH4-N
0
50
100
150
200
250
17607 6807 25907 141107 3108 22208
Date
c) d)
BS2 NO3-N
0
1
2
3
4
5
6
17607 6807 25907 141107 3108 22208
Date
BS2 NH4-N
0
5
10
15
20
25
30
35
40
45
50
17607 6807 25907 141107 3108 22208
Date
Taken overall the QC data suggest that nitrate-N and total mineral N are more consistent than ammonium -N
524 Reporting
Soil mineralisable N data have been analysed to provide information on the state of mineralisable N in 2007
The data in this Report describe mineralisable N concentration in 2007 in dry soil and in soil organic matter
mineralisable N stock (ie amount per hectare) and nitrate proportion of mineralisable N (all measured in
soil from 0-15 cm depth) categorised by Broad Habitat Aggregate Vegetation Class (AVC) and soil type (LOI
class) Concentrations in organic matter were obtained using the primary loss -on-ignition value recorded for
the plot in 2007 ie from a core taken adjacent to the core used for mineralisable N analyses In summary
reporting categories are defined as
Broad Habitat - The Broad Habitat classification consists of 27 habitats which account for the entire
land surface of Great Britain and the surrounding sea Countryside Survey reports on soils for 10
major terrestrial habitats
Aggregate Vegetation Class (AVC) ndash is a high level grouping of vegetation types produced from a
quantitative hierarchical classification of the different plant species found in the original Countryside
Survey sample plots Loss on ignition (LOI) category ndash soil type based on soil organic matter content defined as mineral (0 -
8 LOI 0-44 g C kg-1
) humus-mineral (8 ndash 30 LOI 44-165 g C kg-1
) organo-mineral (30 ndash 60
LOI 165-330 g C kg-1
) and organic (60 ndash 100 gt 330 g C kg-1
)
94
Countryside Survey Soils Report from 2007
5 Mineralisable-N
Mineralisable N was not measured in previous surveys so no results regarding change can be presented
Log-transformed data were analysed by REML using the mixed models procedure of SAS (SAS Institute
2006) Back-transformed means and standard errors are presented Significant results relate to statistical
significance with their ecological and policy relevance highlighted where appropriate More details can be
found in Emmett et al (2008) Annex F
The data for mineralisable N concentration in soil and in organic matter and for nitrate proportions were
mapped using kriging to interpolate between the Countryside Survey sample points Routine checking of data
for outliers was conducted and the working dataset was transformed using a normal score procedure to
obtain a Gaussian distribution The data were then interpolated on a 1km UK grid using ordinary kriging and
finally the kriged data were back-transformed to produce interpolated maps In addition sequential Gaussian
simulation (SGs) was conducted on the data to obtain the E-type estimate (mean) and the spatial uncertainty
for the data (conditional variance) The coefficient of variation CV (standard devia tion mean) is reported
53 Results
531 Total mineralisable N concentration in soil
The log-average concentration of mineralisable N measured across all British soils was 102 mg N kg dry soil The distributions of mineralisable N concentration by Broad Habitat AVC and LOI class are shown in Fig 53 The greatest concentrations were found in the Lowland Woodland AVC and the aggregation by Broad Habitat suggests that concentrations were high in both Coniferous and BroadleafMixedYew Woodland Similar concentrations were found in the Fertile Grassland and Infertile Grassland AVCs but the greater disaggregation in the Broad Habitat data allows a difference between infertile grassland types to be distinguished with lower concentrations of minera lisable N in Neutral Grassland than in Acid Grassland (P lt 005) There was a clear increase in mineralisable N concentration with the organic matter content of the soil as illustrated by the differences in mean concentration among loss -on-ignition classes
Mean mineralisable N concentrations across all habitat types were not significantly different among England Scotland and Wales Where more than 20 mineralisable N analyses were available for a Broad Habitat within a country mean concentrations were derived (Table 52) Comparisons across countries are only possible for a limited set of Broad Habitats Mineralisable N concentrations were similar ( P gt 005) in England and Scotland for Arable and Horticulture and for Neutral Grassland Concentrations i n Improved Grassland were similar in all three countries
95
Countryside Survey Soils Report from 2007
5 Mineralisable-N
Figure 53 Mean (+- one standard error) mineralisable nitrogen concentration (mg per kg dry soil) in soil (0 -15
cm depth) within a) Broad Habitats b) Aggregate Vegetation Classes and c) Soil Loss-on-ignition categories
across Britain Analyses were on log-transformed data means and error bars back-transformed to the original
scale
a) Broad Habitats b) Aggregate Vegetation Classes
c) LOI categories
96
Countryside Survey Soils Report from 2007
5 Mineralisable-N
Table 52 Mineralisable N concentrations (mg N kg dry soil) in soils (0-15 cm depth) across all habitats and in
selected Broad Habitats in England Scotland and Wales
a) England
Mean total mineralisable N (mg N kg dry
soil)
Broad Habitat 2007
Broadleaved Mixed and Yew Woodland 160
Arable and Horticulture 83
Improved Grassland 101
Neutral Grassland 69
All habitat types 98
b) Scotland
Mean total mineralisable N (mg N kg dry
soil)
Broad Habitat 2007
Coniferous Woodland 127
Arable and Horticulture 108
Improved Grassland 101
Neutral Grassland 85
Acid Grassland 113
Dwarf Shrub Heath 76
Bog 115
All habitat types 104
c) Wales
Mean total mineralisable N (mg N kg dry
soil)
Broad Habitat 2007
Improved Grassland 100
All habitat types 112
97
Countryside Survey Soils Report from 2007
5 Mineralisable-N
532 Total mineralisable N concentration in soil organic matter
The log-average concentration of mineralisable N in organic matter measured across all British soils was 76 mg N kg loss-on-ignition The distributions of mineralisable N concentration in soil organic matter by Broad Habitat Aggregate Vegetation Class and soil loss -on-ignition class are shown in Figure 54 Differences in mineralisable N concentration in organic matter among Broad Habitats Aggregate Vegetation Classes and loss-on-ignition categories are clearly distinguishable compared with differences in concentrations in soil (Fig 54) Mineralisable N concentration in organic matter was greater in habitats with fertiliser inputs andor fast litter turnover (eg Broadleaved Mixed and Yew Woodland and Arable and Horticulture Broad Habitats or Lowland Woodland and Crops and Weeds AVCs) than in habitats receiving little or no fertiliser input and with impeded litter turnover (eg Dwarf Shrub Heath and Bog Broad Habitats or the Heath and Bog AVC) This measurement distinguished mineralisable N concentrations in organic matter in different grassland AVCs with greater concentrations in Fertile Grassland than in Infertile Grassland In contrast to concentration in dry soil the Neutral Grassland Broad Habitat had greater concentrations of mineralisable N in organic matter than did Acid Grassland (P lt 001) Concentrations in organic matter in Neutral Grassland and Improved Grassland Broad Habitats were similar (P gt 001)
Figure 54 Mean (+- one standard error) mineralisable nitrogen concentration in soil organic matter (mg N kg
loss-on-ignition) in soils (0-15 cm depth) within a) Broad Habitats b) Aggregate Vegetation Classes and c) Soil
Loss-on-ignition categories across Britain Analyses were on log-transformed data means and error bars back-
transformed to the original scale
a) Broad Habitats b) Aggregate Vegetation Classes c) LOI categories
98
Countryside Survey Soils Report from 2007
5 Mineralisable-N
Mean mineralisable N concentrations in organic matter across all habitat types were lower in Wales than in England (P lt 005) and lower in Scotland than in Wales (P lt 005) Where more than 20 mineralisable N analyses were available for a Broad Habitat within a country mean conce ntrations were derived (Table 53) Comparisons across countries are only possible for a limited set of Broad Habitats As with concentrations in soil mineralisable N concentrations in organic matter were similar ( P gt 005) in England and Scotland for Arable and Horticulture and for Neutral Grassland and concentrations in Improved Grassland were similar (P gt 005) in all three countries
Table 53 Mineralisable N concentrations in soil organic matter (mg kg loss-on-ignition) in soils (0-15 cm
depth) across all habitats and in selected Broad Habitats in England Scotland and Wales
a) England
Mean total mineralisable N (mg N kg loss-
on-ignition)
Broad Habitat 2007
Broadleaved Mixed and Yew Woodland 1491
Arable and Horticulture 1893
Improved Grassland 1181
Neutral Grassland 860
All habitat types 1265
b) Scotland
Mean total mineralisable N (mg N kg loss-
on-ignition)
Broad Habitat 2007
Dwarf Shrub Heath 156
Bog 160
Coniferous Woodland 580
Arable and Horticulture 1974
Improved Grassland 1214
Neutral Grassland 1007
Acid Grassland 275
All habitat types 412
c) Wales
Mean total mineralisable N (mg N kg loss-
on-ignition)
Broad Habitat 2007
Improved Grassland 1105
All habitat types 914
99
Countryside Survey Soils Report from 2007
5 Mineralisable-N
533 Total mineralisable N stock
The log-average mineralisable N stock measured across all British soils was 88 kg ha
-1 in 0-15 cm depth
soil The distributions mineralisable N stock by Broad Habitat Aggregate Vegetation Class and soil loss -on-ignition class are shown in Figure 55 The measurement distinguished soils and habitats that are considered fertile from those considered infertile more clearly than mineralisable N concentrations in soil and arguably more clearly than mineralisable N concentrations in soil organic matter Broad Habitats such as Arable and Horticulture and Improved Grassland had consistently large mineralisable N stocks and Bog and Dwarf Shrub Heath had consistently large stocks but the stocks in Fen Marsh and Swamp Broad Habitats were more variable Coniferous and Broadleaf Mixed and Yew Woodland Broad Habitats had similar mineralisable N stocks but the Lowland Woodland AVC had significantly greater stocks than the Upland Woodland AVC Mineralisable N stocks were similar in the 0-8 and 8-30 loss-on-ignition categories but smaller in the 30-60 loss-on-ignition category (P lt 005) and still smaller in the 60-100 loss-on-ignition category (P lt 005)
Figure 55 Mean (+- one standard error) stock of total mineralisable nitrogen (kg N ha-1) in the top 15 cm of
soil within a) Broad Habitats b) Aggregate Vegetation Classes and c) Soil Loss -on-ignition categories across
Britain
a) Broad Habitats b) Aggregate Vegetation Classes c) LOI categories
Mean mineralisable N stocks in 0-15 cm depth soil across all habitat types were lower in Scotland than in England or Wales (P lt 005) Where more than 20 mineralisable N analyses were available for a Broad Habitat within a country mean concentrations were derived (Table 54) As with concentrations in soil and in
100
Countryside Survey Soils Report from 2007
5 Mineralisable-N
soil organic matter mineralisable N stocks were similar (P gt 005) in England and Scotland for Arable and Horticulture and for Neutral Grassland and stocks in Improved Grassland were simi lar (P gt 005) in all three countries Table 54 Mean (+- one standard error) stock of total mineralisable nitrogen (kg N ha-1) in the top 15 cm of soil
across all habitats and in selected Broad Habitats in England Scotland and Wales
a) England
Mean total mineralisable N stock
(kg N ha in 0-15 cm soil)
Broad Habitat 2007
Broadleaved Mixed and Yew Woodland 187
Arable and Horticulture 153
Improved Grassland 146
Neutral Grassland 101
All habitat types 137
b) Scotland
Mean total mineralisable N stock
(kg N ha in 0-15 cm soil)
Broad Habitat 2007
Coniferous Woodland 72
Arable and Horticulture 172
Improved Grassland 143
Neutral Grassland 111
Acid Grassland 39
Dwarf Shrub Heath 26
Bog 22
All habitat types 52
c) Wales
Mean total mineralisable N stock
(kg N ha in 0-15 cm soil)
Broad Habitat 2007
Improved Grassland 140
All habitat types 114
534 Nitrate proportion of mineralisable N
The mean proportion of nitrate in total mineralisable N measured across all British soils was 052 g NO3-N g
-1
total mineralisable N and there was considerable variation in nitrate proportion among Broad Habitats Aggregate Vegetation Classes and soil loss-on-ignition classes (Fig 56) There was no overall correlation of nitrate proportion with mineral N concentration in soil (P gt 005) but nitrate proportion was correlated with mineral N concentration in soil organic matter (c = 039 P lt 005) The pattern of mean nitrate proportion among vegetation and soil classes was similar to the pattern of mineral N concentration in soil organic
101
Countryside Survey Soils Report from 2007
5 Mineralisable-N
matter with the greatest proportions of nitrate in the Arable and Horticulture Broad Habitat and the Crops and Weeds AVC and small nitrate proportions in less fertile habitats such as B og Acid Grassland and Dwarf Shrub Heath The nitrate proportion could also be clearly related to soil organic matter content with the lowest nitrate proportion in the soil category with greatest loss -on-ignition
Figure 56 Mean (+- one standard error) nitrate proportion of total mineralisable nitrogen in soils (0 -15 cm
depth) within a) Broad Habitats b) Aggregate Vegetation Classes and c) Soil Loss -on-ignition categories
across Britain
a) Broad Habitats b) Aggregate Vegetation Classes c) LOI categories
Mean nitrate proportions across all habitat types were similar in England and Wales ( P gt 005) and lower in Scotland than in either country (P lt 005) (Table 55) Where more than 20 mineralisable N analyses were available for a Broad Habitat within a country mean concentrations were derived Comparisons across countries are only possible for a limited set of Broad Habitats As with total mineralisable N concentrations in soil and in organic matter nitrate proportions were similar (P gt 005) in England and Scotland for Arable and Horticulture and for Neutral Grassland and nitrate proportions in Improved Grassland were similar ( P gt 005) in all three countries
102
Countryside Survey Soils Report from 2007
5 Mineralisable-N
Table 55 Nitrate proportion of total mineralisable nitrogen in soils (0-15 cm depth) across all habitats and in
selected Broad Habitats in England Scotland and Wales
a) England
Mean nitrate proportion of mineralisable N
Broad Habitat 2007
Broadleaved Mixed and Yew Woodland 067
Arable and Horticulture 087
Improved Grassland 068
Neutral Grassland 054
All habitat types 069
b) Scotland
Mean nitrate proportion of mineralisable N
Broad Habitat 2007
Coniferous Woodland 030
Arable and Horticulture 088
Improved Grassland 060
Neutral Grassland 050
Acid Grassland 011
Dwarf Shrub Heath 031
Bog 019
All habitat types 037
c) Wales
Mean nitrate proportion of mineralisable N
Broad Habitat 2007
Improved Grassland 057
All habitat types 057
535 Spatial distributions of measured properties
High concentrations of mineralisable N in soil were found in several areas of Britain (Fig 571a amp b) This pattern is difficult to interpret but is perhaps due to the combined effects of greater organic matter conte nts in some areas (and hence a greater total N pool some of which is available for mineralisation) and a history of greater N deposition in the same or other areas By contrast high concentrations of mineralisable N in organic matter (Fig 572a amp b) appear more related to management practices and concentrations of N deposition in particular in areas with more mineral soils There was less small-scale variation in the proportion of nitrate in mineralisable N (Fig 573a amp b) with low proportions in the north and west of Scotland and greater proportions in eastern Britain in particular in central England suggesting links to spatial drivers at large scale such as soil moisture deficit soil pH andor N fertiliser application rate
103
Countryside Survey Soils Report from 2007
5 Mineralisable-N
Figure 57 Maps of a) kriged values and b) coefficients of variation for 1) total mineralisable N (mg N kg-1
soil)
2) total mineralisable N concentration in organic matter (mg N kg-1
loss-on-ignition) and 3) nitrate proportion of
total mineralisable N
a) b)
1)
2)
3)
104
Countryside Survey Soils Report from 2007
5 Mineralisable-N
536 Mineralisable N as an indicator of floristic change
To assess the effectiveness of mineralisable N data as an indicator of eutrophication it will be necessary to analyse the data in relation to other soil measurements and species occurrence data which is beyond the scope of this report Some results are presented here from a pilot study conducted in 2006 as a trial of the mineralisable N method for CS in 2007 All UK plant species have been assigned ldquoEllenberg Nrdquo scores which indicate whether they are likely to occur on high- or low-fertility sites A key test of potential soil indicators of eutrophication is whether they are associated with mean Ellenberg N score A PCA plot of results from the pilot study (Fig 58) demonstrates clearly that mean Ellenberg N is most closely associated with bulk soil properties ndash for example the vector for Ellenberg N has a small angle with NC ratio The position of the NC ratio vector opposite that for moisture shows that these are strongly b ut inversely related This reflects the overall tendency for low-fertility plant communities to occur on organic soils with low NC ratios and high moisture contents The explanatory power of mineralisable N is also considerable as shown by the length of this vector and its position shows that the variation explained by mineralisable N is orthogonal to that explained by total soil NC In other words mineralisable N describes variation in mean Ellenberg N that is not explained by bulk soil properties implying that it is detecting a shorter -term enrichment signal or different soil or vegetation types This is borne out by the considerable increase in proportion of the variance in Ellenberg N that is explained by moving from a regression model using only m oisture content (R
2 = 50) to a
model using both moisture content and mineralisable N (R2 = 70) (Rowe et al in prep Emmett et al 2008)
Figure 58 Ordination of measurements from the Countryside Survey pilot study in 2006 on first and second
principal components of the variation EllenbergN = mean fertility indicator score for plant species present
Nminpot = total N mineralised during a four-week incubation NC = total soil N total soil C pH = soil pH in
water Moisture = g water g-1
fresh soil
-03 -02 -01 00 01 02 03
-03
-02
-01
00
01
02
03
PC1
PC
2
1
2
3
4
5
6
7
8
9
10
11
12
13
14
15
16
17
18
19
20
21
22
2324
25
26
27
28
29
30
31
32
33
34
35
36 37
38
39
40
4142
4344
45
-5 0 5
-50
5
EllenbergN
Nminpot
NC
pH
Moisture
105
Countryside Survey Soils Report from 2007
5 Mineralisable-N
54 Discussion
Net N mineralisation and nitrification result directly in increased exposure of plants to N and increased N
leaching so the mineralisable N results are indicators of N pollution pressure in the sense of a direct cause
of loss of biodiversity and of water quality The results also provide indicators of the state of the soil
ecosystem in that net N mineralisation is likely to increase as the capacity of the soil organic matter pool to
buffer N pollution is depleted These indicators wil l be useful to discriminate which components of the loss of
biodiversity and water quality are due to N pollution The results will also be used to improve understanding
of soil and vegetation processes in particular habitats and improve models of water q uality and biodiversity
change Measurements at a single point in time do not allow direct assessments of change in mineralisable N
or nitrate proportion but a repetition of the measurements would provide evidence for increased damage or
recovery from N pollution The measurements also enable some assessment of nutrient cycling in different
ecosystems as required for the National Ecosystem Assessment It should be noted that an increase in
mineralisable-N would be considered a negative indicator for semi-natural ecosystems and a positive
indicator for intensively managed productive systems
The different measurements included in CS in 2007 allow a choice of the variable used to express mineralisable N Total mineralisable N concentrations in soil are re lated to the quantity of the substrate so mineralisable N concentration in soil is most clearly related to organic matter content (Fig 53) The high mineralisable N concentrations in soil in the Lowland Woodland AVC may be explained in that Lowland Woodland tends to occur on mineral soils but could also be the result of increased interception of N pollutants by woodland or alternatively a greater proportion of labile N in woodland plant litter Mineralisable N concentration in organic matter is more directly relevant to underlying processes since the N available per unit carbon reflects the value of the organic matter as a source of N for decomposers Indeed this variable appears to more clearly reflect the overall fertility of habitats with large concentrations in the Arable and Horticulture and Improved Grassland Broad Habitats as well as in Broadleaved Mixed and Yew Woodland This reflects the improved quality of the soil organic matter due to fertilisation tillage and presence of crops with high litter quality and confirms the sensitivity of the assay to known differences in soil nitrogen availability for plants In contrast to mineralisable N concentration in soil there was a clear lower concentration in organic matter on more organic soils which reflects the known increase in N limitation as soils become more organic Thus whilst Broad Habitats such as Bog and Dwarf Shrub Heath are associated with high soil organic matter contents they are generally N-limited as this organic matter contains relatively little net mineralisable N
The stock of mineralisable N (ie the amount in a given volume of soil) also clearly reflected the overall
fertility of habitats Unlike concentrations in soil or in soil organic matter which are more relevant for mineral
and organic soils respectively stock is a measure of mineralisable N within a consistent soil volume This
reflects N availability within the rooting zone and so more closely represents plant -available N across a
variety of habitats
To establish evidence of change in mineralisable N and thus of deposition -driven changes in soil processes likely to affect plant species composition it will be necessary to analyse these data in combination with a range of external datasets such as pollutant load grazing pressure climate drivers which may affect the spatial trends observed This work is ongoing and will be reported in the CS Integrated Assessment report later in 2010
The proportion of nitrate in mineralisable N is known to be affected by aer ation during the incubation The
texture of the soil on fine scales (eg clay silt and sand fractions or degree of humification of organic
matter) and medium scales (eg porosity and aggregation) will affect the diffusion of air into the soil core
Both organic and mineral soils can vary considerably in porosity and hence the increase in nitrate proportion
with decreasing organic matter content cannot be clearly related to soil texture effects Nitrification rates may
also indicate the size of the nitr ifying bacteria population and hence greater nitrate proportions may be
related to a history of elevated N inputs The clear spatial effect on nitrate proportion (Fig 56) implies that
large scale drivers affect nitrate proportion more than soil texture which varies at a smaller scale These
106
Countryside Survey Soils Report from 2007
5 Mineralisable-N
large scale drivers may include climate pollutant load soil pH and N fertiliser application rate which all vary
from NW to SE Britain in ways that are consistent with the spatial pattern of nitrate proportion Fur ther
analyses of nitrate proportion in relation to site-specific total N deposition history loads of pollutant and
fertiliser NOx and NHy and soil and habitat properties will provide more insights into the processes governing
nitrate proportion and will be reported in the Integrated Assessment These analyses will also inform whether
nitrate proportion is of value as a pressure or state indicator
As well as aiding the development of understanding and models of biogeochemical processes the
mineralisable N results will be useful to explain patterns of floristic change Results from the CS in 2007 pilot
study indicate that mineralisable N explains changes in plant species composition (specifically mean
Ellenberg N score) that cannot be explained by bulk soil properties such as total N or CN ratio (Fig 57)
This will considerably reduce uncertainty in model chains used by the UNECE -CCE to predict floristic change
resulting from N deposition The result is consistent with the understanding from soil proc ess ecology that a
large and habitat-specific fraction of the soil N pool is effectively inert with plant N supply being governed by
the turnover of the more labile organic matter pools The nitrate proportion in mineralisable N may also be a
useful predictor of floristic change (Diekmann and Falkengren-Grerup 1998) for example because plants
typical of lower-fertility habitats are not adapted for nitrate uptake
In conclusion the new measurements of mineralisable N provide a wealth of information useful for
developing science and policy around the ecosystem impacts of N pollution The measurements define a
fraction of the soil N pool that is available to be taken up by plants efficiently andor leached and thus
provide a sensitive indicator of N pollution and ecosystem saturation Soils buffer N pollution particularly
when CN ratios are high and there are large stocks of labile C so N pollutant loads cannot be directly
related to impacts relevant to water quality and biodiversity conservation objectives The measurements will
provide test data for biophysical models of soil change and will also allow improved paramet erisation of
models predicting plant species occurrence and biodiversity change Mineralisable N measurements will
decrease uncertainty associated with linking these two classes of models and thus improve predictions of
biodiversity responses to N pollutant load Future analyses will separate out the inherent variability
associated with climate vegetation and soil type to identify spatial patterns which can be linked to
atmospheric deposition and changes in management
55 Policy Implications
The new national scale mineralisable N measurements will allow
Separation of the effects of N pollution on biodiversity and water quality from effects of other drivers
Assessment of the relative impact of N deposition on different soils and habitats
Improved forecasts of changes in water quality and biodiversity in relation to N deposition rate for use in calculating critical loads under the UNECE Convention on Long -Range Transboundary Air Pollution (CLRTAP)
107
Countryside Survey Soils Report from 2007
5 Mineralisable-N
56 References
Bengtson P Falkengren-Grerup U Bengtsson G 2006 Spatial distributions of plants and gross N
transformation rates in a forest soil Journal of Ecology 94 754-764
Braithwaite ME Ellis RW Preston CD 2006 Change in the British Flora 1987-2004 Botanical Society
of the British Isles
Diekmann M Falkengren-Grerup U 1998 A new species index for forest vascular plants development of
functional indices based on mineralization rates of various forms of soil nitrogen Journal of Ecology 86 269-
283
Dyck W Mees C Hodgkiss P 1987 Nitrogen availability and comparison to uptake in two New Zealand
Pinus radiata forests New Zealand Journal of Forest Science 17 338ndash352
Emmett BA Frogbrook ZL Chamberlain PM Griffiths R Pickup R Poskitt J Reynolds B Rowe
E Spurgeon D Rowland P Wilson J Wood CM 2008 CS Technical Report No 307 Soils Manual
NERCCentre for Ecology amp Hydrology 180 pp (CEH Project Number C03259)
Fierer N Schimel J Cates R Zou J 2001 The influence of balsam poplar tannin fractions on carbon
and nitrogen dynamics in Alaskan taiga floodplain soils Soil Biology and Biochemistry 33 1827ndash1839
Keeney DR 1980 Prediction of soil nitrogen availability in forest ecosy stems a review Forest Science
26 159-171
Maskell LC Smart SM Bullock JM Thompson K Stevens CJ 2010 Nitrogen deposition causes
widespread loss of species richness in British habitats Global Change Biology 16 671ndash679
Miller AE Bowman WD 2003 Alpine plants show species-level differences in the uptake of organic and
inorganic nitrogen Plant and Soil 250 283-292
Raison RJ Connell MJ Khanna PK 1987 Methodology for studying fluxes of soil mineral -N in situ
Soil Biology amp Biochemistry 19 521-530
Rowe EC Emmett BA Smart SM Frogbrook ZL in prep A single -extraction mineralisable nitrogen
assay improves predictions of floristic composition Journal of Vegetation Science
SAS Institute 2006 SAS Enterprise Guide 41
Schimel JP Bennett J 2004 Nitrogen mineralization Challenges of a changing paradigm Ecology 85
591-602
UNECE 2004 The condition of forests in Europe 2004 executive report 51 pp
Wamelink GWW Joosten V van Dobben HF Berendse F 2002 Validity of Ellenberg indicator values
judged from physico-chemical field measurements Journal of Vegetation Science 13 269-278
Waring SA Bremner JM 1964 Ammonium production in soil under waterlogged con ditions as an index of
nitrogen availability Nature 104 951-952
108
Countryside Survey Soils Report from 2007
6 Olsen-P
Summary
Mean Olsen-P concentrations in soil (0-15cm) is an index of the fertility of agricultural soils It‟s
use and relevance in semi-natural and organic soils is less certain Soils collected during
Countryside Survey in 1998 and 2007 indicated there had been a significant decrease in Olsen -P
concentrations in soil (0-15cm) in most Broad Habitats or Aggregate Vegetation Classes across
Great Britain and within individual countries
Olsen-P concentrations in soil (0-15cm) decreased significantly in all soil organic matter categories
across Great Britain and within individual countries between 1998 and 2007 apart from humus -
mineral soils in Scotland where no change was observed
The data do not confirm a trend of increasing P status in intensive grasslands or any other habitat
soils (0-15cm) but indicate a loss of available phosphorus between 1998 and 2007 across a wide
range of habitats and soil types This is likely to be linked to the large reductions in phosphorus
fertiliser use over the same period
61 Introduction
Key question Can the trend of increasing P status in intensive grasslands be confirmed and is it matched in
other habitats
Measurements Repeat measurement of Olsen-P concentrations in soils (0-15 cm) from all plots sampled in
1998
Olsen-P (Olsen et al 1954) has been widely used in England and Wales to assess the fertility of agricultural
soils (MAFF 2000) It was also measured as an integral part of several natio nal soil monitoring schemes
including the Representative Soil Sampling Scheme (RSSS Archer et al 2003) the National Soil Inventory
(NSI McGrath and Loveland 1992) the Environmental Change Network (ECN Morecroft et al 2009) and the
Soil Geochemical Atlas of Northern Ireland (Emmett et al 2008) Olsen-P has also been used in conjunction
with the phosphorus sorption index to provide an index of the leaching risk of dissolved P from soils to
freshwaters (Hughes et al 2001) In the UK Olsen-P has been recommended as an indicator for
environmental interactions between the soil and other linked ecosystems such as freshwaters (Black et al
2008)
Olsen-P was measured in soils taken from the 256 bdquosoil squares‟ during CS in 1998 but the samples were not
analysed until 2002 or reported in the Monitoring and Assessing Soil Quality (MASQ) report (Black et al
2000) although they are held on the CS databaseThe data were not included in the Defra funded study
which examined the comparability of soil properties measured by different surveys and monitoring schemes
where it was erroneously reported that total -P was measured in CS in 1998 (Bradley et al 2003)
611 Choice of Olsen-P in 2007
A wide range of extractants have been used to measure the more soluble weakly bound or bdquoavailable‟ forms
of phosphorus in soils Some of the more commonly used extractants include 1 citric acid 25 acetic
acid dilute buffered sulphuric acid (Truog‟s reagent) acetic acid -sodium acetate buffer (Morgan‟s reagent)
and sodium bicarbonate buffered at pH 85 (Olsen-P) There has been a long standing debate as to the most
appropriate measure of soil available-P in relation to soil type Olsen-P has been favoured for limed fertilised
agricultural soils and semi-natural ecosystems on base rich or circum-neutral soils whilst acid extractions are
considered to be more appropriate for the more acidic soils found in many semi -natural and woodland
ecosystems Numerous studies have compared the performance of the different test s with each other with
plant response and with other factors (see eg Allen 1989 Foy et al 1997 and discussion in Emmett et al
109
Countryside Survey Soils Report from 2007
6 Olsen-P
2008) The evidence so far from these and other studies reported in the literature suggests that it is unlikely
that a simple robust relationship can be established between Olsen-P and other extractants A study
comparing Olsen-P data from two different surveys the Representative Soil Sampling Scheme (RSSS) and
the National Soil Inventory (NSI) concluded that where the same analytical method had been used the data
for phosphorus were entirely comparable (Bradley et al 2003)
The literature indicates that no one extractant is ideal for use across the range of soil fertility and pH
gradients encountered in Countryside Survey Thus one option considered for CS in 2007 was to use more
than one extractant with the choice being determined by the characteristics of each soil sample For example
an acid extractant for semi-natural acidic low fertility soils and Olsen-P for more base-rich fertile soils This
would have made the data very hard to interpret particularly in relation to changes since CS in 1998 and for
those soils with bdquointermediate‟ characteristics where the choice of extractant was not clear Furthermore to
maximise the use of pre-existing 1998 data it would be hard to justify using another extractant even though
Olsen-P might not be ideal across the range of soil conditions encountered in Countryside Survey Bearing
these factors in mind the decision was made to measure Olsen-P in 2007
612 Deliverables for 2007
CS in 2007 has provided the following deliverables
Whole GB and country-level assessment of soil available-P status in 2007
GB-level assessment of change in soil available-P status between Countryside Survey in 1998 and
Countryside Survey in 2007
Explanatory data to contribute to the analysis of other Countryside Survey datasets such as those
describing changes in vegetation species and the trophic status of freshwaters
The Olsen-P data collected in 2007 can also contribute to the assessment of Broad and Priority Habitat
condition in relation to soil fertility and the data will provide a baseline assessment for a recommended UK
soil indicator The rationale for including Olsen-P within the Countryside Survey measurement suite is
summarised in Table 61
Table 61 Rationale for measurement Olsen-P
Issue Facts Comments
History in Countryside Survey Olsen-P measured on samples from 256 squares in CS in 1998
Olsen-P used as a measure of available-P
Links and compatibility to other monitoring programmes
NSI and RSSS used Olsen-P as a measure of available-P to the same depth (0-15 cm) as Countryside Survey
Defra project SP0515 concluded that measurements were comparable between NSI and RSSS
Uniqueness of CS There was a partial resurvey of the NSI in 2003 RSSS has data reported to 2001 Soil pH was measured at many ECN sites in 1998 and 2003 Unique combination of soil vegetation amp land use measured together
High interpretative value for i) terrestrial vegetation species change in response to fertility in combination with soil nitrogen ii) trophic status of linked freshwaters
Value for money (Policy priority or interpretative value X cost)
Recommended UK soil indicator for environmental interaction cheap simple measurement High value for money
Measurement will be made on bdquoblack core‟ soil sample used for pH amp LOI core measurements
110
Countryside Survey Soils Report from 2007
6 Olsen-P
So far measures of soil available-P have not been included in models exploring the relationships between
vegetation species change recorded in CS in 1998 and soil nitrogen enrichment through atmospheric nitrogen
deposition However soil-P data are likely to have strong interpretative power in the analysis of model
simulations and predictions
62 Methods
The soil used for phosphorus analysis was taken from the bdquoblack core‟ and there were n o specific sampling
requirements beyond those normally employed for collecting the bdquoblack core‟ sample (See Chapter 1 amp
Emmett et al 2008 Annex 1)
A total of 1054 black cores were collected from the 5 Main Plots in the original 256 ldquosoilrdquo squares Air -dried
and sieved samples (lt2 mm) were analysed for Olsen-P at CEH in Lancaster in the autumn of 2008 following
the standard operating procedure (Emmett et al 2008) This involved extraction of 5 g of air-dried sieved
soil with 100 ml of 05M sodium bicarbonate at pH 85 The phosphorus in the extract was determined
colorimetrically using a continuous flow analyser The analyser method used molybdenum blue at 880nm with
the addition of a dialysis step to overcome the effect of the Olsen‟s reagent
Olsen-P is expressed in mgPkg dry soil Samples collected from 1998 were analysed in 2002 and those
from 2007 in 2008
621 Quality Assurance and Quality Control
The DefraNERCBBSRC Joint Codes of Practice were followed
A number of factors can contribute to errors in the analysis of Olsen -P and steps were taken to minimise
potential artefacts
Effect of drying ndash drying soil affects the release of phosphorus with enhancements of up to 30 possible
from drying at 40 ordmC (Jackson 1958) The effect varies with soil type (Allen 1989) If field moist soil is
used larger quantities are recommended for the extraction (10 g to 100 ml for mineral soil and up to 25 g
to 100 ml for peats Allen 1989) Methodological consistency is very important Since the Olsen -P
measurements made on 1998 soils used air -dried soils the same procedure was used in 2007
Extraction temperature ndash the extraction is temperature sensitive and must be performed under constant
temperature conditions Extraction procedure and conditions were matched to those used for the analysis
of 1998 soils
Soilsolution ratio and extraction time ndash these may affect the amount of phosphorus extracted and a
consistent method should be employed The same standard operating procedure was used in 1998 and
2007
Effect of organic matter ndash the high pH of the Olsen-P extraction means that some organic matter is also
extracted Organic phosphorus is not measured by the molybenum blue method The wavelength used for
the molybdenum blue determination (880 nm) is a long way from any likely interference effects from
extracted humic acids
111
Countryside Survey Soils Report from 2007
6 Olsen-P
A replicate analysis two standard reference soils and one certified reference soil were ana lysed per batch of
25 samples The same standard reference soils were used in the analysis of samples from 1998 and 2007
providing a check on the consistency of the analyses between the two surveys
The results from the standard reference soils are summarised in Fig 61 Fig 62 and Table 62 For SR2
and SR3 the data show the expected variation around the mean value (Fig 61) A simple t-test showed that
the mean value of SR2 in 2008 (146 mgPkg) was significantly higher (plt0001) compared to the mean in
2002 (128 mgP kg) there was no significant difference between the mean values for SR3 Fewer values
outside the limits on the Shewhart charts and smaller coefficients of variation (Table 62) indicate that the
results for both standard reference soi ls were more consistent in 2008 compared to 2002
Figure 61 Shewhart Quality Control charts for CEH standard reference soils SR2 and SR3 analysed
with sample batches from CS in 1998 and 2007
SR3 - QC chartMean 184 mgP kg
-1 limits +- 2SD of mean
0
5
10
15
20
25
30
M11
675
M11
726
M11
735
M11
755
M11
799
M11
807
M11
813
M11
814
M12
269
EF67
1
EE71
6
EE85
2
EE86
0
EF00
1
EF77
0
Analytical batch number
Ols
en
-P m
gP
kg
-1
CS2000 data CS2007 data Mean Upper limit Lower limit
SR2 - QC chartMean 137 mgP kg
-1 limits +- 2SD of mean
0
5
10
15
20
25
30
M11
675
M11
726
M11
735
M11
755
M11
800
M11
808
M11
813
M11
841
M12
174
EF22
1
EE71
4
EE85
0
EE85
8
EE86
6
EF00
7
EF79
4
Analytical batch number
Ols
en
-P m
gP
kg
-1
CS2000 data CS2007 data Mean Upper limit Lower limit
1998
2007
1998
2000
112
Countryside Survey Soils Report from 2007
6 Olsen-P
Table 62 Mean values (mgPkg) and coefficients of variation (CV ) for the standard reference soils
analysed with samples from CS in 1998 and 2007
Standard reference soil SR2 SR3 ISE921
Mean 1998 (CV) 128 (24) 186 (17) 1055 (10)
Mean 2007 (CV) 146 (13) 177 (13) 1208 (2)
The mean and median values for the standard reference soil (Fig 62) are those obtained from data
submitted by all the laboratories participating in the scheme Unfortunately there is a limited stock of this
material at CEH Lancaster so that only four samples were analysed with the 2008 batches The Shewhart
chart (Fig 62) shows some expected variation but 84 of the points lie within the limit values The four
points at the end of the chart were produced during the 2008 analyses and are within the range of results
obtained in 2002 The 2008 mean value is somewhat higher (Table 62) but as only four samples of ISE921
were analysed with the 2008 batches this result must be interpreted with care
Figure 62 Shewhart QC chart for ISE standard reference soil ISE921 analysed with sample batches
from CS in 1998 and Countryside Survey 2007
The duplicate analyses undertaken within sample batches in 2002 and 2008 were very consistent with most
points falling on or close to the 11 line (Fig 63) The mean difference between duplicates was small in 2002
(-01 mgP g) and 2008 (06 mgPkg) Differences between duplicates were larger for samples with high
concentrations of Olsen-P
Taken overall the Quality Control data show strong consistency within and between the measurements made
in 2002 and 2008 and give little cause for concern regarding a comparison of Olsen -P data from 1998 and
2007 There is a suggestion that the results for the standard reference soils were m ore consistent in 2008
with higher mean values The values obtained in 2008 generally fall within the range measured in 2002 and
within acceptable limits on the Shewhart charts
ISE921 - QC chartISE median value 104 mgP kg
-1 Mean 107 mgP kg
-1 limits +- 2SD of mean
60
70
80
90
100
110
120
130
140
M11
678
M11
724R
M11
736
M11
750
M11
755
M11
776
M11
799
M11
802
M11
806
M11
737
M11
814
M11
776R
M11
816
M11
831
M11
867
M12
227
M12
269
EF28
9
EE80
3-4
Analytical batch number
Ols
en
-P
mg
P k
g-1
CS2000 CS2007 Median Mean Upper limit Lower limit1998
2007
113
Countryside Survey Soils Report from 2007
6 Olsen-P
Figure 63 Scatter plot of duplicate Olsen-P analyses from sample batches analysed in 2002 and 2008
622 Reporting
Soil Olsen-P data (0-15 cm) have been analysed to provide information on the state of Olsen -P in 2007 and
the change since 1998 The statistical approach used for analysing the data fo r change involved
bootstrapping which allows for non-normality in the data without the necessity of knowing details of the actual
distribution As such it provides a more accurate measurement of significance Annex F of Emmett et al
(2008) provides a background document describing this approach
The data in this report describe mean Olsen-P concentrations in soils (0-15 cm) in 2007 and change since
1998 by Broad Habitat Aggregate Vegetation Class (AVC) and Loss-on-Ignition (LOI) category LOI classes
are defined as mineral (0-44 g C kg-1
) humus-mineral (44-165 g C kg-1
) organo-mineral (165-330 g C kg-1
)
and organic (gt 330 g C kg-1
) To remove the effects of large-scale vegetation and or land use change mean
Olsen-P concentrations have also been estimated for plots where the AVC has not changed over time The
AVC is only known for the survey years and may change during intervening periods for example due to
arable-grassland rotation The plots where the AVC has not changed can be regarded as plots wh ere the
vegetation has been largely consistent in 1978 1998 and 2007
The soil Olsen-P concentrations were mapped using indicator kriging to interpolate between the Countryside
Survey sample points The use of indicator kriging rather than ordinary krig ing and spatial interpolation
arises because of the type of data being analyzed In the case of Olsen -P the assumption of connectivity
between sample points with extreme values in space is not valid For instance fertilizer applications in one
location may have no spatial link to those in another As a result ordinary kriging incorporating these
extreme values provides erroneous interpolation biased towards these extreme values Indicator kriging
provides a method of spatially interpreting the underlying patterns in the data without such a bias
interpolating the probability that the data falls above or below a given threshold Semi -variogram analysis
revealed a low level of spatial structure strongest at the threshold level of 18mgkg Full indicator k riging
0
40
80
120
160
200
0 40 80 120 160 200
Duplicate 1 Olsen-P mgP kg-1
Du
plicate
2 O
lsen
-P m
gP
kg
-1
CS2000 CS2007 1 1 line 1998
2007
114
Countryside Survey Soils Report from 2007
6 Olsen-P
was used to interpolate the probability of exceeding this threshold A probability of 1 or above indicates that
the data exceeds the specified threshold value at that location Data was interpolated onto a 1 km UK grid
63 Results
631 Structure of Olsen-P data
Olsen-P was measured in samples from 1068 plots in 2007 of which 65 were also sampled in 1998
Concentrations of Olsen-P measured in soils (0-15 cm) in 2007 ranged between 2 and 380 mgPkg Between
1998 and 2007 the proportion of samples containing 40 mgPkg Olsen-P or less increased from 64 to 76
whilst the proportion samples with greater than 80 mgPkg decreased from 12 to 75 Overall there was
evidence of a downward shift in Olsen-P concentrations across the entire range of values between 1998 and
2007 (Fig 64) The population of values in 1998 and 2007 was highly skewed There were no clear
relationships between change in Olsen-P concentration and 2007 values for soil pH LOI moisture content or
change in soil pH and LOI between 1998 and 2007
632 Change in mean Olsen-P concentration in soils (0-15cm) across Great Britain
The mean Olsen-P concentration in soil (0-15cm) across all Broad Habitat types in Great Britain decreased
from 43 mgPkg to 32 mgPkg or by 26 between 1998 and 2007 (Table 63a) This change was evident in
all individual Broad Habitats except Bracken (Fig 65) The magnitude of change varied between Broad
Habitats with the smallest significant decrease (11) measured in Arable which also had the hig hest mean
concentration of Olsen-P in 2007 (44 mgPkg) The biggest percentage decrease between the surveys (58)
occurred in Dwarf Shrub Heath which also contained the highest mean concentration of Olsen -P (56 mgPkg)
in 1998 The lowest mean concentration of Olsen-P (13 mgPkg) which did not change significantly between
surveys was measured in soils (0-15cm) beneath Bracken
There was a significant decrease in mean Olsen-P concentration between 1998 and 2007 across all AVCs
except for Lowland Woodland (Table 63b) The largest percentage decrease in mean values (51) was
observed in Moorland Grass Mosaics Heath and Bog had the highest mean concentration of Olsen -P in 1998
(52 mgPkg) Crops and Weeds showed the smallest percentage change between surve ys in Olsen-P (11)
this AVC had the highest mean Olsen-P concentration in 2007 (44 mgPkg)
115
Countryside Survey Soils Report from 2007
6 Olsen-P
Figure 64 Distribution of soil Olsen-P (0-15 cm) measurements a) Histogram for 1998 and 2007 b)
Cumulative frequency for 1998 and 2007 Histogram frequencies normalised to percentage of total
number of samples analysed in each survey
0
10
20
30
0 40 80 120 160 200 240 280 320 360
Olsen-P mgPkg
Fre
qu
en
cy
1998 2007
a)
0
25
50
75
100
0 50 100 150 200 250 300 350 400
Olsen-P mgPkg
Cu
mu
lati
ve f
req
ue
nc
y
1998 2007
b)
116
Countryside Survey Soils Report from 2007
6 Olsen-P
Table 63 Change in mean Olsen-P concentration of soils (0-15 cm) across Great Britain for a) Broad
Habitats b) Aggregate Vegetation Classes (AVC) c) AVCs unchanged since 1978 and d) LOI
categories Arrows denote a significant change (plt005) in the direction shown
a) Great Britain - Broad Habitat
Broad Habitats
Mean Olsen-P (mgPkg) Direction of significant
changes
1998 2007 1998 - 2007
Broadleaved Mixed and
Yew Woodland
404 238
Coniferous Woodland 364 274
Arable and Horticulture 496 442
Improved Grassland 405 329
Neutral Grassland 306 245
Acid Grassland 464 211
Bracken 173 130
Dwarf Shrub Heath 560 236
Fen Marsh Swamp 275 194
Bog 533 384
All Habitat Types 428 318
b) Great Britain ndash AVC whole dataset
Aggregate Vegetation
Class
Mean Olsen-P (mgPkg) Direction of significant
changes
1998 2007 1998 - 2007
Upland Woodland 296 182
Lowland Woodland 247 295
Fertile Grassland 426 335
Infertile Grassland 301 210
Moorland Grass Mosaic 495 242
Heath and Bog 521 333
Tall Grass and Herb 449 322
Crops and Weeds 494 442
) Great Britain ndash AVC unchanged
Aggregate Vegetation
Class
Mean Olsen-P (mgPkg) Direction of significant
changes
1998 2007 1998 - 2007
Upland Woodland 319 183
Lowland Woodland 206 270
Fertile Grassland 438 347
Infertile Grassland 261 173
Moorland Grass Mosaic 590 267
Heath and Bog 471 318
Tall Grass and Herb 424 294
Crops and Weeds 499 438
117
Countryside Survey Soils Report from 2007
6 Olsen-P
d) Great Britain ndash Loss on Ignition Category
LOI Category () Mean Olsen-P (mgPkg) Direction of significant
changes
1998 2007 1998 - 2007
Mineral (0-8) 405 339
Humus-mineral (8-30) 329 241
Organo-mineral (30-60) 409 194
Organic (60-100) 630 441
The mean Olsen-P concentrations in soils (0-15 cm) for plots in which the AVC did not change (Table 63c)
were broadly consistent with the dataset as a whole (Table 63b) The exception was Tall Grass and Herb
where no significant change in mean Olsen-P was observed for plots with consistent AVCs between surveys
(Table 64b) This suggests that some of the change in Olsen-P observed for this AVC in the dataset as a
whole may have arisen because of a change in land use between the surveys
Figure 65 Change in mean Olsen-P concentration within Broad Habitats in Great Britain between
1998 and 2007
-60
-40
-20
0
20
Bro
adle
aved
Woodla
nd
Conife
rous
Woodla
nd
Ara
ble
Impro
ved G
rass
Neu
tral
Gra
ss
Aci
d Gra
ss
Bra
cken
Dwar
f Shru
b Hea
th
Fen M
arsh
Swam
p
Bog
Ch
an
ge
in
Ols
en
-P (
mg
kg
)
Mean Olsen-P concentrations decreased significantly across all LOI categories (Table 63d) with the largest
change observed in organo-mineral soils where mean Olsen-P declined by nearly 50 In both surveys the
highest mean Olsen-P concentrations were observed in organic soils reflecting the high mean concentrations
measured in Broad Habitats and AVCs with organic -rich soils (Dwarf Shrub Heath and Bog Broad Habitats
Moorland Grass Mosaic and Heath and Bog AVCs
632 Change in mean Olsen-P concentration in soils (0-15cm) across England
Olsen-P was measured only on the Main Plots within the original 256 squares sampled in 1978 giving a
maximum potential sample number of 1281 of which 1068 were sampled in 2007 and 943 in 1998 For this
reason sample numbers decline rapidly in country-level data analysis A minimum cut-off of 20 samples was
applied for country-level analysis of Olsen-P by Broad Habitat AVC and LOI Category As a result there are
several gaps in the analysis missing values in the tables are signifi ed by a diagonal line across the cell
118
Countryside Survey Soils Report from 2007
6 Olsen-P
There was a significant (16) decrease in mean Olsen-P for the All Broad Habitats category in England
between 1998 and 2007 (Table 64) this was the smallest overall change observed amongst the three
countries Arable soils (0-15 cm) contained the highest mean concentrations of Olsen-P in England 1998
(454 mgPkg) and 2007 (418 mgPkg) and there was a small (8) but significant decrease between the two
surveys Mean Olsen-P concentrations in soils (0-15 cm) beneath Improved Grassland and Neutral Grassland
in England were very similar in 2007 (asymp 26 mgPkg) following significant decreases from levels observed in
1998 (Table 64)
Table 64 Change in mean Olsen-P concentration of soils (0-15 cm) across England for a) Broad
Habitats b) Aggregate Vegetation Classes (AVC) c) AVCs unchanged since 1978 and d) LOI
categories Arrows denote a significant change (plt005) in the direction shown Diagonal line
indicates too few samples to provide reliable value
a) England - Broad Habitat
Broad Habitats
Mean Olsen-P (mgPkg) Direction of significant
changes
1998 2007 1998 - 2007
Broadleaved Mixed and
Yew Woodland
338 269
Coniferous Woodland
Arable and Horticulture 454 418
Improved Grassland 332 260
Neutral Grassland 347 263
Acid Grassland 412
Bracken
Dwarf Shrub Heath
Fen Marsh Swamp
Bog
All Habitat Types 396 332
b) England ndash AVC whole dataset
Aggregate Vegetation
Class
Mean Olsen-P (mgPkg) Direction of significant
changes
1998 2007 1998 - 2007
Upland Woodland
Lowland Woodland 248 272
Fertile Grassland 403 320
Infertile Grassland 273 171
Moorland Grass Mosaic
Heath and Bog
Tall Grass and Herb 423 330
Crops and Weeds 454 413
119
Countryside Survey Soils Report from 2007
6 Olsen-P
c) England ndash AVC unchanged
Aggregate Vegetation
Class
Mean Olsen-P (mgPkg) Direction of significant
changes
1998 2007 1998 - 2007
Upland Woodland
Lowland Woodland
Fertile Grassland 401 323
Infertile Grassland 262 156
Moorland Grass Mosaic
Heath and Bog
Tall Grass and Herb
Crops and Weeds 472 427
d) England ndash Loss on Ignition Category
LOI Category () Mean Olsen-P (mgPkg) Direction of significant
changes
1998 2007 1998 - 2007
Mineral (0-8) 394 342
Humus-mineral (8-30) 346 244
Organo-mineral (30-60) 360 239
Organic (60-100)
There were insufficient samples in 2007 in the Acid Grassland Broad Habitat to make a valid estimate of the
mean No significant change was observed in mean Olsen-P beneath Broadleaved Mixed and Yew Woodland
Broad Habitat in England between 1998 and 2007
There were significant decreases in mean Olsen-P in the Fertile Grassland and Infertile Grassland AVCs in
England between 1998 and 2007 (Table 64b) Of the AVCs with sufficient data to provide a valid estimate of
the mean the highest mean concentrations in 1998 and 2007 were observed in Crops and Weeds
Restricting the analysis to plots where AVC remained unchanged resulted in only three AVCs having
sufficient samples for statistically valid estimates of the mean (Table 64c) Mean values for Infertile
Grassland Fertile Grassland and Crops and Weeds for the unchanged dataset were very similar to those for
the dataset as a whole There were significant decreases in mean Olsen -P in Infertile Grassland and Crops
and Weeds between 1998 and 2007 in the unchanged dataset
Mean Olsen-P decreased significantly in all three LOI categories in England between 1998 and 2007 (Table
64d) The smallest change (13) was observed in mineral soils and the largest in organo-mineral soils
(39) As a result in 2007 humus-mineral and organo-mineral soils had virtually the same mean Olsen-P
concentrations (asymp 24 mgPkg) which were approximately 10 mgPkg less than for mineral soils This
represented an increase in the relative difference in mean Olsen -P between mineral soils and the other
categories compared to 1998
633 Change in mean Olsen-P concentration in soils (0-15cm) across Scotland
In 1998 and 2007 Arable and Horticulture (69 mgPkg and 52 mgPkg) and Improved Grassland (59 mgPkg
and 56 mgPkg) Broad Habitats in Scotland had the highest mean Olsen -P concentrations amongst the three
countries There was a 25 decrease in mean Olsen-P in Scottish Arable soils (0-15 cm) between 1998 and
2007 but no significant change was observed for Improved Grassland (Table 65a) There was a significant
120
Countryside Survey Soils Report from 2007
6 Olsen-P
decrease in mean Olsen-P in semi-natural grassland Broad Habitats in Scotland Scottish Broadleaf
Woodland soils (0-15 cm) had a much higher mean Olsen-P value (51 mgPkg) in 1998 compared to England
(34 mgPkg) but too few samples were taken to provide a reliable estimate of the mean for Scotland in 2007
Upland Woodland Infertile Grassland Moorland Grass Mosaic and Heath and Bog AVCs in Scotland all
showed a significant decrease in mean Olsen-P concentration between 1998 and 2007 (Table 65b) There
were no significant changes in Fertile Grassland or Crops and Weeds The latter contained the largest mean
concentration of Olsen-P in 2007 (50 mgPkg) and AVCs in Scotland were more enriched in Olsen -P
compared to the equivalents in England and Wales Restricting the analysis to unchanged AVCs removed th e
Upland Woodland AVC but for other AVCs results were consistent with those for the dataset as a whole
(Table 65c)
Table 65 Change in mean Olsen-P concentration of soils (0-15 cm) across Scotland for a) Broad
Habitats b) Aggregate Vegetation Classes (AVC) c) AVCs unchanged since 1978 and d) LOI
categories Arrows denote a significant change (plt005) in the direction shown Diagonal line
indicates too few samples to provide reliable value
a) Scotland - Broad Habitat
Broad Habitats
Mean Olsen-P (mgPkg) Direction of significant
changes
1998 2007 1998 - 2007
Broadleaved Mixed and
Yew Woodland
509
Coniferous Woodland 399 295
Arable and Horticulture 689 516
Improved Grassland 591 562
Neutral Grassland 284 249
Acid Grassland 486 215
Bracken
Dwarf Shrub Heath 646 249
Fen Marsh Swamp
Bog 544 365
All Habitat Types 491 328
b) Scotland ndash AVC whole dataset
Aggregate Vegetation
Class
Mean Olsen-P (mgPkg) Direction of significant
changes
1998 2007 1998 - 2007
All Woodland
Upland Woodland 290 219
Lowland Woodland
Fertile Grassland 485 404
Infertile Grassland 362 318
Moorland Grass Mosaic 533 228
Heath and Bog 548 339
Tall Grass and Herb
Crops and Weeds 609 495
121
Countryside Survey Soils Report from 2007
6 Olsen-P
c) Scotland ndash AVC unchanged
Aggregate Vegetation
Class
Mean Olsen-P (mgPkg) Direction of significant
changes
1998 2007 1998 - 2007
All Woodland
Upland Woodland
Lowland Woodland
Fertile Grassland 482 422
Infertile Grassland 302 240
Moorland Grass Mosaic 656 289
Heath and Bog 463 295
Tall Grass and Herb
Crops and Weeds
d) Scotland ndash Loss on Ignition Category
LOI Category () Mean Olsen-P (mgPkg) Direction of significant
changes
1998 2007 1998 - 2007
Mineral (0-8) 477 383
Humus-mineral (8-30) 315 262
Organo-mineral (30-60) 442 181
Organic (60-100) 616 406
The mean Olsen-P concentration in Scottish mineral soils decreased significantly between 1998 and 2007
but there was no significant change observed for humus-mineral soils (Table 65d) Organic soils in Scotland
had a very high mean Olsen-P concentration in 1998 (62 mgPkg) which decreased significantly in 2007 to 41
mgPkg Mean Olsen-P concentrations in organo-mineral soils decreased significantly by more than 60
between 1998 and 2007
634 Change in mean Olsen-P concentration in soils (0-15cm) across Wales
The small number of samples from Wales placed a major restriction on data analysis with only four reporting
categories having sufficient data to provide valid statistics for status and change in Olsen -P (Table 66) The
largest percentage change (41) in the All Broad Habitats category was observed in Wales between 1998
and 2007 reflecting the large significant decrease (47) in mean Olsen-P in the Improved Grassland Broad
Habitat Much of the Improved Grassland in Wales is located on humus -mineral soils which largely accounts
for the significant decrease in Olsen-P between 1998 and 2007 Infertile Grassland was the only AVC in
Wales to have sufficient sample points to provide valid statistics for stock and change (Tables 66b and
66c) Mean concentrations of Olsen-P in this AVC decreased significantly between 1998 and 2007 with or
without changed AVC
122
Countryside Survey Soils Report from 2007
6 Olsen-P
Table 66 Change in mean Olsen-P concentration of soils (0-15 cm) across Wales for a) Broad
Habitats b) Aggregate Vegetation Classes (AVC) c) AVCs unchanged since 1978 and d) LOI
categories Arrows denote a significant change (plt005) in the direction shown Diagonal line
indicates too few samples to provide reliable value
a) Wales - Broad Habitat
Broad Habitats
Mean Olsen-P (mgPkg) Direction of significant
changes
1998 2007 1998 - 2007
Broadleaved Mixed and
Yew Woodland
Coniferous Woodland
Arable and Horticulture
Improved Grassland 408 215
Neutral Grassland
Acid Grassland
Bracken
Dwarf Shrub Heath
Fen Marsh Swamp
Bog
All Habitat Types 323 189
b) Wales ndash AVC whole dataset
Aggregate Vegetation
Class
Mean Olsen-P (mgPkg) Direction of significant
changes
1998 2007 1998 - 2007
Upland Woodland
Lowland Woodland
Fertile Grassland
Infertile Grassland 214 143
Moorland Grass Mosaic
Heath and Bog
Tall Grass and Herb
Crops and Weeds
c) Wales ndash AVC unchanged
Aggregate Vegetation
Class
Mean Olsen-P (mgPkg) Direction of significant
changes
1998 2007 1998 - 2007
Upland Woodland
Lowland Woodland
Fertile Grassland
Infertile Grassland 183 116
Moorland Grass Mosaic
Heath and Bog
Tall Grass and Herb
Crops and Weeds
123
Countryside Survey Soils Report from 2007
6 Olsen-P
d) Wales ndash Loss on Ignition Category
LOI Category () Mean Olsen-P (mgPkg) Direction of significant
changes
1998 2007 1998 - 2007
Mineral (0-8)
Humus-mineral (8-30) 309 174
Organo-mineral (30-60)
Organic (60-100)
64 Discussion and Policy Implications
The results from Countryside Survey in 2007 show a significant decrease between 1998 and 2007 in mean
Olsen-P concentrations in soils (0-15 cm) for most Broad Habitats AVCs and LOI categories across Great
Britain Mean Olsen-P has remained unchanged in a few Broad Habitats and AVCs but no increases in mean
Olsen-P have been observed Changes in mean Olsen-P concentrations in Broad Habitats within individual
countries between 1998 and 2007 reflect this pattern
These results raise the question as to whether the changes observed between 1998 and 2007 are real or an
artefact of field sampling and chemical analysis and whether the Countryside Survey data are consistent with
those from other monitoring schemes It is difficult to compare with results from other surveys due to the
common use of mgl for monitoring agricultural soils compared to mgkg in CS
The same sampling protocol was used in 1998 and 2007 but two important potential sou rces of sampling
variability can be identified The first of these arises because of the strong vertical gradient in Olsen-P
concentration encountered in many soils under different vegetation types (see for example Table 67 and
Fig 66) The highest Olsen-P concentrations are generally encountered in the surface soil layers (0 -5 cm)
which must be sampled consistently in repeat surveys if change is to be assessed accurately A consistent
failure to identify and sample the true soil surface layer could sig nificantly bias results between surveys
Table 67 Vertical distribution of Olsen-P (mgPkg) in a) brown earth soil beneath neutral grassland at
the Snowdon ECN site and b) stagnogley soil beneath improved grassland at Pontbren
Snowdon ECN site Pontbren (CEH unpublished data)
Olsen-P mgPkg Olsen-P mgPkg
Depth cm Mean Std Dev Depth cm Mean Std Dev
0-5 274 223 2-5 234 40
5-10 163 112 5-15 104 25
10-20 78 25 15-30 56 26
20-30 53 10 30-60 33 16
124
Countryside Survey Soils Report from 2007
6 Olsen-P
Figure 66 Vertical distribution of Olsen-P (mgPkg) in three blocks of farm woodland on stagnogley
soils at Pontbren (CEH unpublished data)
A second source of error which affects all analytes arises because re -sampling in each Main Plot does not
occur at exactly the same spot The cores in 1998 and 2007 were taken from points located 2 -3 m apart from
permanently marked locations (Chapter 1) This will introduce random variability into the data due to small
scale heterogeneity in soil properties alongside any surveyor error in re-locating the plots The size of the
effect is unknown but is unlikely to have caused systematic bias between the surveys and there is
significantly less potential for relocation error in CS relative to NSI where no permanen t markers are used
The quality of the chemical analyses for 1998 and 2007 has been discussed in Section 621 Taken overall
the Quality Control data show strong consistency within and between the measurements made in 2002 and
2008 and give little cause for concern regarding a comparison of Olsen-P data from 1998 and 2007
Countryside Survey Olsen-P data are broadly consistent with results from other surveys and monitoring sites
(Tables 68 and 69) Fixed depth sampling at the ECN sites does not include 0-15 cm depth but the data
broadly confirm values measured by Countryside Survey The ECN data further illustrate the strong vertical
gradient in Olsen-P concentrations across a range of land use and habitat types
Table 68 Olsen-P concentrations measured in Arable and Improved Grassland in the National Soil
Inventory in 1980 and 1996 from Bradley et al (2003)
Broad Habitat Olsen-P mgPkg
NSI 1980 (0-15 cm)
Olsen-P mgPkg
NSI 1996 (0-15 cm)
Arable 330 428
Improved
Grassland
227 229
00 100 200 300 400 500
2-5
5-15
15-30
30-60
60-90
De
pth
be
low
su
rfa
ce
(c
m)
Olsen-P (mgPkg)
Cae Draens Tyn-y-Fron Pant Powsi
125
Countryside Survey Soils Report from 2007
6 Olsen-P
Table 610 Olsen-P concentrations measured at two depths in soils at selected Environmental Change
Network sites Samples were not collected at 0-15 cm depth at the ECN sites
ECN site name Land use Olsen-P mgPkg
0-5 cm depth
Olsen-P mgPkg
5-10 cm depth
Drayton Permanent pasture 937 416
North Wyke Permanent pasture 673 357
Snowdon Upland grassland 274 163
Wytham Deciduous woodland 227 114
Alice Holt Oak woodland 135 65
Figure 67 Map of probability of 2007 Olsen-P concentration being greater than 18 mgPkg Probability
scale between zero and one
Analysis of the 2007 Olsen-P data revealed very little spatial structure which is reflected in the map which
predicts the probability on exceeding the threshold o f 18mgPkg on a scale from zero to one a value of one
indicating the threshold has been exceeded (Fig 67) Visual inspection of the mapped data for Olsen-P from
the NSI (McGrath and Loveland 1992) showed a broad separation in Olsen -P concentrations between areas
of managed agricultural land in central southern and eastern England and those under semi -natural
vegetation and forest mainly in the north and west Within the areas of managed land there was a wide range
of concentrations with large differences in values between adjacent NSI mapping units Probability maps for
Olsen-P from the RSSS (Baxter et al 2006) show some limited correspondence between the map for the
2001 RSSS data and Countryside Survey It is important to remember the differences in sampling strategy
and survey design when comparing the data from these three surveys but it is generally apparent that there
are no strong spatial patterns in Olsen-P concentrations
126
Countryside Survey Soils Report from 2007
6 Olsen-P
Assuming that the Countryside Survey data from 1998 and 2007 provide va lid estimates of Olsen-P across
Great Britain a number of hypotheses can be invoked to account for the decrease observed over the nine
year period These are briefly discussed below as detailed exploration is beyond the scope of this Report
Reduction in external inputs of phosphorus- Data on fertiliser use compiled as a core indicator
under the Defra Sustainable Farming and Food Strategy showed a 53 decline in the total use of phosphate
fertiliser between 1984 and 2007 in England Across Great Britain application rates of phosphate (P2O5) to
tillage crops decreased from 51 kgha to 32 kgha and to grass from 21 kgha to 14 kgha between 1998 and
2007 (BSFP 2008) The figures for 2007 correspond to the lowest application rates since statistics were firs t
compiled in 1983 and presumably reflect changes in agricultural management in response to environmental
and economic pressures (Baxter et al 2006)
Taking England as an example combining application rates with agricultural land area data from the Jun e
Agricultural Survey showed a large decline in phosphate use Total application of phosphate in England in
2007 was 123 kT P2O5 to tilled land and 48 kT to grassland compared with 209 kT and 72 kT respectively for
1998 Soil phosphorus status in enclosed agricultural land will also be influenced by more subtle changes in
crop and livestock management and by changes in the type of fertiliser used Oliver et al (2006) commenting
on the decrease in Olsen-P observed in the RSSS between 1971 and 2001 attribu ted the decline to a steady
reduction in phosphorus fertiliser inputs but also noted that for grassland there had been a progressive shift
away from insoluble forms of phosphorus fertiliser such as rock phosphate to more water soluble materials
Deeper ploughing will also bring subsoil with a relatively low phosphorus status to the surface This would
dilute the existing topsoil phosphorus stock unless fertiliser was added
The amount of phosphorus deposited annually across Great Britain from the atmospher e is poorly quantified
with a recent estimate for the United Kingdom of 03 kgPhayr (White 2006) Phosphorus concentrations in
rain are low and the main vector is dry deposition of dust As far as can be ascertained there are no data to
describe trends in atmospheric phosphorus inputs to Great Britain over time Use of clean -up technology for
sulphur emissions from coal burning may have led to a decline in phosphorus emissions with a knock on
effect on atmospheric deposition A reduction in mineral ferti liser use would also reduce the amount of
particulate phosphorus in the atmosphere derived from re-suspended soil The quantities of phosphorus
deposited on semi-natural systems are likely to be relatively small but there is little information as to how
they compare to inputs from sources such as mineral weathering
Effect of atmospheric nitrogen deposition- A number of studies have reported that non-
agricultural ecosystems in Great Britain could be moving towards phosphorus limitation in response to
increased availability of nitrogen from atmospheric deposition In moorland vegetation high foliar NP ratios
have been correlated positively with nitrogen deposition (Kirkham 2001) On the Carneddau in Wales
montane heath vegetation had relatively high foliar NP ratios compared with similar systems receiving less
atmospheric nitrogen deposition in Scotland (Britton et al 2005) Both studies have been cited as examples
of potential phosphorus limitation In contrast Rowe et al (2007) reported that foliar NP ratios in Calluna
collected during 1998 decreased with nitrogen deposition They suggested that enzyme production or
mycorrizal activity may have allowed Calluna to access additional soil phosphorus resources In upland
plantation Sitka spruce forests root bioassay techniques have shown increased phosphorus demand in older
crops where excess nitrogen was leached as nitrate in soil and stream waters (Harrison et al 1995) The
authors inferred that supplies of available phosphorus in soils may have lim ited the ability of older trees to
utilise incoming atmospheric nitrogen Phosphorus deficiency has also been reported in Dutch forests
receiving large amounts of nitrogen deposition probably because of soil acidification (Mohren et al 1986)
The overall implication of these studies is that sustained levels of atmospheric nitrogen deposition may have
increased plant demand on soil phosphorus resources In the soil this may have decreased the size of the
labile phosphorus pool (as measured by Olsen-P) at a time when external sources of phosphorus may also
have declined
127
Countryside Survey Soils Report from 2007
6 Olsen-P
Effects of pH change on phosphorus binding capacity in soils ndash The chemistry of
phosphorus in soils is complex and pH dependent through a number of processes related to the clay mineral
content and presence of sesquioxides and exchangeable aluminium in the soil In fertilised alkaline soils or
calcareous soils phosphorus availability is greatest between pH 6 and pH 7 As pH in these soils increases
above about pH 65 phosphate solubility decreases rapidly with the formation of insoluble calcium salts
which contribute to the unavailable or non-labile soil phosphorus pool In acid mineral soils phosphate ions
combine readily with iron and aluminium to form insoluble compounds whilst fixati on by hydrous iron and
aluminium oxides and clay minerals can sequester large amounts of phosphorus As pH increases so does
the solubility of basic iron and aluminium phosphates (solubility minima between pH 3 and 4) and some of the
fixed phosphorus will also be released resulting in a maximum pool of readily available phosphorus at soil
pH values between 6 and 65 (Brady 1974)
Soil pH increased significantly across many Broad Habitats AVCs and soil LOI categories between 1998 and
2007 In the Broad Habitats and AVCs representative of managed agricultural land mean soil pH across
Great Britain was well above pH 6 and was over pH 7 in the Arable and Horticultural Broad Habitat and Crops
and Weeds AVC in 2007 If calcium was abundant in these soils th e high pH values would favour the
formation of insoluble salts and may reduce the pool of more labile phosphorus In many of the Broad
Habitats and AVCs which would typically have more acid mineral soils (eg Acid Grassland Broad Habitat
Moorland Grass Mosaic AVC) soil pH did not increase significantly between 1998 and 2007 and mean
values were typically around pH 45 In this pH range the relatively available pool of soil phosphorus would
still be small compared with that fixed by hydrous oxides of ir on and aluminium or held in precipitates
Sustained atmospheric nitrogen deposition may have increased plant demand on this pool particularly in
systems where grazing or other forms of biomass harvesting result in nutrient removal from the site
65 References
Allen SE (ed) 1989 Chemical analysis of ecological materials Blackwell Scientific Publications Oxford
368 pp
Archer J Oliver M and Baxter S 2003 Review of the Representative Soil Sampling Scheme (RSSS) Final
report to Defra John Archer Consulting and Department of Soil Science University of Reading
Baxter SJ Oliver MA and Archer JR 2006 The Representative Soil Sampling Scheme of England and
Wales the spatial variation of topsoil nutrient status and pH between 1971 and 2001 Soil Use and
Management 22 383-392
Black HIJ et al 2000 MASQ Monitoring and assessing soil quality in Great Britain Countryside Survey
Module 6 Soils and Pollution RampD technical Report E1-063TR Environment Agency Bristol
Black H Bellamy P Creamer R Elston D Emmett B Frogbrook Z Hudson G Jordan C Lark M
Lilly A Marchant B Plum S Potts J Reynolds B Thompson R and Booth P 2008 Design and
operation of a UK soil monitoring network Contract Report Environmental Agency ISBN 978-1-84432-936-
6
Bradley RI Bellamy PH Loveland PJ Black HIJ Hornung M Scott A Lane A Webb J
Jackson DR 2003 Comparability of soil properties derived from different data sources Defra project code
SP0515
Brady NC 1974 The Nature and Properties of Soils 8th
Edition Macmillan Publishing New York
Britton AJ Pearce ISK and Jones B 2005 Impacts of grazing on montane heath vegetation in Wales
and implications for the restoration of montane areas Biological Conservation 125 515-524
BSFP 2008 The British Survey of Fertiliser Practice Report for 2008 wwwdefragovuk
128
Countryside Survey Soils Report from 2007
6 Olsen-P
Emmett BA Black HIJ Bradley RI Elston D Reynolds B Creamer R Frogbrook ZL Hudson G
Jordan C Lilly A Moffat A Potts J Vanguelova E 2006 National soil monitoring network Review and
assessment study Final Report Project LQ09 SNIFFER Edinburgh
Emmett BA Frogbrook ZL Chamberlain PM Griffiths R Pickup R Poskitt J Reynolds B Rowe
E Spurgeon D Rowland P Wilson J Wood CM 2008 CS Technical Report No 307 Soils Manual
NERCCentre for Ecology amp Hydrology 180 pp (CEH Project Number C03259)
Foy RH Tunney H Carroll MJ Byrne E Gately T Bailey JS Lennox SD 1997 A comparison of
Olsen and Morgan soil phosphorus test results from the cross -border region of Ireland Irish Journal of
Agricultural and Food Research 36 185-193
Harrison AF Stevens PA Dighton J Quarmby C Dickinson AL Jopnes HE Howard DM 1995
The critical load of nitrogen for Sitka spruce forests on stagnopodsols in Wales Role of nutrient limitations
Forest Ecology and Management 76 139-148
Hughes S Reynolds B Bell SA Gardner C 2000 Simple phosphorus saturation index to estimate risk
of dissolved P in runoff from arable soils Soil Use and Management 16 206-210
Jackson ML 1958 Soil Chemical Analysis Prentice Hall London
Kirkham FW 2001 Nitrogen uptake and nutrient limitation in six hill moorland species in relation to
atmospheric nitrogen deposition in England and Wales Journal of Ecology 89 1041-1053
MAFF 2000 Fertilser recommendations for agricultural and horticultu ral crops (RB209) Seventh Edition The
Stationery Office 177pp
McGrath SP Loveland PJ 1992 The Soil Geochemical Atlas of England and Wales Blackie Academic
and Professional
Mohren GMJ van den Berg J Burger FW 1986 Phosphorus defic iency induced by nitrogen input in
Douglas fir in the Netherlands Plant and Soil 95 191-200
Morecroft MD Bealey CE Beaumont DA Benham S Brooks DR Burt TP Critchley CNR Dick
J Littlewood NA Monteith DT Scott WA Smith RI Walmsley C Watson H The UK Environmental
Change Network Emerging trends in the composition of plant and animal communities and the physical
environment Biological Conservation 142 2814-2832
Oliver MA Archer JR Baxter SJ Todd AD Skinner RJ 2006 The Representative Soil Sampling
Scheme of England and Wales a statistical analysis of topsoil nutrient status and pH between 1971 and
2001 Soil Use and Management 22 372-382
Olsen SR Cole CV Watanabe FS Dean LA 1954 Estimation of available phosphorus in soils by
extraction with sodium bicarbonate United States Department of Agriculture Washington DC Circular No
939 19pp
Rowe EC Smart SM Kennedy VH Emmett BA Evans CD 2008 Nitrogen deposition increases the
acquisition of phosphorus and potassium by heather Calluna Vulgaris Environmental Pollution 155 201-207
White RE 2006 Principles and Practice of Soil Science Fourth Edition Blackwell Publishing Oxford
129
Countryside Survey Soils Report from 2007
7 Soil metal concentrations
Summary
A comparison of back corrected Countryside Survey soils (0-15cm) analyses for 1998 and 2007
samples indicated that as would be expected only relative small changes in soil trace metal
concentrations occurred between surveys despite reported declines in atmospheric deposition due
to the long residence time of metals in soils
Of seven metals for which repeat measurement were made during the 2007 survey only for one Cu
was a statistically significant difference in soil (0-15cm) concentrations (an increase) found at the
GB level
When the data for repeat metal measurements were stratified by Broad Habitat Aggregate
Vegetation Class and soil organic matter category further statistically significant differences were
seen For Cu generally significant increases were observed whilst for two metals Cd and Pb
changes were small and idiosyncratic between stratifications For three metals Cr Ni Zn changes
were generally characterised by reduction in crop lands and no change or slight increases in less
managed habitats
For some metals such as Cu and Cd it is l ikely that additional sources (animal manures and
possibly sewage sludge manures and compost for Cu and fertiliser for Cd) beyond atmospheric
inputs are important in maintaining or even increasing soil concentrations principally in managed
areas For the remaining metals especially Cr Ni and Zn there is some suggestion that in areas
where cropping takes place output fluxes may now exceed inputs enabling soil concentrations to
decline
Managed landscape where intensive cropping takes place but sewage sludge animal manures and
composts are rarely applied may be among the first habitats to return from their slight-moderately
elevated states to their pre-industrial background concentrations and could be a focus for future
monitoring
71 Policy background
Key Question Is the decline in atmospheric deposition as reported by the Heavy Metals Monitoring Network reflected in soil metal concentrations measured with CS Measurements Concentrations of Cd Cr Cu Ni Pb V and Zn is soils (0-15cm) collected in repeat sampling of plots that were also sampled and analysed for the same metals in 1998 measurement of concentrations of Li Be Al Ti Mn Fe Co As Rb Se Sr Mo Sb Sn Cs Ba W Hg U in CS in 2007 soil samples as an initial survey of a wider range of trace element From this analysis CS in 2007 has provided
Whole Great Britain (GB) and Broad Habitats Aggregate Vegetation Classes (AVC) and soil type
stratified assessments of soil trace element concentrations in soil (0-15cm) in 2007
Information of the change in concentrations of trace metals (Cd Cr Cu Ni Pb V Zn) in GB soil (0-
15 cm) since previous measurements made at the same plots in 1998
Data to contribute to analysis of source changes in the distribution of trace elements in a range of
GB habitats vegetation types and soil classes
130
Countryside Survey Soils Report from 2007
7 Soil metal concentrations
Background In the European Union and internationally a set of research programmes have focused on assessing the risks of trace metals to ecosystems This work has been driven by policy initiatives which include new procedures for the mandatory risk assessment according to European Commission regulation 148894 and studies to support the 1998 Convention on Long-Range Transboundary Air Pollution Aarhus Protocol on Heavy Metals The focus of policy makers and researchers on the risk assessment of metals recognises the harm that elevated trace element concentrations can do to soil ecosystems A number of keystone soil taxa (eg earthworms springtails nitrifying bacteria) are particularly sensitive to metals High metal concentration in soils can reduce the abundance and diversity of communities of these and other taxa potentially resulting in a breakdown of specific soil functions such as decomposition nutrient turnover and the regulation of hydrological flows through soil Metals are not broken-down over time (unlike most organic chemicals) and so can be removed only by the relatively slow process of cropping and leaching the accumulation of metals offers one of the more serious long-term threats to soil sustainability worldwide The environmental risks of metals for UK soils are currently being asssed in two projects improving current critical loads methods for application within UNECE Convention and developing models that can be used to describe and predict the effects of changes in input rates on soil and freshwater metal pools Both project will benefit from good quality soil metal survey data Key measurements required include information on current concentrations of metals in soils (representing combined geogenic and past anthropogenic inputs) and also predicted rates of change Modification in metal concentration in surface soils will represent the balances between input fluxes associated with natural and anthropogenic inputs and output fluxes associated with crop removal and leaching Measurements of the input rates of atmospheric metal deposition to rural soils in the UK since 2004 have come from analyses of rain water and airborne particulate metal concentrations made within the UK bdquoHeavy Metal Deposition Monitoring Network‟ This network has collected information on the concentrations of a suite of metals of regulatory interest including Cd Cu Ni Pb Zn and Hg Other impo rtant routes for the input of metals to soils are associated with the addition of sewage sludge animal manures and other solid waste streams to soils principally in agricultural areas Information on these inputs can be derived from Defra supported long-term monitoring projects focussing on solid waste receiving systems For estimates of losses from cropping and leaching prediction of removal rates have been made by modelling studies conducted to support development of a critical loads approach for metals in soils Despite this knowledge because the Heavy Metal Deposition Network covers only a small number of sites (15 in GB) and there is little large scale data on the local patterns of solid waste inputs and cropping and leaching removals available the input and output flux estimates that are currently available are very uncertain Although uncertain and spatially variable estimates made by the Heavy Metal Deposition Monitoring Network other large-scale monitoring programs and by source inventory assessment have suggested that rates of atmospheric metal deposition to UK soils are declining For example a European wide survey of trace metal concentration in over 6000 moss samples identified a decline in concentrations of As of 72 Pb of 72 V of 60 Cd of 52 and Fe of 45 between 1990 and 2005 Smaller declines were also found for Zn of 29 Cu of 20 and Ni of 20 Declines for Hg (12) and Cr (2) were not significant While it is apparent that atmospheric deposition is likely to be declining it is not known whether these reductions have yet passed the point beyond which output losses exceed inputs and so overall metal concentrations can begin to decline Dynamic modelling within Defra funded projects on critical loads assessment have suggested that the residence time of metals in soils will be at least many decades and for some metals such as lead possibly millennia (Tipping et al 2006a) Extensive datasets on the rates of change of concentrations of metals in soils are not currently available to validate these model predictions By resampling and measuring soil metal concentration in samples collected countrywide after a 9 year gap it was hoped that CS could provide an initial prototype of just such a dataset
131
Countryside Survey Soils Report from 2007
7 Soil metal concentrations
72 Methods
721 Proof of concept
As part of the Measuring and Assessing Soil Quality of CS in 1998 over 1100 soil samples were successfully analysed for seven trace metals (Cd Cr Cu Ni Pb V Zn) using aqua regia digestion and an ICP -OEC analysis method Measured concentrations showed regional trends with higher value generally found in England and Wales than in Scotland Concentrations also differed between Broad Habitats with highest concentrations in Arable and Horticulture and Improved Grassland soils and lowest concentrations in Dwarf Shrub Heath and Bogs The GB wide sampling and measurement programme of CS in 1998 provided information on the concentrations of metals in the rural soils that are the focus of CS rather than urban or industrial soils that are often considered in pollution assessment programs These rural soils are primari ly influenced by diffuse rather than point source inputs and so are relevant to studies to assess the potential for large scale pollution effects resulting from diffuse exposure To provide initial knowledge on the potential dynamics of metal concentra tions in GB soils a repeat analysis of a sub-set of samples collected within CS in 1998 has been undertaken as part of CS in 2007 This was done to allow the key policy question of interest to stakeholders to be addressed namely Is the decline in atmospheric deposition as reported by the Heavy Metals Monitoring Network reflected in soil metal concentrations measured with CS To address the highlighted policy issue and assess wider implications relating to metal distribution of GB soils the metal componen t of CS in 2007 was designed to provide
A nationwide assessment of the concentrations of 26 metal or metalloid elements namely lithium
(Li) beryllium (Be) aluminium (Al) titanium (Ti) vanadium (V) chromium (Cr) manganese (Mn)
iron (Fe) cobalt (Co) nickel (Ni) copper (Cu) zinc (Zn) arsenic (As) rubidium (Rb) selenium (Se)
strontium (Sr) molybdenum (Mo) cadmium (Cd) antimony (Sb) tin (Sn) caesium (Cs) barium (Ba)
tungsten (W) mercury (Hg) lead (Pb) uranium (U) in almost 500 GB soils collected in CS in 2007
Information on the change in concentrations of metals in GB soils for seven metals (Cd Cr Cu Ni
Pb V Zn) that were also analysed in CS samples collected in 1998 and in the 2007 repeat analyses
An assessment of the influence of Broad Habitats AVC and soil type on measured metal
concentration and rates of change between survey years
Countryside Survey in 2007 has provided a large-scale re-sampling of soil metal concentrations with the framework of an integrated nationwide monitoring program The full rationale for the repeat measurement of soil metal concentrations is set out in Table 71 and the progression of the development of the resampling and analysis approach used set out in detail below
In CS in 1998 concentrations of Cd Cu Cr Ni Pb Zn were measured in soils collected from all Main Plots within squares first sampled for soil (pH LOI soil texture) in the 1978 survey (Chapter 1) This gave a potential total of 1256 soils for metals analysis although actual numbers were somewhat lower due to plot or sample losses meaning that in total 1119 soils were actually analysed Competing priorities for resources during the design of the 2007 survey and measurement program meant that within the available budget a full analysis of all previous analysed Main Plots re-sampled in CS in 1998 could not be supported During preparation for CS a power analysis of the 1998 survey data was conducted to evaluate within and between square variability and to assess the implications of changing sample number for the power of the analysis to detect change in metal concentrations Results of this power analysis indicated lower within square than between square variability Further it was indicated that a reduction in the number of M ain Plots analysed per square from 5 in CS in 1998 to only 2 in CS in 2007 would actually have only a very limited effect on the power to detect change in CS in any repeat analysis Based on this evaluation in 2007 metals analysis was limited to two Main Plots for all squares previously samples in 1978
132
Countryside Survey Soils Report from 2007
7 Soil metal concentrations
Table 71 Summary of rationale for measurement of soil metal concentrations within CS in 2007
Issue Facts Comments History in CS Measured in 1097 samples in
CS in 1998
Measurement of 2007 re-samples will give
capability to establish a time series for the first time
Country level reporting No CS in 1998 did not give country level statistics
Reduced dataset in 2007 limits the power of
analysis for Country level reporting for habitat
vegetation and soil types stratifications
Links and compatibility to other
monitoring programmes
UK heavy metal monitoring
network
BGS G-BASE for soils and
stream sediments
Comparable data to those
collected in the NSI for same
horizon (0-15cm)
Environment Agency Soil and
Herbage Survey
Potential to link soils metal levels with predicted
deposition
Able to link soil metal levels with stream sediment
database
Can compare CS to NSI metal concentrations
Can compare with data for rural but not urban or
industrial site soils
Uniqueness of CS The only national dataset that
reports on metal distribution
and trends within an integrated
monitoring programme
Increase scope by inclusion of additional trace
element analytes within an extended analytical
suite
Value for money (Policy
priority or interpretative value x
cost)
Priority - medium
Value for money - medium
Sound fit with current priorities and good fit with
existing projects
ICP-MS and ICP-OES method delivers data on 26
metals and also on total P and total S
In the intervening period between the analysis of the CS in 1998 samples and the collection of samples from CS in 2007 several analytical developments were introduced into the procedures for trace metal analysis used at the UKAS accredited analytical facility at CEH in Lancaster During the movement of the metal analysis laboratory from its previous location at CEH Merlewood it was necessary to dismantle the hotplate reflux system that was used for digestion of all soils in CS in 1998 L ogistical requirement meant that the equipment could not be rehoused in the new analytical laboratories at CEH in Lancaster Instead it was decided to procure a new microwave digestion system that would be used for soil digestions Although both systems use aqua regia as the reagent for digestion the change in available instrumentation for conducting digestion from a hot plate reflux system to microwave digestion still could have the potential to confound the comparison of the 1998 and 2007 data if the two method show different extraction efficiencies Before detailed analysis of the data was conducted a careful comparison of the two methods was conducted using the available quality assurance information to check the comparability of the two methods In addition to a change in digestion apparatus purchase of new equipment for the analysis laboratory meant that as well as Inductively Coupled Plasma Optical Emission Spectroscopy ( ICP-OES) a further detection method Inductively Coupled Plasma Mass Spectrometry (ICP-MS) could also be used in CS in 2007 In the preparatory work for CS in 2007 the accuracy and precision of the two detection methods was compared for a representative set of aqua regia digests of 1998 CS soils Results indicated a good comparabi lity between the two detection techniques Since the resource implications for the use of the two instruments in parallel were minimal it was decided to use a comprehensive approach for the full analysis that included use of both procedures This approach both ensured any new analytical measures were compatible with CS in 1998 measures from digests and also delivered concentrations for an extended analyte suite The analytical
133
Countryside Survey Soils Report from 2007
7 Soil metal concentrations
strategy used involved a 5 stage approach based on 1) aqua regia digestion 2) analysis by ICP- OES for Cd Cr Cu Pb Ni V Zn P and S 3) further analysis of the same samples for further metals by ICP-MS 4) careful data evaluation 5) targeted re-measurement for any problem analytes
722 Analytical method
The field method used for soil core collection at each Main Plot was the same as in CS in 1998 The cores used for metal analysis were collected using a 15 cm long by 5 cm diameter black plastic core following the detailed field protocol set out in Emmett et al (2008) Once extracted and logged all cores were returned by mail to CEH in Lancaster as the quickest route of return On receipt samples for metal analysis were tak en from the bdquoBlack core‟ (See Emmett et al 2008 Annex 1) A total of 1054 black cores were collected from the 5 Main Plots in the original 256 1978 squares From this total number a subset of two cores from each visited square was chosen for trace met al analysis Cores were chosen at random from the subset of collected samples that were also analysed for concentrations of mineralisable nitrogen (see Chapter 5) All metal analyses were carried out by the UKAS accredited inorganic analysis laboratory at CEH in Lancaster After initial processing of the core to obtain a homogenous sample (See Emmett et al 2008 Annex 1) soil samples were ball-milled before analysis A 05g sub-sample of the dried milled material was used for analysis Digestion of the soil samples was conducted using an aqua regia mixture (3 ml of 37 hydrochloric acid and 9 ml of 69 nitric acid both bdquoaristar‟ grade reagents ) employing microwave heating under pressure The microwave digestion method was adapted from that used by the US EPA (method 3051A) to fit the specific requirements of the available digestion equipment at CEH in Lancaster The use of microwave digestion differed from the procedure used for measurement of soil metal concentration in CS in 1998 as outlined previously As a result of the change in digestion procedure detailed checks of the quality assurance data were conducted to verify the comparability of the analysis methods (see quality assurance section below) Further a series of validation checks have also bee n conducted of samples measured in the CS in 1998 using the CS in 2007 protocol This targeted re -measurement includes samples of a range of soil LOI and pH values and has been used in combination with available quality control information to support interpretations within this report
After digestion all samples were prepared for analysis of Cd Cr Cu Ni Pb V Zn P and S using ICP-OES and the technical method and operational limits relevant to the selected analytes Additionally for each digestion a parallel analysis was conducted that measured concentration of a suite of additional elements namely Li Be Al Ti V Cr Mn Fe Co Ni Cu Zn As Rb Se Sr Mo Cd Sb Sn Cs Ba W Hg Pb U using ICP-MS For reporting all values for metal concentrations derived from both detection methods were expressed as mgkg (equivalent to ppm and μgg) on a dry weight basis
134
Countryside Survey Soils Report from 2007
7 Soil metal concentrations
Table 72 Summary of quality control data for measurement of certified reference soil BCR CRM141R The table
highlights the repeatability of the measurements made in 1998 (top) and 2007 (middle) but also the difference in
the measured quantity resulting from the necessitated change in digestion procedure between CS in 1998 and
CS in 2007 The bottom table shows a comparison of the mean measured total of Cd Cr Cu Ni Pb V and Zn
made using the different method in each survey and the estimation of the correction factor used to back correct
CS in 1998 samples to account for digestion related differences Subsequent data analyse s was done comparing
back corrected CS in 1998 measurements with uncorrected CS in 2007 measured concentrations
1998 CS2000 Reflux digestionICPOES measurement BCR CRM141R
Mgkg Cd
Mgkg
Cr
Mgkg
Cu
Mgkg
Ni
Mgkg
Pb
Mgkg
V
Mgkg
Zn
Mgkg
mean 1360 14100 4700 9730 4860 5030 26100
sigma 070 530 170 370 330 210 930
CV 515 376 362 380 679 417 356
certified 1400 13800 4690 9400 5130 na 27000
recovery 9714 10217 10021 10351 9474 na 9667
bias -040 300 010 330 -270 na -900
bias -286 217 021 351 -526 na -333
error 180 1360 350 1070 930 na 2760
Error 1324 965 745 1100 1914 na 1057
2008 CS2007 microwave digestionICPOES (-oes) or ICPMS (-ms) measurement BCR CRM141R Cd-ms
Mgkg
Cr-ms
Mgkg
Cu-oes
Mgkg
Ni-ms
Mgkg
Pb-ms
Mgkg
V-oes
Mgkg
Zn-oes
Mgkg
Mean 1270 12120 4670 8366 4954 3580 28460
sigma 016 130 060 113 081 190 540
CV 126 107 128 135 164 531 190
Certified 1400 13800 4690 9400 5130 na 27000
recovery 9071 8783 9957 8900 9657 na 10541
bias -130 -1680 -020 -1034 -176 na 1460
bias -929 -1217 -043 -1100 -343 na 541
Error 162 1940 140 1260 338 na 2540
Error 1276 1601 300 1506 682 na 892
BCR CRM141R ndash 19982007 comparison all validation Cd-ms
Mgkg
Cr-ms
Mgkg
Cu-oes
Mgkg
Ni-ms
Mgkg
Pb-ms
Mgkg
V-oes
Mgkg
Zn-oes
Mgkg
1998 1360 14100 4700 9730 4860 5030 26100
2007 1182 10989 4327 7872 4724 2820 26632
19982007 115 128 109 124 103 178 098
135
Countryside Survey Soils Report from 2007
7 Soil metal concentrations
723 Quality assurance
Within each batch of 20 samples a minimum of one blank and two certified reference material (CRM) and one local reference material (LRM) were always analysed The t wo CRMs used were the BCR CRM141R calcareous loam soil and International Soil Exchange ISE 921 river clay both of which have certified values for a range of metals included within the analytical suite Quality control checks for each analytical batch were conducted to ensure that total analytical error was not greater than 20 comprising a 10 error in precision and 10 error in bias This criterion is more rigorous than that used by the Environment Agencies MCERTS performance standard for laboratories undertaking chemical testing of soil (NB MCERTS defines total allowable error of 25 - 10 bias + 15 precision) For the 2007 soils analysed using microwave digestion with ICP-OES or ICP-MS detection certified values for the repeat analysed metals (Cd Cr Cu Ni Pb Zn) indicated that the total error of the method is within the allowable 20 Compared with results from the CS in 1998 survey the analytical method used in CS in 2007 provided a similar and in both cases satisfactory precision of measurement in all cases ( Table 72) This confirms the suitability of the method used Even though both the microwave and hotplate digestion method performed within quality assurance targets it must be remembered that both digestion procedure remain operationally defined This means that the two aqua regia digest ion based techniques do not give a full measurement of all metals present in soils Some metal remains unextracted These residual ions are however mostly bound to silicate minerals and as such are widely considered to be unimportant for estimating the mobility and behaviour of trace elements in soil This operational component to the effectiveness of the method does however raise the potential for the two procedures to produce slightly different estimates of metal concentrations from the same soil To provide a cross check between measurements made by the two different digestion methods two separate approaches were used For the first a comparison was made of the measurements made of the BCR CRM141R calcareous loam soil which was extensively analysed during both the CS in 1998 and CS in 2007 measurement campaigns Comparison of quantifications of the CRM in the two surveys indicated that 6 of the 7 metals showed higher concentrations in BCR CRM141R soil in CS in 1998 than in CS in 2007 (Table 72) Cd Cr Cu Ni and Pb showed concentrations that were between 3 (Pb) and 28 (Cr) higher in CS in 1998 Concentrations of V in CS in 1998 were 78 higher in the CRM in measurements made in CS in 1998 than in CS in 2007 Of measured metals in the CRM only Zn concentrations were lower (by 2) in CS in 1998 than in CS in 2007 The second approach to comparison of the two digestion techniques was through a repeat analysis of samples that were originally measured following hotplate reflux digestion as part of the CS survey in 1998 but this time using the CS in 2007 microwave method Twenty six samples that had been archived from the 1998 survey were digested using the microwave method and analysed for concentration of the seven trace elements (Cd Cr Cu Ni Pb V Zn) that were originally measured during the 1998 analysis The results of this targeted re-measurement confirm the initial indication gained from the comparison of certified reference material analyses in all cases except for V The method compari son highlights that there is an approximate 30 increase in measured Cr and Ni concentrations using the reflux technique Cd and to a lesser extent Cu concentrations are also marginally higher with hotplate reflux (3 -10) while Pb and Zn concentrations are similar to within a few percent using both methods (Table 73) For V the comparison between soils highlights a small underestimation of concentrations using reflux while in contrast a large overestimation was indicated by the CRM comparison
136
Countryside Survey Soils Report from 2007
7 Soil metal concentrations
Table 73 Summary data for measurement of soil trace metal concentrations measured in selected (26) soil
samples collected in CS in 1998 using the hot reflux digestion protocol used for all CS in 1998 analyses and also
the microwave digestion protocol used for analysis in CS in 2007 samples The table highlights the repeatability
of the measurements made in 1998 (top) and 2007 (middle) but also the difference in the mean measured total of
Cd Cr Cu Ni Pb V and Zn made using the different methods as shown by the comparison of measured
concentration between the two procedures
Cd-ms
mgkg
Cr-ms
mgkg
Cu-oes
mgkg
Ni-ms
mgkg
Pb-ms
mgkg
V-oes
mgkg
Zn-oes
mgkg
1998 soils by reflux 036 3575 1703 2847 6738 4145 6146
SD 026 5219 1754 5487 9835 3859 4222
1998 soil by microwave 034 2775 1594 2041 7122 4061 6298
SD 023 3937 1515 4282 9392 3838 4196
RefluxMicrowave 111 131 103 136 096 098 097
SD 040 064 017 057 013 016 013
Because the differences relating to the efficiency of the digestion techniques used between surveys could
contribute to any indicated differences between surveys it was decided to ldquonormaliserdquo one set of
measurements to allow direct comparison As the 2007 measurements showed the highest precision for the
majority of the metals measured in both surveys (Cd Cu Pb Zn) and the microwave digestion method will be
applied in future soil metal research within CEH including any potential future CS analyses it was decided to
normalise the 1998 data to give concentration estimates for soil collected in 1998 assuming analysis
conducted according to the CS in 2007 method The back correction of the 1998 concentrations was
achieved by dividing the measured value by the ratio of mean 1998 2007 measurements for the BCR
CRM141R reference soil Correction was undertaken according to measurement in the reference soil for two
reasons Firstly these analyses were made at the same time that the CS soils themselves were measured
meaning that they are most likely to relate to operational conditions at the time of CS sample assessment
Secondly the CRM dataset contains a greater number of total measurements than the repeated 1998
dataset The back correction of the 1998 measurements gives an estimated value for 1 998 soils if measured
using the 2007 protocol The back correction procedure was conducted for 6 metals Cd Cr Cu N Pb Zn
but not for V This was because the large discrepancy in BCR CRM141R measurement between survey s for
this metal (78) and the mismatch between this comparison and the repeat measures questions the
reliability of the extraction method and data ldquonormalisationrdquo approaches used for this metal As a result V
has been excluded from the analysis of change between surveys
137
Countryside Survey Soils Report from 2007
7 Soil metal concentrations
Figure 71 Comparison of change in measure metal concentration following back correction of 1998 data to
account for differences resulting from changes in digestion procedure between the 1998 and 2007 survey in
relation to pH of the measure soil Red line indicates linear trend of change in relation to pH Absence of a
strong trend for change in relation to soil pH indicate that there is no effect of soil pH on the size of the
difference resulting from the digestion change meaning that a single value for back correction is applicable to
soils independent of pH
-2000
-1500
-1000
-0500
0000
0500
1000
1500
3 4 5 6 7 8 9 10
Soil pH
Ch
an
ge
soil C
d 1
99
8-2
007
(m
gk
g)
-40000
-20000
0000
20000
40000
60000
80000
100000
120000
140000
3 4 5 6 7 8 9 10
Soil pH
Ch
an
ge
soil C
r 1
99
8-2
007
(m
gk
g)
-30000
-20000
-10000
0000
10000
20000
30000
40000
50000
60000
3 4 5 6 7 8 9 10
Soil pH
Ch
an
ge
soil C
u 1
99
8-2
007
(m
gk
g)
-80000
-60000
-40000
-20000
0000
20000
40000
60000
3 4 5 6 7 8 9 10
Soil pH
Ch
an
ge
soil N
i 1
99
8-2
007
(m
gk
g)
-1000000
-800000
-600000
-400000
-200000
0000
200000
400000
600000
3 4 5 6 7 8 9 10
Soil pH
Ch
an
ge
soil P
b 1
99
8-2
007
(m
gk
g)
-40000
-20000
0000
20000
40000
60000
80000
3 4 5 6 7 8 9 10
Soil pH
Ch
an
ge
soil V
199
8-2
007
(m
gk
g)
-500000
-400000
-300000
-200000
-100000
0000
100000
200000
3 4 5 6 7 8 9 10
Soil pH
Ch
an
ge
soil Z
n 1
99
8-2
007
(m
gk
g)
Cd Cr
Cu Ni
Pb V
Zn
Cd_98_07_change = 0759 + 000300 PH2007 Cr_98_07_change = 018 - 00196 PH2007
Cu_98_07_change = 235 + 00427 PH2007 Ni_98_07_change = 036 - 000637 PH2007
Pb_98_07_change = - 022 + 000466 PH2007 V_98_07_change = 899 + 0211 PH2007
Zn_98_07_change = - 177 - 00425 PH2007
138
Countryside Survey Soils Report from 2007
7 Soil metal concentrations
Figure 72 Comparison of change in measure metal concentration following back correction of 1998 data to
account for differences resulting from changes in digestion procedure between the 1998 and 2007 survey in
relation to soil LOI Red lines indicate the linear trend for change as a function of LOI Absence of a strong trend
for change in relation to soil pH indicate that there is no effect of soil p H on the size of the difference resulting
from the digestion change meaning that a single value for back correction is applicable to soils independent of
LOI
Cd Cr
Cu Ni
Pb V
Zn
-2000
-1500
-1000
-0500
0000
0500
1000
1500
0 20 40 60 80 100
Soil loss on ignition
Ch
an
ge
soil
Cd
19
98
-20
07
(m
gk
g)
-40000
-20000
0000
20000
40000
60000
80000
100000
120000
140000
0 20 40 60 80 100
Soil loss on ignition
Ch
an
ge
soil
Cr
19
98
-20
07
(m
gk
g)
-30000
-20000
-10000
0000
10000
20000
30000
40000
50000
60000
0 20 40 60 80 100
Soil loss on ignition
Ch
an
ge
soil
Cu
19
98
-20
07
(m
gk
g)
-80000
-60000
-40000
-20000
0000
20000
40000
60000
0 20 40 60 80 100
Soil loss on ignition
Ch
an
ge
soil
Ni
19
98
-20
07
(m
gk
g)
-1000000
-800000
-600000
-400000
-200000
0000
200000
400000
600000
0 20 40 60 80 100
Soil loss on ignition
Ch
an
ge
soil
Pb
19
98
-20
07
(m
gk
g)
-40000
-20000
0000
20000
40000
60000
80000
0 20 40 60 80 100
Soil loss on ignition
Ch
an
ge
soil
V 1
99
8-2
00
7 (
mg
kg
)
-500000
-400000
-300000
-200000
-100000
0000
100000
200000
0 20 40 60 80 100
Soil loss on ignition
Ch
an
ge
soil
Zn
19
98
-20
07
(m
gk
g)
Cr_98_07_change = 015 - 000509 LOI2007
Cu_98_07_change = 270 + 000924 LOI2007 Ni_98_07_change = 045 - 000205 LOI2007
Pb_98_07_change = 225 + 000046 LOI2007 V_98_07_change = 104 + 00479 LOI2007
Zn_98_07_change = - 217 - 00104 LOI2007
Cd_98_07_change = 0938 + 0000107 LOI2007
139
Countryside Survey Soils Report from 2007
7 Soil metal concentrations
A potential concern with the back correction approach used to ldquonormaliserdquo measurements between surveys was that this could results in the false identification of change in some habit ats if the difference in digestion technique resulted in different ratios of measured metals in soils of differing properties such as pH LOI and metal concentration Any such trends with soil properties could under or over correct concentrations in particular soils types Since some habitats and vegetation classes are associated with certain soils (eg Bogs with low pH organic soils) this could lead to the erroneous identification of change in certain data stratifications To investigate whether soil properties had the potential to bias result by differentially affecting extraction efficiency between CS in 1998 and 2007 methods correlation plots were drawn between the predicted change between surveys and the potentially key soil properties of pH LOI a nd metal concentration For pH 5 metals (Cd Cu Ni Pb Zn) showed no clear trend of change with soil acidity ( Fig 71) This suggested that the relative digestion efficiency of the different methods is not affected by this parameter A small dependency of change in Cr concentration with pH was found indicating that association of habitats and vegetation classes with low pH could result in the incorrect identification of change with errors relating to indications of increased change in low pH soil and reduced change in high pH soil V showed a marked dependency of change on soil pH providing further support for exclusion of this metal from further analysis Against LOI all metals except V showed no clear trend of change ( Fig 72) Ideally investigation of the effect of metal concentration on relative extraction efficiency would also have been tested however this analysis is affected by regression to the mean issues which means that the significant trends seen which indicates positive change at low concentrations and negative change at high concentrations are explained by statistical chance rather than a real concentration dependent effect Overall the analysis of the effect of all testable soil properties supported the use of a single factor for back correction of the CS in 1998 measurements with a slight caveat for soil Cr concentrations in respect of pH
724 Reporting
Measured soil elemental concentrations for Li Be Al Ti V Cr Mn Fe Co Ni Cu Zn As Rb Se Sr Mo Cd Sb Sn Cs Ba W Hg Pb U P and S have been analysed to provide information on the state and in seven cases (Cd Cr Cu Ni Pb V and Zn) change since CS in 1998 Data were analysed using the standard mixed model analysis appropriate to CS measurements The statistical approach used for analys is for change involved bootstrapping which allows for non-normality in the data without the necessity of knowing details of actual distribution As such it provides a more accurate measurement of significance A nnex F of Emmett et al (2008) provides a background document describing this approach The data in this report describes analysis of concentrations in CS in 2007 and changes since CS in 1998 for Cd Cr Cu Ni Pb Zn in soils (0 -15 cm) by Broad Habitat Aggregate Vegetation Class (AVC) and soil LOI class
Results are reported by three major categories for Great Britain and individual countries
Broad Habitat - the Broad Habitat classification consists of 27 habitats which account for the entire
land surface of Great Britain and the surrounding sea Countryside Survey reports on 10 major
terrestrial habitats
Aggregate Vegetation Class (AVC) ndash is a high level grouping of vegetation types produced from a
quantitative hierarchical classification of the different plant species found in the original Countryside
Survey sample plots Soil organic matter (LOI) category - mineral (0-8 LOI 0-44 g C kg
-1) humus-mineral (8 ndash 30 LOI
44-165 g C kg-1
) organo-mineral (30 ndash 60 LOI 165-330 g C kg-1
) and organic (60 ndash 100 gt 330 g
C kg-1
) Analysis of concentrations by Broad Habitat class and soil type is also briefly reported for As Mn Se Co Hg Mo Al and Ti Significant results relate to statistical significance with their ecological and policy relevance highlighted where appropriate Soil Arsenic (As) levels were interpolated using median indicator kriging to predict the probability of a threshold value of As concentration (807 mgkg) being exceeded A probability of 1 or above indicates that the data exceeds the specified threshold value at that location This method of spatial interpolation is particularly suited to interpreting heavy metals where point values can h ave large point scale variability rendering ordinary kriging unsuitable Data was interpolated onto a 1 km UK grid The change for soil Cu was
140
Countryside Survey Soils Report from 2007
7 Soil metal concentrations
mapped using kriging to interpolate between the Countryside Survey sample points Routine checking of data for outliers was conducted and the working data set was transformed using a normal score procedure to obtain a Gaussian distribution The data were then interpolated on a 1km UK grid using ordinary kriging and finally the kriged data were back-transformed to produce an interpolated map of Cu change
73 Results
731 Repeat measured metals comparison of CS data in 1998 and 2007
Cadmium The mean concentration of Cd measured in GB soils collected in 2007 was 0404 mgkg This compares with an mean concentration of 0417 mgkg measured in soil sample for CS in 1998 (Table 73 Fig 73) This represents a non-significant change in measured Cd concentration of 0013 mgkg between surveys Stratification of the data indicated that significant changes in soil Cd concentrations were not found in any Broad Habitat although it was notable that four habitats that are associated with minimal management namely Coniferous Woodland Acid Grassland Dwarf Shrub Heath and Fen Marsh and Swamp showed relatively large non-significant decreases in soil Cd concentration (in the region of 005 mgkg magnitude) In contrast habitats associated with more intensive management such as Arable and Horticulture and Improved Grassland showed smaller changes represented by a decline of 0003 mgkg and increase of 0029 mgkg respectively Bog habitats also showed a small non-significant increase in measured soil Cd Stratification by AVC indicated a significant reduction in measured soil Cd concentrations in Heath and Bog Here mean measured concentrations reduced to 0399 mgkg in 2007 from a mean of 0475 mgkg in 1998 Significant change was not found for any other AVC Stratification by soil LOI category indicated no significant change in Cd concentrations in Mineral Humus mineral and Organic soils In Organo-mineral soils a significant decrease of 0309 mgkg was found in 2007 when compared to 1998 values This category of soils is however represented by only a relatively small number of samples in the repeat sample dataset f or Cd which may be a contributing factor towards the observed change for this LOI class
141
Countryside Survey Soils Report from 2007
7 Soil metal concentrations
c) Great Britain - Soil LOI Category
Soil LOI category 1998 2007 1998-2007
Mineral 032 0332
Humus-mineral 0421 0412
Organo-mineral 0557 0246
Organic 0483 0452
Direction of
significant
changes
Soil Cd concentration
(mgkg)
Table 74 Changes in concentration of Cd (mgkg) in soils (0 -15 cm depth) within a) Broad Habitats b)
Aggregate Vegetation Classes and c) Soil LOI categories across Great Britain Arrows denote a significant
change (plt005) in the direction shown
a) Great Britain - Broad Habitats
Broad Habitat 1998 2007 1998-2007
Broadleaved Mixed and Yew Woodland 0413 0418
Coniferous Woodland 0308 0256
Arable and Horticulture 0355 0352
Improved Grassland 0389 0418
Neutral Grassland 0458 0416
Acid Grassland 0458 0404
Dwarf Shrub Heath 0457 0392
Fen Marsh and Swamp 0553 042
Bog 0631 0646
All habitat types 0417 0404
b) Great Britain - Aggregate Vegetation Class
AVC 1998 2007 1998-2007
Crops and weeds 0355 0359
Tall grass and Herb 0447 0409
Fertile grassland 0367 0365
Infertile grassland 0475 0446
Lowland woodland 0576 0612
Upland Woodland 0269 0197
Moorland grass mosaics 0405 0376
Heath and bog 0475 0399
All vegetation types 0417 0404
Direction of
significant
changes
Direction of
significant
changesSoil Cd concentration
(mgkg)
Soil Cd concentration
(mgkg)
142
Countryside Survey Soils Report from 2007
7 Soil metal concentrations
Figure 73 Changes (+- 95 CIs) in measured soil Cd concentration in soils (0-15 cm depth) within a) Broad
Habitats b) Aggregate Vegetation Classes and c) Soil LOI categories across Great Britain Standard errors are
indicated Significant differences p lt 005 p lt 001 p lt 0001 are shown
The mean concentration of Cr in GB soils was 213 mgkg in CS in 2007 compared to the mean of 224 mgkg in 1998 (Table 75 Fig 74) This represents a non-significant decrease of 11 mgkg Stratification of the data to assess change in measured Cr by Broad Habitats indicated significant reductions in soil Cr concentrations between surveys in Broadleaved Woodland Arable and Horticulture and Improved and Neutral Grasslands In contrast in Bogs there was a significant increased in measured soil Cr T his increase was however from a low baseline level as Cr concentrations in Bog were lower than in any other habitat in both surveys (46 mgkg in 1998 and 76 mgkg in 2007) In other Broad Habitats observed changes were non-significant with Coniferous Woodland Dwarf Shrub Heath and Fen Marsh and Swamp all showing small non-significant increases in mean measured Cr concentration Stratification by AVC partly reflected the trends seen within the Broad Habitats Significant decreases in measured Cr concentrations were found in Crop and Weed and Fertile Grassland Non-significant decreases were found in Tall Grass and Herb and Infertile Grassland In contrast a significant increase in measured soil Cr was found in Heath and Bog soils and non-significant increases in Upland Woodland and Moorland Grass Mosaic Stratification by soil LOI category indicated a significant decrease in measured Cr concentrations in Mineral and Humus -mineral soils and a significant increase in Organic soils
-020
-015
-010
-005
000
005
010
Bro
adlea
f
Coni
fer
Ara
ble
Impro
ved
Gra
ss
Neut
ral G
rass
Acid
Gra
ss
Shr
ub Hea
th
Bog
All ha
bita
ts
Ch
an
ge i
n s
oil
Cd
co
ncen
trati
on
(mg
kg
)
-020
-015
-010
-005
000
005
010
Cro
ps a
nd w
eeds
Tall g
rass
and
Her
b
Fertile
grass
land
Infe
rtile g
rass
land
Upla
nd W
oodlan
d
Moo
rland
gra
ss m
osaics
Heat
h and
bog
All ve
geta
tion
type
s
Ch
an
ge i
n s
oil
Cd
co
ncen
trati
on
(mg
kg
)
-040
-030
-020
-010
000
010
020
Min
eral
Hum
us-m
iner
al
Org
ano
-min
eral
Org
ani
c
Ch
an
ge in
so
il C
d c
on
cen
trati
on
(mg
kg
)
a) Broad Habitats
c) LOI categoriesb) Aggregate vegetation class
143
Countryside Survey Soils Report from 2007
7 Soil metal concentrations
c) Great Britain - Soil LOI Category
Soil LOI category 1998 2007 1998-2007
Mineral 268 236
Humus-mineral 28 264
Organo-mineral 183 247
Organic 41 53
Direction of
significant
changes
Soil Cr concentration
(mgkg)
Table 75 Changes in concentration of Cr (mgkg) in soils (0-15 cm depth) within a) Broad Habitats b) Aggregate
Vegetation Classes and c) Soil LOI categories across Great Britain Arrows denote a significant change (plt005)
in the direction shown
a) Great Britain - Broad Habitats
Broad Habitat 1998 2007 1998-2007
Broadleaved Mixed and Yew Woodland 227 195
Coniferous Woodland 128 139
Arable and Horticulture 295 254
Improved Grassland 282 264
Neutral Grassland 276 239
Acid Grassland 169 199
Dwarf Shrub Heath 11 186
Fen Marsh and Swamp 208 216
Bog 46 76
All habitat types 224 213
b) Great Britain - Aggregate Vegetation Class
AVC 1998 2007 1998-2007
Crops and weeds 295 261
Tall grass and Herb 321 288
Fertile grassland 286 262
Infertile grassland 27 253
Upland Woodland 232 237
Moorland grass mosaics 157 173
Heath and bog 48 71
All vegetation types 224 213
Direction of
significant
changesSoil Cr concentration
(mgkg)
Soil Cr concentration
(mgkg)
Direction of
significant
changes
144
Countryside Survey Soils Report from 2007
7 Soil metal concentrations
Figure 74 Changes (+- 95 CIs) in measured soil Cr concentration in soils (0-15 cm depth) within a) Broad
Habitats b) Aggregate Vegetation Classes and c) Soil LOI categories across Great Britain Standard errors are
indicated Significant differences p lt 005 p lt 001 p lt 0001 are shown
Copper The mean concentration of Cu in GB soils analysed in CS in 2007 was 186 mgkg ( Table 76 Fig 75) This is higher than the mean concentration of 166 mgkg measured in 1998 This represents a statistically significant increase in soil Cu concentrations of 2 mgkg between surveys Stratification of the data to analyse change by Broad Habitats indicated that the increase in Cu concentration detected in the GB wide soil dataset was evident in all Broad Habitats with the magnitude of change ranging from 02 mgkg in Arable and Horticulture soils to 6 mgkg in Dwarf Shrub Heath In 3 of the 9 Broad Habitats the increase in soil Cu was statistically significant These were Improved Grassland Dwarf Shrub Heath and Bogs which showed changes in measured soil Cu concentrations of 26 6 and 41 mgkg respectively Stratification by AVC indicated an increase in soil Cu concentrations in all vegetation types except for Tall Grass and Herb and Upland Woodland for which small non-significant decreases were found Three AVC categories showed significant increases in measured soil Cu There were Fertile Grassland Moorland Grass Mosaic and Heath and Bog within which increases were 41 5 and 33 mgkg respectively Analysis by soil LOI category indicated an increase of between 17 and 33 mgkg for the four soil type stratifications The measured increases were significant for 3 out of 4 categories namely the Mineral Humus-mineral and Organic soils
-10
-5
0
5
10
15
20
25
Bro
adlea
f
Coni
fer
Ara
ble
Impro
ved
Gra
ss
Neut
ral G
rass
Acid
Gra
ss
Shr
ub Hea
th
Bog
All ha
bita
ts
Ch
an
ge i
n s
oil
Cr
co
ncen
trati
on
(mg
kg
)
-10
-5
0
5
10
15
20
25
Min
eral
Hum
us-m
iner
al
Org
ano-m
iner
al
Org
anic
Ch
an
ge in
so
il C
r co
ncen
trati
on
(mg
kg
)
-10
-5
0
5
10
15
20
25
Cro
ps a
nd w
eeds
Tall g
rass
and
Her
b
Fertile
grass
land
Infe
rtile g
rass
land
Upla
nd W
oodlan
d
Moo
rland
gra
ss m
osaics
Heat
h and
bog
All ve
geta
tion
type
s
Ch
an
ge i
n s
oil
Cr
co
ncen
trati
on
(mg
kg
)
a) Broad Habitats
c) LOI categoriesb) Aggregate vegetation class
145
Countryside Survey Soils Report from 2007
7 Soil metal concentrations
c) Great Britain - Soil LOI Category
Soil LOI category 1998 2007 1998-2007
Mineral 178 195
Humus-mineral 198 221
Organo-mineral 161 195
Organic 74 103
Direction of
significant
changes
Soil Cu concentration
(mgkg)
Table 76 Changes in concentration of Cu (mgkg) in soils (0 -15 cm depth) within a) Broad Habitats b)
Aggregate Vegetation Classes and c) Soil LOI categories across Great Britain Arrows denote a significant
change (plt005) in the direction shown
a) Great Britain - Broad Habitats
Broad Habitat 1998 2007 1998-2007
Broadleaved Mixed and Yew Woodland 259 263
Coniferous Woodland 92 102
Arable and Horticulture 205 207
Improved Grassland 169 195
Neutral Grassland 226 237
Acid Grassland 124 147
Dwarf Shrub Heath 10 16
Fen Marsh and Swamp 172 191
Bog 69 11
All habitat types 166 186
b) Great Britain - Aggregate Vegetation Class
AVC 1998 2007 1998-2007
Crops and weeds 194 20
Tall grass and Herb 266 258
Fertile grassland 198 239
Infertile grassland 189 202
Lowland wooded 349 368
Upland Woodland 133 124
Moorland grass mosaics 109 159
Heath and bog 73 106
All vegetation types 166 19
Direction of
significant
changes
Direction of
significant
changesSoil Cu concentration
(mgkg)
Soil Cu concentration
(mgkg)
146
Countryside Survey Soils Report from 2007
7 Soil metal concentrations
Figure 75 Changes (+- 95 CIs) in measured soil Cu concentration in soils (0-15 cm depth) within a) Broad
Habitats b) Aggregate Vegetation Classes and c) Soil LOI categories across Great Britain Standard errors are
indicated Significant differences p lt 005 p lt 001 p lt 0001 are shown
Nickel The mean concentration of Ni in GB soils collected and analysed in the 2007 survey was 18 mgkg (Table 77 Fig 76) This is slightly although not significantly lower than the mean measured concentration in 1998 of 184 mgkg Within the different Broad Habitat categories a statistically significant decrease in soil Ni was found in 3 These were Broadleaved Woodland where concentrations fell by 2 mgkg and Arable and Horticulture where concentrations reduced by 18 mgkg and Neutral Grassland where a 21 mgkg decrease were found There was one habitat where measured soil Ni concentrations significantly increased between surveys This was Bog within which mean measured soil Ni concentrations increased 41 mgkg Analysis by AVC indicated significant change of measured Ni concentrations in Crop and We ed only Here a significant reduction in measured concentrations of 17 mgkg was found Analysis by soil LOI category indicated no significant change across any of the four soil classes
-8
-4
0
4
8
12
Bro
adlea
f
Coni
fer
Ara
ble
Impro
ved
Gra
ss
Neut
ral G
rass
Acid
Gra
ss
Shr
ub Hea
th
Bog
All ha
bita
ts
Ch
an
ge i
n s
oil
Cu
co
ncen
trati
on
(mg
kg
)
-8
-4
0
4
8
12
Min
eral
Hum
us-m
iner
al
Org
ano
-min
eral
Org
ani
c
Ch
an
ge in
so
il C
u c
on
cen
trati
on
(mg
kg
)
-8
-4
0
4
8
12
Cro
ps a
nd w
eeds
Tall g
rass
and
Her
b
Fertile
grass
land
Infe
rtile g
rass
land
Upla
nd W
oodlan
d
Moo
rland
gra
ss m
osaics
Heat
h and
bog
All ve
geta
tion
type
s
Ch
an
ge i
n s
oil
Cu
co
ncen
trati
on
(mg
kg
)
a) Broad Habitats
c) LOI categoriesb) Aggregate vegetation class
147
Countryside Survey Soils Report from 2007
7 Soil metal concentrations
c) Great Britain - Soil LOI Category
Soil LOI category 1998 2007 1998-2007
Mineral 197 189
Humus-mineral 195 191
Organo-mineral 249 253
Organic 35 35
Direction of
significant
changes
Soil Ni concentration
(mgkg)
Table 77 Changes in concentration of Ni (mgkg) in soils (0 -15 cm depth) within a) Broad Habitats b) Aggregate
Vegetation Classes and c) Soil LOI categories across Great Britain Arrows denote a significant change (plt005)
in the direction shown
a) Great Britain - Broad Habitats
Broad Habitat 1998 2007 1998-2007
Broadleaved Mixed and Yew Woodland 179 159
Coniferous Woodland 9 99
Arable and Horticulture 219 201
Improved Grassland 169 195
Neutral Grassland 226 205
Dwarf Shrub Heath 102 160
Fen Marsh and Swamp 172 191
Bog 69 110
All habitat types 184 18
b) Great Britain - Aggregate Vegetation Class
AVC 1998 2007 1998-2007
Crops and weeds 216 199
Tall grass and Herb 23 228
Fertile grassland 195 194
Infertile grassland 205 193
Lowland wooded 184 18
Upland Woodland 143 148
Moorland grass mosaics 25 24
Heath and bog 70 74
All vegetation types 184 18
Direction of
significant
changes
Direction of
significant
changesSoil Ni concentration
(mgkg)
Soil Ni concentration
(mgkg)
148
Countryside Survey Soils Report from 2007
7 Soil metal concentrations
Figure 76 Changes (+- 95 CIs) in measured soil Ni concentration in soils (0 -15 cm depth) within a) Broad
Habitats b) Aggregate Vegetation Classes and c) Soil LOI categories across Great Britain Standard errors are
indicated Significant differences p lt 005 p lt 001 p lt 0001 are shown
Lead The mean measured concentration of Pb in GB soils in 2007 was 804 mgkg ( Table 78 Fig 77) This is slightly although not significantly lower than the measured mean concentration of 825 mgkg found in 1998 Stratification of the data by Broad Habitat indicated that there was an increase of between 04 and 204 mgkg in 4 of 8 habitats In two habitats namely Improved Grassland and Dwarf Shrub Heath this increase was statistically significant The remaining habitats showed non -significant decreases in measured soil Pb concentrations ranging from 17 mgk in Fen Marsh and Swamp to 455 mgkg in Acid Grassland When data was analysed by AVC no significant changes in soil Pb concentration were found for any category Similarly stratification of the data by Soil LOI class did not highlight significant changes in measured soil Pb concentration between different soi l types
-15
-10
-5
0
5
10
15
Bro
adlea
f
Coni
fer
Ara
ble
Impro
ved
Gra
ss
Neut
ral G
rass
Shr
ub H
eath
Bog
All ha
bita
ts
Ch
an
ge i
n s
oil
Ni
co
ncen
trati
on
(mg
kg
)
-15
-10
-5
0
5
10
15
Cro
ps a
nd w
eeds
Tall g
rass
and
herb
Fertile
grass
land
Infe
rtile g
rass
land
Upla
nd w
ooded
Moo
rland
gra
ss m
osaics
Heat
h and
bog
All ve
geta
tion
type
s
Ch
an
ge i
n s
oil
Ni
co
ncen
trati
on
(mg
kg
)
-15
-10
-5
0
5
10
15
Min
eral
Hum
us-m
iner
al
Org
ano
-min
eral
Org
ani
c
Ch
an
ge in
so
il N
i co
ncen
trati
on
(mg
kg
)
a) Broad Habitats
c) LOI categoriesb) Aggregate vegetation class
149
Countryside Survey Soils Report from 2007
7 Soil metal concentrations
Table 78 Changes in concentration of Pb (mgkg) in soils (0 -15 cm depth) within a) Broad Habitats b)
Aggregate Vegetation Classes and c) Soil LOI categories across Great Britain Arrows denote a significant
change (plt005) in the direction shown
a) Great Britain - Broad Habitats
Broad Habitat 1998 2007 1998-2007
Coniferous Woodland 816 782
Arable and Horticulture 415 419
Improved Grassland 55 664
Neutral Grassland 609 526
Acid Grassland 1188 763
Dwarf Shrub Heath 679 883
Fen Marsh and Swamp 642 625
Bog 562 592
All habitat types 825 804
b) Great Britain - Aggregate Vegetation Class
AVC 1998 2007 1998-2007
Crops and weeds 449 454
Tall grass and Herb 638 614
Fertile grassland 560 617
Infertile grassland 627 589
Upland Woodland 853 780
Moorland grass mosaics 887 829
Heath and bog 704 705
All vegetation types 825 804
Direction of
significant
changes
Direction of
significant
changesSoil Pb concentration
(mgkg)
Soil Pb concentration
(mgkg)
c) Great Britain - Soil LOI Category
Soil LOI category 1998 2007 1998-2007
Mineral 413 426
Humus-mineral 1295 1269
Organo-mineral 997 985
Organic 752 682
Direction of
significant
changes
Soil Pb concentration
(mgkg)
150
Countryside Survey Soils Report from 2007
7 Soil metal concentrations
Figure 77 Changes (+- 95 CIs) in measured soil Pb concentration in soils (0-15 cm depth) within a) Broad
Habitats b) Aggregate Vegetation Classes and c) Soil LOI categories across Great Britain Standard errors are
indicated Significant differences p lt 005 p lt 001 p lt 0001 are shown
Zinc The mean concentration of Zn in GB soils in CS in 2007 was 773 mgkg ( Table 79 Fig 78) This is lower than the mean concentration of 804 mgkg found in 1998 This reduction of 31 mgkg in soil Zn in GB is not statistically significant Stratification of the data to analyse change in soil Zn concentration by Broad Habitat indicated that mean concentration were lower in 2007 than in 1998 in 7 of 10 h abitats This reduction in soil Zn was significant in two habitats These were Arable and Horticulture in which concentration fell on average by 57 mgkg and Neutral Grassland in which concentrations fell by 104 mgkg A significant increase in soil Zn concentration of 72 mgkg was found in Bog habitats All other changes in measured soil Zn by Broad Habitats were not significant When data was analysed by AVC no significant changes in soil Zn concentration were indicated for any vegetation class Strat ification of the data by LOI class also failed to identify significant changes in measured Zn between soil types
-100
-80
-60
-40
-20
0
20
40
Bro
adlea
f
Coni
fer
Ara
ble
Impro
ved
Gra
ss
Neut
ral G
rass
Acid
Gra
ss
Shr
ub Hea
th
Bog
All ha
bita
ts
Ch
an
ge i
n s
oil
Pb
co
ncen
trati
on
(mg
kg
)
-100
-80
-60
-40
-20
0
20
40
Cro
ps a
nd w
eeds
Tall g
rass
and
Her
b
Fertile
grass
land
Infe
rtile g
rass
land
Upla
nd W
oodlan
d
Moo
rland
gra
ss m
osaics
Heat
h and
bog
All ve
geta
tion
type
s
Ch
an
ge i
n s
oil
Pb
co
ncen
trati
on
(mg
kg
)
-100
-80
-60
-40
-20
0
20
40
Min
eral
Hum
us-m
iner
al
Org
ano
-min
eral
Org
ani
c
Ch
an
ge in
so
il P
b c
on
cen
trati
on
(mg
kg
)
a) Broad Habitats
c) LOI categoriesb) Aggregate vegetation class
151
Countryside Survey Soils Report from 2007
7 Soil metal concentrations
c) Great Britain - Soil LOI Category
Soil LOI category 1998 2007 1998-2007
Mineral 885 824
Humus-mineral 100 1006
Organo-mineral 61 357
Organic 342 376
Direction of
significant
changes
Soil Zn concentration
(mgkg)
Table 79 Changes in concentration of Zn (mgkg) in soils (0 -15 cm depth) within a) Broad Habitats b)
Aggregate Vegetation Classes and c) Soil LOI categories across Great Britain Arrows denote a significant
change (plt005) in the direction shown
a) Great Britain - Broad Habitats
Broad Habitat 1998 2007 1998-2007
Broadleaved Mixed and Yew Woodland 864 857
Coniferous Woodland 446 485
Arable and Horticulture 901 844
Improved Grassland 1076 1043
Neutral Grassland 995 891
Acid Grassland 422 439
Bracken 507 399
Dwarf Shrub Heath 407 389
Fen Marsh and Swamp 682 583
Bog 485 577
All habitat types 804 773
b) Great Britain - Aggregate Vegetation Class
AVC 1998 2007 1998-2007
Crops and weeds 943 919
Tall grass and Herb 117 1055
Fertile grassland 1033 1024
Infertile grassland 1061 776
Lowland woodland 1046 1087
Upland Woodland 513 482
Moorland grass mosaics 45 433
Heath and bog 357 363
All vegetation types 804 77
Direction of
significant
changesSoil Zn concentration
(mgkg)
Soil Zn concentration
(mgkg)
Direction of
significant
changes
152
Countryside Survey Soils Report from 2007
7 Soil metal concentrations
Figure 78 Changes (+- 95 CIs) in measured soil Zn concentration in soils (0 -15 cm depth) within a) Broad
Habitats b) Aggregate Vegetation Classes and c) Soil LOI categories across Great Britain Standard errors are
indicated Significant differences p lt 005 p lt 001 p lt 0001 are shown
732 Metals measured only in CS in 2007
Use of a combined ICP-OES approach allowed extension of the suite of measured metal concentrations beyond the initial set of seven metals measured in 1998 to include a total assessment of the concentrations of 26 metal or metalloid elements (Li Be Al Ti V Cr Mn Fe Co Ni Cu Zn As Rb Se Sr Mo Cd Sb Sn Cs Ba W Hg Pb U as well as Cd Cr Cu Ni Pb V and Zn) in almost 500 GB soil samples Seven of these single time point measured metals are reported here but the full dataset is available for download from the CS website The analysis includes stratification of the data available for each chosen metal by Broad Habitat and Soil LOI category The seven chosen metals and metalloids have been selected for initial assessment because they have a known toxicity to humans and wildlife and so have been of long -standing
-75
-50
-25
0
25
Bro
adlea
f
Coni
fer
Ara
ble
Impro
ved
Gra
ss
Neut
ral G
rass
Acid
Gra
ss
Shr
ub Hea
th
Bog
All ha
bita
ts
Ch
an
ge i
n s
oil
Zn
co
ncen
trati
on
(mg
kg
)
-75
-50
-25
0
25
Cro
ps a
nd w
eeds
Tall g
rass
and
Her
b
Fertile
grass
land
Infe
rtile g
rass
land
Upla
nd W
oodlan
d
Moo
rland
gra
ss m
osaics
Heat
h and
bog
All ve
geta
tion
type
s
Ch
an
ge i
n s
oil
Zn
co
ncen
trati
on
(mg
kg
)
-75
-50
-25
0
25
Min
eral
Hum
us-m
iner
al
Org
ano
-min
eral
Org
ani
c
Ch
an
ge in
so
il Z
n c
on
cen
trati
on
(mg
kg
)
a) Broad Habitats
c) LOI categoriesb) Aggregate vegetation class
153
Countryside Survey Soils Report from 2007
7 Soil metal concentrations
regulatory concern because they are essential metals that can elicit both deficiency at low concentration and toxicity at high concentration and or because new application (fuel additive nanomaterial) means that current commercial and consumer product uses are increasing Specific reason for selection for each metalmetalloid are
Al is selected as it is common in soils and has been w idely implicated in toxicity during
acidification
As is selected as it is a known risk for food chain transfer to wildlife and humans
Mn is selected as it is widely used in an increasing number of commercial products
Hg is selected because it is the focus of the Defra Critical Loads metals project and also because
no change has been detected in European Moss Surveys indicating continued deposition at historic
rates
Mo is selected as it is essential and is currently one of the focus metals for EU wide m etals risk
assessment activities
Se is selected as it has a small ldquowindow of essentialityrdquo meaning it is known to cause toxicity at
high concentration but and also to be deficient at low levels in soil
Ti is selected as it is of growing regulatory concern due to commercial uses including in
nanoparticle forms
Aluminium Concentrations of aluminium were higher than those of Cd Cu Cr Ni Pb Zn As Mn Hg Mo Se or Ti by at least a factor of ten and more than this in many cases Within Broad Habitats concentration ranged from 2060 mgkg in Bog to almost 12000 mgkg in Arable and Horticulture and Improved Grassland soils Habitats that are associated with lowland areas on mineral soils such as Improved and Neutral Grassland and Arable and Horticulture contained significantly higher Al concentrations than habitats such as Dwarf Shrub Heath and Bog which are associated with upland areas on organic of organo -mineral soils (Fig 79) The analysis by LOI indicates that Al concentrations in soils are significantly different in organic soils when compared to the three remaining soil categories Since organic soils are most commonly found in habitats such as Bog and Dwarf Shrub Heath this suggests that the soil type associated with these habitats may have important influences on soil Al concentration Particularly important are likely to be the lower pH of soils in upland habitats and also high rainfall rates found in these areas Both of these factors can lead to greater metal mobility resulting in greater leaching losses Figure 79 Measured soil Al concentration (+- 95 CIs) in soils (0-15 cm depth) within a) Broad Habitats b) Soil
LOI categories across Great Britain Columns not sharing the same letter are significantly different at p lt 005
level
ba
0
2000
4000
6000
8000
10000
12000
14000
16000
Bro
adlea
f
Coni
fer
Ara
ble
Impro
ved
Gra
ss
Neut
ral G
rass
Acid
Gra
ss
Shr
ub Hea
th
Bog
S
oil
Al
co
ncen
trati
on
(mg
kg
) a
bb
ab
a
c
d
a
0
2000
4000
6000
8000
10000
12000
14000
Min
eral
Hum
us-
min
era
l
Org
ano-
min
eral
Org
anic
So
il A
l co
ncen
trati
on
(mg
kg
)
aa
b
a
154
Countryside Survey Soils Report from 2007
7 Soil metal concentrations
Arsenic
Concentrations of arsenic analysed by Broad Habitat ranged 302 mgkg in Bog to 1102mgkg in soils under
Improved Grassland (Fig 710) When As concentration are compared across habitats it is evident that the
highest concentration like those for Al are found in Arable and Horticulture and Improved and Neutral
Grasslands Acid Grassland and Broadleaved and Coniferous Woodland soils were intermediate while
habitats associated with more remote and upland area such as Bogs and Dwa rf Shrub Heath soils contain
significantly lower As concentration than soils in lowland agricultural habitats ( Fig 710) Analysis by soil LOI
category indicated that soil As concentrations were significantly higher in mineral soils than in Organo -
mineral and Organic soils (Fig 710)
Figure 710 Measured soil As concentration (+ - 95 CIs) in soils (0-15 cm depth) within a) Broad Habitats b)
Soil LOI categories across Great Britain Columns not sharing the same letter are significantly different at p lt
005 level
Soil Arsenic (As) levels in GB soils measure in CS in 2007 were interpolated using median indicator kriging
to predict the probability of exceeding the median value of the data set (807 mgkg) The use of indicator
kriging rather than ordinary kriging and spatial interpolation arises because of the type of data being
analyzed In the case of soil metals and metalloids the assumption of connectivity between sample points
with extreme values in space is not necessarily va lid As a result ordinary kriging incorporating these
extreme values provides erroneous interpolation biased towards extreme s Indicator kriging provides a
method of spatially interpreting the underlying patterns in the data without such a bias interpo lating the
probability that the data falls above or below a given threshold A probability of 1 or above indicates that the
data exceeds the specified threshold value represented by the median concentration (As 807 mgkg) at that
location Data were interpolated in this manner onto a 1 km GB grid Mapping of As concentration as the
probability to exceed median values indicates highest probability of exceedance (ie high likelihood of high
concentrations) in soil in the Midlands and south of England and Wales (Fig 711) This spatial distribution of
As reflects patterns in As concentration measured in previous soil and stream sediment surveys such as the
NSI soil metal survey and G-BASE The higher frequency of above average soil As concentrations found in
these regions can be linked to the known presence pf As rich Jurassic and Cretaceous rocks from which the
surfaces soils are derived Indeed areas of the south-west of England notably in Devon and Cornwall are
well known for the prevalence of historic arsenic mining areas (eg in the Tamar valley)
ba
0
2
4
6
8
10
12
14
Bro
adlea
f
Coni
fer
Ara
ble
Impro
ved
Gra
ss
Neut
ral G
rass
Acid
Gra
ss
Shr
ub Hea
th
Bog
So
il A
s c
on
cen
trati
on
(mg
kg
) bc
a a
c
ab
cd
d
bc
0
2
4
6
8
10
12
Min
eral
Hum
us-
min
era
l
Org
ano-
min
eral
Org
anic
So
il A
s c
on
cen
trati
on
(mg
kg
)
b
c
a
ab
155
Countryside Survey Soils Report from 2007
7 Soil metal concentrations
Figure 711 Map of probability that a plot exceeds the median value of 807 mgKg As in soils (0 -15 cm)
collected from across GB in CS in 2007 ndash value of one indicate guaranteed exceedance values of 0 non
exceedance
Manganese
Mean manganese concentrations varied between Broad Habitats by approximately an order of magnitude
ranging from 46 mgkg in Bog and 566 mgkg in Dwarf Shrub Heath to 558 mgkg and 495 mgkg in the
Arable and Horticulture and Improved Grassland soils As for Al and As highest Mn concentrations were
found in habitat categories that are associated with lowland areas located principally on mineral soils These
include soils in Improved and Neutral Grassland and Arable and Horticulture habitats Upland habitats
located on acid organic soils such as Bog Dwarf Shrub Heath and also Acid Grassland showed the lowest
Mn concentrations Coniferous and Broadleaved Woodlands were intermediate Analysis by L OI supported a
role for soil type alone in determining the patterns of Mn concentration between Broad Habitats A clear
pattern of significant reduction in measured Mn concentrations was found in soil categories of increasing LOI
(Fig 712) This suggests that the soil characteristics in some habitats such as the lower mineral soil
content and typically lower pH values of Bog Dwarf Shrub Heath and Acid Grassland habitats coupled to
high rainfall in the upland areas may be important in explaining obser ved differences through their effects on
leaching rates
156
Countryside Survey Soils Report from 2007
7 Soil metal concentrations
Figure 712 Measured soil Mn concentration (+ - 95 CIs) in soils (0-15 cm depth) within a) Broad Habitats b)
Soil LOI categories across Great Britain Columns not sharing the same letter are sig nificantly different at p lt
005 level
Mercury Mercury was the sole metal amongst the 13 discussed in detail in this chapter for which measured concentration frequently did not exceed the analytical limits of detection Of the 414 samples successfully digested and analysed for Hg concentration 175 (42) contained Hg concentrations that were below the detection limit of 0067mgkg When correcting the low level unquantified samples to a value of half the analytical detection limit in accordance with standard practice measured Hg concentration between habitats ranged from 0052 mgkg in Arable and Horticulture soil to 0187 in Bog Stratification by Broad Habitat indicated a contrasting trend to Al As and Mn for soil Hg Thus highest concentrations were found in Bogs Dwarf Shrub Heath and Acid Grassland and lowest concentration in Arable and Horticulture and Improved and Neutral Grassland Hg concentrations were also influence by soil LOI category showing significant differences between all treatments with highest values in organic soils ( Fig 713) At high concentrations Hg is known to be toxic to biota and also to accumulate in food chains High Hg concentrations have for example been detected in tissues of piscivorus species in the UK Predatory Bird Monitoring Scheme suggesting that this may be an important exposure route particularly for organic mercury The presence of higher concentrations of Hg associated with habitats such as Acid Grassland Dwarf Shrub Heath and Bog and with Organic soils indicates that the greatest potential for Hg exposure in wildlife is likely to occur in these principally upland areas
ba
0
100
200
300
400
500
600
700
Bro
adlea
f
Coni
fer
Ara
ble
Impro
ved
Gra
ss
Neut
ral G
rass
Acid
Gra
ss
Shr
ub Hea
th
Bog
So
il M
n c
on
cen
trati
on
(mg
kg
)
cd
a a
b
deef
f
bc
0
100
200
300
400
500
600
700
Min
eral
Hum
us-m
iner
al
Org
ano-
min
eral
Org
anic
So
il M
n c
on
cen
trati
on
(mg
kg
)
c
d
b
a
157
Countryside Survey Soils Report from 2007
7 Soil metal concentrations
Figure 713 Measured soil Hg concentration (+ - 95 CIs) in soils (0-15 cm depth) within a) Broad Habitats b)
Soil LOI categories across Great Britain Columns not sharing the same letter are significantly different at p lt
005 level
Molybdenum Mean molybdenum concentrations ranged between Broad Habitats by less than a factor of two Highest concentrations of 0979 mgkg were found in Dwarf Shrub Heath soils and lowest concentrations of 0581 mgkg in Coniferous Woodlands (Fig 714) The difference in Mo concentration between these two Broad Habitats was significant This was not the case for any other Broad Habitat pair except Coniferous Woodland and Bog Stratification by LOI indicated that mineral soils contain significantly lower Mo concentration than either Organo-mineral or Organic soils Difference in mean concentration were however a ctually rather small (maximum difference 02 mgkg between Mineral and Humus-mineral soils)
Figure 714 Measured soil Mo concentration (+ - 95 CIs) in soils (0-15 cm depth) within a) Broad Habitats b)
Soil LOI categories across Great Britain Columns not sharing the same letter are significantly different at p lt
005 level
ba
0
005
01
015
02
025
Bro
adlea
f
Coni
fer
Ara
ble
Impro
ved
Gra
ss
Neut
ral G
rass
Acid
Gra
ss
Shr
ub Hea
th
Bog
So
il H
g c
on
cen
trati
on
(mg
kg
)
c
d d
bc
ab
c
a
d
0
005
01
015
02
025
Min
eral
Hum
us-m
iner
al
Org
ano-
min
eral
Org
anic
So
il H
g c
on
cen
trati
on
(mg
kg
)
b
a
cd
ba
0
02
04
06
08
1
12
14
16
Bro
adlea
f
Coni
fer
Ara
ble
Impro
ved
Gra
ss
Neut
ral G
rass
Acid
Gra
ss
Shr
ub Hea
th
Bog
So
il M
o c
on
cen
trati
on
(mg
kg
) b abab ab
ab
a
aab
0
02
04
06
08
1
12
14
Min
eral
Hum
us-m
iner
al
Org
ano-
min
eral
Org
anic
So
il M
o c
on
cen
trati
on
(mg
kg
)
a
a
ab
b
158
Countryside Survey Soils Report from 2007
7 Soil metal concentrations
Selenium Se is an essential trace element that is also toxic at high concentrations Hence it is often stated to have a small ldquowindow of essentialityrdquo for env ironmental concentration within which neither deficiency or toxic would be anticipated Measured mean Se concentrations in CS in 2007 soils differed between Broad Habitats by approximately a factor of 4 Highest concentrations were in habitats associated w ith low pH organic rich upland soils such as Bog Dwarf Shrub Heath and Acid Grassland Lowest concentrations were in Arable and Horticulture and Improved and Neutral Grassland soils (Fig 715) Analysis by soil LOI stratification indicated significant differences in Se concentrations between all soils types with highest Se concentration associated Organic soils and a clear trend for decreasing concentration in lower LOI soils Cases of Se toxicity have most frequently been associated with point sourc e industrial release scenarios or the local consumption of vegetables grown on selenium-rich carbonaceous shale derived soils (as affected member of a rural Chinese population) Such exposure scenarios are not relevant to the GB situation indicating that Se toxicity is unlikely to be a major national issue of concern As well as high concentrations being toxic to humans as well as other plant and animal species Se can also affect plant growth and animal health as a result of deficiency Again in China th is has been linked both to effects of crop production and also to human disease (Wang and Gao 1998) Currently no criteria exist that set a critical concentration for Se deficiency in soils For plants growing on potentially Se deficient soils it is clear that the value for deficiency will depend on both the plant species considered and also the effect of soil properties on Se bioavailability Further for establishing a lower level for human food consumption and for animal (incl uding livestock) health the composition of the diet and the proportion that is grown on Se deficient soils is also an important factor especially when a prominent portion of diet sourced locally On the basis of published studies probable concentrations for deficiency are likely to be in the range 01-025 mgkg In GB soils no plot contains Se levels below these concentrations Taking a conservative value of 05 mgkg as an indication of potentially deficient soil only 8 of 414 plots (19) contain soi l Se level below this value Hence it is unlikely that deficiency in soils Se concentration is a major factor that is influencing the nature of prevalent plant communities across GB Figure 715 Measured soil Se concentration (+ - 95 CIs) in soils (0-15 cm depth) within a) Broad Habitats b)
Soil LOI categories across Great Britain Columns not sharing the same letter are significantly different at p lt
005 level
Titanium TiO2 is currently one of the most widely used nanoparticle types in consumer products Concerns about the potential effects of nanoparticle on human health and wildlife have resulted in a growing interest in the biogeochemistry of titanium Particularly important is to establish baseline concentration of Ti in so il waters and sediments since these provide a natural background against which any additional input of Ti in
ba
0
05
1
15
2
25
3
35
4
45
Bro
adlea
f
Coni
fer
Ara
ble
Impro
ved
Gra
ss
Neut
ral G
rass
Acid
Gra
ss
Shr
ub Hea
th
Bog
So
il S
e c
on
cen
trati
on
(mg
kg
)
a
aa a
a
a
a
a
0
05
1
15
2
25
3
35
4
Min
eral
Hum
us-m
iner
al
Org
ano-
min
eral
Org
anic
So
il S
e c
on
cen
trati
on
(mg
kg
)
b
a
c
d
159
Countryside Survey Soils Report from 2007
7 Soil metal concentrations
nanoparticle form would have to be detected In GB soil measured Ti concentrations ranged between Broad Habitats by approximately a factor of 3 from a highest concentration of 109 mgkg in Bog soils to 325 mgkg in Neutral Grassland (Fig 716) Between Broad Habitats soils from Bog Dwarf Shrub Heath and Acid Grassland contained higher concentrations than Arable and Horticulture and Neutral and Improved Grassland with Broadleaved and Coniferous Woodland intermediate Stratification by LOI indicated that mineral soils contained significantly lower Ti concentration than Oragno -mineral soils The analysis indicates a relatively high background level of Ti in GB soils (50-100 mgkg) against which any future inputs of titanium must be detected Figure 716 Measured soil Ti concentration (+ - 95 CIs) in soils (0-15 cm depth) within a) Broad Habitats b)
Soil LOI categories across Great Britain Columns not sharing the same letter are significantly different at p lt
005 level
74 Discussion and Policy Implications
A number of surveys have measured metal concentrations in soils and stream sediments collected from a network of sites within GB or constituent countries The UK Soil and Herbage Survey conducted by the Environment Agency (EA) for England and Wales measured concentrations of 13 elements (Cd Cr Cu Mn Hg Ni Pb Pt Ti V Zn Sn As Zn) in soil and vegetation from 122 rural sites 29 urban sites and 54 industrial sites across the UK (Ross et al 2007) Measurement of soil (015cm) trace element concentrations were accompanied by additional measurements of the concentration of organic pollutants including polychlorinated biphenyls polycyclic aromatic hydrocarbons and polychlorinated dioxins and furans Analysis of the data was conducted to assess mean concentration o f measure trace pollutants and metals in soil according to Country (England Scotland Wales) and site location ( rural urban industrial) All data from the UK Soil and Herbage Survey has been published To date however the sampling and analysis campaig n has not been repeated meaning that an assessment of change in trace element concentration is not possible within the dataset An extensive survey of metal concentration in UK soils has also been conducted within the framework of the National Soil Inventory (NSI) program This study has reported on a range of properties of UK soils including total and extractable metal concentrations in over 6000 soil samples collected across England and Wales with further data for Scotland available through the NSI Scotland Phase 1 and 2 projects A set of detailed spatially resolved maps have been produced from this data which include maps of soil metal concentration (McGrath and Loveland 1992) The Geochemical Baseline Survey of the Environment (G-BASE) which is coordinated by the British Geological Survey (BGS) is also a large scale and long running survey of stream water stream sediment and soil chemistry that has measured metal concentrations in stream and soil
ba
0
20
40
60
80
100
120
140
160
180
Bro
adlea
f
Coni
fer
Ara
ble
Impro
ved
Gra
ss
Neut
ral G
rass
Acid
Gra
ss
Shr
ub Hea
th
Bog
S
oil
Ti
co
ncen
trati
on
(mg
kg
)
bc
d cd d
ab
aa
cd
0
50
100
150
200
250
Min
eral
Hum
us-m
iner
al
Org
ano-
min
eral
Org
anic
So
il T
i co
ncen
trati
on
(mg
kg
)
a
a
a
b
160
Countryside Survey Soils Report from 2007
7 Soil metal concentrations
samples (5-20 cm depth) collected at an average density of one sample every 1ndash2 km2 of UK land surface
(wwwbgsacukgbasehomehtml) To date G-BASE has been completed for all regions except the Southern third of England with this area is scheduled for completion over the next decade Compared to the EA NSI and BGS surveys the soil component of Countryside Survey in 2007 has a spatial resolution for the trace metals comparable with that of the EA‟s UK Soils and Herbage survey The Soil and Herbage survey included 205 sample sites while CS has measurements for 256 squares although within each square 5 samples in CS in 1998 and 2 in CS in 2007 have been measured The spatial resolution of CS is however below those of either the G-BASE or the NSI datasets which each comprise a much greater number of analysed samples Compared to the other major soil and stream sediment survey con ducted in the UK CS is unique because sites are visited over a single season at time periods separated over a number of years (6-9 year intervals between surveys) Within the soil component of CS samples have been collected on three occasions in survey years (1978 1998 2007) and trace metal concentrations measured in the surveys in 1998 and 2007 This means that CS has the unique ability to look for large scale change in soil properties including trace metal concentrations over time within GB top soils (0-15 cm) Despite the (relatively) sparse spatial resolution CS soil metal analyses can nonetheless be a valuable addition to current knowledge on trace element concentrations in GB soils In particular because soil metal concentrations are not measured in isolation but instead form part of a wider survey of the physical chemical and biological characteristics of GB habitats measurement of soil metal concentrations can be stratified and correlated according to a range of other measurement parameters Metal content of soil is derived from two main sources (Boruvka et al 2005) - either naturally from the geogenic weathering of base rock during soil formation (pedogenesis) or anthropogenically through point source or diffuse pollution andor solid waste disposal (Merian et al 2004) There is therefore a need to consider both potential sources when assessing d ifference in metal concentration between habitats and also over time In the absence of human inputs it can be expected that the metal concentration of soils will reach a steady state which represents the balance of inputs derived from weathering and natu ral deposition (eg volcanic) and outputs due to leaching and vegetative off -take Additional human associated inputs can result in an increase in soil metal concentrations because the increased fluxes to soils will mean that inputs exceed outputs thereby allowing concentrations to rise As soil concentrations start to increase due to for example human associated deposition rates of leaching will begin to increase until eventually a new steady state at a higher soil metal concentration is reached - although this may take decades to hundreds of years depending upon the metal If inputs then reduce long-term reductions in soil concentrations may be initiated as leaching rates exceed inputs Available evidence from the UK Heavy Metal Deposition Monitor ing herbarium studies and Europe-wide survey of metal concentration in moss samples suggests that currently the rates of aerial deposition of metals to soils peaked in the UK in the 1960-1970s and are now in steady decline (RoTAP 2010) Legislation on the concentrations of metals present in fertilisers (especially Cd) domestic and industrial sludges and other waste streams regularly recovered to land have also been effective in reducing input concentrations for a range of trace elements Although input ra tes are likely to be decreasing work within Defra supported projects to assess environmental risks of metals for UK soils still predict exceedances of estimated critical load for Cd and Pb in 96 and 6 of UK soil respectively (Hall et al 2006) Comparison of the concentrations of Cd Cu Pb and Zn measured in CS soil samples in 1998 also indicated that measured concentrations exceeded the soil pH and LOI corrected critical limits for these metals as developed by Lofts et al (2004) within Defra funded projects to develop a critical loads approach for trace metals by at least a factor of 3 in 0 207 155 and 221 of soil samples for Cd Cu Pb and Zn respectively (Spurgeon et al 2008) These analyses suggest that soil metal concentrations in GB are elevated as a result of direct inputs and that risk to soil communities as a result of this metal loading cannot be excluded With inputs in potential decline a key aim in CS was to see whether the trend for increasing soil surface metal concentration has been reversed to the point where leaching and other losses may exceed inputs and so measured soil metal concentrations may have started to decline a t a rate detectable in the timeframe of successive Countryside Surveys When looking for change between temporally separate surveys it is important to consider the influence that any difference in survey methods may play since differences in method may lead to potentially spurious indications of change Unfortunately in the case of soil metal analysis within CS a major change in the analytical procedure had to be implemented because of changes in the infrastructure available at the analytical laboratory In particular the hot plate reflux system used for the
161
Countryside Survey Soils Report from 2007
7 Soil metal concentrations
digestion of all soil in CS in 1998 was not available for the reanalysis in 2007 The alternative method used was microwave digestion For both procedures the regent used was Aqua Regia While use of the same reagent for digestion is an important consideration it is also possible that the changes in the temperature and pressure condition during digestion may have an effect on digestion efficiency and on concentrations measured from similar samples To investigate this results for the standard reference material BCR CRM141R calcareous loam soil which was measured multiple times through the analysis programme of both surveys were compared to determine whether the different digestion methods used result ed in similar estimates of trace element concentration in the CRM The CRM assessment was supported by a targeted reanalysis of 1998 collected soils using the 2007 method The comparison of measured concentration in the CRM revealed that the two methods gave slightly different quantification for Cd Cr Cu Ni Pb V and Zn concentrations (Table 72) and this was supported the results of the reanalysis of CS in 1998 soils (Table 73) Thus to allow change analysis a back correction of 1998 measurements wa s conducted to recalculate measured concentration for the 1998 soils to a predicted concentration that would be expected assuming analysis using the 2007 method This was done by dividing 1998 measurements by the ratio of the 19982007 mean measured concentrations for the BCR CRM141R analyse Checks that a single value for correction was applicable to all soils were conducted by plotting predicted change between surveys against both the LOI and pH measured in CS in 2007 soils These plots indicated no clear trend for difference with LOI for 6 of 7 metals and no clear trend for 5 of 7 metals for pH Exceptions were V which showed dependency of change on pH and LOI and Cr which showed slight dependency for pH With metal inputs to GB soils estimated to be fa lling dynamic modelling within Defra funded projects on critical loads assessment has been used to estimate the potential residence times of some existing pollutant metals in UK soils This has suggested that the metals will reside in soils for at least m any decades even for relatively mobile metals (eg Cd Zn) and possibly many millennia for metals that have a high affinity to soil organic matter (eg Cd Pb) (Tipping et al 2006b) Extensive datasets on the rates of change of concentrations of metals in soils are currently however scarcely available against which to validate these model predictions The analysis of change between back corrected 1998 data and measurements made in CS in 2007 outlined here can be used to provide initial insight into the rates of change of soil trace metal concentrations Results indicated that generally only small scale changes in measured soil metal concentrations were found between survey years Comparison of concentration indicated that a change in estimated 1998 and measured 2007 concentrations of greater than 10 wer e found in 6 of 21 stratification levels (Broad Habitat AVC soil LOI Category) for Cd 9 of 21 for Cr 13 of 21 for Cu 3 of 20 for Ni 3 of 20 for Pb and 5 of 22 for Zn The small magnitude of change in soils estimated between surveys means that a sig nificant change in concentrations at the GB scale was detected only for Cu For this metal a small magnitude but highly significant estimated increase in measure concentration of 2 mgkg was detected No other metal showed a significant change in measured concentration across GB Stratification of the data by Broad Habitat AVC and soil LOI revealed addition information about patterns of change in soil metal concentrations in different strata All metals showed significant change for at least one category level Importantly when considering stratification by so many categories the potential for type 1 statistical error is increased in line which the number of strata considered To include analysis by broad AVC and soil LOI category involves separate statistical testing of approximately 20 separate categories for each metal Since the significance of each is calculated separately and the cut off for statistical significance was 005 it will be expected that for each analyte one type I error (ie a false positive where a truly non-significant result is deemed significant in a test) would be anticipated within the analysis While multiple sample correct algorithms can be used to control for type I error arising from multiple testing for significance in CS such algorithms are not used because the extra stringency for type 1 error come with the penalty of an increase probability of type 2 errors (ie a truly significant result deemed non-significant in a test) This could mean that truly significant effects at the national scale are missed with potential impact for the environment and policy Where statistically significant effects are found careful review of relevant evidence that supports these as true responses is needed In particular identification of po tential drivers of change is needed as discussed briefly below Cadmium Soil (0-15cm) Cd showed only relatively small changes between survey with an overall decline of 0013 mgkg (3) in 2007 soils The only statistically significant change found related to a significant decrease in soil Cd in Heath and Bog vegetation and Organo-mineral soils The overall decline in Cd concentration might reflect declining deposition of this metal as detected in monitoring programs Cd is a particularly labile metal
162
Countryside Survey Soils Report from 2007
7 Soil metal concentrations
and as a result it may be expect to show relatively rapid leaching from soils leading to reduced soil Cd levels There is no obvious reason why either Heath and Bog vegetation or Organo -mineral soil should show significant reductions in soil Cd while other habi tats do not One possibility is that the remaining presence of Cd in some fertiliser may be maintaining Cd concentration in farmed soils while in soils that are not subjected to fertiliser application during land management soil Cd loses may now exceed in puts allowing concentration to reduce Chromium Soil (0-15cm) Cr showed a decrease of 09 mgkg (46) between 1998 and 2007 Broadleaved Wooodland Arable and Horticulture and Improved and Neutral Grassland soils characterised by Crop and Weed and Fertile Grassland vegetation showed significant decreases in soil Cr levels Decreases were also found in Mineral and Humus-mineral soils Bogs and Organo-mineral soil showed significantly higher soil Cr concentrations The results for Cr initially suggest that in managed habitats particularly those where crops including grass for livestock are grown the predominant trend of soil Cr concentration is down This is not though the case with Acid Grassland Dwarf Shrub Heath and Fen Marsh and Swamp soils which i n addition to Bogs showed increased Cr concentrations There are two potential explanations for the differences in trend in Cr concentration between habitats as observed The first potential cause of the apparent trend in soil Cr concentration is that me asurement errors relating to difference in digestion efficiency between high pH low LOI mineral soils and low pH high LOI organic soils may be in part responsible Comparisons of change across the 2007 soil pH and LOI range indicates that there is no trend for Cr concentration to show greater change in more organic rich soil ( Fig 72) A slight trend for greater change in high pH soil is however indicated ( Fig 71) At a neutral pH this effect results with a potential discrepancy of up to 27 mgkg in back corrected 1998 concentrations Effects of the method shift between surveys may therefore be the cause of some of the observed declines in mineral neutral soils and associated habitats and vegetation classes For low pH soils effects associated wi th method change are likely to be less important as a cause of Cr concentration increase since comparison suggests comparability between predicted 1998 and measured 2007 concentrations at higher pHs In those habitats that are characterised by low pH such as Bogs Acid Grassland and Dwarf Shrub Heath the increased Cr concentration found cannot therefore be disregarded as a methodological error suggesting that in these areas deposition loads may still exceed loses A second potential reason for the habitat difference found in the direction of change of soil Cr concentration that is also worth consideration is the role of cropping as an additional loss flux The habitats where Cr concentrations were increasing namely Arable and Horticulture and Grassla nds are predominately used for agricultural production In these systems harvesting of plants and livestock may provide a route of loss of Cr from soil that is not relevant to areas not under agricultural production Such increased loss may contribute to the reduction in soil Cr found in these areas when compared to uncropped areas Copper Soil (0-15cm) Cu was the only metal that showed a significant change at the GB scale increasing by a mean value of 2 mgkg across the full dataset Comparison of the effect of the change in digestion procedure between surveys by analysis of CRMs indicated that only a small change in measured Cu concentration resulted This meant that only a small correction factor needed to be applied to the 1998 measured values Analysis of change in soil Cu between back corrected 1998 and 2007 values in relation to both soil pH and LOI indicated that the magnitude of Cu change in soils could not be related to either parameter The small size of overall change between CRM measurements made by different methods and also the absence of trends with soil pH and LOI suggests that the change in digestion procedure was not a major contributing factor behind the observed increase in soil Cu concentrations Within habitats Improved Grasslands Dwarf Shrub Heath and Bog also showed significant increases in soil Cu as did the AVCs associated with these habitats Significant changes in 3 of 4 soil LOI categories were also found Cu has a high affinity with soil organic matter and so it may be expected to show only very low rates of leaching loss from soils Even if inputs of Cu in soils were reduced to zero it would be anticipated that the Cu that has already been loaded into GB soils would take a considerable time (perhaps many centuries) to be completely leached Monitoring networks have shown that the concentrations of Cu being deposited to soil are likely to be decreasing as a result of tighter emission controls However in contrast to other metals the
163
Countryside Survey Soils Report from 2007
7 Soil metal concentrations
magnitude of these decreases in deposition remains relatively modest For example Cu deposition had reduced by only 20 in a European wide survey of metal concentration in mosses compared to 72 for As 72 for Pb 60 for V and 52 for Cd At the same time while deposition has been slight ly decreasing there is a growing body of evidence to suggest that the use of Cu containing supplements in the livestock industry are potentially increasing the Cu load being added to soils under grazed areas and in areas to which animal manures are applied Additionally Cu concentrations are known to be associated with sewage sludge material and green waste which are frequently recovered to land The fact that among habitats Improved Grasslands were found to contain Cu concentrations significantly increas ed by 26 mgkg suggests that the presence of Cu concentration in animal manure may indeed being playing a role in increasing national soil Cu levels to some extent That Cu concentration were also increasing in all other habitats and significantly in some cases can be taken as quite strong evidence that currently Cu inputs still exceed outputs from leaching and cropping leading to further elevation in Cu concentrations over time
Figure 717 Map of estimated change in measures soil Cu concentration (mgkg) in soils (0-15 cm) collected
from across GB in CS in 1998 and 2007
Figure 917 Map of estimated change in
measured soil Cu concentration in soils
(0-15 cm) collected from across GB in CS
in 1998 and in 2007
164
Countryside Survey Soils Report from 2007
7 Soil metal concentrations
An analysis of the spatial structure within estimated change in soil Cu concentrations was conducted by using
kriging to interpolate values for change (Fig 717) This analysis was done using ordinary kriging to
interpolate between the Countryside Survey sample points Routine checking of data for outliers was
conducted and the working data set was transformed using a normal score procedure to obtain a Gaussian
distribution The data were then interpolated on a 1km UK grid using ordinary kriging and finally the kriged
data were back-transformed to produce an interpolated map of Cu change Mapping highlighted significant
spatial structure within the change dataset with greatest increases being associated with hotspots in areas
of the Northern England and Mid and South Wales uplands Where decreases were indicated these were
associated most commonly with reductions in concentration in lowland areas of the South and East England
that are associated with intensive arable land use Mapping of change thus highlights that increases in soil
Cu occurred principally in upland areas where both output fluxes associated with cropping may be limited and
also where livestock rearing may play a role as a potential additional source of Cu input Nickel Soil (0-15cm) Ni increased across all soils by 16 mgkg between survey years Two habitats showed significant decreases in measured soil Ni These were Broadleaved Woodland and Arable and Horticulture Crop and Weed vegetation also showed significant decrease Ni increased significantly in Neutral Grassland and Bogs As decreases were concentrated in habitats associated frequently with neutral low organic soils this raises the possibility that differential digestion efficiency may be a factor in the observed difference as was suggested to be the case for Cr Comparison of trends of change between back corrected 1998 and 1998 measurements however suggests that this was not the case as no trend with either pH or LOI was observed (Fig 71 and 72) The fact that the habitats that showed increases in Ni are associated with different soils types also suggests that analytical artefacts are not the primary cau se of the observed change A second potential cause of change may be the role of cropping as an additional loss flux for this metal as also highlighted for Cr In particular in Arable and Horticulture area harvesting of plants may provide an additional route of loss that allows soil Ni concentrations to decrease Such losses would not be relevant to less productive land such as Bogs where removal of plant biomass does not regularly take place
Lead Soil (0-15cm) Pb concentrations showed a small non-significant decrease between surveys This is potentially consistent with an overall loss of soil Pb in particular as the move to unleaded petrol has substantial decreased Pb inputs over the past two decades Although the overall dataset indicated slight losses two habitats showed significant increases There is no obvious reason why these two habitats Improved Grassland and Dwarf Shrub Heath should show such increases particularly as they are associated with different soil types Among AVCs and soil type no significant change in soil Pb concentrations were found The relatively small change in measured soil Pb and limited significant change in only a small number of unrelated habitat strata suggests that the high affinity of Pb to soil organic matter whi ch results in long predicted residence times for of Pb in soils may currently be limiting rates of Pb loss from soils Thus while deposition maybe decreasing soil Pb concentrations may be doing so only very slowly or not at all Zinc Zn (0-15cm) showed a small non-significant decrease between surveys and Zn concentrations were significantly reduced in two habitats Arable and Horticulture and Neutral Grassland No dependency of change between back corrected 1998 and 2007 measurements on either soil pH or LOI was detected in the dataset This suggests that the decreases seen are probably not the result of an analytical artefact relating to different efficiencies of soil digestion Instead the potential role of cropping as an additional loss flux as highlighted earlier for Cr and also for Ni may be important As deposition rates decrease in those areas where there is loss both from leaching and cropping it is possible that outputs may exceed current rates of metal inputs leading to a small but in some cases significant overall loss of soil Zn
165
Countryside Survey Soils Report from 2007
7 Soil metal concentrations
741 Policy implications The results of the comparison of back corrected 1998 and CS in 2007 analyses indicated that as would be expected only relative small changes in soil trace metal concentrations had occurred between surveys For one metal Cu the difference (an increase) was statistically significant For all metal s when data was stratified further statistically significant differences were seen For Cu these were mainly associated with significant increases for two metals Cd and Pb the changes were small and apparently idiosyncratic while for three metals (Cr Ni Zn) the changes were somewhat similar with reduction seen particularly in crop lands and no change or in some case slight and sometimes significant increases found in less managed habitats Overall the results suggests that at present the changes in deposition that have occurred over recent decades have yet to lead to substantial changes in measure d soil metal concentrations For some metals such as Cu and Cd it is l ikely that additional sources (animal manures and possibly sewage sludge manures and compost for Cu and fertiliser for Cd) beyond atmospheric inputs are important in maintaining or even increase soil concentrations principally in managed areas For the remaining metals especially Cr Ni and Zn there is some suggestion that in areas where cropping takes place output fluxes may now exceed inputs meaning that soil concentrations can start to decline Overall this suggest s that the managed landscape where intensive cropping takes place but sewage sludge animal manures and composts are rarely applied may be among the first habitats to show a return of GB soil metal concentrations from their current slight -moderately elevated states to their pre-industrial background concentrations These areas could thus be a focus for future monitoring
75 References
REFERENCES
Boruvka L Vacek O Jehlicka J 2005 Principal component analysis as a tool to indicate the origin of
potentially toxic elements in soils Geoderma 128 289-300
Emmett BA Frogbrook ZL Chamberlain PM Griffiths R Pickup R Poskitt J Reynolds B Rowe
E Spurgeon D Rowland P Wilson J Wood CM 2008 CS Technical Report No 307 Soils Manual
NERCCentre for Ecology amp Hydrology 180 pp (CEH Project Number C03259)
Hall JR Ashmore M Fawehinmi J Jordan C Lofts S Shotbolt L Spurgeon DJ Svendsen C
Tipping E 2006 Developing a critical load approach for national risk assessments of atmospheric metal
deposition Environmental Toxicology and Chemistry 25 883-890
Lofts S Spurgeon DJ Svendsen C Tipping E 2004 Deriving soil critical limits for Cu Zn Cd and Pb
a method based on free ion concentrations Environmental Science and Technology 38 3623-3621
McGrath SP Loveland PJ 1992 The Soil Geochemical Atlas of England and Wales Blackie Academic
and Professional Glasgow
Merian E Anke M Inhat M Stoeppler M (Eds) 2004 Elements and their Compounds in the
Environment Wiley VCH Weinheim Germany
Ross SM MD W Copplestone D Warriner M Crook P 2007 UK Soil and Herbage Pollutant Survey
Environmental concentrations of heavy metals in UK soil and herbage UK Soil and Herbage Pollutant
Survey Environment Agency p 132
RoTAP 2010 Review of Transboundary Air Pollution Acidification Eutrophication Ground Level Ozone and
Heavy Metals in the UK Defra
166
Countryside Survey Soils Report from 2007
7 Soil metal concentrations
Spurgeon DJ Rowland P Ainsworth G Rothery P Long S Black HIJ 2008 Geographical and
pedological drivers of distribution and risks to soil fauna of seven metals (Cd Cu Cr Ni Pb V and Zn) in
British soils Environmental Pollution 153 273-283
Tipping E Lawlor AJ Lofts S 2006a Simulating the long-term chemistry of an upland UK catchment
Major solutes and acidification Environmental Pollution 141 151-166
Tipping E Lawlor AJ Lofts S Shotbolt L 2006b Simulating the long-term chemistry of an upland UK
catchment Heavy metals Environmental Pollution 141 139-150
Wang ZJ Gao YX 1998 Biogeochemical cycling of selenium in Chinese environments 1st Asia Pacific
Symposium on Environmental Geochemistry Pergamon-Elsevier Science Ltd Hong Kong Peoples R China
pp 1345-1351
167
Countryside Survey Soils Report from 2007
8 Soil invertebrates
Summary
There were an estimated 128 quadrillion (128x1016
) soil invertebrates present in the top 8 cm of
Great Britain soils during the time of Countryside Survey sampling in 2007 C omparing these
results with those from the survey in 1998 has enable change in soil biodiversity to be estimated at
a national scale
A significant increase in total invertebrate catch in samples from soils (0-8cm) from all Broad
Habitats Aggregate Vegetation Classes and soil organic matter categories except for agricultural
areas on mineral soils was found in Countryside Survey in 2007 The increase in invertebrate catch
was mainly the result of an increase in the catch of mites in 2007 samples This resulted in an
increase in the mite springtail ratio but a decreased Shannon diversity due to the dominance of
mites in 2007 cores
A small reduction in the number of soil invertebrate broad taxa (0 -8cm) was recorded which is not
inconsistent with reported declines in soil biodiversity However repeat sampling is required to
ensure this is not linked to different seasonal conditions in the two sampling years F urther
analysis through focussed study may be needed to assess whether the changes in soil chemistry
land management annual weather patterns or merely natural population variation can explain
observed soil invertebrate community changes
81 Policy background
Key Question Does CS provide any evidence to indicate that there has been a loss of soil biodiversity as has been stated by the EU Measurements Enumeration of the number of soil invertebrate presence within Tullgren funnel extractions of 927 separate 4 cm diameter 8 cm long soil cores collected from plots across GB to give 1) total catch of invertebrates from all broad taxa 2) the number of broad taxa represented by the presence of at least one individual in a core 3) total catch of mites and springtails 4) the ratio of Mites Springtails 5) the Shannon Diversity statistic calculated using counts of the number of individuals within broad taxa including springtail superfamily From this analysis CS in 2007 has provided
Whole Broad Habitats Aggregate Vegetation Class and soil type stratified assessments of the
characteristic (total catch broad taxa representation total catch and relative catch of mites and
springtails Shannon Diversity) of soil invertebrate communities across Great Britain
Information of the change in characteristic of soil invertebrate communities in Great Britain soils
(0-8cm) since initial measurement in Countryside Survey in 1998
Data to contribute to analysis of changes in vegetation selected soil properties and other habitat
characteristics between successive Countryside Surveys in 1998 and 2007
The activities of the soil biota are critical for the provision of many important soil functions and resulting ecosystem services These include but are not limited to biomass production storing filtering and transforming nutrients contaminants and water and acting as a biodiversity pool from which future novel applications and products can be derived Because they are intimately involved in many important soil functions and are fundamental to maintaining soil quality the biological components of soils have considerable potential as indicators of soil quality National-level requirements for biological indicators were
168
Countryside Survey Soils Report from 2007
8 Soil invertebrates
outlined in the Soil Action Plan for England (Defra 2004) and have been investigated in a series of projects funded by Defra as part of the UK Soil Indicators Consortium These have been assessing the relative performance of a range of potential soil bioindicators under field conditions At present comparatively l ittle is known about the biodiversity of soil compared to for example above ground diversity In the microbial realm molecular approaches such as terminal restriction fragment length polymorphism (tRFLP) phylogenetic microarrays and metagenomics are starting to reveal patterns in the diversity and distribution of soil microbes For the soil meio- meso- and macro-fauna molecular approaches to biodiversity assessment still remain in development For some key groups such as earthworms and springtails good keys to the UK and other national fauna do exist although even in these cases traditional morphological taxonomy can be hampered by cryptic speciation (ie occurrence of groups of species which are reproductively isolated from each other but have high morphological similarity) and other taxonomic uncertainties Beyond these better known groups in taxa like mites and nematodes there are significant issues for morphological identification associated with the lack of keys laborious nature of the work and declining expert base Because they are often poorly known few soil species are recognised for their conservation value A few such as some ants and fungi are covered by UK Biodiversity Action Plan (UK BAPs) However as knowledge of soil biodiversity is often sparse it is not well known if and how climate land use land management change and pollution affect populations of even these relatively well known and highly valued species let alone the large amount of often hidden diversity that maybe present in soils Beyond the few soil species covered by BAPs there is a well recognised need to quantify soil biodiversity and determine whether it is possible to observe consistent patterns of population and community structure against a dynamic background of spatial and seasonal variability Key questions in this area of research and conservation relate to determining if and how soil biodiversity changes over time and the nature of the environmental drivers of any such changes Large-scale biodiversity assessment as well as long-term experiments and focussed mesocosm and laboratory studies are all important tools that can contribute data to improve current knowledge in this area
82 Methods
821 Proof of concept
Invertebrate diversity was first measured as part of CS in 1998 and CS is the first and only national scale monitoring of soil biodiversity in the UK The inclusion of invertebrate diversity measurements in CS in 1998 was partially driven by a 1996 report of the Royal Commission on Environmental Pollution (RCEP) on the Sustainable Use of Soils which identified the development of indices of soil biological activity and diversity as a key research priority In the RCEP report it was recognised that a major difficulty in developing soil biodiversity based indicators was the requirement for baseline data on population and community structure and how these change over time It was within this context of a need for baseline information that an assessment of soil biodiversity was deemed timely within CS in 1998 CS was chosen as a suitable vehicle for the assessment because the existing survey infrastructure and sampling regime used in CS could provided a cost-effective framework for integrating a soil biological survey into a study that already included assessment for other land use soil vegetation and water parameters The aim of the soil invertebrate diversity measurements that were conducted in CS in 1998 (enumeration of mainly mesofauna groups collected by Tullgren extraction of a relatively small soil core) was not to sample and identify all invertebrate diversity within a given plot Such an all-taxa biodiversity inventory would instead require use of a wide range of sampling techniques and would be a massive undertaking and highly expensive Instead the aim of CS in 1998 was to produce an initial baseline dataset of invertebrate group level community composition across all major soil groups and habitats of Great Britain The strategy was to capture soil invertebrates that would be abundant and relatively cost -effective to identify The group of soil
169
Countryside Survey Soils Report from 2007
8 Soil invertebrates
invertebrates that best suited these criteria was the soil mesofauna To sample the soil fauna intact soil cores (4 cm diameter 8 cm long) were collected for laboratory extraction of mesofauna This approach was favoured over the use of an on-site hand-sorting technique which would be effective for macroinvertebrates or pitfall trapping which would preferentially sample soil surface active invertebrates Identification of the extracted invertebrates was conducted to broad taxa (phylum order) level for all available and successfully extracted samples (total 1076) collected from CS squares that were initially visited in the 1978 survey Table 81 Overview of soil invertebrate samples and level of taxonomic resolution for CS in 1998 and 2007
1998
2007
Main Plots
km-squares
Main Plots
km-squares
Total sampled 1286 256 927 238 Broad invertebrate taxa 1076 237 927 238 Mites (Acari) Separated to broad group a
-
-
238
90
Checked for Oribatid presence 963 237 238 90 Oribatids present 504 182 212 90 Oribatids identified to species b 504 182 - - Springtails (Collembola) Checked for Collembola presence Separated to broad group c
1076
237
927
238
Collembola present 837 233 816 238 Collembola identified to species 336 176 - -
a Separated into Oribatids Mesostigmatids and Prostigmatids
b PresenceAbsence data only
c Separated into Entomobryoidea Poduroidea Neelidae and Sminthuridae
While the invertebrate sampling undertaken in CS in 1998 identified and enumerated invertebrates extracted to broad taxa for all cores it was also decided to undertake a limited identification of some taxa to a deeper taxonomic resolution (Table 81) Of the two main mesofaunal groups the mites and springtails the mites (Acari) were checked for the presence of the most common major group the oribatidae in the community sample while the Collembola were identified into the superfamily groups of entomobryoidea neelidae poduroidea and sminthuridae In the CS in 1998 samples 504 samples were check for the presence of oribatids mites and all 1076 separated to superfamily for the Collembola In all of the 504 samples checked for oribatids additional identification of mites was undertaken to establish the presenceabsence of individual oribatid species This species level identification was conducted on a voluntary basis by Mr Frank Monson For the springtails species identification and enumeration was conducted for 336 samples representing approximately one third of available samples Analysis of the patterns of distribution of invertebrates in CS in 1998 detected significant differences in invertebrate diversity between Environmental Zones Broad Habitats ITE L and Classes Aggregate Vegetation Classes and Soil Types The 1998 CS dataset forms a valuable baseline that can be used to place specific site region and country-scale changes within a regional and national environmental context Resampling of the CS sites in 2007 provided an opportunity to determine whether these patterns of invertebrate diversity can be consistently detected against a background of spatial and temporal heterogeneity within soil communities The detailed protocols that were developed for soil invertebrate sampling in CS in 1998 have been used for the re-sampling in 2007 By returning to the majority of the CS plots first sampled in 1998 CS in 2007 can
170
Countryside Survey Soils Report from 2007
8 Soil invertebrates
provide information on the temporal stability of soil communities Resource limitations in 2007 meant that it was not possible to identify all invertebrates in all the cores that were collected from the remaining Main Plots that were first sampled in 1998 Of the cores that were available from re -sampled sites a total of 927 cores have been enumerated to broad taxa Of these 927 samples superfamily level identification was conducted for the springtails for all cores and separation of mites to major group for 238 Limited resources meant that no species level identification could be supported although all extracted invertebr ates have been stored and can be made available for future identification on request Soil invertebrate sampling and analysis throughout the CS project is summarised in Table 82 below Table 82 Summary of rationale for measurement of soil invertebrate community composition in CS
Facts Comments
History in CS First measured in CS in 1998 for Main Plots in original 1978 squares only (total 1076 samples)
Repeat of most plots in CS in 2007 to initiate first ever national time-series for soil community assessment
Country level reporting No CS in 1998 did not give country level statistics Smaller data-set in 2007 limits power for Country level reporting for habitat vegetation and soil types stratifications
Links and compatibility to other monitoring programmes
No other GB wide survey or monitoring programmes for soil mesofauna Earthworms surveys being undertaken in Scotland and as part of the Opal project run by the Natural History Museum London
CS unique in UK as soil biodiversity assessment is integrated with other survey approaches that measure land use vegetation soil properties and waters Other countries such as the Netherlands Germany and Canada also have programmes involving biodiversity assessments Measurements of microarthropods are compatible with these schemes
Uniqueness of CS No other GB datasets Only UK wide dataset for mesofauna communities Only UK dataset with time series from repeat visits
Value for money (Policy priority or interpretative value x cost)
Medium Policy relevant and scientifically significant Relatively low cost
Important to establish whether it is possible to detect meaningful changes against spatial and temporal variability
Important in interpreting other data such as UK microbial survey and for integrated assessment
Samples for invertebrate identification and enumeration were collected at all selected Main Plots This included all of the original 1978 256 squares sampled in CS in 1978 that could be revisited Sampling was undertaken using 4 cm diameter by 8 cm long white plastic core following the detailed field protocol described in Emmett et al (2008) and briefly summarised in Chapter 1 Briefly surface vegetation was removed to reveal the soil surface Any litter layer present was not removed The core was knocked into the
171
Countryside Survey Soils Report from 2007
8 Soil invertebrates
ground to the full length of the core using a mallet and plate In stony or shallow soils the sampling point was moved if a full core depth would not be obtained Any such variations in core location were recorded On removal of the core from the ground the outside of the core was cleaned and any excess soil trimmed from the bottom of the core Caps were then gently pushed over the ends of the core and the intact sample posted to CEH in Lancaster as the quickest route of return given the countrywide nature of the sampling programme Soil invertebrates were extracted from cores as soon as possible using a dry Tullgren extraction method This uses surface heating of the exposed surface of the core to drive the soil fauna downwards and out of the open bottom end of the core and into the collection bottles filled with a 70 ethanol preservative below Once collected soil invertebrates were identified to major taxa (Taxonomic level 1) and counted The broad taxa categories used for enumeration was acari araneae chilopoda ndash geophilomorpha chilopoda ndash lithobiomorpha chilopoda coleoptera collembola ndash entomobryoidea collembola ndash neelidae collembola ndash poduroidea collembola ndash sminthuridae copepoda diptera diplura diplopoda gastropoda hemiptera hymenoptera isopoda lepidoptera nematoda nematomorpha oligochaeta opiliones pauropoda protura pseudoscorpions psocoptera pulmonata symphyla thysanura thysanoptera unknown All extracted invertebrates collected from counted cores have been stored in ethanol and are available for further species level identification to interested parties Invertebrate numbers were reported for each quantified soil core
822 Quality control
After an initial identification to broad taxa mite group and springtail superfamily at regular intervals the samples were reassembled and resorted identified and enumerated by an alternative member of staff This second identification and count ing step was then compared with the original count to assess the potential for operator error during processing If any substantive differences in count were found by this cross checking procedure counting was halted and the differences in identifications that lay behind the discrepancies resolved by the counting team Any such changes were noted on the record sheets kept for each sample
823 Reporting
Change in the composition of the soil invertebrate communities as represented by c ounts of the macro and mesofaunal group collected by Tullgren extraction of soil cores collected in CS in 1998 and 2007 have been analysed using a mixed modelling approach using the SAS statistical software platform The statistical approach used for analysing the data for change involved bootstrapping which allows for non-normality in the data without the necessity to know details of the actual distribution As such it provides a more accurate measurement of significance than alternative approaches Annex F of Emmett et al (2008) provides a background document describing the basis of the mixed model procedure As well as looking for overall change at the GB wide scale statistical analyses have been conducted to assess change of measured or calculated parameters soil community parameters within different strata w ithin the data-set These include analysis according to stratification by Broad Habitat Aggregate Vegetation Class and Soil Loss on Ignition (LOI) category which are briefly described here
Broad Habitat - The Broad Habitat classification consists of 27 habitats which account for the entire
land surface of Great Britain and the surrounding sea Countryside Survey reports on 10 major
terrestrial habitats
Aggregate Vegetation Class (AVC) ndash is a high level grouping of vegetation types produced from a
quantitative hierarchical classification of the different plant species found in the original Countryside
Survey sample plots Soil organic matter (LOI) category - mineral (0-8 LOI 0-44 g C kg
-1) humus-mineral (8 ndash 30 LOI
44-165 g C kg-1
) organo-mineral (30 ndash 60 LOI 165-330 g C kg-1
) and organic (60 ndash 100 gt 330 g
C kg-1
)
172
Countryside Survey Soils Report from 2007
8 Soil invertebrates
Measured and calculated parameters that were used as inputs for the analysis were
1 Total catch of invertebrates from all broad taxa to give a measure of overall abundance of invertebrates in CS cores
2 Number of broad taxa represented by the presence of at least one individual in each CS core as a measure of community taxa richness
3 Total catch of mites and springtails only since these two mesofauna groups usually comprised the majority of the invertebrates present in each core
4 The ratio of Mites Springtails since this parameter was found to change in relation to climatic conditions as indicated by annual precipitation (highest mite springtail ratio was found in plots where annual precipitation was highest within GB) in the 1998 data-set
5 Shannon Diversity calculated for each sample using counts of individual number within broad taxa including counts for springtail superfamily as available for all 1998 and 2007 samples
As well as analysis of each parameter according the outlined stratification a spatial analysis was undertaken using geostatistics For the measured parameters tested namely total invertebrate catch mite springtail ratio and Shannon Diversity the semi-variograms identified no spatial correlation at the regional scale For this reason spatial interpolation or mapping of change is not feasible and as a result is not reported further in this chapter
83 Results
831 Total invertebrate catch
The mean number of invertebrates collected from cores in CS in 1998 was 523 and 77 in 2007 ( Table 83) This represented an overall increase of 47 in total catch in CS in 2007 The highest catches of invertebrates were in woodland habitats with high catches also recorded in Acid Grassland and Dwarf Shrub Heath Lowest numbers occurred in three habitats Arable and Horticulture Improved Grassland and Neutral Grassland that are most frequently the subject of intensive management practices Catches in Arable and Horticulture habitats in particular were notably low in both surveys
173
Countryside Survey Soils Report from 2007
8 Soil invertebrates
Table 83 Changes in total invertebrate catch of soils (0 -8cm depth) within a) Broad Habitats b) Aggregate
Vegetation Classes and c) Soil LOI categories across Great Britain Arrows denote a significant change (plt005)
in the direction shown
C) Great Britain - Soil LOI Category
Soil LOI category 1998 2007 1998-2007
Mineral 367 451
Humus-mineral 553 895
Organo-mineral 816 1179
Organic 697 1053
Direction of
significant
changesTotal catch
a) Great Britain - Broad Habitats
Broad Habitat 1998 2007 1998-2007
Broadleaved Mixed and Yew Woodland 922 1032
Coniferous Woodland 904 1524
Arable and Horticulture 309 316
Improved Grassland 385 575
Neutral Grassland 422 86
Acid Grassland 859 1139
Dwarf Shrub Heath 757 1192
Fen Marsh and Swamp 641 843
Bog 493 774
All habitat types 523 77
b) Great Britain - Aggregate Vegetation Class
AVC 1998 2007 1998-2007
Crops and weeds 316 302
Tall grass and Herb 319 552
Fertile grassland 362 525
Infertile grassland 448 799
Upland Woodland 97 1404
Moorland grass mosaics 843 1276
Heath and bog 606 89
All vegetation types 523 77
Direction of
significant
changes
Direction of
significant
changesTotal catch
Total catch
174
Countryside Survey Soils Report from 2007
8 Soil invertebrates
Figure 81 Changes (+- 95 CIs) in total invertebrate catch of soils (0-8cm depth) within a) Broad abitats b)
Aggregate Vegetation Classes and c) Soil LOI categories across Great Britain Standard errors are indicated
Significant differences p lt 005 p lt 001 p lt 0001 are shown
Analysis using the mixed model indicated that the increase seen in total catch in GB soils in CS in 2007 was highly significant (plt0001) Stratification of the data to assess change by Broad Habitat indicated that a significant increase in catch was detected in 5 of 9 Broad Habitats (Fig 81) For the remaining 4 habitats small non-significant increases in catch were found These were Broadleaved Woodlands Acid Grassland and Fen Marsh and Swamp which all showed non-significant increases of 12 325 and 315 respectively and Arable and Horticulture which showed only a 2 increase in mean catch No habitat showed a mean decrease in total invertebrate catch The absence of a clear increase in total invertebrate catch which was evident in all other habitats and significant in most Arable and Horticulture areas is particularly interesting because the absence of an effect is not the result of low sample numbers in the analysis In fact Arable systems are the second best represented habitat after Improved Grasslands in the repeat sampled soi l invertebrate dataset with 217 enumerated samples This suggests that the factor that is responsible for the general increase in invertebrate catches in soil cores sampled from across GB is not applicable to Arable and Horticulture systems
-40
0
40
80
120
160
Min
eral
Hum
us-m
iner
al
Org
ano
-miner
al
Org
anic
Ch
an
ge t
ota
l in
vert
eb
rate
catc
h p
er
plo
t
-40
0
40
80
120
160
Cro
ps a
nd w
eeds
Tall g
rass
and
Her
b
Fertile
grass
land
Infe
rtile g
rass
land
Upla
nd W
oodlan
d
Moo
rland
gra
ss m
osaics
Heat
h and
bog
All ve
geta
tion
type
s
Ch
an
ge t
ota
l in
vert
eb
rate
catc
h p
er
plo
t
-40
0
40
80
120
160
Bro
adlea
f
Coni
fer
Ara
ble
Impro
ved
Gra
ss
Neut
ral G
rass
Acid
Gra
ss
Shr
ub Hea
th
Fen
Bog
All ha
bita
ts
Ch
an
ge t
ota
l in
vert
eb
rate
catc
h p
er
plo
t
a) Broad Habitats
c) LOI categoriesb) Aggregate vegetation class
175
Countryside Survey Soils Report from 2007
8 Soil invertebrates
Further stratification of the data by AVC indicated patterns of change that were generally in line with those indicated by the habitat analysis No significant increase in catch was found between Crops and Weeds and Tall Grass and Herb which are vegetation classes associated with arable landscapes while total catch was significantly higher in all other vegetation classes Analysis by LOI class indicated significant change in total invertebrate catch in all classes with three classes highly significant (plt0001) and the mineral soil (LOI lt 0-8) significant at plt005 Smallest overall increase in total catch was found for the mineral soils in terms of both absolute numbers and percentage change Since these included a large proportion of the Arable and Horticulture s oils (189 of 371 soils in the 0-8 LOI category are from Arable and Horticulture habitats) this suggests that the low organic matter content of these soils possibly in combination with arable land management practice may be a contributing factor preventing increase in the total catch of invertebrates in the mineral soil category to the same extent found in soil with higher LOI
832 Total broad taxa in catch
The mean number of invertebrate taxa represented by at least one individual in soil cores in 1998 was 434 and was 385 in 2007 (Table 84) This represented an overall decrease of 11 in average taxa representation in CS in 2007 compared to 1998 This reduction is highly statistically significant (plt0001) Because of the small size of the core sample used for invertebrate extraction in CS the number of taxa that may be represented within a catch at any given plot is rather idiosyncratic Further both the core size and extraction technique used (surface heating within a Tullgren funnel apparatus ) is targeted at collecting mainly hard bodied soil mesofauna Thus while small arthropods such as mites and springtails are usually well sampled (Van Straalen and Rijninks 1982) soft bodied meiofauna such as nematodes and tardigrade and larger macrofauna such as Oligochaetes centipedes millipedes and woodlice are not well represented in the extracted sample As a result within any one sample the total number of taxa present can be affected not only by habitat and soil conditions but also by the chance inclusion of individuals of larger invertebrates within the sample Taxa representation as a result is subject to large variation in measurement between samples that is independent of fixed factor effects When analysed by Broad Habitats the highest average number of invertebrate taxa was found in Broadleaved Mixed and Yew Woodland in both the CS in 1998 and 2007 (Table 84) High taxa representation in these habitats is consistent with the high overall catches recorded in these areas since there is a positive relationship between overall catch and number of represented taxa within the CS data-set In remaining habitats trends for representation of taxa in different systems varied slightly between surveys Bogs showed low taxa richness in both surveys and Arable and Horticulture systems also had relatively low taxa richness that is consistent with the low overall catch in these areas in both surveys
176
Countryside Survey Soils Report from 2007
8 Soil invertebrates
Table 84 Changes in total number of sampled taxa represented by at least one individual in soil samples (0 -8cm
depth) within a) Broad Habitats b) Aggregate Vegetation Classes and c) Soil LOI categories across Great
Britain Arrows denote a significant change (plt005) in the direction shown
a) Great Britain - Broad Habitats
Broad Habitat 1998 2007 1998-2007
Broadleaved Mixed and Yew Woodland 581 495
Coniferous Woodland 435 466
Arable and Horticulture 413 34
Improved Grassland 454 374
Neutral Grassland 453 433
Acid Grassland 460 397
Dwarf Shrub Heath 426 364
Fen Marsh and Swamp 394 411
Bog 335 328
All habitat types 434 385
b) Great Britain - Aggregate Vegetation Class
AVC 1998 2007 1998-2007
Crops and weeds 427 342
Tall grass and Herb 416 415
Fertile grassland 452 367
Infertile grassland 462 423
Lowland woodland 648 561
Upland Woodland 500 461
Moorland grass mosaics 434 397
Heath and bog 356 336
All vegetation types 434 385
c) Great Britain - Soil LOI Category
Soil LOI category 1998 2007 1998-2007
Mineral 437 373
Humus-mineral 466 408
Organo-mineral 451 425
Organic 360 346
Direction of
significant
changesNumber of broad taxa
Number of broad taxa
Direction of
significant
changesNumber of broad taxa
Direction of
significant
changes
177
Countryside Survey Soils Report from 2007
8 Soil invertebrates
Figure 82 Changes (+- 95 CIs) in total number of sampled taxa represented by at least one individual in soils
(0-8cm depth) within a) Broad Habitats b) Aggregate Vegetation Classes and c) Soil LOI categories across Great
Britain Standard errors are indicated Significant differences p lt 005 p lt 001 p lt 0001 are shown
Analysis of taxa richness using the mixed model indicated that the reduction in the total number of collected taxa in CS in 2007 compared to 1998 was highly significant (plt0001) Stratification of the data to assess change by Broad Habitat indicated that in 5 out of 9 cases (Broadleaved Woodland Arable and Horticulture Improved Grassland Acid Grassland and Dwarf Shrub Heath) the reduction in taxa representation indicated was statistically significant (Fig 82) Analysis using AVC revealed further information about the changes in taxa representation between surveys Thus while all AVC categories showed a reduction in taxa richness greatest change was found for Crops and Weeds and in Fertile Grassland In both cases these changes were statistically significant (plt0001) with a further significant decrease (plt005) also found in soils from Infertile Grassland Because these Arable and Grassland areas are subject to the greatest anthropogenic influence through land management this suggests that land management practice may be in some way influencing the representation and distribution of some soil taxa in these systems Analysis by LOI class indicated a reduction in taxa representation in all soil classes The change in representation was greatest in the mineral (0-8 LOI) and humus-mineral (8-30 LOI) soils rather than in soils with a higher LOI This is consistent with the reduction in taxa catch detected in the Arable habitats and Crop and weed AVC class and Improved Grassland habitat and Fertile Grassland AVC since these habitats and vegetation types are extensively represented within the less organic rich soils within the low LOI class
-3
-2
-1
0
1
2
3
Bro
adlea
f
Coni
fer
Ara
ble
Impro
ved
Gra
ss
Neut
ral G
rass
Acid
Gra
ss
Shr
ub Hea
th
Fen
Bog
All ha
bita
ts
Ch
an
ge b
road
taxa
catc
h p
er
plo
t
-3
-2
-1
0
1
2
3
Cro
ps a
nd w
eeds
Tall g
rass
and
Her
b
Fertile
grass
land
Infe
rtile g
rass
land
Lowland
Wood
land
Upla
nd W
oodlan
d
Moo
rland
gra
ss m
osaics
Heat
h and
bog
All ve
geta
tion
type
s
Ch
an
ge b
road
taxa
catc
h p
er
plo
t
-3
-2
-1
0
1
2
3
Min
eral
Hum
us-m
iner
al
Org
ano-m
iner
al
Org
anic
Ch
an
ge b
road
taxa
catc
h p
er
plo
t
a) Broad Habitats
c) LOI categoriesb) Aggregate vegetation class
178
Countryside Survey Soils Report from 2007
8 Soil invertebrates
833 Total catch of mites and springtails
The average combined number of mites and springtails present in CS in 1998 was 389 compared to 721 in 2007 In 1998 mites and springtails comprised 743 of all invertebrates captured while in 2007 this had increased to 936 Springtails and mites thus increased in their overall dominance between the two surveys Because springtails and mites dominate total invertebrates to such an extent their patterns of abundance between habitats reflect those also found for total invertebrate catch ( Table 85) The highest combined catches of mites and springtails were in woodland habitats (notably Coniferous Woodland) with high numbers also found in habitats such as Acid Grassland and Dwarf Shrub Heath Lowest counts were found in Arable and Horticulture and Improved Grassland habitats Since these habitats are often intensively managed this suggests a potential influence of management regime on these two important soil mesofauna groups Table 85 Changes in combined catch of mites and springtails in soils (0 -8cm depth) within a) Broad Habitats b)
Aggregate Vegetation Classes and c) Soil LOI categories across Great Britain Arrows denote a significant
change (plt005) in the direction shown
a) Great Britain - Broad Habitats
Broad Habitat 1998 2007 1998-2007
Broadleaved Mixed and Yew Woodland 688 937
Coniferous Woodland 769 1459
Arable and Horticulture 210 281
Improved Grassland 254 533
Neutral Grassland 281 805
Acid Grassland 694 1085
Dwarf Shrub Heath 61 1158
Fen Marsh and Swamp 554 777
Bog 381 74
All habitat types 389 721
b) Great Britain - Aggregate Vegetation Class
AVC 1998 2007 1998-2007
Crops and weeds 209 266
Tall grass and Herb 216 501
Fertile grassland 222 483
Infertile grassland 309 747
Upland Woodland 857 1338
Moorland grass mosaics 66 1222
Heath and bog 492 85
All vegetation types 389 721
Direction of
significant
changes
Direction of
significant
changesAbundance mites and
springtails
Abundance mites and
springtails
179
Countryside Survey Soils Report from 2007
8 Soil invertebrates
Figure 83 Changes (+- 95 CIs) in the combined catch of mites and springtails from soils (0-8cm depth) within
a) Broad Habitats b) Aggregate Vegetation Classes and c) Soil LOI categories across Great Britain Standard
errors are indicated Significant differences p lt 005 p lt 001 p lt 0001 are shown
Data analysis using the mixed model indicated that the increase in the combined catch of sprigtails and mites in CS in 2007 compared to 1998 was highly significant (plt0001) when considering all soils (Fig 83) Stratification of the data to assess change by Broad Habitat indicated effects that were consistent with those for total invertebrate number Thus combined mite and springtail catches were increased in all analysed habitat classes and no habitat showed a mean decrease in mite and springtail catch For 7 out of 9 habitats (Coniferous Woodland Arable and Horticulture Improved Grassland Neutral Grassland Acid Grassland Dwarf Shrub Heath and Bog) the increase in combined mite and springtail catch was statistically sig nificant with Arable and Horticulture soils showing the lowest overall change Because of the low starting point in Arable soils the actual percentage increase in combined catch (342 increase) was only slightly below the
c) Great Britain - Soil LOI Category
Soil LOI category 1998 2007 1998-2007
Mineral 244 411
Humus-mineral 411 839
Organo-mineral 685 1129
Organic 586 1015
Direction of
significant
changesAbundance mites and
springtails
-40
0
40
80
120
Cro
ps a
nd w
eeds
Tall g
rass
and
Her
b
Fertile
grass
land
Infe
rtile g
rass
land
Lowland
Wood
land
Moo
rland
gra
ss m
osaics
Heat
h and
bog
All ve
geta
tion
type
s
Ch
an
ge m
ites a
nd
sp
rig
tail
catc
h p
er
plo
t
-40
0
40
80
120
Bro
adlea
f
Coni
fer
Ara
ble
Impro
ved
Gra
ss
Neut
ral G
rass
Acid
Gra
ss
Shr
ub Hea
th
Fen
Bog
All ha
bita
ts
Ch
an
ge m
ites a
nd
sp
rig
tail
catc
h p
er
plo
t
-40
0
40
80
120
Min
eral
Hum
us-m
iner
al
Org
ano
-min
eral
Org
ani
c
Ch
an
ge m
ites a
nd
sp
rig
tail
catc
h p
er
plo
t
a) Broad Habitats
c) LOI categoriesb) Aggregate vegetation class
180
Countryside Survey Soils Report from 2007
8 Soil invertebrates
lower end of level of change found for the remaining habitats (36-186) The remaining 2 habitats each showed non-significant increases in combined catch Analysis by AVC indicated an effect of vegetation on combined mite and springtail catch in line with those for total invertebrate numbers A significant increase in the combined catch was found in all vegetation classes with the exception of Crop and Weeds and Coniferous Woodland Analysis by LOI class indicated significant change in mite and springtail catch in all classes Absolute size of the increase was lowest for the mineral soil (LOI lt 0-8) with the other soil classes each showing similar change However when changes are calculated as percentage difference from CS in 1998 the change in the mineral soils (68) is not inconsistent with the percentage change in the remaining LOI categories (65 -104) That a significant increase in combined mite and springtail catch was found for the low LOI soil suggests that the limited changes in total mite and springtail catch that were s een in Arable habitats dominated by the Crop and Weed AVC category is not merely a result of the low LOI of soils in these areas Instead other land management practices may be important in limiting the extent of observed change
834 Ratio of mites springtails
Analysis was conducted of the change in the ratio of Mites Springtails since this parameter was found to vary in relation to annual precipitation (and as a result habitat) in CS in 1998 Highest catches of mites were found in plots at which rainfall was highest while springtails favoured lower rainfall plots Mite springtail ratios thus varied systematically with increasing rainfall (Fig 84) In CS in 1998 the average mite springtail ratio in GB soils was 63 and in CS in 2007 this value had increased to 89 (Table 86 Fig 85) Highest mite springtail ratios were found in habitats that are associated with high rain fall particularly in upland regions of GB A pattern that is consistent with the recognised trend (Fig 84) Habitats with highest mite springtail ratio were Bog Dwarf Shrub Heath and Acid Grassland Woodlands were intermediate while values in Arable and Horticulture Neutral Grassland and Improved Grassland soils were the lowest of the studied habitats The patte rn of mite springtail ratio found between the Broad Habitats for in CS in 2007 supports the importance of moisture availability on the relative abundance of the major meiofaunal groups as indicated initially in CS in 1998 Figure 84 Mite abundance and relative abundance of Collembola in relation to mean annual precipitation
Trends (with 95 confidence intervals) are calculated based on data collected from 1097 Tullgren samples
collected across GB in 1998
0 500 1000 1500 2000 2500 3000 35000 500 1000 1500 2000 2500 3000 3500
500
750
2500
5000
7500
25000
50000
75000
Acari
abundance (
log
10
m- 2
+ 1
00
02
04
06
08
10
rela
tive a
bundance o
f colle
mbola
(arc
sin
e
+ 0
5)
Number of mites m-2
Relative abundance of Collembola m-2
Fig 84 Mite abundance and relative
abundance of Collembola in relation to
mean annual precipitation Trends (with
95 confidence intervals) are calculated
based on data collected from 1097 Tullgren
samples collected across GB in CS2000
181
Countryside Survey Soils Report from 2007
8 Soil invertebrates
All Broad Habitats included in the stratified analysis showed a significant increase in mite springtail ratio Statistical analysis indicated that this increase was significant in all habitats except for Dwarf Shrub Heath and Bog the two habitats that had the highest ratios i n both CS in 1998 and 2007 The significant increase in the mite springtail ratio found in the majority of habitats was largely the result of an increase in the total number of mites caught rather than a reduction in springtail catches The increase in mi te numbers is also the major reason for the increase in both the combined number of mites and springtails and total invertebrate catch (since mites are a major contributor to overall invertebrate numbers) Analysis of the data by AVC indicated clear effects of vegetation class on mite springtail ratio These effects were largely consistent with the trends found for Broad Habitats There was a significant increase in the mite springtail ratio in all vegetation classes except Moorland Grass Mosaic and Hea th and Bog the two classes for which ratios in CS in 1998 and 2007 were highest Analysis by LOI class was also consistent with the changes in mite springtail ratio across other stratifications A significant increase in the mite springtail ratio wer e found in mineral humus-mineral and organo-mineral soils associated with the lowland habitats and vegetation classes in which mite springtail ratio showed a significant increase Only in organic soils associated with upland areas was the increase in ratio between the 1998 and 2007 not significant
Table 86 Changes in ratio of mites springtails in soils (0 -8cm depth) within a) Broad Habitats b) Aggregate
Vegetation Classes and c) Soil LOI categories across Great Britain Arrows denote a significant change (plt005)
in the direction shown
a) Great Britain - Broad Habitats
Broad Habitat 1998 2007 1998-2007
Broadleaved Mixed and Yew Woodland 554 1008
Coniferous Woodland 644 1464
Arable and Horticulture 183 531
Improved Grassland 402 820
Neutral Grassland 406 966
Acid Grassland 1053 1839
Dwarf Shrub Heath 1302 1140
Bog 1383 1526
All habitat types 63 109
b) Great Britain - Aggregate Vegetation Class
AVC 1998 2007 1998-2007
Crops and weeds 187 53
Tall grass and Herb 25 62
Fertile grassland 262 791
Infertile grassland 501 1109
Upland Woodland 67 1129
Moorland grass mosaics 1391 1748
Heath and bog 1477 1754
All vegetation types 628 1087
Direction of
significant
changes
Direction of
significant
changesMites springtails
Mites springtails
182
Countryside Survey Soils Report from 2007
8 Soil invertebrates
c) Great Britain - Soil LOI Category
Soil LOI category 1998 2007 1998-2007
Mineral 357 750
Humus-mineral 402 1034
Organo-mineral 927 1540
Organic 1731 1833
Direction of
significant
changesMites springtails
Figure 85 Changes (+- 95 CIs) in the ratio of mites springtails in soils (0 -8cm depth) within a) Broad
Habitats b) Aggregate Vegetation Classes and c) Soil LOI categories across Great Britain Standard errors are
indicated Significant differences p lt 005 p lt 001 p lt 0001 are shown
835 Shannon Diversity
Shannon diversity was calculated using counts of the number of individuals within broad taxa (nb counts of springtails to superfamily were included as separate broad taxa in the analysis) Mean Shannon diversity in CS in 1998 was 102 and in 2007 this value has reduced to 072 ( Table 87) This represented an overall reduction of 03 units in CS in 2007 Shannon diversity showed only a limited difference between different habitats Broadleaved Woodland showed the highest Shannon statistic in both 1998 and 2007 (121 and 087 respectively) while Bogs showed lowest Shannon diversity in both surveys (071 and 052 respectively)
-8
-4
0
4
8
12
16
20
Bro
adlea
f
Coni
fer
Ara
ble
Impro
ved
Gra
ss
Neut
ral G
rass
Acid
Gra
ss
Shr
ub Hea
th
Bog
All ha
bita
tsCh
an
ge p
rop
ort
ion
mit
es
pri
ng
tail
s
per
plo
t
-8
-4
0
4
8
12
16
20
Cro
ps a
nd w
eeds
Tall g
rass
and
herb
Fertile
grass
land
Infe
rtile g
rass
land
Lowland
woo
ded
Upla
nd w
ooded
Moo
rland
gra
ss m
osaics
Heat
h and
bog
All ve
geta
tion
type
s
Ch
an
ge p
rop
ort
ion
mit
es
pri
ng
tail
s
per
plo
t
-8
-4
0
4
8
12
16
20
Min
eral
Hum
us-m
iner
al
Org
ano
-min
eral
Org
ani
c
Ch
an
ge p
rop
ort
ion
mit
es
pri
ng
tails
per
plo
t
a) Broad Habitats
c) LOI categoriesb) Aggregate vegetation class
183
Countryside Survey Soils Report from 2007
8 Soil invertebrates
Statistical analysis indicated that the decrease in Shannon diversity in 2007 was highly significant (plt0001) when considered for GB wide soils (Table 87) Stratification of the data to assess change by Broad Habitat indicated a significant decrease in diversity in 8 of 9 habitats ( Fig 86) Only in Fen Marsh and Swamp was the reduction in Shannon diversity not significant Analysis by AVC indicated that the reduction in Shannon diversity was also significant in the majority of vegetation classes (Fig 86) Of the 8 AVCs represented in the data-set all showed a significant reduction in Shannon diversity except for Tall Grass and Herb Analysis by LOI class in dicated significant change in all soil LOI classes indicating that reduced Shannon diversity was associated with all soil types Table 87 Changes in invertebrate Shannon diversity based on enumeration to broad taxa of invertebrates
collected from soils (0-8cm depth) within a) Broad Habitats b) Aggregate Vegetation Classes and c) Soil LOI
categories across Great Britain Arrows denote a significant change (plt005) in the direction shown
a) Great Britain - Broad Habitats
Broad Habitat 1998 2007 1998-2007
Broadleaved Mixed and Yew Woodland 121 087
Coniferous Woodland 093 061
Arable and Horticulture 110 085
Improved Grassland 117 079
Neutral Grassland 109 073
Acid Grassland 089 055
Dwarf Shrub Heath 087 063
Fen Marsh and Swamp 081 073
Bog 071 052
All habitat types 102 072
b) Great Britain - Aggregate Vegetation Class
AVC 1998 2007 1998-2007
Crops and weeds 115 085
Tall grass and Herb 109 092
Fertile grassland 117 081
Infertile grassland 111 073
Lowland woodland 127 092
Upland Woodland 104 067
Moorland grass mosaics 085 057
Heath and bog 074 054
All vegetation types 102 072
Direction of
significant
changesShannon Diversity
Shannon Diversity
Direction of
significant
changes
184
Countryside Survey Soils Report from 2007
8 Soil invertebrates
c) Great Britain - Soil LOI Category
Soil LOI category 1998 2007 1998-2007
Mineral 112 082
Humus-mineral 112 074
Organo-mineral 094 062
Organic 069 051
Direction of
significant
changesShannon Diversity
Figure 86 Changes (+- 95 CIs) in invertebrate Shannon diversity based on enumeration to broad taxa of
invertebrates collected from soils (0-8cm depth) within a) Broad Habitats b) Aggregate Vegetation Classes and
c) Soil LOI categories across Great Britain Standard errors are indicated Significant differences p lt 005 p
lt 001 p lt 0001 are shown
-8
-4
0
4
8
12
16
20
Bro
adlea
f
Coni
fer
Ara
ble
Impro
ved
Gra
ss
Neut
ral G
rass
Acid
Gra
ss
Shr
ub Hea
th
Bog
All ha
bita
tsCh
an
ge p
rop
ort
ion
mit
es
pri
ng
tail
s
per
plo
t
-8
-4
0
4
8
12
16
20
Cro
ps a
nd w
eeds
Tall g
rass
and
herb
Fertile
grass
land
Infe
rtile g
rass
land
Lowland
woo
ded
Upla
nd w
ooded
Moo
rland
gra
ss m
osaics
Heat
h and
bog
All ve
geta
tion
type
s
Ch
an
ge p
rop
ort
ion
mit
es
pri
ng
tail
s
per
plo
t
-8
-4
0
4
8
12
16
20
Min
eral
Hum
us-m
iner
al
Org
ano
-min
eral
Org
ani
c
Ch
an
ge p
rop
ort
ion
mit
es
pri
ng
tails
per
plo
t
a) Broad Habitats
c) LOI categoriesb) Aggregate vegetation class
185
Countryside Survey Soils Report from 2007
8 Soil invertebrates
84 Discussion and Policy Implications
841 Introduction
Soils are critical components of the terrestrial ecosystems They are vulnerable to the effects of anthropogenic activity such as the release of pollutant chemicals and accelerating climate change Within the soil the micro- meio- meso- and macro-fauna all play a critical role in the provision of many important soils functions and resulting ecosystem services The poorly established taxonomy of many common soil macroinvertebrate taxa coupled to a declining taxonomic base means that the effects of human activity on subterranean invertebrate community structure is not well understood These include not only nematodes mites and springtails whose morphological taxonomy is ldquodifficultrdquo but also groups such as Oligochaetes and Molluscs for which there is strong evidence for a high frequency of morphologically similar cryptic species (King et al 2008) Countryside Survey represents one of only a limited number of programmes that have attempted national scale monitoring of soil biodiversity CS is unique in co-ordinating soil biodiversity monitoring at a GB scale with other surveying approaches for land use vegetation soils and waters Other countries such as the Netherlands Germany and Canada do have programmes involving soil biodiversity assessments however unlike CS which is temporally synchronised in a single season these other programs take a rolling approach to sample collection (ie sampling a certain percentage of sites in each year) As outlined the aim of soil invertebrate sampling in CS was not to provide a comprehensive assessment of soil biodiversity since this would require use of a wide range of techniques Instead a snapshot of the abundance of principally the main soil mesofauna groups the mites and springtails with some information on meiofauna (eg nematodes) and macrofauna is gathered Microbial diversity was not measured in the main part of CS although bacterial diversity in all soils for which soil invertebrate communities were assessed have been analysed in separate work supported through NERC grants raising the potential for a more integrated assessment of the microbial and invertebrate diversity data From the re-sampling in CS in 2007 the key policy question to be addressed was whether CS could provide any evidence to indicate that there has been a loss of soil biodiversity as has been stated in previous statements made by the EU Because it was not feasible within available resources to identify collected fauna to species levels due to both the number of invertebrates captured and the challenge of species level identification for groups such as the oribatid mites it is certainly not possible to provide a comprehensive answer to the policy question Between year variation in seasonal weather patterns may also strongly influence patterns observed While a complete answer is not possible useful insight into the status of soil communities at the GB scale and with habitats vegetation classes and different soil typ es can be derived from the survey results The re-sampling of soil communities in 2007 showed clear trends at the national scale Mean number of invertebrates collected significantly increased across GB Overall there was an increase of 47 in total catc h in the CS in 2007 survey compared to 1998 Calculated at the level of individual per m
2 based on the 4 cm
2
diameter of the sample core used the total catch measured equates to around 41500 individual soil invertebrates per m
2 within the top 8 cm of the soil in 1998 and over 61252 in 2007 Values for individual
habitats varied from around 25000 individuals per m2 for both 1998 and 2007 in Arable and Horticulture
habitats to around 73000 in 1998 and 89000 in 2007 for Broadleaved Woodlands The estimat e of total catch m
2 for Bog soils of around 39000 for 1998 and 61000 for 2007 are above the range of 5000 -10000 in
a dry summer (2003) found previously in peatland and birchwood soils (Osler et al 2006) Studies at the same sites in a wetter summer (2004) did produce values of 14000 -100000 mite m
2 and 1500-26000
springtail m2 that are more comparable with estimates from CS in 2007 Values for deciduous woodland are
close to the upper limit of the range of 15000-90000 for the total catch of mites and springtails found in control and disturbed woodland (Maraun et al 2003) This suggests that the method used for invertebrate sample collection in CS produced estimates of abundance that are largely compatible with results from published studies Scaling up estimates of invertebrate numbers to a GB scale based on measured density and GB land area indicates that there were an estimated 128 quadrillion (128x10
16) soil invertebrates
186
Countryside Survey Soils Report from 2007
8 Soil invertebrates
present in the top 8 cm of GB soils during the time of CS in 2007 This number is up 41 quadrillion (41x1015
) since CS in 1998 when ldquoonlyrdquo 87 quadrillion (872x10
15) invertebrates were estimated to be present
Stratification of the data indicated that the increase in total invertebrate catch was detectable in all habitats except arable and managed grassland areas largely associated with mineral soils Because total invertebrate catch was dominated by mites and springtails the increase in the combined total catch of these two groups was broadly consistent with patterns found for total invertebrate catch An in crease in the mite springtail ratio indicated that the increase in combined mite and springtail and total invertebrate catch was mainly the result of an increase in the number of mites retrieved Shannon diversity was reduced in all soils This was partly the result of an increase in the catch of mites the increased dominance of which within the samples results in a corresponding reduction in the Shannon diversity statistic although the reduction in diversity was not solely the result of an increase in the dominance of mites as a reduction in the richness of broad taxa represented by at least one individual in each core was also found
842 Cause of change in soil invertebrate communities between surveys
An important consideration when comparing results between repeat surveys is to ensure that the methods used for both sampling occasions are comparable In certain cases changes in instrumentation in available facilities or of staff can result in shifts in methods that require careful thought befor e conclusions are drawn from results Because large differences in invertebrate catch were seen between the 1998 and 2007 surveys consideration was given as to whether there were methodological shifts in 2007 compared to 1998 that could have contributed to the observed differences Five stages of the sampling and enumeration process were identified within which potential variations in procedure could occur Methods used in both surveys were compared in relation to these five areas and the potential impact of any sampling and handling differences between surveys considered 1 Preparation of the plot area for sampling In the field survey in CS in 2007 core sampling locations were decided according to instructions set out the field sampling protocol (Emmett et al 2008) The approach was consistent with that used in 1998 For sampling the cores used for invertebrate enumeration surveyors were instructed to leave the litter layer present on the soil surface intact In CS in 1998 similar instructions were not given explicitly to the surveyors Observation of the receipt of core from both surveys suggests that in reality this potential discrepancy is of minor importance For example for grassland sites cores were almost always received with the turf layer still intact at the top of the core throughout both surveys This suggests that sampling in the large number of grassland plots present within CS wa s conducted in an identical way For plots where grass was not present it is harder to tell if the litter layer has been similarly treated If the tendency was for litter removal in CS in 1998 but not in 2007 this could play a part in the higher catches in 2007 since invertebrate densities are highest in the surface litter layer and this layer would be more prevalent in the cores taken in the later survey If this was indeed the case though it would be expected that catches would be increased by a greater amount in woodland than grassland plots since it is know from the intact vegetation that grassland plots were similarly treated Comparison of the relative change in the woodland and grassland habitats suggests that in fact changes in catches in the tw o habitats were broadly similar This suggests that differences in the treatment of the litter layer during sampling are not likely to be the cause of the different in community parameters observed between surveys 2 Soil core insertion and on site handling Exactly the same cores were used for CS in 2007 as were used in 1998 (white 4 cm diameter 8 cm long plastic cores) Cores were knocked into the ground using a mallet and plate on both occasions Once the core had been inserted and removed it was nec essary to cap the core to prevent desiccation affecting invertebrate survival during transit Caps used in CS in 1998 were designed to fit into the inner rim of the core while those used in CS in 2007 fitted over the out rim The caps that were used in CS in 1998 were noted to slightly compress the core during insertion while the same was not true of the caps in 2007 For invertebrates to escape from soils during Tullgren extraction it is necessary that they are able to freely move through the soil profi le to allow escape and capture It is conceivable that the slight compaction of CS in 1998 soils may have impeded invertebrate escape during extraction with a resulting small reduction in catch in CS in 1998 While a compaction effect on Tullgren extractio n can not be fully excluded the extent of compaction of cores in 1998 was actually rather small Given the magnitude of the shift in community parameters between surveys it is difficult to envisage that this small difference could have
187
Countryside Survey Soils Report from 2007
8 Soil invertebrates
lead to the almost 50 increase in catch found in 2007 compared to the earlier survey particularly as catches in both surveys are towards the upper range of previous invertebrate counts taken in similar habitats (Osler et al 2006 Maraun et al 2003) 3 Core transport to the laboratory During both the 1998 and 2007 surveys the fauna cores were immediately placed into cool boxes after being dug from the soil and then posted first class to the laboratory at the first opportunity Return by post was selected as the most rapid means of core return even from dist ant locations It was acknowledged during initial survey design that the transport process was not well controlled and that the cores may be subject to stressful conditions notably high temperatures as sampling was mainly conducted over the summer months Many soil invertebrates have a low tolerance to heat stress Thus it is certainly possible that some temperature intolerant invertebrates in particular cores may have been lost (ie died) during transit Because the same approach to core return was used and also because the post service worked equally effectively for both surveys this suggests that differences in the time of transit while possibly affecting the integrity of individual samples can not account for community changes detected between surveys Further work to trace temperature data relating to the survey period is needed to investigate if different in average conditions during transit were prevalent between survey that could play a role 4 Soil invertebrate extraction method and conditions Different methods of extraction will collect a different sample of invertebrates from a given sample Tullgren extraction is particularly well suited to the collection of hard bodied mesofauna groups such as mites and springtails (Van Straalen and Rijninks 1982) Exactly the same Tullgren funnel system was used for invertebrate extraction in both Countryside surveys In CS in 2007 the funnel system was housed in a laboratory that received direct sun and so regularly reached temperature of 25
oC while in CS in 1998 the extractions took place in a laboratory that was shaded and so ambient
conditions did not regularly reach these higher temperatures High temperatures can be expected to stress soil invertebrates resulting in possible mortality within cores meaning that individuals are not extracted It was initially a concern in CS in 2007 that the high ambient temperatures in the laboratory used for the extractions could affect invertebrate catches with high temperature resulting in some mortality within cores and so lower catches Since actual catch observed in CS in 2007 we re significantly higher than in 1998 it seems unlikely that ambient conditions had any effect on the efficiency of soil extraction and ultimately on observed community change 5 Soil invertebrate sorting identification and enumeration Different personnel were involved in enumeration in the 1998 and 2007 surveys This could lead to discrepancies between surveys However the involvement of multiple staff for sorting and identification in both surveys and also the use of quality assurance checks during enumeration are both factors that suggest that identification and counting errors are unlikely to lie behind observed community change found between survey years As outlined a comparison of the detailed protocols for the two surveys indicated only small discrepancies between surveys These related to tube capping ambient conditions during extraction and changes in staff involved in enumeration In practice the changes were actually rather small The majority of the two procedures (cores sampling method return procedure Tullgren system quality assurance system) were rather similar Given the magnitude of community changes it seems unlikely that changes in capping which results in slight core compaction could account for the difference in catches se en Ambient temperature during sampling would have been expect to lower catches in 2007 compared to 1998 while quality assurance and training procedure precluded difference resulting from personnel change For this reason it is difficult to argue that the difference seen in soil invertebrate community between surveys namely an increased catch of especially mites leading to a high mite springtail ratio and higher combined mite and springtail number coupled with a reduction in diversity resulting from both increased mite dominance and lower representation of broad taxa in CS in 2007 samples are solely down to methodological difference Real differences in community parameters between sample years seem instead to be the most reasonable explanation
188
Countryside Survey Soils Report from 2007
8 Soil invertebrates
843 Initial attribution of soil invertebrate community change
The lag in completing the enumeration of the soil fauna means that at present attribution of changes in the soil invertebrate community remain in process Even though detailed attribution of changes in soil invertebrate community structure is yet to be completed it is possible even now to identify a number of potential candidate drivers that could be responsible for the quite substantial changes detected in soil communities between the two survey years Soil invertebrate communities are known to be sensitive to climatic condition For example in 1998 it was noted that the number of oribatid mites tended to increase in plots that are subjected to high mean annual rainfall while springtail were more frequent in plots where precipitation was lower The survey year of 2007 in the UK was one of the wettest summers on record While it must also be recognised that 1998 was also a relatively wet summer the rainfall amounts that occurred over the k ey survey month of June and July in GB in 2007 were notably higher and in some areas reached record levels indicating the extent of rainfall in the later survey year Wetter soil resulting from more rain can have both a positive and a negative effect on soil invertebrate catches from Tullgren extractions Wet soils tend to swell As a result this means that within the restricted volume of the sample soil core a smaller weight of soil will be sampled Lower soil layers in particular can as a result be missed This reduced sampling at depth could result in the loss of some invertebrates from the sample Since the majority of soil invertebrates live in or on the surface soil and soil litter layers the actual number of individuals missed by the reduced sampling of deeper soils may actually be rather small A potentially more important effect of wetter soils may be that they maintain soil invertebrate s in an active state that would not be the case in soils that were drier It is well known that many soil i nvertebrates are sensitive to drought conditions This is because most below-ground invertebrates have water permeable integuments and so are unable to resist water loss in drying environments The sensitivity of some soil taxa to drought stress is recognised as an important determinant of their habitat preferences As a result the ecophysiology of desiccation tolerance and water balance in some taxa has been studied in detail Some species such as earthworms and springtails may burrow into the deeper so il layers where soil moisture is retained to escape from drought condition Other species use a range of desiccation tolerance mechanisms (eg anhydrobiosis estivation) If escape to moist deeper soil microsites is used then this can prevent the initial capture of individuals within a defined depth soil sample If a desiccation tolerance strategy is used this can preclude the individual from responding to desiccation as a result of Tullgren extraction in a manner that allows capture In either case this may limit invertebrate catches in drier soils Initial attribution work focussing on 1998 and 2007 soil moisture measurements has indicated that there is no clear evidence for an increase in soil moisture content and sampling time (data not shown) This c omparison does not preclude a potential influence of high rainfall on community parameters since communities are likely to response to longer term changes in soil moisture regime This means that even though there is no clear evidence of soil moisture levels between surveys it remains possible that the high rainfall found in 2007 may indeed play some role in the observed different between soil communities found between survey years It is widely recognised that soil invertebrate communities are sensitive to a range of land management practices (Schon et al 2008) including land cover change (Black et al 2003) tillage regime and disturbance (Maraun et al 2003) pesticides and heavy metals (Frampton 1999 Pedersen et al 1999) and nitrogen inputs (Lindberg and Persson 2004) Because the changes in soil community structure detected between surveys was relevant to all habitats and vegetation classes except intensively managed land mainly on mineral soils attribution of changes in soil community composition to a particular driver must be relevant for a range of habitats and soil types This means that changes in land management such as stocking density pesticide application rates or tillage regimes that apply only to certain habitat types cannot explain all of the observed difference At a national scale one major difference that has occurred that has had a major effect on soil properties is the change in sulphur deposition and resulting effect on soil pH Measures to reduce sulphur emission have resulted in reduced rate of deposition and a resulting increase in soil pH across GB of almost 05 pH units since 1978 The pH of the soil is known to play a key role i n determining the structure of below ground communities Within CS in 2007 a negative relationship exists between soil pH and total invertebrate catch (Fig 87) This is explained because the highly abundant oribatid mite group do not favour neutral soil habitats associated with mineral soils in agricultural landscapes but instead favour low
189
Countryside Survey Soils Report from 2007
8 Soil invertebrates
pH organic soils in more upland areas Thus while important for determining overall composition of the soil community (eg high catch and dominance of mites in Dwar f Shrub Heath and Bogs) change in soil pH alone is unlikely to be a major driver of community change between survey years Comparison of communities in different habitats indicates that larger soil invertebrate communities are found in habitats such as woodland while Arable and Horticulture and managed grassland have smaller communities with fewer broad taxa It is often assumed because they are recently planted that Coniferous Woodland have a lower conservation value than older Broadlea ved Woodland Full species identification and enumerations of different woodland of known age would be needed to test this hypothesis for soil fauna The GB wide survey from CS does indicate that in terms of community size and frequency of broad taxa the two woodland types differ little in their harboured soil communities For the conservation of soil biodiversity on the basis of this analysis woodlands emerge as potentially important targets The small community size and low taxa representation for managed habitats suggests impacts of land management practices such as tillage fertiliser inputs and pesticide application on soil communities in these areas Arable and grassland areas emerge as potential targets for soil biodiversity restoration Figure 87 Relationship between soil pH measured in soils sample (0-15 cm depth) in CS in 2007 and the total
catch of soil invertebrates from soil core (0-8) depth
Within the land use and habitat survey of CS one of the most notable changes over time has been a significant increase in woodland cover in the UK Because woodland harbours large soil communities it would be expected that this increase in woodland area would be beneficial to the national stock of soil invertebrates Within CS the designation of Broad Habitats is done by surveyors on each sampling occasion This means that areas designated as woodland in each survey are done on the basis of current habitat distribution Similarly vegetation class is determined directly by analysis of the flora present at the actual sample plots Since the statistical analysis links invertebrate catch directly to recorded Broad Habitat and AVC in each category changes in soil community composition between surveys cannot be linked simply to changing in woodland frequency In fact because new woodland may be expected to still be undergoing community succession land cover change to woodland may be expected to have a slight negative effect on invertebrate community catch and diversity within woodland cate gories in a substantial amount of new
y = 46489e-0368x
R2 = 01776
1
10
100
1000
10000
3 4 5 6 7 8 9
Soil pH CS 2007
Lo
g s
oil
in
verte
bra
te c
atc
h
CS
20
07
Fig X7 Relationship between soil pH measured
in soils sample (0-15 cm depth) in CS2007 and
the total catch of soil invertebrates from soil core
(0-8 cm) depth
Soil pH 1998
Log soil invertebrate
catch in 2007
190
Countryside Survey Soils Report from 2007
8 Soil invertebrates
woodland becomes included within later surveys Increasing woodland may therefore play only a limited role as a driver of overall change
844 Concluding remarks
Re-sampling of the soil invertebrate community was undertaken in CS in 2007 as part of the soil work -package according the published CS methodology A total of 945 samples were enumerated Results indicated an overall significant increase in total invertebrate catch in samples from all habitats AVCs an d soil types except for agricultural areas located predominately on mineral soils The increase in invertebrate catch predominantly related to an increase in the catch of mites in CS in 2007 sample s This was shown in the increase in mite springtail ratio found across GB and in many Broad Habitats AVCs and soil LOI categories The increased dominance of mites was a major factor that decreased Shannon diversity in CS in 2007 cores although there was also a small reduction in the number of broad taxa represented in sample cores at the GB scale and also when the data was stratified to Broad Habitat AVC and soil type (by LOI) A single repeat sampling campaign such as CS cannot prove or disprove whether a large scale and long term change in soil biodiversity is underway Particularly effects of short term temporal effects such as seasonal weather patterns on invertebrate communities or sampling efficiency cannot be excluded Nonetheless on the basis of the survey data it is certainly not possible to confidently refute the possibility that such a change may be occurring This suggests that further analysis through focussed study may be needed to tease out whether the changes in soil chemistry land management or climate are playing a role in the observed so il invertebrate community change
85 References
Black HIJ Parekh NR Chaplow JS Monson F Watkins J Creamer R et al 2003 Assessing soil biodiversity across Great Britain national trends in the occurrence of het erotrophic bacteria and invertebrates in soil Journal of Environmental Management 67 255-266
Emmett BA Frogbrook ZL Chamberlain PM Griffiths R Pickup R Poskitt J Reynolds B Rowe
E Spurgeon D Rowland P Wilson J Wood CM 2008 CS Technical Report No 307 Soils Manual
NERCCentre for Ecology amp Hydrology 180 pp (CEH Project Number C03259) Frampton GK 2009 Spatial variation in non-target effects of the insecticides chlorpyrifos cypermethrin and pirimicarb on Collembola in winter wheat Pesticide Science 55 875-886 King RA Tibble AL Symondson WOC 2008 Opening a can of worms unprecedented sympatric cryptic diversity within British lumbricid earthworms Molecular Ecology 17 4684-4698 Lindberg N Persson T 2004 Effects of long-term nutrient fertilisation and irrigation on the microarthropod community in a boreal Norway spruce stand Forest Ecology and Management 188 125-135 Maraun M Salamon JA Schneider K Schaefer M Scheu S 2003 Oribatid mite and collembolan diversity density and community structure in a moder beech forest (Fagus sylvatica) effects of mechanical perturbations Soil Biology amp Biochemistry 35 1387-1394 Osler GHR Cole L Keith AM 2006 Changes in oribatid mite community structure associated with the succession from heather (Calluna vulgaris) moorland to birch (Betula pubescens) woodland Pedobiologia 50 323-330 Pedersen MB Axelsen JA Strandberg B Jensen J Attrill MJ 1999 The impact of a copper gradient on a microarthropod field community Ecotoxicology 8 467-483
191
Countryside Survey Soils Report from 2007
8 Soil invertebrates
Schon NL Mackay AD Minor MA Yeates GW Hedley MJ 2008 Soil fauna in grazed New Zealand hill country pastures at two management intensities Applied Soil Ecology 40 218-228 Van Straalen NM Rijninks PC 1982 The efficiency of Tullgren apparatus with respect to interpretation seasonal-changes in age structure of soil arthropod populations Pedobiologia 24 197-209
192
Countryside Survey Soils Report from 2007
This report was produced by the Centre for Ecology amp Hydrology with input from the other members of the Countryside Survey partnership Copyright of the report and photographs is owned by the Natural Environment Research Council Copyright enquiries should be addressed to Knowledge Transfer Team Centre for Ecology amp Hydrology Maclean Building Benson Lane Wallingford OX10 8BB This publication excluding logos may be reproduced free of charge in any format or medium for research private study or the purposes of internal use within an organisation This is subject to it being reproduced accurately and not being subject to any treatment that could be considered derogatory The reproduced material must be acknowledged as NERC Copyright (except where otherwise s tated) and the publication cited as follows Emmett BA Reynolds B Chamberlain PM Rowe E Spurgeon D Brittain SA Frogbrook Z Hughes S Lawlor AJ Poskitt J Potter E Robinson DA Scott A Wood C Woods C 2010 Countryside Survey Soils Report from 2007 Technical Report No 907 NERCCentre for Ecology amp Hydrology 192pp (CEH Project Number C03259)
For further information on Countryside Survey see wwwcountrysidesurveyorguk
Or contact Countryside Survey Project Office Centre for Ecology amp Hydrology
Lancaster Environment Centre Library Avenue Bailrigg Lancaster LA1 4AP
Telephone 01524 595811 Email enquiriescehacuk Countryside Survey in 2007 was funded by a partnership of government -funded bodies led by the Natural Environment Research Council (NERC) and the Department for Environment Food and Rural Affairs (Defra)
Disclaimer Any decisions or actions informed by this Technical Report are taken entirely at your own risk In no event shall NERC be liable for any damages including loss of business loss of opportunity loss of data loss of profits or for any other indirect or consequential loss or damage whatsoe ver arising out of the use of or inability to use the material presented in this report The Countryside Survey partnership has endeavoured to ensure that the results presented in this report are quality assured and accurate Data has been collected to es timate the stock change extent andor quality of the reported parameters However the complex nature of the experimental design means that results can not necessarily be extrapolated andor interpolated beyond their intended use without reference to the original data

1
Countryside Survey Soils Report from 2007
1 Centre for Ecology amp Hydrology Maclean Building Benson Lane Crowmarsh Gifford Wallingford
Oxfordshire OX10 8BB 2
Formerly Centre for Ecology amp Hydrology 3
Formerly Centre for Ecology amp Hydrology Now Environment Agency Wales
CS Technical Report No 907
Soils Report from 2007
Emmett BA1 Reynolds B
1 Chamberlain PM
2
Rowe E1 Spurgeon D
1 Brittain SA
1 Frogbrook Z
3
Hughes S1 Lawlor AJ
1 Poskitt J
1 Potter E
1
Robinson DA1 Scott A
1 Wood C
1 Woods C
1
Centre for Ecology amp Hydrology
(Natural Environment Research Council)
January 2010 (revised 23 February 2010)
2
Countryside Survey Soils Report from 2007
Acknowledgements
The Countryside Survey of 2007 is funded by a partnership of nine government funded bodies led by the Natural Environment Research Council (NERC) and the Department for Environment Food and Rural Affairs (Defra) The completion of the survey has only been made possible by the support and advice of many dedicated individuals from these and other organisations who provided their time and valuable advice to the project board the project steering group and the pro ject advisory groups The project Partners would like to thank all the landowners farmers and other land managers who gave permission for the field surveyors to collect data and samples from their land Without such cooperation scientific field studies like Countryside Survey would not be possible The Countryside Survey Partners would like to thank all those who contributed to the work presented in this report largely in NERC‟s Centre for Ecology amp Hydrology (CEH) Field surveyors regional coordinators and QA teams Nik Aspey Boris Assyov Maurice Bailey Dave Bennett Caroline Boffey Katja Busch Anne Butler Luciana Carotenuto Paul Chamberlain Rebecca Chance Jake Chant Hannah Chivers David Cole Ceirios Davies Kathryn Dawson Jan Dick Mit zi de Ville Martin Duncan Claire Edwards Richard Ellis Fiona Everingham Angus Garbutt Iain Gunn Anne Harvey Adrianna Hawczak Stuart Hedley Lynn Heeley Gale Hodges Nik Hudson Sarah Hulmes Gwilym Jones Ursula Jones Jana Kahl Emma Koblizek W endy MacFarlane Lindsay Maskell Alain Mauric Elaine McClymont Sebastian Meis Bruce Miller Ruth Mitchell Lindsay Moore Lila Morris Mike Morecroft Owen Mountford John Murphy Emma Nicklin Lisa Norton Peter Nuttall Judith O‟Hare Martin Page De nise Pallett Hristo Pedashenko Jodey Peyton Alison Pike Hannah Price Maria Ramirez -Jimenez Amy Rees Brian Reynolds Nicola Rivett Glenn Roberts Liz Roberts Patrick Home Robertson Rob Rose Martin Rossall Ed Rowe Frank Ryan Stephen Ryder Pete Scarlett Dave Scott Robert Seaton Luke Sidebottom Louise Slack Simon Smart Tom Smith Jon Steele Peter Steward Michelle Taylor Sam Thomas Nicola Thompson Will Thomson Annie Truscott Linda Turner Jackie Ullyett Kiril Vasilev Katy Walker Ke vin Walker Alistair Watson Trevor West James Whiteford Michael Wilcox Lorna Wilkie Geoffrey Wilkinson Claire Wood Statistical analytical technical and data management support Annie Brittain Mike Brown Paul Chamberlain Kathy Chandler Jackie Chaplow Jenny Clapham Ralph Clarke Andy Crowe Zoe Frogbrook Steve Hughes Alan Lawlor Jan Poskitt Elaine Potter Annabel Rice Phil Rowland Andy Scott Rod Scott Rick Stuart Nicola Thomson Colin Vincent Mike Wilson John Watkins Ruth Watts Claire Wood Clive Woods and Simon Wright Advice and training Colin Barr Helaina Black Bob Bunce Zoe Frogbrook Dave Howard Mike Hornung Steve Marshall Steve Moss and Dave Wilson Project management and administration Mark Bailey Mike Brown Peter Carey Julie Delve Bridget Emmett Les Firbank Julie Grimshaw Lindsay Maskell John Murphy Lisa Norton Dan Osborn Terry Parr Ian Simpson Simon Smart and John Watkins
3
Countryside Survey Soils Report from 2007
Contents
Executive Summary p4 1) Field Sampling and Bulk Density p9 2) Carbon p18 3) Soil pH p47 4) Total nitrogen and CN p71 5) Mineralisable-N p89 6) Olsen P p108 7) Soil metal concentrations p129 8) Soil invertebrates p167
4
Countryside Survey Soils Report from 2007
Executive Summary
Executive Summary
Countryside Survey is a unique study or bdquoaudit‟ of the natural resources of the UK‟s countryside The Survey
has been carried out at regular intervals since 1978 The countryside is sampl ed and studied using rigorous
scientific methods allowing us to compare results from 2007 with those from previous surveys In this way
we can detect the gradual and subtle changes that occur in the countryside over time A series of reports
have been published outlining the main findings for UK and individual countries which included results for two
soil variables namely soil carbon and acidity This report outlines the major findings for all soil variables
measured as part of the survey in 2007
Key policy questions to be answered in 2007 were
Can we confirm the loss of soil carbon (0-15cm) as reported by Bellamy et al 2005
Has the recovery from acidification detected by Countryside Survey in 1998 between 1978 and 1998
continued
Can the trend of eutrophication of the countryside detected in the vegetation be detected in the soil
using the mean total nitrogen concentration
Can the trend of eutrophication of the countryside detected in the vegetation be detected in the soil as
well using a more sensitive soil process method for nitrogen
Can the trend of increasing P status in intensive grasslands be confirmed and is it matched in other
habitats
Is the decline in atmospheric deposition of heavy metals as reported by the Heavy Metals Monitoring
Network reflected in soil metal concentrations measured in Countryside Survey
Does Countryside Survey provide any evidence to indicate that there has been a loss of soil
biodiversity as has been stated by the European Union
Soils have been part of Countryside Survey since it‟s inception in 1978 The rationale for their inclusion was
originally to provide many of the explanatory variables which contribute to the understanding of vegetation
distribution and change which are the central core of the survey More recently soils have been recognised
as a valuable resource in their own right due to their importance for delivering a range of ecosystem services
Consequently the number of variables have increased over time from soil organic matter and pH in 1978 to
nutrients contaminants and biodiversity in 1998 and soil physical measurements and biogeochemical fluxes
in the latest survey in 2007
The soil variables were selected for inclusion in the 2007 survey according to a range of criteria including
relevance to policy needs scientific questions uniqueness of Countryside Survey soils data both in isolation
and when combined with other Countryside Survey variables value for money and links and compatibility
with other soil monitoring programmes It should be noted that with the exception of soil invertebrates many
Countryside Survey soil variables are currently included in the list of recommended primary indicators of soil
quality by the UK Soil Indicator Consortium namely soil organic matter soil organic carbon bulk density soil
acidity (pH) mean total nitrogen concentration an indicator of phosphorus availabil ity (Olsen-P) an indicator
of nitrogen availability (mineralisable-N) total copper zinc cadmium and nickel All variables with the
exception of soil invertebrates are measured in the top 15cm of the soil profile only Soil invertebrates are
recorded for the top 8cm of soil This focus on the top 15cm of soil mirrors the focus of several other soil
monitoring programmes as it is thought the top soil horizons are the most susceptible to change over time as
they are more immediately affected by land management activities and environmental change Ideally future
soil monitoring should include lower soil horizons as important stocks of carbon supply of nutrients filtering
and storage of contaminants and soil biota occur below the top 15cm
Countryside Survey uses a sampling approach which samples one-kilometre squares randomly located within
different land class in GB The original 1978 survey consisted of 256 1-km squares and collected five soil
samples per square where possible taken from random co-ordinates in five segments of the square Detailed
vegetation and other biophysical measurements were taken at the same location In total the 1978 survey
collected 1197 soil samples for analysis During 1998 surveyors collected soil samples from the plots used
5
Countryside Survey Soils Report from 2007
Executive Summary
for soil sampling in the original 1978 squares and 1098 samples were returned for analysis Plots were re-
located using maps andor markers placed in the 1978 survey In 2007 591 1-km squares were sampled with
a total of 2614 samples returned for analysis More samples were therefore taken in 2007 than collectively in
1978 and 1998 This increase in sample over time has been driven by the requirement to provide individual
country level reports first for Scotland in 1998 and then Wales in 2007 Statistical methods are used to
enable this increase in sample number over time to be taken into account when estimating change over time
The limited number of sampling sites in Wales in 1978 and 1998 have limited the number of vegetation and
soil categories where change can be reported However the data provides an important expanded baseline
for reporting a wider range of changes in future surveys
Full details on all methods used are available from the Countryside Survey website (Emmett et al 2008
available at httpwwwcountrysidesurveyorgukpdfreports2007CS_UK_2007_TR3pdf)
Results are reported by three major categories for Great Britain and individual countries
Broad Habitat - The Broad Habitat classification consists of 27 habitats which account for the entire
land surface of Great Britain and the surrounding sea Countryside Survey reports on soils for 10
major terrestrial habitats
Aggregate Vegetation Class (AVC) ndash is a high level grouping of vegetation types produced from a
quantitative hierarchical classification of the different plant species found in the original Countryside
Survey sample plots Soil organic matter category - Mineral humus mineral organo-mineral and organic soils
Significant results relate to statistical significance with their ecological and policy relevance highlighted
where appropriate
Key findings from the soils component of the Countryside Survey in 2007 are
Bulk Density
A total of 2614 samples were sampled from 591 1km squares from across G reat Britain during the Countryside Survey field survey in 2007
Topsoil bulk density measurements were carried out on all individual samples collected in 20 07 Values ranged from 002 to 195 g cm
-3 and were negatively correlated with soil C concentration
Mineral soils exhibited the highest bulk density values and organic soils the lowest Average topsoil bulk density across Aggregate Vegetation Class and Broad Habitat classes varied between 02 and 12 g cm
-3 and was lowest in Bog soils and highest in Arable and Horticulture soils
A new transfer function between bulk density and C has been defined which significantly changes past estimates of soil carbon densities and stocks (0-15cm) of organic soils previously published for other surveys
Carbon
Carbon concentration in the soil (0-15 cm) increased in Great Britain between 1978 and 1998 and decreased between 1998 and 2007 Overall there was no change in carbon concentration in the soil (0-15 cm) in Great Britain between 1978 and 2007 and cannot confirm the loss reported by the National Soil Inventory
The one consistent exception is loss of carbon (0 -15cm) from the intensively managed Arable and Horticulture Broad Habitat Crops and Weeds Aggregate Vegetation Class This suggests that current policies in place to limit soil degradation are not maintaining soil quality in cropped land
The mean soil (0-15cm) carbon density across Great Britain in 2007 was calculated to be 69 tha ranging between a mean of 47 tha in the Arable and Horticulture Broad Habitat to a mean of 91 tha in Acid Grassland Peat soils do not contain the highest density in topsoil due to low bulk densities The new transfer function between bulk density and C significantly changes past estimates of soil carbon densities stocks and change (0-15cm) of organic soils previously published for other surveys
6
Countryside Survey Soils Report from 2007
Executive Summary
Area estimates for each Broad Habitat were used to convert soil carbon densities to soil (0-15cm) carbon stock for GB and individual countries Soil (0 -15cm) values were 1582 TgC for GB and 795TgC 628 TgC and 159 TgC for England Scotland and Wales in 2007 respectively It must be emphasised this significantly underestimates the tota l carbon stock in soils due to the large carbon stores at depth particularly in peat soils This has greatest impact for estimates for Scotland However topsoil carbon stocks may be most vulnerable to land management activities and environmental change
pH
The mean pH of soils (0-15cm) increased in less acidic soils across Great Britain (GB) between 1998 and 2007 continuing a trend observed between 1978 and 1998 These soils are associated with Broadleaved Woodland Arable and Horticulture Improved Grassland and Neutral Grassland Broad Habitats This increase in pH is consistent with the expected benefit of continued reductions in sulphur emissions
There was no significant change in mean soil (0-15 cm) pH in more acidic organic-rich soils across Great Britain between 1998 and 2007 This will affect Broad Habitats such as Bog Dwarf Shrub Heath and Acid Grassland Data analysis is ongoing to determine if the lower su lphur reductions in the north and west of the Great Britain or other drivers of change such as nitrogen deposition and land management are responsible in the organic soils where pH did not significantly increase between 1998 and 2007 Conversion between land uses between surveys was not responsible for this as similar trends were observed in soils with or without conversion
One exception with no apparent trends between any time period was Coniferous Woodland It is possible the acidification of soils associated with intensive forestry due to base cation uptake and enhanced capture of acidic pollutants by the tree canopy may be offsetting the effects of reduced sulphur emissions
The results for individual countries broadly reflected those for Great Britain as a whole with continued increase in soil pH only observed in less acidic soils Insu fficient sample size for some habitat types with lower area in individual countries prevented significant trends being identified in some cases
The implications of these findings are that current emission control policies combined with current policies to protect soil through sustainable land management practices have had some major benefits but they may not be sufficient to promote continued recovery from acidification in organic -rich soils
Nitrogen
There were small but significant decreases in mean so il (0-15 cm) total nitrogen concentration between 1998 and 2007 in many Broad Habitats and Aggregate Vegetation Classes across Great Britain and the individual countries no reporting category recorded an increase in mean soil (0 -15 cm) total nitrogen concentration
For semi-natural and woodland soils continued input of nitrogen deposition at 20 -30 kgNhayr for many parts of Great Britain has not caused the expected average increase of 3 -4 in this basic soil property Instead the decreases observed combined with a trend for an increase in total carbon to nitrogen ratio suggest there may be increased nitrogen loss or uptake possibly combined with a trend for increased carbon density as reported for some soils in Chapter 2 The effects of one or both of these processes would be to effectively bdquodilute‟ the soil (0 -15cm) nitrogen concentration signal Both processes (increased nitrogen loss and increased carbon fixation by plants leading to storage in soil) are known possible consequences of nitrogen enrichment which can result in vegetation composition change and thus this parameter may not be a sensitive indicator of eutrophication from atmospheric nitrogen deposition
There was no change or a small significant decline in mean soil total nitrogen concentrati ons in improved and fertile grassland categories between 1998 and 2007 across Great Britain and within individual countries despite major reductions in fertiliser use As there is no change in the soil (0 -15cm) total carbon to nitrogen ratio this indicates farmers have maintained soil nitrogen status in managed grassland systems despite a reduction in mineral fertiliser use possibly due to use of alternative organic sources of nitrogen such as slurry and organic waste products
7
Countryside Survey Soils Report from 2007
Executive Summary
In cropland systems a significant decline in soil (0-15cm) total nitrogen concentrations and total carbon to nitrogen ratios was observed between 1998 and 2007 for Great Britain and England A significant decline in soil (0-15cm) total carbon concentrations was also reported (Chapte r 2) As there is only a small decline in fertiliser use in these systems and there is evidence of combined carbon and nitrogen loss deep ploughing erosion or increased decomposition rates may be the most likely explanation of this trend
Mineralisable-N
Mineralisable-N stock (kgN ha) in soil (0-15cm) was a sensitive indicator of recognised differences in nitrogen availability between different vegetation types suggesting it is a promising indicator of eutrophication of the countryside
Initial investigations testing the link between mineralisable-N and occurrence of plant species in 45 test sites suggests it provides additional information to mean total nitrogen concentration data (N) possibly linked to short term changes in nitrogen availability or specific vegetation or soil types
There were strong geographical trends in the proportion of mineralised -N transformed to the mobile form nitrate which suggest a close relationship to broad-scale climatic or soil parameters
Future analyses will separate out the inherent variability associated with climate vegetation and soil type to identify spatial patterns which can be linked to atmospheric deposition and changes in management
Olsen-P
Mean Olsen-P concentrations in soil (0-15cm) is an index of the fertility of agricultural soils It‟s use and relevance in semi-natural and organic soils is less certain Soils collected during Countryside Survey in 1998 and 2007 indicated there had been a significant decrease in Olsen-P concentrations in soil (0-15cm) in most Broad Habitats or Aggregate Vegetation Classes across Great Britain and within individual countries
Olsen-P concentrations in soil (0-15cm) decreased significantly in all soil organic matter categories across Great Britain and within individual countries between 1998 and 2007 apart from humus-mineral soils in Scotland where no change was observed
The data do not confirm a trend of increasing P status in intensive grasslands or any other habitat soils (0-15cm) but indicate a loss of available phosphorus between 1998 and 2007 across a wide range of habitats and soil types This is likely to be linked to the large reductions in phosphorus fertiliser use over the same period
Metals
A comparison of back corrected Countryside Survey soils (0 -15cm) analyses for 1998 and 2007 samples indicated that as would be expected only relative small changes in soil trace metal concentrations occurred between surveys despite reported declines in atmospheric deposition due to the long residence time of metals in soils
Of seven metals for which repeat measurement were made during the 2007 survey only for one Cu was a statistically significant difference in soil (0 -15cm) concentrations (an increase) found at the GB level
When the data for repeat metal measurements were stratified by Broad Habitat Aggregate Vegetation Class and soil organic matter category further statistically significant differences were seen For Cu generally significant increases were observed whilst for two metals Cd and Pb changes were small and idiosyncratic between stratifications For three metals Cr Ni Zn changes were generally characterised by reduction in crop lands and no change or slight increases in less managed habitats
For some metals such as Cu and Cd it is likely that additional sources (animal manures and possibly sewage sludge manures and compost for Cu and fertiliser for Cd) beyond atmospheric inputs are important in maintaining or even increasing soil concentrations principally in managed areas For the remaining metals especially Cr Ni and Zn there is some suggestion that in areas where cropping takes place output fluxes may now exceed inputs enabling soil concentrations to decline
8
Countryside Survey Soils Report from 2007
Executive Summary
Managed landscape where intensive cropping takes place but sewage sludge a nimal manures and composts are rarely applied may be among the first habitats to return from their slight -moderately elevated states to their pre-industrial background concentrations and could be a focus for future monitoring
Soil Invertebrates
There were an estimated 128 quadrillion (128x1016
) soil invertebrates present in the top 8 cm of Great Britain soils during the time of Countryside Survey sampling in 2007 Comparing these results with those from the survey in 1998 has enable change in soil b iodiversity to be estimated at a national scale
A significant increase in total invertebrate catch in samples from soils (0-8cm) from all Broad Habitats Aggregate Vegetation Classes and soil organic matter categories except for agricultural areas on mineral soils was found in Countryside Survey in 2007 The increase in invertebrate catch was mainly the result of an increase in the catch of mites in 2007 samples This resulted in an increase in the mite springtail ratio but a decreased Shannon diversit y due to the dominance of mites in Countryside Survey in 2007 cores
A small reduction in the number of soil invertebrate broad taxa (0 -8cm) was recorded which is not inconsistent with reported declines in soil biodiversity However repeat sampling is required to ensure this is not linked to different seasonal conditions in the two sampling years Further analysis through focussed study may be needed to assess whether the changes in soil chemistry land management annual weather patterns or merely natural population variation can explain observed soil invertebrate community changes
Preliminary results from the soils work were presented in the Countryside Survey UK Results from 2007
report (Carey et al 2008 ab) and the country Reports published for England Scotland and Wales in 2009
(httpwwwcountrysidesurveyorgukreports2007html )
Data for the Countryside Survey in 2007 and earlier years have previously been released via the project web
site (httpwwwcountrysidesurveyorgukdatahtml)
The policy implications of trends observed are outlined in each chapter of the report together with a
discussion of possible causes of the changes observed Ongoing data analysis is focussed on identifying the
links between soil variables measured between soil and vegetation and water quality changes reported in
other Countryside Survey reports and between trends in soil variables and the intended and unintended
change of our environment from man‟s activities such as land use and management air pollution and climate
change A subset of the results from these analyses will be reported in the Countryside Survey Integrated
Assessment Report later in 2010 with the remainder in the scientific peer-review literature
9
Countryside Survey Soils Report from 2007
1 Field sampling and Bulk Density
Summary
A total of 2614 samples were collected from 591 1km squares across GB during the CS field survey
in 2007
Topsoil bulk density measurements were carried out on all individual samples collected in 2007
Values ranged from 002 to 195 g cm-3
and were negatively correlated with soil C concentration
Mineral soils exhibited the highest bulk density values and organic soils the lowest Average
topsoil bulk density across Aggregate Vegetation Class and Broad Habitat classes varied between
02 and 12 g cm-3
and was lowest in bog soils and highest in arable and horticultural soils
A new transfer function between bulk density and C has been defined which significa ntly changes
past estimates of soil carbon densities and stocks (0-15cm) of organic soils previously published
for other surveys
11 Introduction
Countryside Survey (CS) is an integrated survey of the GB countryside and soils have been part of CS since
its inception in 1978 The rationale for their inclusion was originally to provide many of the explanatory
variables which contribute to the understanding of vegetation distribution and change which are the central
core of the survey
The sampling strategy used for CS is based on a rigorous statistical approach as an audit of the entire GB
countryside combining monitoring of habitat vegetation soils and waters would be prohibitively expensive
and impractical to run CS uses a sample based approach to collect information at the level of detail required
for national reporting whilst providing the benefits of integrated monitoring It is important to remember that
the results of CS are therefore calculated estimates and not absolute numbers derived from a complete
coverage of the country
Great Britain was stratified first into Land Classes based on the major environmental gradients across the
countryside This permitted the sample to be structured to give reliable national statistics and also ensured
that the sample is representative of the range of different environments found in Great Britain (England
Scotland and Wales) The sample consists of a set of bdquosample squares‟ measuring 1km x 1km selected
randomly from the Ordnance Survey grid within the various Land Classes Altogether 591 sample squares
were surveyed in 2007 289 were in England 107 in Wales and 195 in Scotland Sufficient sample squares
were selected from each geographical region to enable reliable statistical reporting for Great Br itain as a
whole and for each separate country (Table 11) As far as possible the same squares are resampled each
time CS is repeated but in addition each successive CS has included greater numbers of sample squares
The estimates of change presented in this report use a statistical modelling technique to infer missing values
so that changes between each year of the survey can be made using the maximum data available - see the
CS Statistical report (Scott 2008) For full information about CS and methodology employed in square and
plot selection and the field survey see the main GB report (Carey et al 2008 available at
httpwwwcountrysidesurveyorgukreports2007html)
10
Countryside Survey Soils Report from 2007
1 Field sampling and Bulk Density
Table 11 Number of squares surveyed in each survey year which included soil sampling in each
country of GB
Country 1978 1998 2007
England 126 302 289
Scotland 108 203 195
Wales 22 64 107
Total 256 569 591
The soil variables were selected for inclusion in the 2007 survey according to a range of criteria including
relevance to policy needs scientific questions uniqueness of CS soils data both in isolation and when
combined with other CS variables value for money and links and compatibility with other soil monitoring
programmes It should be noted that with the exception of soil invertebrates many CS soil variables are
currently included in the list of recommended primary indicators of soil quality by the UK Soil Indicator
Consortium namely soil organic matter (LOI) and soil organic carbon bulk density soil acidity (pH) total-N
(N) an indicator of phosphorus availabilty (Olsen-P) an indicator of nitrogen availability (mineralisable-N)
total copper zinc cadmium and nickel All variables with the exception of soil invertebrates are measured in
the top 15cm of the soil profile only Soil invertebrates are recorded for the top 8cm of soil This focus on the
top 15cm of soil mirrors the focus of several other soil monitoring programmes (eg NSI) as it is thought the
top soil horizons are thought to be the most susceptible to change over time as they are more immediately
affected by land management activities and environmental change Ideally future soil monitoring should
include lower soil horizons as they are important for storage of carbon supply of nutrients filter ing and
storage of contaminants and as a habitat for soil biota This is particularly important for carbon storage in
peat soils where significant carbon in stored below 15cm
12 Soil sampling and preparation for analysis
As part of the 1978 survey soil samples from the top approximately 0-15cm were collected from a soil pit in
the centre of each of the five Main bdquoX‟ Plots (200m2) randomly located in each of the 256 1km x 1km squares
Maps were drawn to help future relocation In 1990 permanent metal markers were placed immediately
adjacent to the south corner of all plots as mapped in 1978 (or according to an alternative detailed protocol if
within-field placement was inappropriate) during a CS survey which did not involve soil sampling Samples
were taken 15cm to the north of the inner 2m x 2m plot in the centre of the Main Plots in 1998 and to the
south in 2007 In 1998 and 2007 maps and markers were requested from the surveyors for all new or
changed locations Samples from 1998 and 2007 were therefore resampled 2-3m apart between each survey
This compares to 20-50m for the National Soil Inventory In total the 1978 survey collected 1197 soil
samples for analysis During 1998 surveyors collected soil samples from all plots used for soil sampli ng in
the original 1978 squares and 1098 samples were returned for analysis (Note a total of 569 squares were
visited across GB in 1998 but soil sampling was only included in the original 256 squares) In 2007 591 1 km
squares were sampled with a total of ca 11000 samples returned for analysis (591 squares x 5 Main Plots x
4 core types (Table 12) of which 2614 (591 squares x 5 Main plots ndash missing cores) were used for bulk
density analyses Some samples could not be taken for practical reasons or were not suitable for analysis
11
Countryside Survey Soils Report from 2007
1 Field sampling and Bulk Density
Table 12 Description of CS soil cores
Core No Colour and length Core measurements Comments
1 Black 15cm pH LOI Bulk density
N Olsen P metals
Insufficient sample for all analyses if soil
was peaty Core 4 was used in that
situation
2 White 8cm Invertebrate diversity
3 White 15cm Microbial diversity
Persistent organic
pollutants (POPs)
Frozen on arrival Microbial diversity
analyses are part of a NERC funded
project and are not reported as part of CS
POP analysis was not funded but sampled
preserved in case funding becomes
available
4 White 15cm Mineralisable-N Samples also used for metals and Olsen P
if insufficient sample in Core 1
The soil (0-15cm) samples enable changes in several key topsoil characteristics to be studied including pH
soil carbon and nitrogen concentrations and content a measure of available phosphorus heavy metal
concentrations and soil biota In addition measurements of potentially mineralisable nitrogen and bulk
density were made for the first time Three soil samples only were collected from each Main Plot from the top
15cm of the soil profile and a fourth for the invertebrate sample from the top 8cm only In 1998 and 2007 this
was carried out using a plastic corer hammered into the soil and then pulled out with the sample intact The
plastic was grey or black ABS (acrylonitrile butadiene styrene) water pipe In 1978 a soil pit was dug and soil
was collected from the top 15 cm of the profile in the side of the pit In all t hree years loose vegetation and
fresh litter were cleared from the soil surface before the sample was taken Samples were stored in cold
boxes and posted back to the laboratory for analysis On arrival at the laboratory all soil cores were logged
in the core extruded from the plastic tube a digital photograph taken and basic core dimensions taken
before processing began For full information on methodology and Standard Operating Procedures for all
variables see the CS Soils Manual (Emmett et al 2008 available at
httpwwwcountrysidesurveyorguktech_reportshtml)
13 Bulk density
Soil bulk density (BD) is the single most useful parameter of soil physical structure It is a direct measure of
soil compaction (or loosening) and is essential to assess total available pore space within a soil (that is total
porosity) Soil pore space occupies roughly half of the soils volume and is essential for the sustainable use
of soils since the pores hold air water and soil biodiversity Bulk density is an excellent measure of a most
important contemporary form of soil degradation that which occurs due to ill -timed cultivation compaction by
vehicles and stocking and also affects soil biodiversity since increased BD means reduced macropore
volume which is associated with decreases in microbial biomass and activity The rationale for measurement
is outlined in Table 13
The BD of a soil is also essential in the estimation of soil carbon (C) densities where it is necessary to
convert from soil organic carbon (SOC) to SOC per unit volume (eg g cm-3
) Soil carbon stocks (0-15cm)
can then be calculated by combining carbon densities with area of Broad Habitat Changes to soil C density
and stocks represent a major component of UK greenhouse gas emissions and under the Kyoto Protocol the
UK is required to make estimates of net carbon emissions to the atmosphere Changes in soil C stock will
12
Countryside Survey Soils Report from 2007
1 Field sampling and Bulk Density
need to be included in inventories and reporting if these estimates are to be meaningful To date our
knowledge of soil C stocks and changes is limited recent work by National Soil Resources Institute (Bellamy
et al 2005) indicates that large changes have occurred recently but these changes can only be related to
broad habitat types Determinations of soil BD in CS in 2007 will allow the calculation of topsoil C stocks and
change from 1998 whilst relating these observed changes to potential pressures and drivers such as land
use change climate change and atmospheric deposition
We assessed the different methods of extracting soil from the ground for BD determination including coring
and digging a soil pit Five different cores were tested 10 cm long x 5 cm diameter round core 15 cm x 64
cm round core 10 cm long x 5 cm square metal core 10 cm long x 8 cm s quare metal core 8 cm long x 4 cm
diameter round core The soil pit method involved digging a pit then filling the resulting hole with a plastic
bag and using water to measure the volume
Five field sites were visited to allow the comparison of 5 dif ferent soil types Soils tested were clayey soil
sandy soil peaty soil stony soil and a woodland loam Three replicates per extraction method (both coring
and pit extraction) per soil type were taken (excepting sand and clayey sand as it was deci ded that the
soils were uniform enough for just one sample to be taken) In the laboratory samples were weighed
separated out onto a tray and dried at 105degC Once dry the soils were sieved and stones and soil separated
All components were weighed and the BD calculated excluding stones and other debris
Table 13 Bulk density rationale for measurement
Facts Comments
History in CS
None
Links and compatibility to other monitoring programmes
National Soil Inventory - England amp Wales (NSI EampW) Bulk density estimated from original survey measurements National Soil Inventory (NSI Scotland) - Scotland Some bulk density values available Environmental Change Network Sample soils at 12 terrestrial sites every 5- and 20- years Bulk density measured every 20 years to depth of 120cm or bedrock
Obvious links to NSI EampW and NSI Scotland particularly in the 2007 Scottish resurvey which will happen at the same time as CS in 2007 However BD estimation methods differ and will need to be compared with caution Only one 20-year sampling has been made ndash next due in 2013 High intensity measurements on limited number of sites will complement CS data
Uniqueness of CS
No national dataset to estimate bulk density on every soil sample measured for C
Value for money (Policy priority or interpretative value X cost)
High High policy and interpretative value low cost Cheap reliable way of assessing soil physical structure Pedotransfer functions highly relevant for other survey and monitoring programmes
13
Countryside Survey Soils Report from 2007
1 Field sampling and Bulk Density
Overall the different core types tested gave fairly consistent BD values across soil types and no one core
type gave consistently higherlower BD values (Emmett et al 2008) The values of BD estimated from cores
and pits were similar and were within the ranges of typical values expected for each of the soil types
However any methods used for sampling in CS must take into account the time available in the field the
capacity of the field team to carry equipment and the logistics of t he survey The recommendations for BD
measurements in CS were as follows
The pit extraction method is not feasible due to the amount of heavy equipment needed and the
complexity of the task
Although the metal square cores tended to hammer in more easily they tended to distort easily in
difficult soils making their use limited In bdquosticky‟ soils some of the sample was left in the corners
of the core They are also heavier to transport by post
Taking the above into account the coring method is the only method which can be realistically
carried out in a consistent manner on such a large scale
The black 15 cm cores used in the 1998 are acceptable to use for measuring bulk density in the
majority of soils on the condition that surveyorslab personnel follow careful instructions
provided in the CS Field Handbook
Thus in 2007 CS soils were sampled using the 15 cm long x 5 cm diameter core hammered into the ground
and removed using pliers as in the 1998 soil survey
Bulk density was estimated for each soil sample by making detailed weight measurements throughout the soil
processing procedure Briefly the exact dimensions of the sampled soil core were recorded before the soil
was extruded from the plastic tube and the soil was then weighed homo genised reweighed before drying at
room temperature for up to two weeks At the end of this period the soil was again weighed and then sieved
to 2 mm and the weight and volume of the debris remaining (largely composed of stones and plant material
and called unsieved debris) recorded A sub-sample of 10 g of soil was then accurately weighed and dried
overnight at 105 degC before LOI determination The moisture loss at each stage of the process was used to
estimate the initial moisture content of the soil and from that the initial dry weight of the soil Bulk density
was then estimated using the equation
Data were analysed using the standard mixed model analysis appropriate to CS measurements The
statistical approach used for analys is for change involved bootstrapping which allows for non-normality in the
data without the necessity of knowing details of actual distribution As such it provides a more accurate
measurement of significance Annex F of Emmett et al (2008) provides a background document describing
this approach
14 Results
Results are presented for three major categories Broad Habitats Aggregate Vegetation Class and Loss on
Ignition Category
Broad Habitat - The Broad Habitat classification consists of 27 habitats which account for the entire
land surface of Great Britain and the surrounding sea Countryside Survey reports on 10 major
terrestrial habitats
Aggregate Vegetation Class (AVC) ndash is a high level grouping of vegetation types produced from a
quantitative hierarchical classification of the different plant species found in the original Countryside
Survey sample plots
( debris) unsieved of volume - collected core of volume
debris) unsieved of weight- soil of t(dry weigh )cm (gdensity Bulk 3-
14
Countryside Survey Soils Report from 2007
1 Field sampling and Bulk Density
Loss on ignition (LOI) category ndash soil type based on soil organic matter content defined as mineral (0-
8 LOI 0-44 g C kg-1
) humus-mineral (8 ndash 30 LOI 44-165 g C kg-1
) organo-mineral (30 ndash 60
LOI 165-330 g C kg-1
) and organic (60 ndash 100 gt 330 g C kg-1
)
Topsoil bulk density in individual samples in 2007 ranged from 002 to 195 g cm-3
and was negatively
correlated with soil C concentration with mineral soils exhibiting the highest bulk density values and organic
soils the lowest Average topsoil bulk density across AVC and BH classes varied between 0 2 and 12 g cm-3
and was lowest in bog soils and highest in arable and horticultural soils (Table 14) However within each
AVC or BH large ranges of BD values were observed
There was a strong relationship between C concentration and soil BD in the 20 07 data (Fig 11) which is
significantly different to the commonly used pedotransfer function from Howard et al (1995) and used by
Bellamy et al (2005) This relationship can be applied to the 1978 and 1998 LOI data to estimate BD in those
years This is required if estimates of soil density of C or other element are required between surveys To
limit the accumulation of errors through applying successive empirical transformations to the data the 2007
relationship between C concentration and density (calculated directly from the 2007 data) was used to
estimate C density from concentration in 1978 and 1998 in Section 23 and 24 Since the relationship
between C concentration and bulk density is non-linear average C densities cannot be calculated directly
from average concentration and bulk density values ie multiplying the values in C in Section 2 Tables
24 26 28 210 will not produce the C density estimates in Tables 25 27 29 211 and 212
CS estimates of topsoil C density assume that the relationship between C concentration and BD in 2007 is
the same in 1978 and 1998 Since there are no studies of changes in BD over time across the entire range of
C concentrations this assumption remains untested A range of factors such as land -use specific effects and
soil moisture variation are likely to contribute to the large variation in BD at any given C concentration ( Fig
11) but given the large sample size and representative nature of CS data it is unlikely that the overall C
concentration-BD relationship will change significantly over time
15
Countryside Survey Soils Report from 2007
1 Field sampling and Bulk Density
Table 14 Bulk density (g cm-3) in different Broad Habitat Classes Aggregate Vegetation Classes and Loss on ignition () categories
a) Great Britain - Broad Habitat
Broad Habitat 2007
Broadleaved Mixed and Yew Woodland 078
Coniferous Woodland 052
Arable and Horticulture 123
Improved Grassland 097
Neutral Grassland 090
Acid Grassland 043
Bracken 043
Dwarf Shrub Heath 035
Fen Marsh and Swamp 045
Bog 017
All habitat types 078
b) AVC - whole dataset
Aggregate Vegetation Class 2007
Upland Woodland 053
Lowland Woodland 082
Fertile Grassland 103
Infertile Grassland 088
Moorland Grass Mosaics 041
Heath and Bog 021
Tall Grass and Herb 105
Crops and Weeds 125
c) Loss on ignition category
LOI category () 2007
Mineral (0-8) 117
Humus-mineral (8-30) 077
Organo-mineral (30-60) 036
Organic (60-100) 014
16
Countryside Survey Soils Report from 2007
1 Field sampling and Bulk Density
Figure 11 Relationship between topsoil C concentration and bulk density in CS in 2007 Circles are estimates
from Countryside Survey samples in 2007 the solid line is the regression line of the data (y = 129e-00206x
+
251e-00003x
-2057) the dashed line is the estimate of bulk density derived from a commonly-used pedotransfer
function (y = 13 - 0275ln(x10) Howard et al1995 as used in Bellamy et al 2005)
15 Discussion and Policy Implications
To our knowledge our measurements of topsoil BD represent the most comprehensive dataset available for
GB to date Figure 11 compares our BD results with that of the pedotransfer function first used by Howard
et al (1995) and subsequently by Bellamy et al (2005) For C concentrations greater than 68 g C kg-1
the
Howard et al 1995 equation overestimates BD especially at high C concentrations Using the Howard et
al 1995 equation soils containing gt400 g C kg-1
are constrained to possess a BD of 022-028 g cm-3
but
CS results show that 92 of soils containing gt400 g C kg-1
exhibit BD lt02 g cm-3
and 51 have a BD lt01
g cm-3
Very low BD for highly organic topsoils has been reported by other authors (eg Givelet et al 2004
van der Linden et al (2008) The differences in the two BD equations have implications for the estimates of
topsoil C stock and change given by Bellamy et al 2005 Our estimate of 949 Tg for the total topsoil C stock
of England and Wales in 1978 is substantially larger than the 864 Tg estimated by Bellamy et al (2005)
however this is partly due to different conversion factors used assuming that C is 50 of LOI (as Bellamy et
al 2005) rather than 55 (the value used here) CS data yields an estimate of 863 Tg C for England and
Wales in 1978 However the different BD equations produce estimates of C stock at specific C
concentrations that vary considerably Bellamy et al (2005) estimated that soils in England and Wales which
contained gt300 g C kg-1
in 1978 had a total topsoil (0-15 cm) C stock of 122 Tg Using the more realistic CS
equation to estimate topsoil C stock for these soils reduced this value to ca 73 Tg and on the same basis
would reduce the estimated loss of C from these soils from 21 to ca 12 Tg yr-1
However these revised
17
Countryside Survey Soils Report from 2007
1 Field sampling and Bulk Density
estimates of topsoil C stocks do not explain the substantial differences between our results and those of
Bellamy et al 2005 in terms of change in topsoil C concentration and stock Reasons for this continue to be
explored The importance of the modified transfer function is less important when bulk density is used as an
indicator of soil quality associated with land management practices as change rather than absolute value in
these situations is usually of greater interest
16 References
Bellamy PH Loveland PJ Bradley RI Lark RM and Kirk GJD 2005 Carbon losses from all soils
across England and Wales 1978-2003 Nature 437 245-248
Carey PD Wallis S Chamberlain PM Cooper A Emmett BA Maskell LC McCann T Murphy J
Norton LR Reynolds B Scott WA Simpson IC Smart SM Ullyett JM 2008 Countryside Survey
UK Results from 2007 NERCCentre for Ecology amp Hydrology 105pp (CEH Project Number C03259)
Emmett BA Frogbrook ZLChamberlain PM Griffiths R Pickup R Poskitt J Reynolds B Rowe
E Rowland P Spurgeon D Wilson J Wood CM 2008 Countryside Survey Soils Manual Countryside
Survey Technical Report No0407
Givelet N Le Roux G Cheburkin A Chen B Frank J Goodsite M E Kempter H Krachler M
Noernberg T Rausch N Rheinberger S Roos-Barraclough F Sapkota A Scholz C and Shotyk W
2004 Suggested protocol for collecting handling and preparing peat cores and peat samples for physical
chemical mineralogical and isotopic analyses J Environ Monit 6 481-492 2004
Howard PJA Loveland PJ Bradley RI Dry FT Howard DM Howard DC 1995 The carbon
content of soil and its geographic distribution in Great Britain Soil Use and Management 11 9-15
Scott WA 2008 Countryside Survey Statistical Report Countryside Survey Technical Report No407
NERCCentre for Ecology amp Hydrology and Pond Conservation 15pp (CEH Project Number C03259)
van der Linden M Barke J Vickery E Charman D J and van Geel B2008 Late Holocene human
impact and climate change recorded in a North Swedish peat deposit Palaeogeography Palaeoclimatology
Palaeoecology 258 1-27
18
Countryside Survey Soils Report from 2007
2 Carbon
Summary
Carbon concentration in the soil (0-15 cm) increased in Great Britain between 1978 and 1998 and
decreased between 1998 and 2007 Overall there was no change in carbon concentration in the soil
(0-15 cm) in Great Britain between 1978 and 2007 and cannot confirm the loss reported by the
National Soil Inventory
The one consistent exception is loss of carbon (0-15cm) from the intensively managed Arable and
Horticulture Broad Habitat Crops and Weeds Aggregate Vegetation Class This suggests that
current policies in place to limit soil degradation are not maintaining soil quality in cropped land
The mean soil (0-15cm) carbon density across Great Britain in 2007 was calculated to be 69 tha
ranging between a mean of 47 tha in the Arable Broad Habitat to a mean of 91 tha in Acid
Grassland Peat soils do not contain the highest density in topsoil due to low bulk densities A new
transfer function between bulk density and C has been defined which significantly changes past
estimates of soil carbon densities stocks and change (0-15cm) of organic soils previously
published for other surveys
Area estimates for each Broad Habitat were used to convert soil carbon densities to soil (0 -15cm)
carbon stock for GB and individual countries Soil (0-15cm) values were 1582 TgC for GB and
795TgC 628 TgC and 159 TgC for England Scotland and Wales in 2007 respectively It must be
emphasised this significantly underestimates the total carbon stock in soils due to the large carbon
stores at depth particularly in peat soils This has greatest impact for estimates f or Scotland
However topsoil carbon stocks may be most vulnerable to land management activities and
environmental change
21 Policy Background1
Key question Can we confirm the loss of soil carbon (0-15cm) as reported by Bellamy et al 2005
Measurements Organic matter content by loss-on-ignition of soil (0-15cm) in repeats of all plots sampled in
1978 and 1998 and all additional plots sampled in 2007 Carbon concentration data of soil (0-15cm) in
repeats of all plots sampled in 1998 and repeated in 2007 By combining these data and linking to bulk
density measurements CS in 2007 has delivered
Whole GB and country-level assessment of status and change of soil (0-15cm) carbon
concentration density and stock between 1978 1998 and 2007
19
Countryside Survey Soils Report from 2007
2 Carbon
Soil organic C (SOC) is one of the headline indictors of soil quality and there is a wide acceptance that
carbon is fundamental to soil functioning as it is the primary energy source in soils and has a critical role in
maintaining soil structural condition and resil ience and water retention All soils therefore need to retain
carbon However soil C changes are measured against large background stocks and high spatial
heterogeneity and more information is needed to be able to manage this resource better Specific policy
requirements which require improved information on the status and change of soil carbon content include UK
and EU legislation soil protection measures that will help to conserve soil carbon The reformed Common
Agriculture Policy requires all farmers in receipt of the single payment to take measures to protect their soil
from erosion organic matter decline and structural damage Changes to soil C content also represent a major
component of UK greenhouse gas emissions and under the Kyoto Protocol the UK is required to make
estimates of net carbon emissions to the atmosphere However knowledge of soil C stocks and changes is
limited recent work by the NSRI (Bellamy et al 2005) indicates that large changes have occurred recently
but there has been some debate concerning possible causes (Smith et al 2007) In addition if stocks could
be related to more detailed vegetation and other environmental data this would al low better mitigation
targeting Whereas above ground carbon cycling is well understood there are great uncertainties in climate
impacts on soil carbon cycling CS soil C data will contribute to knowledge of how soil C is changing how
this relates to vegetation change and land use and management and provide evidence of the effectiveness of
soil protection legislation
Soil samples taken for Countryside Survey in 2007 will be the third in a time series of samples from 1978 and
1998 this will be the first national soil time-series in Europe and possibly globally Analyses of topsoil C in
2007 will allow further quantification of topsoil C contents and change across all major UK land uses and
crucially through the link to other CS and spatially relevant information will allow the assignment of
pressures and drivers to the observed changes be they climate change land use and management or
atmospheric deposition This link to drivers of change will be reported in the CS Integrated Assessment
Report and peer-reviewed literature
22 Methods
221 Proof of concept
Loss-on-ignition (LOI) is a simple and inexpensive method for determining soil organic matter and estimating
soil organic carbon concentration (hereafter called soil C concentration) using an appropriate conversion
equation An analysis of the benefits of including the measurement in the 2007 survey is summarised in
Table 21
LOI values were determined for 1197 plots within 256 1km squares in 1978 1098 plots within 256 squares in
1998 and 2614 plots within 591 squares in 2007 The increase in sample number was necessary to provide
adequate statistical power to detect change within all three GB countries Power analysis of the exist ing CS
dataset (1978 amp 1998) was performed to determine the number of squares needed in 2007 to give adequate
reporting power for soils in Wales and greater power for soils in Scotland and England For further
information see Emmett et al (2008) Essentially sampling within CS can determine significant differences in
soil C concentration if these are greater than 8 of previous estimates
In 1978 and 1998 LOI was performed on 10 g soil at 375degC for 16 hours and on 1 g soil at 550degC for 3 hours
respectively In the preparation phase for CS in 2007 it was identified that the 1998 LOI method had resulted
in higher values of LOI across the enti re soil organic matter range relative to the 1978 method and it was
decided that all available 1998 soils would be reanalysed using the 1978 method Additionally it was
decided to use the 1978 LOI method in 2007 as 1) this would yield a consistent dataset across 1978 1998
and 2007 and 2) the use of 10 g soil for LOI is preferable since it is more representative than 1 g
Alongside LOI measurements soil C concentration was determined by elemental analyser analysis in 1998
and again in 2007 This measurement complements the LOI data since it is an actual measurement of C
20
Countryside Survey Soils Report from 2007
2 Carbon
concentration in soil however in soils with high amounts of carbonates the soil C concentration may be
considerably larger than the organic C concentration Soil C concentration cannot replace LOI as a method
of measuring soil C because 1978 samples were only analysed by LOI and not by soil C concentration
A conversion factor of 05 from the literature has been used to convert LOI to soil C concentration for CS
reports to date The completed analysis of the combined analysis of 1998 and 2007 data for LOI has
indicated a different value of 055 which is now being used in all estimates of soil C concentration and
carbon density
To calculate topsoil carbon density on a g cm-3
basis a measurement of C per unit volume is needed
Combining bulk density measurements reported in Chapter 1 for the 2007 samples with LOIsoil C
concentration values result in estimates of topsoil C density on an area basis This in turn can be combined
with Broad Habitat area estimates from the CS surveys leading to the first national survey assessment of
topsoil carbon stock (0-15cm) derived from co-located measured variables
Table 21 LOI soil C concentration density and stock Rationale for measurement
Issue Facts Comments
History in CS Loss-on-ignition Topsoil total C content () Topsoil carbon density (g cm
-3)
Measured in 1978 and 1998 for 256 squares Expanded to 591 squares in 2007 Gives total soil C content measured by elemental analyser in 1998 and 2007 on original plots which can be used to convert all 2007 LOI values A conversion function will be obtained from 2007 bulk density values
Repeat sampling will maintain the time series The increased spatial coverage will support country-level reporting by giving greater statistical power especially for Wales (see below) Data obtained from same analytical run as that of total soil N content This function will allow change in soil carbon density to be determined for all time periods
Links and compatibility to other monitoring programmes
National Soil Inventory- England amp Wales Information from 5500 locations in England amp Wales including C and soil horizon information National Soil Inventory - Scotland Data from 770 locations includes C and soil horizon information A partial repeat survey in Scotland was carried out 2007 ndash 2009 Environmental Change Network Soil monitoring at 12 terrestrial sites every 5 amp 20 years Total organic C and bulk density in both 5 and 20-year determinands Dissolved organic C
Data comparability exercise for Defra (Project SP0515) Analysis of repeat survey results in progress ECN data not available
21
Countryside Survey Soils Report from 2007
2 Carbon
measured in soils every 2 weeks Representative Soil Sampling Scheme (RSSS) Carried out since 1969 - 2003 soil samples taken from stratified random sample of 180 farms Runs on a five-year sampling cycle with a subset of the selected farms sampled each year UK Woodland resurvey Biosoil and Level II plots
RSSS not measured SOC since 1984 Data available for 103 woodlands Data in preparation
Uniqueness of CS LOI and C (0-15cm) Carbon density and stock (0-15cm)
CS soil samples are spatially linked to many other data collected at the same time It is unique in that the results can be linked to pressures and drivers eg vegetation deposition land management CS measures the bulk density of each soil sample which when combined with area enables anb estimate of soil (0-15cm) C stock
Sampling of soil in close proximity to the detailed vegetations characterisations is vital in the investigation of relationships between land usehabitat and soil characteristics Topsoil bulk density (BD) has not been measured within any large-scale soil survey until now The data can be used to determine how stable BD is over time and whether BD measured or estimated are required to assess soil carbon changes
Value for money (Policy priority or interpretative value x cost) LOI and soil C concentration (g kg
-1)
Topsoil C stock
High High
High policy and interpretative value (time series) low cost Expansion to all CS squares future-proofs data for further Surveys High policy and interpretative value low cost
22
Countryside Survey Soils Report from 2007
2 Carbon
222 Laboratory analysis
Samples for LOI were collected using the 15cm long by 5cm diameter black plastic core following the field
protocol described in Chapter 1 and in more detail in Emmett et al (2008) LOI was measured on a 10 g air
dried sub-sample taken after sieving to 2 mm The sub-sample was dried at 105degC for 16 hours to remove
moisture weighed then combusted at 375degC for 16 hours The cooled sample was then weighed and the
loss-on-ignition () calculated Soil C concentration was determined using a total elemental analyser for the
original 256 squares The method used was CEH Lancaster UKAS accredited method SOP3102 Details of
the method are given in Emmett et al (2008)
223 Quality Assurance and Quality Control
The DefraNERC Joint Codes of Practice were followed throughout
Method comparability A selection of 40 soils from 1998 were analysed by LOI using the methodologies
used in the 1978 and 1998 surveys (Table 22) Results gave good agreement over the whole range of LOI
values (Fig 21) but across the whole dataset mean LOI values were significantly lower (-12) using the
1978 method compared to the 1998 method (Table 23) This difference in the results using the 1978 method
was present regardless of whether the soils were heated for 2frac14 or 3 hr (mean decrease -114 and -143
respectively
Table 22 LOI method conditions in 1978 and original 1998 method
Survey Amount of soil (g) Temp (degC) Time (hr)
1978 10 375 16
1998 1 550 Not less than 2
23
Countryside Survey Soils Report from 2007
2 Carbon
Figure 21 Comparison of LOI using 1978 and original 1998 method
y = 1013x - 17343
R2 = 09982
0
20
40
60
80
100
0 20 40 60 80 100
LOI CS2000 method
LO
I 1
97
8 m
eth
od
Table 23 Differences in LOI results as a deviation from 1978 results using 1978 and original 1998 methods
LOI Mean difference
1978-1998 SD SE
lt20 -15 08 02
20-80 -12 32 11
gt80 -06 03 01
The results also show that the observed differences in LOI results are more pronounced at lower organic
matter contents where the 1978 method gave LOI values approx 15 lower than the 1998 method at LOI
values lt 20 compared with 06 lower at LOI values gt80 (Table 23) These lower LOI values
produced by the 1978 method are much more important when the organic matter content is low as a small
change in total organic matter content is a large relative change in organi c matter
These differences were not considered acceptable and all 1998 samples with sufficient sample remaining
were re-analysed using the 1978 method A transformation was devised for the remaining samples using the
relationship derived from those where dual analyses were available All samples in 2007 were analysed using
the 1978 methodology
Analytical QC In each analytical batch of samples for LOI in 2007 one soil was repeated The comparison
between the two replicates indicates clear reproducibility of results (Fig 22)
LOI 1998 method
24
Countryside Survey Soils Report from 2007
2 Carbon
Figure 22 Reproducibility of LOI measurements on repeated samples in 2007
0
20
40
60
80
100
0 20 40 60 80 100
Loss-on-ignition ()
Re
pe
at
los
s-o
n-i
gn
itio
n (
)
Conversion to soil C concentration For the main CS report released in November 2008 the soil loss -on-
ignition (LOI) to soil C concentration (g kg-1
) relationship was considered to be
soil C concentration = 05LOI
This value was derived from the literature and was used because at that time only soil C concentration data
for 1998 were available and it was not known if the new LOI to soil C concentration relationship was stable
and reproducible between years The soil C concentration data for 2007 are now available and have been
compared with that from 1998 Fig 23 demonstrates that to two decimal places the regression relationship
between LOI and soil C concentration was the same in both 1998 and 2007
soil C concentration = 055LOI
25
Countryside Survey Soils Report from 2007
2 Carbon
Figure 23 The relationship between LOI and soil C concentration () for 1998 and 2007 soils
y = 05453x + 04366
R2 = 09853
0
10
20
30
40
50
60
70
0 20 40 60 80 100
LOI
C
1998
2007
It should be noted that whilst these relationships have been shown for 1998 and 2007 we have no
measurements for 1978 It cannot therefore be demonstrated that such a relationship would hold in that year
However there seems no scientific reason to consider that the relationship would not hold in 1978
Since there is now a CS-specific LOI-soil C concentration relationship better estimates of topsoil C
concentration and density will be produced if the CS relationship is used compared to the literature derived
value However the estimates reported in the main CS report will then differ from those in the CS soils
report The difference is simple since the proportion of LOI accounted for by C has increased by 10 (from
05 to 055) all previous estimates of C concentration and density will also increase by 10
224 Reporting
The Broad Habitat (BH) classification has been developed over the last 15 years and currently consists of 27
habitats which account for the entire land surface of Great Britain and the surrounding sea ( Jackson 2000)
The BH areas in CS have a minimum mappable unit size of 400 m2 (Carey et al 2008) Since some Broad
Habitats contain no soil and others are rare and so not encountered frequently in CS only 10 BH are
reported here Additionally due to the lack of mapped habitat information in 1978 all reporting by BH refers
to the 2007 habitat allocation for the parcel in which each vegetation p lot resides except when the plot was
not sampled in 2007 in which case the 1998 BH allocation was used In summary t he BH is a description of
a parcel of land (eg an arable field) whilst the AVC is a description of a plot within a parcel (eg a smal l
patch of lowland woodland at the edge of an arable field) the AVC may not therefore be representative of the
whole parcel and may differ from the BH but is representative of the vegetation above the soil sampling
locations BH areas in 2007 were taken from Carey et al (2008) A soil type category has also been
developed based on soil organic matter content In summary
26
Countryside Survey Soils Report from 2007
2 Carbon
Broad Habitat - The Broad Habitat classification consists of 27 habitats which account for the entire
land surface of Great Britain and the surrounding sea Countryside Survey reports on soils for 10
major terrestrial habitats
Aggregate Vegetation Class (AVC) ndash is a high level grouping of vegetation types produced from a
quantitative hierarchical classification of the different plant species found in the original Countryside
Survey sample plots Loss on ignition (LOI) category ndash soil type based on soil organic matter content defined as mineral (0 -
8 LOI 0-44 g C kg-1
) humus-mineral (8 ndash 30 LOI 44-165 g C kg-1
) organo-mineral (30 ndash 60
LOI 165-330 g C kg-1
) and organic (60 ndash 100 gt 330 g C kg-1
) The soil C concentration values were mapped using kriging to interpolate between the Countryside Survey
sample points Routine checking of data for outliers was conducted and the working data set was transformed
using a normal score procedure to obtain a Gaussian distribution The data were then interpolated on a 1km
UK grid using ordinary kriging and finally the kriged data were back-transformed to produce an interpolated
map of soil C concentration In addition Sequential Gaussian simulation (SGs) was conducted on the data to
obtain the E-type estimate (mean) and the spatial uncertainty for the data (conditional variance) Both the
coefficient of variation CV (standard deviation mean) and the signal to noise ratio SNR (mean standard
deviation) are reported
23 Results
231 Structure of soil (0-15cm) LOI data and conversion to soil C concentration
Recorded LOI values were in the range 10 ndash 985 corresponding to topsoil C concentrations of 55 ndash 5418
g C kg-1
) The maximum C concentration possible in a soil is 550 g kg-1
using the conversion factor 055
The distribution of C concentrations across the observed range is shown in Fig 24 The mix of soils across
GB has a characteristic bi-modal U-shaped distribution pattern with the majority of soils containing lt100 g C
kg-1
Across the three Surveys mineral humus-mineral organo-mineral and organic topsoils accounted for
34-39 35-38 6-7 and 17-21 of all samples respectively
Within CS 58 of samples (2843 samples) come from plots which have been sampled more than once
Therefore 42 of samples come from plots only sampled once primarily due to the many extra sampling
locations in 2007 Some variation in C concentration in repeat plots would be expected due to occasional
failure in relocating the exact plot soil heterogeneity differences in sampling procedures across the Surveys
and real change over t ime However the vast majority of observed differences in repeat plots were small
(Fig 24) 83-91 of differences in repeat plots were lt100 g C kg-1
(lt20 LOI) At the other end of the
scale 1-5 of all differences from repeat plots were gt300 g kg-1
(gt60 LOI) Such large differences are
highly unlikely to be due to real change in soil C concentration and suggest that soils in some locations were
extremely heterogeneous or that surveyors were not always successful in accurately re -locating plots
27
Countryside Survey Soils Report from 2007
2 Carbon
Figure 24 Distribution of Countryside Survey soil C concentration data (0 -15cm) (a) Number of observations for
25 g kg-1
divisions (b) Cumulative frequency
232 Change in soil (0-15cm) C concentration and density across Great Britain
At the highest level of analysis for GB as a whole and for the whole 29 year period between 1978 and 2007
no net significant change in soil C concentration (0-15cm) was observed (Fig 25a amp b) Trends over time
were significant for Scotland and GB only with both showing a significant increase between 1978 and 1998
followed by a significant decline between 1998 and 2007 with no overall change over the whole 29 year
period The 1998 Survey contained a greater frequency of soils with higher LOI values whi ch led to higher
estimates of soil C concentrations that year We can find no systematic bias in our data (eg an
undersampling of a particular habitat soil type or geographical area) which could lead to this distribution and
the potential drivers of this temporal pattern is currently being investigated and will be reported in the
Integrated Assessment Report The overall picture is one of little large -scale change in topsoil C
concentrations in the long term
Mean soil C concentrations for individual countries vary due to the different frequencies of soil type Soil C
concentration increases in the order EnglandltWalesltScotland No significant change by soil carbon category
was observed (Fig 25b) Trends for individual countries are discussed more full y in the individual country
sections
28
Countryside Survey Soils Report from 2007
2 Carbon
Figure 25 Change in soil C concentration (0-15cm) for GB and individual countries (a) over time and (b) net
change between 1978 and 2007 Standard errors are indicated Significant differences ( plt0001 plt0 01
plt005) are shown between the years bracketed
a) b)
Significant changes were observed within and between the different Broad Habitat Aggregate Vegetation
Classes soil carbon categories and between the individual su rvey years (Table 24)
Amongst BHs which represent the larger habitat unit within which each soil sampling location resides topsoil
C concentrations in 1978 and 2007 were significantly different in Arable and Horticulture Bracken and
Broadleaf Woodland soils (Table 24a) Note that the BH is based on 2007 recording (and occasionally on
the 1998 data) since the BH classification did not exist in 1978 There were very low numbers of soil
samples in the Bracken BH in 1978 and 1998 ndash 10 and 12 respectively ndash so estimates for these years are
likely to be inaccurate The 2007 estimate which is based on 53 samples is more likely to represent a
reasonable value of the C concentration in the Bracken BH and the significant change is likely an effect of
better representation in 2007
The pattern of higher C concentrations in 1998 compared with the other Survey years also occurred within
many Aggregate Vegetation Classes although changes were not always significant ( Table 24b Fig 26)
Within AVCs the only significant differences in topsoil C concentration over the whole 29 year period were a
decrease in arable soils (AVC Crops and Weeds) and an increase in all woodlands (the combined Lowland
and Upland Woodland AVCs) (Fig 27a) In 1978 1998 and 2007 CS sampled 23 29 and 81 lowland
woodlands respectively and 76 71 and 198 Upland Woodlands Coverage of these AVCs was low in both
1978 and 1998 due to the smaller number of samples taken in these years and the infrequent occurrence of
woodlands in the GB countryside Larger areas of woodlands and greater numbers of soil samples collected
have contributed to greater numbers of woodland soil samples in 2007 Our report of topsoil C concentration
change in woodlands should therefore be seen in the context of low sample numbers in 1978 and 1998 and
represents our best estimates based on available CS data
To remove the effects of large-scale vegetationland use change we also estimated topsoil C concentrations
in plots which were sampled in all three Surveys and in which the AVC did not change over time ( Table
24c) Since the AVC of the plots is only known for the Survey years we cannot rule out changes in the
intervening years eg rotation between arable and grassland systems Therefore plo ts where the AVC has
-8
-6
-4
-2
0
2
4
6
8
10
12
GB England Scotland Wales
Ch
an
ge
in
ca
rbo
n c
on
ce
ntr
ati
on
(g
Ck
g)
0
50
100
150
200
250
300
1975 1980 1985 1990 1995 2000 2005 2010
Me
an
ca
rbo
n c
on
ce
ntr
ati
on
(g
Ck
g)
GB England Scotland Wales
29
Countryside Survey Soils Report from 2007
2 Carbon
not changed are plots in which the vegetation composition has been largely consistent in 1978 1998 and
2007 Only 405 plots had consistent AVCs in the three Surveys and because of this there were insufficient
samples in the Tall Grass and Herb AVC and soils in this category were ignored Additionally the lowland
and Upland Woodland AVCs were grouped into one category all woodlands due to the small number of
samples in each category individually Nevertheless trends in these plo ts were broadly consistent with those
observed for the whole dataset suggesting that shifts in AVC (ie land use change) are unlikely to be a major
factor in determining soil C concentration changes over time
Within soil C group categories there were significant increases in soil C concentration between 1978 and
1998 for mineral and organic soils however subsequent declines in the period 1998 to 2007 led to no
significant changes between 1978 and 2007 (Table 24d Fig 27b)
When soil C concentration (0-15cm) was converted to carbon density using the bulk density transfer function
the significant reduction in Broad Habitat Arable and Horticulture and AVC Crops and Weeds categories was
again apparent (Fig 28 Table 25) This appears the most consistent of all trends identified by CS in 2007
whether expressed as C concentration or density
Figure 26 The change in soil C concentrations (0-15cm) between 1978 1998 and 2007 across AVC
classifications characterised by (a) low ndash medium topsoil C concentrations and (b) high topsoil C
concentrations Significant changes are indicated in Table 24
a) b)
0
50
100
150
200
250
300
350
400
450
1975 1980 1985 1990 1995 2000 2005 2010
Me
an
ca
rbo
n c
on
ce
ntr
ati
on
(g
Ck
g)
Upland Woodland Moorland grass mosaic
Heath and Bog
0
10
20
30
40
50
60
70
80
90
100
1975 1980 1985 1990 1995 2000 2005 2010
Mean
carb
on
co
ncen
trati
on
(g
Ck
g)
Crops and Weeds Tall grass and herbs
Fertile grassland Infertile grassland
Lowland woodland
30
Countryside Survey Soils Report from 2007
2 Carbon
Figure 27 Overall change in soil C concentrations (0-15cm) between 1978 and 2007 (a) across AVC categories
and (b) LOI categories Standard errors are indicated Significant differences ( plt0001) are shown
a) b)
Figure 28 Overall change in soil C density (0-15cm) between 1978 and 2007 (a) across AVC categories and (b)
LOI categories Standard errors are indicated Significant differences ( plt005) are shown
a) b)
-6
-4
-2
0
2
4
6
8
Mineral Humus-mineral Organo-mineral Organic
Ch
an
ge
in
ca
rbo
n d
en
sit
y (
gC
cm
3)
-50
-40
-30
-20
-10
0
10
20
30
40
Mineral Humus-mineral Organo-mineral Organic
Ch
an
ge
in
ca
rbo
n c
on
ce
ntr
ati
on
(g
Ck
g)
-20
-10
0
10
20
30
40
50
60
Cro
ps amp
wee
ds
Tall g
rass
and
her
b
Fertile
gras
slan
d
Infe
rtile g
rass
land
Lowland
woo
dlan
d
Upl
and
woo
dlan
d
Moo
rland
gra
ss m
osaics
Hea
th a
nd b
ogCh
an
ge
in
ca
rbo
n c
on
ce
ntr
ati
on
(g
Ck
g)
-10
-5
0
5
10
15
Cro
ps amp
wee
ds
Tall g
rass
and
her
b
Fertile
gras
slan
d
Infe
rtile g
rass
land
Lowland
woo
dlan
d
Upl
and
woo
dlan
d
Moo
rland
gra
ss m
osaics
Hea
th a
nd b
og
Ch
an
ge
in
ca
rbo
n d
en
sit
y (
gC
cm
3)
31
Countryside Survey Soils Report from 2007
2 Carbon
Table 24 Changes in soil C concentration (0-15cm) in GB for (a) Broad Habitats (b) Aggregate Vegetation Class (AVC) (c) AVCs unchanged since 1978 and (d) LOI categories Arrows denote significant change (plt005 level) in the direction shown Diagonal line indicates too few samples to provide reliable value
a) Great Britain - Broad Habitat
Broad Habitat 1978 1998 2007 1978-1998 1998-2007 1978-2007
Broadleaved Mixed and Yew Woodland 624 1022 887
Coniferous Woodland 2037 2220 1978
Arable and Horticulture 345 335 307
Improved Grassland 564 583 569
Neutral Grassland 671 701 680
Acid Grassland 2351 2567 2285
Bracken 1552 1547 1959
Dwarf Shrub Heath 3053 2987 2849
Fen Marsh and Swamp 2317 2528 2286
Bog 4118 4499 4329
All habitat types 1356 1465 1370
b) AVC - whole dataset
Aggregate Vegetation Class 1978 1998 2007 1978-1998 1998-2007 1978-2007
All Woodlands 1037 1430 1309
Upland Woodland 1282 1780 1598
Lowland Woodland 580 861 655
Fertile Grassland 473 516 483
Infertile Grassland 624 696 661
Moorland Grass Mosaics 2186 2420 2258
Heath and Bog 3710 4127 3898
Tall Grass and Herb 536 463 470
Crops and Weeds 349 332 313
Aggregate Vegetation Class 1978 1998 2007 1978-1998 1998-2007 1978-2007
All Woodlands 800 1394 1465
Upland Woodland
Lowland Woodland
Fertile Grassland 509 555 548
Infertile Grassland 694 731 711
Moorland Grass Mosaics 2646 2941 2649
Heath and Bog 4137 4527 4366
Tall Grass and Herb
Crops and Weeds 289 282 251
d) Loss on ignition category
LOI category () 1978 1998 2007 1978-1998 1998-2007 1978-2007
Mineral (0-8) 298 327 302
Humus-mineral (8-30) 761 787 762
Organo-mineral (30-60) 2521 2682 2322
Organic (60-100) 4466 4824 4679
Mean carbon concentration gkg-1 Direction of significant changes
Mean carbon concentration gkg-1 Direction of significant changes
Mean carbon concentration gkg-1 Direction of significant changes
Mean carbon concentration gkg-1 Direction of significant changes
c) AVC unchanged
32
Countryside Survey Soils Report from 2007
2 Carbon
Table 25 Changes in soil C density (0-15cm) in GB for (a) Broad Habitats (b) Aggregate Vegetation Class (AVC)
(c) AVCs unchanged since 1978 and (d) LOI categories Arrows denote significant change (plt005 level) in the
direction shown Diagonal line indicates too few samples to provide reliable value
a) Great Britain - Broad Habitat
Broad Habitat 1978 1998 2007 1978-1998 1998-2007 1978-2007
Broadleaved Mixed and Yew Woodland 659 769 729
Coniferous Woodland 837 840 814
Arable and Horticulture 530 518 473
Improved Grassland 657 679 672
Neutral Grassland 655 717 686
Acid Grassland 916 889 906
Bracken 743 992 847
Dwarf Shrub Heath 842 839 899
Fen Marsh and Swamp 857 821 828
Bog 834 813 856
All habitat types 687 706 693
Aggregate Vegetation Class 1978 1998 2007 1978-1998 1998-2007 1978-2007
All Woodlands 722 796 796
Upland Woodland 761 835 847
Lowland Woodland 649 707 683
Fertile Grassland 608 659 626
Infertile Grassland 690 736 716
Moorland Grass Mosaics 869 897 898
Heath and Bog 824 835 844
Tall Grass and Herb 596 604 581
Crops and Weeds 509 512 479
Aggregate Vegetation Class 1978 1998 2007 1978-1998 1998-2007 1978-2007
All Woodlands 662 905 784
Upland Woodland
Lowland Woodland
Fertile Grassland 628 690 699
Infertile Grassland 711 738 729
Moorland Grass Mosaics 817 919 807
Heath and Bog 847 846 788
Tall Grass and Herb
Crops and Weeds 515 488 462
d) Loss on ignition category
LOI category () 1978 1998 2007 1978-1998 1998-2007 1978-2007
Mineral (0-8) 506 541 513
Humus-mineral (8-30) 750 777 763
Organo-mineral (30-60) 988 974 997
Organic (60-100) 834 809 849
b) AVC - whole dataset
Mean Carbon Density (tha) Direction of significant changes
Mean Carbon Density (tha) Direction of significant changes
Mean Carbon Density (tha) Direction of significant changes
c) AVC unchanged
Mean Carbon Density (tha) Direction of significant changes
33
Countryside Survey Soils Report from 2007
2 Carbon
233 Change in soil (0-15cm) C concentration and density (0-15cm) for England
Mean soil C concentrations in England (Table 26) are generally lower than those for GB as a whole This is
due to lower frequency of carbon rich soils in England and Wales relati ve to Scotland No significant change
was observed for the country between individual surveys (Fig 25a) or the whole 29 year period (Fig 25b)
There were fewer significant differences observed within individual vegetation and soil categories for tops oils
in England relative to GB and there was an insufficient number of samples to report on some categories
Consistent with changes observed for GB were significant reductions for the Arable and Horticulture Broad
Habitat and Crops and Weed Aggregate Vegetation Class Significant differences ( plt0001) are shown
(Fig 29) Significant increases for GB woodland soils were not reflected in the results for England However
a significant increase was observed for Infertile Grassland in England which was n ot observed for GB When
transformed to carbon density similar trends were observed (Fig 210 Table 27) Significant differences for
the whole 29 year period were only observed for Crops and Weeds and Moorland Grass Mosaic Aggregate
Vegetation Class
Figure 29 Change in soil C concentration (0-15cm) for England between 1978 and 2007 for different AVCs
Standard errors are indicated Significant differences ( plt0001 plt005) are shown
Figure 210 Change in soil C density (0-15cm) for England between 1978 and 2007 for different AVCs Standard
errors are indicated Significant differences ( plt0001 plt005) are shown There was insufficient samples to
report for Tall Grass and Herb Mean change for Upland Wood was lt 01 gcm3
-10
-5
0
5
10
15
20
25
Cro
ps amp
wee
ds
Tall g
rass
amp her
b
Fertile
gras
slan
d
Infe
rtile
gra
ssla
nd
Lowla
nd w
ood
Upl
and
woo
d
Moo
rland
gra
ss m
osai
c
Hea
th a
nd b
og
Ch
an
ge
in
ca
rbo
n d
en
sit
y (
gC
cm
3)
-30
-20
-10
0
10
20
30
40
50
60
70
80
Crops amp
weeds
Fertile
grassland
Infertile
grassland
Lowland
wood
Upland
wood
Moorland
grass
mosaic
Heath and
bog
Ch
an
ge in
ca
rbo
n c
on
ce
ntr
ati
on
(g
Ck
g)
34
Countryside Survey Soils Report from 2007
2 Carbon
Table 26 Changes in soil C concentration (0-15cm) in England for (a) Broad Habitats (b) Aggregate Vegetation
Class (AVC) (c) AVCs unchanged since 1978 and (d) LOI categories Arrows denote significant change (plt005
level) in the direction shown Diagonal line indicates too few samples to provide reliable value
a) England - Broad Habitat
Broad Habitat 1978 1998 2007 1978-1998 1998-2007 1978-2007
Broadleaved Mixed and Yew Woodland 546 804 687
Coniferous Woodland 1173 1578 1312
Arable and Horticulture 339 328 300
Improved Grassland 503 542 531
Neutral Grassland 601 693 648
Acid Grassland 1970 2006 2098
Bracken 1150 1273 1535
Dwarf Shrub Heath 2980 2275 2292
Fen Marsh and Swamp 2888 2789 2738
Bog 1978 4313 3985
All habitat types 744 797 756
Aggregate Vegetation Class 1978 1998 2007 1978-1998 1998-2007 1978-2007
Upland Woodland 1050 1625 1313
Lowland Woodland 596 876 691
Fertile Grassland 450 501 446
Infertile Grassland 546 667 630
Moorland Grass Mosaics 1980 1898 2174
Heath and Bog 3022 3544 3390
Tall Grass and Herb 434 433
Crops and Weeds 340 323 307
Aggregate Vegetation Class 1978 1998 2007 1978-1998 1998-2007 1978-2007
Upland Woodland
Lowland Woodland
Fertile Grassland 521 550 557
Infertile Grassland 633 741 723
Moorland Grass Mosaics
Heath and Bog
Tall Grass and Herb
Crops and Weeds 282 275 249
d) Loss on ignition category
LOI category () 1978 1998 2007 1978-1998 1998-2007 1978-2007
Mineral (0-8) 290 318 292
Humus-mineral (8-30) 684 742 705
Organo-mineral (30-60) 3454 2349 2101
Organic (60-100)
b) AVC - whole dataset
Mean carbon concentration gkg-1 Direction of significant changes
Mean carbon concentration gkg-1 Direction of significant changes
Mean carbon concentration gkg-1 Direction of significant changes
c) AVC unchanged
Mean carbon concentration gkg-1 Direction of significant changes
35
Countryside Survey Soils Report from 2007
2 Carbon
Table 27 Changes in soil C density (0-15cm) in England for (a) Broad Habitats (b) Aggregate Vegetation Class
(AVC) (c) AVCs unchanged since 1978 and (d) LOI categories Arrows denote s ignificant change (plt005 level) in
the direction shown Diagonal line indicates too few samples to provide reliable value
a) England - Broad Habitat
Broad Habitat 1978 1998 2007 1978-1998 1998-2007 1978-2007
Broadleaved Mixed and Yew Woodland 578 761 688
Coniferous Woodland 896 760 779
Arable and Horticulture 491 498 469
Improved Grassland 629 685 646
Neutral Grassland 624 656 659
Acid Grassland 766 720 955
Bracken 959 728 941
Dwarf Shrub Heath 771 1018 966
Fen Marsh and Swamp 819 941 967
Bog 1060 1198 852
All habitat types 696 715 702
Aggregate Vegetation Class 1978 1998 2007 1978-1998 1998-2007 1978-2007
Upland Woodland 814 684 814
Lowland Woodland 698 718 681
Fertile Grassland 616 639 609
Infertile Grassland 688 708 693
Moorland Grass Mosaics 777 898 880
Heath and Bog 796 857 912
Tall Grass and Herb 554 613 585
Crops and Weeds 497 501 469
Aggregate Vegetation Class 1978 1998 2007 1978-1998 1998-2007 1978-2007
Upland Woodland
Lowland Woodland
Fertile Grassland 631 690 687
Infertile Grassland 745 760 795
Moorland Grass Mosaics
Heath and Bog
Tall Grass and Herb
Crops and Weeds 498 476 439
d) Loss on ignition category
LOI category () 1978 1998 2007 1978-1998 1998-2007 1978-2007
Mineral (0-8) 504 523 496
Humus-mineral (8-30) 754 783 744
Organo-mineral (30-60) 1172 1011 885
Organic (60-100)
Mean Carbon Density (tha) Direction of significant changes
b) AVC - whole dataset
Mean Carbon Density (tha) Direction of significant changes
Mean Carbon Density (tha) Direction of significant changes
c) AVC unchanged
Mean Carbon Density (tha) Direction of significant changes
36
Countryside Survey Soils Report from 2007
2 Carbon
234 Change in soil (0-15cm) C concentration and density (0-15cm) across Scotland
Mean soil C concentrations in Scotland are generally higher than that for GB as a whole This is due to
higher frequency of carbon rich soils relative to England and Wales A significant increase was observed
between 1978 and 1998 and a significant decline between 1998 and 2007 which was mirrored in the GB
trends (Fig 25a) There was no significant change over the whole 29 year period (Fig 25b)
There were fewer significant differences for individual vegetation and soil categories for topsoils in Scotland
relative to GB and there was insufficient number of samples to report on some categories (Table 28)
Consistent with changes observed for GB were a significant increase for the Broadleaved Mixed and Yew
Woodland Broad Habitat and a significant decline in Crops and Weed Aggregate Vegetation Class (Fig
211) Significant increases for the GB Bracken Broad Habitat was not observed for Scotland Transformation
to carbon density confirmed a significant decline in soil carbon status of the Crops and Weeds Aggregate
Vegetation Class (Fig 212 Table 29)
Figure 211 Change in soil C concentration (0-15cm) for Scotland between 1978 and 2007 for different AVCs
Standard errors are indicated Standard errors are indicated Significant differences ( plt005) are shown
Figure 212 Change in soil C density for Scotland (0-15cm) between 1978 and 2007 for different AVCs Standard
errors are indicated Standard errors are indicated Significant differences ( plt0005) are shown
-20
-10
0
10
20
30
40
50
60
70
Crops amp
weeds
Fertile
grassland
Infertile
grassland
Upland wood Moorland
grass
mosaic
Heath and
bog
Ch
an
ge
in
ca
rbo
n c
on
ce
ntr
ati
on
(g
Ck
g)
-15
-10
-5
0
5
10
Crops amp
weeds
Fertile
grassland
Infertile
grassland
Upland wood Moorland
grass
mosaic
Heath and
bog
Ch
an
ge
in
ca
rbo
n c
on
ce
ntr
ati
on
(g
Ck
g)
37
Countryside Survey Soils Report from 2007
2 Carbon
Table 28 Changes in soil C concentration (0-15cm) in Scotland for (a) Broad Habitats (b) Aggregate Vegetation
Class (AVC) (c) AVCs unchanged since 1978 and (d) LOI categories Arrows denote significant change (plt005
level) in the direction shown Diagonal line indicates too few samples to provide reliable value
a) Scotland - Broad Habitat
Broad Habitat 1978 1998 2007 1978-1998 1998-2007 1978-2007
Broadleaved Mixed and Yew Woodland 889 1719 1451
Coniferous Woodland 2385 2456 2289
Arable and Horticulture 358 356 323
Improved Grassland 646 640 650
Neutral Grassland 911 842 835
Acid Grassland 2628 2919 2479
Bracken 2383 2312 2932
Dwarf Shrub Heath 3189 3310 3138
Fen Marsh and Swamp 2145 2700 2282
Bog 4242 4539 4382
All habitat types 2385 2578 2420
Aggregate Vegetation Class 1978 1998 2007 1978-1998 1998-2007 1978-2007
Upland Woodland 1441 1888 1847
Lowland Woodland
Fertile Grassland 470 525 492
Infertile Grassland 840 895 827
Moorland Grass Mosaics 2236 2541 2293
Heath and Bog 3926 4329 4097
Tall Grass and Herb
Crops and Weeds 369 371 322
Aggregate Vegetation Class 1978 1998 2007 1978-1998 1998-2007 1978-2007
Upland Woodland
Lowland Woodland
Fertile Grassland
Infertile Grassland 779 759 703
Moorland Grass Mosaics 2804 3202 2881
Heath and Bog 4168 4574 4409
Tall Grass and Herb
Crops and Weeds
d) Loss on ignition category
LOI category () 1978 1998 2007 1978-1998 1998-2007 1978-2007
Mineral (0-8) 305 336 314
Humus-mineral (8-30) 877 882 859
Organo-mineral (30-60) 2558 2888 2329
Organic (60-100) 4475 4820 4686
b) AVC - whole dataset
Mean carbon concentration gkg-1 Direction of significant changes
Mean carbon concentration gkg-1 Direction of significant changes
Mean carbon concentration gkg-1 Direction of significant changes
c) AVC unchanged
Mean carbon concentration gkg-1 Direction of significant changes
38
Countryside Survey Soils Report from 2007
2 Carbon
Table 29 Changes in soil C density (0 -15cm) in Scotland for (a) Broad Habitats (b) Aggregate Vegetation Class
(AVC) (c) AVCs unchanged since 1978 and (d) LOI categories Arrows denote significant change (plt005 level) in
the direction shown Diagonal line indicates too few samples to provide reliable value
a) Scotland - Broad Habitat
Broad Habitat 1978 1998 2007 1978-1998 1998-2007 1978-2007
Broadleaved Mixed and Yew Woodland 752 629 776
Coniferous Woodland 874 793 804
Arable and Horticulture 536 526 523
Improved Grassland 688 724 701
Neutral Grassland 728 713 739
Acid Grassland 938 937 884
Bracken 682 944 874
Dwarf Shrub Heath 881 821 900
Fen Marsh and Swamp 930 948 766
Bog 834 883 833
All habitat types 776 780 787
Aggregate Vegetation Class 1978 1998 2007 1978-1998 1998-2007 1978-2007
Upland Woodland 878 799 818
Lowland Woodland 00 00 00
Fertile Grassland 661 697 655
Infertile Grassland 690 779 728
Moorland Grass Mosaics 926 916 904
Heath and Bog 853 836 826
Tall Grass and Herb
Crops and Weeds 563 583 507
Aggregate Vegetation Class 1978 1998 2007 1978-1998 1998-2007 1978-2007
Upland Woodland
Lowland Woodland
Fertile Grassland
Infertile Grassland 682 678 720
Moorland Grass Mosaics 897 903 878
Heath and Bog 852 869 816
Tall Grass and Herb
Crops and Weeds
d) Loss on ignition category
LOI category () 1978 1998 2007 1978-1998 1998-2007 1978-2007
Mineral (0-8) 499 522 520
Humus-mineral (8-30) 778 806 815
Organo-mineral (30-60) 1009 931 899
Organic (60-100) 858 775 853
Mean Carbon Density (tha) Direction of significant changes
b) AVC - whole dataset
Mean Carbon Density (tha) Direction of significant changes
Mean Carbon Density (tha) Direction of significant changes
c) AVC unchanged
Mean Carbon Density (tha) Direction of significant changes
39
Countryside Survey Soils Report from 2007
2 Carbon
235 Change in soil (0-15cm) C concentration and density (0-15cm) across Wales
Mean soil C concentrations (0-15cm) in Wales are intermediate relative to England and Scotland No
significant change between surveys or over the whole 29 year period was observed ( Fig 25 a amp b)
There was only one significant difference observed within individual categories a decrease for the
Coniferous Woodland Broad Habitat (Table 210) There was no significant change with the two Aggregate
Vegetation Classes we are able to report either for soil (0 -15cm) concentration or density (Fig 213 amp 214
Table 210 amp 211) The low number of reporting categories are due to the lower number of sampl es for
Wales relative to England and Scotland which were sampled in 1978 Reporting change over the full 29 year
reporting period is therefore only possible for Fertile and Infertile Grasslands which have the largest number
of sample squares The increase in sample number in 2007 survey will ensure this improves in future surveys
as we now have baseline measurements for 7 Broad Habitat categories
Figure 213 Change in soil C concentration (0-15cm) for Wales between 1978 and 2007 for the AVC categories
with sufficient sample number to allow reporting for the full 29 year reporting period No significant change was
observed
Figure 214 Change in soil C density (0-15cm) for Wales between 1978 and 2007 for the AVC categories with
sufficient sample number to allow reporting for the full 29 year reporting period Standard error bars are
indicated No significant change was observed
-10
-8
-6
-4
-2
0
2
4
6
8
Fertile grassland Infertile grassland
Ch
an
ge
in
ca
rbo
n c
on
ce
ntr
ati
on
(g
Ck
g)
-12
-10
-8
-6
-4
-2
0
2
Fertile grassland Infertile grassland
Ch
an
ge i
n c
arb
on
den
sit
y (
gC
cm
3)
40
Countryside Survey Soils Report from 2007
2 Carbon
Table 210 Changes in soil C concentration (0-15cm) in Wales for (a) Broad Habitats (b) Aggregate Vegetation
Class (AVC) (c) AVCs unchanged since 1978 and (d) LOI categories Arrows denote significant change (plt005
level) in the direction shown Diagonal line indicates too few samples to provide reliable value
a) Wales - Broad Habitat
Broad Habitat 1978 1998 2007 1978-1998 1998-2007 1978-2007
Broadleaved Mixed and Yew Woodland 672 721 870
Coniferous Woodland 1766 2336 1843
Arable and Horticulture 385 349
Improved Grassland 680 663 606
Neutral Grassland 533 574 621
Acid Grassland 1982 2082 2077
Bracken
Dwarf Shrub Heath 2107 2672 2800
Fen Marsh and Swamp
Bog
All habitat types 1076 1089 1086
Aggregate Vegetation Class 1978 1998 2007 1978-1998 1998-2007 1978-2007
Upland Woodland 1424
Lowland Woodland
Fertile Grassland 545 539 568
Infertile Grassland 637 632 612
Moorland Grass Mosaics 2208
Heath and Bog 3338
Tall Grass and Herb
Crops and Weeds
Aggregate Vegetation Class 1978 1998 2007 1978-1998 1998-2007 1978-2007
Upland Woodland
Lowland Woodland
Fertile Grassland
Infertile Grassland
Moorland Grass Mosaics
Heath and Bog
Tall Grass and Herb
Crops and Weeds
d) Loss on ignition category
LOI category () 1978 1998 2007 1978-1998 1998-2007 1978-2007
Mineral (0-8)
Humus-mineral (8-30) 714 688 691
Organo-mineral (30-60)
Organic (60-100)
b) AVC - whole dataset
Mean carbon concentration gkg-1 Direction of significant changes
Mean carbon concentration gkg-1 Direction of significant changes
Mean carbon concentration gkg-1 Direction of significant changes
c) AVC unchanged
Mean carbon concentration gkg-1 Direction of significant changes
41
Countryside Survey Soils Report from 2007
2 Carbon
Table 211 Changes in soil C density (0-15cm) in Wales for (a) Broad Habitats (b) Aggregate Vegetation Class
(AVC) (c) AVCs unchanged since 1978 and (d) LOI categories Arrows denote significant change (plt005 level) in
the direction shown Diagonal line indicates too few samples to provide reliable value
a) Wales - Broad Habitat
Broad Habitat 1978 1998 2007 1978-1998 1998-2007 1978-2007
Broadleaved Mixed and Yew Woodland 772 614 790
Coniferous Woodland 657 940 762
Arable and Horticulture 708 560
Improved Grassland 726 690 681
Neutral Grassland 644 671 694
Acid Grassland 892 928 838
Bracken
Dwarf Shrub Heath 1341 1068 1033
Fen Marsh and Swamp
Bog
All habitat types 765 802 752
Aggregate Vegetation Class 1978 1998 2007 1978-1998 1998-2007 1978-2007
Upland Woodland
Lowland Woodland
Fertile Grassland 731 714 686
Infertile Grassland 718 663 697
Moorland Grass Mosaics
Heath and Bog
Tall Grass and Herb
Crops and Weeds
Aggregate Vegetation Class 1978 1998 2007 1978-1998 1998-2007 1978-2007
Upland Woodland
Lowland Woodland
Fertile Grassland
Infertile Grassland
Moorland Grass Mosaics
Heath and Bog
Tall Grass and Herb
Crops and Weeds
d) Loss on ignition category
LOI category () 1978 1998 2007 1978-1998 1998-2007 1978-2007
Mineral (0-8)
Humus-mineral (8-30) 718 795 800
Organo-mineral (30-60)
Organic (60-100)
Mean Carbon Density (tha) Direction of significant changes
b) AVC - whole dataset
Mean Carbon Density (tha) Direction of significant changes
Mean Carbon Density (tha) Direction of significant changes
c) AVC unchanged
Mean Carbon Density (tha) Direction of significant changes
42
Countryside Survey Soils Report from 2007
2 Carbon
24 Discussion
It is estimated that European soils contain 75-79Pg C (Schils et al 2008) of which UK soils store 6-7 Pg
The top 15 cm of soils in GB (ie the UK without Northern Ireland) store ca 16 Pg C (Table 211) Soils are
the largest terrestrial pool of C There is a need to track and understand trends in soil C and to optimise
future soil C storage through land management and use Although measurements of topsoil organic C are
available in all member EU countries very few countries have repeated sampling campaigns (Saby et al
2008) and to our knowledge Countryside Survey is the first survey in Europe to sample soils three times
The approach to monitoring programs in Europe has been reviewed by Kibblewhite et al (2008) Morvan et
al (2008) and Schils et al (2008) current national monitoring programs are criticised because of lack of soil
BD measurements insufficient sample numbers and lack of repeated explanatory measurements
Countryside Survey particularly the 2007 Survey addresses these particular issues for GB
The mapped distributions of soil C concentrations (as ) in 2007 ( Fig 215a) follows the anticipated pattern
with high concentrations in upland peatland areas such as NW Scotland N England and upland areas of
Wales The coefficient of variation (CV standard deviation mean an indicator of the spread of the data
around the mean value) is lowest in areas dominated by either low carbon soils which are intensively
managed or high carbon soils in upland areas where there is little variation (Fig 215b) Conversely the
signal to noise ratio (SNR mean standard deviation) indicates that for values above 1 the signal is stronger
than the noise High SNR‟s are consistent with managed arable areas acros s Eastern England and the
upland and peat areas across the UK but especially in N Scotland (Fig 215c) This may occur because the
soil management leads to greater uniformity of carbon levels across these areas In areas less intensively
managed natural variation in soil carbon levels across the landscape may lead to the low SNR‟s observed
Figure 215 Maps of soil C concentration (0-15cm) in 2007(a) using ordinary Kriging (C) (b) coefficient of
variation and (c) signal to noise ratio
43
Countryside Survey Soils Report from 2007
2 Carbon
Multiplying soil C density by area of habitats for individual countries results in the estimate of carbon
currently stored in 0-15cm of GB soils (Table 211)
Table 211 Estimate of soil carbon stock (0-15cm) for GB and individual countries
Country km2 Soil C density
(0-15cm)
tha
Soil C stock
(0-15cm)
TgC
se
GB 228226 6931 1582 29
England 127284 6245 795 15
Scotland 79849 7879 628 11
Wales 21091 7519 159 3
The CS estimate for England and Wales (954 Tg) in soils (0 -15cm) compares with an estimate of 864 Tg for
England and Wales estimated by Bellamy et al (2005) One major cause of this difference is the new
conversion factor for LOI to soil C concentration of 055 defined by CS compared to the factor of 05 used by
Bellamy et al (2005) The new pedotransfer function for bulk density measurements to soil C concentration
described in Chapter 1 primarily affects estimates of stock and change for organic soils only and has only
limited effect on total stock estimates (0-15cm) at the national scale
The results from the Countryside Survey of Great Britain reported here suggest that the topsoil C
concentration and stock of GB and its constituent countries has not changed significantly since 1978
Results for topsoil C density are a combination of changes in soil C concentration and estimated bulk density
and we observed no overall change at a GB level in C concentration although there was a significant
increase (+8) between 1978 and 1998 and a decrease ( -65) in 1998 and 2007 Examining C
concentration by other strata (eg country soil C group AVC) produced similar results with consistent
differences between 1978 and 2007 only occurring in arable and woodland systems Particularly significant
in light of Bellamy et al (2005) is the lack of change in topsoil C concentrations in organic soils although this
disagrees with Bellamy et al (2005) it is in agreement with other reports and the outputs of soil C models
There are unfortunately few monitoring studies from W Europe with which to c ompare our topsoil results
some studies only report changes in C concentration some only C density some only to 1m depth Our
results for changes in topsoil C concentrations in arable and grassland systems are comparable with the
ranges reported by various studies on Belgian soils (Goidts and van Wesemael 2007) but are smaller than
those reported by Bellamy et al (2005) for England and Wales For woodland soils CS estimates of change
are larger than those reported from a major UK resurvey of 103 wood lands (Kirby et al 2005) and in the
opposite direction to reports of C changes in woodland soils in Belgium (Stevens and van Wesemael 2008)
and to that of Bellamy et al (2005) for England and Wales Given the small number of woodlands sampled in
CS in 1978 and 1998 a potentially more accurate picture of changes in topsoil C concentration in GB
woodlands was reported by Kirby et al (2005) whose survey specifically examined changes in woodlands
between 1971 and 2000-2003 and found no significant change in topsoil C concentration which remained
around 88 g C kg -1 However CS estimates of changes in woodland topsoil C densities (12-30 g C m
-2 yr
-1)
are similar to model estimates of European forest soils by Liski et al (2002) and Nabuurs et al (2003)
which suggest net sequestration of 19 and 11 g m-2
yr-1
respectively
A range of potential factors responsible for soil C change have been proposed including climate change
nutrient deposition management practices increasing atmospheric CO 2 concentrations and land use and
land use change However at the large scale the attributi on of change is complicated by the presence of
multiple drivers which can simultaneously affect the balance of C inputs (largely plant biomass) and outputs
(mostly microbial respiration) Our results also suggest that land use change (as measured by the AVC) is
not responsible for the few significant observed changes in topsoil C concentration Climate change is
unlikely to be the cause of change in topsoil C since changes in temperature and rainfall across GB since
44
Countryside Survey Soils Report from 2007
2 Carbon
1978 have been insufficient to cause large-scale changes in mineral soil C concentration or density (Smith et
al 2007) Model estimates of climate change-related variation in C density for England Scotland and Wales
are -001 +003 and +001 yr -1 respectively if changes in net primary productivity (NPP) are included
(Smith et al 2007) CS estimates of change are much larger than these -009 to -021 +01 to +013 and
+018 to +039 yr -1 for all arable grassland and forest soils respectively across GB Since land use change
and climate change may be excluded as primary drivers of change and trends differ between habitat types
other habitat-specific drivers must be responsible for the long-term changes observed in arable and woodland
soils The most consistent finding from CS in 2007 is the reduction in soil C (0-15cm) concentration and
density in cropland A reduction in mean total N concentration as well (Chapter 4) suggests processes such
as erosion deep ploughing (which brings soil with lower CN ratio soil to the surface) and or increased
decomposition may be responsible for this trend Intensification of farming practices are often thought to be
the dominant factor (Stoate et al 2001) In Broadleaved Woodland where a significant increase was
observed changes in tree age structure and reduced harvesting are likely to be the main drivers of soil C
concentration increases (Liski et al 2002 De Vries et al 2006) Efforts to attribute the observed soil (0-
15cm) C changes in CS are ongoing and will be reported in the CS Integr ated Assessment Report
25 Policy Implications
The results from CS in 2007 do not confirm the widespread loss of soil carbon (0-15cm) as reported by
Bellamy et al (2005) for soils (0-15cm) as part of the National Soils Inventory monitoring programme in
England and Wales between 1978 and 2003 The one consistent exception is loss of carbon (0-15cm) from
the intensively managed Arable and Horticulture Broad Habitat Crops and Weeds Aggregate Vegetation
Class soils This suggests that current policies in place to limit soil degradation are not maintaining soil
quality in cropped land
The stability in soil carbon measurements in other land use types could be a combination of a complex mix of
factors some of which may increase soil (0-15cm) C concentration eg increased carbon inputs from plants
due to nitrogen deposition and increased carbon dioxide in the atmosphere whilst some may reduce soil C
concentration eg intensive land management Only by further analysis of the spatial patterns within the CS
datasets in combination with experimental and survey data from other studies and modelling approaches will
it be possible to advise on the likely future trends of soil carbon and indeed help to explain the general trend
of an increase between 1978 and decrease from 1998 to 2007 It should also be remembered these are
results for soil 0-15cm only and not the whole soil profile It does not include soil lost by erosion although a
reduction in soil C concentration would be expected if the latter was widespread as soil decreases in soil C
concentration down the soil profile
A major change for CS in 2007 was the introduction of data which enables calculation of carbon stock (0 -
15cm) This takes into account not only the soil C concentration of soil in the top 15cm but also the amount of
soil The amount of soil may change due to changes in the compaction of the soil for example due to the use
of heavy machinery or increased animal numbers The increased information this provides has resulted in
greater confidence in the reduction in soil carbon for intensively managed arable and crop soils as this trend
is observed in both soil C concentration and C density results and is the most consistent result within
individual categories By combining C density data wi th areas of Broad Habitats a national estimate of the
topsoil (0-15cm) carbon stock from co-located bulk density and soil C concentration measurements is now
available for the first time
The data provide an evidence base for monitoring the protection o f soil carbon stores highlighted as a priority
within the new Soils Strategy for England the Environment Strategy in Wales and Scottish Soil Framework
The new data have now been selected as an indicator of soil quality for State of the Environment Repor ting
45
Countryside Survey Soils Report from 2007
2 Carbon
26 References
Bellamy PH Loveland PJ Bradley RI Lark RM Kirk GJD 2005 Carbon losses from all soils
across England and Wales 1978-2003 Nature 437 245-248
Carey PD Wallis S Chamberlain PM Cooper A Emmett BA Maskell LC McCann T Murphy J
Norton LR Reynolds B Scott WA Simpson IC Smart SM Ullyett JM 2008 Countryside Survey
UK Results from 2007 NERCCentre for Ecology amp Hydrology 105pp (CEH Project Number C03259)
De Vries W Reinds GJ Gundersen P Sterba H 2006 The impact of nitrogen deposition on carbon
sequestration in European forests and forest soils Global Change Biology 12 1151-1173
Emmett BA Frogbrook ZL Chamberlain PM Griffiths R Pickup R Poskitt J Reynolds B Rowe
E Spurgeon D Rowland P Wilson J and Wood CM 2008 CS Technical Report No 307 Soils
Manual NERCCentre for Ecology amp Hydrology 180 pp (CEH Project Number C03259)
Goidts E van Wesemael B 2007 Regional assessment of soil organic carbon changes under agriculture in
Southern Belgium (1955-2005) Geoderma 141 341-354
Jackson DL 2000 Guidance on the interpretation of the Biodiversity Broad Habitat Classification (terrestrial
and freshwater types) Definitions and the relationship with other classifications JNCC Peterborough UK
Kibblewhite MG Jones RJA Baritz R Huber S Arrouays D Micheli E Stephens M 2008
ENVASSO Final Report Part I Scientific and Technical Activ ities ENVASSO Project (Contract 022713)
coordinated by Cranfield University UK for Scientific Support to Policy European Commission 6th
Framework Research Programme
Kirby KJ Smart SM Black HIJ Bunce RGH Corney PM Smithers RJ 2005 Long term
ecological change in British woodlands (1971-2001) English Nature Peterborough UK
Liski J Perruchoud D Karjalainen T 2002 Increasing carbon stocks in the forest soils of western Europe
Forest Ecology and Management 169 159-175
Morvan X Saby NPA Arrouays D Le Bas C Jones RJA Verheijen FGA Bellamy PH
Stephens M Kibblewhite MG 2008 Soil monitoring in Europe A review of existing systems and
requirements for harmonisation Science of the Total Environment 391 1-12
Nabuurs G J Schelhaas M J Mohren G M J and Field C B 2003 Temporal evolution of the
European forest sector carbon sink from 1950 to 1999 Global Change Biol 9 152-160
Saby NPA Bellamy PH Morvan X Arrouays D Jones RJA Verheijen FGA Kibblewhite MG
Verdoodt A Berenyiuveges J Freudenschuss A Simota C 2008 Will European soil-monitoring networks
be able to detect changes in topsoil organic carbon content Global Change Biology 14 2432-2442
Schils R Kuikman P Liski J van Oijen M Smith P Webb J Alm J Somogyi Z van den Akker J
Billett M Emmett BA Evans C Lindner M Palosuo T Bellamy P Jandl R Hiederer R 2008
Review of existing information on the interrelations between soil and climate change European Commission
Brussels
Smith P Chapman SJ Scott WA Black HIJ Wattenbach M Milne R Campbell CD Lilly A
Ostle N Levy PE Lumsdon DG Millard P Towers W Zaehle S amp Smith JU (2007) Climate
change cannot be entirely responsible for soil carbon loss observed in England and Wales 1978 -2003
Global Change Biology 13 2605-2609
46
Countryside Survey Soils Report from 2007
2 Carbon
Stevens Avan Wesemael B 2008 Soil organic carbon dynamics at the regional scale as influenced by
land use history a case study in forest soils from southern Belgium Soil Use and Management 24 69-79
Stoate C Boatman ND Borralho RJ Carvalho CR de Snoo GR Eden P 2001 Ecological impacts
of arable intensification in Europe Journal of Environmental Management 63 337-365
47
Countryside Survey Soils Report from 2007
3 Soil pH
Summary
The mean pH of soils (0-15cm) increased in less acidic soils across Great Britain (GB) between
1998 and 2007 continuing a trend observed between 1978 and 1998 These soils are associated with
Broadleaved Woodland Arable and Horticulture Improved Grassland and Neutral Grassland Broad
Habitats This increase in pH is consistent with the expected b enefit of continued reductions in
sulphur emissions
There was no significant change in mean soil (0-15 cm) pH in more acidic organic-rich soils across
Great Britain between 1998 and 2007 This will affect Broad Habitats such as Bog Dwarf Shrub
Heath and Acid Grassland Data analysis is ongoing to determine if the lower sulphur reductions in
the north and west of the Great Britain or other drivers of change such as nitrogen deposition and
land management are responsible in the organic soils where pH did not significantly increase
between 1998 and 2007 Conversion between land uses between surveys was not responsible as
similar trends were observed in soils with or without conversion
One exception with no apparent trends between any time period was Coniferous Woodland It is
possible the acidification of soils associated with intensive forestry due to base cation uptake and
enhanced capture of acidic pollutants by the tree canopy may be offsetting the effects of reduced
sulphur emissions
The results for individual countries broadly reflected those for Great Britain as a whole with
continued increase in soil pH only observed in less acidic soils Insufficient sample size for some
habitat types with lower area in individual countries prevented significant trends being identified in
some cases
The implications of these findings are that current emission control policies combined with current
policies to protect soil through sustainable land management practices have had some major
benefits but they may not be sufficient to promote continued recovery from acidification i n organic-
rich soils
31 Policy background
Key question Has the recovery from acidification detected by Countryside Survey between 1978 and 1998
continued
Measurements The pH of soils (0-15 cm) from all plots sampled in 1978 and 1998 and all additional plots
sampled in 2007
Soil pH is probably the most commonly measured soil chemical parameter It gives an indication of soil
acidity and therefore has direct policy relevance in a number of areas primarily recovery from acidification
and impacts on biodiversity Soil pH is a key variable for predicting the mobility and bioavailability of metals
in soils and helps determine the response of plant species to changes in atmospheric nitrogen and acid
deposition It is currently estimated that 58 of ter restrial semi-natural habitats across GB receive acidic
deposition in excess of their buffering capacity thus potentially causing long term damage according to the
critical load methodology (RoTAP 2010)
The soil pH data from the Countryside Survey in 1998 provided unique nationwide evidence of soil pH change
(0-15 cm) since the first measurements in 1978 Preliminary data were incorporated within the report of the
National Expert Group on Transboundary Air Pollution (NEGTAP 2001) as providing evidence of a possible
48
Countryside Survey Soils Report from 2007
3 Soil pH
response to the reduction in acid deposition over the twenty year period between the two surveys The MASQ
report (Monitoring and Assessing of Soil Quality Black et al 2000) provided a more complete analysis of the
Countryside Survey soils data and confirmed an increase in soil pH (0-15 cm) between 1978 and 2000 in all
but Coniferous Woodlands Broad Habitat irrespective of whether the data were analysed by Environmental
Zone Broad Habitat ITE Land Class Aggregate Vegetation Class (AVC) or major soil group More
importantly the vegetation survey indicated a change in vegetation structure towards more nitrophilous less
acid tolerant species from 1990 to 1998 (Haines-Young et al 2000) providing corroboration for the soil data
and an excellent example of the power of the Countryside Survey approach in combining co-located
synchronous data collection of a wide range of variables A new review of changes in soil pH is due to be
published later in 2010 Review of Transboundary Air Pollution (RoTAP) and current indications are that
trends identified by CS are mirrored in other surveys (RoTAP 2010)
The rationale for including measurement of soil pH at 0-15 cm depth in the survey in 2007 is summarised in
Table 31 Measurement of soil (0-15 cm) pH will deliver
An extended time series of soil pH from 1978
Increased reporting power for individual countries (especially Wales) by making measurements in all
squares sampled during Countryside Survey in 2007 (591)
An assessment as to whether the decrease in soil acidity across all major soil groups and the majority of
Broad Habitats observed between 1978 and 1998 has continued
Improved prediction of plant species composition change using linked biogeochemical plant species
models
49
Countryside Survey Soils Report from 2007
3 Soil pH
Table 31 Rationale for measurement of soil (0-15 cm) pH
Issue Facts Comments
History in Countryside Survey
Measured on soils collected from Main Plots in the original 256 squares which formed the ldquoITE Ecological Survey of the UKrdquo Countryside Survey in 1998 re-measured pH from the same 256 squares
256 squares essential to maintain time series data 591 squares will provide better spatial information Soil pH is a critical interpretative variable
Country level reporting Power analysis has indicated only 256 squares are needed to quantify pH change at country level based on change between 1978 and 1998
It is unlikely that the pH change between Countryside Survey in 1998 and Countryside Survey in 2007 will be as great or consistent as between 1978 and Countryside Survey in 1998 The time period is shorter and the deposition change has been less Soil pH is a critical parameter for interpretation of plant species change (Ellenberg pH) bioavailability of P N and metals Recommendation is therefore for soil pH (0-15 cm) to be measured in all 591 squares
Links and compatibility to other monitoring programmes
Comparable data to those collected in the National Soil Inventory (NSI) Representative Soil Sampling Scheme (RSSS) for same horizon (0-15cm) Environmental Change Network (ECN) provides more information to depth and more frequent monitoring of soil solution but from few sites
Countryside Survey will provide data for three time points There were partial resurveys of the NSI in 19945 19956 and 2003 RSSS have data reported to 2001 Soil pH was measured at many ECN sites in 1993 1998 and 2003 Countryside Survey in 2007 will provide the only update for spatially extensive data on soil pH (0-15 cm) in Great Britain A comparison of these surveys was reported in Defra project SP0515 (Defra 2003)
Uniqueness of Countryside Survey
Time series is unique The integrated approach enabling links to vegetation management and water quality change is unique
Value for money (Policy priority or interpretative value x cost)
Very high High policy and interpretative value low cost
50
Countryside Survey Soils Report from 2007
3 Soil pH
32 Methods
321 Proof of concept
The measurement of soil pH in a suspension of de-ionised water is a very well established technique and was
used in both 1978 and for Countryside Survey in 1998 However measurements of pH in water are subject to
a number of uncertainties some of which are fundamentally related to the effects of changes in the ionic
strength of the soil-water suspension on ions sorbed to the soil particles One of the main consequences of
this is the so called dilution effect whereby different pH values are measured depending on the soilwater
ratio in the suspension A solution of 001M Calcium Chloride (CaCl2) has approximately the same ionic
strength as the soil solution in fertilised temperate soils and has been recommended as a more appropriate
medium for soil pH measurement (Schofield and Taylor 1955) Measurement of pH in CaCl2 yields more
consistent results the pH value in CaCl2 is lower than measured in water but closer to the value observed
under equilibrium conditions using repeated extractions (White 1969) The relationship between soil pH
measured in water and CaCl2 is not consistent For example over a wide pH range in lowland grassland soils
(Fig 31) soil pH in CaCl2 was approximately 08 pH units lower than the corresponding measurements in
deionised water There was also considerable scatter in the relationship particularly for more acid soils
In the 1978 Ecological Survey soil pH in water was measured at ITE Bangor using a modified version of the
method used by the Soil Survey of England and Wales (Avery and Bascomb 1974) In 1998 soil pH was
measured at CEH Merlewood using the protocol described in Allen et al (1989) The latter resulted in a
suspension with a soil to water ratio of approximately 12 by weight compared to the 1978 analyses with a
soil to water ratio of 125 by weight It is unlikely that this small difference in ratio result ed in a significant
difference in pH between the two methods As soil pH in CaCl2 was to be measured in 2007 in addition to pH
in water the original method used in 1978 was chosen Soil pH in CaCl2 can easily be measured using the
1978 method by adding a few millilitres of concentrated CaCl2 solution to the water pH suspension This
saves the time required to re-weigh and mix a second sample and conserves valuable soil for other analyses
The comparability of the 1978 and 1998 methods was checked prior to the survey in 1998 using archive soils
taken in 1971 from woodland habitats across Great Britain (Black et al 2000) The method used in 1971 was
the same as that used in 1978 and the re-analysis on dried archived soils used the 1998 method No
statistically significant differences were found between pH values measured on dried archive soils from 1971
using the 1998 method and the original data obtained from field moist soils in 1971
Figure 31 Soil pH (0-15 cm) measured in deionised water and 001M CaCl2 for a range of lowland
grassland soils (unpublished data CEH Bangor and CCW)
y = 101x - 080
R2 = 0953
3
4
5
6
7
8
9
3 4 5 6 7 8
Soil pH in water
So
il p
H i
n C
aC
l 2
11 line
51
Countryside Survey Soils Report from 2007
3 Soil pH
322 Laboratory analysis
Samples for soil pH measurement were collected using the 15 cm long by 5 cm diameter black plastic core
following the field protocol described in the Soils Manual (Emmett et al 2008)
The pH of fresh soil in water was measured using 10 g of field -moist soil in a 50 ml plastic beaker to which 25
ml of deionised water was added giving a ratio of soil to water of 125 by weight The suspension was stirred
thoroughly and left to stand for 30 minutes after which time the pH electrode was inserted into the
suspension and a reading taken after a further 30 seconds Following the measurement of soil pH in water 2
ml of 0125M CaCl2 were added to the suspension which on dilution with the 25 ml of water resulted in a
solution concentration of approximately 001M CaCl 2 The suspension was stirred thoroughly and left for 10
minutes after which time the pH electrode was inserted into the suspension and a reading taken after a
further 30 seconds Measurements of soil pH in water and CaCl 2 were repeated on all samples using 10 g of
air dried lt 2mm sieved soil
The fresh soil pH measurements were made as soon as possible after the sample was opened Care was
taken to ensure that the temperature of the buffer solutions used to calibrate the pH meter differed by no
more than 1degC from the temperature of the soil suspensions The pH electrode was carefully rinsed and dried
between each measurement Particular care was taken to clean the electrode following calibration with buffer
solutions
323 Quality Assurance and Quality Control
The DefraNERCBBSRC Joint Codes of Practice were followed
Method comparability Soil pH measurements in deionised water were made on a subset of
approximately 200 soils taken from the 1998 soil sample archive to check the comparability of the method
used in 2007 with that used in 1998
Figure 32 Results of repeat soil pH measurements on archived air dried soil samples collected in
1998
A plot of the repeated measurements from 1998 survey (Fig 32) shows close agreement between the two
datasets with no discernible bias and points clustering along the 11 line From these data it was concluded
that the difference between the methods used in 1998 and 2007 1978 would not bias the pH time series
data However it was noted that in 1978 soil pH was reported to 005 pH units whereas in 1998 and 2007
data were reported to 001 pH units
y = 103x - 023
R2 = 0955
2
4
6
8
10
2 4 6 8 10
Dry soil pH in 1998
Re
peat
dry
so
il p
H in
2007
1 1 line
52
Countryside Survey Soils Report from 2007
3 Soil pH
Analytical Quality Control The calibration of the pH meter was checked after a batch of 25 samples
using pH 4 and pH 7 buffer solutions If either of the buffer solution calibration values differed by more than
002 pH units from the expected value the meter was re-calibrated A standard soil a certified reference soil
and a duplicate analysis was performed on every batch of 25 samples (Fig 33) Soil pH in water and CaCl2
was reported to 001 pH units
Figure 33 Results for batch repeats of pH measurements in a) water and b) CaCl 2
324 Reporting
Soil pH data (0-15 cm) have been analysed to provide information on the state of soil acidity in 2007 and the
change in soil acidity since 1978 The statistical approach used for analysing the data for change involved
bootstrapping which allows for non-normality in the data without the necessity of knowing de tails of the actual
distribution As such it provides a more accurate measurement of significance Annex F of Emmett et al
(2008) provides a background document describing this approach
Prior to the 2007 survey a power analysis was undertaken of the sampling requirements to reliably detect
change in soil pH (0-15 cm) at the country level and details of the outcome are included in Emmett et al
(2008) The resulting increase in the number of squares for Countryside Survey in 2007 to 591 has enabled
reporting of soil pH by Broad Habitat at the Great Britain level (Carey et al 2008) and at the level of the
individual countries (Smart et al 2009 for Wales Norton et al 2009 for Scotland Countryside Survey 2009
for England)
The data in this report describe soil acidity in 2007 and change since 1978 by Broad Habitat Aggregate
Vegetation Class and Loss-on-Ignition (LOI) class In summary
Broad Habitat - The Broad Habitat classification consists of 27 habitats which account for the entire
land surface of Great Britain and the surrounding sea Countryside Survey reports on soils for 10
major terrestrial habitats
Aggregate Vegetation Class (AVC) ndash is a high level grouping of vegetation types produced from a
quantitative hierarchical classification of the different plant species found in the original Countryside
Survey sample plots Loss on ignition (LOI) category ndash soil type based on soil organic matter content defined as minera l (0-
8 LOI 0-44 g C kg-1
) humus-mineral (8 ndash 30 LOI 44-165 g C kg-1
) organo-mineral (30 ndash 60
LOI 165-330 g C kg-1
) and organic (60 ndash 100 gt 330 g C kg-1
)
y = 102x - 012
R2 = 0969
3
4
5
6
7
8
9
3 4 5 6 7 8 9
Sample pH
Re
peat
sam
ple
pH
1 1 line
a) pH in water
y = 102x - 008
R2 = 0976
2
3
4
5
6
7
8
9
2 3 4 5 6 7 8 9
Sample pH
Re
peat
sam
ple
pH
1 1 line
b) pH in CaCl2
53
Countryside Survey Soils Report from 2007
3 Soil pH
The soil pH data were mapped using kriging to interpolate between the Countryside Survey sample points
Routine checking of data for outliers was conducted and the working dataset was transformed using a normal
score procedure to obtain a Gaussian distribution The data were then interpolated on a 1km UK grid using
ordinary kriging and finally the kriged data were back-transformed to produce an interpolated map of soil pH Prior to the 2007 survey data were too sparse to give meaningful and statistically valid interpolation in space and thus no maps of change are presented This will be poss ible in future surveys due to the enhanced baseline
33 Results
331 Structure of the soil pH data
The measured soil pH (0-15 cm) across the three surveys ranged between pH 320 and pH 915 The
distributions of pH values changed with each survey revea ling a progressive reduction in the frequency of
acid values (pHlt5) and an increase in the frequency of values in the range pH 58 to 62 The frequency of
values gt pH 8 also increased across the surveys (Fig 34)
Figure 34 Histograms showing distribution of soil pH (0-15 cm) measurements for a) 1978 b) 1998 c)
2007 and d) cumulative frequency Histogram frequencies normalised to percentage of total number of
samples analysed in each survey
a) 1978
00
20
40
60
80
100
33
64
24
85
4 66
67
27
88
4 9
Soil (0-15 cm) pH
No
o
f o
bserv
ati
on
s (
)
b) 1998
00
20
40
60
80
33
64
24
85
4 66
67
27
88
4 9
Soil (0-15 cm) pH
No
o
f o
bserv
ati
on
s (
)
c) 2007
00
20
40
60
80
33
64
24
85
4 66
67
27
88
4 9
Soil (0-15 cm) pH
No
o
f o
bserv
ati
on
s (
)
d)
00
02
04
06
08
10
3 5 7 9
Soil (0-15 cm) pH
Cu
mu
lati
ve
freq
uen
cy (
)
1978 1998 2007
54
Countryside Survey Soils Report from 2007
3 Soil pH
Approximately 42 of plots were sampled only once in the three surveys (Table 32) reflecting the large
increase in the number of plots in sampled 2007 For plots with repeat measurements an increase of 02 pH
units or more was recorded for an average 66 of plots 11 of plots s howed no change and 22 showed a
decrease in pH of 02 pH units or more (Table 33) This reflects the range of variability always seen in large
scale surveys such as CS Statistical significance in the categories of interest however are the critical issue
Table 32 Number of plots recording a measurement of soil pH (0-15 cm) in each Countryside Survey
Table 33 Percentage of samples from repeat plots in each Countryside Survey showing a decrease in
pH of 02 units or more (ΔpH-ve) no change in pH (ΔpH 0) or an increase in pH of 02 units or more
(ΔpH +ve)
332 Change in mean soil pH (0-15 cm) across Great Britain
The state and change in soil pH across Great Britain over the three Countryside Surveys is summarised in
Table 34 Soils beneath Broad Habitats in Great Britain covered a wide range of pH the most acid soils
comprised those beneath Coniferous Woodland Bog and Dwarf Shrub Heath Broad Habitats where mean pH
in 2007 was asymp 45 whilst the least acid soils (0-15 cm) were those in the enclosed farmland Broad Habitats
with mean pH values ranging between 63 and 72 in 2007
With the exception of Coniferous Woodlands mean soil pH (0-15 cm) increased significantly in all Broad
Habitats over the 29 years from the first survey in 1978 Mean soil pH beneath Coniferous Woodland
remained unchanged over the 29 year period whilst beneath Bracken Broad Habitat the only significant
increase in mean pH was between 1978 and 2007 No significant increases in mean pH were observed
amongst the more acid (1978 mean pH lt 5) and organic -rich Broad Habitats between 1998 and 2007 In
contrast mean soil pH increased between each Countryside Survey in those Broad Habitats with a 1978
mean pH gt5
Analysis of the data in relation to AVC broad ly reflected the results by Broad Habitat In the less acid AVCs
(Fertile and Infertile Grassland and Crops and Weeds mean pH 2007 gt 6) there was a significant increase in
mean soil pH between all three surveys For those AVCs with a mean pH in 2007 of 5 or less there was no
significant change in mean soil pH between 1998 and 2007 but a significant increase was observed between
1978 and 1998 which largely accounted for the increase between 1978 and 2007 There were no significant
changes in mean soil pH in the Tall Grass and Herb AVC and in Lowland Woodlands the only significant soil
pH increase occurred between 1978 and 2007
ΔpH -veΔ p H 0
Δ p H + v e
1978-1998 27 9 64
1998-2007 23 14 63
1978-2007 19 9 72
Mean 23 11 66
No of sites
1978 1998 2007
1978 only 274 274
1998 only 160 160
2007 only 1719 1719
1978 amp1998 only 111 111 222
1998 amp 2007 only 173 173 346
1978 amp 2007 only 179 179 358
1978 amp 1998 amp 2007 688 688 688 2064
Total number of plots 1252 1132 2759 5143
Total number of
samples
Survey years
55
Countryside Survey Soils Report from 2007
3 Soil pH
Table 34 Changes in mean soil pH (0-15 cm) across Great Britain for a) Broad Habitats b) Aggregate
Vegetation Classes (AVC) c) AVCs unchanged since 1978 and d) LOI categories Arrows denote a
significant change (plt005) in the direction shown Diagonal line indicates too few samples to provide
reliable value
a) Great Britain - Broad Habitat
Broad Habitat 1978 1998 2007 1978-1998 1998-2007 1978-2007
Broadleaved Mixed and Yew Woodland 509 547 575
Coniferous Woodland 432 439 450
Arable and Horticulture 659 681 720
Improved Grassland 579 606 627
Neutral Grassland 552 599 614
Acid Grassland 444 472 478
Bracken 414 447 464
Dwarf Shrub Heath 419 450 455
Fen Marsh and Swamp 464 535 545
Bog 429 449 451
All habitat types 539 567 587
Mean pH Direction of significant changes
Aggregate Vegetation Class 1978 1998 2007 1978-1998 1998-2007 1978-2007
All Woodland 452 487 501
Upland Woodland 417 453 459
Lowland Woodland 506 531 566
Fertile Grassland 605 623 645
Infertile Grassland 549 586 610
Moorland Grass Mosaic 440 477 477
Heath and Bog 426 442 444
Tall Grass and Herb 645 685 689
Crops and Weeds 657 679 725
b) Great Britain - AVC whole dataset
Mean pH Direction of significant changes
Aggregate Vegetation Class 1978 1998 2007 1978-1998 1998-2007 1978-2007
All Woodlands 421 454 482
Upland Woodland
Lowland Woodland
Fertile Grassland 600 608 643
Infertile Grassland 549 581 619
Moorland Grass Mosaic 439 476 478
Heath and Bog 435 457 457
Tall Grass and Herb
Crops and Weeds 701 694 738
Mean pH Direction of significant changes
c) Great Britain - AVC unchanged
56
Countryside Survey Soils Report from 2007
3 Soil pH
In order to remove the effects of vegetation land use change statistical analysis was performed on a subset
of the plots which had been sampled in all three Surveys and for which the AVC had remained unchanged
over time AVC is only recorded at the time of each Countryside Survey so change in the intervening years
cannot be ruled out but the plots for which AVC has not changed will have a vegetation composition that has
remained largely consistent in 1978 1998 and 2007
Restricting the analysis to plots where AVC has remained unchanged since 1978 resulted in three Classes
having insufficient data for analysis (Upland and Lowland Woodland and Tall Grass and Herb) Amongst the
remaining unchanged AVCs the only differences in the results were for Fertile Grass land and Crops and
Weeds where the significant increase in mean soil pH between 1978 and 1998 was lost For Fertile
Grassland the mean soil pH values recorded for the whole dataset and for the AVC unchanged data were
very similar suggesting that significance was lost due to a reduction in the number of samples In contrast
for Crops and Weeds the 1978 mean values differ by 044 units between the two datasets suggesting that
restricting the analysis to unchanged plots has eliminated some that were either mis-classified in 1978 or
were responding to changes in landuse vegetation prior to 1978
In all three surveys the most acid soils corresponded to those with the highest organic matter content (Table
34) reflecting the broad inverse relationship between soil pH and LOI (Fig 35) The lower boundary pH
values to this relationship decreased approximately linearly from pH 4 to pH 34 across the full range of LOI
values The upper boundary value decreased more steeply from pH 915 at less than 1 LOI to pH 496 at
96 LOI Mineral soils therefore had a much wider pH range (eg pH 394 to 86 at 4 LOI) compared with
organic soils (eg pH 35 to 51 at 95 LOI) Due to the logarithmic pH scale the range in hydrogen ion
concentrations was actually greater in organic soils (equivalent to 771 μEq kg at 95 LOI) compared to
mineral soils (equivalent to 287 μEq kg at 4 LOI)
Mean soil pH increased significantly across all three Countryside Surveys in mineral soils with an LOI less
than 30 (Table 34) There was no significant change in mean soil pH for organo-mineral and organic soils
between 1998 and 2007 although there was a significant increase in mean pH between 1978 and 1998 which
largely accounted for the significant increase between 1978 and 2007 (Fig 36)
d) Great Britain - Loss on ignition category
LOI category () 1978 1998 2007 1978-1998 1998-2007 1978-2007
Mineral (0-8) 619 643 674
Humus-mineral (8-30) 530 567 590
Organo-mineral (30-60) 458 495 496
Organic (60-100) 425 445 444
Mean pH Direction of significant changes
57
Countryside Survey Soils Report from 2007
3 Soil pH
Figure 35 The relationship between soil pH (0-15 cm) and Loss on Ignition in 2007
Figure 36 The change in the mean pH of soils (0-15 cm) for mineral soils (0-8 LOI) and organic soils
(60-100 LOI) between 1978 and 2007 Significant changes ( plt0001) are show between the dates
bracketed 95 CI are shown for each data point
333 Change in mean soil pH (0-15 cm) across England
Mean soil pH (0-15 cm) values in the All Broad Habitats category for England were approximately 05 pH
units higher compared to Great Britain as a whole (Fig 37) with significant increases observed between
each survey and over the 29 year period since 1978 (Table 35 and Fig 38)
2
3
4
5
6
7
8
9
10
0 10 20 30 40 50 60 70 80 90 100
LOI ()
pH
300
400
500
600
700
800
1973 1978 1983 1988 1993 1998 2003 2008
pH
LOI category 0-8 LOI category 60-100
58
Countryside Survey Soils Report from 2007
3 Soil pH
Figure 37 Differences between England and Great Britain in mean soil pH (0-15 cm) for all Broad
Habitats
Soils beneath enclosed farmland Broad Habitats were the least acid in England with mean pH values gt 65 in
2007 and significant increases in mean soil pH between each survey Mean soil pH (0 -15 cm) in English
enclosed farmland was asymp 025 pH units higher than for Great Britain as a whole (Fig 37) In contrast to
Great Britain Bog soils were the most acid in England (2007 mean pH 401) and no significant changes in
mean pH were recorded across the 29 year period of Countryside Survey Apart from Bog Fen Marsh and
Swamp and Coniferous Woodland all other Broad Habitats showed a significant increase in mean soil pH
between 1978 and 2007 In contrast to Great Britain as whole mean soil pH in Bracken and Dwarf Shrub
Heath Broad Habitats increased significantly between 1998 and 2007 but not between 1978 and 1998 the
mean pH of Acid Grassland soils increased significantly between all three surveys
With the exception of Heath and Bog AVC where no significant changes were observed a nd Crops and
Weeds where there were too few samples for statistical analysis the mean soil pH (0 -15 cm) increased
significantly in all AVCs between 1978 and 2007 in England (Table 35) This broadly reflects the results for
analysis by Broad Habitat except that soil pH increased significantly in the Upland Woodland AVC but not in
Coniferous Forest Broad Habitat possibly due to the inclusion of some broadleaf woodland within the Upland
Woodland AVC and exclusion of lowland coniferous woodland Mean soil pH increased significantly between
1998 and 2007 in Moorland Grass Mosaic in England in contrast to Great Britain where no significant change
was recorded over this period Restricting statistical analysis to unchanged AVCs eliminated several classes
due to small sample numbers Significance was lost for the change in mean soil pH between 1978 and 1998
for Infertile Grassland and Crops and Weeds This may be due to a reduction in sample numbers but for
Crops and Weeds the mean soil pH for the unchanged dataset (pH 709) was approximately 03 pH units
higher than for the whole dataset Restricting the analysis to unchanged plots may have eliminated some
plots that were either mis-classified in 1978 or responding to changes in landuse vegetation prior to 19 78
For England the most organic-rich (60-100 LOI category Table 35) soils were not represented in
sufficient numbers for statistical analysis Mean soil pH (0 -15 cm) was highest in the mineral category (2007
pH 702) and lowest in the organo-mineral soils (2007 pH 502) Mean soil pH increased significantly between
each Survey and across the 29 years since 1978 in soils with less than 30 LOI For organo-mineral soils
(30-60 LOI) mean soil pH increased significantly between 1978 and 1998 which large ly accounted for the
significant increase between 1978 and 2007 These results were consistent with those for Great Britain as a
whole
-060
-040
-020
000
020
040
060
080B
roa
dle
ave
d
Mix
ed
an
d
Ye
wC
on
ife
rou
s
Wo
od
lan
d
Ara
ble
an
d
Ho
rtic
ultu
re
Imp
rove
d
Gra
ssla
nd
Ne
utr
al
Gra
ssla
nd
Acid
Gra
ssla
nd
Bra
cke
n
Dw
arf
Sh
rub
He
ath
Fe
n M
ars
h
an
d S
wa
mp
Bo
g
All
ha
bita
t
typ
es
Dif
fere
nc
e in
me
an
pH
59
Countryside Survey Soils Report from 2007
3 Soil pH
Figure 38 The change in the mean pH of soils (0-15 cm) for across all Broad Habitats in England and
Great Britain between 1978 and 2007 Significant changes ( plt0001) are show between the dates
bracketed 95 CI are shown for each data point
Table 35 Changes in mean soil pH (0-15 cm) across England for a) Broad Habitats b) Aggregate
Vegetation Classes (AVC) c) AVCs unchanged since 1978 and d) LOI categories Arrows denote a
significant change (plt005) in the direction shown Diagonal line indicates too few samples to provide
reliable value
a) England - Broad Habitat
Broad Habitat 1978 1998 2007 1978-1998 1998-2007 1978-2007
Broadleaved Mixed and Yew Woodland 523 583 607
Coniferous Woodland 431 413 444
Arable and Horticulture 671 702 743
Improved Grassland 614 629 658
Neutral Grassland 572 618 641
Acid Grassland 404 451 474
Bracken 411 408 489
Dwarf Shrub Heath 400 412 440
Fen Marsh and Swamp 515 583 548
Bog 409 409 401
All habitat types 589 619 651
Mean pH Direction of significant changes
300
400
500
600
700
800
1973 1978 1983 1988 1993 1998 2003 2008
pH
England Great Britain
60
Countryside Survey Soils Report from 2007
3 Soil pH
d) England - Loss on ignition category
LOI category () 1978 1998 2007 1978-1998 1998-2007 1978-2007
Mineral (0-8) 640 670 702
Humus-mineral (8-30) 573 601 640
Organo-mineral (30-60) 449 504 502
Organic (60-100)
Mean pH Direction of significant changes
334 Change in mean soil pH (0-15 cm) across Scotland
There was a significant increase in mean soil pH in the All Broad Habitats category for Scotland from 1998 to
2007 (Table 36) Earlier increases in pH between 1978 and 1998 and overall from 1978 to 2007 were also
significant (Table 35) Overall mean soil pH was more acid in Scotland compared to Great Britain as a
whole most notably for the enclosed farmland Broad Habitats and for Broadleaved Woodland and Neutral
Grassland (Fig 39)
b) England - AVC whole dataset
Aggregate Vegetation Class 1978 1998 2007 1978-1998 1998-2007 1978-2007
Upland Woodland 401 434 457
Lowland woodland 518 539 572
Fertile grassland 624 640 672
Infertile grassland 575 610 630
Moorland grass mosaics 405 438 465
Heath and Bog 398 416 424
Tall grass and Herb 700 706
Crops and weeds 672 703 750
Mean pH Direction of significant changes
Aggregate Vegetation Class 1978 1998 2007 1978-1998 1998-2007 1978-2007
Upland Woodland
Lowland woodland
Fertile grassland 619 628 666
Infertile grassland 582 609 637
Moorland grass mosaic
Heath and Bog
Tall grass and Herb
Crops and weeds 709 705 753
Mean pH Direction of significant changes
c) England - AVC unchanged
61
Countryside Survey Soils Report from 2007
3 Soil pH
Figure 39 Differences between Scotland and Great Britain in mean soil pH (0-15 cm) for all Broad
Habitats
Soils beneath the Arable Broad Habitat were the least acidic in Scotlan d (2007 mean pH 628) and this was
the only Broad Habitat to record a significant increase in mean soil pH between 1998 (pH 598) and 2007 (pH
628) Mean soil pH in the Arable Broad Habitat did not increase significantly between 1978 and 1998 or
across the entire period from 1978 to 2007
There was no significant change in mean soil pH beneath woodland Broad Habitats in Scotland between
1998 and 2007 or between 1978 and 1998 or between 1978 and 2007 There was a significant increase in
soil pH between 1978 and 1998 for Improved Grassland Neutral Grassland Dwarf Shrub Heath Fen Marsh
and Swamp and Bog Broad Habitats which largely accounted for the significant increase in mean soil pH over
the entire period from 1978 to 2007 in these Broad Habitats Mean soil pH beneath Acid Grassland increased
significanly between 1978 (pH 461) and 2007 (pH 482) but not between 1978 and 1998 or between 1998
and 2007 Bracken was the most acidic Broad Habitat in Scotland in 2007 (mean pH 451) but there were no
significant changes in mean soil pH between any of the Surveys or over the 29 year period from 1978
Infertile Grassland and Crops and Weeds were the only AVCs in Scotland to record a significant increase in
mean soil pH between 1997 and 2007 For Infertile Grassland this continued the trend of significant mean
soil pH increase between 1978 and 1998 and across the entire period from 1978 to 2007 No other significant
changes in mean soil pH were observed for Crops and Weeds There was a significant increase in mean soil
pH for Moorland Mosaics and Heath and Bog between 1978 and 1998 which largely accounted for the
significant increases between 1978 and 2007 For Upland Woodland there was a significant increase in mean
soil pH between 1978 and 2007 but no other significant changes were observed
Restricting the statistical analysis to unchanged AVCs eliminated all but three classes due to small sample
numbers The only difference in the results for the remaining AVCs was the loss of significance for the
increase in mean soil pH in Infertile Grassland between 1978 and 1998 The mean pH values for 1978 and
1998 and the differences between 1978 and 1998 are similar for the unchanged and the whole Infertile
Grassland dataset indicating that a reduction in sample numbers may have caused the loss of significance
-100
-080
-060
-040
-020
000
020B
roadle
aved
Mix
ed a
nd
Yew
Co
nifero
us
Woodla
nd
Ara
ble
and
Ho
rtic
ulture
Impro
ved
Gra
ssla
nd
Ne
utr
al
Gra
ssla
nd
Acid
Gra
ssla
nd
Bra
cken
Dw
arf
Shru
b
He
ath
Fen M
ars
h
and S
wam
p
Bog
All
habitat
types
Dif
fere
nce in
mean
pH
62
Countryside Survey Soils Report from 2007
3 Soil pH
Table 36 Changes in mean soil pH (0-15 cm) across Scotland for a) Broad Habitats b) Aggregate
Vegetation Classes (AVC) c) AVCs unchanged since 1978 and d) LOI categories Arrows denote a
significant change (plt005) in the direction shown Diagonal line indicates too few samples to provide
reliable value
a) Scotland - Broad Habitat
Broad Habitat 1978 1998 2007 1978-1998 1998-2007 1978-2007
Broadleaved Mixed and Yew Woodland 500 485 526
Coniferous Woodland 442 452 461
Arable and Horticulture 614 598 628
Improved Grassland 544 584 595
Neutral Grassland 531 571 572
Acid Grassland 461 483 482
Bracken 442 481 451
Dwarf Shrub Heath 431 463 466
Fen Marsh and Swamp 459 524 531
Bog 434 453 459
All habitat types 481 502 509
Mean pH Direction of significant changes
b) Scotland - AVC whole dataset
Aggregate Vegetation Class 1978 1998 2007 1978-1998 1998-2007 1978-2007
Upland Woodland 432 464 470
Lowland woodland
Fertile grassland 575 594 608
Infertile grassland 535 567 589
Moorland grass mosaics 451 490 487
Heath and Bog 434 450 453
Tall grass and Herb
Crops and weeds 607 578 616
Mean pH Direction of significant changes
Aggregate Vegetation Class 1978 1998 2007 1978-1998 1998-2007 1978-2007
Upland Woodland
Lowland woodland
Fertile grassland
Infertile grassland 525 554 593
Moorland grass mosaic 451 486 489
Heath and Bog 440 461 461
Tall grass and Herb
Crops and weeds
Mean pH Direction of significant changes
c) Scotland - AVC unchanged
63
Countryside Survey Soils Report from 2007
3 Soil pH
In 2007 the mean soil pH in mineral and humus-mineral soils in Scotland was approximately 05 pH units
lower compared to the equivalent soils across Great Britain as a whole (Tables 34 and 36) In contrast the
mean soil pH of the organic-rich soils (gt 30 LOI) was approximately the same in Scotland and across Great
Britain in 2007 For soils in all LOI categories there was a significant increase in mean pH between 1978 and
2007 but the patterns of change with respect to LOI category for other periods were much less consistent in
Scotland compared to Great Britain as a whole Mineral so ils were the only category to record a significant
increase in mean soil pH between 1998 and 2007 The mean pH of humus -mineral and organic soils
increased significantly between 1978 and 1998 which largely accounted for the increase in mean soil pH
between 1978 and 2007 For organo-mineral soils (30-60 LOI) there were no significant changes in mean
soil pH between 1978 and 1998 or between 1998 and 2007
335 Change in mean soil pH (0-15 cm) across Wales
The most acid soils in Wales in 2007 were those beneath Coniferous Woodland (pH 414) whilst soils
beneath enclosed farmland Broad Habitats were the least acid (Table 37) There were no significant
changes in mean soil pH for any of the Broad Habitats in Wales between 1998 and 2007 The mean pH of
soils beneath Broadleaved Woodland Improved Grassland and Neutral Grassland increased significantly
between 1978 and 1998 and this accounted for much of the significant increase in mean soil pH between
1978 and 2007 in these Broad Habitats For Coniferous Woodland Acid Grassland and Dwarf Shrub Heath
there were no significant changes in mean soil pH between any of the Surveys or across the entire period
between 1978 and 2007 Mean soil pH was more acid in Wales for all Broad Habitats relative to mean values
for Great Britain (Fig 310)
Figure 310 Differences between Wales and Great Britain in mean soil pH (0-15 cm) for all Broad
Habitats
-080
-070
-060
-050
-040
-030
-020
-010
000
Bro
ad
lea
ve
d
Mix
ed
an
d
Ye
wC
on
ife
rou
s
Wo
od
lan
d
Ara
ble
an
d
Ho
rtic
ultu
re
Imp
rove
d
Gra
ssla
nd
Ne
utr
al
Gra
ssla
nd
Acid
Gra
ssla
nd
Bra
cke
n
Dw
arf
Sh
rub
He
ath
Fe
n M
ars
h
an
d S
wa
mp
Bo
g
All
ha
bita
t
typ
es
Dif
fere
nc
e in
me
an
pH
d) Scotland - Loss on ignition category
LOI category () 1978 1998 2007 1978-1998 1998-2007 1978-2007
Mineral (0-8) 575 582 605
Humus-mineral (8-30) 496 535 545
Organo-mineral (30-60) 464 487 496
Organic (60-100) 430 451 450
Mean pH Direction of significant changes
64
Countryside Survey Soils Report from 2007
3 Soil pH
Infertile Grassland and Fertile Grassland were the only AVCs to have sufficient data to report st ate and
change for all three Countryside Surveys (Table 37) The mean pH of soils beneath Fertile Grassland did not
change significantly between any of the Surveys or across the period from 1978 to 2007 For Infertile
Grassland there was a significant increase in mean soil pH between 1998 and 2007 between 1978 and 1998
and across the entire period from 1978 to 2007 Restricting the statistical analysis to unchanged AVCs
eliminated all but Infertile Grassland which showed very similar results to the AVC d ataset as a whole It is
unlikely therefore that the changes observed in mean soil pH for Infertile Grassland in Wales resulted from a
change in land use or vegetation composition
There was no significant change in the mean soil pH of mineral or humus -mineral soils in Wales between
1998 and 2007 and there were too few data to report on state and change in mean soil pH for organo -mineral
and organic soils (Table 37) The mean pH of mineral soils (0-15 cm) did not change significantly between
any of the surveys or across the entire period from 1978 to 2007 There was a significant increase in the
mean pH of humus mineral soils (0-15 cm) between 1978 and 1998 and this largely accounted for the
significant increase in mean soil pH between 1978 and 2007
Table 37 Changes in mean soil pH (0-15 cm) across Wales for a) Broad Habitats b) Aggregate
Vegetation Classes (AVC) c) AVCs unchanged since 1978 and d) LOI categories Arrows denote a
significant change (plt005) in the direction shown Diagonal line indicates too few samples to provide
reliable value
a) Wales - Broad Habitat
Broad Habitat 1978 1998 2007 1978-1998 1998-2007 1978-2007
Broadleaved Mixed and Yew Woodland 453 524 540
Coniferous Woodland 373 422 414
Arable and Horticulture 500 648
Improved Grassland 536 574 594
Neutral Grassland 506 585 582
Acid Grassland 434 441 474
Bracken
Dwarf Shrub Heath 413 453 440
Fen Marsh and Swamp
Bog
All habitat types 500 543 556
Mean pH Direction of significant changes
b) Wales - AVC whole dataset
Aggregate Vegetation Class 1978 1998 2007 1978-1998 1998-2007 1978-2007
Upland Woodland 441
Lowland woodland
Fertile grassland 585 608 608
Infertile grassland 507 554 590
Moorland grass mosaics 464
Heath and Bog 429
Tall grass and Herb
Crops and weeds
Mean pH Direction of significant changes
65
Countryside Survey Soils Report from 2007
3 Soil pH
34 Discussion and Policy Implications
Soils (0-15 cm) in Great Britain and regionally within individual countries covered a wide range of pH in 2007
from a minimum of pH 32 to a maximum of pH 915 Organic soils were consistently the most acid whilst the
highest pH values were encountered in mineral soils which also showed the widest range in soil pH The
least acidic soils with a mean pH in excess of 6 were generally found in moderate to intensively managed
agricultural land such as Arable and Improved Grassland Broad Habitats and Fertile Grassland and Crops
and Weeds AVCs Acidic soils with a mean pH less than 5 were associated with Coniferous Woodland Acid
Grassland Dwarf Shrub Heath and Bog Broad Habitats and the Upland Woodland Moorland Grass Mosaic
and Heath and Bog AVCs These generally had organic -rich soils whereas managed agricultural land was
associated with soils with a low organic matter content (Chapter 2)
The mapped distribution of soil pH in 2007 (Fig 311) followed the anticipated pattern with lower pH soils in
the upland areas of Wales Pennines and much of Scotland The coefficient of variation (CV standard
deviation mean an indicator of the spread of the data around the mean value) was lowest in areas
dominated by either high pH soils which are intensively managed or low pH soils in upland areas where there
is little variation Conversely the signal to noise ratio (SN R mean standard deviation) indicated that for
values above 1 the signal was stronger than the noise High SNRs were observed across managed arable
areas in eastern England and agricultural land in southern central England This may occur because soil
management leads to greater uniformity of pH values across these areas High SNRs in the uplands reflect
the presence of acidic peaty and peaty mineral soils in Acid Grassland Dwarf Shrub Heath Bog and
Coniferous Woodland Broad Habitats For England and Wales the broad patterns in the soil pH data (Fig
311) correspond well to maps originating from the National Soil Inventory dataset (NSI McGrath and
Loveland 1992) and the Representative Soil Sampling Scheme (RSSS Baxter et al 2006) although the
latter are restricted to managed agricultural land
d) Wales - Loss on ignition category
LOI category () 1978 1998 2007 1978-1998 1998-2007 1978-2007
Mineral (0-8) 554 588 613
Humus-mineral (8-30) 487 547 555
Organo-mineral (30-60)
Organic (60-100)
Mean pH Direction of significant changes
Aggregate Vegetation Class 1978 1998 2007 1978-1998 1998-2007 1978-2007
Upland Woodland
Lowland woodland
Fertile grassland
Infertile grassland 505 550 609
Moorland grass mosaic
Heath and Bog
Tall grass and Herb
Crops and weeds
c) Wales - AVC unchanged
Mean pH Direction of significant changes
66
Countryside Survey Soils Report from 2007
3 Soil pH
Figure 311 Maps of soil (0-15 cm) pH in 2007 (a) using ordinary Kriging (pH units) (b) coefficient of variation
and (c) signal to noise ratio
Across Great Britain and regionally within the individual countries soils (0 -15 cm) showed evidence of
increasing pH (decreasing acidity) between 1978 and 2007 This is consistent with a response to a reduction
in acid deposition over the last 29 years (NEGTAP 2001 RoTAP 2010) For the more organic -rich soils and
their associated Broad Habitats and AVCs the significant increase in mean pH between 1978 and 2007 was
largely accounted for by the increase between 1978 and 1998 General ly there was no significant pH change
recorded between 1998 and 2007 for organic-rich soils (gt30 LOI) In contrast for mineral and humus-
mineral soils and associated Broad Habitats and AVCs significant increases in soil pH were often observed
between each Survey as well as across the entire period from 1978 to 2007 This was a consistent pattern for
plots with unchanged AVC classification in the different surveys indicating land use change was not
responsible for the trends observed However land managem ent within squares such as changes in rates of
lime and fertiliser applications or stocking densities may play an important role which is currently being
investigated
When comparing changes in pH between different soil types Broad Habitats or AVCs it must be remembered
that pH is a logarithmic scale An equal rate of recovery in terms of pH units would not be expected for a
low pH and a high pH soil Conversion of pH data to hydrogen ion concentrations reveals that annual rates of
change in hydrogen ion concentration for high pH low organic matter soils has been sustained across the 29
year period The large annual rate of change between 1978 and 1998 for more organic -rich low pH soils
slowed dramatically between 1998 and 2007 The different trends observed for mineral and organic soils
may indicate that the soil response to reducing mineral acid inputs from the atmosphere is influenced by soil
organic matter content possibly as a result of buffering by organic acids As the concentration of mineral
a)
)
b)
)
c)
)
67
Countryside Survey Soils Report from 2007
3 Soil pH
acids in the soil declines and soil solution pH rises organic acids will come into solution and de -protonate
providing a buffering mechanism to further pH change In addition organic -rich soils are broadly located in
the north and west of the British Is les where initial pollution levels were lowest and reductions in acid
deposition have been smaller than anticipated given the size of the emission reductions and less than in
regions such as central England which are closer to the main emission sources ( Fig 312 NEGTAP 2001
RoTAP 2010)
Figure 312 a) The regional grouping of sites in the UK precipitation chemistry network used in the statistical
analysis of trends B) Trends in SO2 over the last 20 years in the four groups of monitoring stations
a) b)
Identifying the relative influence of these factors is important to assessing the ldquosuccessrdquo of emission control
policy for acid deposition and will be the subject of further analysis Thus in semi -natural systems on the
more organic-rich soils the implications for biodiversity and metal mobilisation are not clear until further
analysis determines the cause of the lack of change in soil pH Current risk assessment tools using the
critical load methodology indicate the majority of these systems remain at risk from acidic deposition and
thus the lack of further increases in soil pH needs to be investigated closely (RoTAP 2010) One possibility
is the variability in initial acidic deposition inputs and subsequent tre nds (Fig 312)
The significant increase in mean soil pH between 1978 and 2007 observed for managed agricultural land will
be influenced by farming practice such as moves towards deeper cultivation bringing relatively unweathered
chalk parent material to the soil surface In England many areas of arable and arable ley or short term
grassland are located in areas close to emission sources and will have experienced relatively large
reductions in acid deposition loading especially from dry deposition of S O2 (NEGTAP 2001) compared to
areas further west where wet deposition dominates inputs
Group=4
Group=3
Group=2
Group=1
Years since 1986
25
30
0
10 5
10
20
15 0
15
-5
5
20
SO2 concentration (microgm-3)
68
Countryside Survey Soils Report from 2007
3 Soil pH
The influence of agricultural management is difficult to separate from external factors and the evidence from
other soil surveys is contradictory The RSSS (Skinner et al 1992) is exclusively focussed on soils under
agricultural management Re-analysis of the RSSS data (Oliver et al 2006) showed that the temporal
change in agricultural soil pH was small between 1971 and 2001 Spatial disaggregation of the RSSS dat a
indicated that soil pH declined in areas of permanent grassland such as the west of England and Wales
possibly because farmers did not maintain lime inputs following the loss of subsidy in 1976 (Skinner and
Todd 1998 Baxter et al 2006) The RSSS data also showed that soil pH had changed little over time in
arable and arable ley systems with the interpretation that arable farmers have maintained optimal pH levels
for crop production (Oliver et al 2006) Selective re-sampling of arable arable-ley and permanent
(managed) grassland sites of the National Soil Inventory showed an increase in soil pH of between 01 and
03 pH units between the early 1980s and 199596 (Defra 2003) The NSI data corroborate the results from
Countryside Survey for England and Wales between 1978 and 1998 mean pH values for equivalent land use
types are also similar Currently there are no other published national -scale datasets to provide evidence of
pH change in agricultural soils between 1998 and 2007
The soil pH data show an increase over time in the frequency of pH values in excess of pH 85 In 2007
approximately two thirds of the 54 plots with pH gt 85 were in the Arable Broad Habitat with values
approaching pH 9 in some plots Soil pH values in excess of 83 indicat e that calcium carbonate solubility is
no longer controlling soil pH and there is an influence from sodium salts accumulating in the soil Two of the
sample points with the highest pH values are very close to the coast and are mapped as Littoral Sediment o r
Supra-littoral Sediment Broad Habitats where sodium will be abundant Several sample sites are located in
the fens of East Anglia and again there may be abundant sodium in these soils The remaining sites are
further west in Oxfordshire and may be influenced by irrigation which can lead to sodium accumulation in the
soil
Across Great Britain and within individual countries Coniferous Woodland was consistently amongst the most
acidic of the Broad Habitats and showed no significant temporal changes in m ean soil pH Whilst sample
numbers were relatively low in England and Wales (c40) Broad Habitats with fewer samples have shown
significant pH increases and samples numbers in Scotland (125) and across Great Britain as a whole (207)
were easily sufficient to detect change The implication from Countryside Survey is that soils beneath
Coniferous Woodlands are either responding very slowly to changes in acid deposition or other factors such
as accumulation of acidic organic matter are controlling soil pH in these systems Large areas of conifer
forest are located at relatively high altitude in the north and west of Britain where annual rainfall is high wet
deposition enhanced by seeder-feeder effects dominates atmospheric inputs (Dore et al 1992) and forest
canopies are frequently enveloped in cloud which even now can contain high concentrations of atmospheric
pollutants Given this environment and the ability of conifer canopies to efficiently scavenge air pollutants
from the atmosphere (Fowler et al 1989) the positive effects of emission reductions may be attenuated in
Coniferous Woodland There is also a known interaction between forest age or maturity and atmospheric
nitrogen deposition which can potentially acidify forest soils through ldquonitrogen sa turationrdquo (Emmett et al
2003 Emmett and Reynolds 1996) Atmospheric nitrogen deposition has changed little over the past 29
years whilst conifer plantations have grown older as trees planted in the 1960s reach maturity The ongoing
effects of nitrogen deposition may therefore offset the benefits of lower sulphur deposition Aside from
external influences the build up of acidic forest floor and accumulation of base cations into standing
biomass especially in those areas with a naturally ldquoacidicrdquo geolog y and soils may also be contributing to the
sustained acidity of surface soils in Coniferous Woodland The policy consequences of these results are
more likely to affect the aquatic rather than the terrestrial environment In Wales for example surface w ater
acidification in afforested headwater catchments and the persistence of acid episodes has already been
identified as a significant threat to achieving compliance to the Water Framework Directive in some upland
water bodies
69
Countryside Survey Soils Report from 2007
3 Soil pH
341 Policy implications
The increased soil pH observed for the more mineral soils is consistent with the expected benefit of
continued reductions in sulphur emissions Data analysis is ongoing to determine if other drivers of change
such as nitrogen deposition or land management is slowing recovery in the organic soils where pH did not
significantly increase between 1998 and 2007 Conversion from one land use to another does not seem to be
an important factor Land management may be affecting soil pH in more intensively managed agricultural
land and further work is required to separate this influence from the response to reduced acid and nitrogen
deposition The implications of these findings are that current emission control policies combined with current
policies to protect soil through sustainable land management practices may not currently be sufficient to
promote continued recovery from acidification in organic -rich soils
35 References
Allen SE (ed) 1989 Chemical analysis of ecological materials Blackwell Scientific Publications Oxford
368 pp
Avery BW Bascomb CL 1974 Soil Survey Laboratory Methods Soil Survey Technical Monograph No 6
Harpenden
Baxter SJ Oliver MA Archer JR 2006 The Representative Soil Sampling Scheme of England and
Wales the spatial variation of topsoil nutrient status and pH between 1971 and 2001 Soil Use and
Management 22 383-392
Black HIJ Garnet JS Ainsworth G Coward PA Creamer R Ellwood S Horne J Hornung M
Kennedy VH Monson F Raine L Osborn D Parekh NR Parrington J Poskitt JM Potter E
Reeves N Rowland AP Self P Turner S Watkins J Woods C Wright J 2000 MASQ Monitoring
and Assessing Soil Quality in Great Britain Countryside Survey Module 6 Soils and Pollution RampD
Technical Report E1-063TR Environment Agency Bristol
Carey PD Wallis S Chamberlain PM Cooper A Emmett BA Maskell LC McCann T Murphy J
Norton LR Reynolds B Scott WA Simpson IC Smart SM Ullyett JM 2008 Countryside Survey
UK Results from 2007 NERCCentre for Ecology amp Hydrology 105pp (CEH Project Number C03259)
Countryside Survey 2009 England Results from 2007 (published September 2009) NERCCentre for Ecology
amp Hydrology Department for Environment Food and Rural Affairs Natural England 119pp (CEH Project
Number C03259)
Defra 2003 Comparability of soil properties derived from different data sources Report by National Soil
Resources Institute Defra Project SP0515
Dore AJ Choularton TW Fowler D 1992 An improved wet deposition map of the United Kingdom
incorporating the seeder-feeder effect over mountainous terrrain Atmospheric Environment 26 1375-1381
Emmett BA Frogbrook ZL Chamberlain PM Griffiths R Pickup R Poskitt J Reynolds B Rowe
E Spurgeon D Rowland P Wilson J and Wood CM 2008 CS Technical Report No 307 Soils
Manual NERCCentre for Ecology amp Hydrology 180 pp (CEH Project Number C03259)
Emmett BA Reynolds B Stevens PA Norris DA Hughes S Gorres J Lubrecht I 1993 Nitrate
leaching from afforested Welsh catchments - interactions between stand age and nitrogen deposition Ambio
22 386-394
70
Countryside Survey Soils Report from 2007
3 Soil pH
Emmett BA Reynolds B 1996 Nitrogen critical loads for spruce plantations in Wales is there too much
nitrogen Forestry 69 205-214
Fowler D Cape JN and Unsworth MH 1989 Deposition of atmospheric pollutants on forests
Philosophical Transactions of the Royal Society B 324 247-265
Fowler D Coyle M Apsimon HM Ashmore MR Bareham SA Battarbee RW Derwent RG
Erisman JW Goodwin J Grennfelt P Hornung M Irwin J Jenkins A Metcalfe SE Ormerod SJ
Reynolds B Woodin S 2001 Transboundary Air pollution Acidification Eutrophication and Ground -Level
Ozone in the UK NEGTAP 2001 314pp DEFRA Contract No EPG 13153
Haines-Young RH Barr CJ Black HIJ Briggs DL Bunce RGH Clarke RT Cooper A Dawson
FH Firbank LG Fuller RM Furse MT Gillespie MK Hill R Hornung M Howard DC McCann
T Morecroft MD Petit S Sier ARJ Smart SM Smith GM Stott AP Stuart RC and Watkins
JW 2000 Accounting for nature assessing habitats in the UK countryside Centre for Ecology and
Hydrology Department of the Environment Transport and the Regions 134 pp
McGrath SP Loveland PJ 1992 The Soil Geochemical Atlas of England and Wales Blackie Academ ic
and Professional
NEGTAP 2001 Transboundary Air Pollution Acidification Eutrophication and Ground -Level Ozone in the
UK Prepared by the National Expert Group on Transboundary Air Pollution on behalf of the UK Department
for Environment Food and Rural Affairs (DEFRA) and the Devolved Administrations 314 pp
Norton LR Murphy J Reynolds B Marks S Mackey EC 2009 Countryside Survey Scotland Results
from 2007 NERCCentre for Ecology amp Hydrology The Scottish Government Scottish Natural Heritage
83pp (CEH Project Number C03259)
Oliver MA Archer JR Baxter SJ Todd AD Skinner RJ 2006 The Representative Soil Sampling
Scheme of England and Wales a statistical analysis of topsoil nutrient status and pH between 197 1 and
2001 Soil Use and Management 22 372-382
RoTAP 2010 Review of Transboundary Air Pollution Acidification Eutrophication Ground Level Ozone and
Heavy Metals in the UK Defra
Schofield RK Taylor AW1955 The measurement of soil pH Soil Science Society of America Journal 19
164-167
Skinner RJ Todd AD 1998 Twenty-five years of monitoring pH and nutrient status of soils in Enlgand and
Wales Soil Use and Management 14 162-169
Skinner RJ Church BM Kershaw CD 1992 Recent trends in soil pH and nutrient status in England and
Wales Soil Use and Management 8 16-20
Smart SM Allen D Murphy J Carey PD Emmett BA Reynolds B Simpson IC Evans RA
Skates J Scott WA Maskell LC Norton LR Rossall MJ Wood C 2009 Countryside Survey Wales
Results from 2007 NERCCentre for Ecology amp Hydrology Welsh Assembly Government Countryside
Council for Wales 94pp (CEH Project Number C03259)
White RE 1969 On the measurement of so il pH Journal of the Australian Institute of Agricultural Science
35 3-14
71
Countryside Survey Soils Report from 2007
4 Total nitrogen and CN
Summary
There were small but significant decreases in mean soil (0-15 cm) total nitrogen concentration
between 1998 and 2007 in many Broad Habitats and Aggregate Vegetation Classes across Great
Britain and the individual countries no reporting category recorded an increase in mean soil (0 -15
cm) total nitrogen concentration
For semi-natural and woodland soils continued input of nitrogen deposition at 20-30 kgNhayr for
many parts of Great Britain has not caused the expected average increase of 3 -4 in this basic soil
property Instead the decreases observed combined with a trend for an increase in total carbon to
nitrogen ratio suggest there may be increased nitrogen loss or uptake possibly combined with a
trend for increased carbon density as reported for some soils in Chapter 2 The effects of one or
both of these processes would be to effectively bdquodilute‟ the soil (0 -15cm) nitrogen concentration
signal Both processes (increased nitrogen loss and increased carbon fixation by plants leading to
storage in soil) are known possible consequences of nitrogen enrichment which can result in
vegetation composition change and thus this parameter may not be a sensitive indicator of
eutrophication from atmospheric nitrogen deposition
There was no change or a small significant decline in mean soil total nitrogen concentrations in
improved and fertile grassland categories between 1998 and 2007 across Great Britain and within
individual countries despite major reductions in fertiliser use As there is no change in the soil (0 -
15cm) total carbon to nitrogen ratio this indicates farmers have maintained soil nitrogen status in
managed grassland systems despite a reduction in mineral fertiliser use possibly due to use of
alternative organic sources of nitrogen such as slurry and organic waste products
In cropland systems a significant decline in soil (0-15cm) total nitrogen concentrations and total
carbon to nitrogen ratios was observed between 1998 and 2007 for Great Britain and England A
significant decline in soil (0-15cm) total carbon concentrations was also reported (Chapter 2) As
there is only a small decline in fertiliser use in these systems and there is evidence of combined
carbon and nitrogen loss deep ploughing erosion or increased decomposition rates may be the
most likely explanation of this trend
41 Introduction
Key question Can the trend of eutrophication of the countryside be detected in the soil as well as the
vegetation using this basic soil property
Measurements Repeat measurement of soil (0-15 cm) total nitrogen concentration measured in all plots
sampled in 1998
Soil total nitrogen concentration (hereafter called soil N concentration) and stock are basic fundame ntal
measurements of soil fertility They are relatively insensitive to short -term changes but over a longer time
period give an overall indication of trends in soil fertility and changes in nutrient status in relation to other
parameters such as carbon (C) Changes in plant species composition were observed following the
Countryside Survey (CS) in 1998 (Haines-Young 2000) and these were ascribed to ecosystem eutrophication
following enhanced deposition of atmospheric N compounds
In response to the key question soil N concentration data can be used to provide
72
Countryside Survey Soils Report from 2007
4 Total Nitrogen and CN
National and country-level assessments of soil N concentration and change in soil N concentration
since 1998
Attribution of change in and form of soil N in response to pressures and drivers
Attribution of change in plant species composition in relation to internal N status versus
atmospheric N deposition
Assessment of soil N in relation to changes in soil C status
The deliverables for total soil (0-15 cm) N from CS in 2007 will be
National and country-level assessments of status and change in soil (0-15 cm) total N concentration
and stock since 1998
Assessment of soil N in relation to changes in soil C status
411 Rationale for measurement
The rationale for the measurement of soil total N concentration and stock is given in Table 41 Total N has
not been measured in surveys of soil quality in England and Wales apart from forest and woodland systems
in the BIOSOIL and British Woodland Survey It is a parameter within the National Soil In ventory for Scotland
(NSIS) and is included in the soil measurements at Environmental Change Network sites
Table 41 Total N rationale for measurement
Facts Comments History in CS Total N measured in CS
in 1998
Maintain time series Enables stock and change
Links and compatibility to other monitoring programmes
Not measured in NSI
Total N has been measured in the NSIS (Scotland) BIOSOIL and the British Woodland Survey
Uniqueness of CS No other known national datasets
Only integrated sample which can be linked to vegetation and land management
Value for money (Policy priority or interpretative value x cost)
High High policy and interpretative value low cost
42 Methods
The soil used for total N analysis was taken from the bdquoBlack core‟ and there were no specific sampling
requirements beyond those normally employed for collecting these samples (See Emmett et al 2008 Annex
1)
One thousand and twenty four samples were analysed at CEH Lancaster for total N in 2007 using the UKAS
accredited method SOP3102 Samples were analysed using an Elementar Vario -EL elemental analyser
(Elementaranalysensysteme GmbH Hanau Germany) The Vario EL is a fully automated analytical
instrument working on the principle of oxidative combustion followed by thermal conductivity detection
Following combustion in the presence of excess oxygen the oxides of N and C flow through a reduction
column which removes excess oxygen C is trapped on a column whilst N is carried to a detector C is then
73
Countryside Survey Soils Report from 2007
4 Total nitrogen and CN
released from the trap and detected separately Sample weights are usually 15 mg for peat and 15 -60 mg for
mineral soil samples
The concentration of total N is expressed in dry weight of soil which is abbreviated in the text to N
To calculate topsoil total N density a measurement of N content per unit volume is needed Combining bulk
density measurements reported in Chapter 1 for the 2007 samples with soil N concentration values result in
estimates of topsoil (0-15 cm) N density on an area basis expressed in units of tha
421 Quality Assurance and Quality Control
The DefraNERCBBSRC Joint Codes of Practice were followed
Due to the fully automated nature of the instrument calibration was performed infrequently with daily runs
being factorised to the instrument calibration through the use of a certified standard (acetanilide) Quality
control was achieved by using two in-house reference materials analysed with each batch of samples and by
the analysis of duplicate samples
Results of the analysis of standard reference materials (SRM) SR3 and SR8 which cover a range of soil N
concentration values are shown using Shewhart charts (Fig 41a and Fig 41b) The same standards were
used in the sample batches from 1998 and 2007 and the relative performance of the a nalysis can be
compared
Figure 41 Shewhart QC charts for total N analysis () of standard reference materials a) SR3 and b) SR8
a) SR3 - QC ChartMean = 065 limits +- 2 SD of mean
050
055
060
065
070
075
0 50 100 150 200 250
Arbitrary sample no
N
1998 2007 Mean Upper limit Lower limit
b) SR8 - QC ChartMean = 030 limits +- 2 SD of mean
025
028
030
033
035
0 20 40 60 80 100 120 140 160 180 200
Arbitrary sample no
N
1998 2007 Mean Upper limit Lower limit ISO median
74
Countryside Survey Soils Report from 2007
4 Total Nitrogen and CN
The Quality Control charts provide evidence of acceptable results for the analyses under taken in 1998 for
both SRMs More points fall outside the 2SD limit for both SRMs in 2007 For SR3 there is an upward trend
in the results whereas a downward trend is suggested for SR8 with values falling closer to the ISO median
value of 029 N Taken overall the values for the repeated SRM analyses fall within acceptable Quality
Control limits and there is no evidence to indicate a consistent bias in the results
422 Reporting
Soil N concentration data (0-15 cm) have been analysed to provide information on the state of soil N
concentration in 2007 and the change since 1998 The statistical approach used for analysing the data for
change involved bootstrapping which allows for non-normality in the data without the necessity of knowing
details of the actual distribution As such it provides a more accurate measurement of significance Annex F
of Emmett et al (2008) provides a background document describing this approach
The data in this report describe mean soil N concentrations in soils (0-15 cm) in 2007 and change since 1998
by Broad Habitat Aggregate Vegetation Class (AVC) and Loss-on-Ignition (LOI) category for Great Britain
(GB) and for the individual countries In summary these are defined as
Broad Habitat - The Broad Habitat classification consists of 27 habitats which account for the entire
land surface of Great Britain and the surrounding sea Countryside Survey reports on soils for 10
major terrestrial habitats
Aggregate Vegetation Class (AVC) ndash is a high level grouping of vegetation types produced from a
quantitative hierarchical classification of the different plant species found in the original Countryside
Survey sample plots Loss on ignition (LOI) category ndash soil type based on soil organic matter content defined as mineral (0 -
8 LOI 0-44 g C kg-1
) humus-mineral (8 ndash 30 LOI 44-165 g C kg-1
) organo-mineral (30 ndash 60
LOI 165-330 g C kg-1
) and organic (60 ndash 100 gt 330 g C kg-1
)
To remove the effects of large-scale vegetation and or land use change mean soil N concentrations have
also been estimated for plots where the AVC has not changed over time The AVC is only known for the
survey years and may change during intervening periods for example due to arable -grassland rotation The
plots where the AVC has not changed can therefore be regarded as plots where the vegetation has been
largely consistent in 1978 1998 and 2007
Soil (0-15 cm) total N density (tha) has been estimated for 2007 using the total N concentration and the bulk
density data These values are reported using the same categories for GB and individual countries Total N
density has not been estimated for AVC unchanged as change in density cannot be reported
43 Results
431 Structure of the total nitrogen concentration data
Total N concentration was measured in samples from 1024 plots in 2007 and from 1110 plots in 1998 75 of
plots sampled in 2007 had also been sampled in 1998 Concentrations of total N measured in soils (0-15 cm)
in 2007 ranged between 004 and 277N compared to a range of values betw een 008 and 322 N in 1998
The common practice in agricultural soils to determine N on a volume basis (mglitre) makes comparison
difficult particularly when combined with different depth of 0 -75cm compared to 0-15cm in CS for grassland
soils although ranges for CS soils seem broadly comparable
75
Countryside Survey Soils Report from 2007
4 Total nitrogen and CN
Between 1998 and 2007 the proportion of samples with a total N concentration of 1N or less increased
from 71 to 80 whilst the proportion of samples with greater than 2N decreased from 9 to 54
Overall there was evidence of a downward shift in total N concentrations across the entire range of values
between 1998 and 2007 (Fig 42) The populations in 1998 and 2007 were skewed and slightly bimodal
Figure 42 Distribution of soil (0-15cm) N concentrations a) Histogram for 1998 and 2007 b) Cumulative
frequency for 1998 and 2007 Histogram frequencies normalised to percentage of total number of samples
analysed in each survey
Soil N concentration was strongly and positively correlated to loss on ignition (r2 = 089) although there was
more scatter in both datasets at higher values of LOI and total N (Fig 43a) Total N concentration decreased
with increasing bulk density in a logarithmic relationship (r2 = 079 Fig 43b) and together the results show
not unexpectedly that peaty soils with low bulk density contain the highest concentrations of N Below pH
55 soil N concentrations varied across the full range of values measured (04 to 28N) whilst abov e pH 6
the majority of samples contained between 01 and 06 N (Fig 43c) There was no clear relationship
0
3
6
9
12
15
18
01 05 09 13 17 21 25 29 33
Total N ( dry wt of soil)
Fre
qu
en
cy
1998 2007
a)
0
20
40
60
80
100
0 1 2 3 4
Total N ( dry wt of soil)
Cu
mu
lati
ve
fre
qu
en
cy
1998 2007
b)
76
Countryside Survey Soils Report from 2007
4 Total Nitrogen and CN
between total N concentration and Olsen-P (Fig 43d) A wide range of total N values were encountered at
Olsen-P concentrations below 50 mgP kg-1
although samples with very high Olsen-P values in excess of
150 mgP kg-1
generally had low total N concentrations (lt05 N)
Figure 43 Relationships between soil N concentration in 2007 and a) Loss-on-ignition b) bulk density c) soil
pH and d) Olsen-P concentration
Figure 44 Plots of soil N concentration change between 1998 and 2007 (Delta soil N concentration) and 2007
values for a) Loss-on-ignition b) bulk density c) soil pH and d) Olsen-P concentration
-3
-2
-1
0
1
2
3
0 20 40 60 80 100 120
2007 LOI ( dry wt soil)
Delt
a
N
a)
-3
-2
-1
0
1
2
3
0 05 1 15 2
2007 Bulk density (gcm3)
Delt
a
N
b)
-3
-2
-1
0
1
2
3
3 4 5 6 7 8 9
2007 pH
Delt
a
N
c)
-3
-2
-1
0
1
2
3
0 50 100 150 200 250
2007 Olsen-P (mgPkg)
Delt
a
N
d)
0
1
2
3
0 100 200 300 400
Olsen P (mgkg)
To
tal
N (
d
ry w
t s
oil
) d)
0
1
2
3
3 5 7 9
pH
To
tal
N (
d
ry w
t s
oil
)
c)
y = -06385Ln(x) + 03753
R2 = 07927
0
1
2
3
0 05 1 15 2
Bulk density (gcm3)
To
tal
N (
d
ry w
t s
oil
) b)y = 00758x
07302
R2 = 0891
0
1
2
3
0 20 40 60 80 100
LOI ( dry wt soil)
To
tal
N (
d
ry w
t s
oil
) a)
77
Countryside Survey Soils Report from 2007
4 Total nitrogen and CN
Changes in soil N concentration between 1998 and 2007 occurred across the full range of LOI
concentrations (Fig 44a) whereas large changes were more prevalent in soils with a bulk density below asymp07
gcm3 and pH less than 55 (Figs 44b and 44c) Soils with relatively low Olsen-P concentrations (lt20 mgP
kg-1
) showed the largest decrease in total N concentration (Fig 44d) with decreases of up to 2N
432 Change in mean total nitrogen concentration in soils (0-15 cm) across Great
Britain
There was a significant approximately 10 decrease in soil (0-15 cm) N concentration between 1998 and
2007 across GB as a whole (Table 42) This was reflected in many Broad Habitats The magnitude of
change varied between Broad Habitats with the smallest significant decrease (7 ) measured in Arable which
also had the lowest soil N concentrations in 1998 (027 N) and 2007 (025 N) The biggest percentage
decrease between the surveys (21) occurred in Coniferous Woodland The highest soil N concentrations in
both surveys were measured in soils in the Bog Broad Habitat (178 N in 1998 and 159 N in 2007) The
soil N concentration in soils (0-15 cm) beneath Broadleaved Woodland Improved Grassland Bracken and
Fen Marsh and Swamp did not change significantly between 1998 and 2007
The largest total N density (60 tha) was measured in Improved Grassland reflecting the intermediate mean
N concentration and relatively high bulk density Despite having the highest mean total N concentration soils
in the Bog and Coniferous Woodland had the lowest N densities (38 tha) due to the low bulk density values
in these Broad Habitats
There was a significant decrease in soil N concentration in all AVCs except Lowland Woodland Tall Grass
and Herb and Crops and Weeds between 1998 and 2007 (Table 42b) The lowest soil N concentrations were
observed in Crops and Weeds in 1998 (026 N) and 2007 (025 N) whilst Heath and Bog AVC had the
highest mean values in 1998 (17 N) and 2007 (147 N) The soil N concentrations in soils (0-15 cm) for
plots in which the AVC did not change (Table 42c) were broadly consistent with the dataset as a whole
(Table 42b) Significant changes were only observed in Heath and Bog and Infertile Grassland for the
unchanged dataset This suggests that some of the significant change in soil N concentrations observed in
the dataset as a whole may have arisen because of a change in land use between the surveys
Heath and Bog AVC had the lowest total N density in 2007 (38 tha) and Fertile Grassland the highest (59
tha) These values compare closely with values measured in Bog and Improved Grassland Broad Habitats
respectively
Soil N concentrations decreased significantly across all LOI categories (Table 42d Fig 45) with the
largest change observed in organo-mineral soils where mean total N in soils (0-15 cm) declined by more than
20 In both surveys the highest soil N concentrations were observed in organic soils which accounted for
the high concentrations measured in Broad Habitats and AVCs with organic -rich soils (Dwarf Shrub Heath
and Bog Broad Habitats Moorland Grass Mosaic and Heath and Bog AVCs) Organic soils had the lowest
total N density (38 tha) while the highest density was observed in humus -mineral soils (60 tha)
The soil N concentration data were combined with C data to calculate changes in soil CN ratio (0-15cm) The
CN variable provides information on the relative change in C and N storage in soils The general trend
across all Broad Habitats is for no change or an increase in CN rat io (Table 43)
78
Countryside Survey Soils Report from 2007
4 Total Nitrogen and CN
Table 42 Change between 1998 and 2007 in N concentration of soils (0-15 cm) and total N density of soils (0-15
cm) in 2007 for GB for a) Broad Habitats b) Aggregate Vegetation Classes (AVC) c) AVCs unchanged since 1978
and d) LOI categories Arrows denote a significant change (plt005) in the direction shown Diagonal line
indicates too few samples to provide reliable value
a) Great Britain ndash Broad Habitat
Broad Habitats Mean Total Nitrogen ( dry wt soil)
Direction of
significant changes
Total Nitrogen
density (tha)
1998 2007 1998 - 2007 2007
Broadleaved Mixed and
Yew Woodland
070 065 51
Coniferous Woodland 112 088 38
Arable and Horticulture 027 025 43
Improved Grassland 047 045 60
Neutral Grassland 052 047 56
Acid Grassland 149 123 51
Bracken 084 095
Dwarf Shrub Heath 131 114 47
Fen Marsh and Swamp 122 108 48
Bog 178 159 38
All Habitat Types 079 071 49
b) Great Britain ndash AVC whole dataset
Aggregate Vegetation
Class
Mean Total Nitrogen ( dry wt soil) Direction of
significant changes
Total Nitrogen
density (tha)
1998 2007 1998 - 2007 2007
Upland Woodland 091 073 40
Lowland Woodland 060 058 51
Fertile Grassland 044 041 59
Infertile Grassland 057 052 58
Moorland Grass Mosaic 128 113 48
Heath and Bog 170 147 38
Tall Grass and Herb 036 036 48
Crops and Weeds 026 025 43
c) Great Britain ndash AVC unchanged
Aggregate Vegetation
Class
Mean Total Nitrogen ( dry wt soil) Direction of
significant changes
Total Nitrogen
density (tha)
1998 2007 1998 - 2007 2007
Upland Woodland 090 072
Lowland Woodland 065 067
Fertile Grassland 047 044
Infertile Grassland 059 053
Moorland Grass Mosaic 138 124
Heath and Bog 170 151
Tall Grass and Herb 032 032
Crops and Weeds 025 024
79
Countryside Survey Soils Report from 2007
4 Total nitrogen and CN
d) Great Britain ndash Loss on Ignition category
LOI category () Mean Total Nitrogen ( dry wt soil)
Direction of
significant changes
Total Nitrogen
density (tha)
1998 2007 1998 - 2007 2007
Mineral (0-8) 029 027 44
Humus-mineral (8-30) 060 056 60
Organo-mineral (30-60) 146 114 51
Organic (60-100) 191 180 38
Figure 45 Change in soil (0-15 cm) N concentration across LOI categories in Great Britain between 1998 and
2007 Significant changes are shown as plt0001 plt001 plt005 95 CI are shown for each bar
-06
-05
-04
-03
-02
-01
0
Mineral Humus-mineral Organo-mineral Organic
Soil LOI categories
Dif
fere
nce
1998-2
007
(
N)
80
Countryside Survey Soils Report from 2007
4 Total Nitrogen and CN
Table 43 Change in CN ratio of soils (0-15 cm) across Great Britain for a) Broad Habitats b) Aggregate
Vegetation Classes (AVC) c) AVCs unchanged since 1978 and d) LOI categories Arrows denote a significant
change (plt005) in the direction shown
a) Great Britain ndash Broad Habitat
Broad Habitats Mean CN ratio
Direction of
significant changes
1998 2007 1998 - 2007
Broadleaved Mixed and
Yew Woodland
140 142
Coniferous Woodland 201 215
Arable and Horticulture 117 113
Improved Grassland 118 120
Neutral Grassland 123 127
Acid Grassland 177 182
Bracken 152 165
Dwarf Shrub Heath 229 231
Fen Marsh and Swamp 164 177
Bog 262 282
All Habitat Types 156 160
b) Great Britain ndash AVC whole dataset
Aggregate Vegetation
Class
Mean CN ratio Direction of
significant changes
1998 2007 1998 - 2007
Upland Woodland 179 193
Lowland Woodland 134 142
Fertile Grassland 117 121
Infertile Grassland 124 130
Moorland Grass Mosaic 189 196
Heath and Bog 260 268
Tall Grass and Herb 117 118
Crops and Weeds 118 113
c) Great Britain ndash AVC unchanged
Aggregate Vegetation
Class
Mean CN ratio Direction of
significant changes
1998 2007 1998 - 2007
Upland Woodland 171 183
Lowland Woodland 140 150
Fertile Grassland 117 122
Infertile Grassland 124 130
Moorland Grass Mosaic 190 199
Heath and Bog 273 294
Tall Grass and Herb 115 120
Crops and Weeds 117 112
81
Countryside Survey Soils Report from 2007
4 Total nitrogen and CN
d) Great Britain ndash Loss on Ignition category
LOI category () Mean CN ratio
Direction of
significant changes
1998 2007 1998 - 2007
Mineral (0-8) 117 116
Humus-mineral (8-30) 134 142
Organo-mineral (30-60) 194 204
Organic (60-100) 266 278
433 Change in mean total nitrogen concentration in soils (0-15 cm) across England
Total N concentration was measured only on the Main Plots within the original 256 squares sampled in 1978
giving a maximum potential sample number of 1281 of which 1024 were sampled in 2007 and 1110 in 1998
For this reason sample numbers decline rapidly in country-level data analysis A minimum cut-off of 20
samples was applied for country-level analysis of total N concentration by Broad Habitat AVC and LOI
Category As a result there are several gaps in the results Missing data are denoted by a horizontal line
across the cell in the table
There was a relatively small (115) but significant decrease in soil N concentration across the All Broad
Habitats category in England between 1998 and 2007 (Table 44a) Arable soils (0-15 cm) contained the
lowest soil N concentrations in England in 1998 (027 N) and 2007 (025 N) and there was a small (7)
but significant decrease between the two surveys Soil N concentrations in soils (0-15 cm) beneath Improved
Grassland and Neutral Grassland in England were very similar in 2007 ( asymp 048 N) and a significant
decrease in concentration was observed in the latter between 1998 and 2007 (Table 44a) No significant
changes were observed in N concentrations in soils (0-15 cm) beneath Broadleaved Mixed and Yew
Woodland and Acid Grassland in England between 1998 and 2007 There were insufficient samples to make
a valid estimate of the mean and change in N concentration in soils (0-15 cm) in the remaining Broad
Habitats in England
Total N density was lowest in the Arable Broad Habitat (4 4 tha) and highest in Improved Grassland (61
tha) these figures were very similar to the data for these Broad Habitats across GB (Table 42a)
There were significant decreases in soil N concentration in Fertile Grassland and Infertile Grassland AVCs in
England between 1998 and 2007 (Table 44b) Of the AVCs with sufficient data to provide a valid estimate of
the mean the highest concentrations in 1998 and 2007 were measured in soils (0-15 cm) beneath Moorland
Grass Mosaic (109 N) The highest total N density was measured in Infertile Grassland AVC (61 tha)
whilst Upland Woodland and Crops and Weeds jointly had the lowest total N density (43 tha)
Restricting the analysis to plots where AVC remained unchanged resulted in only three AVCs having
sufficient samples for statistically valid estimates of the mean (Table 44c) Infertile Grassland was the only
AVC showing a significant reduction in mean soil N concentration between 1998 and 2007 Mean values for
Fertile Grassland and Crops and Weeds for the unchanged dataset were very similar to those for the dataset
as a whole
There was small (asymp10) but significant decrease in soil N concentration in mineral and humus-mineral soils
in England between 1998 and 2007 (Table 44d) Organo-mineral soils did not change significantly between
the surveys and there were insufficient data to provide valid estimates for organic soils in England The
lowest total N density was observed in mineral soils (45 tha) and humus-mineral soils contained the most
total N (67 tha)
82
Countryside Survey Soils Report from 2007
4 Total Nitrogen and CN
Table 44 Change between 1998 and 2007 in N concentration of soils (0-15 cm) and total N density of soils (0-15
cm) in 2007 for England for a) Broad Habitats b) Aggregate Vegetation Classes (AVC) c) AVCs unchanged since
1978 and d) LOI categories Arrows denote a significant change (plt005) in the direction shown Diagonal line
indicates too few samples to provide reliable estimate
a) England ndash Broad Habitat
Broad Habitats Mean Total Nitrogen ( dry wt soil)
Direction of
significant changes
Total Nitrogen
density (tha)
1998 2007 1998 - 2007 2007
Broadleaved Mixed and
Yew Woodland
064 058 56
Coniferous Woodland
Arable and Horticulture 027 025 44
Improved Grassland 047 045 61
Neutral Grassland 052 046 59
Acid Grassland 110 092 54
Bracken
Dwarf Shrub Heath
Fen Marsh and Swamp
Bog
All Habitat Types 052 046 53
b) England ndash AVC whole dataset
Aggregate Vegetation
Class
Mean Total Nitrogen ( dry wt soil) Direction of
significant changes
Total Nitrogen
density (tha)
1998 2007 1998 - 2007 2007
Upland Woodland 106 089 43
Lowland Woodland 061 060 53
Fertile Grassland 045 039 59
Infertile Grassland 056 051 61
Moorland Grass Mosaic 109 109 58
Heath and Bog
Tall Grass and Herb 036 037 49
Crops and Weeds 027 025 43
c) England ndash AVC unchanged
Aggregate Vegetation
Class
Mean Total Nitrogen ( dry wt soil) Direction of
significant changes
Total Nitrogen
density (tha)
1998 2007 1998 - 2007 2007
Upland Woodland
Lowland Woodland
Fertile Grassland 049 045
Infertile Grassland 060 055
Moorland Grass Mosaic
Heath and Bog
Tall Grass and Herb
Crops and Weeds 025 024
83
Countryside Survey Soils Report from 2007
4 Total nitrogen and CN
d) England ndash Loss on Ignition category
LOI category () Mean Total Nitrogen ( dry wt soil)
Direction of
significant changes
Total Nitrogen
density (tha)
1998 2007 1998 - 2007 2007
Mineral (0-8) 029 026 45
Humus-mineral (8-30) 062 056 67
Organo-mineral (30-60) 145 110 63
Organic (60-100)
434 Change in mean total nitrogen concentration in soils (0-15 cm) across Scotland
In Scotland there was a small (11) but significant decline in soil N concentration for the All Broad Habitats
category (Table 45a) between 1998 and 2007 Significant decreases in N concentration in soils (0-15 cm)
were also observed in Coniferous Woodland Acid Grassland Dwarf Shrub Heath and Bog Broad Habitats
but there were no significant changes in soil N concentration in Broadleaf Woodland Arable Improved
Grassland and Neutral Grassland Improved Grassland contained the most total N (52 tha) and Coniferous
Woodland had the lowest total N density (37 tha) The figure for Coniferous Woodland is comparable with
that for GB but Improved Grassland in Scotland contains 08 tha less total N compared to GB
Infertile Grassland and Heath and Bog AVCs all showed a significant decrease in total N concentration
between 1998 and 2007 (Table 45b) There were no significant changes in Upland Woodland Moorland
Grass Mosaic Fertile Grassland or Crops and Weeds The latter contained the smallest soil N concentrations
in 1998 and 2007 (024 N and 023 N respectively) whilst the highest mean concentrations were
measured in Heath and Bog (148 N in 2007) Despite the high mean soil (0 -15 cm) N Heath and Bog
had the lowest total N density (36 tha) reflecting the relatively low bulk density of organic -rich soils Infertile
Grassland contained the largest quantity of soil (0 -15 cm) N (52 tha)
Restricting the analysis to unchanged AVCs removed the Crops and Weeds AVC but for the other AVCs the
results were consistent with those for the dataset as a whole (Table 45c)
Table 45 Change between 1998 and 2007 in N concentration of soils (0-15 cm) and total N density of soils (0-15
cm) in 2007 for Scotland for a) Broad Habitats b) Aggregate Vegetat ion Classes (AVC) c) AVCs unchanged since
1978 and d) LOI categories Arrows denote a significant change (plt005) in the direction shown Diagonal line
indicates too few samples to provide reliable value
a) Scotland ndash Broad Habitat
Broad Habitats Mean Total Nitrogen ( dry wt soil)
Direction of
significant changes
Total Nitrogen
density (tha)
1998 2007 1998 - 2007 2007
Broadleaved Mixed and
Yew Woodland
081 076 40
Coniferous Woodland 111 092 37
Arable and Horticulture 026 026 41
Improved Grassland 045 043 52
Neutral Grassland 052 046 49
Acid Grassland 163 134 46
Bracken
Dwarf Shrub Heath 134 117 42
84
Countryside Survey Soils Report from 2007
4 Total Nitrogen and CN
Fen Marsh and Swamp
Bog 178 158 38
All Habitat Types 112 100 43
b) Scotland ndash AVC whole dataset
Aggregate Vegetation
Class
Mean Total Nitrogen ( dry wt soil) Direction of
significant changes
Total Nitrogen
density (tha)
1998 2007 1998 - 2007 2007
Upland Woodland 082 070 38
Lowland Woodland
Fertile Grassland 040 037 51
Infertile Grassland 064 054 52
Moorland Grass Mosaic 127 112 45
Heath and Bog 172 148 36
Tall Grass and Herb
Crops and Weeds 024 023 42
c) Scotland ndash AVC unchanged
Aggregate Vegetation
Class
Mean Total Nitrogen ( dry wt soil) Direction of
significant changes
Total Nitrogen
density (tha)
1998 2007 1998 - 2007 2007
Upland Woodland 086 075
Lowland Woodland
Fertile Grassland 044 041
Infertile Grassland 063 052
Moorland Grass Mosaic 143 124
Heath and Bog 172 153
Tall Grass and Herb
Crops and Weeds
d) Scotland ndash Loss on Ignition category
LOI category () Mean Total Nitrogen ( dry wt soil)
Direction of
significant changes
Total Nitrogen
density (tha)
1998 2007 1998 - 2007 2007
Mineral (0-8) 027 025 39
Humus-mineral (8-30) 058 053 50
Organo-mineral (30-60) 144 111 45
Organic (60-100) 189 178 36
There was no significant change in soil N concentration of mineral and humus-mineral soils in Scotland
between 1998 and 2007 (Table 45d) Soil N concentration decreased significantly by over 20 in organo-
mineral soils but there was a much smaller (6) significant decrease in organic soils between 1998 and
2007 The highest soil N concentrations in 1998 and 2007 were observed in organic soils (189 N and 178
N respectively) these had the lowest total N density in 2007 (36 tha) Humus-mineral soils contained the
most N (50 tha) in Scotland
85
Countryside Survey Soils Report from 2007
4 Total nitrogen and CN
435 Change in mean total nitrogen concentration in soils (0-15 cm) across Wales
The small number of samples from Wales placed a major restriction on data analysis with only seven
reporting categories having sufficient data to report valid statistics for status and change in soil N
concentration (Table 46) There was no significant change in soil N concentration across Wales as a whole
between 1998 and 2007 (Table 46a) Improved Grassland was the only Broad Habitat to have sufficient data
to provide stock and change statistics in Wales and this showed no significant change in soil N concentration
between 1998 and 2007 Total N density in Improved Grassland in Wales in 2007 (72 tha) was relatively
high compared with other countries and with GB as a whole For Wales as a whole total N density was 61
tha in 2007 which was a comparatively high figure and reflected the pre-dominance in Wales of samples
from Improved Grassland (43 of samples) and the virtual absence of samples from Broad Habitats with
more organic-rich soils which have a lower total N density
Infertile Grassland and Fertile Grassland were the only AVCs in Wales to have sufficient sample points to
provide valid statistics for stock and change (Tables 46 b and 46c) Mean concentrations of total N did not
change significantly between 1998 and 2007 in either AVC The largest total N density was measured in
Fertile Grassland (75 tha) this was the highest value for this AVC of all three countries Restricting the
dataset to unchanged AVCs (Table 46c) reduced the number of reporting categories to Infertile Grass land
and mean soil N concentration did not change between 1998 and 2007
There were no significant changes in mean soil N concentrations in mineral and humus -mineral soils in Wales
between 1998 and 2007 (Table 46d) These were the only soil LOI categories to have sufficient samples to
report status and change Total N densities in 2007 in mineral and humus-mineral soils were 53 tha and 64
tha respectively
Table 46 Change between 1998 and 2007 in N concentration of soils (0-15 cm) and total N density of soils (0-15
cm) in 2007 for Wales for a) Broad Habitats b) Aggregate Vegetation Classes (AVC) c) AVCs unchanged since
1978 and d) LOI categories Absence of arrows denote no significant change (plt005) were observed Diagonal
line indicates too few samples to provide reliable value
a) Wales ndash Broad Habitat
Broad Habitats Mean Total Nitrogen ( dry wt soil)
Direction of
significant changes
Total Nitrogen
density (tha)
1998 2007 1998 - 2007 2007
Broadleaved Mixed and
Yew Woodland
Coniferous Woodland
Arable and Horticulture
Improved Grassland 057 057 72
Neutral Grassland
Acid Grassland
Bracken
Dwarf Shrub Heath
Fen Marsh and Swamp
Bog
All Habitat Types 074 070 61
86
Countryside Survey Soils Report from 2007
4 Total Nitrogen and CN
b) Wales ndash AVC whole dataset
Aggregate Vegetation
Class
Mean Total Nitrogen ( dry wt soil) Direction of
significant changes
Total Nitrogen
density (tha)
1998 2007 1998 - 2007 2007
Upland Woodland
Lowland Woodland
Fertile Grassland 054 056 75
Infertile Grassland 056 055 61
Moorland Grass Mosaic
Heath and Bog
Tall Grass and Herb
Crops and Weeds
c) Wales ndash AVC unchanged
Aggregate Vegetation
Class
Mean Total Nitrogen ( dry wt soil) Direction of
significant changes
Total Nitrogen
density (tha)
1998 2007 1998 - 2007 2007
Upland Woodland
Lowland Woodland
Fertile Grassland
Infertile Grassland 051 051
Moorland Grass Mosaic
Heath and Bog
Tall Grass and Herb
Crops and Weeds
d) Wales ndash Loss on Ignition category
LOI category () Mean Total Nitrogen ( dry wt soil)
Direction of
significant changes
Total Nitrogen
density (tha)
1998 2007 1998 - 2007 2007
Mineral (0-8) 035 035 53
Humus-mineral (8-30) 061 059 64
Organo-mineral (30-60)
Organic (60-100)
87
Countryside Survey Soils Report from 2007
4 Total nitrogen and CN
44 Discussion and Policy Implications
The policy question which led to the inclusion of this parameter in the CS in 2007 was ldquoCan the
eutrophication trend in the countryside be detected in the soil as well as the vegetation using this basic soil
propertyrdquo As there were no significant increases in mean soil N concentration in any reporting category in
GB or in the individual countries between 1998 and 2007 the conclusion must be a negative Instead
significant decreases in soil N concentration were detected for many reporting categories The decreases for
woodlands and semi-natural habitats were generally small (5-10 of 1998 levels) with a maximum of 21 in
Coniferous Woodland In intensively managed soils the question of in terest although not specified would
have been ldquoCan the decline in fertiliser use in improved grassland and cropland be detected in the soil using
this basic soil property ldquo There is not as clear evidence for this as might have been expected with no
change or a small decline (4-7 of 1998 levels) observed
For semi-natural and woodland systems the results imply that sustained levels of atmospheric N deposition
over the decade from 1998 to 2007 have not resulted in measurable increases in soil (0 -15 cm) N
concentration as expected Average inputs across GB are ca 20 kgNhayr which is equivalent to 018tNha
This translates to a potential increase of ca 3-4 in soil nitrogen concentrations (0-15cm) In contrast to the
expected increase in soil N concentration there was a significant decline in many habitats The trend for
increased CN ratios (significant for Coniferous Woodland and Neutral Grassland) indicates that there is
either increased removal of N from the soil by vegetation leaching or gas eous pathways and or greater
inputs and storage of C due to increased plant productivity Change in plant fixation of C and uptake of N
may be driven by the combined and possibly interactive effects of N deposition and climate change on plant
productivity No significant increase in soil (0-15cm) carbon density was observed for any semi-natural
habitat or woodland (Chapter 2) although there were positive trends observed for Acid Grassland Dwarf
Shrub Heath and Bog (Table 25)
For managed grasslands the overall trend is not clear Whilst there was no change over this period in soil (0 -
15cm) nitrogen concentrations for Improved Grassland Broad Habitat there was a significant decline for the
Fertile Grassland AVC for GB No significant change in CN was o bserved for either category The relatively
small signal observed is unexpected as fertiliser application rates to grassland declined dramatically by asymp
40 to 65 kgNha between 1998 and 2007 (BSFP 2008) Taking England as an example combined land use
and fertiliser statistics showed a reduction in total use of N fertilisers between 1998 and 2007 of 33 for
grassland The grassland statistic for England combined the effects of a reduction in application rate (by
c40) and a small (12) increase in land area under grassland (June Agricultural Census data for 1998 and
2007) This result could imply either that livestock farmers are using alternative sour ces of N such as farm
yard manure slurries and other organic waste products to maintain N levels in managed grassland soils or
soil (0-15 cm) N is an insensitive indicator of soil response to changes in fertiliser use
For cropped systems a decline in N and CN ratios was observed suggesting the loss of soil C (0 -15cm)
reported in Chapter 2 is matched by a loss of N (9 and 75 respectively between 1998 and 2007) As there
was only a small decline in N fertiliser application rates to tilled land acro ss GB between 1998 and 2007 (eg
in England 6 drop for tilled land) it is most likely that processes which would remove C and N in equal
proportions may be responsible eg erosion or deep ploughing resulting in lower soil horizons characterised
by lower CN coming to the surface
441 Policy implications
In semi-natural systems the decline in N is contrary to expectations due to the ongoing input of N
atmospheric deposition across the GB landscape at an average of ca 20-30kgNhayr (RoTAP 2010) There
may be either increased removal of N from the soil by vegetation leaching or gaseous pathways and or
greater inputs and storage of C due to increased plant productivity Increased loss of N is known to be linked
to N inputs although evidence for this is currently limited for GB (RoTAP 2010) Change in plant uptake of C
88
Countryside Survey Soils Report from 2007
4 Total Nitrogen and CN
and N may be driven by the combined and possible interactive effects of N deposition and climate change on
plant productivity Increased plant productivity is one of the primary dri vers of vegetation composition change
in semi-natural systems (NEGTAP 2001 RoTAP 2010) This apparent bdquodilution‟ of the N signal in the soil
may also have major implications for current soil and pollution monitoring programmes which rely on the
gross soil measurements such as N and CN to indicate the impact of N deposition in semi -natural systems
A more sensitive indicator of plant available-N such as Mineralisable-N (Chapter 5) may need to be
combined with plant productivity and vegetation composition change in the future Ongoing analysis will help
resolve the links between the changes in the C and N storage rates and the possible underlying drivers
In improved grassland systems the lack of any clear decline in N despite a major reduction in N fe rtiliser
use over the same period suggests farmers are using alternative sources of N such as slurry and other
organic waste solids and or that N is an insensitive indicator of change in fertiliser use If indeed farmers
are continuing to maintain total soil N concentrations in managed grassland whilst reducing use of mineral N
fertiliser this would be a positive outcome as the energy costs associated with mineral fertiliser use will have
been reduced without detriment to soil N status Fertiliser use is one of the indicators used by Defra to gauge
progress in reducing the environmental cost of the food chain under the Sustainable Farming and Food
Strategy N fertiliser has been chosen because N contributes to diffuse pollution and fertiliser production has
a high energy cost However there is a risk that the maintenance of soil N status possibly through other
sources of N may limit the intended benefits of reduced fertiliser use for diffuse pollution control
In cropped soils the loss of soil C (0-15cm) reported in Chapter 2 combined with the reported decline in soil
N concentrations here suggest erosion deep ploughing or increased decomposition may be responsible for
the 7-9 reduction for C and N as there is little change in fertiliser application rates This suggests that
policies in place to protect soils in cropped system may not be adequate
45 References
BSFP 2008 The British Survey of Fertiliser Practice Report for 2008 httpwwwdefragovuk
Emmett BA Frogbrook ZL Chamberlain PM Griffiths R Pickup R Poskitt J Reynolds B Rowe
E Spurgeon D Rowland P Wilson J and Wood CM 2008 CS Technical Report No 307 Soils
Manual NERCCentre for Ecology amp Hydrology 180 pp (CEH Project Number C03259)
Haines-Young RH Barr CJ Black HIJ Briggs DL Bunce RGH Clarke RT Cooper A Dawson
FH Firbank LG Fuller RM Furse MT Gillespie MK Hill R Hornung M Howard DC McCann
T Morecroft MD Petit S Sier ARJ Smart SM Smith GM Stott AP Stuart RC and Watkins
JW 2000 Accounting for nature assessing habitats in the UK countryside Department of the Environment
Transport and the Regions Centre for Ecology and Hydrology 134pp
Smith J Smith P Wattenbach M Zaehle S Hiederer R Jones RJA Montanarella L Rounsevell
MDA Reginster I Ewert F 2005 Projected changes in mineral soil carbon of European croplands and
grasslands 1990-2080 Global Change Biology 11 2141 ndash 2152
89
Countryside Survey Soils Report from 2007
5 Mineralisable-N
Summary
Mineralisable-N stock (kgN ha) in soil (0-15cm) was a sensitive indicator of recognised differences
in nitrogen availability between different vegetation types suggesting it is a promising indicator of
eutrophication of the countryside
Initial investigations testing the link between mineralisable-N and occurrence of plant species in 45
test sites suggests it provides additional information to mean total nitrogen concentration data
(N) possibly linked to short term changes in nitrogen availability or specific vegetation or soil
types
There were strong geographical trends in the proportion of mineralised-N transformed to the mobile
form nitrate which suggest a close relationship to broad-scale climatic or soil parameters
Future analyses will separate out the inherent variability associated with climate vegetation and
soil type to identify spatial patterns which can be linked to atmospheric deposition and changes in
management
51 Policy background
Policy question Can the trend of eutrophication of the countryside be detected in the soil as well as the vegetation using this sensitive soil process method
Measurements Concentrations of ammonium- and nitrate-N in soil (0-15cm) after a standard incubation The
measurement was carried out for the first time in 2007 Soils were collected from plots included in the original
1978 survey Countryside Survey (CS) in 2007 has provided
Whole GB and country-level assessment of soil mineralisable N status in 2007
Explanatory data to contribute to the analysis of other CS datasets such as those describing changes in plant species composition
Data likely to decrease uncertainty in model chains used to predict impacts of N deposition on biodiversity
Changes in plant species composition observed following CS in 1998 have been ascribed to eutrophication
following increased deposition of atmospheric nitrogen (N) compounds (Braithwaite et al 2006 Maskell et al
2010) This eutrophication is unlikely to be closely linked to changes in soil total N and total CN since the
soil N stock is large in relation to annual fluxes and contains much N that is not available to plants The
purpose of the measurement of mineralisable N within CS in 2007 is to develop a simple but robust index of
plant-available N This will help determine causal drivers of change in species composition by linking
measures of soil N status with plant species composition across a wide range of Broad Habitats
geographical locations and soil types Mineralisable N measurements will also be used to improve models of
soil biogeochemistry used at national scale to predict carbon (C) and N cycling and the effects of N pollution
on biodiversity The data will also be useful in identifying one aspect of nutrient cycling at a national scale
between different habitats and the relationship to different drivers Nutrient cycling is one of the ecosystem
supporting services currently under review as part of the National Ecosystem Assessment
Several types of analyses have been proposed to measure plant -available N including measurements of net
N mineralisation flux gross mineralisation flux and proxies such as near-infra-red absorption analysis
Plants are able to take up N even from soils with no net mineralisation flux (eg Dyck et al 1987) due to
interception of available N before it can be re-immobilised Such temporarily-available N pools can be
measured using isotopic dilution or by adsorption onto strong ion-exchange resins but these measurements
probably overestimate plant-available N (Fierer et al 2001) While net mineralisation measurements
90
Countryside Survey Soils Report from 2007
5 Mineralisable-N
underestimate plant-available N in low-N systems particularly where plants take up a substantial proportion
of N in dissolved organic form net N mineralisation remains useful to distinguish soils across a range of N
availability (Schimel and Bennett 2004)
Plant species may vary in their preference for dissolved organic reduced or oxidised N (Miller and Bowman
2003) species typical of infertile habitats are more likely to use dissolved organic N whereas species typical
of fertile habitats are more likely to be adapted for nitrate assimilation Thus while mineralisable N is an index
of plant available-N the two concepts do not correspond directly since some plants use dissolved organic N
directly and also since plants exert some contro l over mineralisation and therefore N availability within the
rhizosphere The relative availability of ammonium and nitrate may be more important than gross fluxes for
explaining species occurrence (Bengtson et al 2006) A measure of net nitrification during incubation was
also included to assess whether this distinguished soil types more clearly and to provide extra information for
plant species occurrence models
Policy decisions concerned with the abatement o f atmospheric emissions of sulphur dioxide and oxidised and
reduced forms of N are currently informed through the critical load approach The general definition of the
critical load is ldquoa quantitative estimate of an exposure to one or more pollutants belo w which significant
harmful effects on specified sensitive elements of the environment do not occur according to present
knowledgerdquo (UNECE 2004) Critical loads for N are calculated using either empirical or steady-state mass
balance approaches (UNECE 2004) Empirical approaches rely on data from experiments with critical loads
for each habitat agreed by consensus at an EUUNECE level However neither of these approaches allows a
timescale of changes to be identified and so dynamic models are being developed to improve forecasting of
both soil and plant species change Hitherto soil total N and total C have been used as the abiotic indicators
of N availability that link biogeochemical and floristic parts of these models These bulk measures only
explain around 60 of the variation in mean Ellenberg N (a floristic indicator of eutrophication) Abiotic
measurement of N status are thought to be the major source of uncertainty in such model chains (Wamelink
et al 2002) A more sensitive measurement of available N is required to provide a better indication of
excessive N deposition and a more accurate predictor of floristic change and improve the accuracy of model
chains used to develop policy in relation to the UNECE process
52 Methods
521 Proof of concept
Net mineralisation flux has generally been measured by comparing the amounts of extractable nitrate and
ammonium before and after a period of incubation using paired soil samples eg (Keeney 1980 Waring and
Bremner 1964) Soil disturbance can change mineralisation and immobilisation rates so methods that keep
the core intact are preferred (Raison et al 1987) However the established method may be unsuitable for
large surveys in which the transit of cores to the laboratory cannot be completely contro lled since
mineralisation in transit is likely to lead to large variation in mineral N contents on arrival at the laboratory
which inevitably increases error in the calculation of net flux For this reason a new method was developed
during the CS in 2007 pilot study in which soils were flushed through with approximately four pore -volumes
of an artificial rain solution to remove any accumulation of mineral N during transit
Water tension during incubation affects the mineralisation rate and nitrification and denitrification fluxes and
hence the ratio of ammonium to nitrate Measuring water tension is time -consuming and so calculating the
amount of water that needs to be added or evaporated to reach a particular proportion of water -holding
capacity for a given soil is not straightforward Instead water tension was standardised to approximately that
at field capacity by applying suction to the saturated soil to drain the larger pores
A pilot study showed that the new mineralisable N measurement greatly improved the prediction of floristic
composition as represented by mean Ellenberg N score (Rowe et al in prep) The method was applied to a
large set of cores taken in CS in 2007 A full description of the m ethod is given in the CS in 2007 Soils
91
Countryside Survey Soils Report from 2007
5 Mineralisable-N
Manual (Emmett et al 2008) Three of the five Main Plots were selected for analysis at random from each of
the original 256 CS squares Access restrictions to some of the CS plots prevented collection of some c ores
and 699 of the planned 768 analyses were carried out
Three metrics were chosen to express measurements of mineral N ie ammonium and nitrate contents The
total mineral N per g soil reflects availability to plants but gives the impression of lar ge available N contents
in organic sols with low bulk density Total mineral N per g organic matter may provide a better index of N
availability since large carbon contents are likely to inhibit the net release of mineral N from organic matter
Nitrate content after incubation is a measure of net nitrification (since N is initially released from organic
matter in reduced forms) To separate this signal from that of overall quantity of mineral N nitrate -N content
was expressed as a proportion of total mineral N
The rationale for including mineralisable N within the CS measurement suite is summarised in Table 51
Table 51 Summary of rationale for measurement of soil mineralisable nitrogen within CS in 2007
Issue Facts Comments History in CS No measurements previously
made Better measure of plant-available N than total or soluble N
Country level reporting No Dataset confined to 1978 CS squares which limits the power of analysis for Country level reporting for habitat vegetation and soil types stratifications
Links and compatibility to other monitoring programmes
No known datasets at national scale
Linked to N storage and turnover hence to water quality and floristic monitoring eg Environmental Change Network
Uniqueness of CS No known datasets at national scale
Only integrated sample which can be linked to vegetation and land management
Value for money (Policy priority or interpretative value x cost)
Medium High policy and interpretative value medium cost
522 Analytical method
An extra soil core was taken in 2007 in addition to those taken in previous surveys for mineralisable N analyses A 15 cm long by 5 cm diameter plastic pipe was knocked into the ground to obtain this core according to the detailed field protocol set out in (Emmett et al 2008 Chapter 1) Once extracted and logged the long white cores were returned by mail to CEH Bangor Cores were stored at 4
oC until a
sufficient number had been received for an analytical batch
The lab protocol is set out in detail in (Emmett et al 2008) In short the plastic sampling pipe was split open
and the intact soil core laid on a perforated rack The core was misted repeatedly with a solution with the
same concentrations of major ions as UK rain in 2007 as estimate d using the FRAME model (except with
zero N concentrations) until approximately 150 ml solution had passed through Suction was applied using a
vacuum line to drain larger pores of solution The core was wrapped in a thin plastic bag to restrict aeration
and incubated for four weeks at 10 oC After the full 4 week incubation period the core was carefully
homogenised and a subsample extracted using a 1-molar solution of potassium chloride (KCl) for analysis of
ammonium and nitrate content Mineralisable N was expressed in mg N kg dry soil
92
Countryside Survey Soils Report from 2007
5 Mineralisable-N
523 Quality assurance
Replicate cores were not available but replicate subsamples were taken after incubation for KCl extraction and analysis from two cores per batch of approximately 30 samples Two standard re ference soils (CEH Bangor Reference Soils 1 and 2) were also analysed per batch Several steps were taken to minimise potential artefacts by standardising sample collection flushing incubation and analysis Initial mineral contents were standardised by f lushing with a minus-N solution A standard amount of solution was passed through each core This took less time for coarse -textured soils than for fine clay and peat soils To standardise temperature conditions during the flushing step all cores were retained in the flushing room at 4
oC for the same length of time
Incubation took place under standard conditions of temperature and aeration and for a standard time
The duplicate analyses undertaken on replicate subsamples were very consistent for nitr ate (R2 = 98 ) but
not as good for ammonium (R2 = 63 ) (Fig 51) Since duplicate samples were only separated during
subsampling after incubation the likely cause of this inconsistency was the incomplete homogenisation of
cores before subsampling The effect was worse for ammonium presumably due to localised production of
ammonium in anaerobic microsites together with lower rates of diffusion for ammonium ions than for the more
weakly-adsorbed nitrate ions
Figure 51 Consistency of ammonium and nitrate analyses between duplicate subsamples
NO3
0
001
002
003
004
005
0 001 002 003 004 005
Duplicate 1 nitrate concentration mg NO3-N
g dry soil
Du
plicate
1 n
itra
te c
on
cen
trati
on
mg
NO
3-N
g
dry
so
il
NH4
0
001
002
003
004
005
0 001 002 003 004 005
Duplicate 2 ammonium concentration mg
NH4-N g dry soil
Du
plicate
1 a
mm
on
ium
co
ncen
trati
on
m
g N
H4-N
g
dry
so
il
Analyses of reference samples showed some variation between batches but there was no evidence of systematic bias (Fig 52) The coefficient of variation (cv) for nitrate was somewhat greater for the low -N BS2 standard (15) than for the high-N BS1 standard (9) The cv for ammonium was similar (12) for the low-N and high-N standards
93
Countryside Survey Soils Report from 2007
5 Mineralisable-N
Figure 52 Nitrate (a amp c) and ammonium (b amp d) contents in high-N (BS1 a amp b) and low-N (BS2 c amp d)
reference soils included with sample batches during CS in 2007 mineralisable N analyses
a) b)
BS1 NO3-N
0
50
100
150
200
250
300
350
400
17607 6807 25907 141107 3108 22208
Date
BS1 NH4-N
0
50
100
150
200
250
17607 6807 25907 141107 3108 22208
Date
c) d)
BS2 NO3-N
0
1
2
3
4
5
6
17607 6807 25907 141107 3108 22208
Date
BS2 NH4-N
0
5
10
15
20
25
30
35
40
45
50
17607 6807 25907 141107 3108 22208
Date
Taken overall the QC data suggest that nitrate-N and total mineral N are more consistent than ammonium -N
524 Reporting
Soil mineralisable N data have been analysed to provide information on the state of mineralisable N in 2007
The data in this Report describe mineralisable N concentration in 2007 in dry soil and in soil organic matter
mineralisable N stock (ie amount per hectare) and nitrate proportion of mineralisable N (all measured in
soil from 0-15 cm depth) categorised by Broad Habitat Aggregate Vegetation Class (AVC) and soil type (LOI
class) Concentrations in organic matter were obtained using the primary loss -on-ignition value recorded for
the plot in 2007 ie from a core taken adjacent to the core used for mineralisable N analyses In summary
reporting categories are defined as
Broad Habitat - The Broad Habitat classification consists of 27 habitats which account for the entire
land surface of Great Britain and the surrounding sea Countryside Survey reports on soils for 10
major terrestrial habitats
Aggregate Vegetation Class (AVC) ndash is a high level grouping of vegetation types produced from a
quantitative hierarchical classification of the different plant species found in the original Countryside
Survey sample plots Loss on ignition (LOI) category ndash soil type based on soil organic matter content defined as mineral (0 -
8 LOI 0-44 g C kg-1
) humus-mineral (8 ndash 30 LOI 44-165 g C kg-1
) organo-mineral (30 ndash 60
LOI 165-330 g C kg-1
) and organic (60 ndash 100 gt 330 g C kg-1
)
94
Countryside Survey Soils Report from 2007
5 Mineralisable-N
Mineralisable N was not measured in previous surveys so no results regarding change can be presented
Log-transformed data were analysed by REML using the mixed models procedure of SAS (SAS Institute
2006) Back-transformed means and standard errors are presented Significant results relate to statistical
significance with their ecological and policy relevance highlighted where appropriate More details can be
found in Emmett et al (2008) Annex F
The data for mineralisable N concentration in soil and in organic matter and for nitrate proportions were
mapped using kriging to interpolate between the Countryside Survey sample points Routine checking of data
for outliers was conducted and the working dataset was transformed using a normal score procedure to
obtain a Gaussian distribution The data were then interpolated on a 1km UK grid using ordinary kriging and
finally the kriged data were back-transformed to produce interpolated maps In addition sequential Gaussian
simulation (SGs) was conducted on the data to obtain the E-type estimate (mean) and the spatial uncertainty
for the data (conditional variance) The coefficient of variation CV (standard devia tion mean) is reported
53 Results
531 Total mineralisable N concentration in soil
The log-average concentration of mineralisable N measured across all British soils was 102 mg N kg dry soil The distributions of mineralisable N concentration by Broad Habitat AVC and LOI class are shown in Fig 53 The greatest concentrations were found in the Lowland Woodland AVC and the aggregation by Broad Habitat suggests that concentrations were high in both Coniferous and BroadleafMixedYew Woodland Similar concentrations were found in the Fertile Grassland and Infertile Grassland AVCs but the greater disaggregation in the Broad Habitat data allows a difference between infertile grassland types to be distinguished with lower concentrations of minera lisable N in Neutral Grassland than in Acid Grassland (P lt 005) There was a clear increase in mineralisable N concentration with the organic matter content of the soil as illustrated by the differences in mean concentration among loss -on-ignition classes
Mean mineralisable N concentrations across all habitat types were not significantly different among England Scotland and Wales Where more than 20 mineralisable N analyses were available for a Broad Habitat within a country mean concentrations were derived (Table 52) Comparisons across countries are only possible for a limited set of Broad Habitats Mineralisable N concentrations were similar ( P gt 005) in England and Scotland for Arable and Horticulture and for Neutral Grassland Concentrations i n Improved Grassland were similar in all three countries
95
Countryside Survey Soils Report from 2007
5 Mineralisable-N
Figure 53 Mean (+- one standard error) mineralisable nitrogen concentration (mg per kg dry soil) in soil (0 -15
cm depth) within a) Broad Habitats b) Aggregate Vegetation Classes and c) Soil Loss-on-ignition categories
across Britain Analyses were on log-transformed data means and error bars back-transformed to the original
scale
a) Broad Habitats b) Aggregate Vegetation Classes
c) LOI categories
96
Countryside Survey Soils Report from 2007
5 Mineralisable-N
Table 52 Mineralisable N concentrations (mg N kg dry soil) in soils (0-15 cm depth) across all habitats and in
selected Broad Habitats in England Scotland and Wales
a) England
Mean total mineralisable N (mg N kg dry
soil)
Broad Habitat 2007
Broadleaved Mixed and Yew Woodland 160
Arable and Horticulture 83
Improved Grassland 101
Neutral Grassland 69
All habitat types 98
b) Scotland
Mean total mineralisable N (mg N kg dry
soil)
Broad Habitat 2007
Coniferous Woodland 127
Arable and Horticulture 108
Improved Grassland 101
Neutral Grassland 85
Acid Grassland 113
Dwarf Shrub Heath 76
Bog 115
All habitat types 104
c) Wales
Mean total mineralisable N (mg N kg dry
soil)
Broad Habitat 2007
Improved Grassland 100
All habitat types 112
97
Countryside Survey Soils Report from 2007
5 Mineralisable-N
532 Total mineralisable N concentration in soil organic matter
The log-average concentration of mineralisable N in organic matter measured across all British soils was 76 mg N kg loss-on-ignition The distributions of mineralisable N concentration in soil organic matter by Broad Habitat Aggregate Vegetation Class and soil loss -on-ignition class are shown in Figure 54 Differences in mineralisable N concentration in organic matter among Broad Habitats Aggregate Vegetation Classes and loss-on-ignition categories are clearly distinguishable compared with differences in concentrations in soil (Fig 54) Mineralisable N concentration in organic matter was greater in habitats with fertiliser inputs andor fast litter turnover (eg Broadleaved Mixed and Yew Woodland and Arable and Horticulture Broad Habitats or Lowland Woodland and Crops and Weeds AVCs) than in habitats receiving little or no fertiliser input and with impeded litter turnover (eg Dwarf Shrub Heath and Bog Broad Habitats or the Heath and Bog AVC) This measurement distinguished mineralisable N concentrations in organic matter in different grassland AVCs with greater concentrations in Fertile Grassland than in Infertile Grassland In contrast to concentration in dry soil the Neutral Grassland Broad Habitat had greater concentrations of mineralisable N in organic matter than did Acid Grassland (P lt 001) Concentrations in organic matter in Neutral Grassland and Improved Grassland Broad Habitats were similar (P gt 001)
Figure 54 Mean (+- one standard error) mineralisable nitrogen concentration in soil organic matter (mg N kg
loss-on-ignition) in soils (0-15 cm depth) within a) Broad Habitats b) Aggregate Vegetation Classes and c) Soil
Loss-on-ignition categories across Britain Analyses were on log-transformed data means and error bars back-
transformed to the original scale
a) Broad Habitats b) Aggregate Vegetation Classes c) LOI categories
98
Countryside Survey Soils Report from 2007
5 Mineralisable-N
Mean mineralisable N concentrations in organic matter across all habitat types were lower in Wales than in England (P lt 005) and lower in Scotland than in Wales (P lt 005) Where more than 20 mineralisable N analyses were available for a Broad Habitat within a country mean conce ntrations were derived (Table 53) Comparisons across countries are only possible for a limited set of Broad Habitats As with concentrations in soil mineralisable N concentrations in organic matter were similar ( P gt 005) in England and Scotland for Arable and Horticulture and for Neutral Grassland and concentrations in Improved Grassland were similar (P gt 005) in all three countries
Table 53 Mineralisable N concentrations in soil organic matter (mg kg loss-on-ignition) in soils (0-15 cm
depth) across all habitats and in selected Broad Habitats in England Scotland and Wales
a) England
Mean total mineralisable N (mg N kg loss-
on-ignition)
Broad Habitat 2007
Broadleaved Mixed and Yew Woodland 1491
Arable and Horticulture 1893
Improved Grassland 1181
Neutral Grassland 860
All habitat types 1265
b) Scotland
Mean total mineralisable N (mg N kg loss-
on-ignition)
Broad Habitat 2007
Dwarf Shrub Heath 156
Bog 160
Coniferous Woodland 580
Arable and Horticulture 1974
Improved Grassland 1214
Neutral Grassland 1007
Acid Grassland 275
All habitat types 412
c) Wales
Mean total mineralisable N (mg N kg loss-
on-ignition)
Broad Habitat 2007
Improved Grassland 1105
All habitat types 914
99
Countryside Survey Soils Report from 2007
5 Mineralisable-N
533 Total mineralisable N stock
The log-average mineralisable N stock measured across all British soils was 88 kg ha
-1 in 0-15 cm depth
soil The distributions mineralisable N stock by Broad Habitat Aggregate Vegetation Class and soil loss -on-ignition class are shown in Figure 55 The measurement distinguished soils and habitats that are considered fertile from those considered infertile more clearly than mineralisable N concentrations in soil and arguably more clearly than mineralisable N concentrations in soil organic matter Broad Habitats such as Arable and Horticulture and Improved Grassland had consistently large mineralisable N stocks and Bog and Dwarf Shrub Heath had consistently large stocks but the stocks in Fen Marsh and Swamp Broad Habitats were more variable Coniferous and Broadleaf Mixed and Yew Woodland Broad Habitats had similar mineralisable N stocks but the Lowland Woodland AVC had significantly greater stocks than the Upland Woodland AVC Mineralisable N stocks were similar in the 0-8 and 8-30 loss-on-ignition categories but smaller in the 30-60 loss-on-ignition category (P lt 005) and still smaller in the 60-100 loss-on-ignition category (P lt 005)
Figure 55 Mean (+- one standard error) stock of total mineralisable nitrogen (kg N ha-1) in the top 15 cm of
soil within a) Broad Habitats b) Aggregate Vegetation Classes and c) Soil Loss -on-ignition categories across
Britain
a) Broad Habitats b) Aggregate Vegetation Classes c) LOI categories
Mean mineralisable N stocks in 0-15 cm depth soil across all habitat types were lower in Scotland than in England or Wales (P lt 005) Where more than 20 mineralisable N analyses were available for a Broad Habitat within a country mean concentrations were derived (Table 54) As with concentrations in soil and in
100
Countryside Survey Soils Report from 2007
5 Mineralisable-N
soil organic matter mineralisable N stocks were similar (P gt 005) in England and Scotland for Arable and Horticulture and for Neutral Grassland and stocks in Improved Grassland were simi lar (P gt 005) in all three countries Table 54 Mean (+- one standard error) stock of total mineralisable nitrogen (kg N ha-1) in the top 15 cm of soil
across all habitats and in selected Broad Habitats in England Scotland and Wales
a) England
Mean total mineralisable N stock
(kg N ha in 0-15 cm soil)
Broad Habitat 2007
Broadleaved Mixed and Yew Woodland 187
Arable and Horticulture 153
Improved Grassland 146
Neutral Grassland 101
All habitat types 137
b) Scotland
Mean total mineralisable N stock
(kg N ha in 0-15 cm soil)
Broad Habitat 2007
Coniferous Woodland 72
Arable and Horticulture 172
Improved Grassland 143
Neutral Grassland 111
Acid Grassland 39
Dwarf Shrub Heath 26
Bog 22
All habitat types 52
c) Wales
Mean total mineralisable N stock
(kg N ha in 0-15 cm soil)
Broad Habitat 2007
Improved Grassland 140
All habitat types 114
534 Nitrate proportion of mineralisable N
The mean proportion of nitrate in total mineralisable N measured across all British soils was 052 g NO3-N g
-1
total mineralisable N and there was considerable variation in nitrate proportion among Broad Habitats Aggregate Vegetation Classes and soil loss-on-ignition classes (Fig 56) There was no overall correlation of nitrate proportion with mineral N concentration in soil (P gt 005) but nitrate proportion was correlated with mineral N concentration in soil organic matter (c = 039 P lt 005) The pattern of mean nitrate proportion among vegetation and soil classes was similar to the pattern of mineral N concentration in soil organic
101
Countryside Survey Soils Report from 2007
5 Mineralisable-N
matter with the greatest proportions of nitrate in the Arable and Horticulture Broad Habitat and the Crops and Weeds AVC and small nitrate proportions in less fertile habitats such as B og Acid Grassland and Dwarf Shrub Heath The nitrate proportion could also be clearly related to soil organic matter content with the lowest nitrate proportion in the soil category with greatest loss -on-ignition
Figure 56 Mean (+- one standard error) nitrate proportion of total mineralisable nitrogen in soils (0 -15 cm
depth) within a) Broad Habitats b) Aggregate Vegetation Classes and c) Soil Loss -on-ignition categories
across Britain
a) Broad Habitats b) Aggregate Vegetation Classes c) LOI categories
Mean nitrate proportions across all habitat types were similar in England and Wales ( P gt 005) and lower in Scotland than in either country (P lt 005) (Table 55) Where more than 20 mineralisable N analyses were available for a Broad Habitat within a country mean concentrations were derived Comparisons across countries are only possible for a limited set of Broad Habitats As with total mineralisable N concentrations in soil and in organic matter nitrate proportions were similar (P gt 005) in England and Scotland for Arable and Horticulture and for Neutral Grassland and nitrate proportions in Improved Grassland were similar ( P gt 005) in all three countries
102
Countryside Survey Soils Report from 2007
5 Mineralisable-N
Table 55 Nitrate proportion of total mineralisable nitrogen in soils (0-15 cm depth) across all habitats and in
selected Broad Habitats in England Scotland and Wales
a) England
Mean nitrate proportion of mineralisable N
Broad Habitat 2007
Broadleaved Mixed and Yew Woodland 067
Arable and Horticulture 087
Improved Grassland 068
Neutral Grassland 054
All habitat types 069
b) Scotland
Mean nitrate proportion of mineralisable N
Broad Habitat 2007
Coniferous Woodland 030
Arable and Horticulture 088
Improved Grassland 060
Neutral Grassland 050
Acid Grassland 011
Dwarf Shrub Heath 031
Bog 019
All habitat types 037
c) Wales
Mean nitrate proportion of mineralisable N
Broad Habitat 2007
Improved Grassland 057
All habitat types 057
535 Spatial distributions of measured properties
High concentrations of mineralisable N in soil were found in several areas of Britain (Fig 571a amp b) This pattern is difficult to interpret but is perhaps due to the combined effects of greater organic matter conte nts in some areas (and hence a greater total N pool some of which is available for mineralisation) and a history of greater N deposition in the same or other areas By contrast high concentrations of mineralisable N in organic matter (Fig 572a amp b) appear more related to management practices and concentrations of N deposition in particular in areas with more mineral soils There was less small-scale variation in the proportion of nitrate in mineralisable N (Fig 573a amp b) with low proportions in the north and west of Scotland and greater proportions in eastern Britain in particular in central England suggesting links to spatial drivers at large scale such as soil moisture deficit soil pH andor N fertiliser application rate
103
Countryside Survey Soils Report from 2007
5 Mineralisable-N
Figure 57 Maps of a) kriged values and b) coefficients of variation for 1) total mineralisable N (mg N kg-1
soil)
2) total mineralisable N concentration in organic matter (mg N kg-1
loss-on-ignition) and 3) nitrate proportion of
total mineralisable N
a) b)
1)
2)
3)
104
Countryside Survey Soils Report from 2007
5 Mineralisable-N
536 Mineralisable N as an indicator of floristic change
To assess the effectiveness of mineralisable N data as an indicator of eutrophication it will be necessary to analyse the data in relation to other soil measurements and species occurrence data which is beyond the scope of this report Some results are presented here from a pilot study conducted in 2006 as a trial of the mineralisable N method for CS in 2007 All UK plant species have been assigned ldquoEllenberg Nrdquo scores which indicate whether they are likely to occur on high- or low-fertility sites A key test of potential soil indicators of eutrophication is whether they are associated with mean Ellenberg N score A PCA plot of results from the pilot study (Fig 58) demonstrates clearly that mean Ellenberg N is most closely associated with bulk soil properties ndash for example the vector for Ellenberg N has a small angle with NC ratio The position of the NC ratio vector opposite that for moisture shows that these are strongly b ut inversely related This reflects the overall tendency for low-fertility plant communities to occur on organic soils with low NC ratios and high moisture contents The explanatory power of mineralisable N is also considerable as shown by the length of this vector and its position shows that the variation explained by mineralisable N is orthogonal to that explained by total soil NC In other words mineralisable N describes variation in mean Ellenberg N that is not explained by bulk soil properties implying that it is detecting a shorter -term enrichment signal or different soil or vegetation types This is borne out by the considerable increase in proportion of the variance in Ellenberg N that is explained by moving from a regression model using only m oisture content (R
2 = 50) to a
model using both moisture content and mineralisable N (R2 = 70) (Rowe et al in prep Emmett et al 2008)
Figure 58 Ordination of measurements from the Countryside Survey pilot study in 2006 on first and second
principal components of the variation EllenbergN = mean fertility indicator score for plant species present
Nminpot = total N mineralised during a four-week incubation NC = total soil N total soil C pH = soil pH in
water Moisture = g water g-1
fresh soil
-03 -02 -01 00 01 02 03
-03
-02
-01
00
01
02
03
PC1
PC
2
1
2
3
4
5
6
7
8
9
10
11
12
13
14
15
16
17
18
19
20
21
22
2324
25
26
27
28
29
30
31
32
33
34
35
36 37
38
39
40
4142
4344
45
-5 0 5
-50
5
EllenbergN
Nminpot
NC
pH
Moisture
105
Countryside Survey Soils Report from 2007
5 Mineralisable-N
54 Discussion
Net N mineralisation and nitrification result directly in increased exposure of plants to N and increased N
leaching so the mineralisable N results are indicators of N pollution pressure in the sense of a direct cause
of loss of biodiversity and of water quality The results also provide indicators of the state of the soil
ecosystem in that net N mineralisation is likely to increase as the capacity of the soil organic matter pool to
buffer N pollution is depleted These indicators wil l be useful to discriminate which components of the loss of
biodiversity and water quality are due to N pollution The results will also be used to improve understanding
of soil and vegetation processes in particular habitats and improve models of water q uality and biodiversity
change Measurements at a single point in time do not allow direct assessments of change in mineralisable N
or nitrate proportion but a repetition of the measurements would provide evidence for increased damage or
recovery from N pollution The measurements also enable some assessment of nutrient cycling in different
ecosystems as required for the National Ecosystem Assessment It should be noted that an increase in
mineralisable-N would be considered a negative indicator for semi-natural ecosystems and a positive
indicator for intensively managed productive systems
The different measurements included in CS in 2007 allow a choice of the variable used to express mineralisable N Total mineralisable N concentrations in soil are re lated to the quantity of the substrate so mineralisable N concentration in soil is most clearly related to organic matter content (Fig 53) The high mineralisable N concentrations in soil in the Lowland Woodland AVC may be explained in that Lowland Woodland tends to occur on mineral soils but could also be the result of increased interception of N pollutants by woodland or alternatively a greater proportion of labile N in woodland plant litter Mineralisable N concentration in organic matter is more directly relevant to underlying processes since the N available per unit carbon reflects the value of the organic matter as a source of N for decomposers Indeed this variable appears to more clearly reflect the overall fertility of habitats with large concentrations in the Arable and Horticulture and Improved Grassland Broad Habitats as well as in Broadleaved Mixed and Yew Woodland This reflects the improved quality of the soil organic matter due to fertilisation tillage and presence of crops with high litter quality and confirms the sensitivity of the assay to known differences in soil nitrogen availability for plants In contrast to mineralisable N concentration in soil there was a clear lower concentration in organic matter on more organic soils which reflects the known increase in N limitation as soils become more organic Thus whilst Broad Habitats such as Bog and Dwarf Shrub Heath are associated with high soil organic matter contents they are generally N-limited as this organic matter contains relatively little net mineralisable N
The stock of mineralisable N (ie the amount in a given volume of soil) also clearly reflected the overall
fertility of habitats Unlike concentrations in soil or in soil organic matter which are more relevant for mineral
and organic soils respectively stock is a measure of mineralisable N within a consistent soil volume This
reflects N availability within the rooting zone and so more closely represents plant -available N across a
variety of habitats
To establish evidence of change in mineralisable N and thus of deposition -driven changes in soil processes likely to affect plant species composition it will be necessary to analyse these data in combination with a range of external datasets such as pollutant load grazing pressure climate drivers which may affect the spatial trends observed This work is ongoing and will be reported in the CS Integrated Assessment report later in 2010
The proportion of nitrate in mineralisable N is known to be affected by aer ation during the incubation The
texture of the soil on fine scales (eg clay silt and sand fractions or degree of humification of organic
matter) and medium scales (eg porosity and aggregation) will affect the diffusion of air into the soil core
Both organic and mineral soils can vary considerably in porosity and hence the increase in nitrate proportion
with decreasing organic matter content cannot be clearly related to soil texture effects Nitrification rates may
also indicate the size of the nitr ifying bacteria population and hence greater nitrate proportions may be
related to a history of elevated N inputs The clear spatial effect on nitrate proportion (Fig 56) implies that
large scale drivers affect nitrate proportion more than soil texture which varies at a smaller scale These
106
Countryside Survey Soils Report from 2007
5 Mineralisable-N
large scale drivers may include climate pollutant load soil pH and N fertiliser application rate which all vary
from NW to SE Britain in ways that are consistent with the spatial pattern of nitrate proportion Fur ther
analyses of nitrate proportion in relation to site-specific total N deposition history loads of pollutant and
fertiliser NOx and NHy and soil and habitat properties will provide more insights into the processes governing
nitrate proportion and will be reported in the Integrated Assessment These analyses will also inform whether
nitrate proportion is of value as a pressure or state indicator
As well as aiding the development of understanding and models of biogeochemical processes the
mineralisable N results will be useful to explain patterns of floristic change Results from the CS in 2007 pilot
study indicate that mineralisable N explains changes in plant species composition (specifically mean
Ellenberg N score) that cannot be explained by bulk soil properties such as total N or CN ratio (Fig 57)
This will considerably reduce uncertainty in model chains used by the UNECE -CCE to predict floristic change
resulting from N deposition The result is consistent with the understanding from soil proc ess ecology that a
large and habitat-specific fraction of the soil N pool is effectively inert with plant N supply being governed by
the turnover of the more labile organic matter pools The nitrate proportion in mineralisable N may also be a
useful predictor of floristic change (Diekmann and Falkengren-Grerup 1998) for example because plants
typical of lower-fertility habitats are not adapted for nitrate uptake
In conclusion the new measurements of mineralisable N provide a wealth of information useful for
developing science and policy around the ecosystem impacts of N pollution The measurements define a
fraction of the soil N pool that is available to be taken up by plants efficiently andor leached and thus
provide a sensitive indicator of N pollution and ecosystem saturation Soils buffer N pollution particularly
when CN ratios are high and there are large stocks of labile C so N pollutant loads cannot be directly
related to impacts relevant to water quality and biodiversity conservation objectives The measurements will
provide test data for biophysical models of soil change and will also allow improved paramet erisation of
models predicting plant species occurrence and biodiversity change Mineralisable N measurements will
decrease uncertainty associated with linking these two classes of models and thus improve predictions of
biodiversity responses to N pollutant load Future analyses will separate out the inherent variability
associated with climate vegetation and soil type to identify spatial patterns which can be linked to
atmospheric deposition and changes in management
55 Policy Implications
The new national scale mineralisable N measurements will allow
Separation of the effects of N pollution on biodiversity and water quality from effects of other drivers
Assessment of the relative impact of N deposition on different soils and habitats
Improved forecasts of changes in water quality and biodiversity in relation to N deposition rate for use in calculating critical loads under the UNECE Convention on Long -Range Transboundary Air Pollution (CLRTAP)
107
Countryside Survey Soils Report from 2007
5 Mineralisable-N
56 References
Bengtson P Falkengren-Grerup U Bengtsson G 2006 Spatial distributions of plants and gross N
transformation rates in a forest soil Journal of Ecology 94 754-764
Braithwaite ME Ellis RW Preston CD 2006 Change in the British Flora 1987-2004 Botanical Society
of the British Isles
Diekmann M Falkengren-Grerup U 1998 A new species index for forest vascular plants development of
functional indices based on mineralization rates of various forms of soil nitrogen Journal of Ecology 86 269-
283
Dyck W Mees C Hodgkiss P 1987 Nitrogen availability and comparison to uptake in two New Zealand
Pinus radiata forests New Zealand Journal of Forest Science 17 338ndash352
Emmett BA Frogbrook ZL Chamberlain PM Griffiths R Pickup R Poskitt J Reynolds B Rowe
E Spurgeon D Rowland P Wilson J Wood CM 2008 CS Technical Report No 307 Soils Manual
NERCCentre for Ecology amp Hydrology 180 pp (CEH Project Number C03259)
Fierer N Schimel J Cates R Zou J 2001 The influence of balsam poplar tannin fractions on carbon
and nitrogen dynamics in Alaskan taiga floodplain soils Soil Biology and Biochemistry 33 1827ndash1839
Keeney DR 1980 Prediction of soil nitrogen availability in forest ecosy stems a review Forest Science
26 159-171
Maskell LC Smart SM Bullock JM Thompson K Stevens CJ 2010 Nitrogen deposition causes
widespread loss of species richness in British habitats Global Change Biology 16 671ndash679
Miller AE Bowman WD 2003 Alpine plants show species-level differences in the uptake of organic and
inorganic nitrogen Plant and Soil 250 283-292
Raison RJ Connell MJ Khanna PK 1987 Methodology for studying fluxes of soil mineral -N in situ
Soil Biology amp Biochemistry 19 521-530
Rowe EC Emmett BA Smart SM Frogbrook ZL in prep A single -extraction mineralisable nitrogen
assay improves predictions of floristic composition Journal of Vegetation Science
SAS Institute 2006 SAS Enterprise Guide 41
Schimel JP Bennett J 2004 Nitrogen mineralization Challenges of a changing paradigm Ecology 85
591-602
UNECE 2004 The condition of forests in Europe 2004 executive report 51 pp
Wamelink GWW Joosten V van Dobben HF Berendse F 2002 Validity of Ellenberg indicator values
judged from physico-chemical field measurements Journal of Vegetation Science 13 269-278
Waring SA Bremner JM 1964 Ammonium production in soil under waterlogged con ditions as an index of
nitrogen availability Nature 104 951-952
108
Countryside Survey Soils Report from 2007
6 Olsen-P
Summary
Mean Olsen-P concentrations in soil (0-15cm) is an index of the fertility of agricultural soils It‟s
use and relevance in semi-natural and organic soils is less certain Soils collected during
Countryside Survey in 1998 and 2007 indicated there had been a significant decrease in Olsen -P
concentrations in soil (0-15cm) in most Broad Habitats or Aggregate Vegetation Classes across
Great Britain and within individual countries
Olsen-P concentrations in soil (0-15cm) decreased significantly in all soil organic matter categories
across Great Britain and within individual countries between 1998 and 2007 apart from humus -
mineral soils in Scotland where no change was observed
The data do not confirm a trend of increasing P status in intensive grasslands or any other habitat
soils (0-15cm) but indicate a loss of available phosphorus between 1998 and 2007 across a wide
range of habitats and soil types This is likely to be linked to the large reductions in phosphorus
fertiliser use over the same period
61 Introduction
Key question Can the trend of increasing P status in intensive grasslands be confirmed and is it matched in
other habitats
Measurements Repeat measurement of Olsen-P concentrations in soils (0-15 cm) from all plots sampled in
1998
Olsen-P (Olsen et al 1954) has been widely used in England and Wales to assess the fertility of agricultural
soils (MAFF 2000) It was also measured as an integral part of several natio nal soil monitoring schemes
including the Representative Soil Sampling Scheme (RSSS Archer et al 2003) the National Soil Inventory
(NSI McGrath and Loveland 1992) the Environmental Change Network (ECN Morecroft et al 2009) and the
Soil Geochemical Atlas of Northern Ireland (Emmett et al 2008) Olsen-P has also been used in conjunction
with the phosphorus sorption index to provide an index of the leaching risk of dissolved P from soils to
freshwaters (Hughes et al 2001) In the UK Olsen-P has been recommended as an indicator for
environmental interactions between the soil and other linked ecosystems such as freshwaters (Black et al
2008)
Olsen-P was measured in soils taken from the 256 bdquosoil squares‟ during CS in 1998 but the samples were not
analysed until 2002 or reported in the Monitoring and Assessing Soil Quality (MASQ) report (Black et al
2000) although they are held on the CS databaseThe data were not included in the Defra funded study
which examined the comparability of soil properties measured by different surveys and monitoring schemes
where it was erroneously reported that total -P was measured in CS in 1998 (Bradley et al 2003)
611 Choice of Olsen-P in 2007
A wide range of extractants have been used to measure the more soluble weakly bound or bdquoavailable‟ forms
of phosphorus in soils Some of the more commonly used extractants include 1 citric acid 25 acetic
acid dilute buffered sulphuric acid (Truog‟s reagent) acetic acid -sodium acetate buffer (Morgan‟s reagent)
and sodium bicarbonate buffered at pH 85 (Olsen-P) There has been a long standing debate as to the most
appropriate measure of soil available-P in relation to soil type Olsen-P has been favoured for limed fertilised
agricultural soils and semi-natural ecosystems on base rich or circum-neutral soils whilst acid extractions are
considered to be more appropriate for the more acidic soils found in many semi -natural and woodland
ecosystems Numerous studies have compared the performance of the different test s with each other with
plant response and with other factors (see eg Allen 1989 Foy et al 1997 and discussion in Emmett et al
109
Countryside Survey Soils Report from 2007
6 Olsen-P
2008) The evidence so far from these and other studies reported in the literature suggests that it is unlikely
that a simple robust relationship can be established between Olsen-P and other extractants A study
comparing Olsen-P data from two different surveys the Representative Soil Sampling Scheme (RSSS) and
the National Soil Inventory (NSI) concluded that where the same analytical method had been used the data
for phosphorus were entirely comparable (Bradley et al 2003)
The literature indicates that no one extractant is ideal for use across the range of soil fertility and pH
gradients encountered in Countryside Survey Thus one option considered for CS in 2007 was to use more
than one extractant with the choice being determined by the characteristics of each soil sample For example
an acid extractant for semi-natural acidic low fertility soils and Olsen-P for more base-rich fertile soils This
would have made the data very hard to interpret particularly in relation to changes since CS in 1998 and for
those soils with bdquointermediate‟ characteristics where the choice of extractant was not clear Furthermore to
maximise the use of pre-existing 1998 data it would be hard to justify using another extractant even though
Olsen-P might not be ideal across the range of soil conditions encountered in Countryside Survey Bearing
these factors in mind the decision was made to measure Olsen-P in 2007
612 Deliverables for 2007
CS in 2007 has provided the following deliverables
Whole GB and country-level assessment of soil available-P status in 2007
GB-level assessment of change in soil available-P status between Countryside Survey in 1998 and
Countryside Survey in 2007
Explanatory data to contribute to the analysis of other Countryside Survey datasets such as those
describing changes in vegetation species and the trophic status of freshwaters
The Olsen-P data collected in 2007 can also contribute to the assessment of Broad and Priority Habitat
condition in relation to soil fertility and the data will provide a baseline assessment for a recommended UK
soil indicator The rationale for including Olsen-P within the Countryside Survey measurement suite is
summarised in Table 61
Table 61 Rationale for measurement Olsen-P
Issue Facts Comments
History in Countryside Survey Olsen-P measured on samples from 256 squares in CS in 1998
Olsen-P used as a measure of available-P
Links and compatibility to other monitoring programmes
NSI and RSSS used Olsen-P as a measure of available-P to the same depth (0-15 cm) as Countryside Survey
Defra project SP0515 concluded that measurements were comparable between NSI and RSSS
Uniqueness of CS There was a partial resurvey of the NSI in 2003 RSSS has data reported to 2001 Soil pH was measured at many ECN sites in 1998 and 2003 Unique combination of soil vegetation amp land use measured together
High interpretative value for i) terrestrial vegetation species change in response to fertility in combination with soil nitrogen ii) trophic status of linked freshwaters
Value for money (Policy priority or interpretative value X cost)
Recommended UK soil indicator for environmental interaction cheap simple measurement High value for money
Measurement will be made on bdquoblack core‟ soil sample used for pH amp LOI core measurements
110
Countryside Survey Soils Report from 2007
6 Olsen-P
So far measures of soil available-P have not been included in models exploring the relationships between
vegetation species change recorded in CS in 1998 and soil nitrogen enrichment through atmospheric nitrogen
deposition However soil-P data are likely to have strong interpretative power in the analysis of model
simulations and predictions
62 Methods
The soil used for phosphorus analysis was taken from the bdquoblack core‟ and there were n o specific sampling
requirements beyond those normally employed for collecting the bdquoblack core‟ sample (See Chapter 1 amp
Emmett et al 2008 Annex 1)
A total of 1054 black cores were collected from the 5 Main Plots in the original 256 ldquosoilrdquo squares Air -dried
and sieved samples (lt2 mm) were analysed for Olsen-P at CEH in Lancaster in the autumn of 2008 following
the standard operating procedure (Emmett et al 2008) This involved extraction of 5 g of air-dried sieved
soil with 100 ml of 05M sodium bicarbonate at pH 85 The phosphorus in the extract was determined
colorimetrically using a continuous flow analyser The analyser method used molybdenum blue at 880nm with
the addition of a dialysis step to overcome the effect of the Olsen‟s reagent
Olsen-P is expressed in mgPkg dry soil Samples collected from 1998 were analysed in 2002 and those
from 2007 in 2008
621 Quality Assurance and Quality Control
The DefraNERCBBSRC Joint Codes of Practice were followed
A number of factors can contribute to errors in the analysis of Olsen -P and steps were taken to minimise
potential artefacts
Effect of drying ndash drying soil affects the release of phosphorus with enhancements of up to 30 possible
from drying at 40 ordmC (Jackson 1958) The effect varies with soil type (Allen 1989) If field moist soil is
used larger quantities are recommended for the extraction (10 g to 100 ml for mineral soil and up to 25 g
to 100 ml for peats Allen 1989) Methodological consistency is very important Since the Olsen -P
measurements made on 1998 soils used air -dried soils the same procedure was used in 2007
Extraction temperature ndash the extraction is temperature sensitive and must be performed under constant
temperature conditions Extraction procedure and conditions were matched to those used for the analysis
of 1998 soils
Soilsolution ratio and extraction time ndash these may affect the amount of phosphorus extracted and a
consistent method should be employed The same standard operating procedure was used in 1998 and
2007
Effect of organic matter ndash the high pH of the Olsen-P extraction means that some organic matter is also
extracted Organic phosphorus is not measured by the molybenum blue method The wavelength used for
the molybdenum blue determination (880 nm) is a long way from any likely interference effects from
extracted humic acids
111
Countryside Survey Soils Report from 2007
6 Olsen-P
A replicate analysis two standard reference soils and one certified reference soil were ana lysed per batch of
25 samples The same standard reference soils were used in the analysis of samples from 1998 and 2007
providing a check on the consistency of the analyses between the two surveys
The results from the standard reference soils are summarised in Fig 61 Fig 62 and Table 62 For SR2
and SR3 the data show the expected variation around the mean value (Fig 61) A simple t-test showed that
the mean value of SR2 in 2008 (146 mgPkg) was significantly higher (plt0001) compared to the mean in
2002 (128 mgP kg) there was no significant difference between the mean values for SR3 Fewer values
outside the limits on the Shewhart charts and smaller coefficients of variation (Table 62) indicate that the
results for both standard reference soi ls were more consistent in 2008 compared to 2002
Figure 61 Shewhart Quality Control charts for CEH standard reference soils SR2 and SR3 analysed
with sample batches from CS in 1998 and 2007
SR3 - QC chartMean 184 mgP kg
-1 limits +- 2SD of mean
0
5
10
15
20
25
30
M11
675
M11
726
M11
735
M11
755
M11
799
M11
807
M11
813
M11
814
M12
269
EF67
1
EE71
6
EE85
2
EE86
0
EF00
1
EF77
0
Analytical batch number
Ols
en
-P m
gP
kg
-1
CS2000 data CS2007 data Mean Upper limit Lower limit
SR2 - QC chartMean 137 mgP kg
-1 limits +- 2SD of mean
0
5
10
15
20
25
30
M11
675
M11
726
M11
735
M11
755
M11
800
M11
808
M11
813
M11
841
M12
174
EF22
1
EE71
4
EE85
0
EE85
8
EE86
6
EF00
7
EF79
4
Analytical batch number
Ols
en
-P m
gP
kg
-1
CS2000 data CS2007 data Mean Upper limit Lower limit
1998
2007
1998
2000
112
Countryside Survey Soils Report from 2007
6 Olsen-P
Table 62 Mean values (mgPkg) and coefficients of variation (CV ) for the standard reference soils
analysed with samples from CS in 1998 and 2007
Standard reference soil SR2 SR3 ISE921
Mean 1998 (CV) 128 (24) 186 (17) 1055 (10)
Mean 2007 (CV) 146 (13) 177 (13) 1208 (2)
The mean and median values for the standard reference soil (Fig 62) are those obtained from data
submitted by all the laboratories participating in the scheme Unfortunately there is a limited stock of this
material at CEH Lancaster so that only four samples were analysed with the 2008 batches The Shewhart
chart (Fig 62) shows some expected variation but 84 of the points lie within the limit values The four
points at the end of the chart were produced during the 2008 analyses and are within the range of results
obtained in 2002 The 2008 mean value is somewhat higher (Table 62) but as only four samples of ISE921
were analysed with the 2008 batches this result must be interpreted with care
Figure 62 Shewhart QC chart for ISE standard reference soil ISE921 analysed with sample batches
from CS in 1998 and Countryside Survey 2007
The duplicate analyses undertaken within sample batches in 2002 and 2008 were very consistent with most
points falling on or close to the 11 line (Fig 63) The mean difference between duplicates was small in 2002
(-01 mgP g) and 2008 (06 mgPkg) Differences between duplicates were larger for samples with high
concentrations of Olsen-P
Taken overall the Quality Control data show strong consistency within and between the measurements made
in 2002 and 2008 and give little cause for concern regarding a comparison of Olsen -P data from 1998 and
2007 There is a suggestion that the results for the standard reference soils were m ore consistent in 2008
with higher mean values The values obtained in 2008 generally fall within the range measured in 2002 and
within acceptable limits on the Shewhart charts
ISE921 - QC chartISE median value 104 mgP kg
-1 Mean 107 mgP kg
-1 limits +- 2SD of mean
60
70
80
90
100
110
120
130
140
M11
678
M11
724R
M11
736
M11
750
M11
755
M11
776
M11
799
M11
802
M11
806
M11
737
M11
814
M11
776R
M11
816
M11
831
M11
867
M12
227
M12
269
EF28
9
EE80
3-4
Analytical batch number
Ols
en
-P
mg
P k
g-1
CS2000 CS2007 Median Mean Upper limit Lower limit1998
2007
113
Countryside Survey Soils Report from 2007
6 Olsen-P
Figure 63 Scatter plot of duplicate Olsen-P analyses from sample batches analysed in 2002 and 2008
622 Reporting
Soil Olsen-P data (0-15 cm) have been analysed to provide information on the state of Olsen -P in 2007 and
the change since 1998 The statistical approach used for analysing the data fo r change involved
bootstrapping which allows for non-normality in the data without the necessity of knowing details of the actual
distribution As such it provides a more accurate measurement of significance Annex F of Emmett et al
(2008) provides a background document describing this approach
The data in this report describe mean Olsen-P concentrations in soils (0-15 cm) in 2007 and change since
1998 by Broad Habitat Aggregate Vegetation Class (AVC) and Loss-on-Ignition (LOI) category LOI classes
are defined as mineral (0-44 g C kg-1
) humus-mineral (44-165 g C kg-1
) organo-mineral (165-330 g C kg-1
)
and organic (gt 330 g C kg-1
) To remove the effects of large-scale vegetation and or land use change mean
Olsen-P concentrations have also been estimated for plots where the AVC has not changed over time The
AVC is only known for the survey years and may change during intervening periods for example due to
arable-grassland rotation The plots where the AVC has not changed can be regarded as plots wh ere the
vegetation has been largely consistent in 1978 1998 and 2007
The soil Olsen-P concentrations were mapped using indicator kriging to interpolate between the Countryside
Survey sample points The use of indicator kriging rather than ordinary krig ing and spatial interpolation
arises because of the type of data being analyzed In the case of Olsen -P the assumption of connectivity
between sample points with extreme values in space is not valid For instance fertilizer applications in one
location may have no spatial link to those in another As a result ordinary kriging incorporating these
extreme values provides erroneous interpolation biased towards these extreme values Indicator kriging
provides a method of spatially interpreting the underlying patterns in the data without such a bias
interpolating the probability that the data falls above or below a given threshold Semi -variogram analysis
revealed a low level of spatial structure strongest at the threshold level of 18mgkg Full indicator k riging
0
40
80
120
160
200
0 40 80 120 160 200
Duplicate 1 Olsen-P mgP kg-1
Du
plicate
2 O
lsen
-P m
gP
kg
-1
CS2000 CS2007 1 1 line 1998
2007
114
Countryside Survey Soils Report from 2007
6 Olsen-P
was used to interpolate the probability of exceeding this threshold A probability of 1 or above indicates that
the data exceeds the specified threshold value at that location Data was interpolated onto a 1 km UK grid
63 Results
631 Structure of Olsen-P data
Olsen-P was measured in samples from 1068 plots in 2007 of which 65 were also sampled in 1998
Concentrations of Olsen-P measured in soils (0-15 cm) in 2007 ranged between 2 and 380 mgPkg Between
1998 and 2007 the proportion of samples containing 40 mgPkg Olsen-P or less increased from 64 to 76
whilst the proportion samples with greater than 80 mgPkg decreased from 12 to 75 Overall there was
evidence of a downward shift in Olsen-P concentrations across the entire range of values between 1998 and
2007 (Fig 64) The population of values in 1998 and 2007 was highly skewed There were no clear
relationships between change in Olsen-P concentration and 2007 values for soil pH LOI moisture content or
change in soil pH and LOI between 1998 and 2007
632 Change in mean Olsen-P concentration in soils (0-15cm) across Great Britain
The mean Olsen-P concentration in soil (0-15cm) across all Broad Habitat types in Great Britain decreased
from 43 mgPkg to 32 mgPkg or by 26 between 1998 and 2007 (Table 63a) This change was evident in
all individual Broad Habitats except Bracken (Fig 65) The magnitude of change varied between Broad
Habitats with the smallest significant decrease (11) measured in Arable which also had the hig hest mean
concentration of Olsen-P in 2007 (44 mgPkg) The biggest percentage decrease between the surveys (58)
occurred in Dwarf Shrub Heath which also contained the highest mean concentration of Olsen -P (56 mgPkg)
in 1998 The lowest mean concentration of Olsen-P (13 mgPkg) which did not change significantly between
surveys was measured in soils (0-15cm) beneath Bracken
There was a significant decrease in mean Olsen-P concentration between 1998 and 2007 across all AVCs
except for Lowland Woodland (Table 63b) The largest percentage decrease in mean values (51) was
observed in Moorland Grass Mosaics Heath and Bog had the highest mean concentration of Olsen -P in 1998
(52 mgPkg) Crops and Weeds showed the smallest percentage change between surve ys in Olsen-P (11)
this AVC had the highest mean Olsen-P concentration in 2007 (44 mgPkg)
115
Countryside Survey Soils Report from 2007
6 Olsen-P
Figure 64 Distribution of soil Olsen-P (0-15 cm) measurements a) Histogram for 1998 and 2007 b)
Cumulative frequency for 1998 and 2007 Histogram frequencies normalised to percentage of total
number of samples analysed in each survey
0
10
20
30
0 40 80 120 160 200 240 280 320 360
Olsen-P mgPkg
Fre
qu
en
cy
1998 2007
a)
0
25
50
75
100
0 50 100 150 200 250 300 350 400
Olsen-P mgPkg
Cu
mu
lati
ve f
req
ue
nc
y
1998 2007
b)
116
Countryside Survey Soils Report from 2007
6 Olsen-P
Table 63 Change in mean Olsen-P concentration of soils (0-15 cm) across Great Britain for a) Broad
Habitats b) Aggregate Vegetation Classes (AVC) c) AVCs unchanged since 1978 and d) LOI
categories Arrows denote a significant change (plt005) in the direction shown
a) Great Britain - Broad Habitat
Broad Habitats
Mean Olsen-P (mgPkg) Direction of significant
changes
1998 2007 1998 - 2007
Broadleaved Mixed and
Yew Woodland
404 238
Coniferous Woodland 364 274
Arable and Horticulture 496 442
Improved Grassland 405 329
Neutral Grassland 306 245
Acid Grassland 464 211
Bracken 173 130
Dwarf Shrub Heath 560 236
Fen Marsh Swamp 275 194
Bog 533 384
All Habitat Types 428 318
b) Great Britain ndash AVC whole dataset
Aggregate Vegetation
Class
Mean Olsen-P (mgPkg) Direction of significant
changes
1998 2007 1998 - 2007
Upland Woodland 296 182
Lowland Woodland 247 295
Fertile Grassland 426 335
Infertile Grassland 301 210
Moorland Grass Mosaic 495 242
Heath and Bog 521 333
Tall Grass and Herb 449 322
Crops and Weeds 494 442
) Great Britain ndash AVC unchanged
Aggregate Vegetation
Class
Mean Olsen-P (mgPkg) Direction of significant
changes
1998 2007 1998 - 2007
Upland Woodland 319 183
Lowland Woodland 206 270
Fertile Grassland 438 347
Infertile Grassland 261 173
Moorland Grass Mosaic 590 267
Heath and Bog 471 318
Tall Grass and Herb 424 294
Crops and Weeds 499 438
117
Countryside Survey Soils Report from 2007
6 Olsen-P
d) Great Britain ndash Loss on Ignition Category
LOI Category () Mean Olsen-P (mgPkg) Direction of significant
changes
1998 2007 1998 - 2007
Mineral (0-8) 405 339
Humus-mineral (8-30) 329 241
Organo-mineral (30-60) 409 194
Organic (60-100) 630 441
The mean Olsen-P concentrations in soils (0-15 cm) for plots in which the AVC did not change (Table 63c)
were broadly consistent with the dataset as a whole (Table 63b) The exception was Tall Grass and Herb
where no significant change in mean Olsen-P was observed for plots with consistent AVCs between surveys
(Table 64b) This suggests that some of the change in Olsen-P observed for this AVC in the dataset as a
whole may have arisen because of a change in land use between the surveys
Figure 65 Change in mean Olsen-P concentration within Broad Habitats in Great Britain between
1998 and 2007
-60
-40
-20
0
20
Bro
adle
aved
Woodla
nd
Conife
rous
Woodla
nd
Ara
ble
Impro
ved G
rass
Neu
tral
Gra
ss
Aci
d Gra
ss
Bra
cken
Dwar
f Shru
b Hea
th
Fen M
arsh
Swam
p
Bog
Ch
an
ge
in
Ols
en
-P (
mg
kg
)
Mean Olsen-P concentrations decreased significantly across all LOI categories (Table 63d) with the largest
change observed in organo-mineral soils where mean Olsen-P declined by nearly 50 In both surveys the
highest mean Olsen-P concentrations were observed in organic soils reflecting the high mean concentrations
measured in Broad Habitats and AVCs with organic -rich soils (Dwarf Shrub Heath and Bog Broad Habitats
Moorland Grass Mosaic and Heath and Bog AVCs
632 Change in mean Olsen-P concentration in soils (0-15cm) across England
Olsen-P was measured only on the Main Plots within the original 256 squares sampled in 1978 giving a
maximum potential sample number of 1281 of which 1068 were sampled in 2007 and 943 in 1998 For this
reason sample numbers decline rapidly in country-level data analysis A minimum cut-off of 20 samples was
applied for country-level analysis of Olsen-P by Broad Habitat AVC and LOI Category As a result there are
several gaps in the analysis missing values in the tables are signifi ed by a diagonal line across the cell
118
Countryside Survey Soils Report from 2007
6 Olsen-P
There was a significant (16) decrease in mean Olsen-P for the All Broad Habitats category in England
between 1998 and 2007 (Table 64) this was the smallest overall change observed amongst the three
countries Arable soils (0-15 cm) contained the highest mean concentrations of Olsen-P in England 1998
(454 mgPkg) and 2007 (418 mgPkg) and there was a small (8) but significant decrease between the two
surveys Mean Olsen-P concentrations in soils (0-15 cm) beneath Improved Grassland and Neutral Grassland
in England were very similar in 2007 (asymp 26 mgPkg) following significant decreases from levels observed in
1998 (Table 64)
Table 64 Change in mean Olsen-P concentration of soils (0-15 cm) across England for a) Broad
Habitats b) Aggregate Vegetation Classes (AVC) c) AVCs unchanged since 1978 and d) LOI
categories Arrows denote a significant change (plt005) in the direction shown Diagonal line
indicates too few samples to provide reliable value
a) England - Broad Habitat
Broad Habitats
Mean Olsen-P (mgPkg) Direction of significant
changes
1998 2007 1998 - 2007
Broadleaved Mixed and
Yew Woodland
338 269
Coniferous Woodland
Arable and Horticulture 454 418
Improved Grassland 332 260
Neutral Grassland 347 263
Acid Grassland 412
Bracken
Dwarf Shrub Heath
Fen Marsh Swamp
Bog
All Habitat Types 396 332
b) England ndash AVC whole dataset
Aggregate Vegetation
Class
Mean Olsen-P (mgPkg) Direction of significant
changes
1998 2007 1998 - 2007
Upland Woodland
Lowland Woodland 248 272
Fertile Grassland 403 320
Infertile Grassland 273 171
Moorland Grass Mosaic
Heath and Bog
Tall Grass and Herb 423 330
Crops and Weeds 454 413
119
Countryside Survey Soils Report from 2007
6 Olsen-P
c) England ndash AVC unchanged
Aggregate Vegetation
Class
Mean Olsen-P (mgPkg) Direction of significant
changes
1998 2007 1998 - 2007
Upland Woodland
Lowland Woodland
Fertile Grassland 401 323
Infertile Grassland 262 156
Moorland Grass Mosaic
Heath and Bog
Tall Grass and Herb
Crops and Weeds 472 427
d) England ndash Loss on Ignition Category
LOI Category () Mean Olsen-P (mgPkg) Direction of significant
changes
1998 2007 1998 - 2007
Mineral (0-8) 394 342
Humus-mineral (8-30) 346 244
Organo-mineral (30-60) 360 239
Organic (60-100)
There were insufficient samples in 2007 in the Acid Grassland Broad Habitat to make a valid estimate of the
mean No significant change was observed in mean Olsen-P beneath Broadleaved Mixed and Yew Woodland
Broad Habitat in England between 1998 and 2007
There were significant decreases in mean Olsen-P in the Fertile Grassland and Infertile Grassland AVCs in
England between 1998 and 2007 (Table 64b) Of the AVCs with sufficient data to provide a valid estimate of
the mean the highest mean concentrations in 1998 and 2007 were observed in Crops and Weeds
Restricting the analysis to plots where AVC remained unchanged resulted in only three AVCs having
sufficient samples for statistically valid estimates of the mean (Table 64c) Mean values for Infertile
Grassland Fertile Grassland and Crops and Weeds for the unchanged dataset were very similar to those for
the dataset as a whole There were significant decreases in mean Olsen -P in Infertile Grassland and Crops
and Weeds between 1998 and 2007 in the unchanged dataset
Mean Olsen-P decreased significantly in all three LOI categories in England between 1998 and 2007 (Table
64d) The smallest change (13) was observed in mineral soils and the largest in organo-mineral soils
(39) As a result in 2007 humus-mineral and organo-mineral soils had virtually the same mean Olsen-P
concentrations (asymp 24 mgPkg) which were approximately 10 mgPkg less than for mineral soils This
represented an increase in the relative difference in mean Olsen -P between mineral soils and the other
categories compared to 1998
633 Change in mean Olsen-P concentration in soils (0-15cm) across Scotland
In 1998 and 2007 Arable and Horticulture (69 mgPkg and 52 mgPkg) and Improved Grassland (59 mgPkg
and 56 mgPkg) Broad Habitats in Scotland had the highest mean Olsen -P concentrations amongst the three
countries There was a 25 decrease in mean Olsen-P in Scottish Arable soils (0-15 cm) between 1998 and
2007 but no significant change was observed for Improved Grassland (Table 65a) There was a significant
120
Countryside Survey Soils Report from 2007
6 Olsen-P
decrease in mean Olsen-P in semi-natural grassland Broad Habitats in Scotland Scottish Broadleaf
Woodland soils (0-15 cm) had a much higher mean Olsen-P value (51 mgPkg) in 1998 compared to England
(34 mgPkg) but too few samples were taken to provide a reliable estimate of the mean for Scotland in 2007
Upland Woodland Infertile Grassland Moorland Grass Mosaic and Heath and Bog AVCs in Scotland all
showed a significant decrease in mean Olsen-P concentration between 1998 and 2007 (Table 65b) There
were no significant changes in Fertile Grassland or Crops and Weeds The latter contained the largest mean
concentration of Olsen-P in 2007 (50 mgPkg) and AVCs in Scotland were more enriched in Olsen -P
compared to the equivalents in England and Wales Restricting the analysis to unchanged AVCs removed th e
Upland Woodland AVC but for other AVCs results were consistent with those for the dataset as a whole
(Table 65c)
Table 65 Change in mean Olsen-P concentration of soils (0-15 cm) across Scotland for a) Broad
Habitats b) Aggregate Vegetation Classes (AVC) c) AVCs unchanged since 1978 and d) LOI
categories Arrows denote a significant change (plt005) in the direction shown Diagonal line
indicates too few samples to provide reliable value
a) Scotland - Broad Habitat
Broad Habitats
Mean Olsen-P (mgPkg) Direction of significant
changes
1998 2007 1998 - 2007
Broadleaved Mixed and
Yew Woodland
509
Coniferous Woodland 399 295
Arable and Horticulture 689 516
Improved Grassland 591 562
Neutral Grassland 284 249
Acid Grassland 486 215
Bracken
Dwarf Shrub Heath 646 249
Fen Marsh Swamp
Bog 544 365
All Habitat Types 491 328
b) Scotland ndash AVC whole dataset
Aggregate Vegetation
Class
Mean Olsen-P (mgPkg) Direction of significant
changes
1998 2007 1998 - 2007
All Woodland
Upland Woodland 290 219
Lowland Woodland
Fertile Grassland 485 404
Infertile Grassland 362 318
Moorland Grass Mosaic 533 228
Heath and Bog 548 339
Tall Grass and Herb
Crops and Weeds 609 495
121
Countryside Survey Soils Report from 2007
6 Olsen-P
c) Scotland ndash AVC unchanged
Aggregate Vegetation
Class
Mean Olsen-P (mgPkg) Direction of significant
changes
1998 2007 1998 - 2007
All Woodland
Upland Woodland
Lowland Woodland
Fertile Grassland 482 422
Infertile Grassland 302 240
Moorland Grass Mosaic 656 289
Heath and Bog 463 295
Tall Grass and Herb
Crops and Weeds
d) Scotland ndash Loss on Ignition Category
LOI Category () Mean Olsen-P (mgPkg) Direction of significant
changes
1998 2007 1998 - 2007
Mineral (0-8) 477 383
Humus-mineral (8-30) 315 262
Organo-mineral (30-60) 442 181
Organic (60-100) 616 406
The mean Olsen-P concentration in Scottish mineral soils decreased significantly between 1998 and 2007
but there was no significant change observed for humus-mineral soils (Table 65d) Organic soils in Scotland
had a very high mean Olsen-P concentration in 1998 (62 mgPkg) which decreased significantly in 2007 to 41
mgPkg Mean Olsen-P concentrations in organo-mineral soils decreased significantly by more than 60
between 1998 and 2007
634 Change in mean Olsen-P concentration in soils (0-15cm) across Wales
The small number of samples from Wales placed a major restriction on data analysis with only four reporting
categories having sufficient data to provide valid statistics for status and change in Olsen -P (Table 66) The
largest percentage change (41) in the All Broad Habitats category was observed in Wales between 1998
and 2007 reflecting the large significant decrease (47) in mean Olsen-P in the Improved Grassland Broad
Habitat Much of the Improved Grassland in Wales is located on humus -mineral soils which largely accounts
for the significant decrease in Olsen-P between 1998 and 2007 Infertile Grassland was the only AVC in
Wales to have sufficient sample points to provide valid statistics for stock and change (Tables 66b and
66c) Mean concentrations of Olsen-P in this AVC decreased significantly between 1998 and 2007 with or
without changed AVC
122
Countryside Survey Soils Report from 2007
6 Olsen-P
Table 66 Change in mean Olsen-P concentration of soils (0-15 cm) across Wales for a) Broad
Habitats b) Aggregate Vegetation Classes (AVC) c) AVCs unchanged since 1978 and d) LOI
categories Arrows denote a significant change (plt005) in the direction shown Diagonal line
indicates too few samples to provide reliable value
a) Wales - Broad Habitat
Broad Habitats
Mean Olsen-P (mgPkg) Direction of significant
changes
1998 2007 1998 - 2007
Broadleaved Mixed and
Yew Woodland
Coniferous Woodland
Arable and Horticulture
Improved Grassland 408 215
Neutral Grassland
Acid Grassland
Bracken
Dwarf Shrub Heath
Fen Marsh Swamp
Bog
All Habitat Types 323 189
b) Wales ndash AVC whole dataset
Aggregate Vegetation
Class
Mean Olsen-P (mgPkg) Direction of significant
changes
1998 2007 1998 - 2007
Upland Woodland
Lowland Woodland
Fertile Grassland
Infertile Grassland 214 143
Moorland Grass Mosaic
Heath and Bog
Tall Grass and Herb
Crops and Weeds
c) Wales ndash AVC unchanged
Aggregate Vegetation
Class
Mean Olsen-P (mgPkg) Direction of significant
changes
1998 2007 1998 - 2007
Upland Woodland
Lowland Woodland
Fertile Grassland
Infertile Grassland 183 116
Moorland Grass Mosaic
Heath and Bog
Tall Grass and Herb
Crops and Weeds
123
Countryside Survey Soils Report from 2007
6 Olsen-P
d) Wales ndash Loss on Ignition Category
LOI Category () Mean Olsen-P (mgPkg) Direction of significant
changes
1998 2007 1998 - 2007
Mineral (0-8)
Humus-mineral (8-30) 309 174
Organo-mineral (30-60)
Organic (60-100)
64 Discussion and Policy Implications
The results from Countryside Survey in 2007 show a significant decrease between 1998 and 2007 in mean
Olsen-P concentrations in soils (0-15 cm) for most Broad Habitats AVCs and LOI categories across Great
Britain Mean Olsen-P has remained unchanged in a few Broad Habitats and AVCs but no increases in mean
Olsen-P have been observed Changes in mean Olsen-P concentrations in Broad Habitats within individual
countries between 1998 and 2007 reflect this pattern
These results raise the question as to whether the changes observed between 1998 and 2007 are real or an
artefact of field sampling and chemical analysis and whether the Countryside Survey data are consistent with
those from other monitoring schemes It is difficult to compare with results from other surveys due to the
common use of mgl for monitoring agricultural soils compared to mgkg in CS
The same sampling protocol was used in 1998 and 2007 but two important potential sou rces of sampling
variability can be identified The first of these arises because of the strong vertical gradient in Olsen-P
concentration encountered in many soils under different vegetation types (see for example Table 67 and
Fig 66) The highest Olsen-P concentrations are generally encountered in the surface soil layers (0 -5 cm)
which must be sampled consistently in repeat surveys if change is to be assessed accurately A consistent
failure to identify and sample the true soil surface layer could sig nificantly bias results between surveys
Table 67 Vertical distribution of Olsen-P (mgPkg) in a) brown earth soil beneath neutral grassland at
the Snowdon ECN site and b) stagnogley soil beneath improved grassland at Pontbren
Snowdon ECN site Pontbren (CEH unpublished data)
Olsen-P mgPkg Olsen-P mgPkg
Depth cm Mean Std Dev Depth cm Mean Std Dev
0-5 274 223 2-5 234 40
5-10 163 112 5-15 104 25
10-20 78 25 15-30 56 26
20-30 53 10 30-60 33 16
124
Countryside Survey Soils Report from 2007
6 Olsen-P
Figure 66 Vertical distribution of Olsen-P (mgPkg) in three blocks of farm woodland on stagnogley
soils at Pontbren (CEH unpublished data)
A second source of error which affects all analytes arises because re -sampling in each Main Plot does not
occur at exactly the same spot The cores in 1998 and 2007 were taken from points located 2 -3 m apart from
permanently marked locations (Chapter 1) This will introduce random variability into the data due to small
scale heterogeneity in soil properties alongside any surveyor error in re-locating the plots The size of the
effect is unknown but is unlikely to have caused systematic bias between the surveys and there is
significantly less potential for relocation error in CS relative to NSI where no permanen t markers are used
The quality of the chemical analyses for 1998 and 2007 has been discussed in Section 621 Taken overall
the Quality Control data show strong consistency within and between the measurements made in 2002 and
2008 and give little cause for concern regarding a comparison of Olsen-P data from 1998 and 2007
Countryside Survey Olsen-P data are broadly consistent with results from other surveys and monitoring sites
(Tables 68 and 69) Fixed depth sampling at the ECN sites does not include 0-15 cm depth but the data
broadly confirm values measured by Countryside Survey The ECN data further illustrate the strong vertical
gradient in Olsen-P concentrations across a range of land use and habitat types
Table 68 Olsen-P concentrations measured in Arable and Improved Grassland in the National Soil
Inventory in 1980 and 1996 from Bradley et al (2003)
Broad Habitat Olsen-P mgPkg
NSI 1980 (0-15 cm)
Olsen-P mgPkg
NSI 1996 (0-15 cm)
Arable 330 428
Improved
Grassland
227 229
00 100 200 300 400 500
2-5
5-15
15-30
30-60
60-90
De
pth
be
low
su
rfa
ce
(c
m)
Olsen-P (mgPkg)
Cae Draens Tyn-y-Fron Pant Powsi
125
Countryside Survey Soils Report from 2007
6 Olsen-P
Table 610 Olsen-P concentrations measured at two depths in soils at selected Environmental Change
Network sites Samples were not collected at 0-15 cm depth at the ECN sites
ECN site name Land use Olsen-P mgPkg
0-5 cm depth
Olsen-P mgPkg
5-10 cm depth
Drayton Permanent pasture 937 416
North Wyke Permanent pasture 673 357
Snowdon Upland grassland 274 163
Wytham Deciduous woodland 227 114
Alice Holt Oak woodland 135 65
Figure 67 Map of probability of 2007 Olsen-P concentration being greater than 18 mgPkg Probability
scale between zero and one
Analysis of the 2007 Olsen-P data revealed very little spatial structure which is reflected in the map which
predicts the probability on exceeding the threshold o f 18mgPkg on a scale from zero to one a value of one
indicating the threshold has been exceeded (Fig 67) Visual inspection of the mapped data for Olsen-P from
the NSI (McGrath and Loveland 1992) showed a broad separation in Olsen -P concentrations between areas
of managed agricultural land in central southern and eastern England and those under semi -natural
vegetation and forest mainly in the north and west Within the areas of managed land there was a wide range
of concentrations with large differences in values between adjacent NSI mapping units Probability maps for
Olsen-P from the RSSS (Baxter et al 2006) show some limited correspondence between the map for the
2001 RSSS data and Countryside Survey It is important to remember the differences in sampling strategy
and survey design when comparing the data from these three surveys but it is generally apparent that there
are no strong spatial patterns in Olsen-P concentrations
126
Countryside Survey Soils Report from 2007
6 Olsen-P
Assuming that the Countryside Survey data from 1998 and 2007 provide va lid estimates of Olsen-P across
Great Britain a number of hypotheses can be invoked to account for the decrease observed over the nine
year period These are briefly discussed below as detailed exploration is beyond the scope of this Report
Reduction in external inputs of phosphorus- Data on fertiliser use compiled as a core indicator
under the Defra Sustainable Farming and Food Strategy showed a 53 decline in the total use of phosphate
fertiliser between 1984 and 2007 in England Across Great Britain application rates of phosphate (P2O5) to
tillage crops decreased from 51 kgha to 32 kgha and to grass from 21 kgha to 14 kgha between 1998 and
2007 (BSFP 2008) The figures for 2007 correspond to the lowest application rates since statistics were firs t
compiled in 1983 and presumably reflect changes in agricultural management in response to environmental
and economic pressures (Baxter et al 2006)
Taking England as an example combining application rates with agricultural land area data from the Jun e
Agricultural Survey showed a large decline in phosphate use Total application of phosphate in England in
2007 was 123 kT P2O5 to tilled land and 48 kT to grassland compared with 209 kT and 72 kT respectively for
1998 Soil phosphorus status in enclosed agricultural land will also be influenced by more subtle changes in
crop and livestock management and by changes in the type of fertiliser used Oliver et al (2006) commenting
on the decrease in Olsen-P observed in the RSSS between 1971 and 2001 attribu ted the decline to a steady
reduction in phosphorus fertiliser inputs but also noted that for grassland there had been a progressive shift
away from insoluble forms of phosphorus fertiliser such as rock phosphate to more water soluble materials
Deeper ploughing will also bring subsoil with a relatively low phosphorus status to the surface This would
dilute the existing topsoil phosphorus stock unless fertiliser was added
The amount of phosphorus deposited annually across Great Britain from the atmospher e is poorly quantified
with a recent estimate for the United Kingdom of 03 kgPhayr (White 2006) Phosphorus concentrations in
rain are low and the main vector is dry deposition of dust As far as can be ascertained there are no data to
describe trends in atmospheric phosphorus inputs to Great Britain over time Use of clean -up technology for
sulphur emissions from coal burning may have led to a decline in phosphorus emissions with a knock on
effect on atmospheric deposition A reduction in mineral ferti liser use would also reduce the amount of
particulate phosphorus in the atmosphere derived from re-suspended soil The quantities of phosphorus
deposited on semi-natural systems are likely to be relatively small but there is little information as to how
they compare to inputs from sources such as mineral weathering
Effect of atmospheric nitrogen deposition- A number of studies have reported that non-
agricultural ecosystems in Great Britain could be moving towards phosphorus limitation in response to
increased availability of nitrogen from atmospheric deposition In moorland vegetation high foliar NP ratios
have been correlated positively with nitrogen deposition (Kirkham 2001) On the Carneddau in Wales
montane heath vegetation had relatively high foliar NP ratios compared with similar systems receiving less
atmospheric nitrogen deposition in Scotland (Britton et al 2005) Both studies have been cited as examples
of potential phosphorus limitation In contrast Rowe et al (2007) reported that foliar NP ratios in Calluna
collected during 1998 decreased with nitrogen deposition They suggested that enzyme production or
mycorrizal activity may have allowed Calluna to access additional soil phosphorus resources In upland
plantation Sitka spruce forests root bioassay techniques have shown increased phosphorus demand in older
crops where excess nitrogen was leached as nitrate in soil and stream waters (Harrison et al 1995) The
authors inferred that supplies of available phosphorus in soils may have lim ited the ability of older trees to
utilise incoming atmospheric nitrogen Phosphorus deficiency has also been reported in Dutch forests
receiving large amounts of nitrogen deposition probably because of soil acidification (Mohren et al 1986)
The overall implication of these studies is that sustained levels of atmospheric nitrogen deposition may have
increased plant demand on soil phosphorus resources In the soil this may have decreased the size of the
labile phosphorus pool (as measured by Olsen-P) at a time when external sources of phosphorus may also
have declined
127
Countryside Survey Soils Report from 2007
6 Olsen-P
Effects of pH change on phosphorus binding capacity in soils ndash The chemistry of
phosphorus in soils is complex and pH dependent through a number of processes related to the clay mineral
content and presence of sesquioxides and exchangeable aluminium in the soil In fertilised alkaline soils or
calcareous soils phosphorus availability is greatest between pH 6 and pH 7 As pH in these soils increases
above about pH 65 phosphate solubility decreases rapidly with the formation of insoluble calcium salts
which contribute to the unavailable or non-labile soil phosphorus pool In acid mineral soils phosphate ions
combine readily with iron and aluminium to form insoluble compounds whilst fixati on by hydrous iron and
aluminium oxides and clay minerals can sequester large amounts of phosphorus As pH increases so does
the solubility of basic iron and aluminium phosphates (solubility minima between pH 3 and 4) and some of the
fixed phosphorus will also be released resulting in a maximum pool of readily available phosphorus at soil
pH values between 6 and 65 (Brady 1974)
Soil pH increased significantly across many Broad Habitats AVCs and soil LOI categories between 1998 and
2007 In the Broad Habitats and AVCs representative of managed agricultural land mean soil pH across
Great Britain was well above pH 6 and was over pH 7 in the Arable and Horticultural Broad Habitat and Crops
and Weeds AVC in 2007 If calcium was abundant in these soils th e high pH values would favour the
formation of insoluble salts and may reduce the pool of more labile phosphorus In many of the Broad
Habitats and AVCs which would typically have more acid mineral soils (eg Acid Grassland Broad Habitat
Moorland Grass Mosaic AVC) soil pH did not increase significantly between 1998 and 2007 and mean
values were typically around pH 45 In this pH range the relatively available pool of soil phosphorus would
still be small compared with that fixed by hydrous oxides of ir on and aluminium or held in precipitates
Sustained atmospheric nitrogen deposition may have increased plant demand on this pool particularly in
systems where grazing or other forms of biomass harvesting result in nutrient removal from the site
65 References
Allen SE (ed) 1989 Chemical analysis of ecological materials Blackwell Scientific Publications Oxford
368 pp
Archer J Oliver M and Baxter S 2003 Review of the Representative Soil Sampling Scheme (RSSS) Final
report to Defra John Archer Consulting and Department of Soil Science University of Reading
Baxter SJ Oliver MA and Archer JR 2006 The Representative Soil Sampling Scheme of England and
Wales the spatial variation of topsoil nutrient status and pH between 1971 and 2001 Soil Use and
Management 22 383-392
Black HIJ et al 2000 MASQ Monitoring and assessing soil quality in Great Britain Countryside Survey
Module 6 Soils and Pollution RampD technical Report E1-063TR Environment Agency Bristol
Black H Bellamy P Creamer R Elston D Emmett B Frogbrook Z Hudson G Jordan C Lark M
Lilly A Marchant B Plum S Potts J Reynolds B Thompson R and Booth P 2008 Design and
operation of a UK soil monitoring network Contract Report Environmental Agency ISBN 978-1-84432-936-
6
Bradley RI Bellamy PH Loveland PJ Black HIJ Hornung M Scott A Lane A Webb J
Jackson DR 2003 Comparability of soil properties derived from different data sources Defra project code
SP0515
Brady NC 1974 The Nature and Properties of Soils 8th
Edition Macmillan Publishing New York
Britton AJ Pearce ISK and Jones B 2005 Impacts of grazing on montane heath vegetation in Wales
and implications for the restoration of montane areas Biological Conservation 125 515-524
BSFP 2008 The British Survey of Fertiliser Practice Report for 2008 wwwdefragovuk
128
Countryside Survey Soils Report from 2007
6 Olsen-P
Emmett BA Black HIJ Bradley RI Elston D Reynolds B Creamer R Frogbrook ZL Hudson G
Jordan C Lilly A Moffat A Potts J Vanguelova E 2006 National soil monitoring network Review and
assessment study Final Report Project LQ09 SNIFFER Edinburgh
Emmett BA Frogbrook ZL Chamberlain PM Griffiths R Pickup R Poskitt J Reynolds B Rowe
E Spurgeon D Rowland P Wilson J Wood CM 2008 CS Technical Report No 307 Soils Manual
NERCCentre for Ecology amp Hydrology 180 pp (CEH Project Number C03259)
Foy RH Tunney H Carroll MJ Byrne E Gately T Bailey JS Lennox SD 1997 A comparison of
Olsen and Morgan soil phosphorus test results from the cross -border region of Ireland Irish Journal of
Agricultural and Food Research 36 185-193
Harrison AF Stevens PA Dighton J Quarmby C Dickinson AL Jopnes HE Howard DM 1995
The critical load of nitrogen for Sitka spruce forests on stagnopodsols in Wales Role of nutrient limitations
Forest Ecology and Management 76 139-148
Hughes S Reynolds B Bell SA Gardner C 2000 Simple phosphorus saturation index to estimate risk
of dissolved P in runoff from arable soils Soil Use and Management 16 206-210
Jackson ML 1958 Soil Chemical Analysis Prentice Hall London
Kirkham FW 2001 Nitrogen uptake and nutrient limitation in six hill moorland species in relation to
atmospheric nitrogen deposition in England and Wales Journal of Ecology 89 1041-1053
MAFF 2000 Fertilser recommendations for agricultural and horticultu ral crops (RB209) Seventh Edition The
Stationery Office 177pp
McGrath SP Loveland PJ 1992 The Soil Geochemical Atlas of England and Wales Blackie Academic
and Professional
Mohren GMJ van den Berg J Burger FW 1986 Phosphorus defic iency induced by nitrogen input in
Douglas fir in the Netherlands Plant and Soil 95 191-200
Morecroft MD Bealey CE Beaumont DA Benham S Brooks DR Burt TP Critchley CNR Dick
J Littlewood NA Monteith DT Scott WA Smith RI Walmsley C Watson H The UK Environmental
Change Network Emerging trends in the composition of plant and animal communities and the physical
environment Biological Conservation 142 2814-2832
Oliver MA Archer JR Baxter SJ Todd AD Skinner RJ 2006 The Representative Soil Sampling
Scheme of England and Wales a statistical analysis of topsoil nutrient status and pH between 1971 and
2001 Soil Use and Management 22 372-382
Olsen SR Cole CV Watanabe FS Dean LA 1954 Estimation of available phosphorus in soils by
extraction with sodium bicarbonate United States Department of Agriculture Washington DC Circular No
939 19pp
Rowe EC Smart SM Kennedy VH Emmett BA Evans CD 2008 Nitrogen deposition increases the
acquisition of phosphorus and potassium by heather Calluna Vulgaris Environmental Pollution 155 201-207
White RE 2006 Principles and Practice of Soil Science Fourth Edition Blackwell Publishing Oxford
129
Countryside Survey Soils Report from 2007
7 Soil metal concentrations
Summary
A comparison of back corrected Countryside Survey soils (0-15cm) analyses for 1998 and 2007
samples indicated that as would be expected only relative small changes in soil trace metal
concentrations occurred between surveys despite reported declines in atmospheric deposition due
to the long residence time of metals in soils
Of seven metals for which repeat measurement were made during the 2007 survey only for one Cu
was a statistically significant difference in soil (0-15cm) concentrations (an increase) found at the
GB level
When the data for repeat metal measurements were stratified by Broad Habitat Aggregate
Vegetation Class and soil organic matter category further statistically significant differences were
seen For Cu generally significant increases were observed whilst for two metals Cd and Pb
changes were small and idiosyncratic between stratifications For three metals Cr Ni Zn changes
were generally characterised by reduction in crop lands and no change or slight increases in less
managed habitats
For some metals such as Cu and Cd it is l ikely that additional sources (animal manures and
possibly sewage sludge manures and compost for Cu and fertiliser for Cd) beyond atmospheric
inputs are important in maintaining or even increasing soil concentrations principally in managed
areas For the remaining metals especially Cr Ni and Zn there is some suggestion that in areas
where cropping takes place output fluxes may now exceed inputs enabling soil concentrations to
decline
Managed landscape where intensive cropping takes place but sewage sludge animal manures and
composts are rarely applied may be among the first habitats to return from their slight-moderately
elevated states to their pre-industrial background concentrations and could be a focus for future
monitoring
71 Policy background
Key Question Is the decline in atmospheric deposition as reported by the Heavy Metals Monitoring Network reflected in soil metal concentrations measured with CS Measurements Concentrations of Cd Cr Cu Ni Pb V and Zn is soils (0-15cm) collected in repeat sampling of plots that were also sampled and analysed for the same metals in 1998 measurement of concentrations of Li Be Al Ti Mn Fe Co As Rb Se Sr Mo Sb Sn Cs Ba W Hg U in CS in 2007 soil samples as an initial survey of a wider range of trace element From this analysis CS in 2007 has provided
Whole Great Britain (GB) and Broad Habitats Aggregate Vegetation Classes (AVC) and soil type
stratified assessments of soil trace element concentrations in soil (0-15cm) in 2007
Information of the change in concentrations of trace metals (Cd Cr Cu Ni Pb V Zn) in GB soil (0-
15 cm) since previous measurements made at the same plots in 1998
Data to contribute to analysis of source changes in the distribution of trace elements in a range of
GB habitats vegetation types and soil classes
130
Countryside Survey Soils Report from 2007
7 Soil metal concentrations
Background In the European Union and internationally a set of research programmes have focused on assessing the risks of trace metals to ecosystems This work has been driven by policy initiatives which include new procedures for the mandatory risk assessment according to European Commission regulation 148894 and studies to support the 1998 Convention on Long-Range Transboundary Air Pollution Aarhus Protocol on Heavy Metals The focus of policy makers and researchers on the risk assessment of metals recognises the harm that elevated trace element concentrations can do to soil ecosystems A number of keystone soil taxa (eg earthworms springtails nitrifying bacteria) are particularly sensitive to metals High metal concentration in soils can reduce the abundance and diversity of communities of these and other taxa potentially resulting in a breakdown of specific soil functions such as decomposition nutrient turnover and the regulation of hydrological flows through soil Metals are not broken-down over time (unlike most organic chemicals) and so can be removed only by the relatively slow process of cropping and leaching the accumulation of metals offers one of the more serious long-term threats to soil sustainability worldwide The environmental risks of metals for UK soils are currently being asssed in two projects improving current critical loads methods for application within UNECE Convention and developing models that can be used to describe and predict the effects of changes in input rates on soil and freshwater metal pools Both project will benefit from good quality soil metal survey data Key measurements required include information on current concentrations of metals in soils (representing combined geogenic and past anthropogenic inputs) and also predicted rates of change Modification in metal concentration in surface soils will represent the balances between input fluxes associated with natural and anthropogenic inputs and output fluxes associated with crop removal and leaching Measurements of the input rates of atmospheric metal deposition to rural soils in the UK since 2004 have come from analyses of rain water and airborne particulate metal concentrations made within the UK bdquoHeavy Metal Deposition Monitoring Network‟ This network has collected information on the concentrations of a suite of metals of regulatory interest including Cd Cu Ni Pb Zn and Hg Other impo rtant routes for the input of metals to soils are associated with the addition of sewage sludge animal manures and other solid waste streams to soils principally in agricultural areas Information on these inputs can be derived from Defra supported long-term monitoring projects focussing on solid waste receiving systems For estimates of losses from cropping and leaching prediction of removal rates have been made by modelling studies conducted to support development of a critical loads approach for metals in soils Despite this knowledge because the Heavy Metal Deposition Network covers only a small number of sites (15 in GB) and there is little large scale data on the local patterns of solid waste inputs and cropping and leaching removals available the input and output flux estimates that are currently available are very uncertain Although uncertain and spatially variable estimates made by the Heavy Metal Deposition Monitoring Network other large-scale monitoring programs and by source inventory assessment have suggested that rates of atmospheric metal deposition to UK soils are declining For example a European wide survey of trace metal concentration in over 6000 moss samples identified a decline in concentrations of As of 72 Pb of 72 V of 60 Cd of 52 and Fe of 45 between 1990 and 2005 Smaller declines were also found for Zn of 29 Cu of 20 and Ni of 20 Declines for Hg (12) and Cr (2) were not significant While it is apparent that atmospheric deposition is likely to be declining it is not known whether these reductions have yet passed the point beyond which output losses exceed inputs and so overall metal concentrations can begin to decline Dynamic modelling within Defra funded projects on critical loads assessment have suggested that the residence time of metals in soils will be at least many decades and for some metals such as lead possibly millennia (Tipping et al 2006a) Extensive datasets on the rates of change of concentrations of metals in soils are not currently available to validate these model predictions By resampling and measuring soil metal concentration in samples collected countrywide after a 9 year gap it was hoped that CS could provide an initial prototype of just such a dataset
131
Countryside Survey Soils Report from 2007
7 Soil metal concentrations
72 Methods
721 Proof of concept
As part of the Measuring and Assessing Soil Quality of CS in 1998 over 1100 soil samples were successfully analysed for seven trace metals (Cd Cr Cu Ni Pb V Zn) using aqua regia digestion and an ICP -OEC analysis method Measured concentrations showed regional trends with higher value generally found in England and Wales than in Scotland Concentrations also differed between Broad Habitats with highest concentrations in Arable and Horticulture and Improved Grassland soils and lowest concentrations in Dwarf Shrub Heath and Bogs The GB wide sampling and measurement programme of CS in 1998 provided information on the concentrations of metals in the rural soils that are the focus of CS rather than urban or industrial soils that are often considered in pollution assessment programs These rural soils are primari ly influenced by diffuse rather than point source inputs and so are relevant to studies to assess the potential for large scale pollution effects resulting from diffuse exposure To provide initial knowledge on the potential dynamics of metal concentra tions in GB soils a repeat analysis of a sub-set of samples collected within CS in 1998 has been undertaken as part of CS in 2007 This was done to allow the key policy question of interest to stakeholders to be addressed namely Is the decline in atmospheric deposition as reported by the Heavy Metals Monitoring Network reflected in soil metal concentrations measured with CS To address the highlighted policy issue and assess wider implications relating to metal distribution of GB soils the metal componen t of CS in 2007 was designed to provide
A nationwide assessment of the concentrations of 26 metal or metalloid elements namely lithium
(Li) beryllium (Be) aluminium (Al) titanium (Ti) vanadium (V) chromium (Cr) manganese (Mn)
iron (Fe) cobalt (Co) nickel (Ni) copper (Cu) zinc (Zn) arsenic (As) rubidium (Rb) selenium (Se)
strontium (Sr) molybdenum (Mo) cadmium (Cd) antimony (Sb) tin (Sn) caesium (Cs) barium (Ba)
tungsten (W) mercury (Hg) lead (Pb) uranium (U) in almost 500 GB soils collected in CS in 2007
Information on the change in concentrations of metals in GB soils for seven metals (Cd Cr Cu Ni
Pb V Zn) that were also analysed in CS samples collected in 1998 and in the 2007 repeat analyses
An assessment of the influence of Broad Habitats AVC and soil type on measured metal
concentration and rates of change between survey years
Countryside Survey in 2007 has provided a large-scale re-sampling of soil metal concentrations with the framework of an integrated nationwide monitoring program The full rationale for the repeat measurement of soil metal concentrations is set out in Table 71 and the progression of the development of the resampling and analysis approach used set out in detail below
In CS in 1998 concentrations of Cd Cu Cr Ni Pb Zn were measured in soils collected from all Main Plots within squares first sampled for soil (pH LOI soil texture) in the 1978 survey (Chapter 1) This gave a potential total of 1256 soils for metals analysis although actual numbers were somewhat lower due to plot or sample losses meaning that in total 1119 soils were actually analysed Competing priorities for resources during the design of the 2007 survey and measurement program meant that within the available budget a full analysis of all previous analysed Main Plots re-sampled in CS in 1998 could not be supported During preparation for CS a power analysis of the 1998 survey data was conducted to evaluate within and between square variability and to assess the implications of changing sample number for the power of the analysis to detect change in metal concentrations Results of this power analysis indicated lower within square than between square variability Further it was indicated that a reduction in the number of M ain Plots analysed per square from 5 in CS in 1998 to only 2 in CS in 2007 would actually have only a very limited effect on the power to detect change in CS in any repeat analysis Based on this evaluation in 2007 metals analysis was limited to two Main Plots for all squares previously samples in 1978
132
Countryside Survey Soils Report from 2007
7 Soil metal concentrations
Table 71 Summary of rationale for measurement of soil metal concentrations within CS in 2007
Issue Facts Comments History in CS Measured in 1097 samples in
CS in 1998
Measurement of 2007 re-samples will give
capability to establish a time series for the first time
Country level reporting No CS in 1998 did not give country level statistics
Reduced dataset in 2007 limits the power of
analysis for Country level reporting for habitat
vegetation and soil types stratifications
Links and compatibility to other
monitoring programmes
UK heavy metal monitoring
network
BGS G-BASE for soils and
stream sediments
Comparable data to those
collected in the NSI for same
horizon (0-15cm)
Environment Agency Soil and
Herbage Survey
Potential to link soils metal levels with predicted
deposition
Able to link soil metal levels with stream sediment
database
Can compare CS to NSI metal concentrations
Can compare with data for rural but not urban or
industrial site soils
Uniqueness of CS The only national dataset that
reports on metal distribution
and trends within an integrated
monitoring programme
Increase scope by inclusion of additional trace
element analytes within an extended analytical
suite
Value for money (Policy
priority or interpretative value x
cost)
Priority - medium
Value for money - medium
Sound fit with current priorities and good fit with
existing projects
ICP-MS and ICP-OES method delivers data on 26
metals and also on total P and total S
In the intervening period between the analysis of the CS in 1998 samples and the collection of samples from CS in 2007 several analytical developments were introduced into the procedures for trace metal analysis used at the UKAS accredited analytical facility at CEH in Lancaster During the movement of the metal analysis laboratory from its previous location at CEH Merlewood it was necessary to dismantle the hotplate reflux system that was used for digestion of all soils in CS in 1998 L ogistical requirement meant that the equipment could not be rehoused in the new analytical laboratories at CEH in Lancaster Instead it was decided to procure a new microwave digestion system that would be used for soil digestions Although both systems use aqua regia as the reagent for digestion the change in available instrumentation for conducting digestion from a hot plate reflux system to microwave digestion still could have the potential to confound the comparison of the 1998 and 2007 data if the two method show different extraction efficiencies Before detailed analysis of the data was conducted a careful comparison of the two methods was conducted using the available quality assurance information to check the comparability of the two methods In addition to a change in digestion apparatus purchase of new equipment for the analysis laboratory meant that as well as Inductively Coupled Plasma Optical Emission Spectroscopy ( ICP-OES) a further detection method Inductively Coupled Plasma Mass Spectrometry (ICP-MS) could also be used in CS in 2007 In the preparatory work for CS in 2007 the accuracy and precision of the two detection methods was compared for a representative set of aqua regia digests of 1998 CS soils Results indicated a good comparabi lity between the two detection techniques Since the resource implications for the use of the two instruments in parallel were minimal it was decided to use a comprehensive approach for the full analysis that included use of both procedures This approach both ensured any new analytical measures were compatible with CS in 1998 measures from digests and also delivered concentrations for an extended analyte suite The analytical
133
Countryside Survey Soils Report from 2007
7 Soil metal concentrations
strategy used involved a 5 stage approach based on 1) aqua regia digestion 2) analysis by ICP- OES for Cd Cr Cu Pb Ni V Zn P and S 3) further analysis of the same samples for further metals by ICP-MS 4) careful data evaluation 5) targeted re-measurement for any problem analytes
722 Analytical method
The field method used for soil core collection at each Main Plot was the same as in CS in 1998 The cores used for metal analysis were collected using a 15 cm long by 5 cm diameter black plastic core following the detailed field protocol set out in Emmett et al (2008) Once extracted and logged all cores were returned by mail to CEH in Lancaster as the quickest route of return On receipt samples for metal analysis were tak en from the bdquoBlack core‟ (See Emmett et al 2008 Annex 1) A total of 1054 black cores were collected from the 5 Main Plots in the original 256 1978 squares From this total number a subset of two cores from each visited square was chosen for trace met al analysis Cores were chosen at random from the subset of collected samples that were also analysed for concentrations of mineralisable nitrogen (see Chapter 5) All metal analyses were carried out by the UKAS accredited inorganic analysis laboratory at CEH in Lancaster After initial processing of the core to obtain a homogenous sample (See Emmett et al 2008 Annex 1) soil samples were ball-milled before analysis A 05g sub-sample of the dried milled material was used for analysis Digestion of the soil samples was conducted using an aqua regia mixture (3 ml of 37 hydrochloric acid and 9 ml of 69 nitric acid both bdquoaristar‟ grade reagents ) employing microwave heating under pressure The microwave digestion method was adapted from that used by the US EPA (method 3051A) to fit the specific requirements of the available digestion equipment at CEH in Lancaster The use of microwave digestion differed from the procedure used for measurement of soil metal concentration in CS in 1998 as outlined previously As a result of the change in digestion procedure detailed checks of the quality assurance data were conducted to verify the comparability of the analysis methods (see quality assurance section below) Further a series of validation checks have also bee n conducted of samples measured in the CS in 1998 using the CS in 2007 protocol This targeted re -measurement includes samples of a range of soil LOI and pH values and has been used in combination with available quality control information to support interpretations within this report
After digestion all samples were prepared for analysis of Cd Cr Cu Ni Pb V Zn P and S using ICP-OES and the technical method and operational limits relevant to the selected analytes Additionally for each digestion a parallel analysis was conducted that measured concentration of a suite of additional elements namely Li Be Al Ti V Cr Mn Fe Co Ni Cu Zn As Rb Se Sr Mo Cd Sb Sn Cs Ba W Hg Pb U using ICP-MS For reporting all values for metal concentrations derived from both detection methods were expressed as mgkg (equivalent to ppm and μgg) on a dry weight basis
134
Countryside Survey Soils Report from 2007
7 Soil metal concentrations
Table 72 Summary of quality control data for measurement of certified reference soil BCR CRM141R The table
highlights the repeatability of the measurements made in 1998 (top) and 2007 (middle) but also the difference in
the measured quantity resulting from the necessitated change in digestion procedure between CS in 1998 and
CS in 2007 The bottom table shows a comparison of the mean measured total of Cd Cr Cu Ni Pb V and Zn
made using the different method in each survey and the estimation of the correction factor used to back correct
CS in 1998 samples to account for digestion related differences Subsequent data analyse s was done comparing
back corrected CS in 1998 measurements with uncorrected CS in 2007 measured concentrations
1998 CS2000 Reflux digestionICPOES measurement BCR CRM141R
Mgkg Cd
Mgkg
Cr
Mgkg
Cu
Mgkg
Ni
Mgkg
Pb
Mgkg
V
Mgkg
Zn
Mgkg
mean 1360 14100 4700 9730 4860 5030 26100
sigma 070 530 170 370 330 210 930
CV 515 376 362 380 679 417 356
certified 1400 13800 4690 9400 5130 na 27000
recovery 9714 10217 10021 10351 9474 na 9667
bias -040 300 010 330 -270 na -900
bias -286 217 021 351 -526 na -333
error 180 1360 350 1070 930 na 2760
Error 1324 965 745 1100 1914 na 1057
2008 CS2007 microwave digestionICPOES (-oes) or ICPMS (-ms) measurement BCR CRM141R Cd-ms
Mgkg
Cr-ms
Mgkg
Cu-oes
Mgkg
Ni-ms
Mgkg
Pb-ms
Mgkg
V-oes
Mgkg
Zn-oes
Mgkg
Mean 1270 12120 4670 8366 4954 3580 28460
sigma 016 130 060 113 081 190 540
CV 126 107 128 135 164 531 190
Certified 1400 13800 4690 9400 5130 na 27000
recovery 9071 8783 9957 8900 9657 na 10541
bias -130 -1680 -020 -1034 -176 na 1460
bias -929 -1217 -043 -1100 -343 na 541
Error 162 1940 140 1260 338 na 2540
Error 1276 1601 300 1506 682 na 892
BCR CRM141R ndash 19982007 comparison all validation Cd-ms
Mgkg
Cr-ms
Mgkg
Cu-oes
Mgkg
Ni-ms
Mgkg
Pb-ms
Mgkg
V-oes
Mgkg
Zn-oes
Mgkg
1998 1360 14100 4700 9730 4860 5030 26100
2007 1182 10989 4327 7872 4724 2820 26632
19982007 115 128 109 124 103 178 098
135
Countryside Survey Soils Report from 2007
7 Soil metal concentrations
723 Quality assurance
Within each batch of 20 samples a minimum of one blank and two certified reference material (CRM) and one local reference material (LRM) were always analysed The t wo CRMs used were the BCR CRM141R calcareous loam soil and International Soil Exchange ISE 921 river clay both of which have certified values for a range of metals included within the analytical suite Quality control checks for each analytical batch were conducted to ensure that total analytical error was not greater than 20 comprising a 10 error in precision and 10 error in bias This criterion is more rigorous than that used by the Environment Agencies MCERTS performance standard for laboratories undertaking chemical testing of soil (NB MCERTS defines total allowable error of 25 - 10 bias + 15 precision) For the 2007 soils analysed using microwave digestion with ICP-OES or ICP-MS detection certified values for the repeat analysed metals (Cd Cr Cu Ni Pb Zn) indicated that the total error of the method is within the allowable 20 Compared with results from the CS in 1998 survey the analytical method used in CS in 2007 provided a similar and in both cases satisfactory precision of measurement in all cases ( Table 72) This confirms the suitability of the method used Even though both the microwave and hotplate digestion method performed within quality assurance targets it must be remembered that both digestion procedure remain operationally defined This means that the two aqua regia digest ion based techniques do not give a full measurement of all metals present in soils Some metal remains unextracted These residual ions are however mostly bound to silicate minerals and as such are widely considered to be unimportant for estimating the mobility and behaviour of trace elements in soil This operational component to the effectiveness of the method does however raise the potential for the two procedures to produce slightly different estimates of metal concentrations from the same soil To provide a cross check between measurements made by the two different digestion methods two separate approaches were used For the first a comparison was made of the measurements made of the BCR CRM141R calcareous loam soil which was extensively analysed during both the CS in 1998 and CS in 2007 measurement campaigns Comparison of quantifications of the CRM in the two surveys indicated that 6 of the 7 metals showed higher concentrations in BCR CRM141R soil in CS in 1998 than in CS in 2007 (Table 72) Cd Cr Cu Ni and Pb showed concentrations that were between 3 (Pb) and 28 (Cr) higher in CS in 1998 Concentrations of V in CS in 1998 were 78 higher in the CRM in measurements made in CS in 1998 than in CS in 2007 Of measured metals in the CRM only Zn concentrations were lower (by 2) in CS in 1998 than in CS in 2007 The second approach to comparison of the two digestion techniques was through a repeat analysis of samples that were originally measured following hotplate reflux digestion as part of the CS survey in 1998 but this time using the CS in 2007 microwave method Twenty six samples that had been archived from the 1998 survey were digested using the microwave method and analysed for concentration of the seven trace elements (Cd Cr Cu Ni Pb V Zn) that were originally measured during the 1998 analysis The results of this targeted re-measurement confirm the initial indication gained from the comparison of certified reference material analyses in all cases except for V The method compari son highlights that there is an approximate 30 increase in measured Cr and Ni concentrations using the reflux technique Cd and to a lesser extent Cu concentrations are also marginally higher with hotplate reflux (3 -10) while Pb and Zn concentrations are similar to within a few percent using both methods (Table 73) For V the comparison between soils highlights a small underestimation of concentrations using reflux while in contrast a large overestimation was indicated by the CRM comparison
136
Countryside Survey Soils Report from 2007
7 Soil metal concentrations
Table 73 Summary data for measurement of soil trace metal concentrations measured in selected (26) soil
samples collected in CS in 1998 using the hot reflux digestion protocol used for all CS in 1998 analyses and also
the microwave digestion protocol used for analysis in CS in 2007 samples The table highlights the repeatability
of the measurements made in 1998 (top) and 2007 (middle) but also the difference in the mean measured total of
Cd Cr Cu Ni Pb V and Zn made using the different methods as shown by the comparison of measured
concentration between the two procedures
Cd-ms
mgkg
Cr-ms
mgkg
Cu-oes
mgkg
Ni-ms
mgkg
Pb-ms
mgkg
V-oes
mgkg
Zn-oes
mgkg
1998 soils by reflux 036 3575 1703 2847 6738 4145 6146
SD 026 5219 1754 5487 9835 3859 4222
1998 soil by microwave 034 2775 1594 2041 7122 4061 6298
SD 023 3937 1515 4282 9392 3838 4196
RefluxMicrowave 111 131 103 136 096 098 097
SD 040 064 017 057 013 016 013
Because the differences relating to the efficiency of the digestion techniques used between surveys could
contribute to any indicated differences between surveys it was decided to ldquonormaliserdquo one set of
measurements to allow direct comparison As the 2007 measurements showed the highest precision for the
majority of the metals measured in both surveys (Cd Cu Pb Zn) and the microwave digestion method will be
applied in future soil metal research within CEH including any potential future CS analyses it was decided to
normalise the 1998 data to give concentration estimates for soil collected in 1998 assuming analysis
conducted according to the CS in 2007 method The back correction of the 1998 concentrations was
achieved by dividing the measured value by the ratio of mean 1998 2007 measurements for the BCR
CRM141R reference soil Correction was undertaken according to measurement in the reference soil for two
reasons Firstly these analyses were made at the same time that the CS soils themselves were measured
meaning that they are most likely to relate to operational conditions at the time of CS sample assessment
Secondly the CRM dataset contains a greater number of total measurements than the repeated 1998
dataset The back correction of the 1998 measurements gives an estimated value for 1 998 soils if measured
using the 2007 protocol The back correction procedure was conducted for 6 metals Cd Cr Cu N Pb Zn
but not for V This was because the large discrepancy in BCR CRM141R measurement between survey s for
this metal (78) and the mismatch between this comparison and the repeat measures questions the
reliability of the extraction method and data ldquonormalisationrdquo approaches used for this metal As a result V
has been excluded from the analysis of change between surveys
137
Countryside Survey Soils Report from 2007
7 Soil metal concentrations
Figure 71 Comparison of change in measure metal concentration following back correction of 1998 data to
account for differences resulting from changes in digestion procedure between the 1998 and 2007 survey in
relation to pH of the measure soil Red line indicates linear trend of change in relation to pH Absence of a
strong trend for change in relation to soil pH indicate that there is no effect of soil pH on the size of the
difference resulting from the digestion change meaning that a single value for back correction is applicable to
soils independent of pH
-2000
-1500
-1000
-0500
0000
0500
1000
1500
3 4 5 6 7 8 9 10
Soil pH
Ch
an
ge
soil C
d 1
99
8-2
007
(m
gk
g)
-40000
-20000
0000
20000
40000
60000
80000
100000
120000
140000
3 4 5 6 7 8 9 10
Soil pH
Ch
an
ge
soil C
r 1
99
8-2
007
(m
gk
g)
-30000
-20000
-10000
0000
10000
20000
30000
40000
50000
60000
3 4 5 6 7 8 9 10
Soil pH
Ch
an
ge
soil C
u 1
99
8-2
007
(m
gk
g)
-80000
-60000
-40000
-20000
0000
20000
40000
60000
3 4 5 6 7 8 9 10
Soil pH
Ch
an
ge
soil N
i 1
99
8-2
007
(m
gk
g)
-1000000
-800000
-600000
-400000
-200000
0000
200000
400000
600000
3 4 5 6 7 8 9 10
Soil pH
Ch
an
ge
soil P
b 1
99
8-2
007
(m
gk
g)
-40000
-20000
0000
20000
40000
60000
80000
3 4 5 6 7 8 9 10
Soil pH
Ch
an
ge
soil V
199
8-2
007
(m
gk
g)
-500000
-400000
-300000
-200000
-100000
0000
100000
200000
3 4 5 6 7 8 9 10
Soil pH
Ch
an
ge
soil Z
n 1
99
8-2
007
(m
gk
g)
Cd Cr
Cu Ni
Pb V
Zn
Cd_98_07_change = 0759 + 000300 PH2007 Cr_98_07_change = 018 - 00196 PH2007
Cu_98_07_change = 235 + 00427 PH2007 Ni_98_07_change = 036 - 000637 PH2007
Pb_98_07_change = - 022 + 000466 PH2007 V_98_07_change = 899 + 0211 PH2007
Zn_98_07_change = - 177 - 00425 PH2007
138
Countryside Survey Soils Report from 2007
7 Soil metal concentrations
Figure 72 Comparison of change in measure metal concentration following back correction of 1998 data to
account for differences resulting from changes in digestion procedure between the 1998 and 2007 survey in
relation to soil LOI Red lines indicate the linear trend for change as a function of LOI Absence of a strong trend
for change in relation to soil pH indicate that there is no effect of soil p H on the size of the difference resulting
from the digestion change meaning that a single value for back correction is applicable to soils independent of
LOI
Cd Cr
Cu Ni
Pb V
Zn
-2000
-1500
-1000
-0500
0000
0500
1000
1500
0 20 40 60 80 100
Soil loss on ignition
Ch
an
ge
soil
Cd
19
98
-20
07
(m
gk
g)
-40000
-20000
0000
20000
40000
60000
80000
100000
120000
140000
0 20 40 60 80 100
Soil loss on ignition
Ch
an
ge
soil
Cr
19
98
-20
07
(m
gk
g)
-30000
-20000
-10000
0000
10000
20000
30000
40000
50000
60000
0 20 40 60 80 100
Soil loss on ignition
Ch
an
ge
soil
Cu
19
98
-20
07
(m
gk
g)
-80000
-60000
-40000
-20000
0000
20000
40000
60000
0 20 40 60 80 100
Soil loss on ignition
Ch
an
ge
soil
Ni
19
98
-20
07
(m
gk
g)
-1000000
-800000
-600000
-400000
-200000
0000
200000
400000
600000
0 20 40 60 80 100
Soil loss on ignition
Ch
an
ge
soil
Pb
19
98
-20
07
(m
gk
g)
-40000
-20000
0000
20000
40000
60000
80000
0 20 40 60 80 100
Soil loss on ignition
Ch
an
ge
soil
V 1
99
8-2
00
7 (
mg
kg
)
-500000
-400000
-300000
-200000
-100000
0000
100000
200000
0 20 40 60 80 100
Soil loss on ignition
Ch
an
ge
soil
Zn
19
98
-20
07
(m
gk
g)
Cr_98_07_change = 015 - 000509 LOI2007
Cu_98_07_change = 270 + 000924 LOI2007 Ni_98_07_change = 045 - 000205 LOI2007
Pb_98_07_change = 225 + 000046 LOI2007 V_98_07_change = 104 + 00479 LOI2007
Zn_98_07_change = - 217 - 00104 LOI2007
Cd_98_07_change = 0938 + 0000107 LOI2007
139
Countryside Survey Soils Report from 2007
7 Soil metal concentrations
A potential concern with the back correction approach used to ldquonormaliserdquo measurements between surveys was that this could results in the false identification of change in some habit ats if the difference in digestion technique resulted in different ratios of measured metals in soils of differing properties such as pH LOI and metal concentration Any such trends with soil properties could under or over correct concentrations in particular soils types Since some habitats and vegetation classes are associated with certain soils (eg Bogs with low pH organic soils) this could lead to the erroneous identification of change in certain data stratifications To investigate whether soil properties had the potential to bias result by differentially affecting extraction efficiency between CS in 1998 and 2007 methods correlation plots were drawn between the predicted change between surveys and the potentially key soil properties of pH LOI a nd metal concentration For pH 5 metals (Cd Cu Ni Pb Zn) showed no clear trend of change with soil acidity ( Fig 71) This suggested that the relative digestion efficiency of the different methods is not affected by this parameter A small dependency of change in Cr concentration with pH was found indicating that association of habitats and vegetation classes with low pH could result in the incorrect identification of change with errors relating to indications of increased change in low pH soil and reduced change in high pH soil V showed a marked dependency of change on soil pH providing further support for exclusion of this metal from further analysis Against LOI all metals except V showed no clear trend of change ( Fig 72) Ideally investigation of the effect of metal concentration on relative extraction efficiency would also have been tested however this analysis is affected by regression to the mean issues which means that the significant trends seen which indicates positive change at low concentrations and negative change at high concentrations are explained by statistical chance rather than a real concentration dependent effect Overall the analysis of the effect of all testable soil properties supported the use of a single factor for back correction of the CS in 1998 measurements with a slight caveat for soil Cr concentrations in respect of pH
724 Reporting
Measured soil elemental concentrations for Li Be Al Ti V Cr Mn Fe Co Ni Cu Zn As Rb Se Sr Mo Cd Sb Sn Cs Ba W Hg Pb U P and S have been analysed to provide information on the state and in seven cases (Cd Cr Cu Ni Pb V and Zn) change since CS in 1998 Data were analysed using the standard mixed model analysis appropriate to CS measurements The statistical approach used for analys is for change involved bootstrapping which allows for non-normality in the data without the necessity of knowing details of actual distribution As such it provides a more accurate measurement of significance A nnex F of Emmett et al (2008) provides a background document describing this approach The data in this report describes analysis of concentrations in CS in 2007 and changes since CS in 1998 for Cd Cr Cu Ni Pb Zn in soils (0 -15 cm) by Broad Habitat Aggregate Vegetation Class (AVC) and soil LOI class
Results are reported by three major categories for Great Britain and individual countries
Broad Habitat - the Broad Habitat classification consists of 27 habitats which account for the entire
land surface of Great Britain and the surrounding sea Countryside Survey reports on 10 major
terrestrial habitats
Aggregate Vegetation Class (AVC) ndash is a high level grouping of vegetation types produced from a
quantitative hierarchical classification of the different plant species found in the original Countryside
Survey sample plots Soil organic matter (LOI) category - mineral (0-8 LOI 0-44 g C kg
-1) humus-mineral (8 ndash 30 LOI
44-165 g C kg-1
) organo-mineral (30 ndash 60 LOI 165-330 g C kg-1
) and organic (60 ndash 100 gt 330 g
C kg-1
) Analysis of concentrations by Broad Habitat class and soil type is also briefly reported for As Mn Se Co Hg Mo Al and Ti Significant results relate to statistical significance with their ecological and policy relevance highlighted where appropriate Soil Arsenic (As) levels were interpolated using median indicator kriging to predict the probability of a threshold value of As concentration (807 mgkg) being exceeded A probability of 1 or above indicates that the data exceeds the specified threshold value at that location This method of spatial interpolation is particularly suited to interpreting heavy metals where point values can h ave large point scale variability rendering ordinary kriging unsuitable Data was interpolated onto a 1 km UK grid The change for soil Cu was
140
Countryside Survey Soils Report from 2007
7 Soil metal concentrations
mapped using kriging to interpolate between the Countryside Survey sample points Routine checking of data for outliers was conducted and the working data set was transformed using a normal score procedure to obtain a Gaussian distribution The data were then interpolated on a 1km UK grid using ordinary kriging and finally the kriged data were back-transformed to produce an interpolated map of Cu change
73 Results
731 Repeat measured metals comparison of CS data in 1998 and 2007
Cadmium The mean concentration of Cd measured in GB soils collected in 2007 was 0404 mgkg This compares with an mean concentration of 0417 mgkg measured in soil sample for CS in 1998 (Table 73 Fig 73) This represents a non-significant change in measured Cd concentration of 0013 mgkg between surveys Stratification of the data indicated that significant changes in soil Cd concentrations were not found in any Broad Habitat although it was notable that four habitats that are associated with minimal management namely Coniferous Woodland Acid Grassland Dwarf Shrub Heath and Fen Marsh and Swamp showed relatively large non-significant decreases in soil Cd concentration (in the region of 005 mgkg magnitude) In contrast habitats associated with more intensive management such as Arable and Horticulture and Improved Grassland showed smaller changes represented by a decline of 0003 mgkg and increase of 0029 mgkg respectively Bog habitats also showed a small non-significant increase in measured soil Cd Stratification by AVC indicated a significant reduction in measured soil Cd concentrations in Heath and Bog Here mean measured concentrations reduced to 0399 mgkg in 2007 from a mean of 0475 mgkg in 1998 Significant change was not found for any other AVC Stratification by soil LOI category indicated no significant change in Cd concentrations in Mineral Humus mineral and Organic soils In Organo-mineral soils a significant decrease of 0309 mgkg was found in 2007 when compared to 1998 values This category of soils is however represented by only a relatively small number of samples in the repeat sample dataset f or Cd which may be a contributing factor towards the observed change for this LOI class
141
Countryside Survey Soils Report from 2007
7 Soil metal concentrations
c) Great Britain - Soil LOI Category
Soil LOI category 1998 2007 1998-2007
Mineral 032 0332
Humus-mineral 0421 0412
Organo-mineral 0557 0246
Organic 0483 0452
Direction of
significant
changes
Soil Cd concentration
(mgkg)
Table 74 Changes in concentration of Cd (mgkg) in soils (0 -15 cm depth) within a) Broad Habitats b)
Aggregate Vegetation Classes and c) Soil LOI categories across Great Britain Arrows denote a significant
change (plt005) in the direction shown
a) Great Britain - Broad Habitats
Broad Habitat 1998 2007 1998-2007
Broadleaved Mixed and Yew Woodland 0413 0418
Coniferous Woodland 0308 0256
Arable and Horticulture 0355 0352
Improved Grassland 0389 0418
Neutral Grassland 0458 0416
Acid Grassland 0458 0404
Dwarf Shrub Heath 0457 0392
Fen Marsh and Swamp 0553 042
Bog 0631 0646
All habitat types 0417 0404
b) Great Britain - Aggregate Vegetation Class
AVC 1998 2007 1998-2007
Crops and weeds 0355 0359
Tall grass and Herb 0447 0409
Fertile grassland 0367 0365
Infertile grassland 0475 0446
Lowland woodland 0576 0612
Upland Woodland 0269 0197
Moorland grass mosaics 0405 0376
Heath and bog 0475 0399
All vegetation types 0417 0404
Direction of
significant
changes
Direction of
significant
changesSoil Cd concentration
(mgkg)
Soil Cd concentration
(mgkg)
142
Countryside Survey Soils Report from 2007
7 Soil metal concentrations
Figure 73 Changes (+- 95 CIs) in measured soil Cd concentration in soils (0-15 cm depth) within a) Broad
Habitats b) Aggregate Vegetation Classes and c) Soil LOI categories across Great Britain Standard errors are
indicated Significant differences p lt 005 p lt 001 p lt 0001 are shown
The mean concentration of Cr in GB soils was 213 mgkg in CS in 2007 compared to the mean of 224 mgkg in 1998 (Table 75 Fig 74) This represents a non-significant decrease of 11 mgkg Stratification of the data to assess change in measured Cr by Broad Habitats indicated significant reductions in soil Cr concentrations between surveys in Broadleaved Woodland Arable and Horticulture and Improved and Neutral Grasslands In contrast in Bogs there was a significant increased in measured soil Cr T his increase was however from a low baseline level as Cr concentrations in Bog were lower than in any other habitat in both surveys (46 mgkg in 1998 and 76 mgkg in 2007) In other Broad Habitats observed changes were non-significant with Coniferous Woodland Dwarf Shrub Heath and Fen Marsh and Swamp all showing small non-significant increases in mean measured Cr concentration Stratification by AVC partly reflected the trends seen within the Broad Habitats Significant decreases in measured Cr concentrations were found in Crop and Weed and Fertile Grassland Non-significant decreases were found in Tall Grass and Herb and Infertile Grassland In contrast a significant increase in measured soil Cr was found in Heath and Bog soils and non-significant increases in Upland Woodland and Moorland Grass Mosaic Stratification by soil LOI category indicated a significant decrease in measured Cr concentrations in Mineral and Humus -mineral soils and a significant increase in Organic soils
-020
-015
-010
-005
000
005
010
Bro
adlea
f
Coni
fer
Ara
ble
Impro
ved
Gra
ss
Neut
ral G
rass
Acid
Gra
ss
Shr
ub Hea
th
Bog
All ha
bita
ts
Ch
an
ge i
n s
oil
Cd
co
ncen
trati
on
(mg
kg
)
-020
-015
-010
-005
000
005
010
Cro
ps a
nd w
eeds
Tall g
rass
and
Her
b
Fertile
grass
land
Infe
rtile g
rass
land
Upla
nd W
oodlan
d
Moo
rland
gra
ss m
osaics
Heat
h and
bog
All ve
geta
tion
type
s
Ch
an
ge i
n s
oil
Cd
co
ncen
trati
on
(mg
kg
)
-040
-030
-020
-010
000
010
020
Min
eral
Hum
us-m
iner
al
Org
ano
-min
eral
Org
ani
c
Ch
an
ge in
so
il C
d c
on
cen
trati
on
(mg
kg
)
a) Broad Habitats
c) LOI categoriesb) Aggregate vegetation class
143
Countryside Survey Soils Report from 2007
7 Soil metal concentrations
c) Great Britain - Soil LOI Category
Soil LOI category 1998 2007 1998-2007
Mineral 268 236
Humus-mineral 28 264
Organo-mineral 183 247
Organic 41 53
Direction of
significant
changes
Soil Cr concentration
(mgkg)
Table 75 Changes in concentration of Cr (mgkg) in soils (0-15 cm depth) within a) Broad Habitats b) Aggregate
Vegetation Classes and c) Soil LOI categories across Great Britain Arrows denote a significant change (plt005)
in the direction shown
a) Great Britain - Broad Habitats
Broad Habitat 1998 2007 1998-2007
Broadleaved Mixed and Yew Woodland 227 195
Coniferous Woodland 128 139
Arable and Horticulture 295 254
Improved Grassland 282 264
Neutral Grassland 276 239
Acid Grassland 169 199
Dwarf Shrub Heath 11 186
Fen Marsh and Swamp 208 216
Bog 46 76
All habitat types 224 213
b) Great Britain - Aggregate Vegetation Class
AVC 1998 2007 1998-2007
Crops and weeds 295 261
Tall grass and Herb 321 288
Fertile grassland 286 262
Infertile grassland 27 253
Upland Woodland 232 237
Moorland grass mosaics 157 173
Heath and bog 48 71
All vegetation types 224 213
Direction of
significant
changesSoil Cr concentration
(mgkg)
Soil Cr concentration
(mgkg)
Direction of
significant
changes
144
Countryside Survey Soils Report from 2007
7 Soil metal concentrations
Figure 74 Changes (+- 95 CIs) in measured soil Cr concentration in soils (0-15 cm depth) within a) Broad
Habitats b) Aggregate Vegetation Classes and c) Soil LOI categories across Great Britain Standard errors are
indicated Significant differences p lt 005 p lt 001 p lt 0001 are shown
Copper The mean concentration of Cu in GB soils analysed in CS in 2007 was 186 mgkg ( Table 76 Fig 75) This is higher than the mean concentration of 166 mgkg measured in 1998 This represents a statistically significant increase in soil Cu concentrations of 2 mgkg between surveys Stratification of the data to analyse change by Broad Habitats indicated that the increase in Cu concentration detected in the GB wide soil dataset was evident in all Broad Habitats with the magnitude of change ranging from 02 mgkg in Arable and Horticulture soils to 6 mgkg in Dwarf Shrub Heath In 3 of the 9 Broad Habitats the increase in soil Cu was statistically significant These were Improved Grassland Dwarf Shrub Heath and Bogs which showed changes in measured soil Cu concentrations of 26 6 and 41 mgkg respectively Stratification by AVC indicated an increase in soil Cu concentrations in all vegetation types except for Tall Grass and Herb and Upland Woodland for which small non-significant decreases were found Three AVC categories showed significant increases in measured soil Cu There were Fertile Grassland Moorland Grass Mosaic and Heath and Bog within which increases were 41 5 and 33 mgkg respectively Analysis by soil LOI category indicated an increase of between 17 and 33 mgkg for the four soil type stratifications The measured increases were significant for 3 out of 4 categories namely the Mineral Humus-mineral and Organic soils
-10
-5
0
5
10
15
20
25
Bro
adlea
f
Coni
fer
Ara
ble
Impro
ved
Gra
ss
Neut
ral G
rass
Acid
Gra
ss
Shr
ub Hea
th
Bog
All ha
bita
ts
Ch
an
ge i
n s
oil
Cr
co
ncen
trati
on
(mg
kg
)
-10
-5
0
5
10
15
20
25
Min
eral
Hum
us-m
iner
al
Org
ano-m
iner
al
Org
anic
Ch
an
ge in
so
il C
r co
ncen
trati
on
(mg
kg
)
-10
-5
0
5
10
15
20
25
Cro
ps a
nd w
eeds
Tall g
rass
and
Her
b
Fertile
grass
land
Infe
rtile g
rass
land
Upla
nd W
oodlan
d
Moo
rland
gra
ss m
osaics
Heat
h and
bog
All ve
geta
tion
type
s
Ch
an
ge i
n s
oil
Cr
co
ncen
trati
on
(mg
kg
)
a) Broad Habitats
c) LOI categoriesb) Aggregate vegetation class
145
Countryside Survey Soils Report from 2007
7 Soil metal concentrations
c) Great Britain - Soil LOI Category
Soil LOI category 1998 2007 1998-2007
Mineral 178 195
Humus-mineral 198 221
Organo-mineral 161 195
Organic 74 103
Direction of
significant
changes
Soil Cu concentration
(mgkg)
Table 76 Changes in concentration of Cu (mgkg) in soils (0 -15 cm depth) within a) Broad Habitats b)
Aggregate Vegetation Classes and c) Soil LOI categories across Great Britain Arrows denote a significant
change (plt005) in the direction shown
a) Great Britain - Broad Habitats
Broad Habitat 1998 2007 1998-2007
Broadleaved Mixed and Yew Woodland 259 263
Coniferous Woodland 92 102
Arable and Horticulture 205 207
Improved Grassland 169 195
Neutral Grassland 226 237
Acid Grassland 124 147
Dwarf Shrub Heath 10 16
Fen Marsh and Swamp 172 191
Bog 69 11
All habitat types 166 186
b) Great Britain - Aggregate Vegetation Class
AVC 1998 2007 1998-2007
Crops and weeds 194 20
Tall grass and Herb 266 258
Fertile grassland 198 239
Infertile grassland 189 202
Lowland wooded 349 368
Upland Woodland 133 124
Moorland grass mosaics 109 159
Heath and bog 73 106
All vegetation types 166 19
Direction of
significant
changes
Direction of
significant
changesSoil Cu concentration
(mgkg)
Soil Cu concentration
(mgkg)
146
Countryside Survey Soils Report from 2007
7 Soil metal concentrations
Figure 75 Changes (+- 95 CIs) in measured soil Cu concentration in soils (0-15 cm depth) within a) Broad
Habitats b) Aggregate Vegetation Classes and c) Soil LOI categories across Great Britain Standard errors are
indicated Significant differences p lt 005 p lt 001 p lt 0001 are shown
Nickel The mean concentration of Ni in GB soils collected and analysed in the 2007 survey was 18 mgkg (Table 77 Fig 76) This is slightly although not significantly lower than the mean measured concentration in 1998 of 184 mgkg Within the different Broad Habitat categories a statistically significant decrease in soil Ni was found in 3 These were Broadleaved Woodland where concentrations fell by 2 mgkg and Arable and Horticulture where concentrations reduced by 18 mgkg and Neutral Grassland where a 21 mgkg decrease were found There was one habitat where measured soil Ni concentrations significantly increased between surveys This was Bog within which mean measured soil Ni concentrations increased 41 mgkg Analysis by AVC indicated significant change of measured Ni concentrations in Crop and We ed only Here a significant reduction in measured concentrations of 17 mgkg was found Analysis by soil LOI category indicated no significant change across any of the four soil classes
-8
-4
0
4
8
12
Bro
adlea
f
Coni
fer
Ara
ble
Impro
ved
Gra
ss
Neut
ral G
rass
Acid
Gra
ss
Shr
ub Hea
th
Bog
All ha
bita
ts
Ch
an
ge i
n s
oil
Cu
co
ncen
trati
on
(mg
kg
)
-8
-4
0
4
8
12
Min
eral
Hum
us-m
iner
al
Org
ano
-min
eral
Org
ani
c
Ch
an
ge in
so
il C
u c
on
cen
trati
on
(mg
kg
)
-8
-4
0
4
8
12
Cro
ps a
nd w
eeds
Tall g
rass
and
Her
b
Fertile
grass
land
Infe
rtile g
rass
land
Upla
nd W
oodlan
d
Moo
rland
gra
ss m
osaics
Heat
h and
bog
All ve
geta
tion
type
s
Ch
an
ge i
n s
oil
Cu
co
ncen
trati
on
(mg
kg
)
a) Broad Habitats
c) LOI categoriesb) Aggregate vegetation class
147
Countryside Survey Soils Report from 2007
7 Soil metal concentrations
c) Great Britain - Soil LOI Category
Soil LOI category 1998 2007 1998-2007
Mineral 197 189
Humus-mineral 195 191
Organo-mineral 249 253
Organic 35 35
Direction of
significant
changes
Soil Ni concentration
(mgkg)
Table 77 Changes in concentration of Ni (mgkg) in soils (0 -15 cm depth) within a) Broad Habitats b) Aggregate
Vegetation Classes and c) Soil LOI categories across Great Britain Arrows denote a significant change (plt005)
in the direction shown
a) Great Britain - Broad Habitats
Broad Habitat 1998 2007 1998-2007
Broadleaved Mixed and Yew Woodland 179 159
Coniferous Woodland 9 99
Arable and Horticulture 219 201
Improved Grassland 169 195
Neutral Grassland 226 205
Dwarf Shrub Heath 102 160
Fen Marsh and Swamp 172 191
Bog 69 110
All habitat types 184 18
b) Great Britain - Aggregate Vegetation Class
AVC 1998 2007 1998-2007
Crops and weeds 216 199
Tall grass and Herb 23 228
Fertile grassland 195 194
Infertile grassland 205 193
Lowland wooded 184 18
Upland Woodland 143 148
Moorland grass mosaics 25 24
Heath and bog 70 74
All vegetation types 184 18
Direction of
significant
changes
Direction of
significant
changesSoil Ni concentration
(mgkg)
Soil Ni concentration
(mgkg)
148
Countryside Survey Soils Report from 2007
7 Soil metal concentrations
Figure 76 Changes (+- 95 CIs) in measured soil Ni concentration in soils (0 -15 cm depth) within a) Broad
Habitats b) Aggregate Vegetation Classes and c) Soil LOI categories across Great Britain Standard errors are
indicated Significant differences p lt 005 p lt 001 p lt 0001 are shown
Lead The mean measured concentration of Pb in GB soils in 2007 was 804 mgkg ( Table 78 Fig 77) This is slightly although not significantly lower than the measured mean concentration of 825 mgkg found in 1998 Stratification of the data by Broad Habitat indicated that there was an increase of between 04 and 204 mgkg in 4 of 8 habitats In two habitats namely Improved Grassland and Dwarf Shrub Heath this increase was statistically significant The remaining habitats showed non -significant decreases in measured soil Pb concentrations ranging from 17 mgk in Fen Marsh and Swamp to 455 mgkg in Acid Grassland When data was analysed by AVC no significant changes in soil Pb concentration were found for any category Similarly stratification of the data by Soil LOI class did not highlight significant changes in measured soil Pb concentration between different soi l types
-15
-10
-5
0
5
10
15
Bro
adlea
f
Coni
fer
Ara
ble
Impro
ved
Gra
ss
Neut
ral G
rass
Shr
ub H
eath
Bog
All ha
bita
ts
Ch
an
ge i
n s
oil
Ni
co
ncen
trati
on
(mg
kg
)
-15
-10
-5
0
5
10
15
Cro
ps a
nd w
eeds
Tall g
rass
and
herb
Fertile
grass
land
Infe
rtile g
rass
land
Upla
nd w
ooded
Moo
rland
gra
ss m
osaics
Heat
h and
bog
All ve
geta
tion
type
s
Ch
an
ge i
n s
oil
Ni
co
ncen
trati
on
(mg
kg
)
-15
-10
-5
0
5
10
15
Min
eral
Hum
us-m
iner
al
Org
ano
-min
eral
Org
ani
c
Ch
an
ge in
so
il N
i co
ncen
trati
on
(mg
kg
)
a) Broad Habitats
c) LOI categoriesb) Aggregate vegetation class
149
Countryside Survey Soils Report from 2007
7 Soil metal concentrations
Table 78 Changes in concentration of Pb (mgkg) in soils (0 -15 cm depth) within a) Broad Habitats b)
Aggregate Vegetation Classes and c) Soil LOI categories across Great Britain Arrows denote a significant
change (plt005) in the direction shown
a) Great Britain - Broad Habitats
Broad Habitat 1998 2007 1998-2007
Coniferous Woodland 816 782
Arable and Horticulture 415 419
Improved Grassland 55 664
Neutral Grassland 609 526
Acid Grassland 1188 763
Dwarf Shrub Heath 679 883
Fen Marsh and Swamp 642 625
Bog 562 592
All habitat types 825 804
b) Great Britain - Aggregate Vegetation Class
AVC 1998 2007 1998-2007
Crops and weeds 449 454
Tall grass and Herb 638 614
Fertile grassland 560 617
Infertile grassland 627 589
Upland Woodland 853 780
Moorland grass mosaics 887 829
Heath and bog 704 705
All vegetation types 825 804
Direction of
significant
changes
Direction of
significant
changesSoil Pb concentration
(mgkg)
Soil Pb concentration
(mgkg)
c) Great Britain - Soil LOI Category
Soil LOI category 1998 2007 1998-2007
Mineral 413 426
Humus-mineral 1295 1269
Organo-mineral 997 985
Organic 752 682
Direction of
significant
changes
Soil Pb concentration
(mgkg)
150
Countryside Survey Soils Report from 2007
7 Soil metal concentrations
Figure 77 Changes (+- 95 CIs) in measured soil Pb concentration in soils (0-15 cm depth) within a) Broad
Habitats b) Aggregate Vegetation Classes and c) Soil LOI categories across Great Britain Standard errors are
indicated Significant differences p lt 005 p lt 001 p lt 0001 are shown
Zinc The mean concentration of Zn in GB soils in CS in 2007 was 773 mgkg ( Table 79 Fig 78) This is lower than the mean concentration of 804 mgkg found in 1998 This reduction of 31 mgkg in soil Zn in GB is not statistically significant Stratification of the data to analyse change in soil Zn concentration by Broad Habitat indicated that mean concentration were lower in 2007 than in 1998 in 7 of 10 h abitats This reduction in soil Zn was significant in two habitats These were Arable and Horticulture in which concentration fell on average by 57 mgkg and Neutral Grassland in which concentrations fell by 104 mgkg A significant increase in soil Zn concentration of 72 mgkg was found in Bog habitats All other changes in measured soil Zn by Broad Habitats were not significant When data was analysed by AVC no significant changes in soil Zn concentration were indicated for any vegetation class Strat ification of the data by LOI class also failed to identify significant changes in measured Zn between soil types
-100
-80
-60
-40
-20
0
20
40
Bro
adlea
f
Coni
fer
Ara
ble
Impro
ved
Gra
ss
Neut
ral G
rass
Acid
Gra
ss
Shr
ub Hea
th
Bog
All ha
bita
ts
Ch
an
ge i
n s
oil
Pb
co
ncen
trati
on
(mg
kg
)
-100
-80
-60
-40
-20
0
20
40
Cro
ps a
nd w
eeds
Tall g
rass
and
Her
b
Fertile
grass
land
Infe
rtile g
rass
land
Upla
nd W
oodlan
d
Moo
rland
gra
ss m
osaics
Heat
h and
bog
All ve
geta
tion
type
s
Ch
an
ge i
n s
oil
Pb
co
ncen
trati
on
(mg
kg
)
-100
-80
-60
-40
-20
0
20
40
Min
eral
Hum
us-m
iner
al
Org
ano
-min
eral
Org
ani
c
Ch
an
ge in
so
il P
b c
on
cen
trati
on
(mg
kg
)
a) Broad Habitats
c) LOI categoriesb) Aggregate vegetation class
151
Countryside Survey Soils Report from 2007
7 Soil metal concentrations
c) Great Britain - Soil LOI Category
Soil LOI category 1998 2007 1998-2007
Mineral 885 824
Humus-mineral 100 1006
Organo-mineral 61 357
Organic 342 376
Direction of
significant
changes
Soil Zn concentration
(mgkg)
Table 79 Changes in concentration of Zn (mgkg) in soils (0 -15 cm depth) within a) Broad Habitats b)
Aggregate Vegetation Classes and c) Soil LOI categories across Great Britain Arrows denote a significant
change (plt005) in the direction shown
a) Great Britain - Broad Habitats
Broad Habitat 1998 2007 1998-2007
Broadleaved Mixed and Yew Woodland 864 857
Coniferous Woodland 446 485
Arable and Horticulture 901 844
Improved Grassland 1076 1043
Neutral Grassland 995 891
Acid Grassland 422 439
Bracken 507 399
Dwarf Shrub Heath 407 389
Fen Marsh and Swamp 682 583
Bog 485 577
All habitat types 804 773
b) Great Britain - Aggregate Vegetation Class
AVC 1998 2007 1998-2007
Crops and weeds 943 919
Tall grass and Herb 117 1055
Fertile grassland 1033 1024
Infertile grassland 1061 776
Lowland woodland 1046 1087
Upland Woodland 513 482
Moorland grass mosaics 45 433
Heath and bog 357 363
All vegetation types 804 77
Direction of
significant
changesSoil Zn concentration
(mgkg)
Soil Zn concentration
(mgkg)
Direction of
significant
changes
152
Countryside Survey Soils Report from 2007
7 Soil metal concentrations
Figure 78 Changes (+- 95 CIs) in measured soil Zn concentration in soils (0 -15 cm depth) within a) Broad
Habitats b) Aggregate Vegetation Classes and c) Soil LOI categories across Great Britain Standard errors are
indicated Significant differences p lt 005 p lt 001 p lt 0001 are shown
732 Metals measured only in CS in 2007
Use of a combined ICP-OES approach allowed extension of the suite of measured metal concentrations beyond the initial set of seven metals measured in 1998 to include a total assessment of the concentrations of 26 metal or metalloid elements (Li Be Al Ti V Cr Mn Fe Co Ni Cu Zn As Rb Se Sr Mo Cd Sb Sn Cs Ba W Hg Pb U as well as Cd Cr Cu Ni Pb V and Zn) in almost 500 GB soil samples Seven of these single time point measured metals are reported here but the full dataset is available for download from the CS website The analysis includes stratification of the data available for each chosen metal by Broad Habitat and Soil LOI category The seven chosen metals and metalloids have been selected for initial assessment because they have a known toxicity to humans and wildlife and so have been of long -standing
-75
-50
-25
0
25
Bro
adlea
f
Coni
fer
Ara
ble
Impro
ved
Gra
ss
Neut
ral G
rass
Acid
Gra
ss
Shr
ub Hea
th
Bog
All ha
bita
ts
Ch
an
ge i
n s
oil
Zn
co
ncen
trati
on
(mg
kg
)
-75
-50
-25
0
25
Cro
ps a
nd w
eeds
Tall g
rass
and
Her
b
Fertile
grass
land
Infe
rtile g
rass
land
Upla
nd W
oodlan
d
Moo
rland
gra
ss m
osaics
Heat
h and
bog
All ve
geta
tion
type
s
Ch
an
ge i
n s
oil
Zn
co
ncen
trati
on
(mg
kg
)
-75
-50
-25
0
25
Min
eral
Hum
us-m
iner
al
Org
ano
-min
eral
Org
ani
c
Ch
an
ge in
so
il Z
n c
on
cen
trati
on
(mg
kg
)
a) Broad Habitats
c) LOI categoriesb) Aggregate vegetation class
153
Countryside Survey Soils Report from 2007
7 Soil metal concentrations
regulatory concern because they are essential metals that can elicit both deficiency at low concentration and toxicity at high concentration and or because new application (fuel additive nanomaterial) means that current commercial and consumer product uses are increasing Specific reason for selection for each metalmetalloid are
Al is selected as it is common in soils and has been w idely implicated in toxicity during
acidification
As is selected as it is a known risk for food chain transfer to wildlife and humans
Mn is selected as it is widely used in an increasing number of commercial products
Hg is selected because it is the focus of the Defra Critical Loads metals project and also because
no change has been detected in European Moss Surveys indicating continued deposition at historic
rates
Mo is selected as it is essential and is currently one of the focus metals for EU wide m etals risk
assessment activities
Se is selected as it has a small ldquowindow of essentialityrdquo meaning it is known to cause toxicity at
high concentration but and also to be deficient at low levels in soil
Ti is selected as it is of growing regulatory concern due to commercial uses including in
nanoparticle forms
Aluminium Concentrations of aluminium were higher than those of Cd Cu Cr Ni Pb Zn As Mn Hg Mo Se or Ti by at least a factor of ten and more than this in many cases Within Broad Habitats concentration ranged from 2060 mgkg in Bog to almost 12000 mgkg in Arable and Horticulture and Improved Grassland soils Habitats that are associated with lowland areas on mineral soils such as Improved and Neutral Grassland and Arable and Horticulture contained significantly higher Al concentrations than habitats such as Dwarf Shrub Heath and Bog which are associated with upland areas on organic of organo -mineral soils (Fig 79) The analysis by LOI indicates that Al concentrations in soils are significantly different in organic soils when compared to the three remaining soil categories Since organic soils are most commonly found in habitats such as Bog and Dwarf Shrub Heath this suggests that the soil type associated with these habitats may have important influences on soil Al concentration Particularly important are likely to be the lower pH of soils in upland habitats and also high rainfall rates found in these areas Both of these factors can lead to greater metal mobility resulting in greater leaching losses Figure 79 Measured soil Al concentration (+- 95 CIs) in soils (0-15 cm depth) within a) Broad Habitats b) Soil
LOI categories across Great Britain Columns not sharing the same letter are significantly different at p lt 005
level
ba
0
2000
4000
6000
8000
10000
12000
14000
16000
Bro
adlea
f
Coni
fer
Ara
ble
Impro
ved
Gra
ss
Neut
ral G
rass
Acid
Gra
ss
Shr
ub Hea
th
Bog
S
oil
Al
co
ncen
trati
on
(mg
kg
) a
bb
ab
a
c
d
a
0
2000
4000
6000
8000
10000
12000
14000
Min
eral
Hum
us-
min
era
l
Org
ano-
min
eral
Org
anic
So
il A
l co
ncen
trati
on
(mg
kg
)
aa
b
a
154
Countryside Survey Soils Report from 2007
7 Soil metal concentrations
Arsenic
Concentrations of arsenic analysed by Broad Habitat ranged 302 mgkg in Bog to 1102mgkg in soils under
Improved Grassland (Fig 710) When As concentration are compared across habitats it is evident that the
highest concentration like those for Al are found in Arable and Horticulture and Improved and Neutral
Grasslands Acid Grassland and Broadleaved and Coniferous Woodland soils were intermediate while
habitats associated with more remote and upland area such as Bogs and Dwa rf Shrub Heath soils contain
significantly lower As concentration than soils in lowland agricultural habitats ( Fig 710) Analysis by soil LOI
category indicated that soil As concentrations were significantly higher in mineral soils than in Organo -
mineral and Organic soils (Fig 710)
Figure 710 Measured soil As concentration (+ - 95 CIs) in soils (0-15 cm depth) within a) Broad Habitats b)
Soil LOI categories across Great Britain Columns not sharing the same letter are significantly different at p lt
005 level
Soil Arsenic (As) levels in GB soils measure in CS in 2007 were interpolated using median indicator kriging
to predict the probability of exceeding the median value of the data set (807 mgkg) The use of indicator
kriging rather than ordinary kriging and spatial interpolation arises because of the type of data being
analyzed In the case of soil metals and metalloids the assumption of connectivity between sample points
with extreme values in space is not necessarily va lid As a result ordinary kriging incorporating these
extreme values provides erroneous interpolation biased towards extreme s Indicator kriging provides a
method of spatially interpreting the underlying patterns in the data without such a bias interpo lating the
probability that the data falls above or below a given threshold A probability of 1 or above indicates that the
data exceeds the specified threshold value represented by the median concentration (As 807 mgkg) at that
location Data were interpolated in this manner onto a 1 km GB grid Mapping of As concentration as the
probability to exceed median values indicates highest probability of exceedance (ie high likelihood of high
concentrations) in soil in the Midlands and south of England and Wales (Fig 711) This spatial distribution of
As reflects patterns in As concentration measured in previous soil and stream sediment surveys such as the
NSI soil metal survey and G-BASE The higher frequency of above average soil As concentrations found in
these regions can be linked to the known presence pf As rich Jurassic and Cretaceous rocks from which the
surfaces soils are derived Indeed areas of the south-west of England notably in Devon and Cornwall are
well known for the prevalence of historic arsenic mining areas (eg in the Tamar valley)
ba
0
2
4
6
8
10
12
14
Bro
adlea
f
Coni
fer
Ara
ble
Impro
ved
Gra
ss
Neut
ral G
rass
Acid
Gra
ss
Shr
ub Hea
th
Bog
So
il A
s c
on
cen
trati
on
(mg
kg
) bc
a a
c
ab
cd
d
bc
0
2
4
6
8
10
12
Min
eral
Hum
us-
min
era
l
Org
ano-
min
eral
Org
anic
So
il A
s c
on
cen
trati
on
(mg
kg
)
b
c
a
ab
155
Countryside Survey Soils Report from 2007
7 Soil metal concentrations
Figure 711 Map of probability that a plot exceeds the median value of 807 mgKg As in soils (0 -15 cm)
collected from across GB in CS in 2007 ndash value of one indicate guaranteed exceedance values of 0 non
exceedance
Manganese
Mean manganese concentrations varied between Broad Habitats by approximately an order of magnitude
ranging from 46 mgkg in Bog and 566 mgkg in Dwarf Shrub Heath to 558 mgkg and 495 mgkg in the
Arable and Horticulture and Improved Grassland soils As for Al and As highest Mn concentrations were
found in habitat categories that are associated with lowland areas located principally on mineral soils These
include soils in Improved and Neutral Grassland and Arable and Horticulture habitats Upland habitats
located on acid organic soils such as Bog Dwarf Shrub Heath and also Acid Grassland showed the lowest
Mn concentrations Coniferous and Broadleaved Woodlands were intermediate Analysis by L OI supported a
role for soil type alone in determining the patterns of Mn concentration between Broad Habitats A clear
pattern of significant reduction in measured Mn concentrations was found in soil categories of increasing LOI
(Fig 712) This suggests that the soil characteristics in some habitats such as the lower mineral soil
content and typically lower pH values of Bog Dwarf Shrub Heath and Acid Grassland habitats coupled to
high rainfall in the upland areas may be important in explaining obser ved differences through their effects on
leaching rates
156
Countryside Survey Soils Report from 2007
7 Soil metal concentrations
Figure 712 Measured soil Mn concentration (+ - 95 CIs) in soils (0-15 cm depth) within a) Broad Habitats b)
Soil LOI categories across Great Britain Columns not sharing the same letter are sig nificantly different at p lt
005 level
Mercury Mercury was the sole metal amongst the 13 discussed in detail in this chapter for which measured concentration frequently did not exceed the analytical limits of detection Of the 414 samples successfully digested and analysed for Hg concentration 175 (42) contained Hg concentrations that were below the detection limit of 0067mgkg When correcting the low level unquantified samples to a value of half the analytical detection limit in accordance with standard practice measured Hg concentration between habitats ranged from 0052 mgkg in Arable and Horticulture soil to 0187 in Bog Stratification by Broad Habitat indicated a contrasting trend to Al As and Mn for soil Hg Thus highest concentrations were found in Bogs Dwarf Shrub Heath and Acid Grassland and lowest concentration in Arable and Horticulture and Improved and Neutral Grassland Hg concentrations were also influence by soil LOI category showing significant differences between all treatments with highest values in organic soils ( Fig 713) At high concentrations Hg is known to be toxic to biota and also to accumulate in food chains High Hg concentrations have for example been detected in tissues of piscivorus species in the UK Predatory Bird Monitoring Scheme suggesting that this may be an important exposure route particularly for organic mercury The presence of higher concentrations of Hg associated with habitats such as Acid Grassland Dwarf Shrub Heath and Bog and with Organic soils indicates that the greatest potential for Hg exposure in wildlife is likely to occur in these principally upland areas
ba
0
100
200
300
400
500
600
700
Bro
adlea
f
Coni
fer
Ara
ble
Impro
ved
Gra
ss
Neut
ral G
rass
Acid
Gra
ss
Shr
ub Hea
th
Bog
So
il M
n c
on
cen
trati
on
(mg
kg
)
cd
a a
b
deef
f
bc
0
100
200
300
400
500
600
700
Min
eral
Hum
us-m
iner
al
Org
ano-
min
eral
Org
anic
So
il M
n c
on
cen
trati
on
(mg
kg
)
c
d
b
a
157
Countryside Survey Soils Report from 2007
7 Soil metal concentrations
Figure 713 Measured soil Hg concentration (+ - 95 CIs) in soils (0-15 cm depth) within a) Broad Habitats b)
Soil LOI categories across Great Britain Columns not sharing the same letter are significantly different at p lt
005 level
Molybdenum Mean molybdenum concentrations ranged between Broad Habitats by less than a factor of two Highest concentrations of 0979 mgkg were found in Dwarf Shrub Heath soils and lowest concentrations of 0581 mgkg in Coniferous Woodlands (Fig 714) The difference in Mo concentration between these two Broad Habitats was significant This was not the case for any other Broad Habitat pair except Coniferous Woodland and Bog Stratification by LOI indicated that mineral soils contain significantly lower Mo concentration than either Organo-mineral or Organic soils Difference in mean concentration were however a ctually rather small (maximum difference 02 mgkg between Mineral and Humus-mineral soils)
Figure 714 Measured soil Mo concentration (+ - 95 CIs) in soils (0-15 cm depth) within a) Broad Habitats b)
Soil LOI categories across Great Britain Columns not sharing the same letter are significantly different at p lt
005 level
ba
0
005
01
015
02
025
Bro
adlea
f
Coni
fer
Ara
ble
Impro
ved
Gra
ss
Neut
ral G
rass
Acid
Gra
ss
Shr
ub Hea
th
Bog
So
il H
g c
on
cen
trati
on
(mg
kg
)
c
d d
bc
ab
c
a
d
0
005
01
015
02
025
Min
eral
Hum
us-m
iner
al
Org
ano-
min
eral
Org
anic
So
il H
g c
on
cen
trati
on
(mg
kg
)
b
a
cd
ba
0
02
04
06
08
1
12
14
16
Bro
adlea
f
Coni
fer
Ara
ble
Impro
ved
Gra
ss
Neut
ral G
rass
Acid
Gra
ss
Shr
ub Hea
th
Bog
So
il M
o c
on
cen
trati
on
(mg
kg
) b abab ab
ab
a
aab
0
02
04
06
08
1
12
14
Min
eral
Hum
us-m
iner
al
Org
ano-
min
eral
Org
anic
So
il M
o c
on
cen
trati
on
(mg
kg
)
a
a
ab
b
158
Countryside Survey Soils Report from 2007
7 Soil metal concentrations
Selenium Se is an essential trace element that is also toxic at high concentrations Hence it is often stated to have a small ldquowindow of essentialityrdquo for env ironmental concentration within which neither deficiency or toxic would be anticipated Measured mean Se concentrations in CS in 2007 soils differed between Broad Habitats by approximately a factor of 4 Highest concentrations were in habitats associated w ith low pH organic rich upland soils such as Bog Dwarf Shrub Heath and Acid Grassland Lowest concentrations were in Arable and Horticulture and Improved and Neutral Grassland soils (Fig 715) Analysis by soil LOI stratification indicated significant differences in Se concentrations between all soils types with highest Se concentration associated Organic soils and a clear trend for decreasing concentration in lower LOI soils Cases of Se toxicity have most frequently been associated with point sourc e industrial release scenarios or the local consumption of vegetables grown on selenium-rich carbonaceous shale derived soils (as affected member of a rural Chinese population) Such exposure scenarios are not relevant to the GB situation indicating that Se toxicity is unlikely to be a major national issue of concern As well as high concentrations being toxic to humans as well as other plant and animal species Se can also affect plant growth and animal health as a result of deficiency Again in China th is has been linked both to effects of crop production and also to human disease (Wang and Gao 1998) Currently no criteria exist that set a critical concentration for Se deficiency in soils For plants growing on potentially Se deficient soils it is clear that the value for deficiency will depend on both the plant species considered and also the effect of soil properties on Se bioavailability Further for establishing a lower level for human food consumption and for animal (incl uding livestock) health the composition of the diet and the proportion that is grown on Se deficient soils is also an important factor especially when a prominent portion of diet sourced locally On the basis of published studies probable concentrations for deficiency are likely to be in the range 01-025 mgkg In GB soils no plot contains Se levels below these concentrations Taking a conservative value of 05 mgkg as an indication of potentially deficient soil only 8 of 414 plots (19) contain soi l Se level below this value Hence it is unlikely that deficiency in soils Se concentration is a major factor that is influencing the nature of prevalent plant communities across GB Figure 715 Measured soil Se concentration (+ - 95 CIs) in soils (0-15 cm depth) within a) Broad Habitats b)
Soil LOI categories across Great Britain Columns not sharing the same letter are significantly different at p lt
005 level
Titanium TiO2 is currently one of the most widely used nanoparticle types in consumer products Concerns about the potential effects of nanoparticle on human health and wildlife have resulted in a growing interest in the biogeochemistry of titanium Particularly important is to establish baseline concentration of Ti in so il waters and sediments since these provide a natural background against which any additional input of Ti in
ba
0
05
1
15
2
25
3
35
4
45
Bro
adlea
f
Coni
fer
Ara
ble
Impro
ved
Gra
ss
Neut
ral G
rass
Acid
Gra
ss
Shr
ub Hea
th
Bog
So
il S
e c
on
cen
trati
on
(mg
kg
)
a
aa a
a
a
a
a
0
05
1
15
2
25
3
35
4
Min
eral
Hum
us-m
iner
al
Org
ano-
min
eral
Org
anic
So
il S
e c
on
cen
trati
on
(mg
kg
)
b
a
c
d
159
Countryside Survey Soils Report from 2007
7 Soil metal concentrations
nanoparticle form would have to be detected In GB soil measured Ti concentrations ranged between Broad Habitats by approximately a factor of 3 from a highest concentration of 109 mgkg in Bog soils to 325 mgkg in Neutral Grassland (Fig 716) Between Broad Habitats soils from Bog Dwarf Shrub Heath and Acid Grassland contained higher concentrations than Arable and Horticulture and Neutral and Improved Grassland with Broadleaved and Coniferous Woodland intermediate Stratification by LOI indicated that mineral soils contained significantly lower Ti concentration than Oragno -mineral soils The analysis indicates a relatively high background level of Ti in GB soils (50-100 mgkg) against which any future inputs of titanium must be detected Figure 716 Measured soil Ti concentration (+ - 95 CIs) in soils (0-15 cm depth) within a) Broad Habitats b)
Soil LOI categories across Great Britain Columns not sharing the same letter are significantly different at p lt
005 level
74 Discussion and Policy Implications
A number of surveys have measured metal concentrations in soils and stream sediments collected from a network of sites within GB or constituent countries The UK Soil and Herbage Survey conducted by the Environment Agency (EA) for England and Wales measured concentrations of 13 elements (Cd Cr Cu Mn Hg Ni Pb Pt Ti V Zn Sn As Zn) in soil and vegetation from 122 rural sites 29 urban sites and 54 industrial sites across the UK (Ross et al 2007) Measurement of soil (015cm) trace element concentrations were accompanied by additional measurements of the concentration of organic pollutants including polychlorinated biphenyls polycyclic aromatic hydrocarbons and polychlorinated dioxins and furans Analysis of the data was conducted to assess mean concentration o f measure trace pollutants and metals in soil according to Country (England Scotland Wales) and site location ( rural urban industrial) All data from the UK Soil and Herbage Survey has been published To date however the sampling and analysis campaig n has not been repeated meaning that an assessment of change in trace element concentration is not possible within the dataset An extensive survey of metal concentration in UK soils has also been conducted within the framework of the National Soil Inventory (NSI) program This study has reported on a range of properties of UK soils including total and extractable metal concentrations in over 6000 soil samples collected across England and Wales with further data for Scotland available through the NSI Scotland Phase 1 and 2 projects A set of detailed spatially resolved maps have been produced from this data which include maps of soil metal concentration (McGrath and Loveland 1992) The Geochemical Baseline Survey of the Environment (G-BASE) which is coordinated by the British Geological Survey (BGS) is also a large scale and long running survey of stream water stream sediment and soil chemistry that has measured metal concentrations in stream and soil
ba
0
20
40
60
80
100
120
140
160
180
Bro
adlea
f
Coni
fer
Ara
ble
Impro
ved
Gra
ss
Neut
ral G
rass
Acid
Gra
ss
Shr
ub Hea
th
Bog
S
oil
Ti
co
ncen
trati
on
(mg
kg
)
bc
d cd d
ab
aa
cd
0
50
100
150
200
250
Min
eral
Hum
us-m
iner
al
Org
ano-
min
eral
Org
anic
So
il T
i co
ncen
trati
on
(mg
kg
)
a
a
a
b
160
Countryside Survey Soils Report from 2007
7 Soil metal concentrations
samples (5-20 cm depth) collected at an average density of one sample every 1ndash2 km2 of UK land surface
(wwwbgsacukgbasehomehtml) To date G-BASE has been completed for all regions except the Southern third of England with this area is scheduled for completion over the next decade Compared to the EA NSI and BGS surveys the soil component of Countryside Survey in 2007 has a spatial resolution for the trace metals comparable with that of the EA‟s UK Soils and Herbage survey The Soil and Herbage survey included 205 sample sites while CS has measurements for 256 squares although within each square 5 samples in CS in 1998 and 2 in CS in 2007 have been measured The spatial resolution of CS is however below those of either the G-BASE or the NSI datasets which each comprise a much greater number of analysed samples Compared to the other major soil and stream sediment survey con ducted in the UK CS is unique because sites are visited over a single season at time periods separated over a number of years (6-9 year intervals between surveys) Within the soil component of CS samples have been collected on three occasions in survey years (1978 1998 2007) and trace metal concentrations measured in the surveys in 1998 and 2007 This means that CS has the unique ability to look for large scale change in soil properties including trace metal concentrations over time within GB top soils (0-15 cm) Despite the (relatively) sparse spatial resolution CS soil metal analyses can nonetheless be a valuable addition to current knowledge on trace element concentrations in GB soils In particular because soil metal concentrations are not measured in isolation but instead form part of a wider survey of the physical chemical and biological characteristics of GB habitats measurement of soil metal concentrations can be stratified and correlated according to a range of other measurement parameters Metal content of soil is derived from two main sources (Boruvka et al 2005) - either naturally from the geogenic weathering of base rock during soil formation (pedogenesis) or anthropogenically through point source or diffuse pollution andor solid waste disposal (Merian et al 2004) There is therefore a need to consider both potential sources when assessing d ifference in metal concentration between habitats and also over time In the absence of human inputs it can be expected that the metal concentration of soils will reach a steady state which represents the balance of inputs derived from weathering and natu ral deposition (eg volcanic) and outputs due to leaching and vegetative off -take Additional human associated inputs can result in an increase in soil metal concentrations because the increased fluxes to soils will mean that inputs exceed outputs thereby allowing concentrations to rise As soil concentrations start to increase due to for example human associated deposition rates of leaching will begin to increase until eventually a new steady state at a higher soil metal concentration is reached - although this may take decades to hundreds of years depending upon the metal If inputs then reduce long-term reductions in soil concentrations may be initiated as leaching rates exceed inputs Available evidence from the UK Heavy Metal Deposition Monitor ing herbarium studies and Europe-wide survey of metal concentration in moss samples suggests that currently the rates of aerial deposition of metals to soils peaked in the UK in the 1960-1970s and are now in steady decline (RoTAP 2010) Legislation on the concentrations of metals present in fertilisers (especially Cd) domestic and industrial sludges and other waste streams regularly recovered to land have also been effective in reducing input concentrations for a range of trace elements Although input ra tes are likely to be decreasing work within Defra supported projects to assess environmental risks of metals for UK soils still predict exceedances of estimated critical load for Cd and Pb in 96 and 6 of UK soil respectively (Hall et al 2006) Comparison of the concentrations of Cd Cu Pb and Zn measured in CS soil samples in 1998 also indicated that measured concentrations exceeded the soil pH and LOI corrected critical limits for these metals as developed by Lofts et al (2004) within Defra funded projects to develop a critical loads approach for trace metals by at least a factor of 3 in 0 207 155 and 221 of soil samples for Cd Cu Pb and Zn respectively (Spurgeon et al 2008) These analyses suggest that soil metal concentrations in GB are elevated as a result of direct inputs and that risk to soil communities as a result of this metal loading cannot be excluded With inputs in potential decline a key aim in CS was to see whether the trend for increasing soil surface metal concentration has been reversed to the point where leaching and other losses may exceed inputs and so measured soil metal concentrations may have started to decline a t a rate detectable in the timeframe of successive Countryside Surveys When looking for change between temporally separate surveys it is important to consider the influence that any difference in survey methods may play since differences in method may lead to potentially spurious indications of change Unfortunately in the case of soil metal analysis within CS a major change in the analytical procedure had to be implemented because of changes in the infrastructure available at the analytical laboratory In particular the hot plate reflux system used for the
161
Countryside Survey Soils Report from 2007
7 Soil metal concentrations
digestion of all soil in CS in 1998 was not available for the reanalysis in 2007 The alternative method used was microwave digestion For both procedures the regent used was Aqua Regia While use of the same reagent for digestion is an important consideration it is also possible that the changes in the temperature and pressure condition during digestion may have an effect on digestion efficiency and on concentrations measured from similar samples To investigate this results for the standard reference material BCR CRM141R calcareous loam soil which was measured multiple times through the analysis programme of both surveys were compared to determine whether the different digestion methods used result ed in similar estimates of trace element concentration in the CRM The CRM assessment was supported by a targeted reanalysis of 1998 collected soils using the 2007 method The comparison of measured concentration in the CRM revealed that the two methods gave slightly different quantification for Cd Cr Cu Ni Pb V and Zn concentrations (Table 72) and this was supported the results of the reanalysis of CS in 1998 soils (Table 73) Thus to allow change analysis a back correction of 1998 measurements wa s conducted to recalculate measured concentration for the 1998 soils to a predicted concentration that would be expected assuming analysis using the 2007 method This was done by dividing 1998 measurements by the ratio of the 19982007 mean measured concentrations for the BCR CRM141R analyse Checks that a single value for correction was applicable to all soils were conducted by plotting predicted change between surveys against both the LOI and pH measured in CS in 2007 soils These plots indicated no clear trend for difference with LOI for 6 of 7 metals and no clear trend for 5 of 7 metals for pH Exceptions were V which showed dependency of change on pH and LOI and Cr which showed slight dependency for pH With metal inputs to GB soils estimated to be fa lling dynamic modelling within Defra funded projects on critical loads assessment has been used to estimate the potential residence times of some existing pollutant metals in UK soils This has suggested that the metals will reside in soils for at least m any decades even for relatively mobile metals (eg Cd Zn) and possibly many millennia for metals that have a high affinity to soil organic matter (eg Cd Pb) (Tipping et al 2006b) Extensive datasets on the rates of change of concentrations of metals in soils are currently however scarcely available against which to validate these model predictions The analysis of change between back corrected 1998 data and measurements made in CS in 2007 outlined here can be used to provide initial insight into the rates of change of soil trace metal concentrations Results indicated that generally only small scale changes in measured soil metal concentrations were found between survey years Comparison of concentration indicated that a change in estimated 1998 and measured 2007 concentrations of greater than 10 wer e found in 6 of 21 stratification levels (Broad Habitat AVC soil LOI Category) for Cd 9 of 21 for Cr 13 of 21 for Cu 3 of 20 for Ni 3 of 20 for Pb and 5 of 22 for Zn The small magnitude of change in soils estimated between surveys means that a sig nificant change in concentrations at the GB scale was detected only for Cu For this metal a small magnitude but highly significant estimated increase in measure concentration of 2 mgkg was detected No other metal showed a significant change in measured concentration across GB Stratification of the data by Broad Habitat AVC and soil LOI revealed addition information about patterns of change in soil metal concentrations in different strata All metals showed significant change for at least one category level Importantly when considering stratification by so many categories the potential for type 1 statistical error is increased in line which the number of strata considered To include analysis by broad AVC and soil LOI category involves separate statistical testing of approximately 20 separate categories for each metal Since the significance of each is calculated separately and the cut off for statistical significance was 005 it will be expected that for each analyte one type I error (ie a false positive where a truly non-significant result is deemed significant in a test) would be anticipated within the analysis While multiple sample correct algorithms can be used to control for type I error arising from multiple testing for significance in CS such algorithms are not used because the extra stringency for type 1 error come with the penalty of an increase probability of type 2 errors (ie a truly significant result deemed non-significant in a test) This could mean that truly significant effects at the national scale are missed with potential impact for the environment and policy Where statistically significant effects are found careful review of relevant evidence that supports these as true responses is needed In particular identification of po tential drivers of change is needed as discussed briefly below Cadmium Soil (0-15cm) Cd showed only relatively small changes between survey with an overall decline of 0013 mgkg (3) in 2007 soils The only statistically significant change found related to a significant decrease in soil Cd in Heath and Bog vegetation and Organo-mineral soils The overall decline in Cd concentration might reflect declining deposition of this metal as detected in monitoring programs Cd is a particularly labile metal
162
Countryside Survey Soils Report from 2007
7 Soil metal concentrations
and as a result it may be expect to show relatively rapid leaching from soils leading to reduced soil Cd levels There is no obvious reason why either Heath and Bog vegetation or Organo -mineral soil should show significant reductions in soil Cd while other habi tats do not One possibility is that the remaining presence of Cd in some fertiliser may be maintaining Cd concentration in farmed soils while in soils that are not subjected to fertiliser application during land management soil Cd loses may now exceed in puts allowing concentration to reduce Chromium Soil (0-15cm) Cr showed a decrease of 09 mgkg (46) between 1998 and 2007 Broadleaved Wooodland Arable and Horticulture and Improved and Neutral Grassland soils characterised by Crop and Weed and Fertile Grassland vegetation showed significant decreases in soil Cr levels Decreases were also found in Mineral and Humus-mineral soils Bogs and Organo-mineral soil showed significantly higher soil Cr concentrations The results for Cr initially suggest that in managed habitats particularly those where crops including grass for livestock are grown the predominant trend of soil Cr concentration is down This is not though the case with Acid Grassland Dwarf Shrub Heath and Fen Marsh and Swamp soils which i n addition to Bogs showed increased Cr concentrations There are two potential explanations for the differences in trend in Cr concentration between habitats as observed The first potential cause of the apparent trend in soil Cr concentration is that me asurement errors relating to difference in digestion efficiency between high pH low LOI mineral soils and low pH high LOI organic soils may be in part responsible Comparisons of change across the 2007 soil pH and LOI range indicates that there is no trend for Cr concentration to show greater change in more organic rich soil ( Fig 72) A slight trend for greater change in high pH soil is however indicated ( Fig 71) At a neutral pH this effect results with a potential discrepancy of up to 27 mgkg in back corrected 1998 concentrations Effects of the method shift between surveys may therefore be the cause of some of the observed declines in mineral neutral soils and associated habitats and vegetation classes For low pH soils effects associated wi th method change are likely to be less important as a cause of Cr concentration increase since comparison suggests comparability between predicted 1998 and measured 2007 concentrations at higher pHs In those habitats that are characterised by low pH such as Bogs Acid Grassland and Dwarf Shrub Heath the increased Cr concentration found cannot therefore be disregarded as a methodological error suggesting that in these areas deposition loads may still exceed loses A second potential reason for the habitat difference found in the direction of change of soil Cr concentration that is also worth consideration is the role of cropping as an additional loss flux The habitats where Cr concentrations were increasing namely Arable and Horticulture and Grassla nds are predominately used for agricultural production In these systems harvesting of plants and livestock may provide a route of loss of Cr from soil that is not relevant to areas not under agricultural production Such increased loss may contribute to the reduction in soil Cr found in these areas when compared to uncropped areas Copper Soil (0-15cm) Cu was the only metal that showed a significant change at the GB scale increasing by a mean value of 2 mgkg across the full dataset Comparison of the effect of the change in digestion procedure between surveys by analysis of CRMs indicated that only a small change in measured Cu concentration resulted This meant that only a small correction factor needed to be applied to the 1998 measured values Analysis of change in soil Cu between back corrected 1998 and 2007 values in relation to both soil pH and LOI indicated that the magnitude of Cu change in soils could not be related to either parameter The small size of overall change between CRM measurements made by different methods and also the absence of trends with soil pH and LOI suggests that the change in digestion procedure was not a major contributing factor behind the observed increase in soil Cu concentrations Within habitats Improved Grasslands Dwarf Shrub Heath and Bog also showed significant increases in soil Cu as did the AVCs associated with these habitats Significant changes in 3 of 4 soil LOI categories were also found Cu has a high affinity with soil organic matter and so it may be expected to show only very low rates of leaching loss from soils Even if inputs of Cu in soils were reduced to zero it would be anticipated that the Cu that has already been loaded into GB soils would take a considerable time (perhaps many centuries) to be completely leached Monitoring networks have shown that the concentrations of Cu being deposited to soil are likely to be decreasing as a result of tighter emission controls However in contrast to other metals the
163
Countryside Survey Soils Report from 2007
7 Soil metal concentrations
magnitude of these decreases in deposition remains relatively modest For example Cu deposition had reduced by only 20 in a European wide survey of metal concentration in mosses compared to 72 for As 72 for Pb 60 for V and 52 for Cd At the same time while deposition has been slight ly decreasing there is a growing body of evidence to suggest that the use of Cu containing supplements in the livestock industry are potentially increasing the Cu load being added to soils under grazed areas and in areas to which animal manures are applied Additionally Cu concentrations are known to be associated with sewage sludge material and green waste which are frequently recovered to land The fact that among habitats Improved Grasslands were found to contain Cu concentrations significantly increas ed by 26 mgkg suggests that the presence of Cu concentration in animal manure may indeed being playing a role in increasing national soil Cu levels to some extent That Cu concentration were also increasing in all other habitats and significantly in some cases can be taken as quite strong evidence that currently Cu inputs still exceed outputs from leaching and cropping leading to further elevation in Cu concentrations over time
Figure 717 Map of estimated change in measures soil Cu concentration (mgkg) in soils (0-15 cm) collected
from across GB in CS in 1998 and 2007
Figure 917 Map of estimated change in
measured soil Cu concentration in soils
(0-15 cm) collected from across GB in CS
in 1998 and in 2007
164
Countryside Survey Soils Report from 2007
7 Soil metal concentrations
An analysis of the spatial structure within estimated change in soil Cu concentrations was conducted by using
kriging to interpolate values for change (Fig 717) This analysis was done using ordinary kriging to
interpolate between the Countryside Survey sample points Routine checking of data for outliers was
conducted and the working data set was transformed using a normal score procedure to obtain a Gaussian
distribution The data were then interpolated on a 1km UK grid using ordinary kriging and finally the kriged
data were back-transformed to produce an interpolated map of Cu change Mapping highlighted significant
spatial structure within the change dataset with greatest increases being associated with hotspots in areas
of the Northern England and Mid and South Wales uplands Where decreases were indicated these were
associated most commonly with reductions in concentration in lowland areas of the South and East England
that are associated with intensive arable land use Mapping of change thus highlights that increases in soil
Cu occurred principally in upland areas where both output fluxes associated with cropping may be limited and
also where livestock rearing may play a role as a potential additional source of Cu input Nickel Soil (0-15cm) Ni increased across all soils by 16 mgkg between survey years Two habitats showed significant decreases in measured soil Ni These were Broadleaved Woodland and Arable and Horticulture Crop and Weed vegetation also showed significant decrease Ni increased significantly in Neutral Grassland and Bogs As decreases were concentrated in habitats associated frequently with neutral low organic soils this raises the possibility that differential digestion efficiency may be a factor in the observed difference as was suggested to be the case for Cr Comparison of trends of change between back corrected 1998 and 1998 measurements however suggests that this was not the case as no trend with either pH or LOI was observed (Fig 71 and 72) The fact that the habitats that showed increases in Ni are associated with different soils types also suggests that analytical artefacts are not the primary cau se of the observed change A second potential cause of change may be the role of cropping as an additional loss flux for this metal as also highlighted for Cr In particular in Arable and Horticulture area harvesting of plants may provide an additional route of loss that allows soil Ni concentrations to decrease Such losses would not be relevant to less productive land such as Bogs where removal of plant biomass does not regularly take place
Lead Soil (0-15cm) Pb concentrations showed a small non-significant decrease between surveys This is potentially consistent with an overall loss of soil Pb in particular as the move to unleaded petrol has substantial decreased Pb inputs over the past two decades Although the overall dataset indicated slight losses two habitats showed significant increases There is no obvious reason why these two habitats Improved Grassland and Dwarf Shrub Heath should show such increases particularly as they are associated with different soil types Among AVCs and soil type no significant change in soil Pb concentrations were found The relatively small change in measured soil Pb and limited significant change in only a small number of unrelated habitat strata suggests that the high affinity of Pb to soil organic matter whi ch results in long predicted residence times for of Pb in soils may currently be limiting rates of Pb loss from soils Thus while deposition maybe decreasing soil Pb concentrations may be doing so only very slowly or not at all Zinc Zn (0-15cm) showed a small non-significant decrease between surveys and Zn concentrations were significantly reduced in two habitats Arable and Horticulture and Neutral Grassland No dependency of change between back corrected 1998 and 2007 measurements on either soil pH or LOI was detected in the dataset This suggests that the decreases seen are probably not the result of an analytical artefact relating to different efficiencies of soil digestion Instead the potential role of cropping as an additional loss flux as highlighted earlier for Cr and also for Ni may be important As deposition rates decrease in those areas where there is loss both from leaching and cropping it is possible that outputs may exceed current rates of metal inputs leading to a small but in some cases significant overall loss of soil Zn
165
Countryside Survey Soils Report from 2007
7 Soil metal concentrations
741 Policy implications The results of the comparison of back corrected 1998 and CS in 2007 analyses indicated that as would be expected only relative small changes in soil trace metal concentrations had occurred between surveys For one metal Cu the difference (an increase) was statistically significant For all metal s when data was stratified further statistically significant differences were seen For Cu these were mainly associated with significant increases for two metals Cd and Pb the changes were small and apparently idiosyncratic while for three metals (Cr Ni Zn) the changes were somewhat similar with reduction seen particularly in crop lands and no change or in some case slight and sometimes significant increases found in less managed habitats Overall the results suggests that at present the changes in deposition that have occurred over recent decades have yet to lead to substantial changes in measure d soil metal concentrations For some metals such as Cu and Cd it is l ikely that additional sources (animal manures and possibly sewage sludge manures and compost for Cu and fertiliser for Cd) beyond atmospheric inputs are important in maintaining or even increase soil concentrations principally in managed areas For the remaining metals especially Cr Ni and Zn there is some suggestion that in areas where cropping takes place output fluxes may now exceed inputs meaning that soil concentrations can start to decline Overall this suggest s that the managed landscape where intensive cropping takes place but sewage sludge animal manures and composts are rarely applied may be among the first habitats to show a return of GB soil metal concentrations from their current slight -moderately elevated states to their pre-industrial background concentrations These areas could thus be a focus for future monitoring
75 References
REFERENCES
Boruvka L Vacek O Jehlicka J 2005 Principal component analysis as a tool to indicate the origin of
potentially toxic elements in soils Geoderma 128 289-300
Emmett BA Frogbrook ZL Chamberlain PM Griffiths R Pickup R Poskitt J Reynolds B Rowe
E Spurgeon D Rowland P Wilson J Wood CM 2008 CS Technical Report No 307 Soils Manual
NERCCentre for Ecology amp Hydrology 180 pp (CEH Project Number C03259)
Hall JR Ashmore M Fawehinmi J Jordan C Lofts S Shotbolt L Spurgeon DJ Svendsen C
Tipping E 2006 Developing a critical load approach for national risk assessments of atmospheric metal
deposition Environmental Toxicology and Chemistry 25 883-890
Lofts S Spurgeon DJ Svendsen C Tipping E 2004 Deriving soil critical limits for Cu Zn Cd and Pb
a method based on free ion concentrations Environmental Science and Technology 38 3623-3621
McGrath SP Loveland PJ 1992 The Soil Geochemical Atlas of England and Wales Blackie Academic
and Professional Glasgow
Merian E Anke M Inhat M Stoeppler M (Eds) 2004 Elements and their Compounds in the
Environment Wiley VCH Weinheim Germany
Ross SM MD W Copplestone D Warriner M Crook P 2007 UK Soil and Herbage Pollutant Survey
Environmental concentrations of heavy metals in UK soil and herbage UK Soil and Herbage Pollutant
Survey Environment Agency p 132
RoTAP 2010 Review of Transboundary Air Pollution Acidification Eutrophication Ground Level Ozone and
Heavy Metals in the UK Defra
166
Countryside Survey Soils Report from 2007
7 Soil metal concentrations
Spurgeon DJ Rowland P Ainsworth G Rothery P Long S Black HIJ 2008 Geographical and
pedological drivers of distribution and risks to soil fauna of seven metals (Cd Cu Cr Ni Pb V and Zn) in
British soils Environmental Pollution 153 273-283
Tipping E Lawlor AJ Lofts S 2006a Simulating the long-term chemistry of an upland UK catchment
Major solutes and acidification Environmental Pollution 141 151-166
Tipping E Lawlor AJ Lofts S Shotbolt L 2006b Simulating the long-term chemistry of an upland UK
catchment Heavy metals Environmental Pollution 141 139-150
Wang ZJ Gao YX 1998 Biogeochemical cycling of selenium in Chinese environments 1st Asia Pacific
Symposium on Environmental Geochemistry Pergamon-Elsevier Science Ltd Hong Kong Peoples R China
pp 1345-1351
167
Countryside Survey Soils Report from 2007
8 Soil invertebrates
Summary
There were an estimated 128 quadrillion (128x1016
) soil invertebrates present in the top 8 cm of
Great Britain soils during the time of Countryside Survey sampling in 2007 C omparing these
results with those from the survey in 1998 has enable change in soil biodiversity to be estimated at
a national scale
A significant increase in total invertebrate catch in samples from soils (0-8cm) from all Broad
Habitats Aggregate Vegetation Classes and soil organic matter categories except for agricultural
areas on mineral soils was found in Countryside Survey in 2007 The increase in invertebrate catch
was mainly the result of an increase in the catch of mites in 2007 samples This resulted in an
increase in the mite springtail ratio but a decreased Shannon diversity due to the dominance of
mites in 2007 cores
A small reduction in the number of soil invertebrate broad taxa (0 -8cm) was recorded which is not
inconsistent with reported declines in soil biodiversity However repeat sampling is required to
ensure this is not linked to different seasonal conditions in the two sampling years F urther
analysis through focussed study may be needed to assess whether the changes in soil chemistry
land management annual weather patterns or merely natural population variation can explain
observed soil invertebrate community changes
81 Policy background
Key Question Does CS provide any evidence to indicate that there has been a loss of soil biodiversity as has been stated by the EU Measurements Enumeration of the number of soil invertebrate presence within Tullgren funnel extractions of 927 separate 4 cm diameter 8 cm long soil cores collected from plots across GB to give 1) total catch of invertebrates from all broad taxa 2) the number of broad taxa represented by the presence of at least one individual in a core 3) total catch of mites and springtails 4) the ratio of Mites Springtails 5) the Shannon Diversity statistic calculated using counts of the number of individuals within broad taxa including springtail superfamily From this analysis CS in 2007 has provided
Whole Broad Habitats Aggregate Vegetation Class and soil type stratified assessments of the
characteristic (total catch broad taxa representation total catch and relative catch of mites and
springtails Shannon Diversity) of soil invertebrate communities across Great Britain
Information of the change in characteristic of soil invertebrate communities in Great Britain soils
(0-8cm) since initial measurement in Countryside Survey in 1998
Data to contribute to analysis of changes in vegetation selected soil properties and other habitat
characteristics between successive Countryside Surveys in 1998 and 2007
The activities of the soil biota are critical for the provision of many important soil functions and resulting ecosystem services These include but are not limited to biomass production storing filtering and transforming nutrients contaminants and water and acting as a biodiversity pool from which future novel applications and products can be derived Because they are intimately involved in many important soil functions and are fundamental to maintaining soil quality the biological components of soils have considerable potential as indicators of soil quality National-level requirements for biological indicators were
168
Countryside Survey Soils Report from 2007
8 Soil invertebrates
outlined in the Soil Action Plan for England (Defra 2004) and have been investigated in a series of projects funded by Defra as part of the UK Soil Indicators Consortium These have been assessing the relative performance of a range of potential soil bioindicators under field conditions At present comparatively l ittle is known about the biodiversity of soil compared to for example above ground diversity In the microbial realm molecular approaches such as terminal restriction fragment length polymorphism (tRFLP) phylogenetic microarrays and metagenomics are starting to reveal patterns in the diversity and distribution of soil microbes For the soil meio- meso- and macro-fauna molecular approaches to biodiversity assessment still remain in development For some key groups such as earthworms and springtails good keys to the UK and other national fauna do exist although even in these cases traditional morphological taxonomy can be hampered by cryptic speciation (ie occurrence of groups of species which are reproductively isolated from each other but have high morphological similarity) and other taxonomic uncertainties Beyond these better known groups in taxa like mites and nematodes there are significant issues for morphological identification associated with the lack of keys laborious nature of the work and declining expert base Because they are often poorly known few soil species are recognised for their conservation value A few such as some ants and fungi are covered by UK Biodiversity Action Plan (UK BAPs) However as knowledge of soil biodiversity is often sparse it is not well known if and how climate land use land management change and pollution affect populations of even these relatively well known and highly valued species let alone the large amount of often hidden diversity that maybe present in soils Beyond the few soil species covered by BAPs there is a well recognised need to quantify soil biodiversity and determine whether it is possible to observe consistent patterns of population and community structure against a dynamic background of spatial and seasonal variability Key questions in this area of research and conservation relate to determining if and how soil biodiversity changes over time and the nature of the environmental drivers of any such changes Large-scale biodiversity assessment as well as long-term experiments and focussed mesocosm and laboratory studies are all important tools that can contribute data to improve current knowledge in this area
82 Methods
821 Proof of concept
Invertebrate diversity was first measured as part of CS in 1998 and CS is the first and only national scale monitoring of soil biodiversity in the UK The inclusion of invertebrate diversity measurements in CS in 1998 was partially driven by a 1996 report of the Royal Commission on Environmental Pollution (RCEP) on the Sustainable Use of Soils which identified the development of indices of soil biological activity and diversity as a key research priority In the RCEP report it was recognised that a major difficulty in developing soil biodiversity based indicators was the requirement for baseline data on population and community structure and how these change over time It was within this context of a need for baseline information that an assessment of soil biodiversity was deemed timely within CS in 1998 CS was chosen as a suitable vehicle for the assessment because the existing survey infrastructure and sampling regime used in CS could provided a cost-effective framework for integrating a soil biological survey into a study that already included assessment for other land use soil vegetation and water parameters The aim of the soil invertebrate diversity measurements that were conducted in CS in 1998 (enumeration of mainly mesofauna groups collected by Tullgren extraction of a relatively small soil core) was not to sample and identify all invertebrate diversity within a given plot Such an all-taxa biodiversity inventory would instead require use of a wide range of sampling techniques and would be a massive undertaking and highly expensive Instead the aim of CS in 1998 was to produce an initial baseline dataset of invertebrate group level community composition across all major soil groups and habitats of Great Britain The strategy was to capture soil invertebrates that would be abundant and relatively cost -effective to identify The group of soil
169
Countryside Survey Soils Report from 2007
8 Soil invertebrates
invertebrates that best suited these criteria was the soil mesofauna To sample the soil fauna intact soil cores (4 cm diameter 8 cm long) were collected for laboratory extraction of mesofauna This approach was favoured over the use of an on-site hand-sorting technique which would be effective for macroinvertebrates or pitfall trapping which would preferentially sample soil surface active invertebrates Identification of the extracted invertebrates was conducted to broad taxa (phylum order) level for all available and successfully extracted samples (total 1076) collected from CS squares that were initially visited in the 1978 survey Table 81 Overview of soil invertebrate samples and level of taxonomic resolution for CS in 1998 and 2007
1998
2007
Main Plots
km-squares
Main Plots
km-squares
Total sampled 1286 256 927 238 Broad invertebrate taxa 1076 237 927 238 Mites (Acari) Separated to broad group a
-
-
238
90
Checked for Oribatid presence 963 237 238 90 Oribatids present 504 182 212 90 Oribatids identified to species b 504 182 - - Springtails (Collembola) Checked for Collembola presence Separated to broad group c
1076
237
927
238
Collembola present 837 233 816 238 Collembola identified to species 336 176 - -
a Separated into Oribatids Mesostigmatids and Prostigmatids
b PresenceAbsence data only
c Separated into Entomobryoidea Poduroidea Neelidae and Sminthuridae
While the invertebrate sampling undertaken in CS in 1998 identified and enumerated invertebrates extracted to broad taxa for all cores it was also decided to undertake a limited identification of some taxa to a deeper taxonomic resolution (Table 81) Of the two main mesofaunal groups the mites and springtails the mites (Acari) were checked for the presence of the most common major group the oribatidae in the community sample while the Collembola were identified into the superfamily groups of entomobryoidea neelidae poduroidea and sminthuridae In the CS in 1998 samples 504 samples were check for the presence of oribatids mites and all 1076 separated to superfamily for the Collembola In all of the 504 samples checked for oribatids additional identification of mites was undertaken to establish the presenceabsence of individual oribatid species This species level identification was conducted on a voluntary basis by Mr Frank Monson For the springtails species identification and enumeration was conducted for 336 samples representing approximately one third of available samples Analysis of the patterns of distribution of invertebrates in CS in 1998 detected significant differences in invertebrate diversity between Environmental Zones Broad Habitats ITE L and Classes Aggregate Vegetation Classes and Soil Types The 1998 CS dataset forms a valuable baseline that can be used to place specific site region and country-scale changes within a regional and national environmental context Resampling of the CS sites in 2007 provided an opportunity to determine whether these patterns of invertebrate diversity can be consistently detected against a background of spatial and temporal heterogeneity within soil communities The detailed protocols that were developed for soil invertebrate sampling in CS in 1998 have been used for the re-sampling in 2007 By returning to the majority of the CS plots first sampled in 1998 CS in 2007 can
170
Countryside Survey Soils Report from 2007
8 Soil invertebrates
provide information on the temporal stability of soil communities Resource limitations in 2007 meant that it was not possible to identify all invertebrates in all the cores that were collected from the remaining Main Plots that were first sampled in 1998 Of the cores that were available from re -sampled sites a total of 927 cores have been enumerated to broad taxa Of these 927 samples superfamily level identification was conducted for the springtails for all cores and separation of mites to major group for 238 Limited resources meant that no species level identification could be supported although all extracted invertebr ates have been stored and can be made available for future identification on request Soil invertebrate sampling and analysis throughout the CS project is summarised in Table 82 below Table 82 Summary of rationale for measurement of soil invertebrate community composition in CS
Facts Comments
History in CS First measured in CS in 1998 for Main Plots in original 1978 squares only (total 1076 samples)
Repeat of most plots in CS in 2007 to initiate first ever national time-series for soil community assessment
Country level reporting No CS in 1998 did not give country level statistics Smaller data-set in 2007 limits power for Country level reporting for habitat vegetation and soil types stratifications
Links and compatibility to other monitoring programmes
No other GB wide survey or monitoring programmes for soil mesofauna Earthworms surveys being undertaken in Scotland and as part of the Opal project run by the Natural History Museum London
CS unique in UK as soil biodiversity assessment is integrated with other survey approaches that measure land use vegetation soil properties and waters Other countries such as the Netherlands Germany and Canada also have programmes involving biodiversity assessments Measurements of microarthropods are compatible with these schemes
Uniqueness of CS No other GB datasets Only UK wide dataset for mesofauna communities Only UK dataset with time series from repeat visits
Value for money (Policy priority or interpretative value x cost)
Medium Policy relevant and scientifically significant Relatively low cost
Important to establish whether it is possible to detect meaningful changes against spatial and temporal variability
Important in interpreting other data such as UK microbial survey and for integrated assessment
Samples for invertebrate identification and enumeration were collected at all selected Main Plots This included all of the original 1978 256 squares sampled in CS in 1978 that could be revisited Sampling was undertaken using 4 cm diameter by 8 cm long white plastic core following the detailed field protocol described in Emmett et al (2008) and briefly summarised in Chapter 1 Briefly surface vegetation was removed to reveal the soil surface Any litter layer present was not removed The core was knocked into the
171
Countryside Survey Soils Report from 2007
8 Soil invertebrates
ground to the full length of the core using a mallet and plate In stony or shallow soils the sampling point was moved if a full core depth would not be obtained Any such variations in core location were recorded On removal of the core from the ground the outside of the core was cleaned and any excess soil trimmed from the bottom of the core Caps were then gently pushed over the ends of the core and the intact sample posted to CEH in Lancaster as the quickest route of return given the countrywide nature of the sampling programme Soil invertebrates were extracted from cores as soon as possible using a dry Tullgren extraction method This uses surface heating of the exposed surface of the core to drive the soil fauna downwards and out of the open bottom end of the core and into the collection bottles filled with a 70 ethanol preservative below Once collected soil invertebrates were identified to major taxa (Taxonomic level 1) and counted The broad taxa categories used for enumeration was acari araneae chilopoda ndash geophilomorpha chilopoda ndash lithobiomorpha chilopoda coleoptera collembola ndash entomobryoidea collembola ndash neelidae collembola ndash poduroidea collembola ndash sminthuridae copepoda diptera diplura diplopoda gastropoda hemiptera hymenoptera isopoda lepidoptera nematoda nematomorpha oligochaeta opiliones pauropoda protura pseudoscorpions psocoptera pulmonata symphyla thysanura thysanoptera unknown All extracted invertebrates collected from counted cores have been stored in ethanol and are available for further species level identification to interested parties Invertebrate numbers were reported for each quantified soil core
822 Quality control
After an initial identification to broad taxa mite group and springtail superfamily at regular intervals the samples were reassembled and resorted identified and enumerated by an alternative member of staff This second identification and count ing step was then compared with the original count to assess the potential for operator error during processing If any substantive differences in count were found by this cross checking procedure counting was halted and the differences in identifications that lay behind the discrepancies resolved by the counting team Any such changes were noted on the record sheets kept for each sample
823 Reporting
Change in the composition of the soil invertebrate communities as represented by c ounts of the macro and mesofaunal group collected by Tullgren extraction of soil cores collected in CS in 1998 and 2007 have been analysed using a mixed modelling approach using the SAS statistical software platform The statistical approach used for analysing the data for change involved bootstrapping which allows for non-normality in the data without the necessity to know details of the actual distribution As such it provides a more accurate measurement of significance than alternative approaches Annex F of Emmett et al (2008) provides a background document describing the basis of the mixed model procedure As well as looking for overall change at the GB wide scale statistical analyses have been conducted to assess change of measured or calculated parameters soil community parameters within different strata w ithin the data-set These include analysis according to stratification by Broad Habitat Aggregate Vegetation Class and Soil Loss on Ignition (LOI) category which are briefly described here
Broad Habitat - The Broad Habitat classification consists of 27 habitats which account for the entire
land surface of Great Britain and the surrounding sea Countryside Survey reports on 10 major
terrestrial habitats
Aggregate Vegetation Class (AVC) ndash is a high level grouping of vegetation types produced from a
quantitative hierarchical classification of the different plant species found in the original Countryside
Survey sample plots Soil organic matter (LOI) category - mineral (0-8 LOI 0-44 g C kg
-1) humus-mineral (8 ndash 30 LOI
44-165 g C kg-1
) organo-mineral (30 ndash 60 LOI 165-330 g C kg-1
) and organic (60 ndash 100 gt 330 g
C kg-1
)
172
Countryside Survey Soils Report from 2007
8 Soil invertebrates
Measured and calculated parameters that were used as inputs for the analysis were
1 Total catch of invertebrates from all broad taxa to give a measure of overall abundance of invertebrates in CS cores
2 Number of broad taxa represented by the presence of at least one individual in each CS core as a measure of community taxa richness
3 Total catch of mites and springtails only since these two mesofauna groups usually comprised the majority of the invertebrates present in each core
4 The ratio of Mites Springtails since this parameter was found to change in relation to climatic conditions as indicated by annual precipitation (highest mite springtail ratio was found in plots where annual precipitation was highest within GB) in the 1998 data-set
5 Shannon Diversity calculated for each sample using counts of individual number within broad taxa including counts for springtail superfamily as available for all 1998 and 2007 samples
As well as analysis of each parameter according the outlined stratification a spatial analysis was undertaken using geostatistics For the measured parameters tested namely total invertebrate catch mite springtail ratio and Shannon Diversity the semi-variograms identified no spatial correlation at the regional scale For this reason spatial interpolation or mapping of change is not feasible and as a result is not reported further in this chapter
83 Results
831 Total invertebrate catch
The mean number of invertebrates collected from cores in CS in 1998 was 523 and 77 in 2007 ( Table 83) This represented an overall increase of 47 in total catch in CS in 2007 The highest catches of invertebrates were in woodland habitats with high catches also recorded in Acid Grassland and Dwarf Shrub Heath Lowest numbers occurred in three habitats Arable and Horticulture Improved Grassland and Neutral Grassland that are most frequently the subject of intensive management practices Catches in Arable and Horticulture habitats in particular were notably low in both surveys
173
Countryside Survey Soils Report from 2007
8 Soil invertebrates
Table 83 Changes in total invertebrate catch of soils (0 -8cm depth) within a) Broad Habitats b) Aggregate
Vegetation Classes and c) Soil LOI categories across Great Britain Arrows denote a significant change (plt005)
in the direction shown
C) Great Britain - Soil LOI Category
Soil LOI category 1998 2007 1998-2007
Mineral 367 451
Humus-mineral 553 895
Organo-mineral 816 1179
Organic 697 1053
Direction of
significant
changesTotal catch
a) Great Britain - Broad Habitats
Broad Habitat 1998 2007 1998-2007
Broadleaved Mixed and Yew Woodland 922 1032
Coniferous Woodland 904 1524
Arable and Horticulture 309 316
Improved Grassland 385 575
Neutral Grassland 422 86
Acid Grassland 859 1139
Dwarf Shrub Heath 757 1192
Fen Marsh and Swamp 641 843
Bog 493 774
All habitat types 523 77
b) Great Britain - Aggregate Vegetation Class
AVC 1998 2007 1998-2007
Crops and weeds 316 302
Tall grass and Herb 319 552
Fertile grassland 362 525
Infertile grassland 448 799
Upland Woodland 97 1404
Moorland grass mosaics 843 1276
Heath and bog 606 89
All vegetation types 523 77
Direction of
significant
changes
Direction of
significant
changesTotal catch
Total catch
174
Countryside Survey Soils Report from 2007
8 Soil invertebrates
Figure 81 Changes (+- 95 CIs) in total invertebrate catch of soils (0-8cm depth) within a) Broad abitats b)
Aggregate Vegetation Classes and c) Soil LOI categories across Great Britain Standard errors are indicated
Significant differences p lt 005 p lt 001 p lt 0001 are shown
Analysis using the mixed model indicated that the increase seen in total catch in GB soils in CS in 2007 was highly significant (plt0001) Stratification of the data to assess change by Broad Habitat indicated that a significant increase in catch was detected in 5 of 9 Broad Habitats (Fig 81) For the remaining 4 habitats small non-significant increases in catch were found These were Broadleaved Woodlands Acid Grassland and Fen Marsh and Swamp which all showed non-significant increases of 12 325 and 315 respectively and Arable and Horticulture which showed only a 2 increase in mean catch No habitat showed a mean decrease in total invertebrate catch The absence of a clear increase in total invertebrate catch which was evident in all other habitats and significant in most Arable and Horticulture areas is particularly interesting because the absence of an effect is not the result of low sample numbers in the analysis In fact Arable systems are the second best represented habitat after Improved Grasslands in the repeat sampled soi l invertebrate dataset with 217 enumerated samples This suggests that the factor that is responsible for the general increase in invertebrate catches in soil cores sampled from across GB is not applicable to Arable and Horticulture systems
-40
0
40
80
120
160
Min
eral
Hum
us-m
iner
al
Org
ano
-miner
al
Org
anic
Ch
an
ge t
ota
l in
vert
eb
rate
catc
h p
er
plo
t
-40
0
40
80
120
160
Cro
ps a
nd w
eeds
Tall g
rass
and
Her
b
Fertile
grass
land
Infe
rtile g
rass
land
Upla
nd W
oodlan
d
Moo
rland
gra
ss m
osaics
Heat
h and
bog
All ve
geta
tion
type
s
Ch
an
ge t
ota
l in
vert
eb
rate
catc
h p
er
plo
t
-40
0
40
80
120
160
Bro
adlea
f
Coni
fer
Ara
ble
Impro
ved
Gra
ss
Neut
ral G
rass
Acid
Gra
ss
Shr
ub Hea
th
Fen
Bog
All ha
bita
ts
Ch
an
ge t
ota
l in
vert
eb
rate
catc
h p
er
plo
t
a) Broad Habitats
c) LOI categoriesb) Aggregate vegetation class
175
Countryside Survey Soils Report from 2007
8 Soil invertebrates
Further stratification of the data by AVC indicated patterns of change that were generally in line with those indicated by the habitat analysis No significant increase in catch was found between Crops and Weeds and Tall Grass and Herb which are vegetation classes associated with arable landscapes while total catch was significantly higher in all other vegetation classes Analysis by LOI class indicated significant change in total invertebrate catch in all classes with three classes highly significant (plt0001) and the mineral soil (LOI lt 0-8) significant at plt005 Smallest overall increase in total catch was found for the mineral soils in terms of both absolute numbers and percentage change Since these included a large proportion of the Arable and Horticulture s oils (189 of 371 soils in the 0-8 LOI category are from Arable and Horticulture habitats) this suggests that the low organic matter content of these soils possibly in combination with arable land management practice may be a contributing factor preventing increase in the total catch of invertebrates in the mineral soil category to the same extent found in soil with higher LOI
832 Total broad taxa in catch
The mean number of invertebrate taxa represented by at least one individual in soil cores in 1998 was 434 and was 385 in 2007 (Table 84) This represented an overall decrease of 11 in average taxa representation in CS in 2007 compared to 1998 This reduction is highly statistically significant (plt0001) Because of the small size of the core sample used for invertebrate extraction in CS the number of taxa that may be represented within a catch at any given plot is rather idiosyncratic Further both the core size and extraction technique used (surface heating within a Tullgren funnel apparatus ) is targeted at collecting mainly hard bodied soil mesofauna Thus while small arthropods such as mites and springtails are usually well sampled (Van Straalen and Rijninks 1982) soft bodied meiofauna such as nematodes and tardigrade and larger macrofauna such as Oligochaetes centipedes millipedes and woodlice are not well represented in the extracted sample As a result within any one sample the total number of taxa present can be affected not only by habitat and soil conditions but also by the chance inclusion of individuals of larger invertebrates within the sample Taxa representation as a result is subject to large variation in measurement between samples that is independent of fixed factor effects When analysed by Broad Habitats the highest average number of invertebrate taxa was found in Broadleaved Mixed and Yew Woodland in both the CS in 1998 and 2007 (Table 84) High taxa representation in these habitats is consistent with the high overall catches recorded in these areas since there is a positive relationship between overall catch and number of represented taxa within the CS data-set In remaining habitats trends for representation of taxa in different systems varied slightly between surveys Bogs showed low taxa richness in both surveys and Arable and Horticulture systems also had relatively low taxa richness that is consistent with the low overall catch in these areas in both surveys
176
Countryside Survey Soils Report from 2007
8 Soil invertebrates
Table 84 Changes in total number of sampled taxa represented by at least one individual in soil samples (0 -8cm
depth) within a) Broad Habitats b) Aggregate Vegetation Classes and c) Soil LOI categories across Great
Britain Arrows denote a significant change (plt005) in the direction shown
a) Great Britain - Broad Habitats
Broad Habitat 1998 2007 1998-2007
Broadleaved Mixed and Yew Woodland 581 495
Coniferous Woodland 435 466
Arable and Horticulture 413 34
Improved Grassland 454 374
Neutral Grassland 453 433
Acid Grassland 460 397
Dwarf Shrub Heath 426 364
Fen Marsh and Swamp 394 411
Bog 335 328
All habitat types 434 385
b) Great Britain - Aggregate Vegetation Class
AVC 1998 2007 1998-2007
Crops and weeds 427 342
Tall grass and Herb 416 415
Fertile grassland 452 367
Infertile grassland 462 423
Lowland woodland 648 561
Upland Woodland 500 461
Moorland grass mosaics 434 397
Heath and bog 356 336
All vegetation types 434 385
c) Great Britain - Soil LOI Category
Soil LOI category 1998 2007 1998-2007
Mineral 437 373
Humus-mineral 466 408
Organo-mineral 451 425
Organic 360 346
Direction of
significant
changesNumber of broad taxa
Number of broad taxa
Direction of
significant
changesNumber of broad taxa
Direction of
significant
changes
177
Countryside Survey Soils Report from 2007
8 Soil invertebrates
Figure 82 Changes (+- 95 CIs) in total number of sampled taxa represented by at least one individual in soils
(0-8cm depth) within a) Broad Habitats b) Aggregate Vegetation Classes and c) Soil LOI categories across Great
Britain Standard errors are indicated Significant differences p lt 005 p lt 001 p lt 0001 are shown
Analysis of taxa richness using the mixed model indicated that the reduction in the total number of collected taxa in CS in 2007 compared to 1998 was highly significant (plt0001) Stratification of the data to assess change by Broad Habitat indicated that in 5 out of 9 cases (Broadleaved Woodland Arable and Horticulture Improved Grassland Acid Grassland and Dwarf Shrub Heath) the reduction in taxa representation indicated was statistically significant (Fig 82) Analysis using AVC revealed further information about the changes in taxa representation between surveys Thus while all AVC categories showed a reduction in taxa richness greatest change was found for Crops and Weeds and in Fertile Grassland In both cases these changes were statistically significant (plt0001) with a further significant decrease (plt005) also found in soils from Infertile Grassland Because these Arable and Grassland areas are subject to the greatest anthropogenic influence through land management this suggests that land management practice may be in some way influencing the representation and distribution of some soil taxa in these systems Analysis by LOI class indicated a reduction in taxa representation in all soil classes The change in representation was greatest in the mineral (0-8 LOI) and humus-mineral (8-30 LOI) soils rather than in soils with a higher LOI This is consistent with the reduction in taxa catch detected in the Arable habitats and Crop and weed AVC class and Improved Grassland habitat and Fertile Grassland AVC since these habitats and vegetation types are extensively represented within the less organic rich soils within the low LOI class
-3
-2
-1
0
1
2
3
Bro
adlea
f
Coni
fer
Ara
ble
Impro
ved
Gra
ss
Neut
ral G
rass
Acid
Gra
ss
Shr
ub Hea
th
Fen
Bog
All ha
bita
ts
Ch
an
ge b
road
taxa
catc
h p
er
plo
t
-3
-2
-1
0
1
2
3
Cro
ps a
nd w
eeds
Tall g
rass
and
Her
b
Fertile
grass
land
Infe
rtile g
rass
land
Lowland
Wood
land
Upla
nd W
oodlan
d
Moo
rland
gra
ss m
osaics
Heat
h and
bog
All ve
geta
tion
type
s
Ch
an
ge b
road
taxa
catc
h p
er
plo
t
-3
-2
-1
0
1
2
3
Min
eral
Hum
us-m
iner
al
Org
ano-m
iner
al
Org
anic
Ch
an
ge b
road
taxa
catc
h p
er
plo
t
a) Broad Habitats
c) LOI categoriesb) Aggregate vegetation class
178
Countryside Survey Soils Report from 2007
8 Soil invertebrates
833 Total catch of mites and springtails
The average combined number of mites and springtails present in CS in 1998 was 389 compared to 721 in 2007 In 1998 mites and springtails comprised 743 of all invertebrates captured while in 2007 this had increased to 936 Springtails and mites thus increased in their overall dominance between the two surveys Because springtails and mites dominate total invertebrates to such an extent their patterns of abundance between habitats reflect those also found for total invertebrate catch ( Table 85) The highest combined catches of mites and springtails were in woodland habitats (notably Coniferous Woodland) with high numbers also found in habitats such as Acid Grassland and Dwarf Shrub Heath Lowest counts were found in Arable and Horticulture and Improved Grassland habitats Since these habitats are often intensively managed this suggests a potential influence of management regime on these two important soil mesofauna groups Table 85 Changes in combined catch of mites and springtails in soils (0 -8cm depth) within a) Broad Habitats b)
Aggregate Vegetation Classes and c) Soil LOI categories across Great Britain Arrows denote a significant
change (plt005) in the direction shown
a) Great Britain - Broad Habitats
Broad Habitat 1998 2007 1998-2007
Broadleaved Mixed and Yew Woodland 688 937
Coniferous Woodland 769 1459
Arable and Horticulture 210 281
Improved Grassland 254 533
Neutral Grassland 281 805
Acid Grassland 694 1085
Dwarf Shrub Heath 61 1158
Fen Marsh and Swamp 554 777
Bog 381 74
All habitat types 389 721
b) Great Britain - Aggregate Vegetation Class
AVC 1998 2007 1998-2007
Crops and weeds 209 266
Tall grass and Herb 216 501
Fertile grassland 222 483
Infertile grassland 309 747
Upland Woodland 857 1338
Moorland grass mosaics 66 1222
Heath and bog 492 85
All vegetation types 389 721
Direction of
significant
changes
Direction of
significant
changesAbundance mites and
springtails
Abundance mites and
springtails
179
Countryside Survey Soils Report from 2007
8 Soil invertebrates
Figure 83 Changes (+- 95 CIs) in the combined catch of mites and springtails from soils (0-8cm depth) within
a) Broad Habitats b) Aggregate Vegetation Classes and c) Soil LOI categories across Great Britain Standard
errors are indicated Significant differences p lt 005 p lt 001 p lt 0001 are shown
Data analysis using the mixed model indicated that the increase in the combined catch of sprigtails and mites in CS in 2007 compared to 1998 was highly significant (plt0001) when considering all soils (Fig 83) Stratification of the data to assess change by Broad Habitat indicated effects that were consistent with those for total invertebrate number Thus combined mite and springtail catches were increased in all analysed habitat classes and no habitat showed a mean decrease in mite and springtail catch For 7 out of 9 habitats (Coniferous Woodland Arable and Horticulture Improved Grassland Neutral Grassland Acid Grassland Dwarf Shrub Heath and Bog) the increase in combined mite and springtail catch was statistically sig nificant with Arable and Horticulture soils showing the lowest overall change Because of the low starting point in Arable soils the actual percentage increase in combined catch (342 increase) was only slightly below the
c) Great Britain - Soil LOI Category
Soil LOI category 1998 2007 1998-2007
Mineral 244 411
Humus-mineral 411 839
Organo-mineral 685 1129
Organic 586 1015
Direction of
significant
changesAbundance mites and
springtails
-40
0
40
80
120
Cro
ps a
nd w
eeds
Tall g
rass
and
Her
b
Fertile
grass
land
Infe
rtile g
rass
land
Lowland
Wood
land
Moo
rland
gra
ss m
osaics
Heat
h and
bog
All ve
geta
tion
type
s
Ch
an
ge m
ites a
nd
sp
rig
tail
catc
h p
er
plo
t
-40
0
40
80
120
Bro
adlea
f
Coni
fer
Ara
ble
Impro
ved
Gra
ss
Neut
ral G
rass
Acid
Gra
ss
Shr
ub Hea
th
Fen
Bog
All ha
bita
ts
Ch
an
ge m
ites a
nd
sp
rig
tail
catc
h p
er
plo
t
-40
0
40
80
120
Min
eral
Hum
us-m
iner
al
Org
ano
-min
eral
Org
ani
c
Ch
an
ge m
ites a
nd
sp
rig
tail
catc
h p
er
plo
t
a) Broad Habitats
c) LOI categoriesb) Aggregate vegetation class
180
Countryside Survey Soils Report from 2007
8 Soil invertebrates
lower end of level of change found for the remaining habitats (36-186) The remaining 2 habitats each showed non-significant increases in combined catch Analysis by AVC indicated an effect of vegetation on combined mite and springtail catch in line with those for total invertebrate numbers A significant increase in the combined catch was found in all vegetation classes with the exception of Crop and Weeds and Coniferous Woodland Analysis by LOI class indicated significant change in mite and springtail catch in all classes Absolute size of the increase was lowest for the mineral soil (LOI lt 0-8) with the other soil classes each showing similar change However when changes are calculated as percentage difference from CS in 1998 the change in the mineral soils (68) is not inconsistent with the percentage change in the remaining LOI categories (65 -104) That a significant increase in combined mite and springtail catch was found for the low LOI soil suggests that the limited changes in total mite and springtail catch that were s een in Arable habitats dominated by the Crop and Weed AVC category is not merely a result of the low LOI of soils in these areas Instead other land management practices may be important in limiting the extent of observed change
834 Ratio of mites springtails
Analysis was conducted of the change in the ratio of Mites Springtails since this parameter was found to vary in relation to annual precipitation (and as a result habitat) in CS in 1998 Highest catches of mites were found in plots at which rainfall was highest while springtails favoured lower rainfall plots Mite springtail ratios thus varied systematically with increasing rainfall (Fig 84) In CS in 1998 the average mite springtail ratio in GB soils was 63 and in CS in 2007 this value had increased to 89 (Table 86 Fig 85) Highest mite springtail ratios were found in habitats that are associated with high rain fall particularly in upland regions of GB A pattern that is consistent with the recognised trend (Fig 84) Habitats with highest mite springtail ratio were Bog Dwarf Shrub Heath and Acid Grassland Woodlands were intermediate while values in Arable and Horticulture Neutral Grassland and Improved Grassland soils were the lowest of the studied habitats The patte rn of mite springtail ratio found between the Broad Habitats for in CS in 2007 supports the importance of moisture availability on the relative abundance of the major meiofaunal groups as indicated initially in CS in 1998 Figure 84 Mite abundance and relative abundance of Collembola in relation to mean annual precipitation
Trends (with 95 confidence intervals) are calculated based on data collected from 1097 Tullgren samples
collected across GB in 1998
0 500 1000 1500 2000 2500 3000 35000 500 1000 1500 2000 2500 3000 3500
500
750
2500
5000
7500
25000
50000
75000
Acari
abundance (
log
10
m- 2
+ 1
00
02
04
06
08
10
rela
tive a
bundance o
f colle
mbola
(arc
sin
e
+ 0
5)
Number of mites m-2
Relative abundance of Collembola m-2
Fig 84 Mite abundance and relative
abundance of Collembola in relation to
mean annual precipitation Trends (with
95 confidence intervals) are calculated
based on data collected from 1097 Tullgren
samples collected across GB in CS2000
181
Countryside Survey Soils Report from 2007
8 Soil invertebrates
All Broad Habitats included in the stratified analysis showed a significant increase in mite springtail ratio Statistical analysis indicated that this increase was significant in all habitats except for Dwarf Shrub Heath and Bog the two habitats that had the highest ratios i n both CS in 1998 and 2007 The significant increase in the mite springtail ratio found in the majority of habitats was largely the result of an increase in the total number of mites caught rather than a reduction in springtail catches The increase in mi te numbers is also the major reason for the increase in both the combined number of mites and springtails and total invertebrate catch (since mites are a major contributor to overall invertebrate numbers) Analysis of the data by AVC indicated clear effects of vegetation class on mite springtail ratio These effects were largely consistent with the trends found for Broad Habitats There was a significant increase in the mite springtail ratio in all vegetation classes except Moorland Grass Mosaic and Hea th and Bog the two classes for which ratios in CS in 1998 and 2007 were highest Analysis by LOI class was also consistent with the changes in mite springtail ratio across other stratifications A significant increase in the mite springtail ratio wer e found in mineral humus-mineral and organo-mineral soils associated with the lowland habitats and vegetation classes in which mite springtail ratio showed a significant increase Only in organic soils associated with upland areas was the increase in ratio between the 1998 and 2007 not significant
Table 86 Changes in ratio of mites springtails in soils (0 -8cm depth) within a) Broad Habitats b) Aggregate
Vegetation Classes and c) Soil LOI categories across Great Britain Arrows denote a significant change (plt005)
in the direction shown
a) Great Britain - Broad Habitats
Broad Habitat 1998 2007 1998-2007
Broadleaved Mixed and Yew Woodland 554 1008
Coniferous Woodland 644 1464
Arable and Horticulture 183 531
Improved Grassland 402 820
Neutral Grassland 406 966
Acid Grassland 1053 1839
Dwarf Shrub Heath 1302 1140
Bog 1383 1526
All habitat types 63 109
b) Great Britain - Aggregate Vegetation Class
AVC 1998 2007 1998-2007
Crops and weeds 187 53
Tall grass and Herb 25 62
Fertile grassland 262 791
Infertile grassland 501 1109
Upland Woodland 67 1129
Moorland grass mosaics 1391 1748
Heath and bog 1477 1754
All vegetation types 628 1087
Direction of
significant
changes
Direction of
significant
changesMites springtails
Mites springtails
182
Countryside Survey Soils Report from 2007
8 Soil invertebrates
c) Great Britain - Soil LOI Category
Soil LOI category 1998 2007 1998-2007
Mineral 357 750
Humus-mineral 402 1034
Organo-mineral 927 1540
Organic 1731 1833
Direction of
significant
changesMites springtails
Figure 85 Changes (+- 95 CIs) in the ratio of mites springtails in soils (0 -8cm depth) within a) Broad
Habitats b) Aggregate Vegetation Classes and c) Soil LOI categories across Great Britain Standard errors are
indicated Significant differences p lt 005 p lt 001 p lt 0001 are shown
835 Shannon Diversity
Shannon diversity was calculated using counts of the number of individuals within broad taxa (nb counts of springtails to superfamily were included as separate broad taxa in the analysis) Mean Shannon diversity in CS in 1998 was 102 and in 2007 this value has reduced to 072 ( Table 87) This represented an overall reduction of 03 units in CS in 2007 Shannon diversity showed only a limited difference between different habitats Broadleaved Woodland showed the highest Shannon statistic in both 1998 and 2007 (121 and 087 respectively) while Bogs showed lowest Shannon diversity in both surveys (071 and 052 respectively)
-8
-4
0
4
8
12
16
20
Bro
adlea
f
Coni
fer
Ara
ble
Impro
ved
Gra
ss
Neut
ral G
rass
Acid
Gra
ss
Shr
ub Hea
th
Bog
All ha
bita
tsCh
an
ge p
rop
ort
ion
mit
es
pri
ng
tail
s
per
plo
t
-8
-4
0
4
8
12
16
20
Cro
ps a
nd w
eeds
Tall g
rass
and
herb
Fertile
grass
land
Infe
rtile g
rass
land
Lowland
woo
ded
Upla
nd w
ooded
Moo
rland
gra
ss m
osaics
Heat
h and
bog
All ve
geta
tion
type
s
Ch
an
ge p
rop
ort
ion
mit
es
pri
ng
tail
s
per
plo
t
-8
-4
0
4
8
12
16
20
Min
eral
Hum
us-m
iner
al
Org
ano
-min
eral
Org
ani
c
Ch
an
ge p
rop
ort
ion
mit
es
pri
ng
tails
per
plo
t
a) Broad Habitats
c) LOI categoriesb) Aggregate vegetation class
183
Countryside Survey Soils Report from 2007
8 Soil invertebrates
Statistical analysis indicated that the decrease in Shannon diversity in 2007 was highly significant (plt0001) when considered for GB wide soils (Table 87) Stratification of the data to assess change by Broad Habitat indicated a significant decrease in diversity in 8 of 9 habitats ( Fig 86) Only in Fen Marsh and Swamp was the reduction in Shannon diversity not significant Analysis by AVC indicated that the reduction in Shannon diversity was also significant in the majority of vegetation classes (Fig 86) Of the 8 AVCs represented in the data-set all showed a significant reduction in Shannon diversity except for Tall Grass and Herb Analysis by LOI class in dicated significant change in all soil LOI classes indicating that reduced Shannon diversity was associated with all soil types Table 87 Changes in invertebrate Shannon diversity based on enumeration to broad taxa of invertebrates
collected from soils (0-8cm depth) within a) Broad Habitats b) Aggregate Vegetation Classes and c) Soil LOI
categories across Great Britain Arrows denote a significant change (plt005) in the direction shown
a) Great Britain - Broad Habitats
Broad Habitat 1998 2007 1998-2007
Broadleaved Mixed and Yew Woodland 121 087
Coniferous Woodland 093 061
Arable and Horticulture 110 085
Improved Grassland 117 079
Neutral Grassland 109 073
Acid Grassland 089 055
Dwarf Shrub Heath 087 063
Fen Marsh and Swamp 081 073
Bog 071 052
All habitat types 102 072
b) Great Britain - Aggregate Vegetation Class
AVC 1998 2007 1998-2007
Crops and weeds 115 085
Tall grass and Herb 109 092
Fertile grassland 117 081
Infertile grassland 111 073
Lowland woodland 127 092
Upland Woodland 104 067
Moorland grass mosaics 085 057
Heath and bog 074 054
All vegetation types 102 072
Direction of
significant
changesShannon Diversity
Shannon Diversity
Direction of
significant
changes
184
Countryside Survey Soils Report from 2007
8 Soil invertebrates
c) Great Britain - Soil LOI Category
Soil LOI category 1998 2007 1998-2007
Mineral 112 082
Humus-mineral 112 074
Organo-mineral 094 062
Organic 069 051
Direction of
significant
changesShannon Diversity
Figure 86 Changes (+- 95 CIs) in invertebrate Shannon diversity based on enumeration to broad taxa of
invertebrates collected from soils (0-8cm depth) within a) Broad Habitats b) Aggregate Vegetation Classes and
c) Soil LOI categories across Great Britain Standard errors are indicated Significant differences p lt 005 p
lt 001 p lt 0001 are shown
-8
-4
0
4
8
12
16
20
Bro
adlea
f
Coni
fer
Ara
ble
Impro
ved
Gra
ss
Neut
ral G
rass
Acid
Gra
ss
Shr
ub Hea
th
Bog
All ha
bita
tsCh
an
ge p
rop
ort
ion
mit
es
pri
ng
tail
s
per
plo
t
-8
-4
0
4
8
12
16
20
Cro
ps a
nd w
eeds
Tall g
rass
and
herb
Fertile
grass
land
Infe
rtile g
rass
land
Lowland
woo
ded
Upla
nd w
ooded
Moo
rland
gra
ss m
osaics
Heat
h and
bog
All ve
geta
tion
type
s
Ch
an
ge p
rop
ort
ion
mit
es
pri
ng
tail
s
per
plo
t
-8
-4
0
4
8
12
16
20
Min
eral
Hum
us-m
iner
al
Org
ano
-min
eral
Org
ani
c
Ch
an
ge p
rop
ort
ion
mit
es
pri
ng
tails
per
plo
t
a) Broad Habitats
c) LOI categoriesb) Aggregate vegetation class
185
Countryside Survey Soils Report from 2007
8 Soil invertebrates
84 Discussion and Policy Implications
841 Introduction
Soils are critical components of the terrestrial ecosystems They are vulnerable to the effects of anthropogenic activity such as the release of pollutant chemicals and accelerating climate change Within the soil the micro- meio- meso- and macro-fauna all play a critical role in the provision of many important soils functions and resulting ecosystem services The poorly established taxonomy of many common soil macroinvertebrate taxa coupled to a declining taxonomic base means that the effects of human activity on subterranean invertebrate community structure is not well understood These include not only nematodes mites and springtails whose morphological taxonomy is ldquodifficultrdquo but also groups such as Oligochaetes and Molluscs for which there is strong evidence for a high frequency of morphologically similar cryptic species (King et al 2008) Countryside Survey represents one of only a limited number of programmes that have attempted national scale monitoring of soil biodiversity CS is unique in co-ordinating soil biodiversity monitoring at a GB scale with other surveying approaches for land use vegetation soils and waters Other countries such as the Netherlands Germany and Canada do have programmes involving soil biodiversity assessments however unlike CS which is temporally synchronised in a single season these other programs take a rolling approach to sample collection (ie sampling a certain percentage of sites in each year) As outlined the aim of soil invertebrate sampling in CS was not to provide a comprehensive assessment of soil biodiversity since this would require use of a wide range of techniques Instead a snapshot of the abundance of principally the main soil mesofauna groups the mites and springtails with some information on meiofauna (eg nematodes) and macrofauna is gathered Microbial diversity was not measured in the main part of CS although bacterial diversity in all soils for which soil invertebrate communities were assessed have been analysed in separate work supported through NERC grants raising the potential for a more integrated assessment of the microbial and invertebrate diversity data From the re-sampling in CS in 2007 the key policy question to be addressed was whether CS could provide any evidence to indicate that there has been a loss of soil biodiversity as has been stated in previous statements made by the EU Because it was not feasible within available resources to identify collected fauna to species levels due to both the number of invertebrates captured and the challenge of species level identification for groups such as the oribatid mites it is certainly not possible to provide a comprehensive answer to the policy question Between year variation in seasonal weather patterns may also strongly influence patterns observed While a complete answer is not possible useful insight into the status of soil communities at the GB scale and with habitats vegetation classes and different soil typ es can be derived from the survey results The re-sampling of soil communities in 2007 showed clear trends at the national scale Mean number of invertebrates collected significantly increased across GB Overall there was an increase of 47 in total catc h in the CS in 2007 survey compared to 1998 Calculated at the level of individual per m
2 based on the 4 cm
2
diameter of the sample core used the total catch measured equates to around 41500 individual soil invertebrates per m
2 within the top 8 cm of the soil in 1998 and over 61252 in 2007 Values for individual
habitats varied from around 25000 individuals per m2 for both 1998 and 2007 in Arable and Horticulture
habitats to around 73000 in 1998 and 89000 in 2007 for Broadleaved Woodlands The estimat e of total catch m
2 for Bog soils of around 39000 for 1998 and 61000 for 2007 are above the range of 5000 -10000 in
a dry summer (2003) found previously in peatland and birchwood soils (Osler et al 2006) Studies at the same sites in a wetter summer (2004) did produce values of 14000 -100000 mite m
2 and 1500-26000
springtail m2 that are more comparable with estimates from CS in 2007 Values for deciduous woodland are
close to the upper limit of the range of 15000-90000 for the total catch of mites and springtails found in control and disturbed woodland (Maraun et al 2003) This suggests that the method used for invertebrate sample collection in CS produced estimates of abundance that are largely compatible with results from published studies Scaling up estimates of invertebrate numbers to a GB scale based on measured density and GB land area indicates that there were an estimated 128 quadrillion (128x10
16) soil invertebrates
186
Countryside Survey Soils Report from 2007
8 Soil invertebrates
present in the top 8 cm of GB soils during the time of CS in 2007 This number is up 41 quadrillion (41x1015
) since CS in 1998 when ldquoonlyrdquo 87 quadrillion (872x10
15) invertebrates were estimated to be present
Stratification of the data indicated that the increase in total invertebrate catch was detectable in all habitats except arable and managed grassland areas largely associated with mineral soils Because total invertebrate catch was dominated by mites and springtails the increase in the combined total catch of these two groups was broadly consistent with patterns found for total invertebrate catch An in crease in the mite springtail ratio indicated that the increase in combined mite and springtail and total invertebrate catch was mainly the result of an increase in the number of mites retrieved Shannon diversity was reduced in all soils This was partly the result of an increase in the catch of mites the increased dominance of which within the samples results in a corresponding reduction in the Shannon diversity statistic although the reduction in diversity was not solely the result of an increase in the dominance of mites as a reduction in the richness of broad taxa represented by at least one individual in each core was also found
842 Cause of change in soil invertebrate communities between surveys
An important consideration when comparing results between repeat surveys is to ensure that the methods used for both sampling occasions are comparable In certain cases changes in instrumentation in available facilities or of staff can result in shifts in methods that require careful thought befor e conclusions are drawn from results Because large differences in invertebrate catch were seen between the 1998 and 2007 surveys consideration was given as to whether there were methodological shifts in 2007 compared to 1998 that could have contributed to the observed differences Five stages of the sampling and enumeration process were identified within which potential variations in procedure could occur Methods used in both surveys were compared in relation to these five areas and the potential impact of any sampling and handling differences between surveys considered 1 Preparation of the plot area for sampling In the field survey in CS in 2007 core sampling locations were decided according to instructions set out the field sampling protocol (Emmett et al 2008) The approach was consistent with that used in 1998 For sampling the cores used for invertebrate enumeration surveyors were instructed to leave the litter layer present on the soil surface intact In CS in 1998 similar instructions were not given explicitly to the surveyors Observation of the receipt of core from both surveys suggests that in reality this potential discrepancy is of minor importance For example for grassland sites cores were almost always received with the turf layer still intact at the top of the core throughout both surveys This suggests that sampling in the large number of grassland plots present within CS wa s conducted in an identical way For plots where grass was not present it is harder to tell if the litter layer has been similarly treated If the tendency was for litter removal in CS in 1998 but not in 2007 this could play a part in the higher catches in 2007 since invertebrate densities are highest in the surface litter layer and this layer would be more prevalent in the cores taken in the later survey If this was indeed the case though it would be expected that catches would be increased by a greater amount in woodland than grassland plots since it is know from the intact vegetation that grassland plots were similarly treated Comparison of the relative change in the woodland and grassland habitats suggests that in fact changes in catches in the tw o habitats were broadly similar This suggests that differences in the treatment of the litter layer during sampling are not likely to be the cause of the different in community parameters observed between surveys 2 Soil core insertion and on site handling Exactly the same cores were used for CS in 2007 as were used in 1998 (white 4 cm diameter 8 cm long plastic cores) Cores were knocked into the ground using a mallet and plate on both occasions Once the core had been inserted and removed it was nec essary to cap the core to prevent desiccation affecting invertebrate survival during transit Caps used in CS in 1998 were designed to fit into the inner rim of the core while those used in CS in 2007 fitted over the out rim The caps that were used in CS in 1998 were noted to slightly compress the core during insertion while the same was not true of the caps in 2007 For invertebrates to escape from soils during Tullgren extraction it is necessary that they are able to freely move through the soil profi le to allow escape and capture It is conceivable that the slight compaction of CS in 1998 soils may have impeded invertebrate escape during extraction with a resulting small reduction in catch in CS in 1998 While a compaction effect on Tullgren extractio n can not be fully excluded the extent of compaction of cores in 1998 was actually rather small Given the magnitude of the shift in community parameters between surveys it is difficult to envisage that this small difference could have
187
Countryside Survey Soils Report from 2007
8 Soil invertebrates
lead to the almost 50 increase in catch found in 2007 compared to the earlier survey particularly as catches in both surveys are towards the upper range of previous invertebrate counts taken in similar habitats (Osler et al 2006 Maraun et al 2003) 3 Core transport to the laboratory During both the 1998 and 2007 surveys the fauna cores were immediately placed into cool boxes after being dug from the soil and then posted first class to the laboratory at the first opportunity Return by post was selected as the most rapid means of core return even from dist ant locations It was acknowledged during initial survey design that the transport process was not well controlled and that the cores may be subject to stressful conditions notably high temperatures as sampling was mainly conducted over the summer months Many soil invertebrates have a low tolerance to heat stress Thus it is certainly possible that some temperature intolerant invertebrates in particular cores may have been lost (ie died) during transit Because the same approach to core return was used and also because the post service worked equally effectively for both surveys this suggests that differences in the time of transit while possibly affecting the integrity of individual samples can not account for community changes detected between surveys Further work to trace temperature data relating to the survey period is needed to investigate if different in average conditions during transit were prevalent between survey that could play a role 4 Soil invertebrate extraction method and conditions Different methods of extraction will collect a different sample of invertebrates from a given sample Tullgren extraction is particularly well suited to the collection of hard bodied mesofauna groups such as mites and springtails (Van Straalen and Rijninks 1982) Exactly the same Tullgren funnel system was used for invertebrate extraction in both Countryside surveys In CS in 2007 the funnel system was housed in a laboratory that received direct sun and so regularly reached temperature of 25
oC while in CS in 1998 the extractions took place in a laboratory that was shaded and so ambient
conditions did not regularly reach these higher temperatures High temperatures can be expected to stress soil invertebrates resulting in possible mortality within cores meaning that individuals are not extracted It was initially a concern in CS in 2007 that the high ambient temperatures in the laboratory used for the extractions could affect invertebrate catches with high temperature resulting in some mortality within cores and so lower catches Since actual catch observed in CS in 2007 we re significantly higher than in 1998 it seems unlikely that ambient conditions had any effect on the efficiency of soil extraction and ultimately on observed community change 5 Soil invertebrate sorting identification and enumeration Different personnel were involved in enumeration in the 1998 and 2007 surveys This could lead to discrepancies between surveys However the involvement of multiple staff for sorting and identification in both surveys and also the use of quality assurance checks during enumeration are both factors that suggest that identification and counting errors are unlikely to lie behind observed community change found between survey years As outlined a comparison of the detailed protocols for the two surveys indicated only small discrepancies between surveys These related to tube capping ambient conditions during extraction and changes in staff involved in enumeration In practice the changes were actually rather small The majority of the two procedures (cores sampling method return procedure Tullgren system quality assurance system) were rather similar Given the magnitude of community changes it seems unlikely that changes in capping which results in slight core compaction could account for the difference in catches se en Ambient temperature during sampling would have been expect to lower catches in 2007 compared to 1998 while quality assurance and training procedure precluded difference resulting from personnel change For this reason it is difficult to argue that the difference seen in soil invertebrate community between surveys namely an increased catch of especially mites leading to a high mite springtail ratio and higher combined mite and springtail number coupled with a reduction in diversity resulting from both increased mite dominance and lower representation of broad taxa in CS in 2007 samples are solely down to methodological difference Real differences in community parameters between sample years seem instead to be the most reasonable explanation
188
Countryside Survey Soils Report from 2007
8 Soil invertebrates
843 Initial attribution of soil invertebrate community change
The lag in completing the enumeration of the soil fauna means that at present attribution of changes in the soil invertebrate community remain in process Even though detailed attribution of changes in soil invertebrate community structure is yet to be completed it is possible even now to identify a number of potential candidate drivers that could be responsible for the quite substantial changes detected in soil communities between the two survey years Soil invertebrate communities are known to be sensitive to climatic condition For example in 1998 it was noted that the number of oribatid mites tended to increase in plots that are subjected to high mean annual rainfall while springtail were more frequent in plots where precipitation was lower The survey year of 2007 in the UK was one of the wettest summers on record While it must also be recognised that 1998 was also a relatively wet summer the rainfall amounts that occurred over the k ey survey month of June and July in GB in 2007 were notably higher and in some areas reached record levels indicating the extent of rainfall in the later survey year Wetter soil resulting from more rain can have both a positive and a negative effect on soil invertebrate catches from Tullgren extractions Wet soils tend to swell As a result this means that within the restricted volume of the sample soil core a smaller weight of soil will be sampled Lower soil layers in particular can as a result be missed This reduced sampling at depth could result in the loss of some invertebrates from the sample Since the majority of soil invertebrates live in or on the surface soil and soil litter layers the actual number of individuals missed by the reduced sampling of deeper soils may actually be rather small A potentially more important effect of wetter soils may be that they maintain soil invertebrate s in an active state that would not be the case in soils that were drier It is well known that many soil i nvertebrates are sensitive to drought conditions This is because most below-ground invertebrates have water permeable integuments and so are unable to resist water loss in drying environments The sensitivity of some soil taxa to drought stress is recognised as an important determinant of their habitat preferences As a result the ecophysiology of desiccation tolerance and water balance in some taxa has been studied in detail Some species such as earthworms and springtails may burrow into the deeper so il layers where soil moisture is retained to escape from drought condition Other species use a range of desiccation tolerance mechanisms (eg anhydrobiosis estivation) If escape to moist deeper soil microsites is used then this can prevent the initial capture of individuals within a defined depth soil sample If a desiccation tolerance strategy is used this can preclude the individual from responding to desiccation as a result of Tullgren extraction in a manner that allows capture In either case this may limit invertebrate catches in drier soils Initial attribution work focussing on 1998 and 2007 soil moisture measurements has indicated that there is no clear evidence for an increase in soil moisture content and sampling time (data not shown) This c omparison does not preclude a potential influence of high rainfall on community parameters since communities are likely to response to longer term changes in soil moisture regime This means that even though there is no clear evidence of soil moisture levels between surveys it remains possible that the high rainfall found in 2007 may indeed play some role in the observed different between soil communities found between survey years It is widely recognised that soil invertebrate communities are sensitive to a range of land management practices (Schon et al 2008) including land cover change (Black et al 2003) tillage regime and disturbance (Maraun et al 2003) pesticides and heavy metals (Frampton 1999 Pedersen et al 1999) and nitrogen inputs (Lindberg and Persson 2004) Because the changes in soil community structure detected between surveys was relevant to all habitats and vegetation classes except intensively managed land mainly on mineral soils attribution of changes in soil community composition to a particular driver must be relevant for a range of habitats and soil types This means that changes in land management such as stocking density pesticide application rates or tillage regimes that apply only to certain habitat types cannot explain all of the observed difference At a national scale one major difference that has occurred that has had a major effect on soil properties is the change in sulphur deposition and resulting effect on soil pH Measures to reduce sulphur emission have resulted in reduced rate of deposition and a resulting increase in soil pH across GB of almost 05 pH units since 1978 The pH of the soil is known to play a key role i n determining the structure of below ground communities Within CS in 2007 a negative relationship exists between soil pH and total invertebrate catch (Fig 87) This is explained because the highly abundant oribatid mite group do not favour neutral soil habitats associated with mineral soils in agricultural landscapes but instead favour low
189
Countryside Survey Soils Report from 2007
8 Soil invertebrates
pH organic soils in more upland areas Thus while important for determining overall composition of the soil community (eg high catch and dominance of mites in Dwar f Shrub Heath and Bogs) change in soil pH alone is unlikely to be a major driver of community change between survey years Comparison of communities in different habitats indicates that larger soil invertebrate communities are found in habitats such as woodland while Arable and Horticulture and managed grassland have smaller communities with fewer broad taxa It is often assumed because they are recently planted that Coniferous Woodland have a lower conservation value than older Broadlea ved Woodland Full species identification and enumerations of different woodland of known age would be needed to test this hypothesis for soil fauna The GB wide survey from CS does indicate that in terms of community size and frequency of broad taxa the two woodland types differ little in their harboured soil communities For the conservation of soil biodiversity on the basis of this analysis woodlands emerge as potentially important targets The small community size and low taxa representation for managed habitats suggests impacts of land management practices such as tillage fertiliser inputs and pesticide application on soil communities in these areas Arable and grassland areas emerge as potential targets for soil biodiversity restoration Figure 87 Relationship between soil pH measured in soils sample (0-15 cm depth) in CS in 2007 and the total
catch of soil invertebrates from soil core (0-8) depth
Within the land use and habitat survey of CS one of the most notable changes over time has been a significant increase in woodland cover in the UK Because woodland harbours large soil communities it would be expected that this increase in woodland area would be beneficial to the national stock of soil invertebrates Within CS the designation of Broad Habitats is done by surveyors on each sampling occasion This means that areas designated as woodland in each survey are done on the basis of current habitat distribution Similarly vegetation class is determined directly by analysis of the flora present at the actual sample plots Since the statistical analysis links invertebrate catch directly to recorded Broad Habitat and AVC in each category changes in soil community composition between surveys cannot be linked simply to changing in woodland frequency In fact because new woodland may be expected to still be undergoing community succession land cover change to woodland may be expected to have a slight negative effect on invertebrate community catch and diversity within woodland cate gories in a substantial amount of new
y = 46489e-0368x
R2 = 01776
1
10
100
1000
10000
3 4 5 6 7 8 9
Soil pH CS 2007
Lo
g s
oil
in
verte
bra
te c
atc
h
CS
20
07
Fig X7 Relationship between soil pH measured
in soils sample (0-15 cm depth) in CS2007 and
the total catch of soil invertebrates from soil core
(0-8 cm) depth
Soil pH 1998
Log soil invertebrate
catch in 2007
190
Countryside Survey Soils Report from 2007
8 Soil invertebrates
woodland becomes included within later surveys Increasing woodland may therefore play only a limited role as a driver of overall change
844 Concluding remarks
Re-sampling of the soil invertebrate community was undertaken in CS in 2007 as part of the soil work -package according the published CS methodology A total of 945 samples were enumerated Results indicated an overall significant increase in total invertebrate catch in samples from all habitats AVCs an d soil types except for agricultural areas located predominately on mineral soils The increase in invertebrate catch predominantly related to an increase in the catch of mites in CS in 2007 sample s This was shown in the increase in mite springtail ratio found across GB and in many Broad Habitats AVCs and soil LOI categories The increased dominance of mites was a major factor that decreased Shannon diversity in CS in 2007 cores although there was also a small reduction in the number of broad taxa represented in sample cores at the GB scale and also when the data was stratified to Broad Habitat AVC and soil type (by LOI) A single repeat sampling campaign such as CS cannot prove or disprove whether a large scale and long term change in soil biodiversity is underway Particularly effects of short term temporal effects such as seasonal weather patterns on invertebrate communities or sampling efficiency cannot be excluded Nonetheless on the basis of the survey data it is certainly not possible to confidently refute the possibility that such a change may be occurring This suggests that further analysis through focussed study may be needed to tease out whether the changes in soil chemistry land management or climate are playing a role in the observed so il invertebrate community change
85 References
Black HIJ Parekh NR Chaplow JS Monson F Watkins J Creamer R et al 2003 Assessing soil biodiversity across Great Britain national trends in the occurrence of het erotrophic bacteria and invertebrates in soil Journal of Environmental Management 67 255-266
Emmett BA Frogbrook ZL Chamberlain PM Griffiths R Pickup R Poskitt J Reynolds B Rowe
E Spurgeon D Rowland P Wilson J Wood CM 2008 CS Technical Report No 307 Soils Manual
NERCCentre for Ecology amp Hydrology 180 pp (CEH Project Number C03259) Frampton GK 2009 Spatial variation in non-target effects of the insecticides chlorpyrifos cypermethrin and pirimicarb on Collembola in winter wheat Pesticide Science 55 875-886 King RA Tibble AL Symondson WOC 2008 Opening a can of worms unprecedented sympatric cryptic diversity within British lumbricid earthworms Molecular Ecology 17 4684-4698 Lindberg N Persson T 2004 Effects of long-term nutrient fertilisation and irrigation on the microarthropod community in a boreal Norway spruce stand Forest Ecology and Management 188 125-135 Maraun M Salamon JA Schneider K Schaefer M Scheu S 2003 Oribatid mite and collembolan diversity density and community structure in a moder beech forest (Fagus sylvatica) effects of mechanical perturbations Soil Biology amp Biochemistry 35 1387-1394 Osler GHR Cole L Keith AM 2006 Changes in oribatid mite community structure associated with the succession from heather (Calluna vulgaris) moorland to birch (Betula pubescens) woodland Pedobiologia 50 323-330 Pedersen MB Axelsen JA Strandberg B Jensen J Attrill MJ 1999 The impact of a copper gradient on a microarthropod field community Ecotoxicology 8 467-483
191
Countryside Survey Soils Report from 2007
8 Soil invertebrates
Schon NL Mackay AD Minor MA Yeates GW Hedley MJ 2008 Soil fauna in grazed New Zealand hill country pastures at two management intensities Applied Soil Ecology 40 218-228 Van Straalen NM Rijninks PC 1982 The efficiency of Tullgren apparatus with respect to interpretation seasonal-changes in age structure of soil arthropod populations Pedobiologia 24 197-209
192
Countryside Survey Soils Report from 2007
This report was produced by the Centre for Ecology amp Hydrology with input from the other members of the Countryside Survey partnership Copyright of the report and photographs is owned by the Natural Environment Research Council Copyright enquiries should be addressed to Knowledge Transfer Team Centre for Ecology amp Hydrology Maclean Building Benson Lane Wallingford OX10 8BB This publication excluding logos may be reproduced free of charge in any format or medium for research private study or the purposes of internal use within an organisation This is subject to it being reproduced accurately and not being subject to any treatment that could be considered derogatory The reproduced material must be acknowledged as NERC Copyright (except where otherwise s tated) and the publication cited as follows Emmett BA Reynolds B Chamberlain PM Rowe E Spurgeon D Brittain SA Frogbrook Z Hughes S Lawlor AJ Poskitt J Potter E Robinson DA Scott A Wood C Woods C 2010 Countryside Survey Soils Report from 2007 Technical Report No 907 NERCCentre for Ecology amp Hydrology 192pp (CEH Project Number C03259)
For further information on Countryside Survey see wwwcountrysidesurveyorguk
Or contact Countryside Survey Project Office Centre for Ecology amp Hydrology
Lancaster Environment Centre Library Avenue Bailrigg Lancaster LA1 4AP
Telephone 01524 595811 Email enquiriescehacuk Countryside Survey in 2007 was funded by a partnership of government -funded bodies led by the Natural Environment Research Council (NERC) and the Department for Environment Food and Rural Affairs (Defra)
Disclaimer Any decisions or actions informed by this Technical Report are taken entirely at your own risk In no event shall NERC be liable for any damages including loss of business loss of opportunity loss of data loss of profits or for any other indirect or consequential loss or damage whatsoe ver arising out of the use of or inability to use the material presented in this report The Countryside Survey partnership has endeavoured to ensure that the results presented in this report are quality assured and accurate Data has been collected to es timate the stock change extent andor quality of the reported parameters However the complex nature of the experimental design means that results can not necessarily be extrapolated andor interpolated beyond their intended use without reference to the original data
2
Countryside Survey Soils Report from 2007
Acknowledgements
The Countryside Survey of 2007 is funded by a partnership of nine government funded bodies led by the Natural Environment Research Council (NERC) and the Department for Environment Food and Rural Affairs (Defra) The completion of the survey has only been made possible by the support and advice of many dedicated individuals from these and other organisations who provided their time and valuable advice to the project board the project steering group and the pro ject advisory groups The project Partners would like to thank all the landowners farmers and other land managers who gave permission for the field surveyors to collect data and samples from their land Without such cooperation scientific field studies like Countryside Survey would not be possible The Countryside Survey Partners would like to thank all those who contributed to the work presented in this report largely in NERC‟s Centre for Ecology amp Hydrology (CEH) Field surveyors regional coordinators and QA teams Nik Aspey Boris Assyov Maurice Bailey Dave Bennett Caroline Boffey Katja Busch Anne Butler Luciana Carotenuto Paul Chamberlain Rebecca Chance Jake Chant Hannah Chivers David Cole Ceirios Davies Kathryn Dawson Jan Dick Mit zi de Ville Martin Duncan Claire Edwards Richard Ellis Fiona Everingham Angus Garbutt Iain Gunn Anne Harvey Adrianna Hawczak Stuart Hedley Lynn Heeley Gale Hodges Nik Hudson Sarah Hulmes Gwilym Jones Ursula Jones Jana Kahl Emma Koblizek W endy MacFarlane Lindsay Maskell Alain Mauric Elaine McClymont Sebastian Meis Bruce Miller Ruth Mitchell Lindsay Moore Lila Morris Mike Morecroft Owen Mountford John Murphy Emma Nicklin Lisa Norton Peter Nuttall Judith O‟Hare Martin Page De nise Pallett Hristo Pedashenko Jodey Peyton Alison Pike Hannah Price Maria Ramirez -Jimenez Amy Rees Brian Reynolds Nicola Rivett Glenn Roberts Liz Roberts Patrick Home Robertson Rob Rose Martin Rossall Ed Rowe Frank Ryan Stephen Ryder Pete Scarlett Dave Scott Robert Seaton Luke Sidebottom Louise Slack Simon Smart Tom Smith Jon Steele Peter Steward Michelle Taylor Sam Thomas Nicola Thompson Will Thomson Annie Truscott Linda Turner Jackie Ullyett Kiril Vasilev Katy Walker Ke vin Walker Alistair Watson Trevor West James Whiteford Michael Wilcox Lorna Wilkie Geoffrey Wilkinson Claire Wood Statistical analytical technical and data management support Annie Brittain Mike Brown Paul Chamberlain Kathy Chandler Jackie Chaplow Jenny Clapham Ralph Clarke Andy Crowe Zoe Frogbrook Steve Hughes Alan Lawlor Jan Poskitt Elaine Potter Annabel Rice Phil Rowland Andy Scott Rod Scott Rick Stuart Nicola Thomson Colin Vincent Mike Wilson John Watkins Ruth Watts Claire Wood Clive Woods and Simon Wright Advice and training Colin Barr Helaina Black Bob Bunce Zoe Frogbrook Dave Howard Mike Hornung Steve Marshall Steve Moss and Dave Wilson Project management and administration Mark Bailey Mike Brown Peter Carey Julie Delve Bridget Emmett Les Firbank Julie Grimshaw Lindsay Maskell John Murphy Lisa Norton Dan Osborn Terry Parr Ian Simpson Simon Smart and John Watkins
3
Countryside Survey Soils Report from 2007
Contents
Executive Summary p4 1) Field Sampling and Bulk Density p9 2) Carbon p18 3) Soil pH p47 4) Total nitrogen and CN p71 5) Mineralisable-N p89 6) Olsen P p108 7) Soil metal concentrations p129 8) Soil invertebrates p167
4
Countryside Survey Soils Report from 2007
Executive Summary
Executive Summary
Countryside Survey is a unique study or bdquoaudit‟ of the natural resources of the UK‟s countryside The Survey
has been carried out at regular intervals since 1978 The countryside is sampl ed and studied using rigorous
scientific methods allowing us to compare results from 2007 with those from previous surveys In this way
we can detect the gradual and subtle changes that occur in the countryside over time A series of reports
have been published outlining the main findings for UK and individual countries which included results for two
soil variables namely soil carbon and acidity This report outlines the major findings for all soil variables
measured as part of the survey in 2007
Key policy questions to be answered in 2007 were
Can we confirm the loss of soil carbon (0-15cm) as reported by Bellamy et al 2005
Has the recovery from acidification detected by Countryside Survey in 1998 between 1978 and 1998
continued
Can the trend of eutrophication of the countryside detected in the vegetation be detected in the soil
using the mean total nitrogen concentration
Can the trend of eutrophication of the countryside detected in the vegetation be detected in the soil as
well using a more sensitive soil process method for nitrogen
Can the trend of increasing P status in intensive grasslands be confirmed and is it matched in other
habitats
Is the decline in atmospheric deposition of heavy metals as reported by the Heavy Metals Monitoring
Network reflected in soil metal concentrations measured in Countryside Survey
Does Countryside Survey provide any evidence to indicate that there has been a loss of soil
biodiversity as has been stated by the European Union
Soils have been part of Countryside Survey since it‟s inception in 1978 The rationale for their inclusion was
originally to provide many of the explanatory variables which contribute to the understanding of vegetation
distribution and change which are the central core of the survey More recently soils have been recognised
as a valuable resource in their own right due to their importance for delivering a range of ecosystem services
Consequently the number of variables have increased over time from soil organic matter and pH in 1978 to
nutrients contaminants and biodiversity in 1998 and soil physical measurements and biogeochemical fluxes
in the latest survey in 2007
The soil variables were selected for inclusion in the 2007 survey according to a range of criteria including
relevance to policy needs scientific questions uniqueness of Countryside Survey soils data both in isolation
and when combined with other Countryside Survey variables value for money and links and compatibility
with other soil monitoring programmes It should be noted that with the exception of soil invertebrates many
Countryside Survey soil variables are currently included in the list of recommended primary indicators of soil
quality by the UK Soil Indicator Consortium namely soil organic matter soil organic carbon bulk density soil
acidity (pH) mean total nitrogen concentration an indicator of phosphorus availabil ity (Olsen-P) an indicator
of nitrogen availability (mineralisable-N) total copper zinc cadmium and nickel All variables with the
exception of soil invertebrates are measured in the top 15cm of the soil profile only Soil invertebrates are
recorded for the top 8cm of soil This focus on the top 15cm of soil mirrors the focus of several other soil
monitoring programmes as it is thought the top soil horizons are the most susceptible to change over time as
they are more immediately affected by land management activities and environmental change Ideally future
soil monitoring should include lower soil horizons as important stocks of carbon supply of nutrients filtering
and storage of contaminants and soil biota occur below the top 15cm
Countryside Survey uses a sampling approach which samples one-kilometre squares randomly located within
different land class in GB The original 1978 survey consisted of 256 1-km squares and collected five soil
samples per square where possible taken from random co-ordinates in five segments of the square Detailed
vegetation and other biophysical measurements were taken at the same location In total the 1978 survey
collected 1197 soil samples for analysis During 1998 surveyors collected soil samples from the plots used
5
Countryside Survey Soils Report from 2007
Executive Summary
for soil sampling in the original 1978 squares and 1098 samples were returned for analysis Plots were re-
located using maps andor markers placed in the 1978 survey In 2007 591 1-km squares were sampled with
a total of 2614 samples returned for analysis More samples were therefore taken in 2007 than collectively in
1978 and 1998 This increase in sample over time has been driven by the requirement to provide individual
country level reports first for Scotland in 1998 and then Wales in 2007 Statistical methods are used to
enable this increase in sample number over time to be taken into account when estimating change over time
The limited number of sampling sites in Wales in 1978 and 1998 have limited the number of vegetation and
soil categories where change can be reported However the data provides an important expanded baseline
for reporting a wider range of changes in future surveys
Full details on all methods used are available from the Countryside Survey website (Emmett et al 2008
available at httpwwwcountrysidesurveyorgukpdfreports2007CS_UK_2007_TR3pdf)
Results are reported by three major categories for Great Britain and individual countries
Broad Habitat - The Broad Habitat classification consists of 27 habitats which account for the entire
land surface of Great Britain and the surrounding sea Countryside Survey reports on soils for 10
major terrestrial habitats
Aggregate Vegetation Class (AVC) ndash is a high level grouping of vegetation types produced from a
quantitative hierarchical classification of the different plant species found in the original Countryside
Survey sample plots Soil organic matter category - Mineral humus mineral organo-mineral and organic soils
Significant results relate to statistical significance with their ecological and policy relevance highlighted
where appropriate
Key findings from the soils component of the Countryside Survey in 2007 are
Bulk Density
A total of 2614 samples were sampled from 591 1km squares from across G reat Britain during the Countryside Survey field survey in 2007
Topsoil bulk density measurements were carried out on all individual samples collected in 20 07 Values ranged from 002 to 195 g cm
-3 and were negatively correlated with soil C concentration
Mineral soils exhibited the highest bulk density values and organic soils the lowest Average topsoil bulk density across Aggregate Vegetation Class and Broad Habitat classes varied between 02 and 12 g cm
-3 and was lowest in Bog soils and highest in Arable and Horticulture soils
A new transfer function between bulk density and C has been defined which significantly changes past estimates of soil carbon densities and stocks (0-15cm) of organic soils previously published for other surveys
Carbon
Carbon concentration in the soil (0-15 cm) increased in Great Britain between 1978 and 1998 and decreased between 1998 and 2007 Overall there was no change in carbon concentration in the soil (0-15 cm) in Great Britain between 1978 and 2007 and cannot confirm the loss reported by the National Soil Inventory
The one consistent exception is loss of carbon (0 -15cm) from the intensively managed Arable and Horticulture Broad Habitat Crops and Weeds Aggregate Vegetation Class This suggests that current policies in place to limit soil degradation are not maintaining soil quality in cropped land
The mean soil (0-15cm) carbon density across Great Britain in 2007 was calculated to be 69 tha ranging between a mean of 47 tha in the Arable and Horticulture Broad Habitat to a mean of 91 tha in Acid Grassland Peat soils do not contain the highest density in topsoil due to low bulk densities The new transfer function between bulk density and C significantly changes past estimates of soil carbon densities stocks and change (0-15cm) of organic soils previously published for other surveys
6
Countryside Survey Soils Report from 2007
Executive Summary
Area estimates for each Broad Habitat were used to convert soil carbon densities to soil (0-15cm) carbon stock for GB and individual countries Soil (0 -15cm) values were 1582 TgC for GB and 795TgC 628 TgC and 159 TgC for England Scotland and Wales in 2007 respectively It must be emphasised this significantly underestimates the tota l carbon stock in soils due to the large carbon stores at depth particularly in peat soils This has greatest impact for estimates for Scotland However topsoil carbon stocks may be most vulnerable to land management activities and environmental change
pH
The mean pH of soils (0-15cm) increased in less acidic soils across Great Britain (GB) between 1998 and 2007 continuing a trend observed between 1978 and 1998 These soils are associated with Broadleaved Woodland Arable and Horticulture Improved Grassland and Neutral Grassland Broad Habitats This increase in pH is consistent with the expected benefit of continued reductions in sulphur emissions
There was no significant change in mean soil (0-15 cm) pH in more acidic organic-rich soils across Great Britain between 1998 and 2007 This will affect Broad Habitats such as Bog Dwarf Shrub Heath and Acid Grassland Data analysis is ongoing to determine if the lower su lphur reductions in the north and west of the Great Britain or other drivers of change such as nitrogen deposition and land management are responsible in the organic soils where pH did not significantly increase between 1998 and 2007 Conversion between land uses between surveys was not responsible for this as similar trends were observed in soils with or without conversion
One exception with no apparent trends between any time period was Coniferous Woodland It is possible the acidification of soils associated with intensive forestry due to base cation uptake and enhanced capture of acidic pollutants by the tree canopy may be offsetting the effects of reduced sulphur emissions
The results for individual countries broadly reflected those for Great Britain as a whole with continued increase in soil pH only observed in less acidic soils Insu fficient sample size for some habitat types with lower area in individual countries prevented significant trends being identified in some cases
The implications of these findings are that current emission control policies combined with current policies to protect soil through sustainable land management practices have had some major benefits but they may not be sufficient to promote continued recovery from acidification in organic -rich soils
Nitrogen
There were small but significant decreases in mean so il (0-15 cm) total nitrogen concentration between 1998 and 2007 in many Broad Habitats and Aggregate Vegetation Classes across Great Britain and the individual countries no reporting category recorded an increase in mean soil (0 -15 cm) total nitrogen concentration
For semi-natural and woodland soils continued input of nitrogen deposition at 20 -30 kgNhayr for many parts of Great Britain has not caused the expected average increase of 3 -4 in this basic soil property Instead the decreases observed combined with a trend for an increase in total carbon to nitrogen ratio suggest there may be increased nitrogen loss or uptake possibly combined with a trend for increased carbon density as reported for some soils in Chapter 2 The effects of one or both of these processes would be to effectively bdquodilute‟ the soil (0 -15cm) nitrogen concentration signal Both processes (increased nitrogen loss and increased carbon fixation by plants leading to storage in soil) are known possible consequences of nitrogen enrichment which can result in vegetation composition change and thus this parameter may not be a sensitive indicator of eutrophication from atmospheric nitrogen deposition
There was no change or a small significant decline in mean soil total nitrogen concentrati ons in improved and fertile grassland categories between 1998 and 2007 across Great Britain and within individual countries despite major reductions in fertiliser use As there is no change in the soil (0 -15cm) total carbon to nitrogen ratio this indicates farmers have maintained soil nitrogen status in managed grassland systems despite a reduction in mineral fertiliser use possibly due to use of alternative organic sources of nitrogen such as slurry and organic waste products
7
Countryside Survey Soils Report from 2007
Executive Summary
In cropland systems a significant decline in soil (0-15cm) total nitrogen concentrations and total carbon to nitrogen ratios was observed between 1998 and 2007 for Great Britain and England A significant decline in soil (0-15cm) total carbon concentrations was also reported (Chapte r 2) As there is only a small decline in fertiliser use in these systems and there is evidence of combined carbon and nitrogen loss deep ploughing erosion or increased decomposition rates may be the most likely explanation of this trend
Mineralisable-N
Mineralisable-N stock (kgN ha) in soil (0-15cm) was a sensitive indicator of recognised differences in nitrogen availability between different vegetation types suggesting it is a promising indicator of eutrophication of the countryside
Initial investigations testing the link between mineralisable-N and occurrence of plant species in 45 test sites suggests it provides additional information to mean total nitrogen concentration data (N) possibly linked to short term changes in nitrogen availability or specific vegetation or soil types
There were strong geographical trends in the proportion of mineralised -N transformed to the mobile form nitrate which suggest a close relationship to broad-scale climatic or soil parameters
Future analyses will separate out the inherent variability associated with climate vegetation and soil type to identify spatial patterns which can be linked to atmospheric deposition and changes in management
Olsen-P
Mean Olsen-P concentrations in soil (0-15cm) is an index of the fertility of agricultural soils It‟s use and relevance in semi-natural and organic soils is less certain Soils collected during Countryside Survey in 1998 and 2007 indicated there had been a significant decrease in Olsen-P concentrations in soil (0-15cm) in most Broad Habitats or Aggregate Vegetation Classes across Great Britain and within individual countries
Olsen-P concentrations in soil (0-15cm) decreased significantly in all soil organic matter categories across Great Britain and within individual countries between 1998 and 2007 apart from humus-mineral soils in Scotland where no change was observed
The data do not confirm a trend of increasing P status in intensive grasslands or any other habitat soils (0-15cm) but indicate a loss of available phosphorus between 1998 and 2007 across a wide range of habitats and soil types This is likely to be linked to the large reductions in phosphorus fertiliser use over the same period
Metals
A comparison of back corrected Countryside Survey soils (0 -15cm) analyses for 1998 and 2007 samples indicated that as would be expected only relative small changes in soil trace metal concentrations occurred between surveys despite reported declines in atmospheric deposition due to the long residence time of metals in soils
Of seven metals for which repeat measurement were made during the 2007 survey only for one Cu was a statistically significant difference in soil (0 -15cm) concentrations (an increase) found at the GB level
When the data for repeat metal measurements were stratified by Broad Habitat Aggregate Vegetation Class and soil organic matter category further statistically significant differences were seen For Cu generally significant increases were observed whilst for two metals Cd and Pb changes were small and idiosyncratic between stratifications For three metals Cr Ni Zn changes were generally characterised by reduction in crop lands and no change or slight increases in less managed habitats
For some metals such as Cu and Cd it is likely that additional sources (animal manures and possibly sewage sludge manures and compost for Cu and fertiliser for Cd) beyond atmospheric inputs are important in maintaining or even increasing soil concentrations principally in managed areas For the remaining metals especially Cr Ni and Zn there is some suggestion that in areas where cropping takes place output fluxes may now exceed inputs enabling soil concentrations to decline
8
Countryside Survey Soils Report from 2007
Executive Summary
Managed landscape where intensive cropping takes place but sewage sludge a nimal manures and composts are rarely applied may be among the first habitats to return from their slight -moderately elevated states to their pre-industrial background concentrations and could be a focus for future monitoring
Soil Invertebrates
There were an estimated 128 quadrillion (128x1016
) soil invertebrates present in the top 8 cm of Great Britain soils during the time of Countryside Survey sampling in 2007 Comparing these results with those from the survey in 1998 has enable change in soil b iodiversity to be estimated at a national scale
A significant increase in total invertebrate catch in samples from soils (0-8cm) from all Broad Habitats Aggregate Vegetation Classes and soil organic matter categories except for agricultural areas on mineral soils was found in Countryside Survey in 2007 The increase in invertebrate catch was mainly the result of an increase in the catch of mites in 2007 samples This resulted in an increase in the mite springtail ratio but a decreased Shannon diversit y due to the dominance of mites in Countryside Survey in 2007 cores
A small reduction in the number of soil invertebrate broad taxa (0 -8cm) was recorded which is not inconsistent with reported declines in soil biodiversity However repeat sampling is required to ensure this is not linked to different seasonal conditions in the two sampling years Further analysis through focussed study may be needed to assess whether the changes in soil chemistry land management annual weather patterns or merely natural population variation can explain observed soil invertebrate community changes
Preliminary results from the soils work were presented in the Countryside Survey UK Results from 2007
report (Carey et al 2008 ab) and the country Reports published for England Scotland and Wales in 2009
(httpwwwcountrysidesurveyorgukreports2007html )
Data for the Countryside Survey in 2007 and earlier years have previously been released via the project web
site (httpwwwcountrysidesurveyorgukdatahtml)
The policy implications of trends observed are outlined in each chapter of the report together with a
discussion of possible causes of the changes observed Ongoing data analysis is focussed on identifying the
links between soil variables measured between soil and vegetation and water quality changes reported in
other Countryside Survey reports and between trends in soil variables and the intended and unintended
change of our environment from man‟s activities such as land use and management air pollution and climate
change A subset of the results from these analyses will be reported in the Countryside Survey Integrated
Assessment Report later in 2010 with the remainder in the scientific peer-review literature
9
Countryside Survey Soils Report from 2007
1 Field sampling and Bulk Density
Summary
A total of 2614 samples were collected from 591 1km squares across GB during the CS field survey
in 2007
Topsoil bulk density measurements were carried out on all individual samples collected in 2007
Values ranged from 002 to 195 g cm-3
and were negatively correlated with soil C concentration
Mineral soils exhibited the highest bulk density values and organic soils the lowest Average
topsoil bulk density across Aggregate Vegetation Class and Broad Habitat classes varied between
02 and 12 g cm-3
and was lowest in bog soils and highest in arable and horticultural soils
A new transfer function between bulk density and C has been defined which significa ntly changes
past estimates of soil carbon densities and stocks (0-15cm) of organic soils previously published
for other surveys
11 Introduction
Countryside Survey (CS) is an integrated survey of the GB countryside and soils have been part of CS since
its inception in 1978 The rationale for their inclusion was originally to provide many of the explanatory
variables which contribute to the understanding of vegetation distribution and change which are the central
core of the survey
The sampling strategy used for CS is based on a rigorous statistical approach as an audit of the entire GB
countryside combining monitoring of habitat vegetation soils and waters would be prohibitively expensive
and impractical to run CS uses a sample based approach to collect information at the level of detail required
for national reporting whilst providing the benefits of integrated monitoring It is important to remember that
the results of CS are therefore calculated estimates and not absolute numbers derived from a complete
coverage of the country
Great Britain was stratified first into Land Classes based on the major environmental gradients across the
countryside This permitted the sample to be structured to give reliable national statistics and also ensured
that the sample is representative of the range of different environments found in Great Britain (England
Scotland and Wales) The sample consists of a set of bdquosample squares‟ measuring 1km x 1km selected
randomly from the Ordnance Survey grid within the various Land Classes Altogether 591 sample squares
were surveyed in 2007 289 were in England 107 in Wales and 195 in Scotland Sufficient sample squares
were selected from each geographical region to enable reliable statistical reporting for Great Br itain as a
whole and for each separate country (Table 11) As far as possible the same squares are resampled each
time CS is repeated but in addition each successive CS has included greater numbers of sample squares
The estimates of change presented in this report use a statistical modelling technique to infer missing values
so that changes between each year of the survey can be made using the maximum data available - see the
CS Statistical report (Scott 2008) For full information about CS and methodology employed in square and
plot selection and the field survey see the main GB report (Carey et al 2008 available at
httpwwwcountrysidesurveyorgukreports2007html)
10
Countryside Survey Soils Report from 2007
1 Field sampling and Bulk Density
Table 11 Number of squares surveyed in each survey year which included soil sampling in each
country of GB
Country 1978 1998 2007
England 126 302 289
Scotland 108 203 195
Wales 22 64 107
Total 256 569 591
The soil variables were selected for inclusion in the 2007 survey according to a range of criteria including
relevance to policy needs scientific questions uniqueness of CS soils data both in isolation and when
combined with other CS variables value for money and links and compatibility with other soil monitoring
programmes It should be noted that with the exception of soil invertebrates many CS soil variables are
currently included in the list of recommended primary indicators of soil quality by the UK Soil Indicator
Consortium namely soil organic matter (LOI) and soil organic carbon bulk density soil acidity (pH) total-N
(N) an indicator of phosphorus availabilty (Olsen-P) an indicator of nitrogen availability (mineralisable-N)
total copper zinc cadmium and nickel All variables with the exception of soil invertebrates are measured in
the top 15cm of the soil profile only Soil invertebrates are recorded for the top 8cm of soil This focus on the
top 15cm of soil mirrors the focus of several other soil monitoring programmes (eg NSI) as it is thought the
top soil horizons are thought to be the most susceptible to change over time as they are more immediately
affected by land management activities and environmental change Ideally future soil monitoring should
include lower soil horizons as they are important for storage of carbon supply of nutrients filter ing and
storage of contaminants and as a habitat for soil biota This is particularly important for carbon storage in
peat soils where significant carbon in stored below 15cm
12 Soil sampling and preparation for analysis
As part of the 1978 survey soil samples from the top approximately 0-15cm were collected from a soil pit in
the centre of each of the five Main bdquoX‟ Plots (200m2) randomly located in each of the 256 1km x 1km squares
Maps were drawn to help future relocation In 1990 permanent metal markers were placed immediately
adjacent to the south corner of all plots as mapped in 1978 (or according to an alternative detailed protocol if
within-field placement was inappropriate) during a CS survey which did not involve soil sampling Samples
were taken 15cm to the north of the inner 2m x 2m plot in the centre of the Main Plots in 1998 and to the
south in 2007 In 1998 and 2007 maps and markers were requested from the surveyors for all new or
changed locations Samples from 1998 and 2007 were therefore resampled 2-3m apart between each survey
This compares to 20-50m for the National Soil Inventory In total the 1978 survey collected 1197 soil
samples for analysis During 1998 surveyors collected soil samples from all plots used for soil sampli ng in
the original 1978 squares and 1098 samples were returned for analysis (Note a total of 569 squares were
visited across GB in 1998 but soil sampling was only included in the original 256 squares) In 2007 591 1 km
squares were sampled with a total of ca 11000 samples returned for analysis (591 squares x 5 Main Plots x
4 core types (Table 12) of which 2614 (591 squares x 5 Main plots ndash missing cores) were used for bulk
density analyses Some samples could not be taken for practical reasons or were not suitable for analysis
11
Countryside Survey Soils Report from 2007
1 Field sampling and Bulk Density
Table 12 Description of CS soil cores
Core No Colour and length Core measurements Comments
1 Black 15cm pH LOI Bulk density
N Olsen P metals
Insufficient sample for all analyses if soil
was peaty Core 4 was used in that
situation
2 White 8cm Invertebrate diversity
3 White 15cm Microbial diversity
Persistent organic
pollutants (POPs)
Frozen on arrival Microbial diversity
analyses are part of a NERC funded
project and are not reported as part of CS
POP analysis was not funded but sampled
preserved in case funding becomes
available
4 White 15cm Mineralisable-N Samples also used for metals and Olsen P
if insufficient sample in Core 1
The soil (0-15cm) samples enable changes in several key topsoil characteristics to be studied including pH
soil carbon and nitrogen concentrations and content a measure of available phosphorus heavy metal
concentrations and soil biota In addition measurements of potentially mineralisable nitrogen and bulk
density were made for the first time Three soil samples only were collected from each Main Plot from the top
15cm of the soil profile and a fourth for the invertebrate sample from the top 8cm only In 1998 and 2007 this
was carried out using a plastic corer hammered into the soil and then pulled out with the sample intact The
plastic was grey or black ABS (acrylonitrile butadiene styrene) water pipe In 1978 a soil pit was dug and soil
was collected from the top 15 cm of the profile in the side of the pit In all t hree years loose vegetation and
fresh litter were cleared from the soil surface before the sample was taken Samples were stored in cold
boxes and posted back to the laboratory for analysis On arrival at the laboratory all soil cores were logged
in the core extruded from the plastic tube a digital photograph taken and basic core dimensions taken
before processing began For full information on methodology and Standard Operating Procedures for all
variables see the CS Soils Manual (Emmett et al 2008 available at
httpwwwcountrysidesurveyorguktech_reportshtml)
13 Bulk density
Soil bulk density (BD) is the single most useful parameter of soil physical structure It is a direct measure of
soil compaction (or loosening) and is essential to assess total available pore space within a soil (that is total
porosity) Soil pore space occupies roughly half of the soils volume and is essential for the sustainable use
of soils since the pores hold air water and soil biodiversity Bulk density is an excellent measure of a most
important contemporary form of soil degradation that which occurs due to ill -timed cultivation compaction by
vehicles and stocking and also affects soil biodiversity since increased BD means reduced macropore
volume which is associated with decreases in microbial biomass and activity The rationale for measurement
is outlined in Table 13
The BD of a soil is also essential in the estimation of soil carbon (C) densities where it is necessary to
convert from soil organic carbon (SOC) to SOC per unit volume (eg g cm-3
) Soil carbon stocks (0-15cm)
can then be calculated by combining carbon densities with area of Broad Habitat Changes to soil C density
and stocks represent a major component of UK greenhouse gas emissions and under the Kyoto Protocol the
UK is required to make estimates of net carbon emissions to the atmosphere Changes in soil C stock will
12
Countryside Survey Soils Report from 2007
1 Field sampling and Bulk Density
need to be included in inventories and reporting if these estimates are to be meaningful To date our
knowledge of soil C stocks and changes is limited recent work by National Soil Resources Institute (Bellamy
et al 2005) indicates that large changes have occurred recently but these changes can only be related to
broad habitat types Determinations of soil BD in CS in 2007 will allow the calculation of topsoil C stocks and
change from 1998 whilst relating these observed changes to potential pressures and drivers such as land
use change climate change and atmospheric deposition
We assessed the different methods of extracting soil from the ground for BD determination including coring
and digging a soil pit Five different cores were tested 10 cm long x 5 cm diameter round core 15 cm x 64
cm round core 10 cm long x 5 cm square metal core 10 cm long x 8 cm s quare metal core 8 cm long x 4 cm
diameter round core The soil pit method involved digging a pit then filling the resulting hole with a plastic
bag and using water to measure the volume
Five field sites were visited to allow the comparison of 5 dif ferent soil types Soils tested were clayey soil
sandy soil peaty soil stony soil and a woodland loam Three replicates per extraction method (both coring
and pit extraction) per soil type were taken (excepting sand and clayey sand as it was deci ded that the
soils were uniform enough for just one sample to be taken) In the laboratory samples were weighed
separated out onto a tray and dried at 105degC Once dry the soils were sieved and stones and soil separated
All components were weighed and the BD calculated excluding stones and other debris
Table 13 Bulk density rationale for measurement
Facts Comments
History in CS
None
Links and compatibility to other monitoring programmes
National Soil Inventory - England amp Wales (NSI EampW) Bulk density estimated from original survey measurements National Soil Inventory (NSI Scotland) - Scotland Some bulk density values available Environmental Change Network Sample soils at 12 terrestrial sites every 5- and 20- years Bulk density measured every 20 years to depth of 120cm or bedrock
Obvious links to NSI EampW and NSI Scotland particularly in the 2007 Scottish resurvey which will happen at the same time as CS in 2007 However BD estimation methods differ and will need to be compared with caution Only one 20-year sampling has been made ndash next due in 2013 High intensity measurements on limited number of sites will complement CS data
Uniqueness of CS
No national dataset to estimate bulk density on every soil sample measured for C
Value for money (Policy priority or interpretative value X cost)
High High policy and interpretative value low cost Cheap reliable way of assessing soil physical structure Pedotransfer functions highly relevant for other survey and monitoring programmes
13
Countryside Survey Soils Report from 2007
1 Field sampling and Bulk Density
Overall the different core types tested gave fairly consistent BD values across soil types and no one core
type gave consistently higherlower BD values (Emmett et al 2008) The values of BD estimated from cores
and pits were similar and were within the ranges of typical values expected for each of the soil types
However any methods used for sampling in CS must take into account the time available in the field the
capacity of the field team to carry equipment and the logistics of t he survey The recommendations for BD
measurements in CS were as follows
The pit extraction method is not feasible due to the amount of heavy equipment needed and the
complexity of the task
Although the metal square cores tended to hammer in more easily they tended to distort easily in
difficult soils making their use limited In bdquosticky‟ soils some of the sample was left in the corners
of the core They are also heavier to transport by post
Taking the above into account the coring method is the only method which can be realistically
carried out in a consistent manner on such a large scale
The black 15 cm cores used in the 1998 are acceptable to use for measuring bulk density in the
majority of soils on the condition that surveyorslab personnel follow careful instructions
provided in the CS Field Handbook
Thus in 2007 CS soils were sampled using the 15 cm long x 5 cm diameter core hammered into the ground
and removed using pliers as in the 1998 soil survey
Bulk density was estimated for each soil sample by making detailed weight measurements throughout the soil
processing procedure Briefly the exact dimensions of the sampled soil core were recorded before the soil
was extruded from the plastic tube and the soil was then weighed homo genised reweighed before drying at
room temperature for up to two weeks At the end of this period the soil was again weighed and then sieved
to 2 mm and the weight and volume of the debris remaining (largely composed of stones and plant material
and called unsieved debris) recorded A sub-sample of 10 g of soil was then accurately weighed and dried
overnight at 105 degC before LOI determination The moisture loss at each stage of the process was used to
estimate the initial moisture content of the soil and from that the initial dry weight of the soil Bulk density
was then estimated using the equation
Data were analysed using the standard mixed model analysis appropriate to CS measurements The
statistical approach used for analys is for change involved bootstrapping which allows for non-normality in the
data without the necessity of knowing details of actual distribution As such it provides a more accurate
measurement of significance Annex F of Emmett et al (2008) provides a background document describing
this approach
14 Results
Results are presented for three major categories Broad Habitats Aggregate Vegetation Class and Loss on
Ignition Category
Broad Habitat - The Broad Habitat classification consists of 27 habitats which account for the entire
land surface of Great Britain and the surrounding sea Countryside Survey reports on 10 major
terrestrial habitats
Aggregate Vegetation Class (AVC) ndash is a high level grouping of vegetation types produced from a
quantitative hierarchical classification of the different plant species found in the original Countryside
Survey sample plots
( debris) unsieved of volume - collected core of volume
debris) unsieved of weight- soil of t(dry weigh )cm (gdensity Bulk 3-
14
Countryside Survey Soils Report from 2007
1 Field sampling and Bulk Density
Loss on ignition (LOI) category ndash soil type based on soil organic matter content defined as mineral (0-
8 LOI 0-44 g C kg-1
) humus-mineral (8 ndash 30 LOI 44-165 g C kg-1
) organo-mineral (30 ndash 60
LOI 165-330 g C kg-1
) and organic (60 ndash 100 gt 330 g C kg-1
)
Topsoil bulk density in individual samples in 2007 ranged from 002 to 195 g cm-3
and was negatively
correlated with soil C concentration with mineral soils exhibiting the highest bulk density values and organic
soils the lowest Average topsoil bulk density across AVC and BH classes varied between 0 2 and 12 g cm-3
and was lowest in bog soils and highest in arable and horticultural soils (Table 14) However within each
AVC or BH large ranges of BD values were observed
There was a strong relationship between C concentration and soil BD in the 20 07 data (Fig 11) which is
significantly different to the commonly used pedotransfer function from Howard et al (1995) and used by
Bellamy et al (2005) This relationship can be applied to the 1978 and 1998 LOI data to estimate BD in those
years This is required if estimates of soil density of C or other element are required between surveys To
limit the accumulation of errors through applying successive empirical transformations to the data the 2007
relationship between C concentration and density (calculated directly from the 2007 data) was used to
estimate C density from concentration in 1978 and 1998 in Section 23 and 24 Since the relationship
between C concentration and bulk density is non-linear average C densities cannot be calculated directly
from average concentration and bulk density values ie multiplying the values in C in Section 2 Tables
24 26 28 210 will not produce the C density estimates in Tables 25 27 29 211 and 212
CS estimates of topsoil C density assume that the relationship between C concentration and BD in 2007 is
the same in 1978 and 1998 Since there are no studies of changes in BD over time across the entire range of
C concentrations this assumption remains untested A range of factors such as land -use specific effects and
soil moisture variation are likely to contribute to the large variation in BD at any given C concentration ( Fig
11) but given the large sample size and representative nature of CS data it is unlikely that the overall C
concentration-BD relationship will change significantly over time
15
Countryside Survey Soils Report from 2007
1 Field sampling and Bulk Density
Table 14 Bulk density (g cm-3) in different Broad Habitat Classes Aggregate Vegetation Classes and Loss on ignition () categories
a) Great Britain - Broad Habitat
Broad Habitat 2007
Broadleaved Mixed and Yew Woodland 078
Coniferous Woodland 052
Arable and Horticulture 123
Improved Grassland 097
Neutral Grassland 090
Acid Grassland 043
Bracken 043
Dwarf Shrub Heath 035
Fen Marsh and Swamp 045
Bog 017
All habitat types 078
b) AVC - whole dataset
Aggregate Vegetation Class 2007
Upland Woodland 053
Lowland Woodland 082
Fertile Grassland 103
Infertile Grassland 088
Moorland Grass Mosaics 041
Heath and Bog 021
Tall Grass and Herb 105
Crops and Weeds 125
c) Loss on ignition category
LOI category () 2007
Mineral (0-8) 117
Humus-mineral (8-30) 077
Organo-mineral (30-60) 036
Organic (60-100) 014
16
Countryside Survey Soils Report from 2007
1 Field sampling and Bulk Density
Figure 11 Relationship between topsoil C concentration and bulk density in CS in 2007 Circles are estimates
from Countryside Survey samples in 2007 the solid line is the regression line of the data (y = 129e-00206x
+
251e-00003x
-2057) the dashed line is the estimate of bulk density derived from a commonly-used pedotransfer
function (y = 13 - 0275ln(x10) Howard et al1995 as used in Bellamy et al 2005)
15 Discussion and Policy Implications
To our knowledge our measurements of topsoil BD represent the most comprehensive dataset available for
GB to date Figure 11 compares our BD results with that of the pedotransfer function first used by Howard
et al (1995) and subsequently by Bellamy et al (2005) For C concentrations greater than 68 g C kg-1
the
Howard et al 1995 equation overestimates BD especially at high C concentrations Using the Howard et
al 1995 equation soils containing gt400 g C kg-1
are constrained to possess a BD of 022-028 g cm-3
but
CS results show that 92 of soils containing gt400 g C kg-1
exhibit BD lt02 g cm-3
and 51 have a BD lt01
g cm-3
Very low BD for highly organic topsoils has been reported by other authors (eg Givelet et al 2004
van der Linden et al (2008) The differences in the two BD equations have implications for the estimates of
topsoil C stock and change given by Bellamy et al 2005 Our estimate of 949 Tg for the total topsoil C stock
of England and Wales in 1978 is substantially larger than the 864 Tg estimated by Bellamy et al (2005)
however this is partly due to different conversion factors used assuming that C is 50 of LOI (as Bellamy et
al 2005) rather than 55 (the value used here) CS data yields an estimate of 863 Tg C for England and
Wales in 1978 However the different BD equations produce estimates of C stock at specific C
concentrations that vary considerably Bellamy et al (2005) estimated that soils in England and Wales which
contained gt300 g C kg-1
in 1978 had a total topsoil (0-15 cm) C stock of 122 Tg Using the more realistic CS
equation to estimate topsoil C stock for these soils reduced this value to ca 73 Tg and on the same basis
would reduce the estimated loss of C from these soils from 21 to ca 12 Tg yr-1
However these revised
17
Countryside Survey Soils Report from 2007
1 Field sampling and Bulk Density
estimates of topsoil C stocks do not explain the substantial differences between our results and those of
Bellamy et al 2005 in terms of change in topsoil C concentration and stock Reasons for this continue to be
explored The importance of the modified transfer function is less important when bulk density is used as an
indicator of soil quality associated with land management practices as change rather than absolute value in
these situations is usually of greater interest
16 References
Bellamy PH Loveland PJ Bradley RI Lark RM and Kirk GJD 2005 Carbon losses from all soils
across England and Wales 1978-2003 Nature 437 245-248
Carey PD Wallis S Chamberlain PM Cooper A Emmett BA Maskell LC McCann T Murphy J
Norton LR Reynolds B Scott WA Simpson IC Smart SM Ullyett JM 2008 Countryside Survey
UK Results from 2007 NERCCentre for Ecology amp Hydrology 105pp (CEH Project Number C03259)
Emmett BA Frogbrook ZLChamberlain PM Griffiths R Pickup R Poskitt J Reynolds B Rowe
E Rowland P Spurgeon D Wilson J Wood CM 2008 Countryside Survey Soils Manual Countryside
Survey Technical Report No0407
Givelet N Le Roux G Cheburkin A Chen B Frank J Goodsite M E Kempter H Krachler M
Noernberg T Rausch N Rheinberger S Roos-Barraclough F Sapkota A Scholz C and Shotyk W
2004 Suggested protocol for collecting handling and preparing peat cores and peat samples for physical
chemical mineralogical and isotopic analyses J Environ Monit 6 481-492 2004
Howard PJA Loveland PJ Bradley RI Dry FT Howard DM Howard DC 1995 The carbon
content of soil and its geographic distribution in Great Britain Soil Use and Management 11 9-15
Scott WA 2008 Countryside Survey Statistical Report Countryside Survey Technical Report No407
NERCCentre for Ecology amp Hydrology and Pond Conservation 15pp (CEH Project Number C03259)
van der Linden M Barke J Vickery E Charman D J and van Geel B2008 Late Holocene human
impact and climate change recorded in a North Swedish peat deposit Palaeogeography Palaeoclimatology
Palaeoecology 258 1-27
18
Countryside Survey Soils Report from 2007
2 Carbon
Summary
Carbon concentration in the soil (0-15 cm) increased in Great Britain between 1978 and 1998 and
decreased between 1998 and 2007 Overall there was no change in carbon concentration in the soil
(0-15 cm) in Great Britain between 1978 and 2007 and cannot confirm the loss reported by the
National Soil Inventory
The one consistent exception is loss of carbon (0-15cm) from the intensively managed Arable and
Horticulture Broad Habitat Crops and Weeds Aggregate Vegetation Class This suggests that
current policies in place to limit soil degradation are not maintaining soil quality in cropped land
The mean soil (0-15cm) carbon density across Great Britain in 2007 was calculated to be 69 tha
ranging between a mean of 47 tha in the Arable Broad Habitat to a mean of 91 tha in Acid
Grassland Peat soils do not contain the highest density in topsoil due to low bulk densities A new
transfer function between bulk density and C has been defined which significantly changes past
estimates of soil carbon densities stocks and change (0-15cm) of organic soils previously
published for other surveys
Area estimates for each Broad Habitat were used to convert soil carbon densities to soil (0 -15cm)
carbon stock for GB and individual countries Soil (0-15cm) values were 1582 TgC for GB and
795TgC 628 TgC and 159 TgC for England Scotland and Wales in 2007 respectively It must be
emphasised this significantly underestimates the total carbon stock in soils due to the large carbon
stores at depth particularly in peat soils This has greatest impact for estimates f or Scotland
However topsoil carbon stocks may be most vulnerable to land management activities and
environmental change
21 Policy Background1
Key question Can we confirm the loss of soil carbon (0-15cm) as reported by Bellamy et al 2005
Measurements Organic matter content by loss-on-ignition of soil (0-15cm) in repeats of all plots sampled in
1978 and 1998 and all additional plots sampled in 2007 Carbon concentration data of soil (0-15cm) in
repeats of all plots sampled in 1998 and repeated in 2007 By combining these data and linking to bulk
density measurements CS in 2007 has delivered
Whole GB and country-level assessment of status and change of soil (0-15cm) carbon
concentration density and stock between 1978 1998 and 2007
19
Countryside Survey Soils Report from 2007
2 Carbon
Soil organic C (SOC) is one of the headline indictors of soil quality and there is a wide acceptance that
carbon is fundamental to soil functioning as it is the primary energy source in soils and has a critical role in
maintaining soil structural condition and resil ience and water retention All soils therefore need to retain
carbon However soil C changes are measured against large background stocks and high spatial
heterogeneity and more information is needed to be able to manage this resource better Specific policy
requirements which require improved information on the status and change of soil carbon content include UK
and EU legislation soil protection measures that will help to conserve soil carbon The reformed Common
Agriculture Policy requires all farmers in receipt of the single payment to take measures to protect their soil
from erosion organic matter decline and structural damage Changes to soil C content also represent a major
component of UK greenhouse gas emissions and under the Kyoto Protocol the UK is required to make
estimates of net carbon emissions to the atmosphere However knowledge of soil C stocks and changes is
limited recent work by the NSRI (Bellamy et al 2005) indicates that large changes have occurred recently
but there has been some debate concerning possible causes (Smith et al 2007) In addition if stocks could
be related to more detailed vegetation and other environmental data this would al low better mitigation
targeting Whereas above ground carbon cycling is well understood there are great uncertainties in climate
impacts on soil carbon cycling CS soil C data will contribute to knowledge of how soil C is changing how
this relates to vegetation change and land use and management and provide evidence of the effectiveness of
soil protection legislation
Soil samples taken for Countryside Survey in 2007 will be the third in a time series of samples from 1978 and
1998 this will be the first national soil time-series in Europe and possibly globally Analyses of topsoil C in
2007 will allow further quantification of topsoil C contents and change across all major UK land uses and
crucially through the link to other CS and spatially relevant information will allow the assignment of
pressures and drivers to the observed changes be they climate change land use and management or
atmospheric deposition This link to drivers of change will be reported in the CS Integrated Assessment
Report and peer-reviewed literature
22 Methods
221 Proof of concept
Loss-on-ignition (LOI) is a simple and inexpensive method for determining soil organic matter and estimating
soil organic carbon concentration (hereafter called soil C concentration) using an appropriate conversion
equation An analysis of the benefits of including the measurement in the 2007 survey is summarised in
Table 21
LOI values were determined for 1197 plots within 256 1km squares in 1978 1098 plots within 256 squares in
1998 and 2614 plots within 591 squares in 2007 The increase in sample number was necessary to provide
adequate statistical power to detect change within all three GB countries Power analysis of the exist ing CS
dataset (1978 amp 1998) was performed to determine the number of squares needed in 2007 to give adequate
reporting power for soils in Wales and greater power for soils in Scotland and England For further
information see Emmett et al (2008) Essentially sampling within CS can determine significant differences in
soil C concentration if these are greater than 8 of previous estimates
In 1978 and 1998 LOI was performed on 10 g soil at 375degC for 16 hours and on 1 g soil at 550degC for 3 hours
respectively In the preparation phase for CS in 2007 it was identified that the 1998 LOI method had resulted
in higher values of LOI across the enti re soil organic matter range relative to the 1978 method and it was
decided that all available 1998 soils would be reanalysed using the 1978 method Additionally it was
decided to use the 1978 LOI method in 2007 as 1) this would yield a consistent dataset across 1978 1998
and 2007 and 2) the use of 10 g soil for LOI is preferable since it is more representative than 1 g
Alongside LOI measurements soil C concentration was determined by elemental analyser analysis in 1998
and again in 2007 This measurement complements the LOI data since it is an actual measurement of C
20
Countryside Survey Soils Report from 2007
2 Carbon
concentration in soil however in soils with high amounts of carbonates the soil C concentration may be
considerably larger than the organic C concentration Soil C concentration cannot replace LOI as a method
of measuring soil C because 1978 samples were only analysed by LOI and not by soil C concentration
A conversion factor of 05 from the literature has been used to convert LOI to soil C concentration for CS
reports to date The completed analysis of the combined analysis of 1998 and 2007 data for LOI has
indicated a different value of 055 which is now being used in all estimates of soil C concentration and
carbon density
To calculate topsoil carbon density on a g cm-3
basis a measurement of C per unit volume is needed
Combining bulk density measurements reported in Chapter 1 for the 2007 samples with LOIsoil C
concentration values result in estimates of topsoil C density on an area basis This in turn can be combined
with Broad Habitat area estimates from the CS surveys leading to the first national survey assessment of
topsoil carbon stock (0-15cm) derived from co-located measured variables
Table 21 LOI soil C concentration density and stock Rationale for measurement
Issue Facts Comments
History in CS Loss-on-ignition Topsoil total C content () Topsoil carbon density (g cm
-3)
Measured in 1978 and 1998 for 256 squares Expanded to 591 squares in 2007 Gives total soil C content measured by elemental analyser in 1998 and 2007 on original plots which can be used to convert all 2007 LOI values A conversion function will be obtained from 2007 bulk density values
Repeat sampling will maintain the time series The increased spatial coverage will support country-level reporting by giving greater statistical power especially for Wales (see below) Data obtained from same analytical run as that of total soil N content This function will allow change in soil carbon density to be determined for all time periods
Links and compatibility to other monitoring programmes
National Soil Inventory- England amp Wales Information from 5500 locations in England amp Wales including C and soil horizon information National Soil Inventory - Scotland Data from 770 locations includes C and soil horizon information A partial repeat survey in Scotland was carried out 2007 ndash 2009 Environmental Change Network Soil monitoring at 12 terrestrial sites every 5 amp 20 years Total organic C and bulk density in both 5 and 20-year determinands Dissolved organic C
Data comparability exercise for Defra (Project SP0515) Analysis of repeat survey results in progress ECN data not available
21
Countryside Survey Soils Report from 2007
2 Carbon
measured in soils every 2 weeks Representative Soil Sampling Scheme (RSSS) Carried out since 1969 - 2003 soil samples taken from stratified random sample of 180 farms Runs on a five-year sampling cycle with a subset of the selected farms sampled each year UK Woodland resurvey Biosoil and Level II plots
RSSS not measured SOC since 1984 Data available for 103 woodlands Data in preparation
Uniqueness of CS LOI and C (0-15cm) Carbon density and stock (0-15cm)
CS soil samples are spatially linked to many other data collected at the same time It is unique in that the results can be linked to pressures and drivers eg vegetation deposition land management CS measures the bulk density of each soil sample which when combined with area enables anb estimate of soil (0-15cm) C stock
Sampling of soil in close proximity to the detailed vegetations characterisations is vital in the investigation of relationships between land usehabitat and soil characteristics Topsoil bulk density (BD) has not been measured within any large-scale soil survey until now The data can be used to determine how stable BD is over time and whether BD measured or estimated are required to assess soil carbon changes
Value for money (Policy priority or interpretative value x cost) LOI and soil C concentration (g kg
-1)
Topsoil C stock
High High
High policy and interpretative value (time series) low cost Expansion to all CS squares future-proofs data for further Surveys High policy and interpretative value low cost
22
Countryside Survey Soils Report from 2007
2 Carbon
222 Laboratory analysis
Samples for LOI were collected using the 15cm long by 5cm diameter black plastic core following the field
protocol described in Chapter 1 and in more detail in Emmett et al (2008) LOI was measured on a 10 g air
dried sub-sample taken after sieving to 2 mm The sub-sample was dried at 105degC for 16 hours to remove
moisture weighed then combusted at 375degC for 16 hours The cooled sample was then weighed and the
loss-on-ignition () calculated Soil C concentration was determined using a total elemental analyser for the
original 256 squares The method used was CEH Lancaster UKAS accredited method SOP3102 Details of
the method are given in Emmett et al (2008)
223 Quality Assurance and Quality Control
The DefraNERC Joint Codes of Practice were followed throughout
Method comparability A selection of 40 soils from 1998 were analysed by LOI using the methodologies
used in the 1978 and 1998 surveys (Table 22) Results gave good agreement over the whole range of LOI
values (Fig 21) but across the whole dataset mean LOI values were significantly lower (-12) using the
1978 method compared to the 1998 method (Table 23) This difference in the results using the 1978 method
was present regardless of whether the soils were heated for 2frac14 or 3 hr (mean decrease -114 and -143
respectively
Table 22 LOI method conditions in 1978 and original 1998 method
Survey Amount of soil (g) Temp (degC) Time (hr)
1978 10 375 16
1998 1 550 Not less than 2
23
Countryside Survey Soils Report from 2007
2 Carbon
Figure 21 Comparison of LOI using 1978 and original 1998 method
y = 1013x - 17343
R2 = 09982
0
20
40
60
80
100
0 20 40 60 80 100
LOI CS2000 method
LO
I 1
97
8 m
eth
od
Table 23 Differences in LOI results as a deviation from 1978 results using 1978 and original 1998 methods
LOI Mean difference
1978-1998 SD SE
lt20 -15 08 02
20-80 -12 32 11
gt80 -06 03 01
The results also show that the observed differences in LOI results are more pronounced at lower organic
matter contents where the 1978 method gave LOI values approx 15 lower than the 1998 method at LOI
values lt 20 compared with 06 lower at LOI values gt80 (Table 23) These lower LOI values
produced by the 1978 method are much more important when the organic matter content is low as a small
change in total organic matter content is a large relative change in organi c matter
These differences were not considered acceptable and all 1998 samples with sufficient sample remaining
were re-analysed using the 1978 method A transformation was devised for the remaining samples using the
relationship derived from those where dual analyses were available All samples in 2007 were analysed using
the 1978 methodology
Analytical QC In each analytical batch of samples for LOI in 2007 one soil was repeated The comparison
between the two replicates indicates clear reproducibility of results (Fig 22)
LOI 1998 method
24
Countryside Survey Soils Report from 2007
2 Carbon
Figure 22 Reproducibility of LOI measurements on repeated samples in 2007
0
20
40
60
80
100
0 20 40 60 80 100
Loss-on-ignition ()
Re
pe
at
los
s-o
n-i
gn
itio
n (
)
Conversion to soil C concentration For the main CS report released in November 2008 the soil loss -on-
ignition (LOI) to soil C concentration (g kg-1
) relationship was considered to be
soil C concentration = 05LOI
This value was derived from the literature and was used because at that time only soil C concentration data
for 1998 were available and it was not known if the new LOI to soil C concentration relationship was stable
and reproducible between years The soil C concentration data for 2007 are now available and have been
compared with that from 1998 Fig 23 demonstrates that to two decimal places the regression relationship
between LOI and soil C concentration was the same in both 1998 and 2007
soil C concentration = 055LOI
25
Countryside Survey Soils Report from 2007
2 Carbon
Figure 23 The relationship between LOI and soil C concentration () for 1998 and 2007 soils
y = 05453x + 04366
R2 = 09853
0
10
20
30
40
50
60
70
0 20 40 60 80 100
LOI
C
1998
2007
It should be noted that whilst these relationships have been shown for 1998 and 2007 we have no
measurements for 1978 It cannot therefore be demonstrated that such a relationship would hold in that year
However there seems no scientific reason to consider that the relationship would not hold in 1978
Since there is now a CS-specific LOI-soil C concentration relationship better estimates of topsoil C
concentration and density will be produced if the CS relationship is used compared to the literature derived
value However the estimates reported in the main CS report will then differ from those in the CS soils
report The difference is simple since the proportion of LOI accounted for by C has increased by 10 (from
05 to 055) all previous estimates of C concentration and density will also increase by 10
224 Reporting
The Broad Habitat (BH) classification has been developed over the last 15 years and currently consists of 27
habitats which account for the entire land surface of Great Britain and the surrounding sea ( Jackson 2000)
The BH areas in CS have a minimum mappable unit size of 400 m2 (Carey et al 2008) Since some Broad
Habitats contain no soil and others are rare and so not encountered frequently in CS only 10 BH are
reported here Additionally due to the lack of mapped habitat information in 1978 all reporting by BH refers
to the 2007 habitat allocation for the parcel in which each vegetation p lot resides except when the plot was
not sampled in 2007 in which case the 1998 BH allocation was used In summary t he BH is a description of
a parcel of land (eg an arable field) whilst the AVC is a description of a plot within a parcel (eg a smal l
patch of lowland woodland at the edge of an arable field) the AVC may not therefore be representative of the
whole parcel and may differ from the BH but is representative of the vegetation above the soil sampling
locations BH areas in 2007 were taken from Carey et al (2008) A soil type category has also been
developed based on soil organic matter content In summary
26
Countryside Survey Soils Report from 2007
2 Carbon
Broad Habitat - The Broad Habitat classification consists of 27 habitats which account for the entire
land surface of Great Britain and the surrounding sea Countryside Survey reports on soils for 10
major terrestrial habitats
Aggregate Vegetation Class (AVC) ndash is a high level grouping of vegetation types produced from a
quantitative hierarchical classification of the different plant species found in the original Countryside
Survey sample plots Loss on ignition (LOI) category ndash soil type based on soil organic matter content defined as mineral (0 -
8 LOI 0-44 g C kg-1
) humus-mineral (8 ndash 30 LOI 44-165 g C kg-1
) organo-mineral (30 ndash 60
LOI 165-330 g C kg-1
) and organic (60 ndash 100 gt 330 g C kg-1
) The soil C concentration values were mapped using kriging to interpolate between the Countryside Survey
sample points Routine checking of data for outliers was conducted and the working data set was transformed
using a normal score procedure to obtain a Gaussian distribution The data were then interpolated on a 1km
UK grid using ordinary kriging and finally the kriged data were back-transformed to produce an interpolated
map of soil C concentration In addition Sequential Gaussian simulation (SGs) was conducted on the data to
obtain the E-type estimate (mean) and the spatial uncertainty for the data (conditional variance) Both the
coefficient of variation CV (standard deviation mean) and the signal to noise ratio SNR (mean standard
deviation) are reported
23 Results
231 Structure of soil (0-15cm) LOI data and conversion to soil C concentration
Recorded LOI values were in the range 10 ndash 985 corresponding to topsoil C concentrations of 55 ndash 5418
g C kg-1
) The maximum C concentration possible in a soil is 550 g kg-1
using the conversion factor 055
The distribution of C concentrations across the observed range is shown in Fig 24 The mix of soils across
GB has a characteristic bi-modal U-shaped distribution pattern with the majority of soils containing lt100 g C
kg-1
Across the three Surveys mineral humus-mineral organo-mineral and organic topsoils accounted for
34-39 35-38 6-7 and 17-21 of all samples respectively
Within CS 58 of samples (2843 samples) come from plots which have been sampled more than once
Therefore 42 of samples come from plots only sampled once primarily due to the many extra sampling
locations in 2007 Some variation in C concentration in repeat plots would be expected due to occasional
failure in relocating the exact plot soil heterogeneity differences in sampling procedures across the Surveys
and real change over t ime However the vast majority of observed differences in repeat plots were small
(Fig 24) 83-91 of differences in repeat plots were lt100 g C kg-1
(lt20 LOI) At the other end of the
scale 1-5 of all differences from repeat plots were gt300 g kg-1
(gt60 LOI) Such large differences are
highly unlikely to be due to real change in soil C concentration and suggest that soils in some locations were
extremely heterogeneous or that surveyors were not always successful in accurately re -locating plots
27
Countryside Survey Soils Report from 2007
2 Carbon
Figure 24 Distribution of Countryside Survey soil C concentration data (0 -15cm) (a) Number of observations for
25 g kg-1
divisions (b) Cumulative frequency
232 Change in soil (0-15cm) C concentration and density across Great Britain
At the highest level of analysis for GB as a whole and for the whole 29 year period between 1978 and 2007
no net significant change in soil C concentration (0-15cm) was observed (Fig 25a amp b) Trends over time
were significant for Scotland and GB only with both showing a significant increase between 1978 and 1998
followed by a significant decline between 1998 and 2007 with no overall change over the whole 29 year
period The 1998 Survey contained a greater frequency of soils with higher LOI values whi ch led to higher
estimates of soil C concentrations that year We can find no systematic bias in our data (eg an
undersampling of a particular habitat soil type or geographical area) which could lead to this distribution and
the potential drivers of this temporal pattern is currently being investigated and will be reported in the
Integrated Assessment Report The overall picture is one of little large -scale change in topsoil C
concentrations in the long term
Mean soil C concentrations for individual countries vary due to the different frequencies of soil type Soil C
concentration increases in the order EnglandltWalesltScotland No significant change by soil carbon category
was observed (Fig 25b) Trends for individual countries are discussed more full y in the individual country
sections
28
Countryside Survey Soils Report from 2007
2 Carbon
Figure 25 Change in soil C concentration (0-15cm) for GB and individual countries (a) over time and (b) net
change between 1978 and 2007 Standard errors are indicated Significant differences ( plt0001 plt0 01
plt005) are shown between the years bracketed
a) b)
Significant changes were observed within and between the different Broad Habitat Aggregate Vegetation
Classes soil carbon categories and between the individual su rvey years (Table 24)
Amongst BHs which represent the larger habitat unit within which each soil sampling location resides topsoil
C concentrations in 1978 and 2007 were significantly different in Arable and Horticulture Bracken and
Broadleaf Woodland soils (Table 24a) Note that the BH is based on 2007 recording (and occasionally on
the 1998 data) since the BH classification did not exist in 1978 There were very low numbers of soil
samples in the Bracken BH in 1978 and 1998 ndash 10 and 12 respectively ndash so estimates for these years are
likely to be inaccurate The 2007 estimate which is based on 53 samples is more likely to represent a
reasonable value of the C concentration in the Bracken BH and the significant change is likely an effect of
better representation in 2007
The pattern of higher C concentrations in 1998 compared with the other Survey years also occurred within
many Aggregate Vegetation Classes although changes were not always significant ( Table 24b Fig 26)
Within AVCs the only significant differences in topsoil C concentration over the whole 29 year period were a
decrease in arable soils (AVC Crops and Weeds) and an increase in all woodlands (the combined Lowland
and Upland Woodland AVCs) (Fig 27a) In 1978 1998 and 2007 CS sampled 23 29 and 81 lowland
woodlands respectively and 76 71 and 198 Upland Woodlands Coverage of these AVCs was low in both
1978 and 1998 due to the smaller number of samples taken in these years and the infrequent occurrence of
woodlands in the GB countryside Larger areas of woodlands and greater numbers of soil samples collected
have contributed to greater numbers of woodland soil samples in 2007 Our report of topsoil C concentration
change in woodlands should therefore be seen in the context of low sample numbers in 1978 and 1998 and
represents our best estimates based on available CS data
To remove the effects of large-scale vegetationland use change we also estimated topsoil C concentrations
in plots which were sampled in all three Surveys and in which the AVC did not change over time ( Table
24c) Since the AVC of the plots is only known for the Survey years we cannot rule out changes in the
intervening years eg rotation between arable and grassland systems Therefore plo ts where the AVC has
-8
-6
-4
-2
0
2
4
6
8
10
12
GB England Scotland Wales
Ch
an
ge
in
ca
rbo
n c
on
ce
ntr
ati
on
(g
Ck
g)
0
50
100
150
200
250
300
1975 1980 1985 1990 1995 2000 2005 2010
Me
an
ca
rbo
n c
on
ce
ntr
ati
on
(g
Ck
g)
GB England Scotland Wales
29
Countryside Survey Soils Report from 2007
2 Carbon
not changed are plots in which the vegetation composition has been largely consistent in 1978 1998 and
2007 Only 405 plots had consistent AVCs in the three Surveys and because of this there were insufficient
samples in the Tall Grass and Herb AVC and soils in this category were ignored Additionally the lowland
and Upland Woodland AVCs were grouped into one category all woodlands due to the small number of
samples in each category individually Nevertheless trends in these plo ts were broadly consistent with those
observed for the whole dataset suggesting that shifts in AVC (ie land use change) are unlikely to be a major
factor in determining soil C concentration changes over time
Within soil C group categories there were significant increases in soil C concentration between 1978 and
1998 for mineral and organic soils however subsequent declines in the period 1998 to 2007 led to no
significant changes between 1978 and 2007 (Table 24d Fig 27b)
When soil C concentration (0-15cm) was converted to carbon density using the bulk density transfer function
the significant reduction in Broad Habitat Arable and Horticulture and AVC Crops and Weeds categories was
again apparent (Fig 28 Table 25) This appears the most consistent of all trends identified by CS in 2007
whether expressed as C concentration or density
Figure 26 The change in soil C concentrations (0-15cm) between 1978 1998 and 2007 across AVC
classifications characterised by (a) low ndash medium topsoil C concentrations and (b) high topsoil C
concentrations Significant changes are indicated in Table 24
a) b)
0
50
100
150
200
250
300
350
400
450
1975 1980 1985 1990 1995 2000 2005 2010
Me
an
ca
rbo
n c
on
ce
ntr
ati
on
(g
Ck
g)
Upland Woodland Moorland grass mosaic
Heath and Bog
0
10
20
30
40
50
60
70
80
90
100
1975 1980 1985 1990 1995 2000 2005 2010
Mean
carb
on
co
ncen
trati
on
(g
Ck
g)
Crops and Weeds Tall grass and herbs
Fertile grassland Infertile grassland
Lowland woodland
30
Countryside Survey Soils Report from 2007
2 Carbon
Figure 27 Overall change in soil C concentrations (0-15cm) between 1978 and 2007 (a) across AVC categories
and (b) LOI categories Standard errors are indicated Significant differences ( plt0001) are shown
a) b)
Figure 28 Overall change in soil C density (0-15cm) between 1978 and 2007 (a) across AVC categories and (b)
LOI categories Standard errors are indicated Significant differences ( plt005) are shown
a) b)
-6
-4
-2
0
2
4
6
8
Mineral Humus-mineral Organo-mineral Organic
Ch
an
ge
in
ca
rbo
n d
en
sit
y (
gC
cm
3)
-50
-40
-30
-20
-10
0
10
20
30
40
Mineral Humus-mineral Organo-mineral Organic
Ch
an
ge
in
ca
rbo
n c
on
ce
ntr
ati
on
(g
Ck
g)
-20
-10
0
10
20
30
40
50
60
Cro
ps amp
wee
ds
Tall g
rass
and
her
b
Fertile
gras
slan
d
Infe
rtile g
rass
land
Lowland
woo
dlan
d
Upl
and
woo
dlan
d
Moo
rland
gra
ss m
osaics
Hea
th a
nd b
ogCh
an
ge
in
ca
rbo
n c
on
ce
ntr
ati
on
(g
Ck
g)
-10
-5
0
5
10
15
Cro
ps amp
wee
ds
Tall g
rass
and
her
b
Fertile
gras
slan
d
Infe
rtile g
rass
land
Lowland
woo
dlan
d
Upl
and
woo
dlan
d
Moo
rland
gra
ss m
osaics
Hea
th a
nd b
og
Ch
an
ge
in
ca
rbo
n d
en
sit
y (
gC
cm
3)
31
Countryside Survey Soils Report from 2007
2 Carbon
Table 24 Changes in soil C concentration (0-15cm) in GB for (a) Broad Habitats (b) Aggregate Vegetation Class (AVC) (c) AVCs unchanged since 1978 and (d) LOI categories Arrows denote significant change (plt005 level) in the direction shown Diagonal line indicates too few samples to provide reliable value
a) Great Britain - Broad Habitat
Broad Habitat 1978 1998 2007 1978-1998 1998-2007 1978-2007
Broadleaved Mixed and Yew Woodland 624 1022 887
Coniferous Woodland 2037 2220 1978
Arable and Horticulture 345 335 307
Improved Grassland 564 583 569
Neutral Grassland 671 701 680
Acid Grassland 2351 2567 2285
Bracken 1552 1547 1959
Dwarf Shrub Heath 3053 2987 2849
Fen Marsh and Swamp 2317 2528 2286
Bog 4118 4499 4329
All habitat types 1356 1465 1370
b) AVC - whole dataset
Aggregate Vegetation Class 1978 1998 2007 1978-1998 1998-2007 1978-2007
All Woodlands 1037 1430 1309
Upland Woodland 1282 1780 1598
Lowland Woodland 580 861 655
Fertile Grassland 473 516 483
Infertile Grassland 624 696 661
Moorland Grass Mosaics 2186 2420 2258
Heath and Bog 3710 4127 3898
Tall Grass and Herb 536 463 470
Crops and Weeds 349 332 313
Aggregate Vegetation Class 1978 1998 2007 1978-1998 1998-2007 1978-2007
All Woodlands 800 1394 1465
Upland Woodland
Lowland Woodland
Fertile Grassland 509 555 548
Infertile Grassland 694 731 711
Moorland Grass Mosaics 2646 2941 2649
Heath and Bog 4137 4527 4366
Tall Grass and Herb
Crops and Weeds 289 282 251
d) Loss on ignition category
LOI category () 1978 1998 2007 1978-1998 1998-2007 1978-2007
Mineral (0-8) 298 327 302
Humus-mineral (8-30) 761 787 762
Organo-mineral (30-60) 2521 2682 2322
Organic (60-100) 4466 4824 4679
Mean carbon concentration gkg-1 Direction of significant changes
Mean carbon concentration gkg-1 Direction of significant changes
Mean carbon concentration gkg-1 Direction of significant changes
Mean carbon concentration gkg-1 Direction of significant changes
c) AVC unchanged
32
Countryside Survey Soils Report from 2007
2 Carbon
Table 25 Changes in soil C density (0-15cm) in GB for (a) Broad Habitats (b) Aggregate Vegetation Class (AVC)
(c) AVCs unchanged since 1978 and (d) LOI categories Arrows denote significant change (plt005 level) in the
direction shown Diagonal line indicates too few samples to provide reliable value
a) Great Britain - Broad Habitat
Broad Habitat 1978 1998 2007 1978-1998 1998-2007 1978-2007
Broadleaved Mixed and Yew Woodland 659 769 729
Coniferous Woodland 837 840 814
Arable and Horticulture 530 518 473
Improved Grassland 657 679 672
Neutral Grassland 655 717 686
Acid Grassland 916 889 906
Bracken 743 992 847
Dwarf Shrub Heath 842 839 899
Fen Marsh and Swamp 857 821 828
Bog 834 813 856
All habitat types 687 706 693
Aggregate Vegetation Class 1978 1998 2007 1978-1998 1998-2007 1978-2007
All Woodlands 722 796 796
Upland Woodland 761 835 847
Lowland Woodland 649 707 683
Fertile Grassland 608 659 626
Infertile Grassland 690 736 716
Moorland Grass Mosaics 869 897 898
Heath and Bog 824 835 844
Tall Grass and Herb 596 604 581
Crops and Weeds 509 512 479
Aggregate Vegetation Class 1978 1998 2007 1978-1998 1998-2007 1978-2007
All Woodlands 662 905 784
Upland Woodland
Lowland Woodland
Fertile Grassland 628 690 699
Infertile Grassland 711 738 729
Moorland Grass Mosaics 817 919 807
Heath and Bog 847 846 788
Tall Grass and Herb
Crops and Weeds 515 488 462
d) Loss on ignition category
LOI category () 1978 1998 2007 1978-1998 1998-2007 1978-2007
Mineral (0-8) 506 541 513
Humus-mineral (8-30) 750 777 763
Organo-mineral (30-60) 988 974 997
Organic (60-100) 834 809 849
b) AVC - whole dataset
Mean Carbon Density (tha) Direction of significant changes
Mean Carbon Density (tha) Direction of significant changes
Mean Carbon Density (tha) Direction of significant changes
c) AVC unchanged
Mean Carbon Density (tha) Direction of significant changes
33
Countryside Survey Soils Report from 2007
2 Carbon
233 Change in soil (0-15cm) C concentration and density (0-15cm) for England
Mean soil C concentrations in England (Table 26) are generally lower than those for GB as a whole This is
due to lower frequency of carbon rich soils in England and Wales relati ve to Scotland No significant change
was observed for the country between individual surveys (Fig 25a) or the whole 29 year period (Fig 25b)
There were fewer significant differences observed within individual vegetation and soil categories for tops oils
in England relative to GB and there was an insufficient number of samples to report on some categories
Consistent with changes observed for GB were significant reductions for the Arable and Horticulture Broad
Habitat and Crops and Weed Aggregate Vegetation Class Significant differences ( plt0001) are shown
(Fig 29) Significant increases for GB woodland soils were not reflected in the results for England However
a significant increase was observed for Infertile Grassland in England which was n ot observed for GB When
transformed to carbon density similar trends were observed (Fig 210 Table 27) Significant differences for
the whole 29 year period were only observed for Crops and Weeds and Moorland Grass Mosaic Aggregate
Vegetation Class
Figure 29 Change in soil C concentration (0-15cm) for England between 1978 and 2007 for different AVCs
Standard errors are indicated Significant differences ( plt0001 plt005) are shown
Figure 210 Change in soil C density (0-15cm) for England between 1978 and 2007 for different AVCs Standard
errors are indicated Significant differences ( plt0001 plt005) are shown There was insufficient samples to
report for Tall Grass and Herb Mean change for Upland Wood was lt 01 gcm3
-10
-5
0
5
10
15
20
25
Cro
ps amp
wee
ds
Tall g
rass
amp her
b
Fertile
gras
slan
d
Infe
rtile
gra
ssla
nd
Lowla
nd w
ood
Upl
and
woo
d
Moo
rland
gra
ss m
osai
c
Hea
th a
nd b
og
Ch
an
ge
in
ca
rbo
n d
en
sit
y (
gC
cm
3)
-30
-20
-10
0
10
20
30
40
50
60
70
80
Crops amp
weeds
Fertile
grassland
Infertile
grassland
Lowland
wood
Upland
wood
Moorland
grass
mosaic
Heath and
bog
Ch
an
ge in
ca
rbo
n c
on
ce
ntr
ati
on
(g
Ck
g)
34
Countryside Survey Soils Report from 2007
2 Carbon
Table 26 Changes in soil C concentration (0-15cm) in England for (a) Broad Habitats (b) Aggregate Vegetation
Class (AVC) (c) AVCs unchanged since 1978 and (d) LOI categories Arrows denote significant change (plt005
level) in the direction shown Diagonal line indicates too few samples to provide reliable value
a) England - Broad Habitat
Broad Habitat 1978 1998 2007 1978-1998 1998-2007 1978-2007
Broadleaved Mixed and Yew Woodland 546 804 687
Coniferous Woodland 1173 1578 1312
Arable and Horticulture 339 328 300
Improved Grassland 503 542 531
Neutral Grassland 601 693 648
Acid Grassland 1970 2006 2098
Bracken 1150 1273 1535
Dwarf Shrub Heath 2980 2275 2292
Fen Marsh and Swamp 2888 2789 2738
Bog 1978 4313 3985
All habitat types 744 797 756
Aggregate Vegetation Class 1978 1998 2007 1978-1998 1998-2007 1978-2007
Upland Woodland 1050 1625 1313
Lowland Woodland 596 876 691
Fertile Grassland 450 501 446
Infertile Grassland 546 667 630
Moorland Grass Mosaics 1980 1898 2174
Heath and Bog 3022 3544 3390
Tall Grass and Herb 434 433
Crops and Weeds 340 323 307
Aggregate Vegetation Class 1978 1998 2007 1978-1998 1998-2007 1978-2007
Upland Woodland
Lowland Woodland
Fertile Grassland 521 550 557
Infertile Grassland 633 741 723
Moorland Grass Mosaics
Heath and Bog
Tall Grass and Herb
Crops and Weeds 282 275 249
d) Loss on ignition category
LOI category () 1978 1998 2007 1978-1998 1998-2007 1978-2007
Mineral (0-8) 290 318 292
Humus-mineral (8-30) 684 742 705
Organo-mineral (30-60) 3454 2349 2101
Organic (60-100)
b) AVC - whole dataset
Mean carbon concentration gkg-1 Direction of significant changes
Mean carbon concentration gkg-1 Direction of significant changes
Mean carbon concentration gkg-1 Direction of significant changes
c) AVC unchanged
Mean carbon concentration gkg-1 Direction of significant changes
35
Countryside Survey Soils Report from 2007
2 Carbon
Table 27 Changes in soil C density (0-15cm) in England for (a) Broad Habitats (b) Aggregate Vegetation Class
(AVC) (c) AVCs unchanged since 1978 and (d) LOI categories Arrows denote s ignificant change (plt005 level) in
the direction shown Diagonal line indicates too few samples to provide reliable value
a) England - Broad Habitat
Broad Habitat 1978 1998 2007 1978-1998 1998-2007 1978-2007
Broadleaved Mixed and Yew Woodland 578 761 688
Coniferous Woodland 896 760 779
Arable and Horticulture 491 498 469
Improved Grassland 629 685 646
Neutral Grassland 624 656 659
Acid Grassland 766 720 955
Bracken 959 728 941
Dwarf Shrub Heath 771 1018 966
Fen Marsh and Swamp 819 941 967
Bog 1060 1198 852
All habitat types 696 715 702
Aggregate Vegetation Class 1978 1998 2007 1978-1998 1998-2007 1978-2007
Upland Woodland 814 684 814
Lowland Woodland 698 718 681
Fertile Grassland 616 639 609
Infertile Grassland 688 708 693
Moorland Grass Mosaics 777 898 880
Heath and Bog 796 857 912
Tall Grass and Herb 554 613 585
Crops and Weeds 497 501 469
Aggregate Vegetation Class 1978 1998 2007 1978-1998 1998-2007 1978-2007
Upland Woodland
Lowland Woodland
Fertile Grassland 631 690 687
Infertile Grassland 745 760 795
Moorland Grass Mosaics
Heath and Bog
Tall Grass and Herb
Crops and Weeds 498 476 439
d) Loss on ignition category
LOI category () 1978 1998 2007 1978-1998 1998-2007 1978-2007
Mineral (0-8) 504 523 496
Humus-mineral (8-30) 754 783 744
Organo-mineral (30-60) 1172 1011 885
Organic (60-100)
Mean Carbon Density (tha) Direction of significant changes
b) AVC - whole dataset
Mean Carbon Density (tha) Direction of significant changes
Mean Carbon Density (tha) Direction of significant changes
c) AVC unchanged
Mean Carbon Density (tha) Direction of significant changes
36
Countryside Survey Soils Report from 2007
2 Carbon
234 Change in soil (0-15cm) C concentration and density (0-15cm) across Scotland
Mean soil C concentrations in Scotland are generally higher than that for GB as a whole This is due to
higher frequency of carbon rich soils relative to England and Wales A significant increase was observed
between 1978 and 1998 and a significant decline between 1998 and 2007 which was mirrored in the GB
trends (Fig 25a) There was no significant change over the whole 29 year period (Fig 25b)
There were fewer significant differences for individual vegetation and soil categories for topsoils in Scotland
relative to GB and there was insufficient number of samples to report on some categories (Table 28)
Consistent with changes observed for GB were a significant increase for the Broadleaved Mixed and Yew
Woodland Broad Habitat and a significant decline in Crops and Weed Aggregate Vegetation Class (Fig
211) Significant increases for the GB Bracken Broad Habitat was not observed for Scotland Transformation
to carbon density confirmed a significant decline in soil carbon status of the Crops and Weeds Aggregate
Vegetation Class (Fig 212 Table 29)
Figure 211 Change in soil C concentration (0-15cm) for Scotland between 1978 and 2007 for different AVCs
Standard errors are indicated Standard errors are indicated Significant differences ( plt005) are shown
Figure 212 Change in soil C density for Scotland (0-15cm) between 1978 and 2007 for different AVCs Standard
errors are indicated Standard errors are indicated Significant differences ( plt0005) are shown
-20
-10
0
10
20
30
40
50
60
70
Crops amp
weeds
Fertile
grassland
Infertile
grassland
Upland wood Moorland
grass
mosaic
Heath and
bog
Ch
an
ge
in
ca
rbo
n c
on
ce
ntr
ati
on
(g
Ck
g)
-15
-10
-5
0
5
10
Crops amp
weeds
Fertile
grassland
Infertile
grassland
Upland wood Moorland
grass
mosaic
Heath and
bog
Ch
an
ge
in
ca
rbo
n c
on
ce
ntr
ati
on
(g
Ck
g)
37
Countryside Survey Soils Report from 2007
2 Carbon
Table 28 Changes in soil C concentration (0-15cm) in Scotland for (a) Broad Habitats (b) Aggregate Vegetation
Class (AVC) (c) AVCs unchanged since 1978 and (d) LOI categories Arrows denote significant change (plt005
level) in the direction shown Diagonal line indicates too few samples to provide reliable value
a) Scotland - Broad Habitat
Broad Habitat 1978 1998 2007 1978-1998 1998-2007 1978-2007
Broadleaved Mixed and Yew Woodland 889 1719 1451
Coniferous Woodland 2385 2456 2289
Arable and Horticulture 358 356 323
Improved Grassland 646 640 650
Neutral Grassland 911 842 835
Acid Grassland 2628 2919 2479
Bracken 2383 2312 2932
Dwarf Shrub Heath 3189 3310 3138
Fen Marsh and Swamp 2145 2700 2282
Bog 4242 4539 4382
All habitat types 2385 2578 2420
Aggregate Vegetation Class 1978 1998 2007 1978-1998 1998-2007 1978-2007
Upland Woodland 1441 1888 1847
Lowland Woodland
Fertile Grassland 470 525 492
Infertile Grassland 840 895 827
Moorland Grass Mosaics 2236 2541 2293
Heath and Bog 3926 4329 4097
Tall Grass and Herb
Crops and Weeds 369 371 322
Aggregate Vegetation Class 1978 1998 2007 1978-1998 1998-2007 1978-2007
Upland Woodland
Lowland Woodland
Fertile Grassland
Infertile Grassland 779 759 703
Moorland Grass Mosaics 2804 3202 2881
Heath and Bog 4168 4574 4409
Tall Grass and Herb
Crops and Weeds
d) Loss on ignition category
LOI category () 1978 1998 2007 1978-1998 1998-2007 1978-2007
Mineral (0-8) 305 336 314
Humus-mineral (8-30) 877 882 859
Organo-mineral (30-60) 2558 2888 2329
Organic (60-100) 4475 4820 4686
b) AVC - whole dataset
Mean carbon concentration gkg-1 Direction of significant changes
Mean carbon concentration gkg-1 Direction of significant changes
Mean carbon concentration gkg-1 Direction of significant changes
c) AVC unchanged
Mean carbon concentration gkg-1 Direction of significant changes
38
Countryside Survey Soils Report from 2007
2 Carbon
Table 29 Changes in soil C density (0 -15cm) in Scotland for (a) Broad Habitats (b) Aggregate Vegetation Class
(AVC) (c) AVCs unchanged since 1978 and (d) LOI categories Arrows denote significant change (plt005 level) in
the direction shown Diagonal line indicates too few samples to provide reliable value
a) Scotland - Broad Habitat
Broad Habitat 1978 1998 2007 1978-1998 1998-2007 1978-2007
Broadleaved Mixed and Yew Woodland 752 629 776
Coniferous Woodland 874 793 804
Arable and Horticulture 536 526 523
Improved Grassland 688 724 701
Neutral Grassland 728 713 739
Acid Grassland 938 937 884
Bracken 682 944 874
Dwarf Shrub Heath 881 821 900
Fen Marsh and Swamp 930 948 766
Bog 834 883 833
All habitat types 776 780 787
Aggregate Vegetation Class 1978 1998 2007 1978-1998 1998-2007 1978-2007
Upland Woodland 878 799 818
Lowland Woodland 00 00 00
Fertile Grassland 661 697 655
Infertile Grassland 690 779 728
Moorland Grass Mosaics 926 916 904
Heath and Bog 853 836 826
Tall Grass and Herb
Crops and Weeds 563 583 507
Aggregate Vegetation Class 1978 1998 2007 1978-1998 1998-2007 1978-2007
Upland Woodland
Lowland Woodland
Fertile Grassland
Infertile Grassland 682 678 720
Moorland Grass Mosaics 897 903 878
Heath and Bog 852 869 816
Tall Grass and Herb
Crops and Weeds
d) Loss on ignition category
LOI category () 1978 1998 2007 1978-1998 1998-2007 1978-2007
Mineral (0-8) 499 522 520
Humus-mineral (8-30) 778 806 815
Organo-mineral (30-60) 1009 931 899
Organic (60-100) 858 775 853
Mean Carbon Density (tha) Direction of significant changes
b) AVC - whole dataset
Mean Carbon Density (tha) Direction of significant changes
Mean Carbon Density (tha) Direction of significant changes
c) AVC unchanged
Mean Carbon Density (tha) Direction of significant changes
39
Countryside Survey Soils Report from 2007
2 Carbon
235 Change in soil (0-15cm) C concentration and density (0-15cm) across Wales
Mean soil C concentrations (0-15cm) in Wales are intermediate relative to England and Scotland No
significant change between surveys or over the whole 29 year period was observed ( Fig 25 a amp b)
There was only one significant difference observed within individual categories a decrease for the
Coniferous Woodland Broad Habitat (Table 210) There was no significant change with the two Aggregate
Vegetation Classes we are able to report either for soil (0 -15cm) concentration or density (Fig 213 amp 214
Table 210 amp 211) The low number of reporting categories are due to the lower number of sampl es for
Wales relative to England and Scotland which were sampled in 1978 Reporting change over the full 29 year
reporting period is therefore only possible for Fertile and Infertile Grasslands which have the largest number
of sample squares The increase in sample number in 2007 survey will ensure this improves in future surveys
as we now have baseline measurements for 7 Broad Habitat categories
Figure 213 Change in soil C concentration (0-15cm) for Wales between 1978 and 2007 for the AVC categories
with sufficient sample number to allow reporting for the full 29 year reporting period No significant change was
observed
Figure 214 Change in soil C density (0-15cm) for Wales between 1978 and 2007 for the AVC categories with
sufficient sample number to allow reporting for the full 29 year reporting period Standard error bars are
indicated No significant change was observed
-10
-8
-6
-4
-2
0
2
4
6
8
Fertile grassland Infertile grassland
Ch
an
ge
in
ca
rbo
n c
on
ce
ntr
ati
on
(g
Ck
g)
-12
-10
-8
-6
-4
-2
0
2
Fertile grassland Infertile grassland
Ch
an
ge i
n c
arb
on
den
sit
y (
gC
cm
3)
40
Countryside Survey Soils Report from 2007
2 Carbon
Table 210 Changes in soil C concentration (0-15cm) in Wales for (a) Broad Habitats (b) Aggregate Vegetation
Class (AVC) (c) AVCs unchanged since 1978 and (d) LOI categories Arrows denote significant change (plt005
level) in the direction shown Diagonal line indicates too few samples to provide reliable value
a) Wales - Broad Habitat
Broad Habitat 1978 1998 2007 1978-1998 1998-2007 1978-2007
Broadleaved Mixed and Yew Woodland 672 721 870
Coniferous Woodland 1766 2336 1843
Arable and Horticulture 385 349
Improved Grassland 680 663 606
Neutral Grassland 533 574 621
Acid Grassland 1982 2082 2077
Bracken
Dwarf Shrub Heath 2107 2672 2800
Fen Marsh and Swamp
Bog
All habitat types 1076 1089 1086
Aggregate Vegetation Class 1978 1998 2007 1978-1998 1998-2007 1978-2007
Upland Woodland 1424
Lowland Woodland
Fertile Grassland 545 539 568
Infertile Grassland 637 632 612
Moorland Grass Mosaics 2208
Heath and Bog 3338
Tall Grass and Herb
Crops and Weeds
Aggregate Vegetation Class 1978 1998 2007 1978-1998 1998-2007 1978-2007
Upland Woodland
Lowland Woodland
Fertile Grassland
Infertile Grassland
Moorland Grass Mosaics
Heath and Bog
Tall Grass and Herb
Crops and Weeds
d) Loss on ignition category
LOI category () 1978 1998 2007 1978-1998 1998-2007 1978-2007
Mineral (0-8)
Humus-mineral (8-30) 714 688 691
Organo-mineral (30-60)
Organic (60-100)
b) AVC - whole dataset
Mean carbon concentration gkg-1 Direction of significant changes
Mean carbon concentration gkg-1 Direction of significant changes
Mean carbon concentration gkg-1 Direction of significant changes
c) AVC unchanged
Mean carbon concentration gkg-1 Direction of significant changes
41
Countryside Survey Soils Report from 2007
2 Carbon
Table 211 Changes in soil C density (0-15cm) in Wales for (a) Broad Habitats (b) Aggregate Vegetation Class
(AVC) (c) AVCs unchanged since 1978 and (d) LOI categories Arrows denote significant change (plt005 level) in
the direction shown Diagonal line indicates too few samples to provide reliable value
a) Wales - Broad Habitat
Broad Habitat 1978 1998 2007 1978-1998 1998-2007 1978-2007
Broadleaved Mixed and Yew Woodland 772 614 790
Coniferous Woodland 657 940 762
Arable and Horticulture 708 560
Improved Grassland 726 690 681
Neutral Grassland 644 671 694
Acid Grassland 892 928 838
Bracken
Dwarf Shrub Heath 1341 1068 1033
Fen Marsh and Swamp
Bog
All habitat types 765 802 752
Aggregate Vegetation Class 1978 1998 2007 1978-1998 1998-2007 1978-2007
Upland Woodland
Lowland Woodland
Fertile Grassland 731 714 686
Infertile Grassland 718 663 697
Moorland Grass Mosaics
Heath and Bog
Tall Grass and Herb
Crops and Weeds
Aggregate Vegetation Class 1978 1998 2007 1978-1998 1998-2007 1978-2007
Upland Woodland
Lowland Woodland
Fertile Grassland
Infertile Grassland
Moorland Grass Mosaics
Heath and Bog
Tall Grass and Herb
Crops and Weeds
d) Loss on ignition category
LOI category () 1978 1998 2007 1978-1998 1998-2007 1978-2007
Mineral (0-8)
Humus-mineral (8-30) 718 795 800
Organo-mineral (30-60)
Organic (60-100)
Mean Carbon Density (tha) Direction of significant changes
b) AVC - whole dataset
Mean Carbon Density (tha) Direction of significant changes
Mean Carbon Density (tha) Direction of significant changes
c) AVC unchanged
Mean Carbon Density (tha) Direction of significant changes
42
Countryside Survey Soils Report from 2007
2 Carbon
24 Discussion
It is estimated that European soils contain 75-79Pg C (Schils et al 2008) of which UK soils store 6-7 Pg
The top 15 cm of soils in GB (ie the UK without Northern Ireland) store ca 16 Pg C (Table 211) Soils are
the largest terrestrial pool of C There is a need to track and understand trends in soil C and to optimise
future soil C storage through land management and use Although measurements of topsoil organic C are
available in all member EU countries very few countries have repeated sampling campaigns (Saby et al
2008) and to our knowledge Countryside Survey is the first survey in Europe to sample soils three times
The approach to monitoring programs in Europe has been reviewed by Kibblewhite et al (2008) Morvan et
al (2008) and Schils et al (2008) current national monitoring programs are criticised because of lack of soil
BD measurements insufficient sample numbers and lack of repeated explanatory measurements
Countryside Survey particularly the 2007 Survey addresses these particular issues for GB
The mapped distributions of soil C concentrations (as ) in 2007 ( Fig 215a) follows the anticipated pattern
with high concentrations in upland peatland areas such as NW Scotland N England and upland areas of
Wales The coefficient of variation (CV standard deviation mean an indicator of the spread of the data
around the mean value) is lowest in areas dominated by either low carbon soils which are intensively
managed or high carbon soils in upland areas where there is little variation (Fig 215b) Conversely the
signal to noise ratio (SNR mean standard deviation) indicates that for values above 1 the signal is stronger
than the noise High SNR‟s are consistent with managed arable areas acros s Eastern England and the
upland and peat areas across the UK but especially in N Scotland (Fig 215c) This may occur because the
soil management leads to greater uniformity of carbon levels across these areas In areas less intensively
managed natural variation in soil carbon levels across the landscape may lead to the low SNR‟s observed
Figure 215 Maps of soil C concentration (0-15cm) in 2007(a) using ordinary Kriging (C) (b) coefficient of
variation and (c) signal to noise ratio
43
Countryside Survey Soils Report from 2007
2 Carbon
Multiplying soil C density by area of habitats for individual countries results in the estimate of carbon
currently stored in 0-15cm of GB soils (Table 211)
Table 211 Estimate of soil carbon stock (0-15cm) for GB and individual countries
Country km2 Soil C density
(0-15cm)
tha
Soil C stock
(0-15cm)
TgC
se
GB 228226 6931 1582 29
England 127284 6245 795 15
Scotland 79849 7879 628 11
Wales 21091 7519 159 3
The CS estimate for England and Wales (954 Tg) in soils (0 -15cm) compares with an estimate of 864 Tg for
England and Wales estimated by Bellamy et al (2005) One major cause of this difference is the new
conversion factor for LOI to soil C concentration of 055 defined by CS compared to the factor of 05 used by
Bellamy et al (2005) The new pedotransfer function for bulk density measurements to soil C concentration
described in Chapter 1 primarily affects estimates of stock and change for organic soils only and has only
limited effect on total stock estimates (0-15cm) at the national scale
The results from the Countryside Survey of Great Britain reported here suggest that the topsoil C
concentration and stock of GB and its constituent countries has not changed significantly since 1978
Results for topsoil C density are a combination of changes in soil C concentration and estimated bulk density
and we observed no overall change at a GB level in C concentration although there was a significant
increase (+8) between 1978 and 1998 and a decrease ( -65) in 1998 and 2007 Examining C
concentration by other strata (eg country soil C group AVC) produced similar results with consistent
differences between 1978 and 2007 only occurring in arable and woodland systems Particularly significant
in light of Bellamy et al (2005) is the lack of change in topsoil C concentrations in organic soils although this
disagrees with Bellamy et al (2005) it is in agreement with other reports and the outputs of soil C models
There are unfortunately few monitoring studies from W Europe with which to c ompare our topsoil results
some studies only report changes in C concentration some only C density some only to 1m depth Our
results for changes in topsoil C concentrations in arable and grassland systems are comparable with the
ranges reported by various studies on Belgian soils (Goidts and van Wesemael 2007) but are smaller than
those reported by Bellamy et al (2005) for England and Wales For woodland soils CS estimates of change
are larger than those reported from a major UK resurvey of 103 wood lands (Kirby et al 2005) and in the
opposite direction to reports of C changes in woodland soils in Belgium (Stevens and van Wesemael 2008)
and to that of Bellamy et al (2005) for England and Wales Given the small number of woodlands sampled in
CS in 1978 and 1998 a potentially more accurate picture of changes in topsoil C concentration in GB
woodlands was reported by Kirby et al (2005) whose survey specifically examined changes in woodlands
between 1971 and 2000-2003 and found no significant change in topsoil C concentration which remained
around 88 g C kg -1 However CS estimates of changes in woodland topsoil C densities (12-30 g C m
-2 yr
-1)
are similar to model estimates of European forest soils by Liski et al (2002) and Nabuurs et al (2003)
which suggest net sequestration of 19 and 11 g m-2
yr-1
respectively
A range of potential factors responsible for soil C change have been proposed including climate change
nutrient deposition management practices increasing atmospheric CO 2 concentrations and land use and
land use change However at the large scale the attributi on of change is complicated by the presence of
multiple drivers which can simultaneously affect the balance of C inputs (largely plant biomass) and outputs
(mostly microbial respiration) Our results also suggest that land use change (as measured by the AVC) is
not responsible for the few significant observed changes in topsoil C concentration Climate change is
unlikely to be the cause of change in topsoil C since changes in temperature and rainfall across GB since
44
Countryside Survey Soils Report from 2007
2 Carbon
1978 have been insufficient to cause large-scale changes in mineral soil C concentration or density (Smith et
al 2007) Model estimates of climate change-related variation in C density for England Scotland and Wales
are -001 +003 and +001 yr -1 respectively if changes in net primary productivity (NPP) are included
(Smith et al 2007) CS estimates of change are much larger than these -009 to -021 +01 to +013 and
+018 to +039 yr -1 for all arable grassland and forest soils respectively across GB Since land use change
and climate change may be excluded as primary drivers of change and trends differ between habitat types
other habitat-specific drivers must be responsible for the long-term changes observed in arable and woodland
soils The most consistent finding from CS in 2007 is the reduction in soil C (0-15cm) concentration and
density in cropland A reduction in mean total N concentration as well (Chapter 4) suggests processes such
as erosion deep ploughing (which brings soil with lower CN ratio soil to the surface) and or increased
decomposition may be responsible for this trend Intensification of farming practices are often thought to be
the dominant factor (Stoate et al 2001) In Broadleaved Woodland where a significant increase was
observed changes in tree age structure and reduced harvesting are likely to be the main drivers of soil C
concentration increases (Liski et al 2002 De Vries et al 2006) Efforts to attribute the observed soil (0-
15cm) C changes in CS are ongoing and will be reported in the CS Integr ated Assessment Report
25 Policy Implications
The results from CS in 2007 do not confirm the widespread loss of soil carbon (0-15cm) as reported by
Bellamy et al (2005) for soils (0-15cm) as part of the National Soils Inventory monitoring programme in
England and Wales between 1978 and 2003 The one consistent exception is loss of carbon (0-15cm) from
the intensively managed Arable and Horticulture Broad Habitat Crops and Weeds Aggregate Vegetation
Class soils This suggests that current policies in place to limit soil degradation are not maintaining soil
quality in cropped land
The stability in soil carbon measurements in other land use types could be a combination of a complex mix of
factors some of which may increase soil (0-15cm) C concentration eg increased carbon inputs from plants
due to nitrogen deposition and increased carbon dioxide in the atmosphere whilst some may reduce soil C
concentration eg intensive land management Only by further analysis of the spatial patterns within the CS
datasets in combination with experimental and survey data from other studies and modelling approaches will
it be possible to advise on the likely future trends of soil carbon and indeed help to explain the general trend
of an increase between 1978 and decrease from 1998 to 2007 It should also be remembered these are
results for soil 0-15cm only and not the whole soil profile It does not include soil lost by erosion although a
reduction in soil C concentration would be expected if the latter was widespread as soil decreases in soil C
concentration down the soil profile
A major change for CS in 2007 was the introduction of data which enables calculation of carbon stock (0 -
15cm) This takes into account not only the soil C concentration of soil in the top 15cm but also the amount of
soil The amount of soil may change due to changes in the compaction of the soil for example due to the use
of heavy machinery or increased animal numbers The increased information this provides has resulted in
greater confidence in the reduction in soil carbon for intensively managed arable and crop soils as this trend
is observed in both soil C concentration and C density results and is the most consistent result within
individual categories By combining C density data wi th areas of Broad Habitats a national estimate of the
topsoil (0-15cm) carbon stock from co-located bulk density and soil C concentration measurements is now
available for the first time
The data provide an evidence base for monitoring the protection o f soil carbon stores highlighted as a priority
within the new Soils Strategy for England the Environment Strategy in Wales and Scottish Soil Framework
The new data have now been selected as an indicator of soil quality for State of the Environment Repor ting
45
Countryside Survey Soils Report from 2007
2 Carbon
26 References
Bellamy PH Loveland PJ Bradley RI Lark RM Kirk GJD 2005 Carbon losses from all soils
across England and Wales 1978-2003 Nature 437 245-248
Carey PD Wallis S Chamberlain PM Cooper A Emmett BA Maskell LC McCann T Murphy J
Norton LR Reynolds B Scott WA Simpson IC Smart SM Ullyett JM 2008 Countryside Survey
UK Results from 2007 NERCCentre for Ecology amp Hydrology 105pp (CEH Project Number C03259)
De Vries W Reinds GJ Gundersen P Sterba H 2006 The impact of nitrogen deposition on carbon
sequestration in European forests and forest soils Global Change Biology 12 1151-1173
Emmett BA Frogbrook ZL Chamberlain PM Griffiths R Pickup R Poskitt J Reynolds B Rowe
E Spurgeon D Rowland P Wilson J and Wood CM 2008 CS Technical Report No 307 Soils
Manual NERCCentre for Ecology amp Hydrology 180 pp (CEH Project Number C03259)
Goidts E van Wesemael B 2007 Regional assessment of soil organic carbon changes under agriculture in
Southern Belgium (1955-2005) Geoderma 141 341-354
Jackson DL 2000 Guidance on the interpretation of the Biodiversity Broad Habitat Classification (terrestrial
and freshwater types) Definitions and the relationship with other classifications JNCC Peterborough UK
Kibblewhite MG Jones RJA Baritz R Huber S Arrouays D Micheli E Stephens M 2008
ENVASSO Final Report Part I Scientific and Technical Activ ities ENVASSO Project (Contract 022713)
coordinated by Cranfield University UK for Scientific Support to Policy European Commission 6th
Framework Research Programme
Kirby KJ Smart SM Black HIJ Bunce RGH Corney PM Smithers RJ 2005 Long term
ecological change in British woodlands (1971-2001) English Nature Peterborough UK
Liski J Perruchoud D Karjalainen T 2002 Increasing carbon stocks in the forest soils of western Europe
Forest Ecology and Management 169 159-175
Morvan X Saby NPA Arrouays D Le Bas C Jones RJA Verheijen FGA Bellamy PH
Stephens M Kibblewhite MG 2008 Soil monitoring in Europe A review of existing systems and
requirements for harmonisation Science of the Total Environment 391 1-12
Nabuurs G J Schelhaas M J Mohren G M J and Field C B 2003 Temporal evolution of the
European forest sector carbon sink from 1950 to 1999 Global Change Biol 9 152-160
Saby NPA Bellamy PH Morvan X Arrouays D Jones RJA Verheijen FGA Kibblewhite MG
Verdoodt A Berenyiuveges J Freudenschuss A Simota C 2008 Will European soil-monitoring networks
be able to detect changes in topsoil organic carbon content Global Change Biology 14 2432-2442
Schils R Kuikman P Liski J van Oijen M Smith P Webb J Alm J Somogyi Z van den Akker J
Billett M Emmett BA Evans C Lindner M Palosuo T Bellamy P Jandl R Hiederer R 2008
Review of existing information on the interrelations between soil and climate change European Commission
Brussels
Smith P Chapman SJ Scott WA Black HIJ Wattenbach M Milne R Campbell CD Lilly A
Ostle N Levy PE Lumsdon DG Millard P Towers W Zaehle S amp Smith JU (2007) Climate
change cannot be entirely responsible for soil carbon loss observed in England and Wales 1978 -2003
Global Change Biology 13 2605-2609
46
Countryside Survey Soils Report from 2007
2 Carbon
Stevens Avan Wesemael B 2008 Soil organic carbon dynamics at the regional scale as influenced by
land use history a case study in forest soils from southern Belgium Soil Use and Management 24 69-79
Stoate C Boatman ND Borralho RJ Carvalho CR de Snoo GR Eden P 2001 Ecological impacts
of arable intensification in Europe Journal of Environmental Management 63 337-365
47
Countryside Survey Soils Report from 2007
3 Soil pH
Summary
The mean pH of soils (0-15cm) increased in less acidic soils across Great Britain (GB) between
1998 and 2007 continuing a trend observed between 1978 and 1998 These soils are associated with
Broadleaved Woodland Arable and Horticulture Improved Grassland and Neutral Grassland Broad
Habitats This increase in pH is consistent with the expected b enefit of continued reductions in
sulphur emissions
There was no significant change in mean soil (0-15 cm) pH in more acidic organic-rich soils across
Great Britain between 1998 and 2007 This will affect Broad Habitats such as Bog Dwarf Shrub
Heath and Acid Grassland Data analysis is ongoing to determine if the lower sulphur reductions in
the north and west of the Great Britain or other drivers of change such as nitrogen deposition and
land management are responsible in the organic soils where pH did not significantly increase
between 1998 and 2007 Conversion between land uses between surveys was not responsible as
similar trends were observed in soils with or without conversion
One exception with no apparent trends between any time period was Coniferous Woodland It is
possible the acidification of soils associated with intensive forestry due to base cation uptake and
enhanced capture of acidic pollutants by the tree canopy may be offsetting the effects of reduced
sulphur emissions
The results for individual countries broadly reflected those for Great Britain as a whole with
continued increase in soil pH only observed in less acidic soils Insufficient sample size for some
habitat types with lower area in individual countries prevented significant trends being identified in
some cases
The implications of these findings are that current emission control policies combined with current
policies to protect soil through sustainable land management practices have had some major
benefits but they may not be sufficient to promote continued recovery from acidification i n organic-
rich soils
31 Policy background
Key question Has the recovery from acidification detected by Countryside Survey between 1978 and 1998
continued
Measurements The pH of soils (0-15 cm) from all plots sampled in 1978 and 1998 and all additional plots
sampled in 2007
Soil pH is probably the most commonly measured soil chemical parameter It gives an indication of soil
acidity and therefore has direct policy relevance in a number of areas primarily recovery from acidification
and impacts on biodiversity Soil pH is a key variable for predicting the mobility and bioavailability of metals
in soils and helps determine the response of plant species to changes in atmospheric nitrogen and acid
deposition It is currently estimated that 58 of ter restrial semi-natural habitats across GB receive acidic
deposition in excess of their buffering capacity thus potentially causing long term damage according to the
critical load methodology (RoTAP 2010)
The soil pH data from the Countryside Survey in 1998 provided unique nationwide evidence of soil pH change
(0-15 cm) since the first measurements in 1978 Preliminary data were incorporated within the report of the
National Expert Group on Transboundary Air Pollution (NEGTAP 2001) as providing evidence of a possible
48
Countryside Survey Soils Report from 2007
3 Soil pH
response to the reduction in acid deposition over the twenty year period between the two surveys The MASQ
report (Monitoring and Assessing of Soil Quality Black et al 2000) provided a more complete analysis of the
Countryside Survey soils data and confirmed an increase in soil pH (0-15 cm) between 1978 and 2000 in all
but Coniferous Woodlands Broad Habitat irrespective of whether the data were analysed by Environmental
Zone Broad Habitat ITE Land Class Aggregate Vegetation Class (AVC) or major soil group More
importantly the vegetation survey indicated a change in vegetation structure towards more nitrophilous less
acid tolerant species from 1990 to 1998 (Haines-Young et al 2000) providing corroboration for the soil data
and an excellent example of the power of the Countryside Survey approach in combining co-located
synchronous data collection of a wide range of variables A new review of changes in soil pH is due to be
published later in 2010 Review of Transboundary Air Pollution (RoTAP) and current indications are that
trends identified by CS are mirrored in other surveys (RoTAP 2010)
The rationale for including measurement of soil pH at 0-15 cm depth in the survey in 2007 is summarised in
Table 31 Measurement of soil (0-15 cm) pH will deliver
An extended time series of soil pH from 1978
Increased reporting power for individual countries (especially Wales) by making measurements in all
squares sampled during Countryside Survey in 2007 (591)
An assessment as to whether the decrease in soil acidity across all major soil groups and the majority of
Broad Habitats observed between 1978 and 1998 has continued
Improved prediction of plant species composition change using linked biogeochemical plant species
models
49
Countryside Survey Soils Report from 2007
3 Soil pH
Table 31 Rationale for measurement of soil (0-15 cm) pH
Issue Facts Comments
History in Countryside Survey
Measured on soils collected from Main Plots in the original 256 squares which formed the ldquoITE Ecological Survey of the UKrdquo Countryside Survey in 1998 re-measured pH from the same 256 squares
256 squares essential to maintain time series data 591 squares will provide better spatial information Soil pH is a critical interpretative variable
Country level reporting Power analysis has indicated only 256 squares are needed to quantify pH change at country level based on change between 1978 and 1998
It is unlikely that the pH change between Countryside Survey in 1998 and Countryside Survey in 2007 will be as great or consistent as between 1978 and Countryside Survey in 1998 The time period is shorter and the deposition change has been less Soil pH is a critical parameter for interpretation of plant species change (Ellenberg pH) bioavailability of P N and metals Recommendation is therefore for soil pH (0-15 cm) to be measured in all 591 squares
Links and compatibility to other monitoring programmes
Comparable data to those collected in the National Soil Inventory (NSI) Representative Soil Sampling Scheme (RSSS) for same horizon (0-15cm) Environmental Change Network (ECN) provides more information to depth and more frequent monitoring of soil solution but from few sites
Countryside Survey will provide data for three time points There were partial resurveys of the NSI in 19945 19956 and 2003 RSSS have data reported to 2001 Soil pH was measured at many ECN sites in 1993 1998 and 2003 Countryside Survey in 2007 will provide the only update for spatially extensive data on soil pH (0-15 cm) in Great Britain A comparison of these surveys was reported in Defra project SP0515 (Defra 2003)
Uniqueness of Countryside Survey
Time series is unique The integrated approach enabling links to vegetation management and water quality change is unique
Value for money (Policy priority or interpretative value x cost)
Very high High policy and interpretative value low cost
50
Countryside Survey Soils Report from 2007
3 Soil pH
32 Methods
321 Proof of concept
The measurement of soil pH in a suspension of de-ionised water is a very well established technique and was
used in both 1978 and for Countryside Survey in 1998 However measurements of pH in water are subject to
a number of uncertainties some of which are fundamentally related to the effects of changes in the ionic
strength of the soil-water suspension on ions sorbed to the soil particles One of the main consequences of
this is the so called dilution effect whereby different pH values are measured depending on the soilwater
ratio in the suspension A solution of 001M Calcium Chloride (CaCl2) has approximately the same ionic
strength as the soil solution in fertilised temperate soils and has been recommended as a more appropriate
medium for soil pH measurement (Schofield and Taylor 1955) Measurement of pH in CaCl2 yields more
consistent results the pH value in CaCl2 is lower than measured in water but closer to the value observed
under equilibrium conditions using repeated extractions (White 1969) The relationship between soil pH
measured in water and CaCl2 is not consistent For example over a wide pH range in lowland grassland soils
(Fig 31) soil pH in CaCl2 was approximately 08 pH units lower than the corresponding measurements in
deionised water There was also considerable scatter in the relationship particularly for more acid soils
In the 1978 Ecological Survey soil pH in water was measured at ITE Bangor using a modified version of the
method used by the Soil Survey of England and Wales (Avery and Bascomb 1974) In 1998 soil pH was
measured at CEH Merlewood using the protocol described in Allen et al (1989) The latter resulted in a
suspension with a soil to water ratio of approximately 12 by weight compared to the 1978 analyses with a
soil to water ratio of 125 by weight It is unlikely that this small difference in ratio result ed in a significant
difference in pH between the two methods As soil pH in CaCl2 was to be measured in 2007 in addition to pH
in water the original method used in 1978 was chosen Soil pH in CaCl2 can easily be measured using the
1978 method by adding a few millilitres of concentrated CaCl2 solution to the water pH suspension This
saves the time required to re-weigh and mix a second sample and conserves valuable soil for other analyses
The comparability of the 1978 and 1998 methods was checked prior to the survey in 1998 using archive soils
taken in 1971 from woodland habitats across Great Britain (Black et al 2000) The method used in 1971 was
the same as that used in 1978 and the re-analysis on dried archived soils used the 1998 method No
statistically significant differences were found between pH values measured on dried archive soils from 1971
using the 1998 method and the original data obtained from field moist soils in 1971
Figure 31 Soil pH (0-15 cm) measured in deionised water and 001M CaCl2 for a range of lowland
grassland soils (unpublished data CEH Bangor and CCW)
y = 101x - 080
R2 = 0953
3
4
5
6
7
8
9
3 4 5 6 7 8
Soil pH in water
So
il p
H i
n C
aC
l 2
11 line
51
Countryside Survey Soils Report from 2007
3 Soil pH
322 Laboratory analysis
Samples for soil pH measurement were collected using the 15 cm long by 5 cm diameter black plastic core
following the field protocol described in the Soils Manual (Emmett et al 2008)
The pH of fresh soil in water was measured using 10 g of field -moist soil in a 50 ml plastic beaker to which 25
ml of deionised water was added giving a ratio of soil to water of 125 by weight The suspension was stirred
thoroughly and left to stand for 30 minutes after which time the pH electrode was inserted into the
suspension and a reading taken after a further 30 seconds Following the measurement of soil pH in water 2
ml of 0125M CaCl2 were added to the suspension which on dilution with the 25 ml of water resulted in a
solution concentration of approximately 001M CaCl 2 The suspension was stirred thoroughly and left for 10
minutes after which time the pH electrode was inserted into the suspension and a reading taken after a
further 30 seconds Measurements of soil pH in water and CaCl 2 were repeated on all samples using 10 g of
air dried lt 2mm sieved soil
The fresh soil pH measurements were made as soon as possible after the sample was opened Care was
taken to ensure that the temperature of the buffer solutions used to calibrate the pH meter differed by no
more than 1degC from the temperature of the soil suspensions The pH electrode was carefully rinsed and dried
between each measurement Particular care was taken to clean the electrode following calibration with buffer
solutions
323 Quality Assurance and Quality Control
The DefraNERCBBSRC Joint Codes of Practice were followed
Method comparability Soil pH measurements in deionised water were made on a subset of
approximately 200 soils taken from the 1998 soil sample archive to check the comparability of the method
used in 2007 with that used in 1998
Figure 32 Results of repeat soil pH measurements on archived air dried soil samples collected in
1998
A plot of the repeated measurements from 1998 survey (Fig 32) shows close agreement between the two
datasets with no discernible bias and points clustering along the 11 line From these data it was concluded
that the difference between the methods used in 1998 and 2007 1978 would not bias the pH time series
data However it was noted that in 1978 soil pH was reported to 005 pH units whereas in 1998 and 2007
data were reported to 001 pH units
y = 103x - 023
R2 = 0955
2
4
6
8
10
2 4 6 8 10
Dry soil pH in 1998
Re
peat
dry
so
il p
H in
2007
1 1 line
52
Countryside Survey Soils Report from 2007
3 Soil pH
Analytical Quality Control The calibration of the pH meter was checked after a batch of 25 samples
using pH 4 and pH 7 buffer solutions If either of the buffer solution calibration values differed by more than
002 pH units from the expected value the meter was re-calibrated A standard soil a certified reference soil
and a duplicate analysis was performed on every batch of 25 samples (Fig 33) Soil pH in water and CaCl2
was reported to 001 pH units
Figure 33 Results for batch repeats of pH measurements in a) water and b) CaCl 2
324 Reporting
Soil pH data (0-15 cm) have been analysed to provide information on the state of soil acidity in 2007 and the
change in soil acidity since 1978 The statistical approach used for analysing the data for change involved
bootstrapping which allows for non-normality in the data without the necessity of knowing de tails of the actual
distribution As such it provides a more accurate measurement of significance Annex F of Emmett et al
(2008) provides a background document describing this approach
Prior to the 2007 survey a power analysis was undertaken of the sampling requirements to reliably detect
change in soil pH (0-15 cm) at the country level and details of the outcome are included in Emmett et al
(2008) The resulting increase in the number of squares for Countryside Survey in 2007 to 591 has enabled
reporting of soil pH by Broad Habitat at the Great Britain level (Carey et al 2008) and at the level of the
individual countries (Smart et al 2009 for Wales Norton et al 2009 for Scotland Countryside Survey 2009
for England)
The data in this report describe soil acidity in 2007 and change since 1978 by Broad Habitat Aggregate
Vegetation Class and Loss-on-Ignition (LOI) class In summary
Broad Habitat - The Broad Habitat classification consists of 27 habitats which account for the entire
land surface of Great Britain and the surrounding sea Countryside Survey reports on soils for 10
major terrestrial habitats
Aggregate Vegetation Class (AVC) ndash is a high level grouping of vegetation types produced from a
quantitative hierarchical classification of the different plant species found in the original Countryside
Survey sample plots Loss on ignition (LOI) category ndash soil type based on soil organic matter content defined as minera l (0-
8 LOI 0-44 g C kg-1
) humus-mineral (8 ndash 30 LOI 44-165 g C kg-1
) organo-mineral (30 ndash 60
LOI 165-330 g C kg-1
) and organic (60 ndash 100 gt 330 g C kg-1
)
y = 102x - 012
R2 = 0969
3
4
5
6
7
8
9
3 4 5 6 7 8 9
Sample pH
Re
peat
sam
ple
pH
1 1 line
a) pH in water
y = 102x - 008
R2 = 0976
2
3
4
5
6
7
8
9
2 3 4 5 6 7 8 9
Sample pH
Re
peat
sam
ple
pH
1 1 line
b) pH in CaCl2
53
Countryside Survey Soils Report from 2007
3 Soil pH
The soil pH data were mapped using kriging to interpolate between the Countryside Survey sample points
Routine checking of data for outliers was conducted and the working dataset was transformed using a normal
score procedure to obtain a Gaussian distribution The data were then interpolated on a 1km UK grid using
ordinary kriging and finally the kriged data were back-transformed to produce an interpolated map of soil pH Prior to the 2007 survey data were too sparse to give meaningful and statistically valid interpolation in space and thus no maps of change are presented This will be poss ible in future surveys due to the enhanced baseline
33 Results
331 Structure of the soil pH data
The measured soil pH (0-15 cm) across the three surveys ranged between pH 320 and pH 915 The
distributions of pH values changed with each survey revea ling a progressive reduction in the frequency of
acid values (pHlt5) and an increase in the frequency of values in the range pH 58 to 62 The frequency of
values gt pH 8 also increased across the surveys (Fig 34)
Figure 34 Histograms showing distribution of soil pH (0-15 cm) measurements for a) 1978 b) 1998 c)
2007 and d) cumulative frequency Histogram frequencies normalised to percentage of total number of
samples analysed in each survey
a) 1978
00
20
40
60
80
100
33
64
24
85
4 66
67
27
88
4 9
Soil (0-15 cm) pH
No
o
f o
bserv
ati
on
s (
)
b) 1998
00
20
40
60
80
33
64
24
85
4 66
67
27
88
4 9
Soil (0-15 cm) pH
No
o
f o
bserv
ati
on
s (
)
c) 2007
00
20
40
60
80
33
64
24
85
4 66
67
27
88
4 9
Soil (0-15 cm) pH
No
o
f o
bserv
ati
on
s (
)
d)
00
02
04
06
08
10
3 5 7 9
Soil (0-15 cm) pH
Cu
mu
lati
ve
freq
uen
cy (
)
1978 1998 2007
54
Countryside Survey Soils Report from 2007
3 Soil pH
Approximately 42 of plots were sampled only once in the three surveys (Table 32) reflecting the large
increase in the number of plots in sampled 2007 For plots with repeat measurements an increase of 02 pH
units or more was recorded for an average 66 of plots 11 of plots s howed no change and 22 showed a
decrease in pH of 02 pH units or more (Table 33) This reflects the range of variability always seen in large
scale surveys such as CS Statistical significance in the categories of interest however are the critical issue
Table 32 Number of plots recording a measurement of soil pH (0-15 cm) in each Countryside Survey
Table 33 Percentage of samples from repeat plots in each Countryside Survey showing a decrease in
pH of 02 units or more (ΔpH-ve) no change in pH (ΔpH 0) or an increase in pH of 02 units or more
(ΔpH +ve)
332 Change in mean soil pH (0-15 cm) across Great Britain
The state and change in soil pH across Great Britain over the three Countryside Surveys is summarised in
Table 34 Soils beneath Broad Habitats in Great Britain covered a wide range of pH the most acid soils
comprised those beneath Coniferous Woodland Bog and Dwarf Shrub Heath Broad Habitats where mean pH
in 2007 was asymp 45 whilst the least acid soils (0-15 cm) were those in the enclosed farmland Broad Habitats
with mean pH values ranging between 63 and 72 in 2007
With the exception of Coniferous Woodlands mean soil pH (0-15 cm) increased significantly in all Broad
Habitats over the 29 years from the first survey in 1978 Mean soil pH beneath Coniferous Woodland
remained unchanged over the 29 year period whilst beneath Bracken Broad Habitat the only significant
increase in mean pH was between 1978 and 2007 No significant increases in mean pH were observed
amongst the more acid (1978 mean pH lt 5) and organic -rich Broad Habitats between 1998 and 2007 In
contrast mean soil pH increased between each Countryside Survey in those Broad Habitats with a 1978
mean pH gt5
Analysis of the data in relation to AVC broad ly reflected the results by Broad Habitat In the less acid AVCs
(Fertile and Infertile Grassland and Crops and Weeds mean pH 2007 gt 6) there was a significant increase in
mean soil pH between all three surveys For those AVCs with a mean pH in 2007 of 5 or less there was no
significant change in mean soil pH between 1998 and 2007 but a significant increase was observed between
1978 and 1998 which largely accounted for the increase between 1978 and 2007 There were no significant
changes in mean soil pH in the Tall Grass and Herb AVC and in Lowland Woodlands the only significant soil
pH increase occurred between 1978 and 2007
ΔpH -veΔ p H 0
Δ p H + v e
1978-1998 27 9 64
1998-2007 23 14 63
1978-2007 19 9 72
Mean 23 11 66
No of sites
1978 1998 2007
1978 only 274 274
1998 only 160 160
2007 only 1719 1719
1978 amp1998 only 111 111 222
1998 amp 2007 only 173 173 346
1978 amp 2007 only 179 179 358
1978 amp 1998 amp 2007 688 688 688 2064
Total number of plots 1252 1132 2759 5143
Total number of
samples
Survey years
55
Countryside Survey Soils Report from 2007
3 Soil pH
Table 34 Changes in mean soil pH (0-15 cm) across Great Britain for a) Broad Habitats b) Aggregate
Vegetation Classes (AVC) c) AVCs unchanged since 1978 and d) LOI categories Arrows denote a
significant change (plt005) in the direction shown Diagonal line indicates too few samples to provide
reliable value
a) Great Britain - Broad Habitat
Broad Habitat 1978 1998 2007 1978-1998 1998-2007 1978-2007
Broadleaved Mixed and Yew Woodland 509 547 575
Coniferous Woodland 432 439 450
Arable and Horticulture 659 681 720
Improved Grassland 579 606 627
Neutral Grassland 552 599 614
Acid Grassland 444 472 478
Bracken 414 447 464
Dwarf Shrub Heath 419 450 455
Fen Marsh and Swamp 464 535 545
Bog 429 449 451
All habitat types 539 567 587
Mean pH Direction of significant changes
Aggregate Vegetation Class 1978 1998 2007 1978-1998 1998-2007 1978-2007
All Woodland 452 487 501
Upland Woodland 417 453 459
Lowland Woodland 506 531 566
Fertile Grassland 605 623 645
Infertile Grassland 549 586 610
Moorland Grass Mosaic 440 477 477
Heath and Bog 426 442 444
Tall Grass and Herb 645 685 689
Crops and Weeds 657 679 725
b) Great Britain - AVC whole dataset
Mean pH Direction of significant changes
Aggregate Vegetation Class 1978 1998 2007 1978-1998 1998-2007 1978-2007
All Woodlands 421 454 482
Upland Woodland
Lowland Woodland
Fertile Grassland 600 608 643
Infertile Grassland 549 581 619
Moorland Grass Mosaic 439 476 478
Heath and Bog 435 457 457
Tall Grass and Herb
Crops and Weeds 701 694 738
Mean pH Direction of significant changes
c) Great Britain - AVC unchanged
56
Countryside Survey Soils Report from 2007
3 Soil pH
In order to remove the effects of vegetation land use change statistical analysis was performed on a subset
of the plots which had been sampled in all three Surveys and for which the AVC had remained unchanged
over time AVC is only recorded at the time of each Countryside Survey so change in the intervening years
cannot be ruled out but the plots for which AVC has not changed will have a vegetation composition that has
remained largely consistent in 1978 1998 and 2007
Restricting the analysis to plots where AVC has remained unchanged since 1978 resulted in three Classes
having insufficient data for analysis (Upland and Lowland Woodland and Tall Grass and Herb) Amongst the
remaining unchanged AVCs the only differences in the results were for Fertile Grass land and Crops and
Weeds where the significant increase in mean soil pH between 1978 and 1998 was lost For Fertile
Grassland the mean soil pH values recorded for the whole dataset and for the AVC unchanged data were
very similar suggesting that significance was lost due to a reduction in the number of samples In contrast
for Crops and Weeds the 1978 mean values differ by 044 units between the two datasets suggesting that
restricting the analysis to unchanged plots has eliminated some that were either mis-classified in 1978 or
were responding to changes in landuse vegetation prior to 1978
In all three surveys the most acid soils corresponded to those with the highest organic matter content (Table
34) reflecting the broad inverse relationship between soil pH and LOI (Fig 35) The lower boundary pH
values to this relationship decreased approximately linearly from pH 4 to pH 34 across the full range of LOI
values The upper boundary value decreased more steeply from pH 915 at less than 1 LOI to pH 496 at
96 LOI Mineral soils therefore had a much wider pH range (eg pH 394 to 86 at 4 LOI) compared with
organic soils (eg pH 35 to 51 at 95 LOI) Due to the logarithmic pH scale the range in hydrogen ion
concentrations was actually greater in organic soils (equivalent to 771 μEq kg at 95 LOI) compared to
mineral soils (equivalent to 287 μEq kg at 4 LOI)
Mean soil pH increased significantly across all three Countryside Surveys in mineral soils with an LOI less
than 30 (Table 34) There was no significant change in mean soil pH for organo-mineral and organic soils
between 1998 and 2007 although there was a significant increase in mean pH between 1978 and 1998 which
largely accounted for the significant increase between 1978 and 2007 (Fig 36)
d) Great Britain - Loss on ignition category
LOI category () 1978 1998 2007 1978-1998 1998-2007 1978-2007
Mineral (0-8) 619 643 674
Humus-mineral (8-30) 530 567 590
Organo-mineral (30-60) 458 495 496
Organic (60-100) 425 445 444
Mean pH Direction of significant changes
57
Countryside Survey Soils Report from 2007
3 Soil pH
Figure 35 The relationship between soil pH (0-15 cm) and Loss on Ignition in 2007
Figure 36 The change in the mean pH of soils (0-15 cm) for mineral soils (0-8 LOI) and organic soils
(60-100 LOI) between 1978 and 2007 Significant changes ( plt0001) are show between the dates
bracketed 95 CI are shown for each data point
333 Change in mean soil pH (0-15 cm) across England
Mean soil pH (0-15 cm) values in the All Broad Habitats category for England were approximately 05 pH
units higher compared to Great Britain as a whole (Fig 37) with significant increases observed between
each survey and over the 29 year period since 1978 (Table 35 and Fig 38)
2
3
4
5
6
7
8
9
10
0 10 20 30 40 50 60 70 80 90 100
LOI ()
pH
300
400
500
600
700
800
1973 1978 1983 1988 1993 1998 2003 2008
pH
LOI category 0-8 LOI category 60-100
58
Countryside Survey Soils Report from 2007
3 Soil pH
Figure 37 Differences between England and Great Britain in mean soil pH (0-15 cm) for all Broad
Habitats
Soils beneath enclosed farmland Broad Habitats were the least acid in England with mean pH values gt 65 in
2007 and significant increases in mean soil pH between each survey Mean soil pH (0 -15 cm) in English
enclosed farmland was asymp 025 pH units higher than for Great Britain as a whole (Fig 37) In contrast to
Great Britain Bog soils were the most acid in England (2007 mean pH 401) and no significant changes in
mean pH were recorded across the 29 year period of Countryside Survey Apart from Bog Fen Marsh and
Swamp and Coniferous Woodland all other Broad Habitats showed a significant increase in mean soil pH
between 1978 and 2007 In contrast to Great Britain as whole mean soil pH in Bracken and Dwarf Shrub
Heath Broad Habitats increased significantly between 1998 and 2007 but not between 1978 and 1998 the
mean pH of Acid Grassland soils increased significantly between all three surveys
With the exception of Heath and Bog AVC where no significant changes were observed a nd Crops and
Weeds where there were too few samples for statistical analysis the mean soil pH (0 -15 cm) increased
significantly in all AVCs between 1978 and 2007 in England (Table 35) This broadly reflects the results for
analysis by Broad Habitat except that soil pH increased significantly in the Upland Woodland AVC but not in
Coniferous Forest Broad Habitat possibly due to the inclusion of some broadleaf woodland within the Upland
Woodland AVC and exclusion of lowland coniferous woodland Mean soil pH increased significantly between
1998 and 2007 in Moorland Grass Mosaic in England in contrast to Great Britain where no significant change
was recorded over this period Restricting statistical analysis to unchanged AVCs eliminated several classes
due to small sample numbers Significance was lost for the change in mean soil pH between 1978 and 1998
for Infertile Grassland and Crops and Weeds This may be due to a reduction in sample numbers but for
Crops and Weeds the mean soil pH for the unchanged dataset (pH 709) was approximately 03 pH units
higher than for the whole dataset Restricting the analysis to unchanged plots may have eliminated some
plots that were either mis-classified in 1978 or responding to changes in landuse vegetation prior to 19 78
For England the most organic-rich (60-100 LOI category Table 35) soils were not represented in
sufficient numbers for statistical analysis Mean soil pH (0 -15 cm) was highest in the mineral category (2007
pH 702) and lowest in the organo-mineral soils (2007 pH 502) Mean soil pH increased significantly between
each Survey and across the 29 years since 1978 in soils with less than 30 LOI For organo-mineral soils
(30-60 LOI) mean soil pH increased significantly between 1978 and 1998 which large ly accounted for the
significant increase between 1978 and 2007 These results were consistent with those for Great Britain as a
whole
-060
-040
-020
000
020
040
060
080B
roa
dle
ave
d
Mix
ed
an
d
Ye
wC
on
ife
rou
s
Wo
od
lan
d
Ara
ble
an
d
Ho
rtic
ultu
re
Imp
rove
d
Gra
ssla
nd
Ne
utr
al
Gra
ssla
nd
Acid
Gra
ssla
nd
Bra
cke
n
Dw
arf
Sh
rub
He
ath
Fe
n M
ars
h
an
d S
wa
mp
Bo
g
All
ha
bita
t
typ
es
Dif
fere
nc
e in
me
an
pH
59
Countryside Survey Soils Report from 2007
3 Soil pH
Figure 38 The change in the mean pH of soils (0-15 cm) for across all Broad Habitats in England and
Great Britain between 1978 and 2007 Significant changes ( plt0001) are show between the dates
bracketed 95 CI are shown for each data point
Table 35 Changes in mean soil pH (0-15 cm) across England for a) Broad Habitats b) Aggregate
Vegetation Classes (AVC) c) AVCs unchanged since 1978 and d) LOI categories Arrows denote a
significant change (plt005) in the direction shown Diagonal line indicates too few samples to provide
reliable value
a) England - Broad Habitat
Broad Habitat 1978 1998 2007 1978-1998 1998-2007 1978-2007
Broadleaved Mixed and Yew Woodland 523 583 607
Coniferous Woodland 431 413 444
Arable and Horticulture 671 702 743
Improved Grassland 614 629 658
Neutral Grassland 572 618 641
Acid Grassland 404 451 474
Bracken 411 408 489
Dwarf Shrub Heath 400 412 440
Fen Marsh and Swamp 515 583 548
Bog 409 409 401
All habitat types 589 619 651
Mean pH Direction of significant changes
300
400
500
600
700
800
1973 1978 1983 1988 1993 1998 2003 2008
pH
England Great Britain
60
Countryside Survey Soils Report from 2007
3 Soil pH
d) England - Loss on ignition category
LOI category () 1978 1998 2007 1978-1998 1998-2007 1978-2007
Mineral (0-8) 640 670 702
Humus-mineral (8-30) 573 601 640
Organo-mineral (30-60) 449 504 502
Organic (60-100)
Mean pH Direction of significant changes
334 Change in mean soil pH (0-15 cm) across Scotland
There was a significant increase in mean soil pH in the All Broad Habitats category for Scotland from 1998 to
2007 (Table 36) Earlier increases in pH between 1978 and 1998 and overall from 1978 to 2007 were also
significant (Table 35) Overall mean soil pH was more acid in Scotland compared to Great Britain as a
whole most notably for the enclosed farmland Broad Habitats and for Broadleaved Woodland and Neutral
Grassland (Fig 39)
b) England - AVC whole dataset
Aggregate Vegetation Class 1978 1998 2007 1978-1998 1998-2007 1978-2007
Upland Woodland 401 434 457
Lowland woodland 518 539 572
Fertile grassland 624 640 672
Infertile grassland 575 610 630
Moorland grass mosaics 405 438 465
Heath and Bog 398 416 424
Tall grass and Herb 700 706
Crops and weeds 672 703 750
Mean pH Direction of significant changes
Aggregate Vegetation Class 1978 1998 2007 1978-1998 1998-2007 1978-2007
Upland Woodland
Lowland woodland
Fertile grassland 619 628 666
Infertile grassland 582 609 637
Moorland grass mosaic
Heath and Bog
Tall grass and Herb
Crops and weeds 709 705 753
Mean pH Direction of significant changes
c) England - AVC unchanged
61
Countryside Survey Soils Report from 2007
3 Soil pH
Figure 39 Differences between Scotland and Great Britain in mean soil pH (0-15 cm) for all Broad
Habitats
Soils beneath the Arable Broad Habitat were the least acidic in Scotlan d (2007 mean pH 628) and this was
the only Broad Habitat to record a significant increase in mean soil pH between 1998 (pH 598) and 2007 (pH
628) Mean soil pH in the Arable Broad Habitat did not increase significantly between 1978 and 1998 or
across the entire period from 1978 to 2007
There was no significant change in mean soil pH beneath woodland Broad Habitats in Scotland between
1998 and 2007 or between 1978 and 1998 or between 1978 and 2007 There was a significant increase in
soil pH between 1978 and 1998 for Improved Grassland Neutral Grassland Dwarf Shrub Heath Fen Marsh
and Swamp and Bog Broad Habitats which largely accounted for the significant increase in mean soil pH over
the entire period from 1978 to 2007 in these Broad Habitats Mean soil pH beneath Acid Grassland increased
significanly between 1978 (pH 461) and 2007 (pH 482) but not between 1978 and 1998 or between 1998
and 2007 Bracken was the most acidic Broad Habitat in Scotland in 2007 (mean pH 451) but there were no
significant changes in mean soil pH between any of the Surveys or over the 29 year period from 1978
Infertile Grassland and Crops and Weeds were the only AVCs in Scotland to record a significant increase in
mean soil pH between 1997 and 2007 For Infertile Grassland this continued the trend of significant mean
soil pH increase between 1978 and 1998 and across the entire period from 1978 to 2007 No other significant
changes in mean soil pH were observed for Crops and Weeds There was a significant increase in mean soil
pH for Moorland Mosaics and Heath and Bog between 1978 and 1998 which largely accounted for the
significant increases between 1978 and 2007 For Upland Woodland there was a significant increase in mean
soil pH between 1978 and 2007 but no other significant changes were observed
Restricting the statistical analysis to unchanged AVCs eliminated all but three classes due to small sample
numbers The only difference in the results for the remaining AVCs was the loss of significance for the
increase in mean soil pH in Infertile Grassland between 1978 and 1998 The mean pH values for 1978 and
1998 and the differences between 1978 and 1998 are similar for the unchanged and the whole Infertile
Grassland dataset indicating that a reduction in sample numbers may have caused the loss of significance
-100
-080
-060
-040
-020
000
020B
roadle
aved
Mix
ed a
nd
Yew
Co
nifero
us
Woodla
nd
Ara
ble
and
Ho
rtic
ulture
Impro
ved
Gra
ssla
nd
Ne
utr
al
Gra
ssla
nd
Acid
Gra
ssla
nd
Bra
cken
Dw
arf
Shru
b
He
ath
Fen M
ars
h
and S
wam
p
Bog
All
habitat
types
Dif
fere
nce in
mean
pH
62
Countryside Survey Soils Report from 2007
3 Soil pH
Table 36 Changes in mean soil pH (0-15 cm) across Scotland for a) Broad Habitats b) Aggregate
Vegetation Classes (AVC) c) AVCs unchanged since 1978 and d) LOI categories Arrows denote a
significant change (plt005) in the direction shown Diagonal line indicates too few samples to provide
reliable value
a) Scotland - Broad Habitat
Broad Habitat 1978 1998 2007 1978-1998 1998-2007 1978-2007
Broadleaved Mixed and Yew Woodland 500 485 526
Coniferous Woodland 442 452 461
Arable and Horticulture 614 598 628
Improved Grassland 544 584 595
Neutral Grassland 531 571 572
Acid Grassland 461 483 482
Bracken 442 481 451
Dwarf Shrub Heath 431 463 466
Fen Marsh and Swamp 459 524 531
Bog 434 453 459
All habitat types 481 502 509
Mean pH Direction of significant changes
b) Scotland - AVC whole dataset
Aggregate Vegetation Class 1978 1998 2007 1978-1998 1998-2007 1978-2007
Upland Woodland 432 464 470
Lowland woodland
Fertile grassland 575 594 608
Infertile grassland 535 567 589
Moorland grass mosaics 451 490 487
Heath and Bog 434 450 453
Tall grass and Herb
Crops and weeds 607 578 616
Mean pH Direction of significant changes
Aggregate Vegetation Class 1978 1998 2007 1978-1998 1998-2007 1978-2007
Upland Woodland
Lowland woodland
Fertile grassland
Infertile grassland 525 554 593
Moorland grass mosaic 451 486 489
Heath and Bog 440 461 461
Tall grass and Herb
Crops and weeds
Mean pH Direction of significant changes
c) Scotland - AVC unchanged
63
Countryside Survey Soils Report from 2007
3 Soil pH
In 2007 the mean soil pH in mineral and humus-mineral soils in Scotland was approximately 05 pH units
lower compared to the equivalent soils across Great Britain as a whole (Tables 34 and 36) In contrast the
mean soil pH of the organic-rich soils (gt 30 LOI) was approximately the same in Scotland and across Great
Britain in 2007 For soils in all LOI categories there was a significant increase in mean pH between 1978 and
2007 but the patterns of change with respect to LOI category for other periods were much less consistent in
Scotland compared to Great Britain as a whole Mineral so ils were the only category to record a significant
increase in mean soil pH between 1998 and 2007 The mean pH of humus -mineral and organic soils
increased significantly between 1978 and 1998 which largely accounted for the increase in mean soil pH
between 1978 and 2007 For organo-mineral soils (30-60 LOI) there were no significant changes in mean
soil pH between 1978 and 1998 or between 1998 and 2007
335 Change in mean soil pH (0-15 cm) across Wales
The most acid soils in Wales in 2007 were those beneath Coniferous Woodland (pH 414) whilst soils
beneath enclosed farmland Broad Habitats were the least acid (Table 37) There were no significant
changes in mean soil pH for any of the Broad Habitats in Wales between 1998 and 2007 The mean pH of
soils beneath Broadleaved Woodland Improved Grassland and Neutral Grassland increased significantly
between 1978 and 1998 and this accounted for much of the significant increase in mean soil pH between
1978 and 2007 in these Broad Habitats For Coniferous Woodland Acid Grassland and Dwarf Shrub Heath
there were no significant changes in mean soil pH between any of the Surveys or across the entire period
between 1978 and 2007 Mean soil pH was more acid in Wales for all Broad Habitats relative to mean values
for Great Britain (Fig 310)
Figure 310 Differences between Wales and Great Britain in mean soil pH (0-15 cm) for all Broad
Habitats
-080
-070
-060
-050
-040
-030
-020
-010
000
Bro
ad
lea
ve
d
Mix
ed
an
d
Ye
wC
on
ife
rou
s
Wo
od
lan
d
Ara
ble
an
d
Ho
rtic
ultu
re
Imp
rove
d
Gra
ssla
nd
Ne
utr
al
Gra
ssla
nd
Acid
Gra
ssla
nd
Bra
cke
n
Dw
arf
Sh
rub
He
ath
Fe
n M
ars
h
an
d S
wa
mp
Bo
g
All
ha
bita
t
typ
es
Dif
fere
nc
e in
me
an
pH
d) Scotland - Loss on ignition category
LOI category () 1978 1998 2007 1978-1998 1998-2007 1978-2007
Mineral (0-8) 575 582 605
Humus-mineral (8-30) 496 535 545
Organo-mineral (30-60) 464 487 496
Organic (60-100) 430 451 450
Mean pH Direction of significant changes
64
Countryside Survey Soils Report from 2007
3 Soil pH
Infertile Grassland and Fertile Grassland were the only AVCs to have sufficient data to report st ate and
change for all three Countryside Surveys (Table 37) The mean pH of soils beneath Fertile Grassland did not
change significantly between any of the Surveys or across the period from 1978 to 2007 For Infertile
Grassland there was a significant increase in mean soil pH between 1998 and 2007 between 1978 and 1998
and across the entire period from 1978 to 2007 Restricting the statistical analysis to unchanged AVCs
eliminated all but Infertile Grassland which showed very similar results to the AVC d ataset as a whole It is
unlikely therefore that the changes observed in mean soil pH for Infertile Grassland in Wales resulted from a
change in land use or vegetation composition
There was no significant change in the mean soil pH of mineral or humus -mineral soils in Wales between
1998 and 2007 and there were too few data to report on state and change in mean soil pH for organo -mineral
and organic soils (Table 37) The mean pH of mineral soils (0-15 cm) did not change significantly between
any of the surveys or across the entire period from 1978 to 2007 There was a significant increase in the
mean pH of humus mineral soils (0-15 cm) between 1978 and 1998 and this largely accounted for the
significant increase in mean soil pH between 1978 and 2007
Table 37 Changes in mean soil pH (0-15 cm) across Wales for a) Broad Habitats b) Aggregate
Vegetation Classes (AVC) c) AVCs unchanged since 1978 and d) LOI categories Arrows denote a
significant change (plt005) in the direction shown Diagonal line indicates too few samples to provide
reliable value
a) Wales - Broad Habitat
Broad Habitat 1978 1998 2007 1978-1998 1998-2007 1978-2007
Broadleaved Mixed and Yew Woodland 453 524 540
Coniferous Woodland 373 422 414
Arable and Horticulture 500 648
Improved Grassland 536 574 594
Neutral Grassland 506 585 582
Acid Grassland 434 441 474
Bracken
Dwarf Shrub Heath 413 453 440
Fen Marsh and Swamp
Bog
All habitat types 500 543 556
Mean pH Direction of significant changes
b) Wales - AVC whole dataset
Aggregate Vegetation Class 1978 1998 2007 1978-1998 1998-2007 1978-2007
Upland Woodland 441
Lowland woodland
Fertile grassland 585 608 608
Infertile grassland 507 554 590
Moorland grass mosaics 464
Heath and Bog 429
Tall grass and Herb
Crops and weeds
Mean pH Direction of significant changes
65
Countryside Survey Soils Report from 2007
3 Soil pH
34 Discussion and Policy Implications
Soils (0-15 cm) in Great Britain and regionally within individual countries covered a wide range of pH in 2007
from a minimum of pH 32 to a maximum of pH 915 Organic soils were consistently the most acid whilst the
highest pH values were encountered in mineral soils which also showed the widest range in soil pH The
least acidic soils with a mean pH in excess of 6 were generally found in moderate to intensively managed
agricultural land such as Arable and Improved Grassland Broad Habitats and Fertile Grassland and Crops
and Weeds AVCs Acidic soils with a mean pH less than 5 were associated with Coniferous Woodland Acid
Grassland Dwarf Shrub Heath and Bog Broad Habitats and the Upland Woodland Moorland Grass Mosaic
and Heath and Bog AVCs These generally had organic -rich soils whereas managed agricultural land was
associated with soils with a low organic matter content (Chapter 2)
The mapped distribution of soil pH in 2007 (Fig 311) followed the anticipated pattern with lower pH soils in
the upland areas of Wales Pennines and much of Scotland The coefficient of variation (CV standard
deviation mean an indicator of the spread of the data around the mean value) was lowest in areas
dominated by either high pH soils which are intensively managed or low pH soils in upland areas where there
is little variation Conversely the signal to noise ratio (SN R mean standard deviation) indicated that for
values above 1 the signal was stronger than the noise High SNRs were observed across managed arable
areas in eastern England and agricultural land in southern central England This may occur because soil
management leads to greater uniformity of pH values across these areas High SNRs in the uplands reflect
the presence of acidic peaty and peaty mineral soils in Acid Grassland Dwarf Shrub Heath Bog and
Coniferous Woodland Broad Habitats For England and Wales the broad patterns in the soil pH data (Fig
311) correspond well to maps originating from the National Soil Inventory dataset (NSI McGrath and
Loveland 1992) and the Representative Soil Sampling Scheme (RSSS Baxter et al 2006) although the
latter are restricted to managed agricultural land
d) Wales - Loss on ignition category
LOI category () 1978 1998 2007 1978-1998 1998-2007 1978-2007
Mineral (0-8) 554 588 613
Humus-mineral (8-30) 487 547 555
Organo-mineral (30-60)
Organic (60-100)
Mean pH Direction of significant changes
Aggregate Vegetation Class 1978 1998 2007 1978-1998 1998-2007 1978-2007
Upland Woodland
Lowland woodland
Fertile grassland
Infertile grassland 505 550 609
Moorland grass mosaic
Heath and Bog
Tall grass and Herb
Crops and weeds
c) Wales - AVC unchanged
Mean pH Direction of significant changes
66
Countryside Survey Soils Report from 2007
3 Soil pH
Figure 311 Maps of soil (0-15 cm) pH in 2007 (a) using ordinary Kriging (pH units) (b) coefficient of variation
and (c) signal to noise ratio
Across Great Britain and regionally within the individual countries soils (0 -15 cm) showed evidence of
increasing pH (decreasing acidity) between 1978 and 2007 This is consistent with a response to a reduction
in acid deposition over the last 29 years (NEGTAP 2001 RoTAP 2010) For the more organic -rich soils and
their associated Broad Habitats and AVCs the significant increase in mean pH between 1978 and 2007 was
largely accounted for by the increase between 1978 and 1998 General ly there was no significant pH change
recorded between 1998 and 2007 for organic-rich soils (gt30 LOI) In contrast for mineral and humus-
mineral soils and associated Broad Habitats and AVCs significant increases in soil pH were often observed
between each Survey as well as across the entire period from 1978 to 2007 This was a consistent pattern for
plots with unchanged AVC classification in the different surveys indicating land use change was not
responsible for the trends observed However land managem ent within squares such as changes in rates of
lime and fertiliser applications or stocking densities may play an important role which is currently being
investigated
When comparing changes in pH between different soil types Broad Habitats or AVCs it must be remembered
that pH is a logarithmic scale An equal rate of recovery in terms of pH units would not be expected for a
low pH and a high pH soil Conversion of pH data to hydrogen ion concentrations reveals that annual rates of
change in hydrogen ion concentration for high pH low organic matter soils has been sustained across the 29
year period The large annual rate of change between 1978 and 1998 for more organic -rich low pH soils
slowed dramatically between 1998 and 2007 The different trends observed for mineral and organic soils
may indicate that the soil response to reducing mineral acid inputs from the atmosphere is influenced by soil
organic matter content possibly as a result of buffering by organic acids As the concentration of mineral
a)
)
b)
)
c)
)
67
Countryside Survey Soils Report from 2007
3 Soil pH
acids in the soil declines and soil solution pH rises organic acids will come into solution and de -protonate
providing a buffering mechanism to further pH change In addition organic -rich soils are broadly located in
the north and west of the British Is les where initial pollution levels were lowest and reductions in acid
deposition have been smaller than anticipated given the size of the emission reductions and less than in
regions such as central England which are closer to the main emission sources ( Fig 312 NEGTAP 2001
RoTAP 2010)
Figure 312 a) The regional grouping of sites in the UK precipitation chemistry network used in the statistical
analysis of trends B) Trends in SO2 over the last 20 years in the four groups of monitoring stations
a) b)
Identifying the relative influence of these factors is important to assessing the ldquosuccessrdquo of emission control
policy for acid deposition and will be the subject of further analysis Thus in semi -natural systems on the
more organic-rich soils the implications for biodiversity and metal mobilisation are not clear until further
analysis determines the cause of the lack of change in soil pH Current risk assessment tools using the
critical load methodology indicate the majority of these systems remain at risk from acidic deposition and
thus the lack of further increases in soil pH needs to be investigated closely (RoTAP 2010) One possibility
is the variability in initial acidic deposition inputs and subsequent tre nds (Fig 312)
The significant increase in mean soil pH between 1978 and 2007 observed for managed agricultural land will
be influenced by farming practice such as moves towards deeper cultivation bringing relatively unweathered
chalk parent material to the soil surface In England many areas of arable and arable ley or short term
grassland are located in areas close to emission sources and will have experienced relatively large
reductions in acid deposition loading especially from dry deposition of S O2 (NEGTAP 2001) compared to
areas further west where wet deposition dominates inputs
Group=4
Group=3
Group=2
Group=1
Years since 1986
25
30
0
10 5
10
20
15 0
15
-5
5
20
SO2 concentration (microgm-3)
68
Countryside Survey Soils Report from 2007
3 Soil pH
The influence of agricultural management is difficult to separate from external factors and the evidence from
other soil surveys is contradictory The RSSS (Skinner et al 1992) is exclusively focussed on soils under
agricultural management Re-analysis of the RSSS data (Oliver et al 2006) showed that the temporal
change in agricultural soil pH was small between 1971 and 2001 Spatial disaggregation of the RSSS dat a
indicated that soil pH declined in areas of permanent grassland such as the west of England and Wales
possibly because farmers did not maintain lime inputs following the loss of subsidy in 1976 (Skinner and
Todd 1998 Baxter et al 2006) The RSSS data also showed that soil pH had changed little over time in
arable and arable ley systems with the interpretation that arable farmers have maintained optimal pH levels
for crop production (Oliver et al 2006) Selective re-sampling of arable arable-ley and permanent
(managed) grassland sites of the National Soil Inventory showed an increase in soil pH of between 01 and
03 pH units between the early 1980s and 199596 (Defra 2003) The NSI data corroborate the results from
Countryside Survey for England and Wales between 1978 and 1998 mean pH values for equivalent land use
types are also similar Currently there are no other published national -scale datasets to provide evidence of
pH change in agricultural soils between 1998 and 2007
The soil pH data show an increase over time in the frequency of pH values in excess of pH 85 In 2007
approximately two thirds of the 54 plots with pH gt 85 were in the Arable Broad Habitat with values
approaching pH 9 in some plots Soil pH values in excess of 83 indicat e that calcium carbonate solubility is
no longer controlling soil pH and there is an influence from sodium salts accumulating in the soil Two of the
sample points with the highest pH values are very close to the coast and are mapped as Littoral Sediment o r
Supra-littoral Sediment Broad Habitats where sodium will be abundant Several sample sites are located in
the fens of East Anglia and again there may be abundant sodium in these soils The remaining sites are
further west in Oxfordshire and may be influenced by irrigation which can lead to sodium accumulation in the
soil
Across Great Britain and within individual countries Coniferous Woodland was consistently amongst the most
acidic of the Broad Habitats and showed no significant temporal changes in m ean soil pH Whilst sample
numbers were relatively low in England and Wales (c40) Broad Habitats with fewer samples have shown
significant pH increases and samples numbers in Scotland (125) and across Great Britain as a whole (207)
were easily sufficient to detect change The implication from Countryside Survey is that soils beneath
Coniferous Woodlands are either responding very slowly to changes in acid deposition or other factors such
as accumulation of acidic organic matter are controlling soil pH in these systems Large areas of conifer
forest are located at relatively high altitude in the north and west of Britain where annual rainfall is high wet
deposition enhanced by seeder-feeder effects dominates atmospheric inputs (Dore et al 1992) and forest
canopies are frequently enveloped in cloud which even now can contain high concentrations of atmospheric
pollutants Given this environment and the ability of conifer canopies to efficiently scavenge air pollutants
from the atmosphere (Fowler et al 1989) the positive effects of emission reductions may be attenuated in
Coniferous Woodland There is also a known interaction between forest age or maturity and atmospheric
nitrogen deposition which can potentially acidify forest soils through ldquonitrogen sa turationrdquo (Emmett et al
2003 Emmett and Reynolds 1996) Atmospheric nitrogen deposition has changed little over the past 29
years whilst conifer plantations have grown older as trees planted in the 1960s reach maturity The ongoing
effects of nitrogen deposition may therefore offset the benefits of lower sulphur deposition Aside from
external influences the build up of acidic forest floor and accumulation of base cations into standing
biomass especially in those areas with a naturally ldquoacidicrdquo geolog y and soils may also be contributing to the
sustained acidity of surface soils in Coniferous Woodland The policy consequences of these results are
more likely to affect the aquatic rather than the terrestrial environment In Wales for example surface w ater
acidification in afforested headwater catchments and the persistence of acid episodes has already been
identified as a significant threat to achieving compliance to the Water Framework Directive in some upland
water bodies
69
Countryside Survey Soils Report from 2007
3 Soil pH
341 Policy implications
The increased soil pH observed for the more mineral soils is consistent with the expected benefit of
continued reductions in sulphur emissions Data analysis is ongoing to determine if other drivers of change
such as nitrogen deposition or land management is slowing recovery in the organic soils where pH did not
significantly increase between 1998 and 2007 Conversion from one land use to another does not seem to be
an important factor Land management may be affecting soil pH in more intensively managed agricultural
land and further work is required to separate this influence from the response to reduced acid and nitrogen
deposition The implications of these findings are that current emission control policies combined with current
policies to protect soil through sustainable land management practices may not currently be sufficient to
promote continued recovery from acidification in organic -rich soils
35 References
Allen SE (ed) 1989 Chemical analysis of ecological materials Blackwell Scientific Publications Oxford
368 pp
Avery BW Bascomb CL 1974 Soil Survey Laboratory Methods Soil Survey Technical Monograph No 6
Harpenden
Baxter SJ Oliver MA Archer JR 2006 The Representative Soil Sampling Scheme of England and
Wales the spatial variation of topsoil nutrient status and pH between 1971 and 2001 Soil Use and
Management 22 383-392
Black HIJ Garnet JS Ainsworth G Coward PA Creamer R Ellwood S Horne J Hornung M
Kennedy VH Monson F Raine L Osborn D Parekh NR Parrington J Poskitt JM Potter E
Reeves N Rowland AP Self P Turner S Watkins J Woods C Wright J 2000 MASQ Monitoring
and Assessing Soil Quality in Great Britain Countryside Survey Module 6 Soils and Pollution RampD
Technical Report E1-063TR Environment Agency Bristol
Carey PD Wallis S Chamberlain PM Cooper A Emmett BA Maskell LC McCann T Murphy J
Norton LR Reynolds B Scott WA Simpson IC Smart SM Ullyett JM 2008 Countryside Survey
UK Results from 2007 NERCCentre for Ecology amp Hydrology 105pp (CEH Project Number C03259)
Countryside Survey 2009 England Results from 2007 (published September 2009) NERCCentre for Ecology
amp Hydrology Department for Environment Food and Rural Affairs Natural England 119pp (CEH Project
Number C03259)
Defra 2003 Comparability of soil properties derived from different data sources Report by National Soil
Resources Institute Defra Project SP0515
Dore AJ Choularton TW Fowler D 1992 An improved wet deposition map of the United Kingdom
incorporating the seeder-feeder effect over mountainous terrrain Atmospheric Environment 26 1375-1381
Emmett BA Frogbrook ZL Chamberlain PM Griffiths R Pickup R Poskitt J Reynolds B Rowe
E Spurgeon D Rowland P Wilson J and Wood CM 2008 CS Technical Report No 307 Soils
Manual NERCCentre for Ecology amp Hydrology 180 pp (CEH Project Number C03259)
Emmett BA Reynolds B Stevens PA Norris DA Hughes S Gorres J Lubrecht I 1993 Nitrate
leaching from afforested Welsh catchments - interactions between stand age and nitrogen deposition Ambio
22 386-394
70
Countryside Survey Soils Report from 2007
3 Soil pH
Emmett BA Reynolds B 1996 Nitrogen critical loads for spruce plantations in Wales is there too much
nitrogen Forestry 69 205-214
Fowler D Cape JN and Unsworth MH 1989 Deposition of atmospheric pollutants on forests
Philosophical Transactions of the Royal Society B 324 247-265
Fowler D Coyle M Apsimon HM Ashmore MR Bareham SA Battarbee RW Derwent RG
Erisman JW Goodwin J Grennfelt P Hornung M Irwin J Jenkins A Metcalfe SE Ormerod SJ
Reynolds B Woodin S 2001 Transboundary Air pollution Acidification Eutrophication and Ground -Level
Ozone in the UK NEGTAP 2001 314pp DEFRA Contract No EPG 13153
Haines-Young RH Barr CJ Black HIJ Briggs DL Bunce RGH Clarke RT Cooper A Dawson
FH Firbank LG Fuller RM Furse MT Gillespie MK Hill R Hornung M Howard DC McCann
T Morecroft MD Petit S Sier ARJ Smart SM Smith GM Stott AP Stuart RC and Watkins
JW 2000 Accounting for nature assessing habitats in the UK countryside Centre for Ecology and
Hydrology Department of the Environment Transport and the Regions 134 pp
McGrath SP Loveland PJ 1992 The Soil Geochemical Atlas of England and Wales Blackie Academ ic
and Professional
NEGTAP 2001 Transboundary Air Pollution Acidification Eutrophication and Ground -Level Ozone in the
UK Prepared by the National Expert Group on Transboundary Air Pollution on behalf of the UK Department
for Environment Food and Rural Affairs (DEFRA) and the Devolved Administrations 314 pp
Norton LR Murphy J Reynolds B Marks S Mackey EC 2009 Countryside Survey Scotland Results
from 2007 NERCCentre for Ecology amp Hydrology The Scottish Government Scottish Natural Heritage
83pp (CEH Project Number C03259)
Oliver MA Archer JR Baxter SJ Todd AD Skinner RJ 2006 The Representative Soil Sampling
Scheme of England and Wales a statistical analysis of topsoil nutrient status and pH between 197 1 and
2001 Soil Use and Management 22 372-382
RoTAP 2010 Review of Transboundary Air Pollution Acidification Eutrophication Ground Level Ozone and
Heavy Metals in the UK Defra
Schofield RK Taylor AW1955 The measurement of soil pH Soil Science Society of America Journal 19
164-167
Skinner RJ Todd AD 1998 Twenty-five years of monitoring pH and nutrient status of soils in Enlgand and
Wales Soil Use and Management 14 162-169
Skinner RJ Church BM Kershaw CD 1992 Recent trends in soil pH and nutrient status in England and
Wales Soil Use and Management 8 16-20
Smart SM Allen D Murphy J Carey PD Emmett BA Reynolds B Simpson IC Evans RA
Skates J Scott WA Maskell LC Norton LR Rossall MJ Wood C 2009 Countryside Survey Wales
Results from 2007 NERCCentre for Ecology amp Hydrology Welsh Assembly Government Countryside
Council for Wales 94pp (CEH Project Number C03259)
White RE 1969 On the measurement of so il pH Journal of the Australian Institute of Agricultural Science
35 3-14
71
Countryside Survey Soils Report from 2007
4 Total nitrogen and CN
Summary
There were small but significant decreases in mean soil (0-15 cm) total nitrogen concentration
between 1998 and 2007 in many Broad Habitats and Aggregate Vegetation Classes across Great
Britain and the individual countries no reporting category recorded an increase in mean soil (0 -15
cm) total nitrogen concentration
For semi-natural and woodland soils continued input of nitrogen deposition at 20-30 kgNhayr for
many parts of Great Britain has not caused the expected average increase of 3 -4 in this basic soil
property Instead the decreases observed combined with a trend for an increase in total carbon to
nitrogen ratio suggest there may be increased nitrogen loss or uptake possibly combined with a
trend for increased carbon density as reported for some soils in Chapter 2 The effects of one or
both of these processes would be to effectively bdquodilute‟ the soil (0 -15cm) nitrogen concentration
signal Both processes (increased nitrogen loss and increased carbon fixation by plants leading to
storage in soil) are known possible consequences of nitrogen enrichment which can result in
vegetation composition change and thus this parameter may not be a sensitive indicator of
eutrophication from atmospheric nitrogen deposition
There was no change or a small significant decline in mean soil total nitrogen concentrations in
improved and fertile grassland categories between 1998 and 2007 across Great Britain and within
individual countries despite major reductions in fertiliser use As there is no change in the soil (0 -
15cm) total carbon to nitrogen ratio this indicates farmers have maintained soil nitrogen status in
managed grassland systems despite a reduction in mineral fertiliser use possibly due to use of
alternative organic sources of nitrogen such as slurry and organic waste products
In cropland systems a significant decline in soil (0-15cm) total nitrogen concentrations and total
carbon to nitrogen ratios was observed between 1998 and 2007 for Great Britain and England A
significant decline in soil (0-15cm) total carbon concentrations was also reported (Chapter 2) As
there is only a small decline in fertiliser use in these systems and there is evidence of combined
carbon and nitrogen loss deep ploughing erosion or increased decomposition rates may be the
most likely explanation of this trend
41 Introduction
Key question Can the trend of eutrophication of the countryside be detected in the soil as well as the
vegetation using this basic soil property
Measurements Repeat measurement of soil (0-15 cm) total nitrogen concentration measured in all plots
sampled in 1998
Soil total nitrogen concentration (hereafter called soil N concentration) and stock are basic fundame ntal
measurements of soil fertility They are relatively insensitive to short -term changes but over a longer time
period give an overall indication of trends in soil fertility and changes in nutrient status in relation to other
parameters such as carbon (C) Changes in plant species composition were observed following the
Countryside Survey (CS) in 1998 (Haines-Young 2000) and these were ascribed to ecosystem eutrophication
following enhanced deposition of atmospheric N compounds
In response to the key question soil N concentration data can be used to provide
72
Countryside Survey Soils Report from 2007
4 Total Nitrogen and CN
National and country-level assessments of soil N concentration and change in soil N concentration
since 1998
Attribution of change in and form of soil N in response to pressures and drivers
Attribution of change in plant species composition in relation to internal N status versus
atmospheric N deposition
Assessment of soil N in relation to changes in soil C status
The deliverables for total soil (0-15 cm) N from CS in 2007 will be
National and country-level assessments of status and change in soil (0-15 cm) total N concentration
and stock since 1998
Assessment of soil N in relation to changes in soil C status
411 Rationale for measurement
The rationale for the measurement of soil total N concentration and stock is given in Table 41 Total N has
not been measured in surveys of soil quality in England and Wales apart from forest and woodland systems
in the BIOSOIL and British Woodland Survey It is a parameter within the National Soil In ventory for Scotland
(NSIS) and is included in the soil measurements at Environmental Change Network sites
Table 41 Total N rationale for measurement
Facts Comments History in CS Total N measured in CS
in 1998
Maintain time series Enables stock and change
Links and compatibility to other monitoring programmes
Not measured in NSI
Total N has been measured in the NSIS (Scotland) BIOSOIL and the British Woodland Survey
Uniqueness of CS No other known national datasets
Only integrated sample which can be linked to vegetation and land management
Value for money (Policy priority or interpretative value x cost)
High High policy and interpretative value low cost
42 Methods
The soil used for total N analysis was taken from the bdquoBlack core‟ and there were no specific sampling
requirements beyond those normally employed for collecting these samples (See Emmett et al 2008 Annex
1)
One thousand and twenty four samples were analysed at CEH Lancaster for total N in 2007 using the UKAS
accredited method SOP3102 Samples were analysed using an Elementar Vario -EL elemental analyser
(Elementaranalysensysteme GmbH Hanau Germany) The Vario EL is a fully automated analytical
instrument working on the principle of oxidative combustion followed by thermal conductivity detection
Following combustion in the presence of excess oxygen the oxides of N and C flow through a reduction
column which removes excess oxygen C is trapped on a column whilst N is carried to a detector C is then
73
Countryside Survey Soils Report from 2007
4 Total nitrogen and CN
released from the trap and detected separately Sample weights are usually 15 mg for peat and 15 -60 mg for
mineral soil samples
The concentration of total N is expressed in dry weight of soil which is abbreviated in the text to N
To calculate topsoil total N density a measurement of N content per unit volume is needed Combining bulk
density measurements reported in Chapter 1 for the 2007 samples with soil N concentration values result in
estimates of topsoil (0-15 cm) N density on an area basis expressed in units of tha
421 Quality Assurance and Quality Control
The DefraNERCBBSRC Joint Codes of Practice were followed
Due to the fully automated nature of the instrument calibration was performed infrequently with daily runs
being factorised to the instrument calibration through the use of a certified standard (acetanilide) Quality
control was achieved by using two in-house reference materials analysed with each batch of samples and by
the analysis of duplicate samples
Results of the analysis of standard reference materials (SRM) SR3 and SR8 which cover a range of soil N
concentration values are shown using Shewhart charts (Fig 41a and Fig 41b) The same standards were
used in the sample batches from 1998 and 2007 and the relative performance of the a nalysis can be
compared
Figure 41 Shewhart QC charts for total N analysis () of standard reference materials a) SR3 and b) SR8
a) SR3 - QC ChartMean = 065 limits +- 2 SD of mean
050
055
060
065
070
075
0 50 100 150 200 250
Arbitrary sample no
N
1998 2007 Mean Upper limit Lower limit
b) SR8 - QC ChartMean = 030 limits +- 2 SD of mean
025
028
030
033
035
0 20 40 60 80 100 120 140 160 180 200
Arbitrary sample no
N
1998 2007 Mean Upper limit Lower limit ISO median
74
Countryside Survey Soils Report from 2007
4 Total Nitrogen and CN
The Quality Control charts provide evidence of acceptable results for the analyses under taken in 1998 for
both SRMs More points fall outside the 2SD limit for both SRMs in 2007 For SR3 there is an upward trend
in the results whereas a downward trend is suggested for SR8 with values falling closer to the ISO median
value of 029 N Taken overall the values for the repeated SRM analyses fall within acceptable Quality
Control limits and there is no evidence to indicate a consistent bias in the results
422 Reporting
Soil N concentration data (0-15 cm) have been analysed to provide information on the state of soil N
concentration in 2007 and the change since 1998 The statistical approach used for analysing the data for
change involved bootstrapping which allows for non-normality in the data without the necessity of knowing
details of the actual distribution As such it provides a more accurate measurement of significance Annex F
of Emmett et al (2008) provides a background document describing this approach
The data in this report describe mean soil N concentrations in soils (0-15 cm) in 2007 and change since 1998
by Broad Habitat Aggregate Vegetation Class (AVC) and Loss-on-Ignition (LOI) category for Great Britain
(GB) and for the individual countries In summary these are defined as
Broad Habitat - The Broad Habitat classification consists of 27 habitats which account for the entire
land surface of Great Britain and the surrounding sea Countryside Survey reports on soils for 10
major terrestrial habitats
Aggregate Vegetation Class (AVC) ndash is a high level grouping of vegetation types produced from a
quantitative hierarchical classification of the different plant species found in the original Countryside
Survey sample plots Loss on ignition (LOI) category ndash soil type based on soil organic matter content defined as mineral (0 -
8 LOI 0-44 g C kg-1
) humus-mineral (8 ndash 30 LOI 44-165 g C kg-1
) organo-mineral (30 ndash 60
LOI 165-330 g C kg-1
) and organic (60 ndash 100 gt 330 g C kg-1
)
To remove the effects of large-scale vegetation and or land use change mean soil N concentrations have
also been estimated for plots where the AVC has not changed over time The AVC is only known for the
survey years and may change during intervening periods for example due to arable -grassland rotation The
plots where the AVC has not changed can therefore be regarded as plots where the vegetation has been
largely consistent in 1978 1998 and 2007
Soil (0-15 cm) total N density (tha) has been estimated for 2007 using the total N concentration and the bulk
density data These values are reported using the same categories for GB and individual countries Total N
density has not been estimated for AVC unchanged as change in density cannot be reported
43 Results
431 Structure of the total nitrogen concentration data
Total N concentration was measured in samples from 1024 plots in 2007 and from 1110 plots in 1998 75 of
plots sampled in 2007 had also been sampled in 1998 Concentrations of total N measured in soils (0-15 cm)
in 2007 ranged between 004 and 277N compared to a range of values betw een 008 and 322 N in 1998
The common practice in agricultural soils to determine N on a volume basis (mglitre) makes comparison
difficult particularly when combined with different depth of 0 -75cm compared to 0-15cm in CS for grassland
soils although ranges for CS soils seem broadly comparable
75
Countryside Survey Soils Report from 2007
4 Total nitrogen and CN
Between 1998 and 2007 the proportion of samples with a total N concentration of 1N or less increased
from 71 to 80 whilst the proportion of samples with greater than 2N decreased from 9 to 54
Overall there was evidence of a downward shift in total N concentrations across the entire range of values
between 1998 and 2007 (Fig 42) The populations in 1998 and 2007 were skewed and slightly bimodal
Figure 42 Distribution of soil (0-15cm) N concentrations a) Histogram for 1998 and 2007 b) Cumulative
frequency for 1998 and 2007 Histogram frequencies normalised to percentage of total number of samples
analysed in each survey
Soil N concentration was strongly and positively correlated to loss on ignition (r2 = 089) although there was
more scatter in both datasets at higher values of LOI and total N (Fig 43a) Total N concentration decreased
with increasing bulk density in a logarithmic relationship (r2 = 079 Fig 43b) and together the results show
not unexpectedly that peaty soils with low bulk density contain the highest concentrations of N Below pH
55 soil N concentrations varied across the full range of values measured (04 to 28N) whilst abov e pH 6
the majority of samples contained between 01 and 06 N (Fig 43c) There was no clear relationship
0
3
6
9
12
15
18
01 05 09 13 17 21 25 29 33
Total N ( dry wt of soil)
Fre
qu
en
cy
1998 2007
a)
0
20
40
60
80
100
0 1 2 3 4
Total N ( dry wt of soil)
Cu
mu
lati
ve
fre
qu
en
cy
1998 2007
b)
76
Countryside Survey Soils Report from 2007
4 Total Nitrogen and CN
between total N concentration and Olsen-P (Fig 43d) A wide range of total N values were encountered at
Olsen-P concentrations below 50 mgP kg-1
although samples with very high Olsen-P values in excess of
150 mgP kg-1
generally had low total N concentrations (lt05 N)
Figure 43 Relationships between soil N concentration in 2007 and a) Loss-on-ignition b) bulk density c) soil
pH and d) Olsen-P concentration
Figure 44 Plots of soil N concentration change between 1998 and 2007 (Delta soil N concentration) and 2007
values for a) Loss-on-ignition b) bulk density c) soil pH and d) Olsen-P concentration
-3
-2
-1
0
1
2
3
0 20 40 60 80 100 120
2007 LOI ( dry wt soil)
Delt
a
N
a)
-3
-2
-1
0
1
2
3
0 05 1 15 2
2007 Bulk density (gcm3)
Delt
a
N
b)
-3
-2
-1
0
1
2
3
3 4 5 6 7 8 9
2007 pH
Delt
a
N
c)
-3
-2
-1
0
1
2
3
0 50 100 150 200 250
2007 Olsen-P (mgPkg)
Delt
a
N
d)
0
1
2
3
0 100 200 300 400
Olsen P (mgkg)
To
tal
N (
d
ry w
t s
oil
) d)
0
1
2
3
3 5 7 9
pH
To
tal
N (
d
ry w
t s
oil
)
c)
y = -06385Ln(x) + 03753
R2 = 07927
0
1
2
3
0 05 1 15 2
Bulk density (gcm3)
To
tal
N (
d
ry w
t s
oil
) b)y = 00758x
07302
R2 = 0891
0
1
2
3
0 20 40 60 80 100
LOI ( dry wt soil)
To
tal
N (
d
ry w
t s
oil
) a)
77
Countryside Survey Soils Report from 2007
4 Total nitrogen and CN
Changes in soil N concentration between 1998 and 2007 occurred across the full range of LOI
concentrations (Fig 44a) whereas large changes were more prevalent in soils with a bulk density below asymp07
gcm3 and pH less than 55 (Figs 44b and 44c) Soils with relatively low Olsen-P concentrations (lt20 mgP
kg-1
) showed the largest decrease in total N concentration (Fig 44d) with decreases of up to 2N
432 Change in mean total nitrogen concentration in soils (0-15 cm) across Great
Britain
There was a significant approximately 10 decrease in soil (0-15 cm) N concentration between 1998 and
2007 across GB as a whole (Table 42) This was reflected in many Broad Habitats The magnitude of
change varied between Broad Habitats with the smallest significant decrease (7 ) measured in Arable which
also had the lowest soil N concentrations in 1998 (027 N) and 2007 (025 N) The biggest percentage
decrease between the surveys (21) occurred in Coniferous Woodland The highest soil N concentrations in
both surveys were measured in soils in the Bog Broad Habitat (178 N in 1998 and 159 N in 2007) The
soil N concentration in soils (0-15 cm) beneath Broadleaved Woodland Improved Grassland Bracken and
Fen Marsh and Swamp did not change significantly between 1998 and 2007
The largest total N density (60 tha) was measured in Improved Grassland reflecting the intermediate mean
N concentration and relatively high bulk density Despite having the highest mean total N concentration soils
in the Bog and Coniferous Woodland had the lowest N densities (38 tha) due to the low bulk density values
in these Broad Habitats
There was a significant decrease in soil N concentration in all AVCs except Lowland Woodland Tall Grass
and Herb and Crops and Weeds between 1998 and 2007 (Table 42b) The lowest soil N concentrations were
observed in Crops and Weeds in 1998 (026 N) and 2007 (025 N) whilst Heath and Bog AVC had the
highest mean values in 1998 (17 N) and 2007 (147 N) The soil N concentrations in soils (0-15 cm) for
plots in which the AVC did not change (Table 42c) were broadly consistent with the dataset as a whole
(Table 42b) Significant changes were only observed in Heath and Bog and Infertile Grassland for the
unchanged dataset This suggests that some of the significant change in soil N concentrations observed in
the dataset as a whole may have arisen because of a change in land use between the surveys
Heath and Bog AVC had the lowest total N density in 2007 (38 tha) and Fertile Grassland the highest (59
tha) These values compare closely with values measured in Bog and Improved Grassland Broad Habitats
respectively
Soil N concentrations decreased significantly across all LOI categories (Table 42d Fig 45) with the
largest change observed in organo-mineral soils where mean total N in soils (0-15 cm) declined by more than
20 In both surveys the highest soil N concentrations were observed in organic soils which accounted for
the high concentrations measured in Broad Habitats and AVCs with organic -rich soils (Dwarf Shrub Heath
and Bog Broad Habitats Moorland Grass Mosaic and Heath and Bog AVCs) Organic soils had the lowest
total N density (38 tha) while the highest density was observed in humus -mineral soils (60 tha)
The soil N concentration data were combined with C data to calculate changes in soil CN ratio (0-15cm) The
CN variable provides information on the relative change in C and N storage in soils The general trend
across all Broad Habitats is for no change or an increase in CN rat io (Table 43)
78
Countryside Survey Soils Report from 2007
4 Total Nitrogen and CN
Table 42 Change between 1998 and 2007 in N concentration of soils (0-15 cm) and total N density of soils (0-15
cm) in 2007 for GB for a) Broad Habitats b) Aggregate Vegetation Classes (AVC) c) AVCs unchanged since 1978
and d) LOI categories Arrows denote a significant change (plt005) in the direction shown Diagonal line
indicates too few samples to provide reliable value
a) Great Britain ndash Broad Habitat
Broad Habitats Mean Total Nitrogen ( dry wt soil)
Direction of
significant changes
Total Nitrogen
density (tha)
1998 2007 1998 - 2007 2007
Broadleaved Mixed and
Yew Woodland
070 065 51
Coniferous Woodland 112 088 38
Arable and Horticulture 027 025 43
Improved Grassland 047 045 60
Neutral Grassland 052 047 56
Acid Grassland 149 123 51
Bracken 084 095
Dwarf Shrub Heath 131 114 47
Fen Marsh and Swamp 122 108 48
Bog 178 159 38
All Habitat Types 079 071 49
b) Great Britain ndash AVC whole dataset
Aggregate Vegetation
Class
Mean Total Nitrogen ( dry wt soil) Direction of
significant changes
Total Nitrogen
density (tha)
1998 2007 1998 - 2007 2007
Upland Woodland 091 073 40
Lowland Woodland 060 058 51
Fertile Grassland 044 041 59
Infertile Grassland 057 052 58
Moorland Grass Mosaic 128 113 48
Heath and Bog 170 147 38
Tall Grass and Herb 036 036 48
Crops and Weeds 026 025 43
c) Great Britain ndash AVC unchanged
Aggregate Vegetation
Class
Mean Total Nitrogen ( dry wt soil) Direction of
significant changes
Total Nitrogen
density (tha)
1998 2007 1998 - 2007 2007
Upland Woodland 090 072
Lowland Woodland 065 067
Fertile Grassland 047 044
Infertile Grassland 059 053
Moorland Grass Mosaic 138 124
Heath and Bog 170 151
Tall Grass and Herb 032 032
Crops and Weeds 025 024
79
Countryside Survey Soils Report from 2007
4 Total nitrogen and CN
d) Great Britain ndash Loss on Ignition category
LOI category () Mean Total Nitrogen ( dry wt soil)
Direction of
significant changes
Total Nitrogen
density (tha)
1998 2007 1998 - 2007 2007
Mineral (0-8) 029 027 44
Humus-mineral (8-30) 060 056 60
Organo-mineral (30-60) 146 114 51
Organic (60-100) 191 180 38
Figure 45 Change in soil (0-15 cm) N concentration across LOI categories in Great Britain between 1998 and
2007 Significant changes are shown as plt0001 plt001 plt005 95 CI are shown for each bar
-06
-05
-04
-03
-02
-01
0
Mineral Humus-mineral Organo-mineral Organic
Soil LOI categories
Dif
fere
nce
1998-2
007
(
N)
80
Countryside Survey Soils Report from 2007
4 Total Nitrogen and CN
Table 43 Change in CN ratio of soils (0-15 cm) across Great Britain for a) Broad Habitats b) Aggregate
Vegetation Classes (AVC) c) AVCs unchanged since 1978 and d) LOI categories Arrows denote a significant
change (plt005) in the direction shown
a) Great Britain ndash Broad Habitat
Broad Habitats Mean CN ratio
Direction of
significant changes
1998 2007 1998 - 2007
Broadleaved Mixed and
Yew Woodland
140 142
Coniferous Woodland 201 215
Arable and Horticulture 117 113
Improved Grassland 118 120
Neutral Grassland 123 127
Acid Grassland 177 182
Bracken 152 165
Dwarf Shrub Heath 229 231
Fen Marsh and Swamp 164 177
Bog 262 282
All Habitat Types 156 160
b) Great Britain ndash AVC whole dataset
Aggregate Vegetation
Class
Mean CN ratio Direction of
significant changes
1998 2007 1998 - 2007
Upland Woodland 179 193
Lowland Woodland 134 142
Fertile Grassland 117 121
Infertile Grassland 124 130
Moorland Grass Mosaic 189 196
Heath and Bog 260 268
Tall Grass and Herb 117 118
Crops and Weeds 118 113
c) Great Britain ndash AVC unchanged
Aggregate Vegetation
Class
Mean CN ratio Direction of
significant changes
1998 2007 1998 - 2007
Upland Woodland 171 183
Lowland Woodland 140 150
Fertile Grassland 117 122
Infertile Grassland 124 130
Moorland Grass Mosaic 190 199
Heath and Bog 273 294
Tall Grass and Herb 115 120
Crops and Weeds 117 112
81
Countryside Survey Soils Report from 2007
4 Total nitrogen and CN
d) Great Britain ndash Loss on Ignition category
LOI category () Mean CN ratio
Direction of
significant changes
1998 2007 1998 - 2007
Mineral (0-8) 117 116
Humus-mineral (8-30) 134 142
Organo-mineral (30-60) 194 204
Organic (60-100) 266 278
433 Change in mean total nitrogen concentration in soils (0-15 cm) across England
Total N concentration was measured only on the Main Plots within the original 256 squares sampled in 1978
giving a maximum potential sample number of 1281 of which 1024 were sampled in 2007 and 1110 in 1998
For this reason sample numbers decline rapidly in country-level data analysis A minimum cut-off of 20
samples was applied for country-level analysis of total N concentration by Broad Habitat AVC and LOI
Category As a result there are several gaps in the results Missing data are denoted by a horizontal line
across the cell in the table
There was a relatively small (115) but significant decrease in soil N concentration across the All Broad
Habitats category in England between 1998 and 2007 (Table 44a) Arable soils (0-15 cm) contained the
lowest soil N concentrations in England in 1998 (027 N) and 2007 (025 N) and there was a small (7)
but significant decrease between the two surveys Soil N concentrations in soils (0-15 cm) beneath Improved
Grassland and Neutral Grassland in England were very similar in 2007 ( asymp 048 N) and a significant
decrease in concentration was observed in the latter between 1998 and 2007 (Table 44a) No significant
changes were observed in N concentrations in soils (0-15 cm) beneath Broadleaved Mixed and Yew
Woodland and Acid Grassland in England between 1998 and 2007 There were insufficient samples to make
a valid estimate of the mean and change in N concentration in soils (0-15 cm) in the remaining Broad
Habitats in England
Total N density was lowest in the Arable Broad Habitat (4 4 tha) and highest in Improved Grassland (61
tha) these figures were very similar to the data for these Broad Habitats across GB (Table 42a)
There were significant decreases in soil N concentration in Fertile Grassland and Infertile Grassland AVCs in
England between 1998 and 2007 (Table 44b) Of the AVCs with sufficient data to provide a valid estimate of
the mean the highest concentrations in 1998 and 2007 were measured in soils (0-15 cm) beneath Moorland
Grass Mosaic (109 N) The highest total N density was measured in Infertile Grassland AVC (61 tha)
whilst Upland Woodland and Crops and Weeds jointly had the lowest total N density (43 tha)
Restricting the analysis to plots where AVC remained unchanged resulted in only three AVCs having
sufficient samples for statistically valid estimates of the mean (Table 44c) Infertile Grassland was the only
AVC showing a significant reduction in mean soil N concentration between 1998 and 2007 Mean values for
Fertile Grassland and Crops and Weeds for the unchanged dataset were very similar to those for the dataset
as a whole
There was small (asymp10) but significant decrease in soil N concentration in mineral and humus-mineral soils
in England between 1998 and 2007 (Table 44d) Organo-mineral soils did not change significantly between
the surveys and there were insufficient data to provide valid estimates for organic soils in England The
lowest total N density was observed in mineral soils (45 tha) and humus-mineral soils contained the most
total N (67 tha)
82
Countryside Survey Soils Report from 2007
4 Total Nitrogen and CN
Table 44 Change between 1998 and 2007 in N concentration of soils (0-15 cm) and total N density of soils (0-15
cm) in 2007 for England for a) Broad Habitats b) Aggregate Vegetation Classes (AVC) c) AVCs unchanged since
1978 and d) LOI categories Arrows denote a significant change (plt005) in the direction shown Diagonal line
indicates too few samples to provide reliable estimate
a) England ndash Broad Habitat
Broad Habitats Mean Total Nitrogen ( dry wt soil)
Direction of
significant changes
Total Nitrogen
density (tha)
1998 2007 1998 - 2007 2007
Broadleaved Mixed and
Yew Woodland
064 058 56
Coniferous Woodland
Arable and Horticulture 027 025 44
Improved Grassland 047 045 61
Neutral Grassland 052 046 59
Acid Grassland 110 092 54
Bracken
Dwarf Shrub Heath
Fen Marsh and Swamp
Bog
All Habitat Types 052 046 53
b) England ndash AVC whole dataset
Aggregate Vegetation
Class
Mean Total Nitrogen ( dry wt soil) Direction of
significant changes
Total Nitrogen
density (tha)
1998 2007 1998 - 2007 2007
Upland Woodland 106 089 43
Lowland Woodland 061 060 53
Fertile Grassland 045 039 59
Infertile Grassland 056 051 61
Moorland Grass Mosaic 109 109 58
Heath and Bog
Tall Grass and Herb 036 037 49
Crops and Weeds 027 025 43
c) England ndash AVC unchanged
Aggregate Vegetation
Class
Mean Total Nitrogen ( dry wt soil) Direction of
significant changes
Total Nitrogen
density (tha)
1998 2007 1998 - 2007 2007
Upland Woodland
Lowland Woodland
Fertile Grassland 049 045
Infertile Grassland 060 055
Moorland Grass Mosaic
Heath and Bog
Tall Grass and Herb
Crops and Weeds 025 024
83
Countryside Survey Soils Report from 2007
4 Total nitrogen and CN
d) England ndash Loss on Ignition category
LOI category () Mean Total Nitrogen ( dry wt soil)
Direction of
significant changes
Total Nitrogen
density (tha)
1998 2007 1998 - 2007 2007
Mineral (0-8) 029 026 45
Humus-mineral (8-30) 062 056 67
Organo-mineral (30-60) 145 110 63
Organic (60-100)
434 Change in mean total nitrogen concentration in soils (0-15 cm) across Scotland
In Scotland there was a small (11) but significant decline in soil N concentration for the All Broad Habitats
category (Table 45a) between 1998 and 2007 Significant decreases in N concentration in soils (0-15 cm)
were also observed in Coniferous Woodland Acid Grassland Dwarf Shrub Heath and Bog Broad Habitats
but there were no significant changes in soil N concentration in Broadleaf Woodland Arable Improved
Grassland and Neutral Grassland Improved Grassland contained the most total N (52 tha) and Coniferous
Woodland had the lowest total N density (37 tha) The figure for Coniferous Woodland is comparable with
that for GB but Improved Grassland in Scotland contains 08 tha less total N compared to GB
Infertile Grassland and Heath and Bog AVCs all showed a significant decrease in total N concentration
between 1998 and 2007 (Table 45b) There were no significant changes in Upland Woodland Moorland
Grass Mosaic Fertile Grassland or Crops and Weeds The latter contained the smallest soil N concentrations
in 1998 and 2007 (024 N and 023 N respectively) whilst the highest mean concentrations were
measured in Heath and Bog (148 N in 2007) Despite the high mean soil (0 -15 cm) N Heath and Bog
had the lowest total N density (36 tha) reflecting the relatively low bulk density of organic -rich soils Infertile
Grassland contained the largest quantity of soil (0 -15 cm) N (52 tha)
Restricting the analysis to unchanged AVCs removed the Crops and Weeds AVC but for the other AVCs the
results were consistent with those for the dataset as a whole (Table 45c)
Table 45 Change between 1998 and 2007 in N concentration of soils (0-15 cm) and total N density of soils (0-15
cm) in 2007 for Scotland for a) Broad Habitats b) Aggregate Vegetat ion Classes (AVC) c) AVCs unchanged since
1978 and d) LOI categories Arrows denote a significant change (plt005) in the direction shown Diagonal line
indicates too few samples to provide reliable value
a) Scotland ndash Broad Habitat
Broad Habitats Mean Total Nitrogen ( dry wt soil)
Direction of
significant changes
Total Nitrogen
density (tha)
1998 2007 1998 - 2007 2007
Broadleaved Mixed and
Yew Woodland
081 076 40
Coniferous Woodland 111 092 37
Arable and Horticulture 026 026 41
Improved Grassland 045 043 52
Neutral Grassland 052 046 49
Acid Grassland 163 134 46
Bracken
Dwarf Shrub Heath 134 117 42
84
Countryside Survey Soils Report from 2007
4 Total Nitrogen and CN
Fen Marsh and Swamp
Bog 178 158 38
All Habitat Types 112 100 43
b) Scotland ndash AVC whole dataset
Aggregate Vegetation
Class
Mean Total Nitrogen ( dry wt soil) Direction of
significant changes
Total Nitrogen
density (tha)
1998 2007 1998 - 2007 2007
Upland Woodland 082 070 38
Lowland Woodland
Fertile Grassland 040 037 51
Infertile Grassland 064 054 52
Moorland Grass Mosaic 127 112 45
Heath and Bog 172 148 36
Tall Grass and Herb
Crops and Weeds 024 023 42
c) Scotland ndash AVC unchanged
Aggregate Vegetation
Class
Mean Total Nitrogen ( dry wt soil) Direction of
significant changes
Total Nitrogen
density (tha)
1998 2007 1998 - 2007 2007
Upland Woodland 086 075
Lowland Woodland
Fertile Grassland 044 041
Infertile Grassland 063 052
Moorland Grass Mosaic 143 124
Heath and Bog 172 153
Tall Grass and Herb
Crops and Weeds
d) Scotland ndash Loss on Ignition category
LOI category () Mean Total Nitrogen ( dry wt soil)
Direction of
significant changes
Total Nitrogen
density (tha)
1998 2007 1998 - 2007 2007
Mineral (0-8) 027 025 39
Humus-mineral (8-30) 058 053 50
Organo-mineral (30-60) 144 111 45
Organic (60-100) 189 178 36
There was no significant change in soil N concentration of mineral and humus-mineral soils in Scotland
between 1998 and 2007 (Table 45d) Soil N concentration decreased significantly by over 20 in organo-
mineral soils but there was a much smaller (6) significant decrease in organic soils between 1998 and
2007 The highest soil N concentrations in 1998 and 2007 were observed in organic soils (189 N and 178
N respectively) these had the lowest total N density in 2007 (36 tha) Humus-mineral soils contained the
most N (50 tha) in Scotland
85
Countryside Survey Soils Report from 2007
4 Total nitrogen and CN
435 Change in mean total nitrogen concentration in soils (0-15 cm) across Wales
The small number of samples from Wales placed a major restriction on data analysis with only seven
reporting categories having sufficient data to report valid statistics for status and change in soil N
concentration (Table 46) There was no significant change in soil N concentration across Wales as a whole
between 1998 and 2007 (Table 46a) Improved Grassland was the only Broad Habitat to have sufficient data
to provide stock and change statistics in Wales and this showed no significant change in soil N concentration
between 1998 and 2007 Total N density in Improved Grassland in Wales in 2007 (72 tha) was relatively
high compared with other countries and with GB as a whole For Wales as a whole total N density was 61
tha in 2007 which was a comparatively high figure and reflected the pre-dominance in Wales of samples
from Improved Grassland (43 of samples) and the virtual absence of samples from Broad Habitats with
more organic-rich soils which have a lower total N density
Infertile Grassland and Fertile Grassland were the only AVCs in Wales to have sufficient sample points to
provide valid statistics for stock and change (Tables 46 b and 46c) Mean concentrations of total N did not
change significantly between 1998 and 2007 in either AVC The largest total N density was measured in
Fertile Grassland (75 tha) this was the highest value for this AVC of all three countries Restricting the
dataset to unchanged AVCs (Table 46c) reduced the number of reporting categories to Infertile Grass land
and mean soil N concentration did not change between 1998 and 2007
There were no significant changes in mean soil N concentrations in mineral and humus -mineral soils in Wales
between 1998 and 2007 (Table 46d) These were the only soil LOI categories to have sufficient samples to
report status and change Total N densities in 2007 in mineral and humus-mineral soils were 53 tha and 64
tha respectively
Table 46 Change between 1998 and 2007 in N concentration of soils (0-15 cm) and total N density of soils (0-15
cm) in 2007 for Wales for a) Broad Habitats b) Aggregate Vegetation Classes (AVC) c) AVCs unchanged since
1978 and d) LOI categories Absence of arrows denote no significant change (plt005) were observed Diagonal
line indicates too few samples to provide reliable value
a) Wales ndash Broad Habitat
Broad Habitats Mean Total Nitrogen ( dry wt soil)
Direction of
significant changes
Total Nitrogen
density (tha)
1998 2007 1998 - 2007 2007
Broadleaved Mixed and
Yew Woodland
Coniferous Woodland
Arable and Horticulture
Improved Grassland 057 057 72
Neutral Grassland
Acid Grassland
Bracken
Dwarf Shrub Heath
Fen Marsh and Swamp
Bog
All Habitat Types 074 070 61
86
Countryside Survey Soils Report from 2007
4 Total Nitrogen and CN
b) Wales ndash AVC whole dataset
Aggregate Vegetation
Class
Mean Total Nitrogen ( dry wt soil) Direction of
significant changes
Total Nitrogen
density (tha)
1998 2007 1998 - 2007 2007
Upland Woodland
Lowland Woodland
Fertile Grassland 054 056 75
Infertile Grassland 056 055 61
Moorland Grass Mosaic
Heath and Bog
Tall Grass and Herb
Crops and Weeds
c) Wales ndash AVC unchanged
Aggregate Vegetation
Class
Mean Total Nitrogen ( dry wt soil) Direction of
significant changes
Total Nitrogen
density (tha)
1998 2007 1998 - 2007 2007
Upland Woodland
Lowland Woodland
Fertile Grassland
Infertile Grassland 051 051
Moorland Grass Mosaic
Heath and Bog
Tall Grass and Herb
Crops and Weeds
d) Wales ndash Loss on Ignition category
LOI category () Mean Total Nitrogen ( dry wt soil)
Direction of
significant changes
Total Nitrogen
density (tha)
1998 2007 1998 - 2007 2007
Mineral (0-8) 035 035 53
Humus-mineral (8-30) 061 059 64
Organo-mineral (30-60)
Organic (60-100)
87
Countryside Survey Soils Report from 2007
4 Total nitrogen and CN
44 Discussion and Policy Implications
The policy question which led to the inclusion of this parameter in the CS in 2007 was ldquoCan the
eutrophication trend in the countryside be detected in the soil as well as the vegetation using this basic soil
propertyrdquo As there were no significant increases in mean soil N concentration in any reporting category in
GB or in the individual countries between 1998 and 2007 the conclusion must be a negative Instead
significant decreases in soil N concentration were detected for many reporting categories The decreases for
woodlands and semi-natural habitats were generally small (5-10 of 1998 levels) with a maximum of 21 in
Coniferous Woodland In intensively managed soils the question of in terest although not specified would
have been ldquoCan the decline in fertiliser use in improved grassland and cropland be detected in the soil using
this basic soil property ldquo There is not as clear evidence for this as might have been expected with no
change or a small decline (4-7 of 1998 levels) observed
For semi-natural and woodland systems the results imply that sustained levels of atmospheric N deposition
over the decade from 1998 to 2007 have not resulted in measurable increases in soil (0 -15 cm) N
concentration as expected Average inputs across GB are ca 20 kgNhayr which is equivalent to 018tNha
This translates to a potential increase of ca 3-4 in soil nitrogen concentrations (0-15cm) In contrast to the
expected increase in soil N concentration there was a significant decline in many habitats The trend for
increased CN ratios (significant for Coniferous Woodland and Neutral Grassland) indicates that there is
either increased removal of N from the soil by vegetation leaching or gas eous pathways and or greater
inputs and storage of C due to increased plant productivity Change in plant fixation of C and uptake of N
may be driven by the combined and possibly interactive effects of N deposition and climate change on plant
productivity No significant increase in soil (0-15cm) carbon density was observed for any semi-natural
habitat or woodland (Chapter 2) although there were positive trends observed for Acid Grassland Dwarf
Shrub Heath and Bog (Table 25)
For managed grasslands the overall trend is not clear Whilst there was no change over this period in soil (0 -
15cm) nitrogen concentrations for Improved Grassland Broad Habitat there was a significant decline for the
Fertile Grassland AVC for GB No significant change in CN was o bserved for either category The relatively
small signal observed is unexpected as fertiliser application rates to grassland declined dramatically by asymp
40 to 65 kgNha between 1998 and 2007 (BSFP 2008) Taking England as an example combined land use
and fertiliser statistics showed a reduction in total use of N fertilisers between 1998 and 2007 of 33 for
grassland The grassland statistic for England combined the effects of a reduction in application rate (by
c40) and a small (12) increase in land area under grassland (June Agricultural Census data for 1998 and
2007) This result could imply either that livestock farmers are using alternative sour ces of N such as farm
yard manure slurries and other organic waste products to maintain N levels in managed grassland soils or
soil (0-15 cm) N is an insensitive indicator of soil response to changes in fertiliser use
For cropped systems a decline in N and CN ratios was observed suggesting the loss of soil C (0 -15cm)
reported in Chapter 2 is matched by a loss of N (9 and 75 respectively between 1998 and 2007) As there
was only a small decline in N fertiliser application rates to tilled land acro ss GB between 1998 and 2007 (eg
in England 6 drop for tilled land) it is most likely that processes which would remove C and N in equal
proportions may be responsible eg erosion or deep ploughing resulting in lower soil horizons characterised
by lower CN coming to the surface
441 Policy implications
In semi-natural systems the decline in N is contrary to expectations due to the ongoing input of N
atmospheric deposition across the GB landscape at an average of ca 20-30kgNhayr (RoTAP 2010) There
may be either increased removal of N from the soil by vegetation leaching or gaseous pathways and or
greater inputs and storage of C due to increased plant productivity Increased loss of N is known to be linked
to N inputs although evidence for this is currently limited for GB (RoTAP 2010) Change in plant uptake of C
88
Countryside Survey Soils Report from 2007
4 Total Nitrogen and CN
and N may be driven by the combined and possible interactive effects of N deposition and climate change on
plant productivity Increased plant productivity is one of the primary dri vers of vegetation composition change
in semi-natural systems (NEGTAP 2001 RoTAP 2010) This apparent bdquodilution‟ of the N signal in the soil
may also have major implications for current soil and pollution monitoring programmes which rely on the
gross soil measurements such as N and CN to indicate the impact of N deposition in semi -natural systems
A more sensitive indicator of plant available-N such as Mineralisable-N (Chapter 5) may need to be
combined with plant productivity and vegetation composition change in the future Ongoing analysis will help
resolve the links between the changes in the C and N storage rates and the possible underlying drivers
In improved grassland systems the lack of any clear decline in N despite a major reduction in N fe rtiliser
use over the same period suggests farmers are using alternative sources of N such as slurry and other
organic waste solids and or that N is an insensitive indicator of change in fertiliser use If indeed farmers
are continuing to maintain total soil N concentrations in managed grassland whilst reducing use of mineral N
fertiliser this would be a positive outcome as the energy costs associated with mineral fertiliser use will have
been reduced without detriment to soil N status Fertiliser use is one of the indicators used by Defra to gauge
progress in reducing the environmental cost of the food chain under the Sustainable Farming and Food
Strategy N fertiliser has been chosen because N contributes to diffuse pollution and fertiliser production has
a high energy cost However there is a risk that the maintenance of soil N status possibly through other
sources of N may limit the intended benefits of reduced fertiliser use for diffuse pollution control
In cropped soils the loss of soil C (0-15cm) reported in Chapter 2 combined with the reported decline in soil
N concentrations here suggest erosion deep ploughing or increased decomposition may be responsible for
the 7-9 reduction for C and N as there is little change in fertiliser application rates This suggests that
policies in place to protect soils in cropped system may not be adequate
45 References
BSFP 2008 The British Survey of Fertiliser Practice Report for 2008 httpwwwdefragovuk
Emmett BA Frogbrook ZL Chamberlain PM Griffiths R Pickup R Poskitt J Reynolds B Rowe
E Spurgeon D Rowland P Wilson J and Wood CM 2008 CS Technical Report No 307 Soils
Manual NERCCentre for Ecology amp Hydrology 180 pp (CEH Project Number C03259)
Haines-Young RH Barr CJ Black HIJ Briggs DL Bunce RGH Clarke RT Cooper A Dawson
FH Firbank LG Fuller RM Furse MT Gillespie MK Hill R Hornung M Howard DC McCann
T Morecroft MD Petit S Sier ARJ Smart SM Smith GM Stott AP Stuart RC and Watkins
JW 2000 Accounting for nature assessing habitats in the UK countryside Department of the Environment
Transport and the Regions Centre for Ecology and Hydrology 134pp
Smith J Smith P Wattenbach M Zaehle S Hiederer R Jones RJA Montanarella L Rounsevell
MDA Reginster I Ewert F 2005 Projected changes in mineral soil carbon of European croplands and
grasslands 1990-2080 Global Change Biology 11 2141 ndash 2152
89
Countryside Survey Soils Report from 2007
5 Mineralisable-N
Summary
Mineralisable-N stock (kgN ha) in soil (0-15cm) was a sensitive indicator of recognised differences
in nitrogen availability between different vegetation types suggesting it is a promising indicator of
eutrophication of the countryside
Initial investigations testing the link between mineralisable-N and occurrence of plant species in 45
test sites suggests it provides additional information to mean total nitrogen concentration data
(N) possibly linked to short term changes in nitrogen availability or specific vegetation or soil
types
There were strong geographical trends in the proportion of mineralised-N transformed to the mobile
form nitrate which suggest a close relationship to broad-scale climatic or soil parameters
Future analyses will separate out the inherent variability associated with climate vegetation and
soil type to identify spatial patterns which can be linked to atmospheric deposition and changes in
management
51 Policy background
Policy question Can the trend of eutrophication of the countryside be detected in the soil as well as the vegetation using this sensitive soil process method
Measurements Concentrations of ammonium- and nitrate-N in soil (0-15cm) after a standard incubation The
measurement was carried out for the first time in 2007 Soils were collected from plots included in the original
1978 survey Countryside Survey (CS) in 2007 has provided
Whole GB and country-level assessment of soil mineralisable N status in 2007
Explanatory data to contribute to the analysis of other CS datasets such as those describing changes in plant species composition
Data likely to decrease uncertainty in model chains used to predict impacts of N deposition on biodiversity
Changes in plant species composition observed following CS in 1998 have been ascribed to eutrophication
following increased deposition of atmospheric nitrogen (N) compounds (Braithwaite et al 2006 Maskell et al
2010) This eutrophication is unlikely to be closely linked to changes in soil total N and total CN since the
soil N stock is large in relation to annual fluxes and contains much N that is not available to plants The
purpose of the measurement of mineralisable N within CS in 2007 is to develop a simple but robust index of
plant-available N This will help determine causal drivers of change in species composition by linking
measures of soil N status with plant species composition across a wide range of Broad Habitats
geographical locations and soil types Mineralisable N measurements will also be used to improve models of
soil biogeochemistry used at national scale to predict carbon (C) and N cycling and the effects of N pollution
on biodiversity The data will also be useful in identifying one aspect of nutrient cycling at a national scale
between different habitats and the relationship to different drivers Nutrient cycling is one of the ecosystem
supporting services currently under review as part of the National Ecosystem Assessment
Several types of analyses have been proposed to measure plant -available N including measurements of net
N mineralisation flux gross mineralisation flux and proxies such as near-infra-red absorption analysis
Plants are able to take up N even from soils with no net mineralisation flux (eg Dyck et al 1987) due to
interception of available N before it can be re-immobilised Such temporarily-available N pools can be
measured using isotopic dilution or by adsorption onto strong ion-exchange resins but these measurements
probably overestimate plant-available N (Fierer et al 2001) While net mineralisation measurements
90
Countryside Survey Soils Report from 2007
5 Mineralisable-N
underestimate plant-available N in low-N systems particularly where plants take up a substantial proportion
of N in dissolved organic form net N mineralisation remains useful to distinguish soils across a range of N
availability (Schimel and Bennett 2004)
Plant species may vary in their preference for dissolved organic reduced or oxidised N (Miller and Bowman
2003) species typical of infertile habitats are more likely to use dissolved organic N whereas species typical
of fertile habitats are more likely to be adapted for nitrate assimilation Thus while mineralisable N is an index
of plant available-N the two concepts do not correspond directly since some plants use dissolved organic N
directly and also since plants exert some contro l over mineralisation and therefore N availability within the
rhizosphere The relative availability of ammonium and nitrate may be more important than gross fluxes for
explaining species occurrence (Bengtson et al 2006) A measure of net nitrification during incubation was
also included to assess whether this distinguished soil types more clearly and to provide extra information for
plant species occurrence models
Policy decisions concerned with the abatement o f atmospheric emissions of sulphur dioxide and oxidised and
reduced forms of N are currently informed through the critical load approach The general definition of the
critical load is ldquoa quantitative estimate of an exposure to one or more pollutants belo w which significant
harmful effects on specified sensitive elements of the environment do not occur according to present
knowledgerdquo (UNECE 2004) Critical loads for N are calculated using either empirical or steady-state mass
balance approaches (UNECE 2004) Empirical approaches rely on data from experiments with critical loads
for each habitat agreed by consensus at an EUUNECE level However neither of these approaches allows a
timescale of changes to be identified and so dynamic models are being developed to improve forecasting of
both soil and plant species change Hitherto soil total N and total C have been used as the abiotic indicators
of N availability that link biogeochemical and floristic parts of these models These bulk measures only
explain around 60 of the variation in mean Ellenberg N (a floristic indicator of eutrophication) Abiotic
measurement of N status are thought to be the major source of uncertainty in such model chains (Wamelink
et al 2002) A more sensitive measurement of available N is required to provide a better indication of
excessive N deposition and a more accurate predictor of floristic change and improve the accuracy of model
chains used to develop policy in relation to the UNECE process
52 Methods
521 Proof of concept
Net mineralisation flux has generally been measured by comparing the amounts of extractable nitrate and
ammonium before and after a period of incubation using paired soil samples eg (Keeney 1980 Waring and
Bremner 1964) Soil disturbance can change mineralisation and immobilisation rates so methods that keep
the core intact are preferred (Raison et al 1987) However the established method may be unsuitable for
large surveys in which the transit of cores to the laboratory cannot be completely contro lled since
mineralisation in transit is likely to lead to large variation in mineral N contents on arrival at the laboratory
which inevitably increases error in the calculation of net flux For this reason a new method was developed
during the CS in 2007 pilot study in which soils were flushed through with approximately four pore -volumes
of an artificial rain solution to remove any accumulation of mineral N during transit
Water tension during incubation affects the mineralisation rate and nitrification and denitrification fluxes and
hence the ratio of ammonium to nitrate Measuring water tension is time -consuming and so calculating the
amount of water that needs to be added or evaporated to reach a particular proportion of water -holding
capacity for a given soil is not straightforward Instead water tension was standardised to approximately that
at field capacity by applying suction to the saturated soil to drain the larger pores
A pilot study showed that the new mineralisable N measurement greatly improved the prediction of floristic
composition as represented by mean Ellenberg N score (Rowe et al in prep) The method was applied to a
large set of cores taken in CS in 2007 A full description of the m ethod is given in the CS in 2007 Soils
91
Countryside Survey Soils Report from 2007
5 Mineralisable-N
Manual (Emmett et al 2008) Three of the five Main Plots were selected for analysis at random from each of
the original 256 CS squares Access restrictions to some of the CS plots prevented collection of some c ores
and 699 of the planned 768 analyses were carried out
Three metrics were chosen to express measurements of mineral N ie ammonium and nitrate contents The
total mineral N per g soil reflects availability to plants but gives the impression of lar ge available N contents
in organic sols with low bulk density Total mineral N per g organic matter may provide a better index of N
availability since large carbon contents are likely to inhibit the net release of mineral N from organic matter
Nitrate content after incubation is a measure of net nitrification (since N is initially released from organic
matter in reduced forms) To separate this signal from that of overall quantity of mineral N nitrate -N content
was expressed as a proportion of total mineral N
The rationale for including mineralisable N within the CS measurement suite is summarised in Table 51
Table 51 Summary of rationale for measurement of soil mineralisable nitrogen within CS in 2007
Issue Facts Comments History in CS No measurements previously
made Better measure of plant-available N than total or soluble N
Country level reporting No Dataset confined to 1978 CS squares which limits the power of analysis for Country level reporting for habitat vegetation and soil types stratifications
Links and compatibility to other monitoring programmes
No known datasets at national scale
Linked to N storage and turnover hence to water quality and floristic monitoring eg Environmental Change Network
Uniqueness of CS No known datasets at national scale
Only integrated sample which can be linked to vegetation and land management
Value for money (Policy priority or interpretative value x cost)
Medium High policy and interpretative value medium cost
522 Analytical method
An extra soil core was taken in 2007 in addition to those taken in previous surveys for mineralisable N analyses A 15 cm long by 5 cm diameter plastic pipe was knocked into the ground to obtain this core according to the detailed field protocol set out in (Emmett et al 2008 Chapter 1) Once extracted and logged the long white cores were returned by mail to CEH Bangor Cores were stored at 4
oC until a
sufficient number had been received for an analytical batch
The lab protocol is set out in detail in (Emmett et al 2008) In short the plastic sampling pipe was split open
and the intact soil core laid on a perforated rack The core was misted repeatedly with a solution with the
same concentrations of major ions as UK rain in 2007 as estimate d using the FRAME model (except with
zero N concentrations) until approximately 150 ml solution had passed through Suction was applied using a
vacuum line to drain larger pores of solution The core was wrapped in a thin plastic bag to restrict aeration
and incubated for four weeks at 10 oC After the full 4 week incubation period the core was carefully
homogenised and a subsample extracted using a 1-molar solution of potassium chloride (KCl) for analysis of
ammonium and nitrate content Mineralisable N was expressed in mg N kg dry soil
92
Countryside Survey Soils Report from 2007
5 Mineralisable-N
523 Quality assurance
Replicate cores were not available but replicate subsamples were taken after incubation for KCl extraction and analysis from two cores per batch of approximately 30 samples Two standard re ference soils (CEH Bangor Reference Soils 1 and 2) were also analysed per batch Several steps were taken to minimise potential artefacts by standardising sample collection flushing incubation and analysis Initial mineral contents were standardised by f lushing with a minus-N solution A standard amount of solution was passed through each core This took less time for coarse -textured soils than for fine clay and peat soils To standardise temperature conditions during the flushing step all cores were retained in the flushing room at 4
oC for the same length of time
Incubation took place under standard conditions of temperature and aeration and for a standard time
The duplicate analyses undertaken on replicate subsamples were very consistent for nitr ate (R2 = 98 ) but
not as good for ammonium (R2 = 63 ) (Fig 51) Since duplicate samples were only separated during
subsampling after incubation the likely cause of this inconsistency was the incomplete homogenisation of
cores before subsampling The effect was worse for ammonium presumably due to localised production of
ammonium in anaerobic microsites together with lower rates of diffusion for ammonium ions than for the more
weakly-adsorbed nitrate ions
Figure 51 Consistency of ammonium and nitrate analyses between duplicate subsamples
NO3
0
001
002
003
004
005
0 001 002 003 004 005
Duplicate 1 nitrate concentration mg NO3-N
g dry soil
Du
plicate
1 n
itra
te c
on
cen
trati
on
mg
NO
3-N
g
dry
so
il
NH4
0
001
002
003
004
005
0 001 002 003 004 005
Duplicate 2 ammonium concentration mg
NH4-N g dry soil
Du
plicate
1 a
mm
on
ium
co
ncen
trati
on
m
g N
H4-N
g
dry
so
il
Analyses of reference samples showed some variation between batches but there was no evidence of systematic bias (Fig 52) The coefficient of variation (cv) for nitrate was somewhat greater for the low -N BS2 standard (15) than for the high-N BS1 standard (9) The cv for ammonium was similar (12) for the low-N and high-N standards
93
Countryside Survey Soils Report from 2007
5 Mineralisable-N
Figure 52 Nitrate (a amp c) and ammonium (b amp d) contents in high-N (BS1 a amp b) and low-N (BS2 c amp d)
reference soils included with sample batches during CS in 2007 mineralisable N analyses
a) b)
BS1 NO3-N
0
50
100
150
200
250
300
350
400
17607 6807 25907 141107 3108 22208
Date
BS1 NH4-N
0
50
100
150
200
250
17607 6807 25907 141107 3108 22208
Date
c) d)
BS2 NO3-N
0
1
2
3
4
5
6
17607 6807 25907 141107 3108 22208
Date
BS2 NH4-N
0
5
10
15
20
25
30
35
40
45
50
17607 6807 25907 141107 3108 22208
Date
Taken overall the QC data suggest that nitrate-N and total mineral N are more consistent than ammonium -N
524 Reporting
Soil mineralisable N data have been analysed to provide information on the state of mineralisable N in 2007
The data in this Report describe mineralisable N concentration in 2007 in dry soil and in soil organic matter
mineralisable N stock (ie amount per hectare) and nitrate proportion of mineralisable N (all measured in
soil from 0-15 cm depth) categorised by Broad Habitat Aggregate Vegetation Class (AVC) and soil type (LOI
class) Concentrations in organic matter were obtained using the primary loss -on-ignition value recorded for
the plot in 2007 ie from a core taken adjacent to the core used for mineralisable N analyses In summary
reporting categories are defined as
Broad Habitat - The Broad Habitat classification consists of 27 habitats which account for the entire
land surface of Great Britain and the surrounding sea Countryside Survey reports on soils for 10
major terrestrial habitats
Aggregate Vegetation Class (AVC) ndash is a high level grouping of vegetation types produced from a
quantitative hierarchical classification of the different plant species found in the original Countryside
Survey sample plots Loss on ignition (LOI) category ndash soil type based on soil organic matter content defined as mineral (0 -
8 LOI 0-44 g C kg-1
) humus-mineral (8 ndash 30 LOI 44-165 g C kg-1
) organo-mineral (30 ndash 60
LOI 165-330 g C kg-1
) and organic (60 ndash 100 gt 330 g C kg-1
)
94
Countryside Survey Soils Report from 2007
5 Mineralisable-N
Mineralisable N was not measured in previous surveys so no results regarding change can be presented
Log-transformed data were analysed by REML using the mixed models procedure of SAS (SAS Institute
2006) Back-transformed means and standard errors are presented Significant results relate to statistical
significance with their ecological and policy relevance highlighted where appropriate More details can be
found in Emmett et al (2008) Annex F
The data for mineralisable N concentration in soil and in organic matter and for nitrate proportions were
mapped using kriging to interpolate between the Countryside Survey sample points Routine checking of data
for outliers was conducted and the working dataset was transformed using a normal score procedure to
obtain a Gaussian distribution The data were then interpolated on a 1km UK grid using ordinary kriging and
finally the kriged data were back-transformed to produce interpolated maps In addition sequential Gaussian
simulation (SGs) was conducted on the data to obtain the E-type estimate (mean) and the spatial uncertainty
for the data (conditional variance) The coefficient of variation CV (standard devia tion mean) is reported
53 Results
531 Total mineralisable N concentration in soil
The log-average concentration of mineralisable N measured across all British soils was 102 mg N kg dry soil The distributions of mineralisable N concentration by Broad Habitat AVC and LOI class are shown in Fig 53 The greatest concentrations were found in the Lowland Woodland AVC and the aggregation by Broad Habitat suggests that concentrations were high in both Coniferous and BroadleafMixedYew Woodland Similar concentrations were found in the Fertile Grassland and Infertile Grassland AVCs but the greater disaggregation in the Broad Habitat data allows a difference between infertile grassland types to be distinguished with lower concentrations of minera lisable N in Neutral Grassland than in Acid Grassland (P lt 005) There was a clear increase in mineralisable N concentration with the organic matter content of the soil as illustrated by the differences in mean concentration among loss -on-ignition classes
Mean mineralisable N concentrations across all habitat types were not significantly different among England Scotland and Wales Where more than 20 mineralisable N analyses were available for a Broad Habitat within a country mean concentrations were derived (Table 52) Comparisons across countries are only possible for a limited set of Broad Habitats Mineralisable N concentrations were similar ( P gt 005) in England and Scotland for Arable and Horticulture and for Neutral Grassland Concentrations i n Improved Grassland were similar in all three countries
95
Countryside Survey Soils Report from 2007
5 Mineralisable-N
Figure 53 Mean (+- one standard error) mineralisable nitrogen concentration (mg per kg dry soil) in soil (0 -15
cm depth) within a) Broad Habitats b) Aggregate Vegetation Classes and c) Soil Loss-on-ignition categories
across Britain Analyses were on log-transformed data means and error bars back-transformed to the original
scale
a) Broad Habitats b) Aggregate Vegetation Classes
c) LOI categories
96
Countryside Survey Soils Report from 2007
5 Mineralisable-N
Table 52 Mineralisable N concentrations (mg N kg dry soil) in soils (0-15 cm depth) across all habitats and in
selected Broad Habitats in England Scotland and Wales
a) England
Mean total mineralisable N (mg N kg dry
soil)
Broad Habitat 2007
Broadleaved Mixed and Yew Woodland 160
Arable and Horticulture 83
Improved Grassland 101
Neutral Grassland 69
All habitat types 98
b) Scotland
Mean total mineralisable N (mg N kg dry
soil)
Broad Habitat 2007
Coniferous Woodland 127
Arable and Horticulture 108
Improved Grassland 101
Neutral Grassland 85
Acid Grassland 113
Dwarf Shrub Heath 76
Bog 115
All habitat types 104
c) Wales
Mean total mineralisable N (mg N kg dry
soil)
Broad Habitat 2007
Improved Grassland 100
All habitat types 112
97
Countryside Survey Soils Report from 2007
5 Mineralisable-N
532 Total mineralisable N concentration in soil organic matter
The log-average concentration of mineralisable N in organic matter measured across all British soils was 76 mg N kg loss-on-ignition The distributions of mineralisable N concentration in soil organic matter by Broad Habitat Aggregate Vegetation Class and soil loss -on-ignition class are shown in Figure 54 Differences in mineralisable N concentration in organic matter among Broad Habitats Aggregate Vegetation Classes and loss-on-ignition categories are clearly distinguishable compared with differences in concentrations in soil (Fig 54) Mineralisable N concentration in organic matter was greater in habitats with fertiliser inputs andor fast litter turnover (eg Broadleaved Mixed and Yew Woodland and Arable and Horticulture Broad Habitats or Lowland Woodland and Crops and Weeds AVCs) than in habitats receiving little or no fertiliser input and with impeded litter turnover (eg Dwarf Shrub Heath and Bog Broad Habitats or the Heath and Bog AVC) This measurement distinguished mineralisable N concentrations in organic matter in different grassland AVCs with greater concentrations in Fertile Grassland than in Infertile Grassland In contrast to concentration in dry soil the Neutral Grassland Broad Habitat had greater concentrations of mineralisable N in organic matter than did Acid Grassland (P lt 001) Concentrations in organic matter in Neutral Grassland and Improved Grassland Broad Habitats were similar (P gt 001)
Figure 54 Mean (+- one standard error) mineralisable nitrogen concentration in soil organic matter (mg N kg
loss-on-ignition) in soils (0-15 cm depth) within a) Broad Habitats b) Aggregate Vegetation Classes and c) Soil
Loss-on-ignition categories across Britain Analyses were on log-transformed data means and error bars back-
transformed to the original scale
a) Broad Habitats b) Aggregate Vegetation Classes c) LOI categories
98
Countryside Survey Soils Report from 2007
5 Mineralisable-N
Mean mineralisable N concentrations in organic matter across all habitat types were lower in Wales than in England (P lt 005) and lower in Scotland than in Wales (P lt 005) Where more than 20 mineralisable N analyses were available for a Broad Habitat within a country mean conce ntrations were derived (Table 53) Comparisons across countries are only possible for a limited set of Broad Habitats As with concentrations in soil mineralisable N concentrations in organic matter were similar ( P gt 005) in England and Scotland for Arable and Horticulture and for Neutral Grassland and concentrations in Improved Grassland were similar (P gt 005) in all three countries
Table 53 Mineralisable N concentrations in soil organic matter (mg kg loss-on-ignition) in soils (0-15 cm
depth) across all habitats and in selected Broad Habitats in England Scotland and Wales
a) England
Mean total mineralisable N (mg N kg loss-
on-ignition)
Broad Habitat 2007
Broadleaved Mixed and Yew Woodland 1491
Arable and Horticulture 1893
Improved Grassland 1181
Neutral Grassland 860
All habitat types 1265
b) Scotland
Mean total mineralisable N (mg N kg loss-
on-ignition)
Broad Habitat 2007
Dwarf Shrub Heath 156
Bog 160
Coniferous Woodland 580
Arable and Horticulture 1974
Improved Grassland 1214
Neutral Grassland 1007
Acid Grassland 275
All habitat types 412
c) Wales
Mean total mineralisable N (mg N kg loss-
on-ignition)
Broad Habitat 2007
Improved Grassland 1105
All habitat types 914
99
Countryside Survey Soils Report from 2007
5 Mineralisable-N
533 Total mineralisable N stock
The log-average mineralisable N stock measured across all British soils was 88 kg ha
-1 in 0-15 cm depth
soil The distributions mineralisable N stock by Broad Habitat Aggregate Vegetation Class and soil loss -on-ignition class are shown in Figure 55 The measurement distinguished soils and habitats that are considered fertile from those considered infertile more clearly than mineralisable N concentrations in soil and arguably more clearly than mineralisable N concentrations in soil organic matter Broad Habitats such as Arable and Horticulture and Improved Grassland had consistently large mineralisable N stocks and Bog and Dwarf Shrub Heath had consistently large stocks but the stocks in Fen Marsh and Swamp Broad Habitats were more variable Coniferous and Broadleaf Mixed and Yew Woodland Broad Habitats had similar mineralisable N stocks but the Lowland Woodland AVC had significantly greater stocks than the Upland Woodland AVC Mineralisable N stocks were similar in the 0-8 and 8-30 loss-on-ignition categories but smaller in the 30-60 loss-on-ignition category (P lt 005) and still smaller in the 60-100 loss-on-ignition category (P lt 005)
Figure 55 Mean (+- one standard error) stock of total mineralisable nitrogen (kg N ha-1) in the top 15 cm of
soil within a) Broad Habitats b) Aggregate Vegetation Classes and c) Soil Loss -on-ignition categories across
Britain
a) Broad Habitats b) Aggregate Vegetation Classes c) LOI categories
Mean mineralisable N stocks in 0-15 cm depth soil across all habitat types were lower in Scotland than in England or Wales (P lt 005) Where more than 20 mineralisable N analyses were available for a Broad Habitat within a country mean concentrations were derived (Table 54) As with concentrations in soil and in
100
Countryside Survey Soils Report from 2007
5 Mineralisable-N
soil organic matter mineralisable N stocks were similar (P gt 005) in England and Scotland for Arable and Horticulture and for Neutral Grassland and stocks in Improved Grassland were simi lar (P gt 005) in all three countries Table 54 Mean (+- one standard error) stock of total mineralisable nitrogen (kg N ha-1) in the top 15 cm of soil
across all habitats and in selected Broad Habitats in England Scotland and Wales
a) England
Mean total mineralisable N stock
(kg N ha in 0-15 cm soil)
Broad Habitat 2007
Broadleaved Mixed and Yew Woodland 187
Arable and Horticulture 153
Improved Grassland 146
Neutral Grassland 101
All habitat types 137
b) Scotland
Mean total mineralisable N stock
(kg N ha in 0-15 cm soil)
Broad Habitat 2007
Coniferous Woodland 72
Arable and Horticulture 172
Improved Grassland 143
Neutral Grassland 111
Acid Grassland 39
Dwarf Shrub Heath 26
Bog 22
All habitat types 52
c) Wales
Mean total mineralisable N stock
(kg N ha in 0-15 cm soil)
Broad Habitat 2007
Improved Grassland 140
All habitat types 114
534 Nitrate proportion of mineralisable N
The mean proportion of nitrate in total mineralisable N measured across all British soils was 052 g NO3-N g
-1
total mineralisable N and there was considerable variation in nitrate proportion among Broad Habitats Aggregate Vegetation Classes and soil loss-on-ignition classes (Fig 56) There was no overall correlation of nitrate proportion with mineral N concentration in soil (P gt 005) but nitrate proportion was correlated with mineral N concentration in soil organic matter (c = 039 P lt 005) The pattern of mean nitrate proportion among vegetation and soil classes was similar to the pattern of mineral N concentration in soil organic
101
Countryside Survey Soils Report from 2007
5 Mineralisable-N
matter with the greatest proportions of nitrate in the Arable and Horticulture Broad Habitat and the Crops and Weeds AVC and small nitrate proportions in less fertile habitats such as B og Acid Grassland and Dwarf Shrub Heath The nitrate proportion could also be clearly related to soil organic matter content with the lowest nitrate proportion in the soil category with greatest loss -on-ignition
Figure 56 Mean (+- one standard error) nitrate proportion of total mineralisable nitrogen in soils (0 -15 cm
depth) within a) Broad Habitats b) Aggregate Vegetation Classes and c) Soil Loss -on-ignition categories
across Britain
a) Broad Habitats b) Aggregate Vegetation Classes c) LOI categories
Mean nitrate proportions across all habitat types were similar in England and Wales ( P gt 005) and lower in Scotland than in either country (P lt 005) (Table 55) Where more than 20 mineralisable N analyses were available for a Broad Habitat within a country mean concentrations were derived Comparisons across countries are only possible for a limited set of Broad Habitats As with total mineralisable N concentrations in soil and in organic matter nitrate proportions were similar (P gt 005) in England and Scotland for Arable and Horticulture and for Neutral Grassland and nitrate proportions in Improved Grassland were similar ( P gt 005) in all three countries
102
Countryside Survey Soils Report from 2007
5 Mineralisable-N
Table 55 Nitrate proportion of total mineralisable nitrogen in soils (0-15 cm depth) across all habitats and in
selected Broad Habitats in England Scotland and Wales
a) England
Mean nitrate proportion of mineralisable N
Broad Habitat 2007
Broadleaved Mixed and Yew Woodland 067
Arable and Horticulture 087
Improved Grassland 068
Neutral Grassland 054
All habitat types 069
b) Scotland
Mean nitrate proportion of mineralisable N
Broad Habitat 2007
Coniferous Woodland 030
Arable and Horticulture 088
Improved Grassland 060
Neutral Grassland 050
Acid Grassland 011
Dwarf Shrub Heath 031
Bog 019
All habitat types 037
c) Wales
Mean nitrate proportion of mineralisable N
Broad Habitat 2007
Improved Grassland 057
All habitat types 057
535 Spatial distributions of measured properties
High concentrations of mineralisable N in soil were found in several areas of Britain (Fig 571a amp b) This pattern is difficult to interpret but is perhaps due to the combined effects of greater organic matter conte nts in some areas (and hence a greater total N pool some of which is available for mineralisation) and a history of greater N deposition in the same or other areas By contrast high concentrations of mineralisable N in organic matter (Fig 572a amp b) appear more related to management practices and concentrations of N deposition in particular in areas with more mineral soils There was less small-scale variation in the proportion of nitrate in mineralisable N (Fig 573a amp b) with low proportions in the north and west of Scotland and greater proportions in eastern Britain in particular in central England suggesting links to spatial drivers at large scale such as soil moisture deficit soil pH andor N fertiliser application rate
103
Countryside Survey Soils Report from 2007
5 Mineralisable-N
Figure 57 Maps of a) kriged values and b) coefficients of variation for 1) total mineralisable N (mg N kg-1
soil)
2) total mineralisable N concentration in organic matter (mg N kg-1
loss-on-ignition) and 3) nitrate proportion of
total mineralisable N
a) b)
1)
2)
3)
104
Countryside Survey Soils Report from 2007
5 Mineralisable-N
536 Mineralisable N as an indicator of floristic change
To assess the effectiveness of mineralisable N data as an indicator of eutrophication it will be necessary to analyse the data in relation to other soil measurements and species occurrence data which is beyond the scope of this report Some results are presented here from a pilot study conducted in 2006 as a trial of the mineralisable N method for CS in 2007 All UK plant species have been assigned ldquoEllenberg Nrdquo scores which indicate whether they are likely to occur on high- or low-fertility sites A key test of potential soil indicators of eutrophication is whether they are associated with mean Ellenberg N score A PCA plot of results from the pilot study (Fig 58) demonstrates clearly that mean Ellenberg N is most closely associated with bulk soil properties ndash for example the vector for Ellenberg N has a small angle with NC ratio The position of the NC ratio vector opposite that for moisture shows that these are strongly b ut inversely related This reflects the overall tendency for low-fertility plant communities to occur on organic soils with low NC ratios and high moisture contents The explanatory power of mineralisable N is also considerable as shown by the length of this vector and its position shows that the variation explained by mineralisable N is orthogonal to that explained by total soil NC In other words mineralisable N describes variation in mean Ellenberg N that is not explained by bulk soil properties implying that it is detecting a shorter -term enrichment signal or different soil or vegetation types This is borne out by the considerable increase in proportion of the variance in Ellenberg N that is explained by moving from a regression model using only m oisture content (R
2 = 50) to a
model using both moisture content and mineralisable N (R2 = 70) (Rowe et al in prep Emmett et al 2008)
Figure 58 Ordination of measurements from the Countryside Survey pilot study in 2006 on first and second
principal components of the variation EllenbergN = mean fertility indicator score for plant species present
Nminpot = total N mineralised during a four-week incubation NC = total soil N total soil C pH = soil pH in
water Moisture = g water g-1
fresh soil
-03 -02 -01 00 01 02 03
-03
-02
-01
00
01
02
03
PC1
PC
2
1
2
3
4
5
6
7
8
9
10
11
12
13
14
15
16
17
18
19
20
21
22
2324
25
26
27
28
29
30
31
32
33
34
35
36 37
38
39
40
4142
4344
45
-5 0 5
-50
5
EllenbergN
Nminpot
NC
pH
Moisture
105
Countryside Survey Soils Report from 2007
5 Mineralisable-N
54 Discussion
Net N mineralisation and nitrification result directly in increased exposure of plants to N and increased N
leaching so the mineralisable N results are indicators of N pollution pressure in the sense of a direct cause
of loss of biodiversity and of water quality The results also provide indicators of the state of the soil
ecosystem in that net N mineralisation is likely to increase as the capacity of the soil organic matter pool to
buffer N pollution is depleted These indicators wil l be useful to discriminate which components of the loss of
biodiversity and water quality are due to N pollution The results will also be used to improve understanding
of soil and vegetation processes in particular habitats and improve models of water q uality and biodiversity
change Measurements at a single point in time do not allow direct assessments of change in mineralisable N
or nitrate proportion but a repetition of the measurements would provide evidence for increased damage or
recovery from N pollution The measurements also enable some assessment of nutrient cycling in different
ecosystems as required for the National Ecosystem Assessment It should be noted that an increase in
mineralisable-N would be considered a negative indicator for semi-natural ecosystems and a positive
indicator for intensively managed productive systems
The different measurements included in CS in 2007 allow a choice of the variable used to express mineralisable N Total mineralisable N concentrations in soil are re lated to the quantity of the substrate so mineralisable N concentration in soil is most clearly related to organic matter content (Fig 53) The high mineralisable N concentrations in soil in the Lowland Woodland AVC may be explained in that Lowland Woodland tends to occur on mineral soils but could also be the result of increased interception of N pollutants by woodland or alternatively a greater proportion of labile N in woodland plant litter Mineralisable N concentration in organic matter is more directly relevant to underlying processes since the N available per unit carbon reflects the value of the organic matter as a source of N for decomposers Indeed this variable appears to more clearly reflect the overall fertility of habitats with large concentrations in the Arable and Horticulture and Improved Grassland Broad Habitats as well as in Broadleaved Mixed and Yew Woodland This reflects the improved quality of the soil organic matter due to fertilisation tillage and presence of crops with high litter quality and confirms the sensitivity of the assay to known differences in soil nitrogen availability for plants In contrast to mineralisable N concentration in soil there was a clear lower concentration in organic matter on more organic soils which reflects the known increase in N limitation as soils become more organic Thus whilst Broad Habitats such as Bog and Dwarf Shrub Heath are associated with high soil organic matter contents they are generally N-limited as this organic matter contains relatively little net mineralisable N
The stock of mineralisable N (ie the amount in a given volume of soil) also clearly reflected the overall
fertility of habitats Unlike concentrations in soil or in soil organic matter which are more relevant for mineral
and organic soils respectively stock is a measure of mineralisable N within a consistent soil volume This
reflects N availability within the rooting zone and so more closely represents plant -available N across a
variety of habitats
To establish evidence of change in mineralisable N and thus of deposition -driven changes in soil processes likely to affect plant species composition it will be necessary to analyse these data in combination with a range of external datasets such as pollutant load grazing pressure climate drivers which may affect the spatial trends observed This work is ongoing and will be reported in the CS Integrated Assessment report later in 2010
The proportion of nitrate in mineralisable N is known to be affected by aer ation during the incubation The
texture of the soil on fine scales (eg clay silt and sand fractions or degree of humification of organic
matter) and medium scales (eg porosity and aggregation) will affect the diffusion of air into the soil core
Both organic and mineral soils can vary considerably in porosity and hence the increase in nitrate proportion
with decreasing organic matter content cannot be clearly related to soil texture effects Nitrification rates may
also indicate the size of the nitr ifying bacteria population and hence greater nitrate proportions may be
related to a history of elevated N inputs The clear spatial effect on nitrate proportion (Fig 56) implies that
large scale drivers affect nitrate proportion more than soil texture which varies at a smaller scale These
106
Countryside Survey Soils Report from 2007
5 Mineralisable-N
large scale drivers may include climate pollutant load soil pH and N fertiliser application rate which all vary
from NW to SE Britain in ways that are consistent with the spatial pattern of nitrate proportion Fur ther
analyses of nitrate proportion in relation to site-specific total N deposition history loads of pollutant and
fertiliser NOx and NHy and soil and habitat properties will provide more insights into the processes governing
nitrate proportion and will be reported in the Integrated Assessment These analyses will also inform whether
nitrate proportion is of value as a pressure or state indicator
As well as aiding the development of understanding and models of biogeochemical processes the
mineralisable N results will be useful to explain patterns of floristic change Results from the CS in 2007 pilot
study indicate that mineralisable N explains changes in plant species composition (specifically mean
Ellenberg N score) that cannot be explained by bulk soil properties such as total N or CN ratio (Fig 57)
This will considerably reduce uncertainty in model chains used by the UNECE -CCE to predict floristic change
resulting from N deposition The result is consistent with the understanding from soil proc ess ecology that a
large and habitat-specific fraction of the soil N pool is effectively inert with plant N supply being governed by
the turnover of the more labile organic matter pools The nitrate proportion in mineralisable N may also be a
useful predictor of floristic change (Diekmann and Falkengren-Grerup 1998) for example because plants
typical of lower-fertility habitats are not adapted for nitrate uptake
In conclusion the new measurements of mineralisable N provide a wealth of information useful for
developing science and policy around the ecosystem impacts of N pollution The measurements define a
fraction of the soil N pool that is available to be taken up by plants efficiently andor leached and thus
provide a sensitive indicator of N pollution and ecosystem saturation Soils buffer N pollution particularly
when CN ratios are high and there are large stocks of labile C so N pollutant loads cannot be directly
related to impacts relevant to water quality and biodiversity conservation objectives The measurements will
provide test data for biophysical models of soil change and will also allow improved paramet erisation of
models predicting plant species occurrence and biodiversity change Mineralisable N measurements will
decrease uncertainty associated with linking these two classes of models and thus improve predictions of
biodiversity responses to N pollutant load Future analyses will separate out the inherent variability
associated with climate vegetation and soil type to identify spatial patterns which can be linked to
atmospheric deposition and changes in management
55 Policy Implications
The new national scale mineralisable N measurements will allow
Separation of the effects of N pollution on biodiversity and water quality from effects of other drivers
Assessment of the relative impact of N deposition on different soils and habitats
Improved forecasts of changes in water quality and biodiversity in relation to N deposition rate for use in calculating critical loads under the UNECE Convention on Long -Range Transboundary Air Pollution (CLRTAP)
107
Countryside Survey Soils Report from 2007
5 Mineralisable-N
56 References
Bengtson P Falkengren-Grerup U Bengtsson G 2006 Spatial distributions of plants and gross N
transformation rates in a forest soil Journal of Ecology 94 754-764
Braithwaite ME Ellis RW Preston CD 2006 Change in the British Flora 1987-2004 Botanical Society
of the British Isles
Diekmann M Falkengren-Grerup U 1998 A new species index for forest vascular plants development of
functional indices based on mineralization rates of various forms of soil nitrogen Journal of Ecology 86 269-
283
Dyck W Mees C Hodgkiss P 1987 Nitrogen availability and comparison to uptake in two New Zealand
Pinus radiata forests New Zealand Journal of Forest Science 17 338ndash352
Emmett BA Frogbrook ZL Chamberlain PM Griffiths R Pickup R Poskitt J Reynolds B Rowe
E Spurgeon D Rowland P Wilson J Wood CM 2008 CS Technical Report No 307 Soils Manual
NERCCentre for Ecology amp Hydrology 180 pp (CEH Project Number C03259)
Fierer N Schimel J Cates R Zou J 2001 The influence of balsam poplar tannin fractions on carbon
and nitrogen dynamics in Alaskan taiga floodplain soils Soil Biology and Biochemistry 33 1827ndash1839
Keeney DR 1980 Prediction of soil nitrogen availability in forest ecosy stems a review Forest Science
26 159-171
Maskell LC Smart SM Bullock JM Thompson K Stevens CJ 2010 Nitrogen deposition causes
widespread loss of species richness in British habitats Global Change Biology 16 671ndash679
Miller AE Bowman WD 2003 Alpine plants show species-level differences in the uptake of organic and
inorganic nitrogen Plant and Soil 250 283-292
Raison RJ Connell MJ Khanna PK 1987 Methodology for studying fluxes of soil mineral -N in situ
Soil Biology amp Biochemistry 19 521-530
Rowe EC Emmett BA Smart SM Frogbrook ZL in prep A single -extraction mineralisable nitrogen
assay improves predictions of floristic composition Journal of Vegetation Science
SAS Institute 2006 SAS Enterprise Guide 41
Schimel JP Bennett J 2004 Nitrogen mineralization Challenges of a changing paradigm Ecology 85
591-602
UNECE 2004 The condition of forests in Europe 2004 executive report 51 pp
Wamelink GWW Joosten V van Dobben HF Berendse F 2002 Validity of Ellenberg indicator values
judged from physico-chemical field measurements Journal of Vegetation Science 13 269-278
Waring SA Bremner JM 1964 Ammonium production in soil under waterlogged con ditions as an index of
nitrogen availability Nature 104 951-952
108
Countryside Survey Soils Report from 2007
6 Olsen-P
Summary
Mean Olsen-P concentrations in soil (0-15cm) is an index of the fertility of agricultural soils It‟s
use and relevance in semi-natural and organic soils is less certain Soils collected during
Countryside Survey in 1998 and 2007 indicated there had been a significant decrease in Olsen -P
concentrations in soil (0-15cm) in most Broad Habitats or Aggregate Vegetation Classes across
Great Britain and within individual countries
Olsen-P concentrations in soil (0-15cm) decreased significantly in all soil organic matter categories
across Great Britain and within individual countries between 1998 and 2007 apart from humus -
mineral soils in Scotland where no change was observed
The data do not confirm a trend of increasing P status in intensive grasslands or any other habitat
soils (0-15cm) but indicate a loss of available phosphorus between 1998 and 2007 across a wide
range of habitats and soil types This is likely to be linked to the large reductions in phosphorus
fertiliser use over the same period
61 Introduction
Key question Can the trend of increasing P status in intensive grasslands be confirmed and is it matched in
other habitats
Measurements Repeat measurement of Olsen-P concentrations in soils (0-15 cm) from all plots sampled in
1998
Olsen-P (Olsen et al 1954) has been widely used in England and Wales to assess the fertility of agricultural
soils (MAFF 2000) It was also measured as an integral part of several natio nal soil monitoring schemes
including the Representative Soil Sampling Scheme (RSSS Archer et al 2003) the National Soil Inventory
(NSI McGrath and Loveland 1992) the Environmental Change Network (ECN Morecroft et al 2009) and the
Soil Geochemical Atlas of Northern Ireland (Emmett et al 2008) Olsen-P has also been used in conjunction
with the phosphorus sorption index to provide an index of the leaching risk of dissolved P from soils to
freshwaters (Hughes et al 2001) In the UK Olsen-P has been recommended as an indicator for
environmental interactions between the soil and other linked ecosystems such as freshwaters (Black et al
2008)
Olsen-P was measured in soils taken from the 256 bdquosoil squares‟ during CS in 1998 but the samples were not
analysed until 2002 or reported in the Monitoring and Assessing Soil Quality (MASQ) report (Black et al
2000) although they are held on the CS databaseThe data were not included in the Defra funded study
which examined the comparability of soil properties measured by different surveys and monitoring schemes
where it was erroneously reported that total -P was measured in CS in 1998 (Bradley et al 2003)
611 Choice of Olsen-P in 2007
A wide range of extractants have been used to measure the more soluble weakly bound or bdquoavailable‟ forms
of phosphorus in soils Some of the more commonly used extractants include 1 citric acid 25 acetic
acid dilute buffered sulphuric acid (Truog‟s reagent) acetic acid -sodium acetate buffer (Morgan‟s reagent)
and sodium bicarbonate buffered at pH 85 (Olsen-P) There has been a long standing debate as to the most
appropriate measure of soil available-P in relation to soil type Olsen-P has been favoured for limed fertilised
agricultural soils and semi-natural ecosystems on base rich or circum-neutral soils whilst acid extractions are
considered to be more appropriate for the more acidic soils found in many semi -natural and woodland
ecosystems Numerous studies have compared the performance of the different test s with each other with
plant response and with other factors (see eg Allen 1989 Foy et al 1997 and discussion in Emmett et al
109
Countryside Survey Soils Report from 2007
6 Olsen-P
2008) The evidence so far from these and other studies reported in the literature suggests that it is unlikely
that a simple robust relationship can be established between Olsen-P and other extractants A study
comparing Olsen-P data from two different surveys the Representative Soil Sampling Scheme (RSSS) and
the National Soil Inventory (NSI) concluded that where the same analytical method had been used the data
for phosphorus were entirely comparable (Bradley et al 2003)
The literature indicates that no one extractant is ideal for use across the range of soil fertility and pH
gradients encountered in Countryside Survey Thus one option considered for CS in 2007 was to use more
than one extractant with the choice being determined by the characteristics of each soil sample For example
an acid extractant for semi-natural acidic low fertility soils and Olsen-P for more base-rich fertile soils This
would have made the data very hard to interpret particularly in relation to changes since CS in 1998 and for
those soils with bdquointermediate‟ characteristics where the choice of extractant was not clear Furthermore to
maximise the use of pre-existing 1998 data it would be hard to justify using another extractant even though
Olsen-P might not be ideal across the range of soil conditions encountered in Countryside Survey Bearing
these factors in mind the decision was made to measure Olsen-P in 2007
612 Deliverables for 2007
CS in 2007 has provided the following deliverables
Whole GB and country-level assessment of soil available-P status in 2007
GB-level assessment of change in soil available-P status between Countryside Survey in 1998 and
Countryside Survey in 2007
Explanatory data to contribute to the analysis of other Countryside Survey datasets such as those
describing changes in vegetation species and the trophic status of freshwaters
The Olsen-P data collected in 2007 can also contribute to the assessment of Broad and Priority Habitat
condition in relation to soil fertility and the data will provide a baseline assessment for a recommended UK
soil indicator The rationale for including Olsen-P within the Countryside Survey measurement suite is
summarised in Table 61
Table 61 Rationale for measurement Olsen-P
Issue Facts Comments
History in Countryside Survey Olsen-P measured on samples from 256 squares in CS in 1998
Olsen-P used as a measure of available-P
Links and compatibility to other monitoring programmes
NSI and RSSS used Olsen-P as a measure of available-P to the same depth (0-15 cm) as Countryside Survey
Defra project SP0515 concluded that measurements were comparable between NSI and RSSS
Uniqueness of CS There was a partial resurvey of the NSI in 2003 RSSS has data reported to 2001 Soil pH was measured at many ECN sites in 1998 and 2003 Unique combination of soil vegetation amp land use measured together
High interpretative value for i) terrestrial vegetation species change in response to fertility in combination with soil nitrogen ii) trophic status of linked freshwaters
Value for money (Policy priority or interpretative value X cost)
Recommended UK soil indicator for environmental interaction cheap simple measurement High value for money
Measurement will be made on bdquoblack core‟ soil sample used for pH amp LOI core measurements
110
Countryside Survey Soils Report from 2007
6 Olsen-P
So far measures of soil available-P have not been included in models exploring the relationships between
vegetation species change recorded in CS in 1998 and soil nitrogen enrichment through atmospheric nitrogen
deposition However soil-P data are likely to have strong interpretative power in the analysis of model
simulations and predictions
62 Methods
The soil used for phosphorus analysis was taken from the bdquoblack core‟ and there were n o specific sampling
requirements beyond those normally employed for collecting the bdquoblack core‟ sample (See Chapter 1 amp
Emmett et al 2008 Annex 1)
A total of 1054 black cores were collected from the 5 Main Plots in the original 256 ldquosoilrdquo squares Air -dried
and sieved samples (lt2 mm) were analysed for Olsen-P at CEH in Lancaster in the autumn of 2008 following
the standard operating procedure (Emmett et al 2008) This involved extraction of 5 g of air-dried sieved
soil with 100 ml of 05M sodium bicarbonate at pH 85 The phosphorus in the extract was determined
colorimetrically using a continuous flow analyser The analyser method used molybdenum blue at 880nm with
the addition of a dialysis step to overcome the effect of the Olsen‟s reagent
Olsen-P is expressed in mgPkg dry soil Samples collected from 1998 were analysed in 2002 and those
from 2007 in 2008
621 Quality Assurance and Quality Control
The DefraNERCBBSRC Joint Codes of Practice were followed
A number of factors can contribute to errors in the analysis of Olsen -P and steps were taken to minimise
potential artefacts
Effect of drying ndash drying soil affects the release of phosphorus with enhancements of up to 30 possible
from drying at 40 ordmC (Jackson 1958) The effect varies with soil type (Allen 1989) If field moist soil is
used larger quantities are recommended for the extraction (10 g to 100 ml for mineral soil and up to 25 g
to 100 ml for peats Allen 1989) Methodological consistency is very important Since the Olsen -P
measurements made on 1998 soils used air -dried soils the same procedure was used in 2007
Extraction temperature ndash the extraction is temperature sensitive and must be performed under constant
temperature conditions Extraction procedure and conditions were matched to those used for the analysis
of 1998 soils
Soilsolution ratio and extraction time ndash these may affect the amount of phosphorus extracted and a
consistent method should be employed The same standard operating procedure was used in 1998 and
2007
Effect of organic matter ndash the high pH of the Olsen-P extraction means that some organic matter is also
extracted Organic phosphorus is not measured by the molybenum blue method The wavelength used for
the molybdenum blue determination (880 nm) is a long way from any likely interference effects from
extracted humic acids
111
Countryside Survey Soils Report from 2007
6 Olsen-P
A replicate analysis two standard reference soils and one certified reference soil were ana lysed per batch of
25 samples The same standard reference soils were used in the analysis of samples from 1998 and 2007
providing a check on the consistency of the analyses between the two surveys
The results from the standard reference soils are summarised in Fig 61 Fig 62 and Table 62 For SR2
and SR3 the data show the expected variation around the mean value (Fig 61) A simple t-test showed that
the mean value of SR2 in 2008 (146 mgPkg) was significantly higher (plt0001) compared to the mean in
2002 (128 mgP kg) there was no significant difference between the mean values for SR3 Fewer values
outside the limits on the Shewhart charts and smaller coefficients of variation (Table 62) indicate that the
results for both standard reference soi ls were more consistent in 2008 compared to 2002
Figure 61 Shewhart Quality Control charts for CEH standard reference soils SR2 and SR3 analysed
with sample batches from CS in 1998 and 2007
SR3 - QC chartMean 184 mgP kg
-1 limits +- 2SD of mean
0
5
10
15
20
25
30
M11
675
M11
726
M11
735
M11
755
M11
799
M11
807
M11
813
M11
814
M12
269
EF67
1
EE71
6
EE85
2
EE86
0
EF00
1
EF77
0
Analytical batch number
Ols
en
-P m
gP
kg
-1
CS2000 data CS2007 data Mean Upper limit Lower limit
SR2 - QC chartMean 137 mgP kg
-1 limits +- 2SD of mean
0
5
10
15
20
25
30
M11
675
M11
726
M11
735
M11
755
M11
800
M11
808
M11
813
M11
841
M12
174
EF22
1
EE71
4
EE85
0
EE85
8
EE86
6
EF00
7
EF79
4
Analytical batch number
Ols
en
-P m
gP
kg
-1
CS2000 data CS2007 data Mean Upper limit Lower limit
1998
2007
1998
2000
112
Countryside Survey Soils Report from 2007
6 Olsen-P
Table 62 Mean values (mgPkg) and coefficients of variation (CV ) for the standard reference soils
analysed with samples from CS in 1998 and 2007
Standard reference soil SR2 SR3 ISE921
Mean 1998 (CV) 128 (24) 186 (17) 1055 (10)
Mean 2007 (CV) 146 (13) 177 (13) 1208 (2)
The mean and median values for the standard reference soil (Fig 62) are those obtained from data
submitted by all the laboratories participating in the scheme Unfortunately there is a limited stock of this
material at CEH Lancaster so that only four samples were analysed with the 2008 batches The Shewhart
chart (Fig 62) shows some expected variation but 84 of the points lie within the limit values The four
points at the end of the chart were produced during the 2008 analyses and are within the range of results
obtained in 2002 The 2008 mean value is somewhat higher (Table 62) but as only four samples of ISE921
were analysed with the 2008 batches this result must be interpreted with care
Figure 62 Shewhart QC chart for ISE standard reference soil ISE921 analysed with sample batches
from CS in 1998 and Countryside Survey 2007
The duplicate analyses undertaken within sample batches in 2002 and 2008 were very consistent with most
points falling on or close to the 11 line (Fig 63) The mean difference between duplicates was small in 2002
(-01 mgP g) and 2008 (06 mgPkg) Differences between duplicates were larger for samples with high
concentrations of Olsen-P
Taken overall the Quality Control data show strong consistency within and between the measurements made
in 2002 and 2008 and give little cause for concern regarding a comparison of Olsen -P data from 1998 and
2007 There is a suggestion that the results for the standard reference soils were m ore consistent in 2008
with higher mean values The values obtained in 2008 generally fall within the range measured in 2002 and
within acceptable limits on the Shewhart charts
ISE921 - QC chartISE median value 104 mgP kg
-1 Mean 107 mgP kg
-1 limits +- 2SD of mean
60
70
80
90
100
110
120
130
140
M11
678
M11
724R
M11
736
M11
750
M11
755
M11
776
M11
799
M11
802
M11
806
M11
737
M11
814
M11
776R
M11
816
M11
831
M11
867
M12
227
M12
269
EF28
9
EE80
3-4
Analytical batch number
Ols
en
-P
mg
P k
g-1
CS2000 CS2007 Median Mean Upper limit Lower limit1998
2007
113
Countryside Survey Soils Report from 2007
6 Olsen-P
Figure 63 Scatter plot of duplicate Olsen-P analyses from sample batches analysed in 2002 and 2008
622 Reporting
Soil Olsen-P data (0-15 cm) have been analysed to provide information on the state of Olsen -P in 2007 and
the change since 1998 The statistical approach used for analysing the data fo r change involved
bootstrapping which allows for non-normality in the data without the necessity of knowing details of the actual
distribution As such it provides a more accurate measurement of significance Annex F of Emmett et al
(2008) provides a background document describing this approach
The data in this report describe mean Olsen-P concentrations in soils (0-15 cm) in 2007 and change since
1998 by Broad Habitat Aggregate Vegetation Class (AVC) and Loss-on-Ignition (LOI) category LOI classes
are defined as mineral (0-44 g C kg-1
) humus-mineral (44-165 g C kg-1
) organo-mineral (165-330 g C kg-1
)
and organic (gt 330 g C kg-1
) To remove the effects of large-scale vegetation and or land use change mean
Olsen-P concentrations have also been estimated for plots where the AVC has not changed over time The
AVC is only known for the survey years and may change during intervening periods for example due to
arable-grassland rotation The plots where the AVC has not changed can be regarded as plots wh ere the
vegetation has been largely consistent in 1978 1998 and 2007
The soil Olsen-P concentrations were mapped using indicator kriging to interpolate between the Countryside
Survey sample points The use of indicator kriging rather than ordinary krig ing and spatial interpolation
arises because of the type of data being analyzed In the case of Olsen -P the assumption of connectivity
between sample points with extreme values in space is not valid For instance fertilizer applications in one
location may have no spatial link to those in another As a result ordinary kriging incorporating these
extreme values provides erroneous interpolation biased towards these extreme values Indicator kriging
provides a method of spatially interpreting the underlying patterns in the data without such a bias
interpolating the probability that the data falls above or below a given threshold Semi -variogram analysis
revealed a low level of spatial structure strongest at the threshold level of 18mgkg Full indicator k riging
0
40
80
120
160
200
0 40 80 120 160 200
Duplicate 1 Olsen-P mgP kg-1
Du
plicate
2 O
lsen
-P m
gP
kg
-1
CS2000 CS2007 1 1 line 1998
2007
114
Countryside Survey Soils Report from 2007
6 Olsen-P
was used to interpolate the probability of exceeding this threshold A probability of 1 or above indicates that
the data exceeds the specified threshold value at that location Data was interpolated onto a 1 km UK grid
63 Results
631 Structure of Olsen-P data
Olsen-P was measured in samples from 1068 plots in 2007 of which 65 were also sampled in 1998
Concentrations of Olsen-P measured in soils (0-15 cm) in 2007 ranged between 2 and 380 mgPkg Between
1998 and 2007 the proportion of samples containing 40 mgPkg Olsen-P or less increased from 64 to 76
whilst the proportion samples with greater than 80 mgPkg decreased from 12 to 75 Overall there was
evidence of a downward shift in Olsen-P concentrations across the entire range of values between 1998 and
2007 (Fig 64) The population of values in 1998 and 2007 was highly skewed There were no clear
relationships between change in Olsen-P concentration and 2007 values for soil pH LOI moisture content or
change in soil pH and LOI between 1998 and 2007
632 Change in mean Olsen-P concentration in soils (0-15cm) across Great Britain
The mean Olsen-P concentration in soil (0-15cm) across all Broad Habitat types in Great Britain decreased
from 43 mgPkg to 32 mgPkg or by 26 between 1998 and 2007 (Table 63a) This change was evident in
all individual Broad Habitats except Bracken (Fig 65) The magnitude of change varied between Broad
Habitats with the smallest significant decrease (11) measured in Arable which also had the hig hest mean
concentration of Olsen-P in 2007 (44 mgPkg) The biggest percentage decrease between the surveys (58)
occurred in Dwarf Shrub Heath which also contained the highest mean concentration of Olsen -P (56 mgPkg)
in 1998 The lowest mean concentration of Olsen-P (13 mgPkg) which did not change significantly between
surveys was measured in soils (0-15cm) beneath Bracken
There was a significant decrease in mean Olsen-P concentration between 1998 and 2007 across all AVCs
except for Lowland Woodland (Table 63b) The largest percentage decrease in mean values (51) was
observed in Moorland Grass Mosaics Heath and Bog had the highest mean concentration of Olsen -P in 1998
(52 mgPkg) Crops and Weeds showed the smallest percentage change between surve ys in Olsen-P (11)
this AVC had the highest mean Olsen-P concentration in 2007 (44 mgPkg)
115
Countryside Survey Soils Report from 2007
6 Olsen-P
Figure 64 Distribution of soil Olsen-P (0-15 cm) measurements a) Histogram for 1998 and 2007 b)
Cumulative frequency for 1998 and 2007 Histogram frequencies normalised to percentage of total
number of samples analysed in each survey
0
10
20
30
0 40 80 120 160 200 240 280 320 360
Olsen-P mgPkg
Fre
qu
en
cy
1998 2007
a)
0
25
50
75
100
0 50 100 150 200 250 300 350 400
Olsen-P mgPkg
Cu
mu
lati
ve f
req
ue
nc
y
1998 2007
b)
116
Countryside Survey Soils Report from 2007
6 Olsen-P
Table 63 Change in mean Olsen-P concentration of soils (0-15 cm) across Great Britain for a) Broad
Habitats b) Aggregate Vegetation Classes (AVC) c) AVCs unchanged since 1978 and d) LOI
categories Arrows denote a significant change (plt005) in the direction shown
a) Great Britain - Broad Habitat
Broad Habitats
Mean Olsen-P (mgPkg) Direction of significant
changes
1998 2007 1998 - 2007
Broadleaved Mixed and
Yew Woodland
404 238
Coniferous Woodland 364 274
Arable and Horticulture 496 442
Improved Grassland 405 329
Neutral Grassland 306 245
Acid Grassland 464 211
Bracken 173 130
Dwarf Shrub Heath 560 236
Fen Marsh Swamp 275 194
Bog 533 384
All Habitat Types 428 318
b) Great Britain ndash AVC whole dataset
Aggregate Vegetation
Class
Mean Olsen-P (mgPkg) Direction of significant
changes
1998 2007 1998 - 2007
Upland Woodland 296 182
Lowland Woodland 247 295
Fertile Grassland 426 335
Infertile Grassland 301 210
Moorland Grass Mosaic 495 242
Heath and Bog 521 333
Tall Grass and Herb 449 322
Crops and Weeds 494 442
) Great Britain ndash AVC unchanged
Aggregate Vegetation
Class
Mean Olsen-P (mgPkg) Direction of significant
changes
1998 2007 1998 - 2007
Upland Woodland 319 183
Lowland Woodland 206 270
Fertile Grassland 438 347
Infertile Grassland 261 173
Moorland Grass Mosaic 590 267
Heath and Bog 471 318
Tall Grass and Herb 424 294
Crops and Weeds 499 438
117
Countryside Survey Soils Report from 2007
6 Olsen-P
d) Great Britain ndash Loss on Ignition Category
LOI Category () Mean Olsen-P (mgPkg) Direction of significant
changes
1998 2007 1998 - 2007
Mineral (0-8) 405 339
Humus-mineral (8-30) 329 241
Organo-mineral (30-60) 409 194
Organic (60-100) 630 441
The mean Olsen-P concentrations in soils (0-15 cm) for plots in which the AVC did not change (Table 63c)
were broadly consistent with the dataset as a whole (Table 63b) The exception was Tall Grass and Herb
where no significant change in mean Olsen-P was observed for plots with consistent AVCs between surveys
(Table 64b) This suggests that some of the change in Olsen-P observed for this AVC in the dataset as a
whole may have arisen because of a change in land use between the surveys
Figure 65 Change in mean Olsen-P concentration within Broad Habitats in Great Britain between
1998 and 2007
-60
-40
-20
0
20
Bro
adle
aved
Woodla
nd
Conife
rous
Woodla
nd
Ara
ble
Impro
ved G
rass
Neu
tral
Gra
ss
Aci
d Gra
ss
Bra
cken
Dwar
f Shru
b Hea
th
Fen M
arsh
Swam
p
Bog
Ch
an
ge
in
Ols
en
-P (
mg
kg
)
Mean Olsen-P concentrations decreased significantly across all LOI categories (Table 63d) with the largest
change observed in organo-mineral soils where mean Olsen-P declined by nearly 50 In both surveys the
highest mean Olsen-P concentrations were observed in organic soils reflecting the high mean concentrations
measured in Broad Habitats and AVCs with organic -rich soils (Dwarf Shrub Heath and Bog Broad Habitats
Moorland Grass Mosaic and Heath and Bog AVCs
632 Change in mean Olsen-P concentration in soils (0-15cm) across England
Olsen-P was measured only on the Main Plots within the original 256 squares sampled in 1978 giving a
maximum potential sample number of 1281 of which 1068 were sampled in 2007 and 943 in 1998 For this
reason sample numbers decline rapidly in country-level data analysis A minimum cut-off of 20 samples was
applied for country-level analysis of Olsen-P by Broad Habitat AVC and LOI Category As a result there are
several gaps in the analysis missing values in the tables are signifi ed by a diagonal line across the cell
118
Countryside Survey Soils Report from 2007
6 Olsen-P
There was a significant (16) decrease in mean Olsen-P for the All Broad Habitats category in England
between 1998 and 2007 (Table 64) this was the smallest overall change observed amongst the three
countries Arable soils (0-15 cm) contained the highest mean concentrations of Olsen-P in England 1998
(454 mgPkg) and 2007 (418 mgPkg) and there was a small (8) but significant decrease between the two
surveys Mean Olsen-P concentrations in soils (0-15 cm) beneath Improved Grassland and Neutral Grassland
in England were very similar in 2007 (asymp 26 mgPkg) following significant decreases from levels observed in
1998 (Table 64)
Table 64 Change in mean Olsen-P concentration of soils (0-15 cm) across England for a) Broad
Habitats b) Aggregate Vegetation Classes (AVC) c) AVCs unchanged since 1978 and d) LOI
categories Arrows denote a significant change (plt005) in the direction shown Diagonal line
indicates too few samples to provide reliable value
a) England - Broad Habitat
Broad Habitats
Mean Olsen-P (mgPkg) Direction of significant
changes
1998 2007 1998 - 2007
Broadleaved Mixed and
Yew Woodland
338 269
Coniferous Woodland
Arable and Horticulture 454 418
Improved Grassland 332 260
Neutral Grassland 347 263
Acid Grassland 412
Bracken
Dwarf Shrub Heath
Fen Marsh Swamp
Bog
All Habitat Types 396 332
b) England ndash AVC whole dataset
Aggregate Vegetation
Class
Mean Olsen-P (mgPkg) Direction of significant
changes
1998 2007 1998 - 2007
Upland Woodland
Lowland Woodland 248 272
Fertile Grassland 403 320
Infertile Grassland 273 171
Moorland Grass Mosaic
Heath and Bog
Tall Grass and Herb 423 330
Crops and Weeds 454 413
119
Countryside Survey Soils Report from 2007
6 Olsen-P
c) England ndash AVC unchanged
Aggregate Vegetation
Class
Mean Olsen-P (mgPkg) Direction of significant
changes
1998 2007 1998 - 2007
Upland Woodland
Lowland Woodland
Fertile Grassland 401 323
Infertile Grassland 262 156
Moorland Grass Mosaic
Heath and Bog
Tall Grass and Herb
Crops and Weeds 472 427
d) England ndash Loss on Ignition Category
LOI Category () Mean Olsen-P (mgPkg) Direction of significant
changes
1998 2007 1998 - 2007
Mineral (0-8) 394 342
Humus-mineral (8-30) 346 244
Organo-mineral (30-60) 360 239
Organic (60-100)
There were insufficient samples in 2007 in the Acid Grassland Broad Habitat to make a valid estimate of the
mean No significant change was observed in mean Olsen-P beneath Broadleaved Mixed and Yew Woodland
Broad Habitat in England between 1998 and 2007
There were significant decreases in mean Olsen-P in the Fertile Grassland and Infertile Grassland AVCs in
England between 1998 and 2007 (Table 64b) Of the AVCs with sufficient data to provide a valid estimate of
the mean the highest mean concentrations in 1998 and 2007 were observed in Crops and Weeds
Restricting the analysis to plots where AVC remained unchanged resulted in only three AVCs having
sufficient samples for statistically valid estimates of the mean (Table 64c) Mean values for Infertile
Grassland Fertile Grassland and Crops and Weeds for the unchanged dataset were very similar to those for
the dataset as a whole There were significant decreases in mean Olsen -P in Infertile Grassland and Crops
and Weeds between 1998 and 2007 in the unchanged dataset
Mean Olsen-P decreased significantly in all three LOI categories in England between 1998 and 2007 (Table
64d) The smallest change (13) was observed in mineral soils and the largest in organo-mineral soils
(39) As a result in 2007 humus-mineral and organo-mineral soils had virtually the same mean Olsen-P
concentrations (asymp 24 mgPkg) which were approximately 10 mgPkg less than for mineral soils This
represented an increase in the relative difference in mean Olsen -P between mineral soils and the other
categories compared to 1998
633 Change in mean Olsen-P concentration in soils (0-15cm) across Scotland
In 1998 and 2007 Arable and Horticulture (69 mgPkg and 52 mgPkg) and Improved Grassland (59 mgPkg
and 56 mgPkg) Broad Habitats in Scotland had the highest mean Olsen -P concentrations amongst the three
countries There was a 25 decrease in mean Olsen-P in Scottish Arable soils (0-15 cm) between 1998 and
2007 but no significant change was observed for Improved Grassland (Table 65a) There was a significant
120
Countryside Survey Soils Report from 2007
6 Olsen-P
decrease in mean Olsen-P in semi-natural grassland Broad Habitats in Scotland Scottish Broadleaf
Woodland soils (0-15 cm) had a much higher mean Olsen-P value (51 mgPkg) in 1998 compared to England
(34 mgPkg) but too few samples were taken to provide a reliable estimate of the mean for Scotland in 2007
Upland Woodland Infertile Grassland Moorland Grass Mosaic and Heath and Bog AVCs in Scotland all
showed a significant decrease in mean Olsen-P concentration between 1998 and 2007 (Table 65b) There
were no significant changes in Fertile Grassland or Crops and Weeds The latter contained the largest mean
concentration of Olsen-P in 2007 (50 mgPkg) and AVCs in Scotland were more enriched in Olsen -P
compared to the equivalents in England and Wales Restricting the analysis to unchanged AVCs removed th e
Upland Woodland AVC but for other AVCs results were consistent with those for the dataset as a whole
(Table 65c)
Table 65 Change in mean Olsen-P concentration of soils (0-15 cm) across Scotland for a) Broad
Habitats b) Aggregate Vegetation Classes (AVC) c) AVCs unchanged since 1978 and d) LOI
categories Arrows denote a significant change (plt005) in the direction shown Diagonal line
indicates too few samples to provide reliable value
a) Scotland - Broad Habitat
Broad Habitats
Mean Olsen-P (mgPkg) Direction of significant
changes
1998 2007 1998 - 2007
Broadleaved Mixed and
Yew Woodland
509
Coniferous Woodland 399 295
Arable and Horticulture 689 516
Improved Grassland 591 562
Neutral Grassland 284 249
Acid Grassland 486 215
Bracken
Dwarf Shrub Heath 646 249
Fen Marsh Swamp
Bog 544 365
All Habitat Types 491 328
b) Scotland ndash AVC whole dataset
Aggregate Vegetation
Class
Mean Olsen-P (mgPkg) Direction of significant
changes
1998 2007 1998 - 2007
All Woodland
Upland Woodland 290 219
Lowland Woodland
Fertile Grassland 485 404
Infertile Grassland 362 318
Moorland Grass Mosaic 533 228
Heath and Bog 548 339
Tall Grass and Herb
Crops and Weeds 609 495
121
Countryside Survey Soils Report from 2007
6 Olsen-P
c) Scotland ndash AVC unchanged
Aggregate Vegetation
Class
Mean Olsen-P (mgPkg) Direction of significant
changes
1998 2007 1998 - 2007
All Woodland
Upland Woodland
Lowland Woodland
Fertile Grassland 482 422
Infertile Grassland 302 240
Moorland Grass Mosaic 656 289
Heath and Bog 463 295
Tall Grass and Herb
Crops and Weeds
d) Scotland ndash Loss on Ignition Category
LOI Category () Mean Olsen-P (mgPkg) Direction of significant
changes
1998 2007 1998 - 2007
Mineral (0-8) 477 383
Humus-mineral (8-30) 315 262
Organo-mineral (30-60) 442 181
Organic (60-100) 616 406
The mean Olsen-P concentration in Scottish mineral soils decreased significantly between 1998 and 2007
but there was no significant change observed for humus-mineral soils (Table 65d) Organic soils in Scotland
had a very high mean Olsen-P concentration in 1998 (62 mgPkg) which decreased significantly in 2007 to 41
mgPkg Mean Olsen-P concentrations in organo-mineral soils decreased significantly by more than 60
between 1998 and 2007
634 Change in mean Olsen-P concentration in soils (0-15cm) across Wales
The small number of samples from Wales placed a major restriction on data analysis with only four reporting
categories having sufficient data to provide valid statistics for status and change in Olsen -P (Table 66) The
largest percentage change (41) in the All Broad Habitats category was observed in Wales between 1998
and 2007 reflecting the large significant decrease (47) in mean Olsen-P in the Improved Grassland Broad
Habitat Much of the Improved Grassland in Wales is located on humus -mineral soils which largely accounts
for the significant decrease in Olsen-P between 1998 and 2007 Infertile Grassland was the only AVC in
Wales to have sufficient sample points to provide valid statistics for stock and change (Tables 66b and
66c) Mean concentrations of Olsen-P in this AVC decreased significantly between 1998 and 2007 with or
without changed AVC
122
Countryside Survey Soils Report from 2007
6 Olsen-P
Table 66 Change in mean Olsen-P concentration of soils (0-15 cm) across Wales for a) Broad
Habitats b) Aggregate Vegetation Classes (AVC) c) AVCs unchanged since 1978 and d) LOI
categories Arrows denote a significant change (plt005) in the direction shown Diagonal line
indicates too few samples to provide reliable value
a) Wales - Broad Habitat
Broad Habitats
Mean Olsen-P (mgPkg) Direction of significant
changes
1998 2007 1998 - 2007
Broadleaved Mixed and
Yew Woodland
Coniferous Woodland
Arable and Horticulture
Improved Grassland 408 215
Neutral Grassland
Acid Grassland
Bracken
Dwarf Shrub Heath
Fen Marsh Swamp
Bog
All Habitat Types 323 189
b) Wales ndash AVC whole dataset
Aggregate Vegetation
Class
Mean Olsen-P (mgPkg) Direction of significant
changes
1998 2007 1998 - 2007
Upland Woodland
Lowland Woodland
Fertile Grassland
Infertile Grassland 214 143
Moorland Grass Mosaic
Heath and Bog
Tall Grass and Herb
Crops and Weeds
c) Wales ndash AVC unchanged
Aggregate Vegetation
Class
Mean Olsen-P (mgPkg) Direction of significant
changes
1998 2007 1998 - 2007
Upland Woodland
Lowland Woodland
Fertile Grassland
Infertile Grassland 183 116
Moorland Grass Mosaic
Heath and Bog
Tall Grass and Herb
Crops and Weeds
123
Countryside Survey Soils Report from 2007
6 Olsen-P
d) Wales ndash Loss on Ignition Category
LOI Category () Mean Olsen-P (mgPkg) Direction of significant
changes
1998 2007 1998 - 2007
Mineral (0-8)
Humus-mineral (8-30) 309 174
Organo-mineral (30-60)
Organic (60-100)
64 Discussion and Policy Implications
The results from Countryside Survey in 2007 show a significant decrease between 1998 and 2007 in mean
Olsen-P concentrations in soils (0-15 cm) for most Broad Habitats AVCs and LOI categories across Great
Britain Mean Olsen-P has remained unchanged in a few Broad Habitats and AVCs but no increases in mean
Olsen-P have been observed Changes in mean Olsen-P concentrations in Broad Habitats within individual
countries between 1998 and 2007 reflect this pattern
These results raise the question as to whether the changes observed between 1998 and 2007 are real or an
artefact of field sampling and chemical analysis and whether the Countryside Survey data are consistent with
those from other monitoring schemes It is difficult to compare with results from other surveys due to the
common use of mgl for monitoring agricultural soils compared to mgkg in CS
The same sampling protocol was used in 1998 and 2007 but two important potential sou rces of sampling
variability can be identified The first of these arises because of the strong vertical gradient in Olsen-P
concentration encountered in many soils under different vegetation types (see for example Table 67 and
Fig 66) The highest Olsen-P concentrations are generally encountered in the surface soil layers (0 -5 cm)
which must be sampled consistently in repeat surveys if change is to be assessed accurately A consistent
failure to identify and sample the true soil surface layer could sig nificantly bias results between surveys
Table 67 Vertical distribution of Olsen-P (mgPkg) in a) brown earth soil beneath neutral grassland at
the Snowdon ECN site and b) stagnogley soil beneath improved grassland at Pontbren
Snowdon ECN site Pontbren (CEH unpublished data)
Olsen-P mgPkg Olsen-P mgPkg
Depth cm Mean Std Dev Depth cm Mean Std Dev
0-5 274 223 2-5 234 40
5-10 163 112 5-15 104 25
10-20 78 25 15-30 56 26
20-30 53 10 30-60 33 16
124
Countryside Survey Soils Report from 2007
6 Olsen-P
Figure 66 Vertical distribution of Olsen-P (mgPkg) in three blocks of farm woodland on stagnogley
soils at Pontbren (CEH unpublished data)
A second source of error which affects all analytes arises because re -sampling in each Main Plot does not
occur at exactly the same spot The cores in 1998 and 2007 were taken from points located 2 -3 m apart from
permanently marked locations (Chapter 1) This will introduce random variability into the data due to small
scale heterogeneity in soil properties alongside any surveyor error in re-locating the plots The size of the
effect is unknown but is unlikely to have caused systematic bias between the surveys and there is
significantly less potential for relocation error in CS relative to NSI where no permanen t markers are used
The quality of the chemical analyses for 1998 and 2007 has been discussed in Section 621 Taken overall
the Quality Control data show strong consistency within and between the measurements made in 2002 and
2008 and give little cause for concern regarding a comparison of Olsen-P data from 1998 and 2007
Countryside Survey Olsen-P data are broadly consistent with results from other surveys and monitoring sites
(Tables 68 and 69) Fixed depth sampling at the ECN sites does not include 0-15 cm depth but the data
broadly confirm values measured by Countryside Survey The ECN data further illustrate the strong vertical
gradient in Olsen-P concentrations across a range of land use and habitat types
Table 68 Olsen-P concentrations measured in Arable and Improved Grassland in the National Soil
Inventory in 1980 and 1996 from Bradley et al (2003)
Broad Habitat Olsen-P mgPkg
NSI 1980 (0-15 cm)
Olsen-P mgPkg
NSI 1996 (0-15 cm)
Arable 330 428
Improved
Grassland
227 229
00 100 200 300 400 500
2-5
5-15
15-30
30-60
60-90
De
pth
be
low
su
rfa
ce
(c
m)
Olsen-P (mgPkg)
Cae Draens Tyn-y-Fron Pant Powsi
125
Countryside Survey Soils Report from 2007
6 Olsen-P
Table 610 Olsen-P concentrations measured at two depths in soils at selected Environmental Change
Network sites Samples were not collected at 0-15 cm depth at the ECN sites
ECN site name Land use Olsen-P mgPkg
0-5 cm depth
Olsen-P mgPkg
5-10 cm depth
Drayton Permanent pasture 937 416
North Wyke Permanent pasture 673 357
Snowdon Upland grassland 274 163
Wytham Deciduous woodland 227 114
Alice Holt Oak woodland 135 65
Figure 67 Map of probability of 2007 Olsen-P concentration being greater than 18 mgPkg Probability
scale between zero and one
Analysis of the 2007 Olsen-P data revealed very little spatial structure which is reflected in the map which
predicts the probability on exceeding the threshold o f 18mgPkg on a scale from zero to one a value of one
indicating the threshold has been exceeded (Fig 67) Visual inspection of the mapped data for Olsen-P from
the NSI (McGrath and Loveland 1992) showed a broad separation in Olsen -P concentrations between areas
of managed agricultural land in central southern and eastern England and those under semi -natural
vegetation and forest mainly in the north and west Within the areas of managed land there was a wide range
of concentrations with large differences in values between adjacent NSI mapping units Probability maps for
Olsen-P from the RSSS (Baxter et al 2006) show some limited correspondence between the map for the
2001 RSSS data and Countryside Survey It is important to remember the differences in sampling strategy
and survey design when comparing the data from these three surveys but it is generally apparent that there
are no strong spatial patterns in Olsen-P concentrations
126
Countryside Survey Soils Report from 2007
6 Olsen-P
Assuming that the Countryside Survey data from 1998 and 2007 provide va lid estimates of Olsen-P across
Great Britain a number of hypotheses can be invoked to account for the decrease observed over the nine
year period These are briefly discussed below as detailed exploration is beyond the scope of this Report
Reduction in external inputs of phosphorus- Data on fertiliser use compiled as a core indicator
under the Defra Sustainable Farming and Food Strategy showed a 53 decline in the total use of phosphate
fertiliser between 1984 and 2007 in England Across Great Britain application rates of phosphate (P2O5) to
tillage crops decreased from 51 kgha to 32 kgha and to grass from 21 kgha to 14 kgha between 1998 and
2007 (BSFP 2008) The figures for 2007 correspond to the lowest application rates since statistics were firs t
compiled in 1983 and presumably reflect changes in agricultural management in response to environmental
and economic pressures (Baxter et al 2006)
Taking England as an example combining application rates with agricultural land area data from the Jun e
Agricultural Survey showed a large decline in phosphate use Total application of phosphate in England in
2007 was 123 kT P2O5 to tilled land and 48 kT to grassland compared with 209 kT and 72 kT respectively for
1998 Soil phosphorus status in enclosed agricultural land will also be influenced by more subtle changes in
crop and livestock management and by changes in the type of fertiliser used Oliver et al (2006) commenting
on the decrease in Olsen-P observed in the RSSS between 1971 and 2001 attribu ted the decline to a steady
reduction in phosphorus fertiliser inputs but also noted that for grassland there had been a progressive shift
away from insoluble forms of phosphorus fertiliser such as rock phosphate to more water soluble materials
Deeper ploughing will also bring subsoil with a relatively low phosphorus status to the surface This would
dilute the existing topsoil phosphorus stock unless fertiliser was added
The amount of phosphorus deposited annually across Great Britain from the atmospher e is poorly quantified
with a recent estimate for the United Kingdom of 03 kgPhayr (White 2006) Phosphorus concentrations in
rain are low and the main vector is dry deposition of dust As far as can be ascertained there are no data to
describe trends in atmospheric phosphorus inputs to Great Britain over time Use of clean -up technology for
sulphur emissions from coal burning may have led to a decline in phosphorus emissions with a knock on
effect on atmospheric deposition A reduction in mineral ferti liser use would also reduce the amount of
particulate phosphorus in the atmosphere derived from re-suspended soil The quantities of phosphorus
deposited on semi-natural systems are likely to be relatively small but there is little information as to how
they compare to inputs from sources such as mineral weathering
Effect of atmospheric nitrogen deposition- A number of studies have reported that non-
agricultural ecosystems in Great Britain could be moving towards phosphorus limitation in response to
increased availability of nitrogen from atmospheric deposition In moorland vegetation high foliar NP ratios
have been correlated positively with nitrogen deposition (Kirkham 2001) On the Carneddau in Wales
montane heath vegetation had relatively high foliar NP ratios compared with similar systems receiving less
atmospheric nitrogen deposition in Scotland (Britton et al 2005) Both studies have been cited as examples
of potential phosphorus limitation In contrast Rowe et al (2007) reported that foliar NP ratios in Calluna
collected during 1998 decreased with nitrogen deposition They suggested that enzyme production or
mycorrizal activity may have allowed Calluna to access additional soil phosphorus resources In upland
plantation Sitka spruce forests root bioassay techniques have shown increased phosphorus demand in older
crops where excess nitrogen was leached as nitrate in soil and stream waters (Harrison et al 1995) The
authors inferred that supplies of available phosphorus in soils may have lim ited the ability of older trees to
utilise incoming atmospheric nitrogen Phosphorus deficiency has also been reported in Dutch forests
receiving large amounts of nitrogen deposition probably because of soil acidification (Mohren et al 1986)
The overall implication of these studies is that sustained levels of atmospheric nitrogen deposition may have
increased plant demand on soil phosphorus resources In the soil this may have decreased the size of the
labile phosphorus pool (as measured by Olsen-P) at a time when external sources of phosphorus may also
have declined
127
Countryside Survey Soils Report from 2007
6 Olsen-P
Effects of pH change on phosphorus binding capacity in soils ndash The chemistry of
phosphorus in soils is complex and pH dependent through a number of processes related to the clay mineral
content and presence of sesquioxides and exchangeable aluminium in the soil In fertilised alkaline soils or
calcareous soils phosphorus availability is greatest between pH 6 and pH 7 As pH in these soils increases
above about pH 65 phosphate solubility decreases rapidly with the formation of insoluble calcium salts
which contribute to the unavailable or non-labile soil phosphorus pool In acid mineral soils phosphate ions
combine readily with iron and aluminium to form insoluble compounds whilst fixati on by hydrous iron and
aluminium oxides and clay minerals can sequester large amounts of phosphorus As pH increases so does
the solubility of basic iron and aluminium phosphates (solubility minima between pH 3 and 4) and some of the
fixed phosphorus will also be released resulting in a maximum pool of readily available phosphorus at soil
pH values between 6 and 65 (Brady 1974)
Soil pH increased significantly across many Broad Habitats AVCs and soil LOI categories between 1998 and
2007 In the Broad Habitats and AVCs representative of managed agricultural land mean soil pH across
Great Britain was well above pH 6 and was over pH 7 in the Arable and Horticultural Broad Habitat and Crops
and Weeds AVC in 2007 If calcium was abundant in these soils th e high pH values would favour the
formation of insoluble salts and may reduce the pool of more labile phosphorus In many of the Broad
Habitats and AVCs which would typically have more acid mineral soils (eg Acid Grassland Broad Habitat
Moorland Grass Mosaic AVC) soil pH did not increase significantly between 1998 and 2007 and mean
values were typically around pH 45 In this pH range the relatively available pool of soil phosphorus would
still be small compared with that fixed by hydrous oxides of ir on and aluminium or held in precipitates
Sustained atmospheric nitrogen deposition may have increased plant demand on this pool particularly in
systems where grazing or other forms of biomass harvesting result in nutrient removal from the site
65 References
Allen SE (ed) 1989 Chemical analysis of ecological materials Blackwell Scientific Publications Oxford
368 pp
Archer J Oliver M and Baxter S 2003 Review of the Representative Soil Sampling Scheme (RSSS) Final
report to Defra John Archer Consulting and Department of Soil Science University of Reading
Baxter SJ Oliver MA and Archer JR 2006 The Representative Soil Sampling Scheme of England and
Wales the spatial variation of topsoil nutrient status and pH between 1971 and 2001 Soil Use and
Management 22 383-392
Black HIJ et al 2000 MASQ Monitoring and assessing soil quality in Great Britain Countryside Survey
Module 6 Soils and Pollution RampD technical Report E1-063TR Environment Agency Bristol
Black H Bellamy P Creamer R Elston D Emmett B Frogbrook Z Hudson G Jordan C Lark M
Lilly A Marchant B Plum S Potts J Reynolds B Thompson R and Booth P 2008 Design and
operation of a UK soil monitoring network Contract Report Environmental Agency ISBN 978-1-84432-936-
6
Bradley RI Bellamy PH Loveland PJ Black HIJ Hornung M Scott A Lane A Webb J
Jackson DR 2003 Comparability of soil properties derived from different data sources Defra project code
SP0515
Brady NC 1974 The Nature and Properties of Soils 8th
Edition Macmillan Publishing New York
Britton AJ Pearce ISK and Jones B 2005 Impacts of grazing on montane heath vegetation in Wales
and implications for the restoration of montane areas Biological Conservation 125 515-524
BSFP 2008 The British Survey of Fertiliser Practice Report for 2008 wwwdefragovuk
128
Countryside Survey Soils Report from 2007
6 Olsen-P
Emmett BA Black HIJ Bradley RI Elston D Reynolds B Creamer R Frogbrook ZL Hudson G
Jordan C Lilly A Moffat A Potts J Vanguelova E 2006 National soil monitoring network Review and
assessment study Final Report Project LQ09 SNIFFER Edinburgh
Emmett BA Frogbrook ZL Chamberlain PM Griffiths R Pickup R Poskitt J Reynolds B Rowe
E Spurgeon D Rowland P Wilson J Wood CM 2008 CS Technical Report No 307 Soils Manual
NERCCentre for Ecology amp Hydrology 180 pp (CEH Project Number C03259)
Foy RH Tunney H Carroll MJ Byrne E Gately T Bailey JS Lennox SD 1997 A comparison of
Olsen and Morgan soil phosphorus test results from the cross -border region of Ireland Irish Journal of
Agricultural and Food Research 36 185-193
Harrison AF Stevens PA Dighton J Quarmby C Dickinson AL Jopnes HE Howard DM 1995
The critical load of nitrogen for Sitka spruce forests on stagnopodsols in Wales Role of nutrient limitations
Forest Ecology and Management 76 139-148
Hughes S Reynolds B Bell SA Gardner C 2000 Simple phosphorus saturation index to estimate risk
of dissolved P in runoff from arable soils Soil Use and Management 16 206-210
Jackson ML 1958 Soil Chemical Analysis Prentice Hall London
Kirkham FW 2001 Nitrogen uptake and nutrient limitation in six hill moorland species in relation to
atmospheric nitrogen deposition in England and Wales Journal of Ecology 89 1041-1053
MAFF 2000 Fertilser recommendations for agricultural and horticultu ral crops (RB209) Seventh Edition The
Stationery Office 177pp
McGrath SP Loveland PJ 1992 The Soil Geochemical Atlas of England and Wales Blackie Academic
and Professional
Mohren GMJ van den Berg J Burger FW 1986 Phosphorus defic iency induced by nitrogen input in
Douglas fir in the Netherlands Plant and Soil 95 191-200
Morecroft MD Bealey CE Beaumont DA Benham S Brooks DR Burt TP Critchley CNR Dick
J Littlewood NA Monteith DT Scott WA Smith RI Walmsley C Watson H The UK Environmental
Change Network Emerging trends in the composition of plant and animal communities and the physical
environment Biological Conservation 142 2814-2832
Oliver MA Archer JR Baxter SJ Todd AD Skinner RJ 2006 The Representative Soil Sampling
Scheme of England and Wales a statistical analysis of topsoil nutrient status and pH between 1971 and
2001 Soil Use and Management 22 372-382
Olsen SR Cole CV Watanabe FS Dean LA 1954 Estimation of available phosphorus in soils by
extraction with sodium bicarbonate United States Department of Agriculture Washington DC Circular No
939 19pp
Rowe EC Smart SM Kennedy VH Emmett BA Evans CD 2008 Nitrogen deposition increases the
acquisition of phosphorus and potassium by heather Calluna Vulgaris Environmental Pollution 155 201-207
White RE 2006 Principles and Practice of Soil Science Fourth Edition Blackwell Publishing Oxford
129
Countryside Survey Soils Report from 2007
7 Soil metal concentrations
Summary
A comparison of back corrected Countryside Survey soils (0-15cm) analyses for 1998 and 2007
samples indicated that as would be expected only relative small changes in soil trace metal
concentrations occurred between surveys despite reported declines in atmospheric deposition due
to the long residence time of metals in soils
Of seven metals for which repeat measurement were made during the 2007 survey only for one Cu
was a statistically significant difference in soil (0-15cm) concentrations (an increase) found at the
GB level
When the data for repeat metal measurements were stratified by Broad Habitat Aggregate
Vegetation Class and soil organic matter category further statistically significant differences were
seen For Cu generally significant increases were observed whilst for two metals Cd and Pb
changes were small and idiosyncratic between stratifications For three metals Cr Ni Zn changes
were generally characterised by reduction in crop lands and no change or slight increases in less
managed habitats
For some metals such as Cu and Cd it is l ikely that additional sources (animal manures and
possibly sewage sludge manures and compost for Cu and fertiliser for Cd) beyond atmospheric
inputs are important in maintaining or even increasing soil concentrations principally in managed
areas For the remaining metals especially Cr Ni and Zn there is some suggestion that in areas
where cropping takes place output fluxes may now exceed inputs enabling soil concentrations to
decline
Managed landscape where intensive cropping takes place but sewage sludge animal manures and
composts are rarely applied may be among the first habitats to return from their slight-moderately
elevated states to their pre-industrial background concentrations and could be a focus for future
monitoring
71 Policy background
Key Question Is the decline in atmospheric deposition as reported by the Heavy Metals Monitoring Network reflected in soil metal concentrations measured with CS Measurements Concentrations of Cd Cr Cu Ni Pb V and Zn is soils (0-15cm) collected in repeat sampling of plots that were also sampled and analysed for the same metals in 1998 measurement of concentrations of Li Be Al Ti Mn Fe Co As Rb Se Sr Mo Sb Sn Cs Ba W Hg U in CS in 2007 soil samples as an initial survey of a wider range of trace element From this analysis CS in 2007 has provided
Whole Great Britain (GB) and Broad Habitats Aggregate Vegetation Classes (AVC) and soil type
stratified assessments of soil trace element concentrations in soil (0-15cm) in 2007
Information of the change in concentrations of trace metals (Cd Cr Cu Ni Pb V Zn) in GB soil (0-
15 cm) since previous measurements made at the same plots in 1998
Data to contribute to analysis of source changes in the distribution of trace elements in a range of
GB habitats vegetation types and soil classes
130
Countryside Survey Soils Report from 2007
7 Soil metal concentrations
Background In the European Union and internationally a set of research programmes have focused on assessing the risks of trace metals to ecosystems This work has been driven by policy initiatives which include new procedures for the mandatory risk assessment according to European Commission regulation 148894 and studies to support the 1998 Convention on Long-Range Transboundary Air Pollution Aarhus Protocol on Heavy Metals The focus of policy makers and researchers on the risk assessment of metals recognises the harm that elevated trace element concentrations can do to soil ecosystems A number of keystone soil taxa (eg earthworms springtails nitrifying bacteria) are particularly sensitive to metals High metal concentration in soils can reduce the abundance and diversity of communities of these and other taxa potentially resulting in a breakdown of specific soil functions such as decomposition nutrient turnover and the regulation of hydrological flows through soil Metals are not broken-down over time (unlike most organic chemicals) and so can be removed only by the relatively slow process of cropping and leaching the accumulation of metals offers one of the more serious long-term threats to soil sustainability worldwide The environmental risks of metals for UK soils are currently being asssed in two projects improving current critical loads methods for application within UNECE Convention and developing models that can be used to describe and predict the effects of changes in input rates on soil and freshwater metal pools Both project will benefit from good quality soil metal survey data Key measurements required include information on current concentrations of metals in soils (representing combined geogenic and past anthropogenic inputs) and also predicted rates of change Modification in metal concentration in surface soils will represent the balances between input fluxes associated with natural and anthropogenic inputs and output fluxes associated with crop removal and leaching Measurements of the input rates of atmospheric metal deposition to rural soils in the UK since 2004 have come from analyses of rain water and airborne particulate metal concentrations made within the UK bdquoHeavy Metal Deposition Monitoring Network‟ This network has collected information on the concentrations of a suite of metals of regulatory interest including Cd Cu Ni Pb Zn and Hg Other impo rtant routes for the input of metals to soils are associated with the addition of sewage sludge animal manures and other solid waste streams to soils principally in agricultural areas Information on these inputs can be derived from Defra supported long-term monitoring projects focussing on solid waste receiving systems For estimates of losses from cropping and leaching prediction of removal rates have been made by modelling studies conducted to support development of a critical loads approach for metals in soils Despite this knowledge because the Heavy Metal Deposition Network covers only a small number of sites (15 in GB) and there is little large scale data on the local patterns of solid waste inputs and cropping and leaching removals available the input and output flux estimates that are currently available are very uncertain Although uncertain and spatially variable estimates made by the Heavy Metal Deposition Monitoring Network other large-scale monitoring programs and by source inventory assessment have suggested that rates of atmospheric metal deposition to UK soils are declining For example a European wide survey of trace metal concentration in over 6000 moss samples identified a decline in concentrations of As of 72 Pb of 72 V of 60 Cd of 52 and Fe of 45 between 1990 and 2005 Smaller declines were also found for Zn of 29 Cu of 20 and Ni of 20 Declines for Hg (12) and Cr (2) were not significant While it is apparent that atmospheric deposition is likely to be declining it is not known whether these reductions have yet passed the point beyond which output losses exceed inputs and so overall metal concentrations can begin to decline Dynamic modelling within Defra funded projects on critical loads assessment have suggested that the residence time of metals in soils will be at least many decades and for some metals such as lead possibly millennia (Tipping et al 2006a) Extensive datasets on the rates of change of concentrations of metals in soils are not currently available to validate these model predictions By resampling and measuring soil metal concentration in samples collected countrywide after a 9 year gap it was hoped that CS could provide an initial prototype of just such a dataset
131
Countryside Survey Soils Report from 2007
7 Soil metal concentrations
72 Methods
721 Proof of concept
As part of the Measuring and Assessing Soil Quality of CS in 1998 over 1100 soil samples were successfully analysed for seven trace metals (Cd Cr Cu Ni Pb V Zn) using aqua regia digestion and an ICP -OEC analysis method Measured concentrations showed regional trends with higher value generally found in England and Wales than in Scotland Concentrations also differed between Broad Habitats with highest concentrations in Arable and Horticulture and Improved Grassland soils and lowest concentrations in Dwarf Shrub Heath and Bogs The GB wide sampling and measurement programme of CS in 1998 provided information on the concentrations of metals in the rural soils that are the focus of CS rather than urban or industrial soils that are often considered in pollution assessment programs These rural soils are primari ly influenced by diffuse rather than point source inputs and so are relevant to studies to assess the potential for large scale pollution effects resulting from diffuse exposure To provide initial knowledge on the potential dynamics of metal concentra tions in GB soils a repeat analysis of a sub-set of samples collected within CS in 1998 has been undertaken as part of CS in 2007 This was done to allow the key policy question of interest to stakeholders to be addressed namely Is the decline in atmospheric deposition as reported by the Heavy Metals Monitoring Network reflected in soil metal concentrations measured with CS To address the highlighted policy issue and assess wider implications relating to metal distribution of GB soils the metal componen t of CS in 2007 was designed to provide
A nationwide assessment of the concentrations of 26 metal or metalloid elements namely lithium
(Li) beryllium (Be) aluminium (Al) titanium (Ti) vanadium (V) chromium (Cr) manganese (Mn)
iron (Fe) cobalt (Co) nickel (Ni) copper (Cu) zinc (Zn) arsenic (As) rubidium (Rb) selenium (Se)
strontium (Sr) molybdenum (Mo) cadmium (Cd) antimony (Sb) tin (Sn) caesium (Cs) barium (Ba)
tungsten (W) mercury (Hg) lead (Pb) uranium (U) in almost 500 GB soils collected in CS in 2007
Information on the change in concentrations of metals in GB soils for seven metals (Cd Cr Cu Ni
Pb V Zn) that were also analysed in CS samples collected in 1998 and in the 2007 repeat analyses
An assessment of the influence of Broad Habitats AVC and soil type on measured metal
concentration and rates of change between survey years
Countryside Survey in 2007 has provided a large-scale re-sampling of soil metal concentrations with the framework of an integrated nationwide monitoring program The full rationale for the repeat measurement of soil metal concentrations is set out in Table 71 and the progression of the development of the resampling and analysis approach used set out in detail below
In CS in 1998 concentrations of Cd Cu Cr Ni Pb Zn were measured in soils collected from all Main Plots within squares first sampled for soil (pH LOI soil texture) in the 1978 survey (Chapter 1) This gave a potential total of 1256 soils for metals analysis although actual numbers were somewhat lower due to plot or sample losses meaning that in total 1119 soils were actually analysed Competing priorities for resources during the design of the 2007 survey and measurement program meant that within the available budget a full analysis of all previous analysed Main Plots re-sampled in CS in 1998 could not be supported During preparation for CS a power analysis of the 1998 survey data was conducted to evaluate within and between square variability and to assess the implications of changing sample number for the power of the analysis to detect change in metal concentrations Results of this power analysis indicated lower within square than between square variability Further it was indicated that a reduction in the number of M ain Plots analysed per square from 5 in CS in 1998 to only 2 in CS in 2007 would actually have only a very limited effect on the power to detect change in CS in any repeat analysis Based on this evaluation in 2007 metals analysis was limited to two Main Plots for all squares previously samples in 1978
132
Countryside Survey Soils Report from 2007
7 Soil metal concentrations
Table 71 Summary of rationale for measurement of soil metal concentrations within CS in 2007
Issue Facts Comments History in CS Measured in 1097 samples in
CS in 1998
Measurement of 2007 re-samples will give
capability to establish a time series for the first time
Country level reporting No CS in 1998 did not give country level statistics
Reduced dataset in 2007 limits the power of
analysis for Country level reporting for habitat
vegetation and soil types stratifications
Links and compatibility to other
monitoring programmes
UK heavy metal monitoring
network
BGS G-BASE for soils and
stream sediments
Comparable data to those
collected in the NSI for same
horizon (0-15cm)
Environment Agency Soil and
Herbage Survey
Potential to link soils metal levels with predicted
deposition
Able to link soil metal levels with stream sediment
database
Can compare CS to NSI metal concentrations
Can compare with data for rural but not urban or
industrial site soils
Uniqueness of CS The only national dataset that
reports on metal distribution
and trends within an integrated
monitoring programme
Increase scope by inclusion of additional trace
element analytes within an extended analytical
suite
Value for money (Policy
priority or interpretative value x
cost)
Priority - medium
Value for money - medium
Sound fit with current priorities and good fit with
existing projects
ICP-MS and ICP-OES method delivers data on 26
metals and also on total P and total S
In the intervening period between the analysis of the CS in 1998 samples and the collection of samples from CS in 2007 several analytical developments were introduced into the procedures for trace metal analysis used at the UKAS accredited analytical facility at CEH in Lancaster During the movement of the metal analysis laboratory from its previous location at CEH Merlewood it was necessary to dismantle the hotplate reflux system that was used for digestion of all soils in CS in 1998 L ogistical requirement meant that the equipment could not be rehoused in the new analytical laboratories at CEH in Lancaster Instead it was decided to procure a new microwave digestion system that would be used for soil digestions Although both systems use aqua regia as the reagent for digestion the change in available instrumentation for conducting digestion from a hot plate reflux system to microwave digestion still could have the potential to confound the comparison of the 1998 and 2007 data if the two method show different extraction efficiencies Before detailed analysis of the data was conducted a careful comparison of the two methods was conducted using the available quality assurance information to check the comparability of the two methods In addition to a change in digestion apparatus purchase of new equipment for the analysis laboratory meant that as well as Inductively Coupled Plasma Optical Emission Spectroscopy ( ICP-OES) a further detection method Inductively Coupled Plasma Mass Spectrometry (ICP-MS) could also be used in CS in 2007 In the preparatory work for CS in 2007 the accuracy and precision of the two detection methods was compared for a representative set of aqua regia digests of 1998 CS soils Results indicated a good comparabi lity between the two detection techniques Since the resource implications for the use of the two instruments in parallel were minimal it was decided to use a comprehensive approach for the full analysis that included use of both procedures This approach both ensured any new analytical measures were compatible with CS in 1998 measures from digests and also delivered concentrations for an extended analyte suite The analytical
133
Countryside Survey Soils Report from 2007
7 Soil metal concentrations
strategy used involved a 5 stage approach based on 1) aqua regia digestion 2) analysis by ICP- OES for Cd Cr Cu Pb Ni V Zn P and S 3) further analysis of the same samples for further metals by ICP-MS 4) careful data evaluation 5) targeted re-measurement for any problem analytes
722 Analytical method
The field method used for soil core collection at each Main Plot was the same as in CS in 1998 The cores used for metal analysis were collected using a 15 cm long by 5 cm diameter black plastic core following the detailed field protocol set out in Emmett et al (2008) Once extracted and logged all cores were returned by mail to CEH in Lancaster as the quickest route of return On receipt samples for metal analysis were tak en from the bdquoBlack core‟ (See Emmett et al 2008 Annex 1) A total of 1054 black cores were collected from the 5 Main Plots in the original 256 1978 squares From this total number a subset of two cores from each visited square was chosen for trace met al analysis Cores were chosen at random from the subset of collected samples that were also analysed for concentrations of mineralisable nitrogen (see Chapter 5) All metal analyses were carried out by the UKAS accredited inorganic analysis laboratory at CEH in Lancaster After initial processing of the core to obtain a homogenous sample (See Emmett et al 2008 Annex 1) soil samples were ball-milled before analysis A 05g sub-sample of the dried milled material was used for analysis Digestion of the soil samples was conducted using an aqua regia mixture (3 ml of 37 hydrochloric acid and 9 ml of 69 nitric acid both bdquoaristar‟ grade reagents ) employing microwave heating under pressure The microwave digestion method was adapted from that used by the US EPA (method 3051A) to fit the specific requirements of the available digestion equipment at CEH in Lancaster The use of microwave digestion differed from the procedure used for measurement of soil metal concentration in CS in 1998 as outlined previously As a result of the change in digestion procedure detailed checks of the quality assurance data were conducted to verify the comparability of the analysis methods (see quality assurance section below) Further a series of validation checks have also bee n conducted of samples measured in the CS in 1998 using the CS in 2007 protocol This targeted re -measurement includes samples of a range of soil LOI and pH values and has been used in combination with available quality control information to support interpretations within this report
After digestion all samples were prepared for analysis of Cd Cr Cu Ni Pb V Zn P and S using ICP-OES and the technical method and operational limits relevant to the selected analytes Additionally for each digestion a parallel analysis was conducted that measured concentration of a suite of additional elements namely Li Be Al Ti V Cr Mn Fe Co Ni Cu Zn As Rb Se Sr Mo Cd Sb Sn Cs Ba W Hg Pb U using ICP-MS For reporting all values for metal concentrations derived from both detection methods were expressed as mgkg (equivalent to ppm and μgg) on a dry weight basis
134
Countryside Survey Soils Report from 2007
7 Soil metal concentrations
Table 72 Summary of quality control data for measurement of certified reference soil BCR CRM141R The table
highlights the repeatability of the measurements made in 1998 (top) and 2007 (middle) but also the difference in
the measured quantity resulting from the necessitated change in digestion procedure between CS in 1998 and
CS in 2007 The bottom table shows a comparison of the mean measured total of Cd Cr Cu Ni Pb V and Zn
made using the different method in each survey and the estimation of the correction factor used to back correct
CS in 1998 samples to account for digestion related differences Subsequent data analyse s was done comparing
back corrected CS in 1998 measurements with uncorrected CS in 2007 measured concentrations
1998 CS2000 Reflux digestionICPOES measurement BCR CRM141R
Mgkg Cd
Mgkg
Cr
Mgkg
Cu
Mgkg
Ni
Mgkg
Pb
Mgkg
V
Mgkg
Zn
Mgkg
mean 1360 14100 4700 9730 4860 5030 26100
sigma 070 530 170 370 330 210 930
CV 515 376 362 380 679 417 356
certified 1400 13800 4690 9400 5130 na 27000
recovery 9714 10217 10021 10351 9474 na 9667
bias -040 300 010 330 -270 na -900
bias -286 217 021 351 -526 na -333
error 180 1360 350 1070 930 na 2760
Error 1324 965 745 1100 1914 na 1057
2008 CS2007 microwave digestionICPOES (-oes) or ICPMS (-ms) measurement BCR CRM141R Cd-ms
Mgkg
Cr-ms
Mgkg
Cu-oes
Mgkg
Ni-ms
Mgkg
Pb-ms
Mgkg
V-oes
Mgkg
Zn-oes
Mgkg
Mean 1270 12120 4670 8366 4954 3580 28460
sigma 016 130 060 113 081 190 540
CV 126 107 128 135 164 531 190
Certified 1400 13800 4690 9400 5130 na 27000
recovery 9071 8783 9957 8900 9657 na 10541
bias -130 -1680 -020 -1034 -176 na 1460
bias -929 -1217 -043 -1100 -343 na 541
Error 162 1940 140 1260 338 na 2540
Error 1276 1601 300 1506 682 na 892
BCR CRM141R ndash 19982007 comparison all validation Cd-ms
Mgkg
Cr-ms
Mgkg
Cu-oes
Mgkg
Ni-ms
Mgkg
Pb-ms
Mgkg
V-oes
Mgkg
Zn-oes
Mgkg
1998 1360 14100 4700 9730 4860 5030 26100
2007 1182 10989 4327 7872 4724 2820 26632
19982007 115 128 109 124 103 178 098
135
Countryside Survey Soils Report from 2007
7 Soil metal concentrations
723 Quality assurance
Within each batch of 20 samples a minimum of one blank and two certified reference material (CRM) and one local reference material (LRM) were always analysed The t wo CRMs used were the BCR CRM141R calcareous loam soil and International Soil Exchange ISE 921 river clay both of which have certified values for a range of metals included within the analytical suite Quality control checks for each analytical batch were conducted to ensure that total analytical error was not greater than 20 comprising a 10 error in precision and 10 error in bias This criterion is more rigorous than that used by the Environment Agencies MCERTS performance standard for laboratories undertaking chemical testing of soil (NB MCERTS defines total allowable error of 25 - 10 bias + 15 precision) For the 2007 soils analysed using microwave digestion with ICP-OES or ICP-MS detection certified values for the repeat analysed metals (Cd Cr Cu Ni Pb Zn) indicated that the total error of the method is within the allowable 20 Compared with results from the CS in 1998 survey the analytical method used in CS in 2007 provided a similar and in both cases satisfactory precision of measurement in all cases ( Table 72) This confirms the suitability of the method used Even though both the microwave and hotplate digestion method performed within quality assurance targets it must be remembered that both digestion procedure remain operationally defined This means that the two aqua regia digest ion based techniques do not give a full measurement of all metals present in soils Some metal remains unextracted These residual ions are however mostly bound to silicate minerals and as such are widely considered to be unimportant for estimating the mobility and behaviour of trace elements in soil This operational component to the effectiveness of the method does however raise the potential for the two procedures to produce slightly different estimates of metal concentrations from the same soil To provide a cross check between measurements made by the two different digestion methods two separate approaches were used For the first a comparison was made of the measurements made of the BCR CRM141R calcareous loam soil which was extensively analysed during both the CS in 1998 and CS in 2007 measurement campaigns Comparison of quantifications of the CRM in the two surveys indicated that 6 of the 7 metals showed higher concentrations in BCR CRM141R soil in CS in 1998 than in CS in 2007 (Table 72) Cd Cr Cu Ni and Pb showed concentrations that were between 3 (Pb) and 28 (Cr) higher in CS in 1998 Concentrations of V in CS in 1998 were 78 higher in the CRM in measurements made in CS in 1998 than in CS in 2007 Of measured metals in the CRM only Zn concentrations were lower (by 2) in CS in 1998 than in CS in 2007 The second approach to comparison of the two digestion techniques was through a repeat analysis of samples that were originally measured following hotplate reflux digestion as part of the CS survey in 1998 but this time using the CS in 2007 microwave method Twenty six samples that had been archived from the 1998 survey were digested using the microwave method and analysed for concentration of the seven trace elements (Cd Cr Cu Ni Pb V Zn) that were originally measured during the 1998 analysis The results of this targeted re-measurement confirm the initial indication gained from the comparison of certified reference material analyses in all cases except for V The method compari son highlights that there is an approximate 30 increase in measured Cr and Ni concentrations using the reflux technique Cd and to a lesser extent Cu concentrations are also marginally higher with hotplate reflux (3 -10) while Pb and Zn concentrations are similar to within a few percent using both methods (Table 73) For V the comparison between soils highlights a small underestimation of concentrations using reflux while in contrast a large overestimation was indicated by the CRM comparison
136
Countryside Survey Soils Report from 2007
7 Soil metal concentrations
Table 73 Summary data for measurement of soil trace metal concentrations measured in selected (26) soil
samples collected in CS in 1998 using the hot reflux digestion protocol used for all CS in 1998 analyses and also
the microwave digestion protocol used for analysis in CS in 2007 samples The table highlights the repeatability
of the measurements made in 1998 (top) and 2007 (middle) but also the difference in the mean measured total of
Cd Cr Cu Ni Pb V and Zn made using the different methods as shown by the comparison of measured
concentration between the two procedures
Cd-ms
mgkg
Cr-ms
mgkg
Cu-oes
mgkg
Ni-ms
mgkg
Pb-ms
mgkg
V-oes
mgkg
Zn-oes
mgkg
1998 soils by reflux 036 3575 1703 2847 6738 4145 6146
SD 026 5219 1754 5487 9835 3859 4222
1998 soil by microwave 034 2775 1594 2041 7122 4061 6298
SD 023 3937 1515 4282 9392 3838 4196
RefluxMicrowave 111 131 103 136 096 098 097
SD 040 064 017 057 013 016 013
Because the differences relating to the efficiency of the digestion techniques used between surveys could
contribute to any indicated differences between surveys it was decided to ldquonormaliserdquo one set of
measurements to allow direct comparison As the 2007 measurements showed the highest precision for the
majority of the metals measured in both surveys (Cd Cu Pb Zn) and the microwave digestion method will be
applied in future soil metal research within CEH including any potential future CS analyses it was decided to
normalise the 1998 data to give concentration estimates for soil collected in 1998 assuming analysis
conducted according to the CS in 2007 method The back correction of the 1998 concentrations was
achieved by dividing the measured value by the ratio of mean 1998 2007 measurements for the BCR
CRM141R reference soil Correction was undertaken according to measurement in the reference soil for two
reasons Firstly these analyses were made at the same time that the CS soils themselves were measured
meaning that they are most likely to relate to operational conditions at the time of CS sample assessment
Secondly the CRM dataset contains a greater number of total measurements than the repeated 1998
dataset The back correction of the 1998 measurements gives an estimated value for 1 998 soils if measured
using the 2007 protocol The back correction procedure was conducted for 6 metals Cd Cr Cu N Pb Zn
but not for V This was because the large discrepancy in BCR CRM141R measurement between survey s for
this metal (78) and the mismatch between this comparison and the repeat measures questions the
reliability of the extraction method and data ldquonormalisationrdquo approaches used for this metal As a result V
has been excluded from the analysis of change between surveys
137
Countryside Survey Soils Report from 2007
7 Soil metal concentrations
Figure 71 Comparison of change in measure metal concentration following back correction of 1998 data to
account for differences resulting from changes in digestion procedure between the 1998 and 2007 survey in
relation to pH of the measure soil Red line indicates linear trend of change in relation to pH Absence of a
strong trend for change in relation to soil pH indicate that there is no effect of soil pH on the size of the
difference resulting from the digestion change meaning that a single value for back correction is applicable to
soils independent of pH
-2000
-1500
-1000
-0500
0000
0500
1000
1500
3 4 5 6 7 8 9 10
Soil pH
Ch
an
ge
soil C
d 1
99
8-2
007
(m
gk
g)
-40000
-20000
0000
20000
40000
60000
80000
100000
120000
140000
3 4 5 6 7 8 9 10
Soil pH
Ch
an
ge
soil C
r 1
99
8-2
007
(m
gk
g)
-30000
-20000
-10000
0000
10000
20000
30000
40000
50000
60000
3 4 5 6 7 8 9 10
Soil pH
Ch
an
ge
soil C
u 1
99
8-2
007
(m
gk
g)
-80000
-60000
-40000
-20000
0000
20000
40000
60000
3 4 5 6 7 8 9 10
Soil pH
Ch
an
ge
soil N
i 1
99
8-2
007
(m
gk
g)
-1000000
-800000
-600000
-400000
-200000
0000
200000
400000
600000
3 4 5 6 7 8 9 10
Soil pH
Ch
an
ge
soil P
b 1
99
8-2
007
(m
gk
g)
-40000
-20000
0000
20000
40000
60000
80000
3 4 5 6 7 8 9 10
Soil pH
Ch
an
ge
soil V
199
8-2
007
(m
gk
g)
-500000
-400000
-300000
-200000
-100000
0000
100000
200000
3 4 5 6 7 8 9 10
Soil pH
Ch
an
ge
soil Z
n 1
99
8-2
007
(m
gk
g)
Cd Cr
Cu Ni
Pb V
Zn
Cd_98_07_change = 0759 + 000300 PH2007 Cr_98_07_change = 018 - 00196 PH2007
Cu_98_07_change = 235 + 00427 PH2007 Ni_98_07_change = 036 - 000637 PH2007
Pb_98_07_change = - 022 + 000466 PH2007 V_98_07_change = 899 + 0211 PH2007
Zn_98_07_change = - 177 - 00425 PH2007
138
Countryside Survey Soils Report from 2007
7 Soil metal concentrations
Figure 72 Comparison of change in measure metal concentration following back correction of 1998 data to
account for differences resulting from changes in digestion procedure between the 1998 and 2007 survey in
relation to soil LOI Red lines indicate the linear trend for change as a function of LOI Absence of a strong trend
for change in relation to soil pH indicate that there is no effect of soil p H on the size of the difference resulting
from the digestion change meaning that a single value for back correction is applicable to soils independent of
LOI
Cd Cr
Cu Ni
Pb V
Zn
-2000
-1500
-1000
-0500
0000
0500
1000
1500
0 20 40 60 80 100
Soil loss on ignition
Ch
an
ge
soil
Cd
19
98
-20
07
(m
gk
g)
-40000
-20000
0000
20000
40000
60000
80000
100000
120000
140000
0 20 40 60 80 100
Soil loss on ignition
Ch
an
ge
soil
Cr
19
98
-20
07
(m
gk
g)
-30000
-20000
-10000
0000
10000
20000
30000
40000
50000
60000
0 20 40 60 80 100
Soil loss on ignition
Ch
an
ge
soil
Cu
19
98
-20
07
(m
gk
g)
-80000
-60000
-40000
-20000
0000
20000
40000
60000
0 20 40 60 80 100
Soil loss on ignition
Ch
an
ge
soil
Ni
19
98
-20
07
(m
gk
g)
-1000000
-800000
-600000
-400000
-200000
0000
200000
400000
600000
0 20 40 60 80 100
Soil loss on ignition
Ch
an
ge
soil
Pb
19
98
-20
07
(m
gk
g)
-40000
-20000
0000
20000
40000
60000
80000
0 20 40 60 80 100
Soil loss on ignition
Ch
an
ge
soil
V 1
99
8-2
00
7 (
mg
kg
)
-500000
-400000
-300000
-200000
-100000
0000
100000
200000
0 20 40 60 80 100
Soil loss on ignition
Ch
an
ge
soil
Zn
19
98
-20
07
(m
gk
g)
Cr_98_07_change = 015 - 000509 LOI2007
Cu_98_07_change = 270 + 000924 LOI2007 Ni_98_07_change = 045 - 000205 LOI2007
Pb_98_07_change = 225 + 000046 LOI2007 V_98_07_change = 104 + 00479 LOI2007
Zn_98_07_change = - 217 - 00104 LOI2007
Cd_98_07_change = 0938 + 0000107 LOI2007
139
Countryside Survey Soils Report from 2007
7 Soil metal concentrations
A potential concern with the back correction approach used to ldquonormaliserdquo measurements between surveys was that this could results in the false identification of change in some habit ats if the difference in digestion technique resulted in different ratios of measured metals in soils of differing properties such as pH LOI and metal concentration Any such trends with soil properties could under or over correct concentrations in particular soils types Since some habitats and vegetation classes are associated with certain soils (eg Bogs with low pH organic soils) this could lead to the erroneous identification of change in certain data stratifications To investigate whether soil properties had the potential to bias result by differentially affecting extraction efficiency between CS in 1998 and 2007 methods correlation plots were drawn between the predicted change between surveys and the potentially key soil properties of pH LOI a nd metal concentration For pH 5 metals (Cd Cu Ni Pb Zn) showed no clear trend of change with soil acidity ( Fig 71) This suggested that the relative digestion efficiency of the different methods is not affected by this parameter A small dependency of change in Cr concentration with pH was found indicating that association of habitats and vegetation classes with low pH could result in the incorrect identification of change with errors relating to indications of increased change in low pH soil and reduced change in high pH soil V showed a marked dependency of change on soil pH providing further support for exclusion of this metal from further analysis Against LOI all metals except V showed no clear trend of change ( Fig 72) Ideally investigation of the effect of metal concentration on relative extraction efficiency would also have been tested however this analysis is affected by regression to the mean issues which means that the significant trends seen which indicates positive change at low concentrations and negative change at high concentrations are explained by statistical chance rather than a real concentration dependent effect Overall the analysis of the effect of all testable soil properties supported the use of a single factor for back correction of the CS in 1998 measurements with a slight caveat for soil Cr concentrations in respect of pH
724 Reporting
Measured soil elemental concentrations for Li Be Al Ti V Cr Mn Fe Co Ni Cu Zn As Rb Se Sr Mo Cd Sb Sn Cs Ba W Hg Pb U P and S have been analysed to provide information on the state and in seven cases (Cd Cr Cu Ni Pb V and Zn) change since CS in 1998 Data were analysed using the standard mixed model analysis appropriate to CS measurements The statistical approach used for analys is for change involved bootstrapping which allows for non-normality in the data without the necessity of knowing details of actual distribution As such it provides a more accurate measurement of significance A nnex F of Emmett et al (2008) provides a background document describing this approach The data in this report describes analysis of concentrations in CS in 2007 and changes since CS in 1998 for Cd Cr Cu Ni Pb Zn in soils (0 -15 cm) by Broad Habitat Aggregate Vegetation Class (AVC) and soil LOI class
Results are reported by three major categories for Great Britain and individual countries
Broad Habitat - the Broad Habitat classification consists of 27 habitats which account for the entire
land surface of Great Britain and the surrounding sea Countryside Survey reports on 10 major
terrestrial habitats
Aggregate Vegetation Class (AVC) ndash is a high level grouping of vegetation types produced from a
quantitative hierarchical classification of the different plant species found in the original Countryside
Survey sample plots Soil organic matter (LOI) category - mineral (0-8 LOI 0-44 g C kg
-1) humus-mineral (8 ndash 30 LOI
44-165 g C kg-1
) organo-mineral (30 ndash 60 LOI 165-330 g C kg-1
) and organic (60 ndash 100 gt 330 g
C kg-1
) Analysis of concentrations by Broad Habitat class and soil type is also briefly reported for As Mn Se Co Hg Mo Al and Ti Significant results relate to statistical significance with their ecological and policy relevance highlighted where appropriate Soil Arsenic (As) levels were interpolated using median indicator kriging to predict the probability of a threshold value of As concentration (807 mgkg) being exceeded A probability of 1 or above indicates that the data exceeds the specified threshold value at that location This method of spatial interpolation is particularly suited to interpreting heavy metals where point values can h ave large point scale variability rendering ordinary kriging unsuitable Data was interpolated onto a 1 km UK grid The change for soil Cu was
140
Countryside Survey Soils Report from 2007
7 Soil metal concentrations
mapped using kriging to interpolate between the Countryside Survey sample points Routine checking of data for outliers was conducted and the working data set was transformed using a normal score procedure to obtain a Gaussian distribution The data were then interpolated on a 1km UK grid using ordinary kriging and finally the kriged data were back-transformed to produce an interpolated map of Cu change
73 Results
731 Repeat measured metals comparison of CS data in 1998 and 2007
Cadmium The mean concentration of Cd measured in GB soils collected in 2007 was 0404 mgkg This compares with an mean concentration of 0417 mgkg measured in soil sample for CS in 1998 (Table 73 Fig 73) This represents a non-significant change in measured Cd concentration of 0013 mgkg between surveys Stratification of the data indicated that significant changes in soil Cd concentrations were not found in any Broad Habitat although it was notable that four habitats that are associated with minimal management namely Coniferous Woodland Acid Grassland Dwarf Shrub Heath and Fen Marsh and Swamp showed relatively large non-significant decreases in soil Cd concentration (in the region of 005 mgkg magnitude) In contrast habitats associated with more intensive management such as Arable and Horticulture and Improved Grassland showed smaller changes represented by a decline of 0003 mgkg and increase of 0029 mgkg respectively Bog habitats also showed a small non-significant increase in measured soil Cd Stratification by AVC indicated a significant reduction in measured soil Cd concentrations in Heath and Bog Here mean measured concentrations reduced to 0399 mgkg in 2007 from a mean of 0475 mgkg in 1998 Significant change was not found for any other AVC Stratification by soil LOI category indicated no significant change in Cd concentrations in Mineral Humus mineral and Organic soils In Organo-mineral soils a significant decrease of 0309 mgkg was found in 2007 when compared to 1998 values This category of soils is however represented by only a relatively small number of samples in the repeat sample dataset f or Cd which may be a contributing factor towards the observed change for this LOI class
141
Countryside Survey Soils Report from 2007
7 Soil metal concentrations
c) Great Britain - Soil LOI Category
Soil LOI category 1998 2007 1998-2007
Mineral 032 0332
Humus-mineral 0421 0412
Organo-mineral 0557 0246
Organic 0483 0452
Direction of
significant
changes
Soil Cd concentration
(mgkg)
Table 74 Changes in concentration of Cd (mgkg) in soils (0 -15 cm depth) within a) Broad Habitats b)
Aggregate Vegetation Classes and c) Soil LOI categories across Great Britain Arrows denote a significant
change (plt005) in the direction shown
a) Great Britain - Broad Habitats
Broad Habitat 1998 2007 1998-2007
Broadleaved Mixed and Yew Woodland 0413 0418
Coniferous Woodland 0308 0256
Arable and Horticulture 0355 0352
Improved Grassland 0389 0418
Neutral Grassland 0458 0416
Acid Grassland 0458 0404
Dwarf Shrub Heath 0457 0392
Fen Marsh and Swamp 0553 042
Bog 0631 0646
All habitat types 0417 0404
b) Great Britain - Aggregate Vegetation Class
AVC 1998 2007 1998-2007
Crops and weeds 0355 0359
Tall grass and Herb 0447 0409
Fertile grassland 0367 0365
Infertile grassland 0475 0446
Lowland woodland 0576 0612
Upland Woodland 0269 0197
Moorland grass mosaics 0405 0376
Heath and bog 0475 0399
All vegetation types 0417 0404
Direction of
significant
changes
Direction of
significant
changesSoil Cd concentration
(mgkg)
Soil Cd concentration
(mgkg)
142
Countryside Survey Soils Report from 2007
7 Soil metal concentrations
Figure 73 Changes (+- 95 CIs) in measured soil Cd concentration in soils (0-15 cm depth) within a) Broad
Habitats b) Aggregate Vegetation Classes and c) Soil LOI categories across Great Britain Standard errors are
indicated Significant differences p lt 005 p lt 001 p lt 0001 are shown
The mean concentration of Cr in GB soils was 213 mgkg in CS in 2007 compared to the mean of 224 mgkg in 1998 (Table 75 Fig 74) This represents a non-significant decrease of 11 mgkg Stratification of the data to assess change in measured Cr by Broad Habitats indicated significant reductions in soil Cr concentrations between surveys in Broadleaved Woodland Arable and Horticulture and Improved and Neutral Grasslands In contrast in Bogs there was a significant increased in measured soil Cr T his increase was however from a low baseline level as Cr concentrations in Bog were lower than in any other habitat in both surveys (46 mgkg in 1998 and 76 mgkg in 2007) In other Broad Habitats observed changes were non-significant with Coniferous Woodland Dwarf Shrub Heath and Fen Marsh and Swamp all showing small non-significant increases in mean measured Cr concentration Stratification by AVC partly reflected the trends seen within the Broad Habitats Significant decreases in measured Cr concentrations were found in Crop and Weed and Fertile Grassland Non-significant decreases were found in Tall Grass and Herb and Infertile Grassland In contrast a significant increase in measured soil Cr was found in Heath and Bog soils and non-significant increases in Upland Woodland and Moorland Grass Mosaic Stratification by soil LOI category indicated a significant decrease in measured Cr concentrations in Mineral and Humus -mineral soils and a significant increase in Organic soils
-020
-015
-010
-005
000
005
010
Bro
adlea
f
Coni
fer
Ara
ble
Impro
ved
Gra
ss
Neut
ral G
rass
Acid
Gra
ss
Shr
ub Hea
th
Bog
All ha
bita
ts
Ch
an
ge i
n s
oil
Cd
co
ncen
trati
on
(mg
kg
)
-020
-015
-010
-005
000
005
010
Cro
ps a
nd w
eeds
Tall g
rass
and
Her
b
Fertile
grass
land
Infe
rtile g
rass
land
Upla
nd W
oodlan
d
Moo
rland
gra
ss m
osaics
Heat
h and
bog
All ve
geta
tion
type
s
Ch
an
ge i
n s
oil
Cd
co
ncen
trati
on
(mg
kg
)
-040
-030
-020
-010
000
010
020
Min
eral
Hum
us-m
iner
al
Org
ano
-min
eral
Org
ani
c
Ch
an
ge in
so
il C
d c
on
cen
trati
on
(mg
kg
)
a) Broad Habitats
c) LOI categoriesb) Aggregate vegetation class
143
Countryside Survey Soils Report from 2007
7 Soil metal concentrations
c) Great Britain - Soil LOI Category
Soil LOI category 1998 2007 1998-2007
Mineral 268 236
Humus-mineral 28 264
Organo-mineral 183 247
Organic 41 53
Direction of
significant
changes
Soil Cr concentration
(mgkg)
Table 75 Changes in concentration of Cr (mgkg) in soils (0-15 cm depth) within a) Broad Habitats b) Aggregate
Vegetation Classes and c) Soil LOI categories across Great Britain Arrows denote a significant change (plt005)
in the direction shown
a) Great Britain - Broad Habitats
Broad Habitat 1998 2007 1998-2007
Broadleaved Mixed and Yew Woodland 227 195
Coniferous Woodland 128 139
Arable and Horticulture 295 254
Improved Grassland 282 264
Neutral Grassland 276 239
Acid Grassland 169 199
Dwarf Shrub Heath 11 186
Fen Marsh and Swamp 208 216
Bog 46 76
All habitat types 224 213
b) Great Britain - Aggregate Vegetation Class
AVC 1998 2007 1998-2007
Crops and weeds 295 261
Tall grass and Herb 321 288
Fertile grassland 286 262
Infertile grassland 27 253
Upland Woodland 232 237
Moorland grass mosaics 157 173
Heath and bog 48 71
All vegetation types 224 213
Direction of
significant
changesSoil Cr concentration
(mgkg)
Soil Cr concentration
(mgkg)
Direction of
significant
changes
144
Countryside Survey Soils Report from 2007
7 Soil metal concentrations
Figure 74 Changes (+- 95 CIs) in measured soil Cr concentration in soils (0-15 cm depth) within a) Broad
Habitats b) Aggregate Vegetation Classes and c) Soil LOI categories across Great Britain Standard errors are
indicated Significant differences p lt 005 p lt 001 p lt 0001 are shown
Copper The mean concentration of Cu in GB soils analysed in CS in 2007 was 186 mgkg ( Table 76 Fig 75) This is higher than the mean concentration of 166 mgkg measured in 1998 This represents a statistically significant increase in soil Cu concentrations of 2 mgkg between surveys Stratification of the data to analyse change by Broad Habitats indicated that the increase in Cu concentration detected in the GB wide soil dataset was evident in all Broad Habitats with the magnitude of change ranging from 02 mgkg in Arable and Horticulture soils to 6 mgkg in Dwarf Shrub Heath In 3 of the 9 Broad Habitats the increase in soil Cu was statistically significant These were Improved Grassland Dwarf Shrub Heath and Bogs which showed changes in measured soil Cu concentrations of 26 6 and 41 mgkg respectively Stratification by AVC indicated an increase in soil Cu concentrations in all vegetation types except for Tall Grass and Herb and Upland Woodland for which small non-significant decreases were found Three AVC categories showed significant increases in measured soil Cu There were Fertile Grassland Moorland Grass Mosaic and Heath and Bog within which increases were 41 5 and 33 mgkg respectively Analysis by soil LOI category indicated an increase of between 17 and 33 mgkg for the four soil type stratifications The measured increases were significant for 3 out of 4 categories namely the Mineral Humus-mineral and Organic soils
-10
-5
0
5
10
15
20
25
Bro
adlea
f
Coni
fer
Ara
ble
Impro
ved
Gra
ss
Neut
ral G
rass
Acid
Gra
ss
Shr
ub Hea
th
Bog
All ha
bita
ts
Ch
an
ge i
n s
oil
Cr
co
ncen
trati
on
(mg
kg
)
-10
-5
0
5
10
15
20
25
Min
eral
Hum
us-m
iner
al
Org
ano-m
iner
al
Org
anic
Ch
an
ge in
so
il C
r co
ncen
trati
on
(mg
kg
)
-10
-5
0
5
10
15
20
25
Cro
ps a
nd w
eeds
Tall g
rass
and
Her
b
Fertile
grass
land
Infe
rtile g
rass
land
Upla
nd W
oodlan
d
Moo
rland
gra
ss m
osaics
Heat
h and
bog
All ve
geta
tion
type
s
Ch
an
ge i
n s
oil
Cr
co
ncen
trati
on
(mg
kg
)
a) Broad Habitats
c) LOI categoriesb) Aggregate vegetation class
145
Countryside Survey Soils Report from 2007
7 Soil metal concentrations
c) Great Britain - Soil LOI Category
Soil LOI category 1998 2007 1998-2007
Mineral 178 195
Humus-mineral 198 221
Organo-mineral 161 195
Organic 74 103
Direction of
significant
changes
Soil Cu concentration
(mgkg)
Table 76 Changes in concentration of Cu (mgkg) in soils (0 -15 cm depth) within a) Broad Habitats b)
Aggregate Vegetation Classes and c) Soil LOI categories across Great Britain Arrows denote a significant
change (plt005) in the direction shown
a) Great Britain - Broad Habitats
Broad Habitat 1998 2007 1998-2007
Broadleaved Mixed and Yew Woodland 259 263
Coniferous Woodland 92 102
Arable and Horticulture 205 207
Improved Grassland 169 195
Neutral Grassland 226 237
Acid Grassland 124 147
Dwarf Shrub Heath 10 16
Fen Marsh and Swamp 172 191
Bog 69 11
All habitat types 166 186
b) Great Britain - Aggregate Vegetation Class
AVC 1998 2007 1998-2007
Crops and weeds 194 20
Tall grass and Herb 266 258
Fertile grassland 198 239
Infertile grassland 189 202
Lowland wooded 349 368
Upland Woodland 133 124
Moorland grass mosaics 109 159
Heath and bog 73 106
All vegetation types 166 19
Direction of
significant
changes
Direction of
significant
changesSoil Cu concentration
(mgkg)
Soil Cu concentration
(mgkg)
146
Countryside Survey Soils Report from 2007
7 Soil metal concentrations
Figure 75 Changes (+- 95 CIs) in measured soil Cu concentration in soils (0-15 cm depth) within a) Broad
Habitats b) Aggregate Vegetation Classes and c) Soil LOI categories across Great Britain Standard errors are
indicated Significant differences p lt 005 p lt 001 p lt 0001 are shown
Nickel The mean concentration of Ni in GB soils collected and analysed in the 2007 survey was 18 mgkg (Table 77 Fig 76) This is slightly although not significantly lower than the mean measured concentration in 1998 of 184 mgkg Within the different Broad Habitat categories a statistically significant decrease in soil Ni was found in 3 These were Broadleaved Woodland where concentrations fell by 2 mgkg and Arable and Horticulture where concentrations reduced by 18 mgkg and Neutral Grassland where a 21 mgkg decrease were found There was one habitat where measured soil Ni concentrations significantly increased between surveys This was Bog within which mean measured soil Ni concentrations increased 41 mgkg Analysis by AVC indicated significant change of measured Ni concentrations in Crop and We ed only Here a significant reduction in measured concentrations of 17 mgkg was found Analysis by soil LOI category indicated no significant change across any of the four soil classes
-8
-4
0
4
8
12
Bro
adlea
f
Coni
fer
Ara
ble
Impro
ved
Gra
ss
Neut
ral G
rass
Acid
Gra
ss
Shr
ub Hea
th
Bog
All ha
bita
ts
Ch
an
ge i
n s
oil
Cu
co
ncen
trati
on
(mg
kg
)
-8
-4
0
4
8
12
Min
eral
Hum
us-m
iner
al
Org
ano
-min
eral
Org
ani
c
Ch
an
ge in
so
il C
u c
on
cen
trati
on
(mg
kg
)
-8
-4
0
4
8
12
Cro
ps a
nd w
eeds
Tall g
rass
and
Her
b
Fertile
grass
land
Infe
rtile g
rass
land
Upla
nd W
oodlan
d
Moo
rland
gra
ss m
osaics
Heat
h and
bog
All ve
geta
tion
type
s
Ch
an
ge i
n s
oil
Cu
co
ncen
trati
on
(mg
kg
)
a) Broad Habitats
c) LOI categoriesb) Aggregate vegetation class
147
Countryside Survey Soils Report from 2007
7 Soil metal concentrations
c) Great Britain - Soil LOI Category
Soil LOI category 1998 2007 1998-2007
Mineral 197 189
Humus-mineral 195 191
Organo-mineral 249 253
Organic 35 35
Direction of
significant
changes
Soil Ni concentration
(mgkg)
Table 77 Changes in concentration of Ni (mgkg) in soils (0 -15 cm depth) within a) Broad Habitats b) Aggregate
Vegetation Classes and c) Soil LOI categories across Great Britain Arrows denote a significant change (plt005)
in the direction shown
a) Great Britain - Broad Habitats
Broad Habitat 1998 2007 1998-2007
Broadleaved Mixed and Yew Woodland 179 159
Coniferous Woodland 9 99
Arable and Horticulture 219 201
Improved Grassland 169 195
Neutral Grassland 226 205
Dwarf Shrub Heath 102 160
Fen Marsh and Swamp 172 191
Bog 69 110
All habitat types 184 18
b) Great Britain - Aggregate Vegetation Class
AVC 1998 2007 1998-2007
Crops and weeds 216 199
Tall grass and Herb 23 228
Fertile grassland 195 194
Infertile grassland 205 193
Lowland wooded 184 18
Upland Woodland 143 148
Moorland grass mosaics 25 24
Heath and bog 70 74
All vegetation types 184 18
Direction of
significant
changes
Direction of
significant
changesSoil Ni concentration
(mgkg)
Soil Ni concentration
(mgkg)
148
Countryside Survey Soils Report from 2007
7 Soil metal concentrations
Figure 76 Changes (+- 95 CIs) in measured soil Ni concentration in soils (0 -15 cm depth) within a) Broad
Habitats b) Aggregate Vegetation Classes and c) Soil LOI categories across Great Britain Standard errors are
indicated Significant differences p lt 005 p lt 001 p lt 0001 are shown
Lead The mean measured concentration of Pb in GB soils in 2007 was 804 mgkg ( Table 78 Fig 77) This is slightly although not significantly lower than the measured mean concentration of 825 mgkg found in 1998 Stratification of the data by Broad Habitat indicated that there was an increase of between 04 and 204 mgkg in 4 of 8 habitats In two habitats namely Improved Grassland and Dwarf Shrub Heath this increase was statistically significant The remaining habitats showed non -significant decreases in measured soil Pb concentrations ranging from 17 mgk in Fen Marsh and Swamp to 455 mgkg in Acid Grassland When data was analysed by AVC no significant changes in soil Pb concentration were found for any category Similarly stratification of the data by Soil LOI class did not highlight significant changes in measured soil Pb concentration between different soi l types
-15
-10
-5
0
5
10
15
Bro
adlea
f
Coni
fer
Ara
ble
Impro
ved
Gra
ss
Neut
ral G
rass
Shr
ub H
eath
Bog
All ha
bita
ts
Ch
an
ge i
n s
oil
Ni
co
ncen
trati
on
(mg
kg
)
-15
-10
-5
0
5
10
15
Cro
ps a
nd w
eeds
Tall g
rass
and
herb
Fertile
grass
land
Infe
rtile g
rass
land
Upla
nd w
ooded
Moo
rland
gra
ss m
osaics
Heat
h and
bog
All ve
geta
tion
type
s
Ch
an
ge i
n s
oil
Ni
co
ncen
trati
on
(mg
kg
)
-15
-10
-5
0
5
10
15
Min
eral
Hum
us-m
iner
al
Org
ano
-min
eral
Org
ani
c
Ch
an
ge in
so
il N
i co
ncen
trati
on
(mg
kg
)
a) Broad Habitats
c) LOI categoriesb) Aggregate vegetation class
149
Countryside Survey Soils Report from 2007
7 Soil metal concentrations
Table 78 Changes in concentration of Pb (mgkg) in soils (0 -15 cm depth) within a) Broad Habitats b)
Aggregate Vegetation Classes and c) Soil LOI categories across Great Britain Arrows denote a significant
change (plt005) in the direction shown
a) Great Britain - Broad Habitats
Broad Habitat 1998 2007 1998-2007
Coniferous Woodland 816 782
Arable and Horticulture 415 419
Improved Grassland 55 664
Neutral Grassland 609 526
Acid Grassland 1188 763
Dwarf Shrub Heath 679 883
Fen Marsh and Swamp 642 625
Bog 562 592
All habitat types 825 804
b) Great Britain - Aggregate Vegetation Class
AVC 1998 2007 1998-2007
Crops and weeds 449 454
Tall grass and Herb 638 614
Fertile grassland 560 617
Infertile grassland 627 589
Upland Woodland 853 780
Moorland grass mosaics 887 829
Heath and bog 704 705
All vegetation types 825 804
Direction of
significant
changes
Direction of
significant
changesSoil Pb concentration
(mgkg)
Soil Pb concentration
(mgkg)
c) Great Britain - Soil LOI Category
Soil LOI category 1998 2007 1998-2007
Mineral 413 426
Humus-mineral 1295 1269
Organo-mineral 997 985
Organic 752 682
Direction of
significant
changes
Soil Pb concentration
(mgkg)
150
Countryside Survey Soils Report from 2007
7 Soil metal concentrations
Figure 77 Changes (+- 95 CIs) in measured soil Pb concentration in soils (0-15 cm depth) within a) Broad
Habitats b) Aggregate Vegetation Classes and c) Soil LOI categories across Great Britain Standard errors are
indicated Significant differences p lt 005 p lt 001 p lt 0001 are shown
Zinc The mean concentration of Zn in GB soils in CS in 2007 was 773 mgkg ( Table 79 Fig 78) This is lower than the mean concentration of 804 mgkg found in 1998 This reduction of 31 mgkg in soil Zn in GB is not statistically significant Stratification of the data to analyse change in soil Zn concentration by Broad Habitat indicated that mean concentration were lower in 2007 than in 1998 in 7 of 10 h abitats This reduction in soil Zn was significant in two habitats These were Arable and Horticulture in which concentration fell on average by 57 mgkg and Neutral Grassland in which concentrations fell by 104 mgkg A significant increase in soil Zn concentration of 72 mgkg was found in Bog habitats All other changes in measured soil Zn by Broad Habitats were not significant When data was analysed by AVC no significant changes in soil Zn concentration were indicated for any vegetation class Strat ification of the data by LOI class also failed to identify significant changes in measured Zn between soil types
-100
-80
-60
-40
-20
0
20
40
Bro
adlea
f
Coni
fer
Ara
ble
Impro
ved
Gra
ss
Neut
ral G
rass
Acid
Gra
ss
Shr
ub Hea
th
Bog
All ha
bita
ts
Ch
an
ge i
n s
oil
Pb
co
ncen
trati
on
(mg
kg
)
-100
-80
-60
-40
-20
0
20
40
Cro
ps a
nd w
eeds
Tall g
rass
and
Her
b
Fertile
grass
land
Infe
rtile g
rass
land
Upla
nd W
oodlan
d
Moo
rland
gra
ss m
osaics
Heat
h and
bog
All ve
geta
tion
type
s
Ch
an
ge i
n s
oil
Pb
co
ncen
trati
on
(mg
kg
)
-100
-80
-60
-40
-20
0
20
40
Min
eral
Hum
us-m
iner
al
Org
ano
-min
eral
Org
ani
c
Ch
an
ge in
so
il P
b c
on
cen
trati
on
(mg
kg
)
a) Broad Habitats
c) LOI categoriesb) Aggregate vegetation class
151
Countryside Survey Soils Report from 2007
7 Soil metal concentrations
c) Great Britain - Soil LOI Category
Soil LOI category 1998 2007 1998-2007
Mineral 885 824
Humus-mineral 100 1006
Organo-mineral 61 357
Organic 342 376
Direction of
significant
changes
Soil Zn concentration
(mgkg)
Table 79 Changes in concentration of Zn (mgkg) in soils (0 -15 cm depth) within a) Broad Habitats b)
Aggregate Vegetation Classes and c) Soil LOI categories across Great Britain Arrows denote a significant
change (plt005) in the direction shown
a) Great Britain - Broad Habitats
Broad Habitat 1998 2007 1998-2007
Broadleaved Mixed and Yew Woodland 864 857
Coniferous Woodland 446 485
Arable and Horticulture 901 844
Improved Grassland 1076 1043
Neutral Grassland 995 891
Acid Grassland 422 439
Bracken 507 399
Dwarf Shrub Heath 407 389
Fen Marsh and Swamp 682 583
Bog 485 577
All habitat types 804 773
b) Great Britain - Aggregate Vegetation Class
AVC 1998 2007 1998-2007
Crops and weeds 943 919
Tall grass and Herb 117 1055
Fertile grassland 1033 1024
Infertile grassland 1061 776
Lowland woodland 1046 1087
Upland Woodland 513 482
Moorland grass mosaics 45 433
Heath and bog 357 363
All vegetation types 804 77
Direction of
significant
changesSoil Zn concentration
(mgkg)
Soil Zn concentration
(mgkg)
Direction of
significant
changes
152
Countryside Survey Soils Report from 2007
7 Soil metal concentrations
Figure 78 Changes (+- 95 CIs) in measured soil Zn concentration in soils (0 -15 cm depth) within a) Broad
Habitats b) Aggregate Vegetation Classes and c) Soil LOI categories across Great Britain Standard errors are
indicated Significant differences p lt 005 p lt 001 p lt 0001 are shown
732 Metals measured only in CS in 2007
Use of a combined ICP-OES approach allowed extension of the suite of measured metal concentrations beyond the initial set of seven metals measured in 1998 to include a total assessment of the concentrations of 26 metal or metalloid elements (Li Be Al Ti V Cr Mn Fe Co Ni Cu Zn As Rb Se Sr Mo Cd Sb Sn Cs Ba W Hg Pb U as well as Cd Cr Cu Ni Pb V and Zn) in almost 500 GB soil samples Seven of these single time point measured metals are reported here but the full dataset is available for download from the CS website The analysis includes stratification of the data available for each chosen metal by Broad Habitat and Soil LOI category The seven chosen metals and metalloids have been selected for initial assessment because they have a known toxicity to humans and wildlife and so have been of long -standing
-75
-50
-25
0
25
Bro
adlea
f
Coni
fer
Ara
ble
Impro
ved
Gra
ss
Neut
ral G
rass
Acid
Gra
ss
Shr
ub Hea
th
Bog
All ha
bita
ts
Ch
an
ge i
n s
oil
Zn
co
ncen
trati
on
(mg
kg
)
-75
-50
-25
0
25
Cro
ps a
nd w
eeds
Tall g
rass
and
Her
b
Fertile
grass
land
Infe
rtile g
rass
land
Upla
nd W
oodlan
d
Moo
rland
gra
ss m
osaics
Heat
h and
bog
All ve
geta
tion
type
s
Ch
an
ge i
n s
oil
Zn
co
ncen
trati
on
(mg
kg
)
-75
-50
-25
0
25
Min
eral
Hum
us-m
iner
al
Org
ano
-min
eral
Org
ani
c
Ch
an
ge in
so
il Z
n c
on
cen
trati
on
(mg
kg
)
a) Broad Habitats
c) LOI categoriesb) Aggregate vegetation class
153
Countryside Survey Soils Report from 2007
7 Soil metal concentrations
regulatory concern because they are essential metals that can elicit both deficiency at low concentration and toxicity at high concentration and or because new application (fuel additive nanomaterial) means that current commercial and consumer product uses are increasing Specific reason for selection for each metalmetalloid are
Al is selected as it is common in soils and has been w idely implicated in toxicity during
acidification
As is selected as it is a known risk for food chain transfer to wildlife and humans
Mn is selected as it is widely used in an increasing number of commercial products
Hg is selected because it is the focus of the Defra Critical Loads metals project and also because
no change has been detected in European Moss Surveys indicating continued deposition at historic
rates
Mo is selected as it is essential and is currently one of the focus metals for EU wide m etals risk
assessment activities
Se is selected as it has a small ldquowindow of essentialityrdquo meaning it is known to cause toxicity at
high concentration but and also to be deficient at low levels in soil
Ti is selected as it is of growing regulatory concern due to commercial uses including in
nanoparticle forms
Aluminium Concentrations of aluminium were higher than those of Cd Cu Cr Ni Pb Zn As Mn Hg Mo Se or Ti by at least a factor of ten and more than this in many cases Within Broad Habitats concentration ranged from 2060 mgkg in Bog to almost 12000 mgkg in Arable and Horticulture and Improved Grassland soils Habitats that are associated with lowland areas on mineral soils such as Improved and Neutral Grassland and Arable and Horticulture contained significantly higher Al concentrations than habitats such as Dwarf Shrub Heath and Bog which are associated with upland areas on organic of organo -mineral soils (Fig 79) The analysis by LOI indicates that Al concentrations in soils are significantly different in organic soils when compared to the three remaining soil categories Since organic soils are most commonly found in habitats such as Bog and Dwarf Shrub Heath this suggests that the soil type associated with these habitats may have important influences on soil Al concentration Particularly important are likely to be the lower pH of soils in upland habitats and also high rainfall rates found in these areas Both of these factors can lead to greater metal mobility resulting in greater leaching losses Figure 79 Measured soil Al concentration (+- 95 CIs) in soils (0-15 cm depth) within a) Broad Habitats b) Soil
LOI categories across Great Britain Columns not sharing the same letter are significantly different at p lt 005
level
ba
0
2000
4000
6000
8000
10000
12000
14000
16000
Bro
adlea
f
Coni
fer
Ara
ble
Impro
ved
Gra
ss
Neut
ral G
rass
Acid
Gra
ss
Shr
ub Hea
th
Bog
S
oil
Al
co
ncen
trati
on
(mg
kg
) a
bb
ab
a
c
d
a
0
2000
4000
6000
8000
10000
12000
14000
Min
eral
Hum
us-
min
era
l
Org
ano-
min
eral
Org
anic
So
il A
l co
ncen
trati
on
(mg
kg
)
aa
b
a
154
Countryside Survey Soils Report from 2007
7 Soil metal concentrations
Arsenic
Concentrations of arsenic analysed by Broad Habitat ranged 302 mgkg in Bog to 1102mgkg in soils under
Improved Grassland (Fig 710) When As concentration are compared across habitats it is evident that the
highest concentration like those for Al are found in Arable and Horticulture and Improved and Neutral
Grasslands Acid Grassland and Broadleaved and Coniferous Woodland soils were intermediate while
habitats associated with more remote and upland area such as Bogs and Dwa rf Shrub Heath soils contain
significantly lower As concentration than soils in lowland agricultural habitats ( Fig 710) Analysis by soil LOI
category indicated that soil As concentrations were significantly higher in mineral soils than in Organo -
mineral and Organic soils (Fig 710)
Figure 710 Measured soil As concentration (+ - 95 CIs) in soils (0-15 cm depth) within a) Broad Habitats b)
Soil LOI categories across Great Britain Columns not sharing the same letter are significantly different at p lt
005 level
Soil Arsenic (As) levels in GB soils measure in CS in 2007 were interpolated using median indicator kriging
to predict the probability of exceeding the median value of the data set (807 mgkg) The use of indicator
kriging rather than ordinary kriging and spatial interpolation arises because of the type of data being
analyzed In the case of soil metals and metalloids the assumption of connectivity between sample points
with extreme values in space is not necessarily va lid As a result ordinary kriging incorporating these
extreme values provides erroneous interpolation biased towards extreme s Indicator kriging provides a
method of spatially interpreting the underlying patterns in the data without such a bias interpo lating the
probability that the data falls above or below a given threshold A probability of 1 or above indicates that the
data exceeds the specified threshold value represented by the median concentration (As 807 mgkg) at that
location Data were interpolated in this manner onto a 1 km GB grid Mapping of As concentration as the
probability to exceed median values indicates highest probability of exceedance (ie high likelihood of high
concentrations) in soil in the Midlands and south of England and Wales (Fig 711) This spatial distribution of
As reflects patterns in As concentration measured in previous soil and stream sediment surveys such as the
NSI soil metal survey and G-BASE The higher frequency of above average soil As concentrations found in
these regions can be linked to the known presence pf As rich Jurassic and Cretaceous rocks from which the
surfaces soils are derived Indeed areas of the south-west of England notably in Devon and Cornwall are
well known for the prevalence of historic arsenic mining areas (eg in the Tamar valley)
ba
0
2
4
6
8
10
12
14
Bro
adlea
f
Coni
fer
Ara
ble
Impro
ved
Gra
ss
Neut
ral G
rass
Acid
Gra
ss
Shr
ub Hea
th
Bog
So
il A
s c
on
cen
trati
on
(mg
kg
) bc
a a
c
ab
cd
d
bc
0
2
4
6
8
10
12
Min
eral
Hum
us-
min
era
l
Org
ano-
min
eral
Org
anic
So
il A
s c
on
cen
trati
on
(mg
kg
)
b
c
a
ab
155
Countryside Survey Soils Report from 2007
7 Soil metal concentrations
Figure 711 Map of probability that a plot exceeds the median value of 807 mgKg As in soils (0 -15 cm)
collected from across GB in CS in 2007 ndash value of one indicate guaranteed exceedance values of 0 non
exceedance
Manganese
Mean manganese concentrations varied between Broad Habitats by approximately an order of magnitude
ranging from 46 mgkg in Bog and 566 mgkg in Dwarf Shrub Heath to 558 mgkg and 495 mgkg in the
Arable and Horticulture and Improved Grassland soils As for Al and As highest Mn concentrations were
found in habitat categories that are associated with lowland areas located principally on mineral soils These
include soils in Improved and Neutral Grassland and Arable and Horticulture habitats Upland habitats
located on acid organic soils such as Bog Dwarf Shrub Heath and also Acid Grassland showed the lowest
Mn concentrations Coniferous and Broadleaved Woodlands were intermediate Analysis by L OI supported a
role for soil type alone in determining the patterns of Mn concentration between Broad Habitats A clear
pattern of significant reduction in measured Mn concentrations was found in soil categories of increasing LOI
(Fig 712) This suggests that the soil characteristics in some habitats such as the lower mineral soil
content and typically lower pH values of Bog Dwarf Shrub Heath and Acid Grassland habitats coupled to
high rainfall in the upland areas may be important in explaining obser ved differences through their effects on
leaching rates
156
Countryside Survey Soils Report from 2007
7 Soil metal concentrations
Figure 712 Measured soil Mn concentration (+ - 95 CIs) in soils (0-15 cm depth) within a) Broad Habitats b)
Soil LOI categories across Great Britain Columns not sharing the same letter are sig nificantly different at p lt
005 level
Mercury Mercury was the sole metal amongst the 13 discussed in detail in this chapter for which measured concentration frequently did not exceed the analytical limits of detection Of the 414 samples successfully digested and analysed for Hg concentration 175 (42) contained Hg concentrations that were below the detection limit of 0067mgkg When correcting the low level unquantified samples to a value of half the analytical detection limit in accordance with standard practice measured Hg concentration between habitats ranged from 0052 mgkg in Arable and Horticulture soil to 0187 in Bog Stratification by Broad Habitat indicated a contrasting trend to Al As and Mn for soil Hg Thus highest concentrations were found in Bogs Dwarf Shrub Heath and Acid Grassland and lowest concentration in Arable and Horticulture and Improved and Neutral Grassland Hg concentrations were also influence by soil LOI category showing significant differences between all treatments with highest values in organic soils ( Fig 713) At high concentrations Hg is known to be toxic to biota and also to accumulate in food chains High Hg concentrations have for example been detected in tissues of piscivorus species in the UK Predatory Bird Monitoring Scheme suggesting that this may be an important exposure route particularly for organic mercury The presence of higher concentrations of Hg associated with habitats such as Acid Grassland Dwarf Shrub Heath and Bog and with Organic soils indicates that the greatest potential for Hg exposure in wildlife is likely to occur in these principally upland areas
ba
0
100
200
300
400
500
600
700
Bro
adlea
f
Coni
fer
Ara
ble
Impro
ved
Gra
ss
Neut
ral G
rass
Acid
Gra
ss
Shr
ub Hea
th
Bog
So
il M
n c
on
cen
trati
on
(mg
kg
)
cd
a a
b
deef
f
bc
0
100
200
300
400
500
600
700
Min
eral
Hum
us-m
iner
al
Org
ano-
min
eral
Org
anic
So
il M
n c
on
cen
trati
on
(mg
kg
)
c
d
b
a
157
Countryside Survey Soils Report from 2007
7 Soil metal concentrations
Figure 713 Measured soil Hg concentration (+ - 95 CIs) in soils (0-15 cm depth) within a) Broad Habitats b)
Soil LOI categories across Great Britain Columns not sharing the same letter are significantly different at p lt
005 level
Molybdenum Mean molybdenum concentrations ranged between Broad Habitats by less than a factor of two Highest concentrations of 0979 mgkg were found in Dwarf Shrub Heath soils and lowest concentrations of 0581 mgkg in Coniferous Woodlands (Fig 714) The difference in Mo concentration between these two Broad Habitats was significant This was not the case for any other Broad Habitat pair except Coniferous Woodland and Bog Stratification by LOI indicated that mineral soils contain significantly lower Mo concentration than either Organo-mineral or Organic soils Difference in mean concentration were however a ctually rather small (maximum difference 02 mgkg between Mineral and Humus-mineral soils)
Figure 714 Measured soil Mo concentration (+ - 95 CIs) in soils (0-15 cm depth) within a) Broad Habitats b)
Soil LOI categories across Great Britain Columns not sharing the same letter are significantly different at p lt
005 level
ba
0
005
01
015
02
025
Bro
adlea
f
Coni
fer
Ara
ble
Impro
ved
Gra
ss
Neut
ral G
rass
Acid
Gra
ss
Shr
ub Hea
th
Bog
So
il H
g c
on
cen
trati
on
(mg
kg
)
c
d d
bc
ab
c
a
d
0
005
01
015
02
025
Min
eral
Hum
us-m
iner
al
Org
ano-
min
eral
Org
anic
So
il H
g c
on
cen
trati
on
(mg
kg
)
b
a
cd
ba
0
02
04
06
08
1
12
14
16
Bro
adlea
f
Coni
fer
Ara
ble
Impro
ved
Gra
ss
Neut
ral G
rass
Acid
Gra
ss
Shr
ub Hea
th
Bog
So
il M
o c
on
cen
trati
on
(mg
kg
) b abab ab
ab
a
aab
0
02
04
06
08
1
12
14
Min
eral
Hum
us-m
iner
al
Org
ano-
min
eral
Org
anic
So
il M
o c
on
cen
trati
on
(mg
kg
)
a
a
ab
b
158
Countryside Survey Soils Report from 2007
7 Soil metal concentrations
Selenium Se is an essential trace element that is also toxic at high concentrations Hence it is often stated to have a small ldquowindow of essentialityrdquo for env ironmental concentration within which neither deficiency or toxic would be anticipated Measured mean Se concentrations in CS in 2007 soils differed between Broad Habitats by approximately a factor of 4 Highest concentrations were in habitats associated w ith low pH organic rich upland soils such as Bog Dwarf Shrub Heath and Acid Grassland Lowest concentrations were in Arable and Horticulture and Improved and Neutral Grassland soils (Fig 715) Analysis by soil LOI stratification indicated significant differences in Se concentrations between all soils types with highest Se concentration associated Organic soils and a clear trend for decreasing concentration in lower LOI soils Cases of Se toxicity have most frequently been associated with point sourc e industrial release scenarios or the local consumption of vegetables grown on selenium-rich carbonaceous shale derived soils (as affected member of a rural Chinese population) Such exposure scenarios are not relevant to the GB situation indicating that Se toxicity is unlikely to be a major national issue of concern As well as high concentrations being toxic to humans as well as other plant and animal species Se can also affect plant growth and animal health as a result of deficiency Again in China th is has been linked both to effects of crop production and also to human disease (Wang and Gao 1998) Currently no criteria exist that set a critical concentration for Se deficiency in soils For plants growing on potentially Se deficient soils it is clear that the value for deficiency will depend on both the plant species considered and also the effect of soil properties on Se bioavailability Further for establishing a lower level for human food consumption and for animal (incl uding livestock) health the composition of the diet and the proportion that is grown on Se deficient soils is also an important factor especially when a prominent portion of diet sourced locally On the basis of published studies probable concentrations for deficiency are likely to be in the range 01-025 mgkg In GB soils no plot contains Se levels below these concentrations Taking a conservative value of 05 mgkg as an indication of potentially deficient soil only 8 of 414 plots (19) contain soi l Se level below this value Hence it is unlikely that deficiency in soils Se concentration is a major factor that is influencing the nature of prevalent plant communities across GB Figure 715 Measured soil Se concentration (+ - 95 CIs) in soils (0-15 cm depth) within a) Broad Habitats b)
Soil LOI categories across Great Britain Columns not sharing the same letter are significantly different at p lt
005 level
Titanium TiO2 is currently one of the most widely used nanoparticle types in consumer products Concerns about the potential effects of nanoparticle on human health and wildlife have resulted in a growing interest in the biogeochemistry of titanium Particularly important is to establish baseline concentration of Ti in so il waters and sediments since these provide a natural background against which any additional input of Ti in
ba
0
05
1
15
2
25
3
35
4
45
Bro
adlea
f
Coni
fer
Ara
ble
Impro
ved
Gra
ss
Neut
ral G
rass
Acid
Gra
ss
Shr
ub Hea
th
Bog
So
il S
e c
on
cen
trati
on
(mg
kg
)
a
aa a
a
a
a
a
0
05
1
15
2
25
3
35
4
Min
eral
Hum
us-m
iner
al
Org
ano-
min
eral
Org
anic
So
il S
e c
on
cen
trati
on
(mg
kg
)
b
a
c
d
159
Countryside Survey Soils Report from 2007
7 Soil metal concentrations
nanoparticle form would have to be detected In GB soil measured Ti concentrations ranged between Broad Habitats by approximately a factor of 3 from a highest concentration of 109 mgkg in Bog soils to 325 mgkg in Neutral Grassland (Fig 716) Between Broad Habitats soils from Bog Dwarf Shrub Heath and Acid Grassland contained higher concentrations than Arable and Horticulture and Neutral and Improved Grassland with Broadleaved and Coniferous Woodland intermediate Stratification by LOI indicated that mineral soils contained significantly lower Ti concentration than Oragno -mineral soils The analysis indicates a relatively high background level of Ti in GB soils (50-100 mgkg) against which any future inputs of titanium must be detected Figure 716 Measured soil Ti concentration (+ - 95 CIs) in soils (0-15 cm depth) within a) Broad Habitats b)
Soil LOI categories across Great Britain Columns not sharing the same letter are significantly different at p lt
005 level
74 Discussion and Policy Implications
A number of surveys have measured metal concentrations in soils and stream sediments collected from a network of sites within GB or constituent countries The UK Soil and Herbage Survey conducted by the Environment Agency (EA) for England and Wales measured concentrations of 13 elements (Cd Cr Cu Mn Hg Ni Pb Pt Ti V Zn Sn As Zn) in soil and vegetation from 122 rural sites 29 urban sites and 54 industrial sites across the UK (Ross et al 2007) Measurement of soil (015cm) trace element concentrations were accompanied by additional measurements of the concentration of organic pollutants including polychlorinated biphenyls polycyclic aromatic hydrocarbons and polychlorinated dioxins and furans Analysis of the data was conducted to assess mean concentration o f measure trace pollutants and metals in soil according to Country (England Scotland Wales) and site location ( rural urban industrial) All data from the UK Soil and Herbage Survey has been published To date however the sampling and analysis campaig n has not been repeated meaning that an assessment of change in trace element concentration is not possible within the dataset An extensive survey of metal concentration in UK soils has also been conducted within the framework of the National Soil Inventory (NSI) program This study has reported on a range of properties of UK soils including total and extractable metal concentrations in over 6000 soil samples collected across England and Wales with further data for Scotland available through the NSI Scotland Phase 1 and 2 projects A set of detailed spatially resolved maps have been produced from this data which include maps of soil metal concentration (McGrath and Loveland 1992) The Geochemical Baseline Survey of the Environment (G-BASE) which is coordinated by the British Geological Survey (BGS) is also a large scale and long running survey of stream water stream sediment and soil chemistry that has measured metal concentrations in stream and soil
ba
0
20
40
60
80
100
120
140
160
180
Bro
adlea
f
Coni
fer
Ara
ble
Impro
ved
Gra
ss
Neut
ral G
rass
Acid
Gra
ss
Shr
ub Hea
th
Bog
S
oil
Ti
co
ncen
trati
on
(mg
kg
)
bc
d cd d
ab
aa
cd
0
50
100
150
200
250
Min
eral
Hum
us-m
iner
al
Org
ano-
min
eral
Org
anic
So
il T
i co
ncen
trati
on
(mg
kg
)
a
a
a
b
160
Countryside Survey Soils Report from 2007
7 Soil metal concentrations
samples (5-20 cm depth) collected at an average density of one sample every 1ndash2 km2 of UK land surface
(wwwbgsacukgbasehomehtml) To date G-BASE has been completed for all regions except the Southern third of England with this area is scheduled for completion over the next decade Compared to the EA NSI and BGS surveys the soil component of Countryside Survey in 2007 has a spatial resolution for the trace metals comparable with that of the EA‟s UK Soils and Herbage survey The Soil and Herbage survey included 205 sample sites while CS has measurements for 256 squares although within each square 5 samples in CS in 1998 and 2 in CS in 2007 have been measured The spatial resolution of CS is however below those of either the G-BASE or the NSI datasets which each comprise a much greater number of analysed samples Compared to the other major soil and stream sediment survey con ducted in the UK CS is unique because sites are visited over a single season at time periods separated over a number of years (6-9 year intervals between surveys) Within the soil component of CS samples have been collected on three occasions in survey years (1978 1998 2007) and trace metal concentrations measured in the surveys in 1998 and 2007 This means that CS has the unique ability to look for large scale change in soil properties including trace metal concentrations over time within GB top soils (0-15 cm) Despite the (relatively) sparse spatial resolution CS soil metal analyses can nonetheless be a valuable addition to current knowledge on trace element concentrations in GB soils In particular because soil metal concentrations are not measured in isolation but instead form part of a wider survey of the physical chemical and biological characteristics of GB habitats measurement of soil metal concentrations can be stratified and correlated according to a range of other measurement parameters Metal content of soil is derived from two main sources (Boruvka et al 2005) - either naturally from the geogenic weathering of base rock during soil formation (pedogenesis) or anthropogenically through point source or diffuse pollution andor solid waste disposal (Merian et al 2004) There is therefore a need to consider both potential sources when assessing d ifference in metal concentration between habitats and also over time In the absence of human inputs it can be expected that the metal concentration of soils will reach a steady state which represents the balance of inputs derived from weathering and natu ral deposition (eg volcanic) and outputs due to leaching and vegetative off -take Additional human associated inputs can result in an increase in soil metal concentrations because the increased fluxes to soils will mean that inputs exceed outputs thereby allowing concentrations to rise As soil concentrations start to increase due to for example human associated deposition rates of leaching will begin to increase until eventually a new steady state at a higher soil metal concentration is reached - although this may take decades to hundreds of years depending upon the metal If inputs then reduce long-term reductions in soil concentrations may be initiated as leaching rates exceed inputs Available evidence from the UK Heavy Metal Deposition Monitor ing herbarium studies and Europe-wide survey of metal concentration in moss samples suggests that currently the rates of aerial deposition of metals to soils peaked in the UK in the 1960-1970s and are now in steady decline (RoTAP 2010) Legislation on the concentrations of metals present in fertilisers (especially Cd) domestic and industrial sludges and other waste streams regularly recovered to land have also been effective in reducing input concentrations for a range of trace elements Although input ra tes are likely to be decreasing work within Defra supported projects to assess environmental risks of metals for UK soils still predict exceedances of estimated critical load for Cd and Pb in 96 and 6 of UK soil respectively (Hall et al 2006) Comparison of the concentrations of Cd Cu Pb and Zn measured in CS soil samples in 1998 also indicated that measured concentrations exceeded the soil pH and LOI corrected critical limits for these metals as developed by Lofts et al (2004) within Defra funded projects to develop a critical loads approach for trace metals by at least a factor of 3 in 0 207 155 and 221 of soil samples for Cd Cu Pb and Zn respectively (Spurgeon et al 2008) These analyses suggest that soil metal concentrations in GB are elevated as a result of direct inputs and that risk to soil communities as a result of this metal loading cannot be excluded With inputs in potential decline a key aim in CS was to see whether the trend for increasing soil surface metal concentration has been reversed to the point where leaching and other losses may exceed inputs and so measured soil metal concentrations may have started to decline a t a rate detectable in the timeframe of successive Countryside Surveys When looking for change between temporally separate surveys it is important to consider the influence that any difference in survey methods may play since differences in method may lead to potentially spurious indications of change Unfortunately in the case of soil metal analysis within CS a major change in the analytical procedure had to be implemented because of changes in the infrastructure available at the analytical laboratory In particular the hot plate reflux system used for the
161
Countryside Survey Soils Report from 2007
7 Soil metal concentrations
digestion of all soil in CS in 1998 was not available for the reanalysis in 2007 The alternative method used was microwave digestion For both procedures the regent used was Aqua Regia While use of the same reagent for digestion is an important consideration it is also possible that the changes in the temperature and pressure condition during digestion may have an effect on digestion efficiency and on concentrations measured from similar samples To investigate this results for the standard reference material BCR CRM141R calcareous loam soil which was measured multiple times through the analysis programme of both surveys were compared to determine whether the different digestion methods used result ed in similar estimates of trace element concentration in the CRM The CRM assessment was supported by a targeted reanalysis of 1998 collected soils using the 2007 method The comparison of measured concentration in the CRM revealed that the two methods gave slightly different quantification for Cd Cr Cu Ni Pb V and Zn concentrations (Table 72) and this was supported the results of the reanalysis of CS in 1998 soils (Table 73) Thus to allow change analysis a back correction of 1998 measurements wa s conducted to recalculate measured concentration for the 1998 soils to a predicted concentration that would be expected assuming analysis using the 2007 method This was done by dividing 1998 measurements by the ratio of the 19982007 mean measured concentrations for the BCR CRM141R analyse Checks that a single value for correction was applicable to all soils were conducted by plotting predicted change between surveys against both the LOI and pH measured in CS in 2007 soils These plots indicated no clear trend for difference with LOI for 6 of 7 metals and no clear trend for 5 of 7 metals for pH Exceptions were V which showed dependency of change on pH and LOI and Cr which showed slight dependency for pH With metal inputs to GB soils estimated to be fa lling dynamic modelling within Defra funded projects on critical loads assessment has been used to estimate the potential residence times of some existing pollutant metals in UK soils This has suggested that the metals will reside in soils for at least m any decades even for relatively mobile metals (eg Cd Zn) and possibly many millennia for metals that have a high affinity to soil organic matter (eg Cd Pb) (Tipping et al 2006b) Extensive datasets on the rates of change of concentrations of metals in soils are currently however scarcely available against which to validate these model predictions The analysis of change between back corrected 1998 data and measurements made in CS in 2007 outlined here can be used to provide initial insight into the rates of change of soil trace metal concentrations Results indicated that generally only small scale changes in measured soil metal concentrations were found between survey years Comparison of concentration indicated that a change in estimated 1998 and measured 2007 concentrations of greater than 10 wer e found in 6 of 21 stratification levels (Broad Habitat AVC soil LOI Category) for Cd 9 of 21 for Cr 13 of 21 for Cu 3 of 20 for Ni 3 of 20 for Pb and 5 of 22 for Zn The small magnitude of change in soils estimated between surveys means that a sig nificant change in concentrations at the GB scale was detected only for Cu For this metal a small magnitude but highly significant estimated increase in measure concentration of 2 mgkg was detected No other metal showed a significant change in measured concentration across GB Stratification of the data by Broad Habitat AVC and soil LOI revealed addition information about patterns of change in soil metal concentrations in different strata All metals showed significant change for at least one category level Importantly when considering stratification by so many categories the potential for type 1 statistical error is increased in line which the number of strata considered To include analysis by broad AVC and soil LOI category involves separate statistical testing of approximately 20 separate categories for each metal Since the significance of each is calculated separately and the cut off for statistical significance was 005 it will be expected that for each analyte one type I error (ie a false positive where a truly non-significant result is deemed significant in a test) would be anticipated within the analysis While multiple sample correct algorithms can be used to control for type I error arising from multiple testing for significance in CS such algorithms are not used because the extra stringency for type 1 error come with the penalty of an increase probability of type 2 errors (ie a truly significant result deemed non-significant in a test) This could mean that truly significant effects at the national scale are missed with potential impact for the environment and policy Where statistically significant effects are found careful review of relevant evidence that supports these as true responses is needed In particular identification of po tential drivers of change is needed as discussed briefly below Cadmium Soil (0-15cm) Cd showed only relatively small changes between survey with an overall decline of 0013 mgkg (3) in 2007 soils The only statistically significant change found related to a significant decrease in soil Cd in Heath and Bog vegetation and Organo-mineral soils The overall decline in Cd concentration might reflect declining deposition of this metal as detected in monitoring programs Cd is a particularly labile metal
162
Countryside Survey Soils Report from 2007
7 Soil metal concentrations
and as a result it may be expect to show relatively rapid leaching from soils leading to reduced soil Cd levels There is no obvious reason why either Heath and Bog vegetation or Organo -mineral soil should show significant reductions in soil Cd while other habi tats do not One possibility is that the remaining presence of Cd in some fertiliser may be maintaining Cd concentration in farmed soils while in soils that are not subjected to fertiliser application during land management soil Cd loses may now exceed in puts allowing concentration to reduce Chromium Soil (0-15cm) Cr showed a decrease of 09 mgkg (46) between 1998 and 2007 Broadleaved Wooodland Arable and Horticulture and Improved and Neutral Grassland soils characterised by Crop and Weed and Fertile Grassland vegetation showed significant decreases in soil Cr levels Decreases were also found in Mineral and Humus-mineral soils Bogs and Organo-mineral soil showed significantly higher soil Cr concentrations The results for Cr initially suggest that in managed habitats particularly those where crops including grass for livestock are grown the predominant trend of soil Cr concentration is down This is not though the case with Acid Grassland Dwarf Shrub Heath and Fen Marsh and Swamp soils which i n addition to Bogs showed increased Cr concentrations There are two potential explanations for the differences in trend in Cr concentration between habitats as observed The first potential cause of the apparent trend in soil Cr concentration is that me asurement errors relating to difference in digestion efficiency between high pH low LOI mineral soils and low pH high LOI organic soils may be in part responsible Comparisons of change across the 2007 soil pH and LOI range indicates that there is no trend for Cr concentration to show greater change in more organic rich soil ( Fig 72) A slight trend for greater change in high pH soil is however indicated ( Fig 71) At a neutral pH this effect results with a potential discrepancy of up to 27 mgkg in back corrected 1998 concentrations Effects of the method shift between surveys may therefore be the cause of some of the observed declines in mineral neutral soils and associated habitats and vegetation classes For low pH soils effects associated wi th method change are likely to be less important as a cause of Cr concentration increase since comparison suggests comparability between predicted 1998 and measured 2007 concentrations at higher pHs In those habitats that are characterised by low pH such as Bogs Acid Grassland and Dwarf Shrub Heath the increased Cr concentration found cannot therefore be disregarded as a methodological error suggesting that in these areas deposition loads may still exceed loses A second potential reason for the habitat difference found in the direction of change of soil Cr concentration that is also worth consideration is the role of cropping as an additional loss flux The habitats where Cr concentrations were increasing namely Arable and Horticulture and Grassla nds are predominately used for agricultural production In these systems harvesting of plants and livestock may provide a route of loss of Cr from soil that is not relevant to areas not under agricultural production Such increased loss may contribute to the reduction in soil Cr found in these areas when compared to uncropped areas Copper Soil (0-15cm) Cu was the only metal that showed a significant change at the GB scale increasing by a mean value of 2 mgkg across the full dataset Comparison of the effect of the change in digestion procedure between surveys by analysis of CRMs indicated that only a small change in measured Cu concentration resulted This meant that only a small correction factor needed to be applied to the 1998 measured values Analysis of change in soil Cu between back corrected 1998 and 2007 values in relation to both soil pH and LOI indicated that the magnitude of Cu change in soils could not be related to either parameter The small size of overall change between CRM measurements made by different methods and also the absence of trends with soil pH and LOI suggests that the change in digestion procedure was not a major contributing factor behind the observed increase in soil Cu concentrations Within habitats Improved Grasslands Dwarf Shrub Heath and Bog also showed significant increases in soil Cu as did the AVCs associated with these habitats Significant changes in 3 of 4 soil LOI categories were also found Cu has a high affinity with soil organic matter and so it may be expected to show only very low rates of leaching loss from soils Even if inputs of Cu in soils were reduced to zero it would be anticipated that the Cu that has already been loaded into GB soils would take a considerable time (perhaps many centuries) to be completely leached Monitoring networks have shown that the concentrations of Cu being deposited to soil are likely to be decreasing as a result of tighter emission controls However in contrast to other metals the
163
Countryside Survey Soils Report from 2007
7 Soil metal concentrations
magnitude of these decreases in deposition remains relatively modest For example Cu deposition had reduced by only 20 in a European wide survey of metal concentration in mosses compared to 72 for As 72 for Pb 60 for V and 52 for Cd At the same time while deposition has been slight ly decreasing there is a growing body of evidence to suggest that the use of Cu containing supplements in the livestock industry are potentially increasing the Cu load being added to soils under grazed areas and in areas to which animal manures are applied Additionally Cu concentrations are known to be associated with sewage sludge material and green waste which are frequently recovered to land The fact that among habitats Improved Grasslands were found to contain Cu concentrations significantly increas ed by 26 mgkg suggests that the presence of Cu concentration in animal manure may indeed being playing a role in increasing national soil Cu levels to some extent That Cu concentration were also increasing in all other habitats and significantly in some cases can be taken as quite strong evidence that currently Cu inputs still exceed outputs from leaching and cropping leading to further elevation in Cu concentrations over time
Figure 717 Map of estimated change in measures soil Cu concentration (mgkg) in soils (0-15 cm) collected
from across GB in CS in 1998 and 2007
Figure 917 Map of estimated change in
measured soil Cu concentration in soils
(0-15 cm) collected from across GB in CS
in 1998 and in 2007
164
Countryside Survey Soils Report from 2007
7 Soil metal concentrations
An analysis of the spatial structure within estimated change in soil Cu concentrations was conducted by using
kriging to interpolate values for change (Fig 717) This analysis was done using ordinary kriging to
interpolate between the Countryside Survey sample points Routine checking of data for outliers was
conducted and the working data set was transformed using a normal score procedure to obtain a Gaussian
distribution The data were then interpolated on a 1km UK grid using ordinary kriging and finally the kriged
data were back-transformed to produce an interpolated map of Cu change Mapping highlighted significant
spatial structure within the change dataset with greatest increases being associated with hotspots in areas
of the Northern England and Mid and South Wales uplands Where decreases were indicated these were
associated most commonly with reductions in concentration in lowland areas of the South and East England
that are associated with intensive arable land use Mapping of change thus highlights that increases in soil
Cu occurred principally in upland areas where both output fluxes associated with cropping may be limited and
also where livestock rearing may play a role as a potential additional source of Cu input Nickel Soil (0-15cm) Ni increased across all soils by 16 mgkg between survey years Two habitats showed significant decreases in measured soil Ni These were Broadleaved Woodland and Arable and Horticulture Crop and Weed vegetation also showed significant decrease Ni increased significantly in Neutral Grassland and Bogs As decreases were concentrated in habitats associated frequently with neutral low organic soils this raises the possibility that differential digestion efficiency may be a factor in the observed difference as was suggested to be the case for Cr Comparison of trends of change between back corrected 1998 and 1998 measurements however suggests that this was not the case as no trend with either pH or LOI was observed (Fig 71 and 72) The fact that the habitats that showed increases in Ni are associated with different soils types also suggests that analytical artefacts are not the primary cau se of the observed change A second potential cause of change may be the role of cropping as an additional loss flux for this metal as also highlighted for Cr In particular in Arable and Horticulture area harvesting of plants may provide an additional route of loss that allows soil Ni concentrations to decrease Such losses would not be relevant to less productive land such as Bogs where removal of plant biomass does not regularly take place
Lead Soil (0-15cm) Pb concentrations showed a small non-significant decrease between surveys This is potentially consistent with an overall loss of soil Pb in particular as the move to unleaded petrol has substantial decreased Pb inputs over the past two decades Although the overall dataset indicated slight losses two habitats showed significant increases There is no obvious reason why these two habitats Improved Grassland and Dwarf Shrub Heath should show such increases particularly as they are associated with different soil types Among AVCs and soil type no significant change in soil Pb concentrations were found The relatively small change in measured soil Pb and limited significant change in only a small number of unrelated habitat strata suggests that the high affinity of Pb to soil organic matter whi ch results in long predicted residence times for of Pb in soils may currently be limiting rates of Pb loss from soils Thus while deposition maybe decreasing soil Pb concentrations may be doing so only very slowly or not at all Zinc Zn (0-15cm) showed a small non-significant decrease between surveys and Zn concentrations were significantly reduced in two habitats Arable and Horticulture and Neutral Grassland No dependency of change between back corrected 1998 and 2007 measurements on either soil pH or LOI was detected in the dataset This suggests that the decreases seen are probably not the result of an analytical artefact relating to different efficiencies of soil digestion Instead the potential role of cropping as an additional loss flux as highlighted earlier for Cr and also for Ni may be important As deposition rates decrease in those areas where there is loss both from leaching and cropping it is possible that outputs may exceed current rates of metal inputs leading to a small but in some cases significant overall loss of soil Zn
165
Countryside Survey Soils Report from 2007
7 Soil metal concentrations
741 Policy implications The results of the comparison of back corrected 1998 and CS in 2007 analyses indicated that as would be expected only relative small changes in soil trace metal concentrations had occurred between surveys For one metal Cu the difference (an increase) was statistically significant For all metal s when data was stratified further statistically significant differences were seen For Cu these were mainly associated with significant increases for two metals Cd and Pb the changes were small and apparently idiosyncratic while for three metals (Cr Ni Zn) the changes were somewhat similar with reduction seen particularly in crop lands and no change or in some case slight and sometimes significant increases found in less managed habitats Overall the results suggests that at present the changes in deposition that have occurred over recent decades have yet to lead to substantial changes in measure d soil metal concentrations For some metals such as Cu and Cd it is l ikely that additional sources (animal manures and possibly sewage sludge manures and compost for Cu and fertiliser for Cd) beyond atmospheric inputs are important in maintaining or even increase soil concentrations principally in managed areas For the remaining metals especially Cr Ni and Zn there is some suggestion that in areas where cropping takes place output fluxes may now exceed inputs meaning that soil concentrations can start to decline Overall this suggest s that the managed landscape where intensive cropping takes place but sewage sludge animal manures and composts are rarely applied may be among the first habitats to show a return of GB soil metal concentrations from their current slight -moderately elevated states to their pre-industrial background concentrations These areas could thus be a focus for future monitoring
75 References
REFERENCES
Boruvka L Vacek O Jehlicka J 2005 Principal component analysis as a tool to indicate the origin of
potentially toxic elements in soils Geoderma 128 289-300
Emmett BA Frogbrook ZL Chamberlain PM Griffiths R Pickup R Poskitt J Reynolds B Rowe
E Spurgeon D Rowland P Wilson J Wood CM 2008 CS Technical Report No 307 Soils Manual
NERCCentre for Ecology amp Hydrology 180 pp (CEH Project Number C03259)
Hall JR Ashmore M Fawehinmi J Jordan C Lofts S Shotbolt L Spurgeon DJ Svendsen C
Tipping E 2006 Developing a critical load approach for national risk assessments of atmospheric metal
deposition Environmental Toxicology and Chemistry 25 883-890
Lofts S Spurgeon DJ Svendsen C Tipping E 2004 Deriving soil critical limits for Cu Zn Cd and Pb
a method based on free ion concentrations Environmental Science and Technology 38 3623-3621
McGrath SP Loveland PJ 1992 The Soil Geochemical Atlas of England and Wales Blackie Academic
and Professional Glasgow
Merian E Anke M Inhat M Stoeppler M (Eds) 2004 Elements and their Compounds in the
Environment Wiley VCH Weinheim Germany
Ross SM MD W Copplestone D Warriner M Crook P 2007 UK Soil and Herbage Pollutant Survey
Environmental concentrations of heavy metals in UK soil and herbage UK Soil and Herbage Pollutant
Survey Environment Agency p 132
RoTAP 2010 Review of Transboundary Air Pollution Acidification Eutrophication Ground Level Ozone and
Heavy Metals in the UK Defra
166
Countryside Survey Soils Report from 2007
7 Soil metal concentrations
Spurgeon DJ Rowland P Ainsworth G Rothery P Long S Black HIJ 2008 Geographical and
pedological drivers of distribution and risks to soil fauna of seven metals (Cd Cu Cr Ni Pb V and Zn) in
British soils Environmental Pollution 153 273-283
Tipping E Lawlor AJ Lofts S 2006a Simulating the long-term chemistry of an upland UK catchment
Major solutes and acidification Environmental Pollution 141 151-166
Tipping E Lawlor AJ Lofts S Shotbolt L 2006b Simulating the long-term chemistry of an upland UK
catchment Heavy metals Environmental Pollution 141 139-150
Wang ZJ Gao YX 1998 Biogeochemical cycling of selenium in Chinese environments 1st Asia Pacific
Symposium on Environmental Geochemistry Pergamon-Elsevier Science Ltd Hong Kong Peoples R China
pp 1345-1351
167
Countryside Survey Soils Report from 2007
8 Soil invertebrates
Summary
There were an estimated 128 quadrillion (128x1016
) soil invertebrates present in the top 8 cm of
Great Britain soils during the time of Countryside Survey sampling in 2007 C omparing these
results with those from the survey in 1998 has enable change in soil biodiversity to be estimated at
a national scale
A significant increase in total invertebrate catch in samples from soils (0-8cm) from all Broad
Habitats Aggregate Vegetation Classes and soil organic matter categories except for agricultural
areas on mineral soils was found in Countryside Survey in 2007 The increase in invertebrate catch
was mainly the result of an increase in the catch of mites in 2007 samples This resulted in an
increase in the mite springtail ratio but a decreased Shannon diversity due to the dominance of
mites in 2007 cores
A small reduction in the number of soil invertebrate broad taxa (0 -8cm) was recorded which is not
inconsistent with reported declines in soil biodiversity However repeat sampling is required to
ensure this is not linked to different seasonal conditions in the two sampling years F urther
analysis through focussed study may be needed to assess whether the changes in soil chemistry
land management annual weather patterns or merely natural population variation can explain
observed soil invertebrate community changes
81 Policy background
Key Question Does CS provide any evidence to indicate that there has been a loss of soil biodiversity as has been stated by the EU Measurements Enumeration of the number of soil invertebrate presence within Tullgren funnel extractions of 927 separate 4 cm diameter 8 cm long soil cores collected from plots across GB to give 1) total catch of invertebrates from all broad taxa 2) the number of broad taxa represented by the presence of at least one individual in a core 3) total catch of mites and springtails 4) the ratio of Mites Springtails 5) the Shannon Diversity statistic calculated using counts of the number of individuals within broad taxa including springtail superfamily From this analysis CS in 2007 has provided
Whole Broad Habitats Aggregate Vegetation Class and soil type stratified assessments of the
characteristic (total catch broad taxa representation total catch and relative catch of mites and
springtails Shannon Diversity) of soil invertebrate communities across Great Britain
Information of the change in characteristic of soil invertebrate communities in Great Britain soils
(0-8cm) since initial measurement in Countryside Survey in 1998
Data to contribute to analysis of changes in vegetation selected soil properties and other habitat
characteristics between successive Countryside Surveys in 1998 and 2007
The activities of the soil biota are critical for the provision of many important soil functions and resulting ecosystem services These include but are not limited to biomass production storing filtering and transforming nutrients contaminants and water and acting as a biodiversity pool from which future novel applications and products can be derived Because they are intimately involved in many important soil functions and are fundamental to maintaining soil quality the biological components of soils have considerable potential as indicators of soil quality National-level requirements for biological indicators were
168
Countryside Survey Soils Report from 2007
8 Soil invertebrates
outlined in the Soil Action Plan for England (Defra 2004) and have been investigated in a series of projects funded by Defra as part of the UK Soil Indicators Consortium These have been assessing the relative performance of a range of potential soil bioindicators under field conditions At present comparatively l ittle is known about the biodiversity of soil compared to for example above ground diversity In the microbial realm molecular approaches such as terminal restriction fragment length polymorphism (tRFLP) phylogenetic microarrays and metagenomics are starting to reveal patterns in the diversity and distribution of soil microbes For the soil meio- meso- and macro-fauna molecular approaches to biodiversity assessment still remain in development For some key groups such as earthworms and springtails good keys to the UK and other national fauna do exist although even in these cases traditional morphological taxonomy can be hampered by cryptic speciation (ie occurrence of groups of species which are reproductively isolated from each other but have high morphological similarity) and other taxonomic uncertainties Beyond these better known groups in taxa like mites and nematodes there are significant issues for morphological identification associated with the lack of keys laborious nature of the work and declining expert base Because they are often poorly known few soil species are recognised for their conservation value A few such as some ants and fungi are covered by UK Biodiversity Action Plan (UK BAPs) However as knowledge of soil biodiversity is often sparse it is not well known if and how climate land use land management change and pollution affect populations of even these relatively well known and highly valued species let alone the large amount of often hidden diversity that maybe present in soils Beyond the few soil species covered by BAPs there is a well recognised need to quantify soil biodiversity and determine whether it is possible to observe consistent patterns of population and community structure against a dynamic background of spatial and seasonal variability Key questions in this area of research and conservation relate to determining if and how soil biodiversity changes over time and the nature of the environmental drivers of any such changes Large-scale biodiversity assessment as well as long-term experiments and focussed mesocosm and laboratory studies are all important tools that can contribute data to improve current knowledge in this area
82 Methods
821 Proof of concept
Invertebrate diversity was first measured as part of CS in 1998 and CS is the first and only national scale monitoring of soil biodiversity in the UK The inclusion of invertebrate diversity measurements in CS in 1998 was partially driven by a 1996 report of the Royal Commission on Environmental Pollution (RCEP) on the Sustainable Use of Soils which identified the development of indices of soil biological activity and diversity as a key research priority In the RCEP report it was recognised that a major difficulty in developing soil biodiversity based indicators was the requirement for baseline data on population and community structure and how these change over time It was within this context of a need for baseline information that an assessment of soil biodiversity was deemed timely within CS in 1998 CS was chosen as a suitable vehicle for the assessment because the existing survey infrastructure and sampling regime used in CS could provided a cost-effective framework for integrating a soil biological survey into a study that already included assessment for other land use soil vegetation and water parameters The aim of the soil invertebrate diversity measurements that were conducted in CS in 1998 (enumeration of mainly mesofauna groups collected by Tullgren extraction of a relatively small soil core) was not to sample and identify all invertebrate diversity within a given plot Such an all-taxa biodiversity inventory would instead require use of a wide range of sampling techniques and would be a massive undertaking and highly expensive Instead the aim of CS in 1998 was to produce an initial baseline dataset of invertebrate group level community composition across all major soil groups and habitats of Great Britain The strategy was to capture soil invertebrates that would be abundant and relatively cost -effective to identify The group of soil
169
Countryside Survey Soils Report from 2007
8 Soil invertebrates
invertebrates that best suited these criteria was the soil mesofauna To sample the soil fauna intact soil cores (4 cm diameter 8 cm long) were collected for laboratory extraction of mesofauna This approach was favoured over the use of an on-site hand-sorting technique which would be effective for macroinvertebrates or pitfall trapping which would preferentially sample soil surface active invertebrates Identification of the extracted invertebrates was conducted to broad taxa (phylum order) level for all available and successfully extracted samples (total 1076) collected from CS squares that were initially visited in the 1978 survey Table 81 Overview of soil invertebrate samples and level of taxonomic resolution for CS in 1998 and 2007
1998
2007
Main Plots
km-squares
Main Plots
km-squares
Total sampled 1286 256 927 238 Broad invertebrate taxa 1076 237 927 238 Mites (Acari) Separated to broad group a
-
-
238
90
Checked for Oribatid presence 963 237 238 90 Oribatids present 504 182 212 90 Oribatids identified to species b 504 182 - - Springtails (Collembola) Checked for Collembola presence Separated to broad group c
1076
237
927
238
Collembola present 837 233 816 238 Collembola identified to species 336 176 - -
a Separated into Oribatids Mesostigmatids and Prostigmatids
b PresenceAbsence data only
c Separated into Entomobryoidea Poduroidea Neelidae and Sminthuridae
While the invertebrate sampling undertaken in CS in 1998 identified and enumerated invertebrates extracted to broad taxa for all cores it was also decided to undertake a limited identification of some taxa to a deeper taxonomic resolution (Table 81) Of the two main mesofaunal groups the mites and springtails the mites (Acari) were checked for the presence of the most common major group the oribatidae in the community sample while the Collembola were identified into the superfamily groups of entomobryoidea neelidae poduroidea and sminthuridae In the CS in 1998 samples 504 samples were check for the presence of oribatids mites and all 1076 separated to superfamily for the Collembola In all of the 504 samples checked for oribatids additional identification of mites was undertaken to establish the presenceabsence of individual oribatid species This species level identification was conducted on a voluntary basis by Mr Frank Monson For the springtails species identification and enumeration was conducted for 336 samples representing approximately one third of available samples Analysis of the patterns of distribution of invertebrates in CS in 1998 detected significant differences in invertebrate diversity between Environmental Zones Broad Habitats ITE L and Classes Aggregate Vegetation Classes and Soil Types The 1998 CS dataset forms a valuable baseline that can be used to place specific site region and country-scale changes within a regional and national environmental context Resampling of the CS sites in 2007 provided an opportunity to determine whether these patterns of invertebrate diversity can be consistently detected against a background of spatial and temporal heterogeneity within soil communities The detailed protocols that were developed for soil invertebrate sampling in CS in 1998 have been used for the re-sampling in 2007 By returning to the majority of the CS plots first sampled in 1998 CS in 2007 can
170
Countryside Survey Soils Report from 2007
8 Soil invertebrates
provide information on the temporal stability of soil communities Resource limitations in 2007 meant that it was not possible to identify all invertebrates in all the cores that were collected from the remaining Main Plots that were first sampled in 1998 Of the cores that were available from re -sampled sites a total of 927 cores have been enumerated to broad taxa Of these 927 samples superfamily level identification was conducted for the springtails for all cores and separation of mites to major group for 238 Limited resources meant that no species level identification could be supported although all extracted invertebr ates have been stored and can be made available for future identification on request Soil invertebrate sampling and analysis throughout the CS project is summarised in Table 82 below Table 82 Summary of rationale for measurement of soil invertebrate community composition in CS
Facts Comments
History in CS First measured in CS in 1998 for Main Plots in original 1978 squares only (total 1076 samples)
Repeat of most plots in CS in 2007 to initiate first ever national time-series for soil community assessment
Country level reporting No CS in 1998 did not give country level statistics Smaller data-set in 2007 limits power for Country level reporting for habitat vegetation and soil types stratifications
Links and compatibility to other monitoring programmes
No other GB wide survey or monitoring programmes for soil mesofauna Earthworms surveys being undertaken in Scotland and as part of the Opal project run by the Natural History Museum London
CS unique in UK as soil biodiversity assessment is integrated with other survey approaches that measure land use vegetation soil properties and waters Other countries such as the Netherlands Germany and Canada also have programmes involving biodiversity assessments Measurements of microarthropods are compatible with these schemes
Uniqueness of CS No other GB datasets Only UK wide dataset for mesofauna communities Only UK dataset with time series from repeat visits
Value for money (Policy priority or interpretative value x cost)
Medium Policy relevant and scientifically significant Relatively low cost
Important to establish whether it is possible to detect meaningful changes against spatial and temporal variability
Important in interpreting other data such as UK microbial survey and for integrated assessment
Samples for invertebrate identification and enumeration were collected at all selected Main Plots This included all of the original 1978 256 squares sampled in CS in 1978 that could be revisited Sampling was undertaken using 4 cm diameter by 8 cm long white plastic core following the detailed field protocol described in Emmett et al (2008) and briefly summarised in Chapter 1 Briefly surface vegetation was removed to reveal the soil surface Any litter layer present was not removed The core was knocked into the
171
Countryside Survey Soils Report from 2007
8 Soil invertebrates
ground to the full length of the core using a mallet and plate In stony or shallow soils the sampling point was moved if a full core depth would not be obtained Any such variations in core location were recorded On removal of the core from the ground the outside of the core was cleaned and any excess soil trimmed from the bottom of the core Caps were then gently pushed over the ends of the core and the intact sample posted to CEH in Lancaster as the quickest route of return given the countrywide nature of the sampling programme Soil invertebrates were extracted from cores as soon as possible using a dry Tullgren extraction method This uses surface heating of the exposed surface of the core to drive the soil fauna downwards and out of the open bottom end of the core and into the collection bottles filled with a 70 ethanol preservative below Once collected soil invertebrates were identified to major taxa (Taxonomic level 1) and counted The broad taxa categories used for enumeration was acari araneae chilopoda ndash geophilomorpha chilopoda ndash lithobiomorpha chilopoda coleoptera collembola ndash entomobryoidea collembola ndash neelidae collembola ndash poduroidea collembola ndash sminthuridae copepoda diptera diplura diplopoda gastropoda hemiptera hymenoptera isopoda lepidoptera nematoda nematomorpha oligochaeta opiliones pauropoda protura pseudoscorpions psocoptera pulmonata symphyla thysanura thysanoptera unknown All extracted invertebrates collected from counted cores have been stored in ethanol and are available for further species level identification to interested parties Invertebrate numbers were reported for each quantified soil core
822 Quality control
After an initial identification to broad taxa mite group and springtail superfamily at regular intervals the samples were reassembled and resorted identified and enumerated by an alternative member of staff This second identification and count ing step was then compared with the original count to assess the potential for operator error during processing If any substantive differences in count were found by this cross checking procedure counting was halted and the differences in identifications that lay behind the discrepancies resolved by the counting team Any such changes were noted on the record sheets kept for each sample
823 Reporting
Change in the composition of the soil invertebrate communities as represented by c ounts of the macro and mesofaunal group collected by Tullgren extraction of soil cores collected in CS in 1998 and 2007 have been analysed using a mixed modelling approach using the SAS statistical software platform The statistical approach used for analysing the data for change involved bootstrapping which allows for non-normality in the data without the necessity to know details of the actual distribution As such it provides a more accurate measurement of significance than alternative approaches Annex F of Emmett et al (2008) provides a background document describing the basis of the mixed model procedure As well as looking for overall change at the GB wide scale statistical analyses have been conducted to assess change of measured or calculated parameters soil community parameters within different strata w ithin the data-set These include analysis according to stratification by Broad Habitat Aggregate Vegetation Class and Soil Loss on Ignition (LOI) category which are briefly described here
Broad Habitat - The Broad Habitat classification consists of 27 habitats which account for the entire
land surface of Great Britain and the surrounding sea Countryside Survey reports on 10 major
terrestrial habitats
Aggregate Vegetation Class (AVC) ndash is a high level grouping of vegetation types produced from a
quantitative hierarchical classification of the different plant species found in the original Countryside
Survey sample plots Soil organic matter (LOI) category - mineral (0-8 LOI 0-44 g C kg
-1) humus-mineral (8 ndash 30 LOI
44-165 g C kg-1
) organo-mineral (30 ndash 60 LOI 165-330 g C kg-1
) and organic (60 ndash 100 gt 330 g
C kg-1
)
172
Countryside Survey Soils Report from 2007
8 Soil invertebrates
Measured and calculated parameters that were used as inputs for the analysis were
1 Total catch of invertebrates from all broad taxa to give a measure of overall abundance of invertebrates in CS cores
2 Number of broad taxa represented by the presence of at least one individual in each CS core as a measure of community taxa richness
3 Total catch of mites and springtails only since these two mesofauna groups usually comprised the majority of the invertebrates present in each core
4 The ratio of Mites Springtails since this parameter was found to change in relation to climatic conditions as indicated by annual precipitation (highest mite springtail ratio was found in plots where annual precipitation was highest within GB) in the 1998 data-set
5 Shannon Diversity calculated for each sample using counts of individual number within broad taxa including counts for springtail superfamily as available for all 1998 and 2007 samples
As well as analysis of each parameter according the outlined stratification a spatial analysis was undertaken using geostatistics For the measured parameters tested namely total invertebrate catch mite springtail ratio and Shannon Diversity the semi-variograms identified no spatial correlation at the regional scale For this reason spatial interpolation or mapping of change is not feasible and as a result is not reported further in this chapter
83 Results
831 Total invertebrate catch
The mean number of invertebrates collected from cores in CS in 1998 was 523 and 77 in 2007 ( Table 83) This represented an overall increase of 47 in total catch in CS in 2007 The highest catches of invertebrates were in woodland habitats with high catches also recorded in Acid Grassland and Dwarf Shrub Heath Lowest numbers occurred in three habitats Arable and Horticulture Improved Grassland and Neutral Grassland that are most frequently the subject of intensive management practices Catches in Arable and Horticulture habitats in particular were notably low in both surveys
173
Countryside Survey Soils Report from 2007
8 Soil invertebrates
Table 83 Changes in total invertebrate catch of soils (0 -8cm depth) within a) Broad Habitats b) Aggregate
Vegetation Classes and c) Soil LOI categories across Great Britain Arrows denote a significant change (plt005)
in the direction shown
C) Great Britain - Soil LOI Category
Soil LOI category 1998 2007 1998-2007
Mineral 367 451
Humus-mineral 553 895
Organo-mineral 816 1179
Organic 697 1053
Direction of
significant
changesTotal catch
a) Great Britain - Broad Habitats
Broad Habitat 1998 2007 1998-2007
Broadleaved Mixed and Yew Woodland 922 1032
Coniferous Woodland 904 1524
Arable and Horticulture 309 316
Improved Grassland 385 575
Neutral Grassland 422 86
Acid Grassland 859 1139
Dwarf Shrub Heath 757 1192
Fen Marsh and Swamp 641 843
Bog 493 774
All habitat types 523 77
b) Great Britain - Aggregate Vegetation Class
AVC 1998 2007 1998-2007
Crops and weeds 316 302
Tall grass and Herb 319 552
Fertile grassland 362 525
Infertile grassland 448 799
Upland Woodland 97 1404
Moorland grass mosaics 843 1276
Heath and bog 606 89
All vegetation types 523 77
Direction of
significant
changes
Direction of
significant
changesTotal catch
Total catch
174
Countryside Survey Soils Report from 2007
8 Soil invertebrates
Figure 81 Changes (+- 95 CIs) in total invertebrate catch of soils (0-8cm depth) within a) Broad abitats b)
Aggregate Vegetation Classes and c) Soil LOI categories across Great Britain Standard errors are indicated
Significant differences p lt 005 p lt 001 p lt 0001 are shown
Analysis using the mixed model indicated that the increase seen in total catch in GB soils in CS in 2007 was highly significant (plt0001) Stratification of the data to assess change by Broad Habitat indicated that a significant increase in catch was detected in 5 of 9 Broad Habitats (Fig 81) For the remaining 4 habitats small non-significant increases in catch were found These were Broadleaved Woodlands Acid Grassland and Fen Marsh and Swamp which all showed non-significant increases of 12 325 and 315 respectively and Arable and Horticulture which showed only a 2 increase in mean catch No habitat showed a mean decrease in total invertebrate catch The absence of a clear increase in total invertebrate catch which was evident in all other habitats and significant in most Arable and Horticulture areas is particularly interesting because the absence of an effect is not the result of low sample numbers in the analysis In fact Arable systems are the second best represented habitat after Improved Grasslands in the repeat sampled soi l invertebrate dataset with 217 enumerated samples This suggests that the factor that is responsible for the general increase in invertebrate catches in soil cores sampled from across GB is not applicable to Arable and Horticulture systems
-40
0
40
80
120
160
Min
eral
Hum
us-m
iner
al
Org
ano
-miner
al
Org
anic
Ch
an
ge t
ota
l in
vert
eb
rate
catc
h p
er
plo
t
-40
0
40
80
120
160
Cro
ps a
nd w
eeds
Tall g
rass
and
Her
b
Fertile
grass
land
Infe
rtile g
rass
land
Upla
nd W
oodlan
d
Moo
rland
gra
ss m
osaics
Heat
h and
bog
All ve
geta
tion
type
s
Ch
an
ge t
ota
l in
vert
eb
rate
catc
h p
er
plo
t
-40
0
40
80
120
160
Bro
adlea
f
Coni
fer
Ara
ble
Impro
ved
Gra
ss
Neut
ral G
rass
Acid
Gra
ss
Shr
ub Hea
th
Fen
Bog
All ha
bita
ts
Ch
an
ge t
ota
l in
vert
eb
rate
catc
h p
er
plo
t
a) Broad Habitats
c) LOI categoriesb) Aggregate vegetation class
175
Countryside Survey Soils Report from 2007
8 Soil invertebrates
Further stratification of the data by AVC indicated patterns of change that were generally in line with those indicated by the habitat analysis No significant increase in catch was found between Crops and Weeds and Tall Grass and Herb which are vegetation classes associated with arable landscapes while total catch was significantly higher in all other vegetation classes Analysis by LOI class indicated significant change in total invertebrate catch in all classes with three classes highly significant (plt0001) and the mineral soil (LOI lt 0-8) significant at plt005 Smallest overall increase in total catch was found for the mineral soils in terms of both absolute numbers and percentage change Since these included a large proportion of the Arable and Horticulture s oils (189 of 371 soils in the 0-8 LOI category are from Arable and Horticulture habitats) this suggests that the low organic matter content of these soils possibly in combination with arable land management practice may be a contributing factor preventing increase in the total catch of invertebrates in the mineral soil category to the same extent found in soil with higher LOI
832 Total broad taxa in catch
The mean number of invertebrate taxa represented by at least one individual in soil cores in 1998 was 434 and was 385 in 2007 (Table 84) This represented an overall decrease of 11 in average taxa representation in CS in 2007 compared to 1998 This reduction is highly statistically significant (plt0001) Because of the small size of the core sample used for invertebrate extraction in CS the number of taxa that may be represented within a catch at any given plot is rather idiosyncratic Further both the core size and extraction technique used (surface heating within a Tullgren funnel apparatus ) is targeted at collecting mainly hard bodied soil mesofauna Thus while small arthropods such as mites and springtails are usually well sampled (Van Straalen and Rijninks 1982) soft bodied meiofauna such as nematodes and tardigrade and larger macrofauna such as Oligochaetes centipedes millipedes and woodlice are not well represented in the extracted sample As a result within any one sample the total number of taxa present can be affected not only by habitat and soil conditions but also by the chance inclusion of individuals of larger invertebrates within the sample Taxa representation as a result is subject to large variation in measurement between samples that is independent of fixed factor effects When analysed by Broad Habitats the highest average number of invertebrate taxa was found in Broadleaved Mixed and Yew Woodland in both the CS in 1998 and 2007 (Table 84) High taxa representation in these habitats is consistent with the high overall catches recorded in these areas since there is a positive relationship between overall catch and number of represented taxa within the CS data-set In remaining habitats trends for representation of taxa in different systems varied slightly between surveys Bogs showed low taxa richness in both surveys and Arable and Horticulture systems also had relatively low taxa richness that is consistent with the low overall catch in these areas in both surveys
176
Countryside Survey Soils Report from 2007
8 Soil invertebrates
Table 84 Changes in total number of sampled taxa represented by at least one individual in soil samples (0 -8cm
depth) within a) Broad Habitats b) Aggregate Vegetation Classes and c) Soil LOI categories across Great
Britain Arrows denote a significant change (plt005) in the direction shown
a) Great Britain - Broad Habitats
Broad Habitat 1998 2007 1998-2007
Broadleaved Mixed and Yew Woodland 581 495
Coniferous Woodland 435 466
Arable and Horticulture 413 34
Improved Grassland 454 374
Neutral Grassland 453 433
Acid Grassland 460 397
Dwarf Shrub Heath 426 364
Fen Marsh and Swamp 394 411
Bog 335 328
All habitat types 434 385
b) Great Britain - Aggregate Vegetation Class
AVC 1998 2007 1998-2007
Crops and weeds 427 342
Tall grass and Herb 416 415
Fertile grassland 452 367
Infertile grassland 462 423
Lowland woodland 648 561
Upland Woodland 500 461
Moorland grass mosaics 434 397
Heath and bog 356 336
All vegetation types 434 385
c) Great Britain - Soil LOI Category
Soil LOI category 1998 2007 1998-2007
Mineral 437 373
Humus-mineral 466 408
Organo-mineral 451 425
Organic 360 346
Direction of
significant
changesNumber of broad taxa
Number of broad taxa
Direction of
significant
changesNumber of broad taxa
Direction of
significant
changes
177
Countryside Survey Soils Report from 2007
8 Soil invertebrates
Figure 82 Changes (+- 95 CIs) in total number of sampled taxa represented by at least one individual in soils
(0-8cm depth) within a) Broad Habitats b) Aggregate Vegetation Classes and c) Soil LOI categories across Great
Britain Standard errors are indicated Significant differences p lt 005 p lt 001 p lt 0001 are shown
Analysis of taxa richness using the mixed model indicated that the reduction in the total number of collected taxa in CS in 2007 compared to 1998 was highly significant (plt0001) Stratification of the data to assess change by Broad Habitat indicated that in 5 out of 9 cases (Broadleaved Woodland Arable and Horticulture Improved Grassland Acid Grassland and Dwarf Shrub Heath) the reduction in taxa representation indicated was statistically significant (Fig 82) Analysis using AVC revealed further information about the changes in taxa representation between surveys Thus while all AVC categories showed a reduction in taxa richness greatest change was found for Crops and Weeds and in Fertile Grassland In both cases these changes were statistically significant (plt0001) with a further significant decrease (plt005) also found in soils from Infertile Grassland Because these Arable and Grassland areas are subject to the greatest anthropogenic influence through land management this suggests that land management practice may be in some way influencing the representation and distribution of some soil taxa in these systems Analysis by LOI class indicated a reduction in taxa representation in all soil classes The change in representation was greatest in the mineral (0-8 LOI) and humus-mineral (8-30 LOI) soils rather than in soils with a higher LOI This is consistent with the reduction in taxa catch detected in the Arable habitats and Crop and weed AVC class and Improved Grassland habitat and Fertile Grassland AVC since these habitats and vegetation types are extensively represented within the less organic rich soils within the low LOI class
-3
-2
-1
0
1
2
3
Bro
adlea
f
Coni
fer
Ara
ble
Impro
ved
Gra
ss
Neut
ral G
rass
Acid
Gra
ss
Shr
ub Hea
th
Fen
Bog
All ha
bita
ts
Ch
an
ge b
road
taxa
catc
h p
er
plo
t
-3
-2
-1
0
1
2
3
Cro
ps a
nd w
eeds
Tall g
rass
and
Her
b
Fertile
grass
land
Infe
rtile g
rass
land
Lowland
Wood
land
Upla
nd W
oodlan
d
Moo
rland
gra
ss m
osaics
Heat
h and
bog
All ve
geta
tion
type
s
Ch
an
ge b
road
taxa
catc
h p
er
plo
t
-3
-2
-1
0
1
2
3
Min
eral
Hum
us-m
iner
al
Org
ano-m
iner
al
Org
anic
Ch
an
ge b
road
taxa
catc
h p
er
plo
t
a) Broad Habitats
c) LOI categoriesb) Aggregate vegetation class
178
Countryside Survey Soils Report from 2007
8 Soil invertebrates
833 Total catch of mites and springtails
The average combined number of mites and springtails present in CS in 1998 was 389 compared to 721 in 2007 In 1998 mites and springtails comprised 743 of all invertebrates captured while in 2007 this had increased to 936 Springtails and mites thus increased in their overall dominance between the two surveys Because springtails and mites dominate total invertebrates to such an extent their patterns of abundance between habitats reflect those also found for total invertebrate catch ( Table 85) The highest combined catches of mites and springtails were in woodland habitats (notably Coniferous Woodland) with high numbers also found in habitats such as Acid Grassland and Dwarf Shrub Heath Lowest counts were found in Arable and Horticulture and Improved Grassland habitats Since these habitats are often intensively managed this suggests a potential influence of management regime on these two important soil mesofauna groups Table 85 Changes in combined catch of mites and springtails in soils (0 -8cm depth) within a) Broad Habitats b)
Aggregate Vegetation Classes and c) Soil LOI categories across Great Britain Arrows denote a significant
change (plt005) in the direction shown
a) Great Britain - Broad Habitats
Broad Habitat 1998 2007 1998-2007
Broadleaved Mixed and Yew Woodland 688 937
Coniferous Woodland 769 1459
Arable and Horticulture 210 281
Improved Grassland 254 533
Neutral Grassland 281 805
Acid Grassland 694 1085
Dwarf Shrub Heath 61 1158
Fen Marsh and Swamp 554 777
Bog 381 74
All habitat types 389 721
b) Great Britain - Aggregate Vegetation Class
AVC 1998 2007 1998-2007
Crops and weeds 209 266
Tall grass and Herb 216 501
Fertile grassland 222 483
Infertile grassland 309 747
Upland Woodland 857 1338
Moorland grass mosaics 66 1222
Heath and bog 492 85
All vegetation types 389 721
Direction of
significant
changes
Direction of
significant
changesAbundance mites and
springtails
Abundance mites and
springtails
179
Countryside Survey Soils Report from 2007
8 Soil invertebrates
Figure 83 Changes (+- 95 CIs) in the combined catch of mites and springtails from soils (0-8cm depth) within
a) Broad Habitats b) Aggregate Vegetation Classes and c) Soil LOI categories across Great Britain Standard
errors are indicated Significant differences p lt 005 p lt 001 p lt 0001 are shown
Data analysis using the mixed model indicated that the increase in the combined catch of sprigtails and mites in CS in 2007 compared to 1998 was highly significant (plt0001) when considering all soils (Fig 83) Stratification of the data to assess change by Broad Habitat indicated effects that were consistent with those for total invertebrate number Thus combined mite and springtail catches were increased in all analysed habitat classes and no habitat showed a mean decrease in mite and springtail catch For 7 out of 9 habitats (Coniferous Woodland Arable and Horticulture Improved Grassland Neutral Grassland Acid Grassland Dwarf Shrub Heath and Bog) the increase in combined mite and springtail catch was statistically sig nificant with Arable and Horticulture soils showing the lowest overall change Because of the low starting point in Arable soils the actual percentage increase in combined catch (342 increase) was only slightly below the
c) Great Britain - Soil LOI Category
Soil LOI category 1998 2007 1998-2007
Mineral 244 411
Humus-mineral 411 839
Organo-mineral 685 1129
Organic 586 1015
Direction of
significant
changesAbundance mites and
springtails
-40
0
40
80
120
Cro
ps a
nd w
eeds
Tall g
rass
and
Her
b
Fertile
grass
land
Infe
rtile g
rass
land
Lowland
Wood
land
Moo
rland
gra
ss m
osaics
Heat
h and
bog
All ve
geta
tion
type
s
Ch
an
ge m
ites a
nd
sp
rig
tail
catc
h p
er
plo
t
-40
0
40
80
120
Bro
adlea
f
Coni
fer
Ara
ble
Impro
ved
Gra
ss
Neut
ral G
rass
Acid
Gra
ss
Shr
ub Hea
th
Fen
Bog
All ha
bita
ts
Ch
an
ge m
ites a
nd
sp
rig
tail
catc
h p
er
plo
t
-40
0
40
80
120
Min
eral
Hum
us-m
iner
al
Org
ano
-min
eral
Org
ani
c
Ch
an
ge m
ites a
nd
sp
rig
tail
catc
h p
er
plo
t
a) Broad Habitats
c) LOI categoriesb) Aggregate vegetation class
180
Countryside Survey Soils Report from 2007
8 Soil invertebrates
lower end of level of change found for the remaining habitats (36-186) The remaining 2 habitats each showed non-significant increases in combined catch Analysis by AVC indicated an effect of vegetation on combined mite and springtail catch in line with those for total invertebrate numbers A significant increase in the combined catch was found in all vegetation classes with the exception of Crop and Weeds and Coniferous Woodland Analysis by LOI class indicated significant change in mite and springtail catch in all classes Absolute size of the increase was lowest for the mineral soil (LOI lt 0-8) with the other soil classes each showing similar change However when changes are calculated as percentage difference from CS in 1998 the change in the mineral soils (68) is not inconsistent with the percentage change in the remaining LOI categories (65 -104) That a significant increase in combined mite and springtail catch was found for the low LOI soil suggests that the limited changes in total mite and springtail catch that were s een in Arable habitats dominated by the Crop and Weed AVC category is not merely a result of the low LOI of soils in these areas Instead other land management practices may be important in limiting the extent of observed change
834 Ratio of mites springtails
Analysis was conducted of the change in the ratio of Mites Springtails since this parameter was found to vary in relation to annual precipitation (and as a result habitat) in CS in 1998 Highest catches of mites were found in plots at which rainfall was highest while springtails favoured lower rainfall plots Mite springtail ratios thus varied systematically with increasing rainfall (Fig 84) In CS in 1998 the average mite springtail ratio in GB soils was 63 and in CS in 2007 this value had increased to 89 (Table 86 Fig 85) Highest mite springtail ratios were found in habitats that are associated with high rain fall particularly in upland regions of GB A pattern that is consistent with the recognised trend (Fig 84) Habitats with highest mite springtail ratio were Bog Dwarf Shrub Heath and Acid Grassland Woodlands were intermediate while values in Arable and Horticulture Neutral Grassland and Improved Grassland soils were the lowest of the studied habitats The patte rn of mite springtail ratio found between the Broad Habitats for in CS in 2007 supports the importance of moisture availability on the relative abundance of the major meiofaunal groups as indicated initially in CS in 1998 Figure 84 Mite abundance and relative abundance of Collembola in relation to mean annual precipitation
Trends (with 95 confidence intervals) are calculated based on data collected from 1097 Tullgren samples
collected across GB in 1998
0 500 1000 1500 2000 2500 3000 35000 500 1000 1500 2000 2500 3000 3500
500
750
2500
5000
7500
25000
50000
75000
Acari
abundance (
log
10
m- 2
+ 1
00
02
04
06
08
10
rela
tive a
bundance o
f colle
mbola
(arc
sin
e
+ 0
5)
Number of mites m-2
Relative abundance of Collembola m-2
Fig 84 Mite abundance and relative
abundance of Collembola in relation to
mean annual precipitation Trends (with
95 confidence intervals) are calculated
based on data collected from 1097 Tullgren
samples collected across GB in CS2000
181
Countryside Survey Soils Report from 2007
8 Soil invertebrates
All Broad Habitats included in the stratified analysis showed a significant increase in mite springtail ratio Statistical analysis indicated that this increase was significant in all habitats except for Dwarf Shrub Heath and Bog the two habitats that had the highest ratios i n both CS in 1998 and 2007 The significant increase in the mite springtail ratio found in the majority of habitats was largely the result of an increase in the total number of mites caught rather than a reduction in springtail catches The increase in mi te numbers is also the major reason for the increase in both the combined number of mites and springtails and total invertebrate catch (since mites are a major contributor to overall invertebrate numbers) Analysis of the data by AVC indicated clear effects of vegetation class on mite springtail ratio These effects were largely consistent with the trends found for Broad Habitats There was a significant increase in the mite springtail ratio in all vegetation classes except Moorland Grass Mosaic and Hea th and Bog the two classes for which ratios in CS in 1998 and 2007 were highest Analysis by LOI class was also consistent with the changes in mite springtail ratio across other stratifications A significant increase in the mite springtail ratio wer e found in mineral humus-mineral and organo-mineral soils associated with the lowland habitats and vegetation classes in which mite springtail ratio showed a significant increase Only in organic soils associated with upland areas was the increase in ratio between the 1998 and 2007 not significant
Table 86 Changes in ratio of mites springtails in soils (0 -8cm depth) within a) Broad Habitats b) Aggregate
Vegetation Classes and c) Soil LOI categories across Great Britain Arrows denote a significant change (plt005)
in the direction shown
a) Great Britain - Broad Habitats
Broad Habitat 1998 2007 1998-2007
Broadleaved Mixed and Yew Woodland 554 1008
Coniferous Woodland 644 1464
Arable and Horticulture 183 531
Improved Grassland 402 820
Neutral Grassland 406 966
Acid Grassland 1053 1839
Dwarf Shrub Heath 1302 1140
Bog 1383 1526
All habitat types 63 109
b) Great Britain - Aggregate Vegetation Class
AVC 1998 2007 1998-2007
Crops and weeds 187 53
Tall grass and Herb 25 62
Fertile grassland 262 791
Infertile grassland 501 1109
Upland Woodland 67 1129
Moorland grass mosaics 1391 1748
Heath and bog 1477 1754
All vegetation types 628 1087
Direction of
significant
changes
Direction of
significant
changesMites springtails
Mites springtails
182
Countryside Survey Soils Report from 2007
8 Soil invertebrates
c) Great Britain - Soil LOI Category
Soil LOI category 1998 2007 1998-2007
Mineral 357 750
Humus-mineral 402 1034
Organo-mineral 927 1540
Organic 1731 1833
Direction of
significant
changesMites springtails
Figure 85 Changes (+- 95 CIs) in the ratio of mites springtails in soils (0 -8cm depth) within a) Broad
Habitats b) Aggregate Vegetation Classes and c) Soil LOI categories across Great Britain Standard errors are
indicated Significant differences p lt 005 p lt 001 p lt 0001 are shown
835 Shannon Diversity
Shannon diversity was calculated using counts of the number of individuals within broad taxa (nb counts of springtails to superfamily were included as separate broad taxa in the analysis) Mean Shannon diversity in CS in 1998 was 102 and in 2007 this value has reduced to 072 ( Table 87) This represented an overall reduction of 03 units in CS in 2007 Shannon diversity showed only a limited difference between different habitats Broadleaved Woodland showed the highest Shannon statistic in both 1998 and 2007 (121 and 087 respectively) while Bogs showed lowest Shannon diversity in both surveys (071 and 052 respectively)
-8
-4
0
4
8
12
16
20
Bro
adlea
f
Coni
fer
Ara
ble
Impro
ved
Gra
ss
Neut
ral G
rass
Acid
Gra
ss
Shr
ub Hea
th
Bog
All ha
bita
tsCh
an
ge p
rop
ort
ion
mit
es
pri
ng
tail
s
per
plo
t
-8
-4
0
4
8
12
16
20
Cro
ps a
nd w
eeds
Tall g
rass
and
herb
Fertile
grass
land
Infe
rtile g
rass
land
Lowland
woo
ded
Upla
nd w
ooded
Moo
rland
gra
ss m
osaics
Heat
h and
bog
All ve
geta
tion
type
s
Ch
an
ge p
rop
ort
ion
mit
es
pri
ng
tail
s
per
plo
t
-8
-4
0
4
8
12
16
20
Min
eral
Hum
us-m
iner
al
Org
ano
-min
eral
Org
ani
c
Ch
an
ge p
rop
ort
ion
mit
es
pri
ng
tails
per
plo
t
a) Broad Habitats
c) LOI categoriesb) Aggregate vegetation class
183
Countryside Survey Soils Report from 2007
8 Soil invertebrates
Statistical analysis indicated that the decrease in Shannon diversity in 2007 was highly significant (plt0001) when considered for GB wide soils (Table 87) Stratification of the data to assess change by Broad Habitat indicated a significant decrease in diversity in 8 of 9 habitats ( Fig 86) Only in Fen Marsh and Swamp was the reduction in Shannon diversity not significant Analysis by AVC indicated that the reduction in Shannon diversity was also significant in the majority of vegetation classes (Fig 86) Of the 8 AVCs represented in the data-set all showed a significant reduction in Shannon diversity except for Tall Grass and Herb Analysis by LOI class in dicated significant change in all soil LOI classes indicating that reduced Shannon diversity was associated with all soil types Table 87 Changes in invertebrate Shannon diversity based on enumeration to broad taxa of invertebrates
collected from soils (0-8cm depth) within a) Broad Habitats b) Aggregate Vegetation Classes and c) Soil LOI
categories across Great Britain Arrows denote a significant change (plt005) in the direction shown
a) Great Britain - Broad Habitats
Broad Habitat 1998 2007 1998-2007
Broadleaved Mixed and Yew Woodland 121 087
Coniferous Woodland 093 061
Arable and Horticulture 110 085
Improved Grassland 117 079
Neutral Grassland 109 073
Acid Grassland 089 055
Dwarf Shrub Heath 087 063
Fen Marsh and Swamp 081 073
Bog 071 052
All habitat types 102 072
b) Great Britain - Aggregate Vegetation Class
AVC 1998 2007 1998-2007
Crops and weeds 115 085
Tall grass and Herb 109 092
Fertile grassland 117 081
Infertile grassland 111 073
Lowland woodland 127 092
Upland Woodland 104 067
Moorland grass mosaics 085 057
Heath and bog 074 054
All vegetation types 102 072
Direction of
significant
changesShannon Diversity
Shannon Diversity
Direction of
significant
changes
184
Countryside Survey Soils Report from 2007
8 Soil invertebrates
c) Great Britain - Soil LOI Category
Soil LOI category 1998 2007 1998-2007
Mineral 112 082
Humus-mineral 112 074
Organo-mineral 094 062
Organic 069 051
Direction of
significant
changesShannon Diversity
Figure 86 Changes (+- 95 CIs) in invertebrate Shannon diversity based on enumeration to broad taxa of
invertebrates collected from soils (0-8cm depth) within a) Broad Habitats b) Aggregate Vegetation Classes and
c) Soil LOI categories across Great Britain Standard errors are indicated Significant differences p lt 005 p
lt 001 p lt 0001 are shown
-8
-4
0
4
8
12
16
20
Bro
adlea
f
Coni
fer
Ara
ble
Impro
ved
Gra
ss
Neut
ral G
rass
Acid
Gra
ss
Shr
ub Hea
th
Bog
All ha
bita
tsCh
an
ge p
rop
ort
ion
mit
es
pri
ng
tail
s
per
plo
t
-8
-4
0
4
8
12
16
20
Cro
ps a
nd w
eeds
Tall g
rass
and
herb
Fertile
grass
land
Infe
rtile g
rass
land
Lowland
woo
ded
Upla
nd w
ooded
Moo
rland
gra
ss m
osaics
Heat
h and
bog
All ve
geta
tion
type
s
Ch
an
ge p
rop
ort
ion
mit
es
pri
ng
tail
s
per
plo
t
-8
-4
0
4
8
12
16
20
Min
eral
Hum
us-m
iner
al
Org
ano
-min
eral
Org
ani
c
Ch
an
ge p
rop
ort
ion
mit
es
pri
ng
tails
per
plo
t
a) Broad Habitats
c) LOI categoriesb) Aggregate vegetation class
185
Countryside Survey Soils Report from 2007
8 Soil invertebrates
84 Discussion and Policy Implications
841 Introduction
Soils are critical components of the terrestrial ecosystems They are vulnerable to the effects of anthropogenic activity such as the release of pollutant chemicals and accelerating climate change Within the soil the micro- meio- meso- and macro-fauna all play a critical role in the provision of many important soils functions and resulting ecosystem services The poorly established taxonomy of many common soil macroinvertebrate taxa coupled to a declining taxonomic base means that the effects of human activity on subterranean invertebrate community structure is not well understood These include not only nematodes mites and springtails whose morphological taxonomy is ldquodifficultrdquo but also groups such as Oligochaetes and Molluscs for which there is strong evidence for a high frequency of morphologically similar cryptic species (King et al 2008) Countryside Survey represents one of only a limited number of programmes that have attempted national scale monitoring of soil biodiversity CS is unique in co-ordinating soil biodiversity monitoring at a GB scale with other surveying approaches for land use vegetation soils and waters Other countries such as the Netherlands Germany and Canada do have programmes involving soil biodiversity assessments however unlike CS which is temporally synchronised in a single season these other programs take a rolling approach to sample collection (ie sampling a certain percentage of sites in each year) As outlined the aim of soil invertebrate sampling in CS was not to provide a comprehensive assessment of soil biodiversity since this would require use of a wide range of techniques Instead a snapshot of the abundance of principally the main soil mesofauna groups the mites and springtails with some information on meiofauna (eg nematodes) and macrofauna is gathered Microbial diversity was not measured in the main part of CS although bacterial diversity in all soils for which soil invertebrate communities were assessed have been analysed in separate work supported through NERC grants raising the potential for a more integrated assessment of the microbial and invertebrate diversity data From the re-sampling in CS in 2007 the key policy question to be addressed was whether CS could provide any evidence to indicate that there has been a loss of soil biodiversity as has been stated in previous statements made by the EU Because it was not feasible within available resources to identify collected fauna to species levels due to both the number of invertebrates captured and the challenge of species level identification for groups such as the oribatid mites it is certainly not possible to provide a comprehensive answer to the policy question Between year variation in seasonal weather patterns may also strongly influence patterns observed While a complete answer is not possible useful insight into the status of soil communities at the GB scale and with habitats vegetation classes and different soil typ es can be derived from the survey results The re-sampling of soil communities in 2007 showed clear trends at the national scale Mean number of invertebrates collected significantly increased across GB Overall there was an increase of 47 in total catc h in the CS in 2007 survey compared to 1998 Calculated at the level of individual per m
2 based on the 4 cm
2
diameter of the sample core used the total catch measured equates to around 41500 individual soil invertebrates per m
2 within the top 8 cm of the soil in 1998 and over 61252 in 2007 Values for individual
habitats varied from around 25000 individuals per m2 for both 1998 and 2007 in Arable and Horticulture
habitats to around 73000 in 1998 and 89000 in 2007 for Broadleaved Woodlands The estimat e of total catch m
2 for Bog soils of around 39000 for 1998 and 61000 for 2007 are above the range of 5000 -10000 in
a dry summer (2003) found previously in peatland and birchwood soils (Osler et al 2006) Studies at the same sites in a wetter summer (2004) did produce values of 14000 -100000 mite m
2 and 1500-26000
springtail m2 that are more comparable with estimates from CS in 2007 Values for deciduous woodland are
close to the upper limit of the range of 15000-90000 for the total catch of mites and springtails found in control and disturbed woodland (Maraun et al 2003) This suggests that the method used for invertebrate sample collection in CS produced estimates of abundance that are largely compatible with results from published studies Scaling up estimates of invertebrate numbers to a GB scale based on measured density and GB land area indicates that there were an estimated 128 quadrillion (128x10
16) soil invertebrates
186
Countryside Survey Soils Report from 2007
8 Soil invertebrates
present in the top 8 cm of GB soils during the time of CS in 2007 This number is up 41 quadrillion (41x1015
) since CS in 1998 when ldquoonlyrdquo 87 quadrillion (872x10
15) invertebrates were estimated to be present
Stratification of the data indicated that the increase in total invertebrate catch was detectable in all habitats except arable and managed grassland areas largely associated with mineral soils Because total invertebrate catch was dominated by mites and springtails the increase in the combined total catch of these two groups was broadly consistent with patterns found for total invertebrate catch An in crease in the mite springtail ratio indicated that the increase in combined mite and springtail and total invertebrate catch was mainly the result of an increase in the number of mites retrieved Shannon diversity was reduced in all soils This was partly the result of an increase in the catch of mites the increased dominance of which within the samples results in a corresponding reduction in the Shannon diversity statistic although the reduction in diversity was not solely the result of an increase in the dominance of mites as a reduction in the richness of broad taxa represented by at least one individual in each core was also found
842 Cause of change in soil invertebrate communities between surveys
An important consideration when comparing results between repeat surveys is to ensure that the methods used for both sampling occasions are comparable In certain cases changes in instrumentation in available facilities or of staff can result in shifts in methods that require careful thought befor e conclusions are drawn from results Because large differences in invertebrate catch were seen between the 1998 and 2007 surveys consideration was given as to whether there were methodological shifts in 2007 compared to 1998 that could have contributed to the observed differences Five stages of the sampling and enumeration process were identified within which potential variations in procedure could occur Methods used in both surveys were compared in relation to these five areas and the potential impact of any sampling and handling differences between surveys considered 1 Preparation of the plot area for sampling In the field survey in CS in 2007 core sampling locations were decided according to instructions set out the field sampling protocol (Emmett et al 2008) The approach was consistent with that used in 1998 For sampling the cores used for invertebrate enumeration surveyors were instructed to leave the litter layer present on the soil surface intact In CS in 1998 similar instructions were not given explicitly to the surveyors Observation of the receipt of core from both surveys suggests that in reality this potential discrepancy is of minor importance For example for grassland sites cores were almost always received with the turf layer still intact at the top of the core throughout both surveys This suggests that sampling in the large number of grassland plots present within CS wa s conducted in an identical way For plots where grass was not present it is harder to tell if the litter layer has been similarly treated If the tendency was for litter removal in CS in 1998 but not in 2007 this could play a part in the higher catches in 2007 since invertebrate densities are highest in the surface litter layer and this layer would be more prevalent in the cores taken in the later survey If this was indeed the case though it would be expected that catches would be increased by a greater amount in woodland than grassland plots since it is know from the intact vegetation that grassland plots were similarly treated Comparison of the relative change in the woodland and grassland habitats suggests that in fact changes in catches in the tw o habitats were broadly similar This suggests that differences in the treatment of the litter layer during sampling are not likely to be the cause of the different in community parameters observed between surveys 2 Soil core insertion and on site handling Exactly the same cores were used for CS in 2007 as were used in 1998 (white 4 cm diameter 8 cm long plastic cores) Cores were knocked into the ground using a mallet and plate on both occasions Once the core had been inserted and removed it was nec essary to cap the core to prevent desiccation affecting invertebrate survival during transit Caps used in CS in 1998 were designed to fit into the inner rim of the core while those used in CS in 2007 fitted over the out rim The caps that were used in CS in 1998 were noted to slightly compress the core during insertion while the same was not true of the caps in 2007 For invertebrates to escape from soils during Tullgren extraction it is necessary that they are able to freely move through the soil profi le to allow escape and capture It is conceivable that the slight compaction of CS in 1998 soils may have impeded invertebrate escape during extraction with a resulting small reduction in catch in CS in 1998 While a compaction effect on Tullgren extractio n can not be fully excluded the extent of compaction of cores in 1998 was actually rather small Given the magnitude of the shift in community parameters between surveys it is difficult to envisage that this small difference could have
187
Countryside Survey Soils Report from 2007
8 Soil invertebrates
lead to the almost 50 increase in catch found in 2007 compared to the earlier survey particularly as catches in both surveys are towards the upper range of previous invertebrate counts taken in similar habitats (Osler et al 2006 Maraun et al 2003) 3 Core transport to the laboratory During both the 1998 and 2007 surveys the fauna cores were immediately placed into cool boxes after being dug from the soil and then posted first class to the laboratory at the first opportunity Return by post was selected as the most rapid means of core return even from dist ant locations It was acknowledged during initial survey design that the transport process was not well controlled and that the cores may be subject to stressful conditions notably high temperatures as sampling was mainly conducted over the summer months Many soil invertebrates have a low tolerance to heat stress Thus it is certainly possible that some temperature intolerant invertebrates in particular cores may have been lost (ie died) during transit Because the same approach to core return was used and also because the post service worked equally effectively for both surveys this suggests that differences in the time of transit while possibly affecting the integrity of individual samples can not account for community changes detected between surveys Further work to trace temperature data relating to the survey period is needed to investigate if different in average conditions during transit were prevalent between survey that could play a role 4 Soil invertebrate extraction method and conditions Different methods of extraction will collect a different sample of invertebrates from a given sample Tullgren extraction is particularly well suited to the collection of hard bodied mesofauna groups such as mites and springtails (Van Straalen and Rijninks 1982) Exactly the same Tullgren funnel system was used for invertebrate extraction in both Countryside surveys In CS in 2007 the funnel system was housed in a laboratory that received direct sun and so regularly reached temperature of 25
oC while in CS in 1998 the extractions took place in a laboratory that was shaded and so ambient
conditions did not regularly reach these higher temperatures High temperatures can be expected to stress soil invertebrates resulting in possible mortality within cores meaning that individuals are not extracted It was initially a concern in CS in 2007 that the high ambient temperatures in the laboratory used for the extractions could affect invertebrate catches with high temperature resulting in some mortality within cores and so lower catches Since actual catch observed in CS in 2007 we re significantly higher than in 1998 it seems unlikely that ambient conditions had any effect on the efficiency of soil extraction and ultimately on observed community change 5 Soil invertebrate sorting identification and enumeration Different personnel were involved in enumeration in the 1998 and 2007 surveys This could lead to discrepancies between surveys However the involvement of multiple staff for sorting and identification in both surveys and also the use of quality assurance checks during enumeration are both factors that suggest that identification and counting errors are unlikely to lie behind observed community change found between survey years As outlined a comparison of the detailed protocols for the two surveys indicated only small discrepancies between surveys These related to tube capping ambient conditions during extraction and changes in staff involved in enumeration In practice the changes were actually rather small The majority of the two procedures (cores sampling method return procedure Tullgren system quality assurance system) were rather similar Given the magnitude of community changes it seems unlikely that changes in capping which results in slight core compaction could account for the difference in catches se en Ambient temperature during sampling would have been expect to lower catches in 2007 compared to 1998 while quality assurance and training procedure precluded difference resulting from personnel change For this reason it is difficult to argue that the difference seen in soil invertebrate community between surveys namely an increased catch of especially mites leading to a high mite springtail ratio and higher combined mite and springtail number coupled with a reduction in diversity resulting from both increased mite dominance and lower representation of broad taxa in CS in 2007 samples are solely down to methodological difference Real differences in community parameters between sample years seem instead to be the most reasonable explanation
188
Countryside Survey Soils Report from 2007
8 Soil invertebrates
843 Initial attribution of soil invertebrate community change
The lag in completing the enumeration of the soil fauna means that at present attribution of changes in the soil invertebrate community remain in process Even though detailed attribution of changes in soil invertebrate community structure is yet to be completed it is possible even now to identify a number of potential candidate drivers that could be responsible for the quite substantial changes detected in soil communities between the two survey years Soil invertebrate communities are known to be sensitive to climatic condition For example in 1998 it was noted that the number of oribatid mites tended to increase in plots that are subjected to high mean annual rainfall while springtail were more frequent in plots where precipitation was lower The survey year of 2007 in the UK was one of the wettest summers on record While it must also be recognised that 1998 was also a relatively wet summer the rainfall amounts that occurred over the k ey survey month of June and July in GB in 2007 were notably higher and in some areas reached record levels indicating the extent of rainfall in the later survey year Wetter soil resulting from more rain can have both a positive and a negative effect on soil invertebrate catches from Tullgren extractions Wet soils tend to swell As a result this means that within the restricted volume of the sample soil core a smaller weight of soil will be sampled Lower soil layers in particular can as a result be missed This reduced sampling at depth could result in the loss of some invertebrates from the sample Since the majority of soil invertebrates live in or on the surface soil and soil litter layers the actual number of individuals missed by the reduced sampling of deeper soils may actually be rather small A potentially more important effect of wetter soils may be that they maintain soil invertebrate s in an active state that would not be the case in soils that were drier It is well known that many soil i nvertebrates are sensitive to drought conditions This is because most below-ground invertebrates have water permeable integuments and so are unable to resist water loss in drying environments The sensitivity of some soil taxa to drought stress is recognised as an important determinant of their habitat preferences As a result the ecophysiology of desiccation tolerance and water balance in some taxa has been studied in detail Some species such as earthworms and springtails may burrow into the deeper so il layers where soil moisture is retained to escape from drought condition Other species use a range of desiccation tolerance mechanisms (eg anhydrobiosis estivation) If escape to moist deeper soil microsites is used then this can prevent the initial capture of individuals within a defined depth soil sample If a desiccation tolerance strategy is used this can preclude the individual from responding to desiccation as a result of Tullgren extraction in a manner that allows capture In either case this may limit invertebrate catches in drier soils Initial attribution work focussing on 1998 and 2007 soil moisture measurements has indicated that there is no clear evidence for an increase in soil moisture content and sampling time (data not shown) This c omparison does not preclude a potential influence of high rainfall on community parameters since communities are likely to response to longer term changes in soil moisture regime This means that even though there is no clear evidence of soil moisture levels between surveys it remains possible that the high rainfall found in 2007 may indeed play some role in the observed different between soil communities found between survey years It is widely recognised that soil invertebrate communities are sensitive to a range of land management practices (Schon et al 2008) including land cover change (Black et al 2003) tillage regime and disturbance (Maraun et al 2003) pesticides and heavy metals (Frampton 1999 Pedersen et al 1999) and nitrogen inputs (Lindberg and Persson 2004) Because the changes in soil community structure detected between surveys was relevant to all habitats and vegetation classes except intensively managed land mainly on mineral soils attribution of changes in soil community composition to a particular driver must be relevant for a range of habitats and soil types This means that changes in land management such as stocking density pesticide application rates or tillage regimes that apply only to certain habitat types cannot explain all of the observed difference At a national scale one major difference that has occurred that has had a major effect on soil properties is the change in sulphur deposition and resulting effect on soil pH Measures to reduce sulphur emission have resulted in reduced rate of deposition and a resulting increase in soil pH across GB of almost 05 pH units since 1978 The pH of the soil is known to play a key role i n determining the structure of below ground communities Within CS in 2007 a negative relationship exists between soil pH and total invertebrate catch (Fig 87) This is explained because the highly abundant oribatid mite group do not favour neutral soil habitats associated with mineral soils in agricultural landscapes but instead favour low
189
Countryside Survey Soils Report from 2007
8 Soil invertebrates
pH organic soils in more upland areas Thus while important for determining overall composition of the soil community (eg high catch and dominance of mites in Dwar f Shrub Heath and Bogs) change in soil pH alone is unlikely to be a major driver of community change between survey years Comparison of communities in different habitats indicates that larger soil invertebrate communities are found in habitats such as woodland while Arable and Horticulture and managed grassland have smaller communities with fewer broad taxa It is often assumed because they are recently planted that Coniferous Woodland have a lower conservation value than older Broadlea ved Woodland Full species identification and enumerations of different woodland of known age would be needed to test this hypothesis for soil fauna The GB wide survey from CS does indicate that in terms of community size and frequency of broad taxa the two woodland types differ little in their harboured soil communities For the conservation of soil biodiversity on the basis of this analysis woodlands emerge as potentially important targets The small community size and low taxa representation for managed habitats suggests impacts of land management practices such as tillage fertiliser inputs and pesticide application on soil communities in these areas Arable and grassland areas emerge as potential targets for soil biodiversity restoration Figure 87 Relationship between soil pH measured in soils sample (0-15 cm depth) in CS in 2007 and the total
catch of soil invertebrates from soil core (0-8) depth
Within the land use and habitat survey of CS one of the most notable changes over time has been a significant increase in woodland cover in the UK Because woodland harbours large soil communities it would be expected that this increase in woodland area would be beneficial to the national stock of soil invertebrates Within CS the designation of Broad Habitats is done by surveyors on each sampling occasion This means that areas designated as woodland in each survey are done on the basis of current habitat distribution Similarly vegetation class is determined directly by analysis of the flora present at the actual sample plots Since the statistical analysis links invertebrate catch directly to recorded Broad Habitat and AVC in each category changes in soil community composition between surveys cannot be linked simply to changing in woodland frequency In fact because new woodland may be expected to still be undergoing community succession land cover change to woodland may be expected to have a slight negative effect on invertebrate community catch and diversity within woodland cate gories in a substantial amount of new
y = 46489e-0368x
R2 = 01776
1
10
100
1000
10000
3 4 5 6 7 8 9
Soil pH CS 2007
Lo
g s
oil
in
verte
bra
te c
atc
h
CS
20
07
Fig X7 Relationship between soil pH measured
in soils sample (0-15 cm depth) in CS2007 and
the total catch of soil invertebrates from soil core
(0-8 cm) depth
Soil pH 1998
Log soil invertebrate
catch in 2007
190
Countryside Survey Soils Report from 2007
8 Soil invertebrates
woodland becomes included within later surveys Increasing woodland may therefore play only a limited role as a driver of overall change
844 Concluding remarks
Re-sampling of the soil invertebrate community was undertaken in CS in 2007 as part of the soil work -package according the published CS methodology A total of 945 samples were enumerated Results indicated an overall significant increase in total invertebrate catch in samples from all habitats AVCs an d soil types except for agricultural areas located predominately on mineral soils The increase in invertebrate catch predominantly related to an increase in the catch of mites in CS in 2007 sample s This was shown in the increase in mite springtail ratio found across GB and in many Broad Habitats AVCs and soil LOI categories The increased dominance of mites was a major factor that decreased Shannon diversity in CS in 2007 cores although there was also a small reduction in the number of broad taxa represented in sample cores at the GB scale and also when the data was stratified to Broad Habitat AVC and soil type (by LOI) A single repeat sampling campaign such as CS cannot prove or disprove whether a large scale and long term change in soil biodiversity is underway Particularly effects of short term temporal effects such as seasonal weather patterns on invertebrate communities or sampling efficiency cannot be excluded Nonetheless on the basis of the survey data it is certainly not possible to confidently refute the possibility that such a change may be occurring This suggests that further analysis through focussed study may be needed to tease out whether the changes in soil chemistry land management or climate are playing a role in the observed so il invertebrate community change
85 References
Black HIJ Parekh NR Chaplow JS Monson F Watkins J Creamer R et al 2003 Assessing soil biodiversity across Great Britain national trends in the occurrence of het erotrophic bacteria and invertebrates in soil Journal of Environmental Management 67 255-266
Emmett BA Frogbrook ZL Chamberlain PM Griffiths R Pickup R Poskitt J Reynolds B Rowe
E Spurgeon D Rowland P Wilson J Wood CM 2008 CS Technical Report No 307 Soils Manual
NERCCentre for Ecology amp Hydrology 180 pp (CEH Project Number C03259) Frampton GK 2009 Spatial variation in non-target effects of the insecticides chlorpyrifos cypermethrin and pirimicarb on Collembola in winter wheat Pesticide Science 55 875-886 King RA Tibble AL Symondson WOC 2008 Opening a can of worms unprecedented sympatric cryptic diversity within British lumbricid earthworms Molecular Ecology 17 4684-4698 Lindberg N Persson T 2004 Effects of long-term nutrient fertilisation and irrigation on the microarthropod community in a boreal Norway spruce stand Forest Ecology and Management 188 125-135 Maraun M Salamon JA Schneider K Schaefer M Scheu S 2003 Oribatid mite and collembolan diversity density and community structure in a moder beech forest (Fagus sylvatica) effects of mechanical perturbations Soil Biology amp Biochemistry 35 1387-1394 Osler GHR Cole L Keith AM 2006 Changes in oribatid mite community structure associated with the succession from heather (Calluna vulgaris) moorland to birch (Betula pubescens) woodland Pedobiologia 50 323-330 Pedersen MB Axelsen JA Strandberg B Jensen J Attrill MJ 1999 The impact of a copper gradient on a microarthropod field community Ecotoxicology 8 467-483
191
Countryside Survey Soils Report from 2007
8 Soil invertebrates
Schon NL Mackay AD Minor MA Yeates GW Hedley MJ 2008 Soil fauna in grazed New Zealand hill country pastures at two management intensities Applied Soil Ecology 40 218-228 Van Straalen NM Rijninks PC 1982 The efficiency of Tullgren apparatus with respect to interpretation seasonal-changes in age structure of soil arthropod populations Pedobiologia 24 197-209
192
Countryside Survey Soils Report from 2007
This report was produced by the Centre for Ecology amp Hydrology with input from the other members of the Countryside Survey partnership Copyright of the report and photographs is owned by the Natural Environment Research Council Copyright enquiries should be addressed to Knowledge Transfer Team Centre for Ecology amp Hydrology Maclean Building Benson Lane Wallingford OX10 8BB This publication excluding logos may be reproduced free of charge in any format or medium for research private study or the purposes of internal use within an organisation This is subject to it being reproduced accurately and not being subject to any treatment that could be considered derogatory The reproduced material must be acknowledged as NERC Copyright (except where otherwise s tated) and the publication cited as follows Emmett BA Reynolds B Chamberlain PM Rowe E Spurgeon D Brittain SA Frogbrook Z Hughes S Lawlor AJ Poskitt J Potter E Robinson DA Scott A Wood C Woods C 2010 Countryside Survey Soils Report from 2007 Technical Report No 907 NERCCentre for Ecology amp Hydrology 192pp (CEH Project Number C03259)
For further information on Countryside Survey see wwwcountrysidesurveyorguk
Or contact Countryside Survey Project Office Centre for Ecology amp Hydrology
Lancaster Environment Centre Library Avenue Bailrigg Lancaster LA1 4AP
Telephone 01524 595811 Email enquiriescehacuk Countryside Survey in 2007 was funded by a partnership of government -funded bodies led by the Natural Environment Research Council (NERC) and the Department for Environment Food and Rural Affairs (Defra)
Disclaimer Any decisions or actions informed by this Technical Report are taken entirely at your own risk In no event shall NERC be liable for any damages including loss of business loss of opportunity loss of data loss of profits or for any other indirect or consequential loss or damage whatsoe ver arising out of the use of or inability to use the material presented in this report The Countryside Survey partnership has endeavoured to ensure that the results presented in this report are quality assured and accurate Data has been collected to es timate the stock change extent andor quality of the reported parameters However the complex nature of the experimental design means that results can not necessarily be extrapolated andor interpolated beyond their intended use without reference to the original data
3
Countryside Survey Soils Report from 2007
Contents
Executive Summary p4 1) Field Sampling and Bulk Density p9 2) Carbon p18 3) Soil pH p47 4) Total nitrogen and CN p71 5) Mineralisable-N p89 6) Olsen P p108 7) Soil metal concentrations p129 8) Soil invertebrates p167
4
Countryside Survey Soils Report from 2007
Executive Summary
Executive Summary
Countryside Survey is a unique study or bdquoaudit‟ of the natural resources of the UK‟s countryside The Survey
has been carried out at regular intervals since 1978 The countryside is sampl ed and studied using rigorous
scientific methods allowing us to compare results from 2007 with those from previous surveys In this way
we can detect the gradual and subtle changes that occur in the countryside over time A series of reports
have been published outlining the main findings for UK and individual countries which included results for two
soil variables namely soil carbon and acidity This report outlines the major findings for all soil variables
measured as part of the survey in 2007
Key policy questions to be answered in 2007 were
Can we confirm the loss of soil carbon (0-15cm) as reported by Bellamy et al 2005
Has the recovery from acidification detected by Countryside Survey in 1998 between 1978 and 1998
continued
Can the trend of eutrophication of the countryside detected in the vegetation be detected in the soil
using the mean total nitrogen concentration
Can the trend of eutrophication of the countryside detected in the vegetation be detected in the soil as
well using a more sensitive soil process method for nitrogen
Can the trend of increasing P status in intensive grasslands be confirmed and is it matched in other
habitats
Is the decline in atmospheric deposition of heavy metals as reported by the Heavy Metals Monitoring
Network reflected in soil metal concentrations measured in Countryside Survey
Does Countryside Survey provide any evidence to indicate that there has been a loss of soil
biodiversity as has been stated by the European Union
Soils have been part of Countryside Survey since it‟s inception in 1978 The rationale for their inclusion was
originally to provide many of the explanatory variables which contribute to the understanding of vegetation
distribution and change which are the central core of the survey More recently soils have been recognised
as a valuable resource in their own right due to their importance for delivering a range of ecosystem services
Consequently the number of variables have increased over time from soil organic matter and pH in 1978 to
nutrients contaminants and biodiversity in 1998 and soil physical measurements and biogeochemical fluxes
in the latest survey in 2007
The soil variables were selected for inclusion in the 2007 survey according to a range of criteria including
relevance to policy needs scientific questions uniqueness of Countryside Survey soils data both in isolation
and when combined with other Countryside Survey variables value for money and links and compatibility
with other soil monitoring programmes It should be noted that with the exception of soil invertebrates many
Countryside Survey soil variables are currently included in the list of recommended primary indicators of soil
quality by the UK Soil Indicator Consortium namely soil organic matter soil organic carbon bulk density soil
acidity (pH) mean total nitrogen concentration an indicator of phosphorus availabil ity (Olsen-P) an indicator
of nitrogen availability (mineralisable-N) total copper zinc cadmium and nickel All variables with the
exception of soil invertebrates are measured in the top 15cm of the soil profile only Soil invertebrates are
recorded for the top 8cm of soil This focus on the top 15cm of soil mirrors the focus of several other soil
monitoring programmes as it is thought the top soil horizons are the most susceptible to change over time as
they are more immediately affected by land management activities and environmental change Ideally future
soil monitoring should include lower soil horizons as important stocks of carbon supply of nutrients filtering
and storage of contaminants and soil biota occur below the top 15cm
Countryside Survey uses a sampling approach which samples one-kilometre squares randomly located within
different land class in GB The original 1978 survey consisted of 256 1-km squares and collected five soil
samples per square where possible taken from random co-ordinates in five segments of the square Detailed
vegetation and other biophysical measurements were taken at the same location In total the 1978 survey
collected 1197 soil samples for analysis During 1998 surveyors collected soil samples from the plots used
5
Countryside Survey Soils Report from 2007
Executive Summary
for soil sampling in the original 1978 squares and 1098 samples were returned for analysis Plots were re-
located using maps andor markers placed in the 1978 survey In 2007 591 1-km squares were sampled with
a total of 2614 samples returned for analysis More samples were therefore taken in 2007 than collectively in
1978 and 1998 This increase in sample over time has been driven by the requirement to provide individual
country level reports first for Scotland in 1998 and then Wales in 2007 Statistical methods are used to
enable this increase in sample number over time to be taken into account when estimating change over time
The limited number of sampling sites in Wales in 1978 and 1998 have limited the number of vegetation and
soil categories where change can be reported However the data provides an important expanded baseline
for reporting a wider range of changes in future surveys
Full details on all methods used are available from the Countryside Survey website (Emmett et al 2008
available at httpwwwcountrysidesurveyorgukpdfreports2007CS_UK_2007_TR3pdf)
Results are reported by three major categories for Great Britain and individual countries
Broad Habitat - The Broad Habitat classification consists of 27 habitats which account for the entire
land surface of Great Britain and the surrounding sea Countryside Survey reports on soils for 10
major terrestrial habitats
Aggregate Vegetation Class (AVC) ndash is a high level grouping of vegetation types produced from a
quantitative hierarchical classification of the different plant species found in the original Countryside
Survey sample plots Soil organic matter category - Mineral humus mineral organo-mineral and organic soils
Significant results relate to statistical significance with their ecological and policy relevance highlighted
where appropriate
Key findings from the soils component of the Countryside Survey in 2007 are
Bulk Density
A total of 2614 samples were sampled from 591 1km squares from across G reat Britain during the Countryside Survey field survey in 2007
Topsoil bulk density measurements were carried out on all individual samples collected in 20 07 Values ranged from 002 to 195 g cm
-3 and were negatively correlated with soil C concentration
Mineral soils exhibited the highest bulk density values and organic soils the lowest Average topsoil bulk density across Aggregate Vegetation Class and Broad Habitat classes varied between 02 and 12 g cm
-3 and was lowest in Bog soils and highest in Arable and Horticulture soils
A new transfer function between bulk density and C has been defined which significantly changes past estimates of soil carbon densities and stocks (0-15cm) of organic soils previously published for other surveys
Carbon
Carbon concentration in the soil (0-15 cm) increased in Great Britain between 1978 and 1998 and decreased between 1998 and 2007 Overall there was no change in carbon concentration in the soil (0-15 cm) in Great Britain between 1978 and 2007 and cannot confirm the loss reported by the National Soil Inventory
The one consistent exception is loss of carbon (0 -15cm) from the intensively managed Arable and Horticulture Broad Habitat Crops and Weeds Aggregate Vegetation Class This suggests that current policies in place to limit soil degradation are not maintaining soil quality in cropped land
The mean soil (0-15cm) carbon density across Great Britain in 2007 was calculated to be 69 tha ranging between a mean of 47 tha in the Arable and Horticulture Broad Habitat to a mean of 91 tha in Acid Grassland Peat soils do not contain the highest density in topsoil due to low bulk densities The new transfer function between bulk density and C significantly changes past estimates of soil carbon densities stocks and change (0-15cm) of organic soils previously published for other surveys
6
Countryside Survey Soils Report from 2007
Executive Summary
Area estimates for each Broad Habitat were used to convert soil carbon densities to soil (0-15cm) carbon stock for GB and individual countries Soil (0 -15cm) values were 1582 TgC for GB and 795TgC 628 TgC and 159 TgC for England Scotland and Wales in 2007 respectively It must be emphasised this significantly underestimates the tota l carbon stock in soils due to the large carbon stores at depth particularly in peat soils This has greatest impact for estimates for Scotland However topsoil carbon stocks may be most vulnerable to land management activities and environmental change
pH
The mean pH of soils (0-15cm) increased in less acidic soils across Great Britain (GB) between 1998 and 2007 continuing a trend observed between 1978 and 1998 These soils are associated with Broadleaved Woodland Arable and Horticulture Improved Grassland and Neutral Grassland Broad Habitats This increase in pH is consistent with the expected benefit of continued reductions in sulphur emissions
There was no significant change in mean soil (0-15 cm) pH in more acidic organic-rich soils across Great Britain between 1998 and 2007 This will affect Broad Habitats such as Bog Dwarf Shrub Heath and Acid Grassland Data analysis is ongoing to determine if the lower su lphur reductions in the north and west of the Great Britain or other drivers of change such as nitrogen deposition and land management are responsible in the organic soils where pH did not significantly increase between 1998 and 2007 Conversion between land uses between surveys was not responsible for this as similar trends were observed in soils with or without conversion
One exception with no apparent trends between any time period was Coniferous Woodland It is possible the acidification of soils associated with intensive forestry due to base cation uptake and enhanced capture of acidic pollutants by the tree canopy may be offsetting the effects of reduced sulphur emissions
The results for individual countries broadly reflected those for Great Britain as a whole with continued increase in soil pH only observed in less acidic soils Insu fficient sample size for some habitat types with lower area in individual countries prevented significant trends being identified in some cases
The implications of these findings are that current emission control policies combined with current policies to protect soil through sustainable land management practices have had some major benefits but they may not be sufficient to promote continued recovery from acidification in organic -rich soils
Nitrogen
There were small but significant decreases in mean so il (0-15 cm) total nitrogen concentration between 1998 and 2007 in many Broad Habitats and Aggregate Vegetation Classes across Great Britain and the individual countries no reporting category recorded an increase in mean soil (0 -15 cm) total nitrogen concentration
For semi-natural and woodland soils continued input of nitrogen deposition at 20 -30 kgNhayr for many parts of Great Britain has not caused the expected average increase of 3 -4 in this basic soil property Instead the decreases observed combined with a trend for an increase in total carbon to nitrogen ratio suggest there may be increased nitrogen loss or uptake possibly combined with a trend for increased carbon density as reported for some soils in Chapter 2 The effects of one or both of these processes would be to effectively bdquodilute‟ the soil (0 -15cm) nitrogen concentration signal Both processes (increased nitrogen loss and increased carbon fixation by plants leading to storage in soil) are known possible consequences of nitrogen enrichment which can result in vegetation composition change and thus this parameter may not be a sensitive indicator of eutrophication from atmospheric nitrogen deposition
There was no change or a small significant decline in mean soil total nitrogen concentrati ons in improved and fertile grassland categories between 1998 and 2007 across Great Britain and within individual countries despite major reductions in fertiliser use As there is no change in the soil (0 -15cm) total carbon to nitrogen ratio this indicates farmers have maintained soil nitrogen status in managed grassland systems despite a reduction in mineral fertiliser use possibly due to use of alternative organic sources of nitrogen such as slurry and organic waste products
7
Countryside Survey Soils Report from 2007
Executive Summary
In cropland systems a significant decline in soil (0-15cm) total nitrogen concentrations and total carbon to nitrogen ratios was observed between 1998 and 2007 for Great Britain and England A significant decline in soil (0-15cm) total carbon concentrations was also reported (Chapte r 2) As there is only a small decline in fertiliser use in these systems and there is evidence of combined carbon and nitrogen loss deep ploughing erosion or increased decomposition rates may be the most likely explanation of this trend
Mineralisable-N
Mineralisable-N stock (kgN ha) in soil (0-15cm) was a sensitive indicator of recognised differences in nitrogen availability between different vegetation types suggesting it is a promising indicator of eutrophication of the countryside
Initial investigations testing the link between mineralisable-N and occurrence of plant species in 45 test sites suggests it provides additional information to mean total nitrogen concentration data (N) possibly linked to short term changes in nitrogen availability or specific vegetation or soil types
There were strong geographical trends in the proportion of mineralised -N transformed to the mobile form nitrate which suggest a close relationship to broad-scale climatic or soil parameters
Future analyses will separate out the inherent variability associated with climate vegetation and soil type to identify spatial patterns which can be linked to atmospheric deposition and changes in management
Olsen-P
Mean Olsen-P concentrations in soil (0-15cm) is an index of the fertility of agricultural soils It‟s use and relevance in semi-natural and organic soils is less certain Soils collected during Countryside Survey in 1998 and 2007 indicated there had been a significant decrease in Olsen-P concentrations in soil (0-15cm) in most Broad Habitats or Aggregate Vegetation Classes across Great Britain and within individual countries
Olsen-P concentrations in soil (0-15cm) decreased significantly in all soil organic matter categories across Great Britain and within individual countries between 1998 and 2007 apart from humus-mineral soils in Scotland where no change was observed
The data do not confirm a trend of increasing P status in intensive grasslands or any other habitat soils (0-15cm) but indicate a loss of available phosphorus between 1998 and 2007 across a wide range of habitats and soil types This is likely to be linked to the large reductions in phosphorus fertiliser use over the same period
Metals
A comparison of back corrected Countryside Survey soils (0 -15cm) analyses for 1998 and 2007 samples indicated that as would be expected only relative small changes in soil trace metal concentrations occurred between surveys despite reported declines in atmospheric deposition due to the long residence time of metals in soils
Of seven metals for which repeat measurement were made during the 2007 survey only for one Cu was a statistically significant difference in soil (0 -15cm) concentrations (an increase) found at the GB level
When the data for repeat metal measurements were stratified by Broad Habitat Aggregate Vegetation Class and soil organic matter category further statistically significant differences were seen For Cu generally significant increases were observed whilst for two metals Cd and Pb changes were small and idiosyncratic between stratifications For three metals Cr Ni Zn changes were generally characterised by reduction in crop lands and no change or slight increases in less managed habitats
For some metals such as Cu and Cd it is likely that additional sources (animal manures and possibly sewage sludge manures and compost for Cu and fertiliser for Cd) beyond atmospheric inputs are important in maintaining or even increasing soil concentrations principally in managed areas For the remaining metals especially Cr Ni and Zn there is some suggestion that in areas where cropping takes place output fluxes may now exceed inputs enabling soil concentrations to decline
8
Countryside Survey Soils Report from 2007
Executive Summary
Managed landscape where intensive cropping takes place but sewage sludge a nimal manures and composts are rarely applied may be among the first habitats to return from their slight -moderately elevated states to their pre-industrial background concentrations and could be a focus for future monitoring
Soil Invertebrates
There were an estimated 128 quadrillion (128x1016
) soil invertebrates present in the top 8 cm of Great Britain soils during the time of Countryside Survey sampling in 2007 Comparing these results with those from the survey in 1998 has enable change in soil b iodiversity to be estimated at a national scale
A significant increase in total invertebrate catch in samples from soils (0-8cm) from all Broad Habitats Aggregate Vegetation Classes and soil organic matter categories except for agricultural areas on mineral soils was found in Countryside Survey in 2007 The increase in invertebrate catch was mainly the result of an increase in the catch of mites in 2007 samples This resulted in an increase in the mite springtail ratio but a decreased Shannon diversit y due to the dominance of mites in Countryside Survey in 2007 cores
A small reduction in the number of soil invertebrate broad taxa (0 -8cm) was recorded which is not inconsistent with reported declines in soil biodiversity However repeat sampling is required to ensure this is not linked to different seasonal conditions in the two sampling years Further analysis through focussed study may be needed to assess whether the changes in soil chemistry land management annual weather patterns or merely natural population variation can explain observed soil invertebrate community changes
Preliminary results from the soils work were presented in the Countryside Survey UK Results from 2007
report (Carey et al 2008 ab) and the country Reports published for England Scotland and Wales in 2009
(httpwwwcountrysidesurveyorgukreports2007html )
Data for the Countryside Survey in 2007 and earlier years have previously been released via the project web
site (httpwwwcountrysidesurveyorgukdatahtml)
The policy implications of trends observed are outlined in each chapter of the report together with a
discussion of possible causes of the changes observed Ongoing data analysis is focussed on identifying the
links between soil variables measured between soil and vegetation and water quality changes reported in
other Countryside Survey reports and between trends in soil variables and the intended and unintended
change of our environment from man‟s activities such as land use and management air pollution and climate
change A subset of the results from these analyses will be reported in the Countryside Survey Integrated
Assessment Report later in 2010 with the remainder in the scientific peer-review literature
9
Countryside Survey Soils Report from 2007
1 Field sampling and Bulk Density
Summary
A total of 2614 samples were collected from 591 1km squares across GB during the CS field survey
in 2007
Topsoil bulk density measurements were carried out on all individual samples collected in 2007
Values ranged from 002 to 195 g cm-3
and were negatively correlated with soil C concentration
Mineral soils exhibited the highest bulk density values and organic soils the lowest Average
topsoil bulk density across Aggregate Vegetation Class and Broad Habitat classes varied between
02 and 12 g cm-3
and was lowest in bog soils and highest in arable and horticultural soils
A new transfer function between bulk density and C has been defined which significa ntly changes
past estimates of soil carbon densities and stocks (0-15cm) of organic soils previously published
for other surveys
11 Introduction
Countryside Survey (CS) is an integrated survey of the GB countryside and soils have been part of CS since
its inception in 1978 The rationale for their inclusion was originally to provide many of the explanatory
variables which contribute to the understanding of vegetation distribution and change which are the central
core of the survey
The sampling strategy used for CS is based on a rigorous statistical approach as an audit of the entire GB
countryside combining monitoring of habitat vegetation soils and waters would be prohibitively expensive
and impractical to run CS uses a sample based approach to collect information at the level of detail required
for national reporting whilst providing the benefits of integrated monitoring It is important to remember that
the results of CS are therefore calculated estimates and not absolute numbers derived from a complete
coverage of the country
Great Britain was stratified first into Land Classes based on the major environmental gradients across the
countryside This permitted the sample to be structured to give reliable national statistics and also ensured
that the sample is representative of the range of different environments found in Great Britain (England
Scotland and Wales) The sample consists of a set of bdquosample squares‟ measuring 1km x 1km selected
randomly from the Ordnance Survey grid within the various Land Classes Altogether 591 sample squares
were surveyed in 2007 289 were in England 107 in Wales and 195 in Scotland Sufficient sample squares
were selected from each geographical region to enable reliable statistical reporting for Great Br itain as a
whole and for each separate country (Table 11) As far as possible the same squares are resampled each
time CS is repeated but in addition each successive CS has included greater numbers of sample squares
The estimates of change presented in this report use a statistical modelling technique to infer missing values
so that changes between each year of the survey can be made using the maximum data available - see the
CS Statistical report (Scott 2008) For full information about CS and methodology employed in square and
plot selection and the field survey see the main GB report (Carey et al 2008 available at
httpwwwcountrysidesurveyorgukreports2007html)
10
Countryside Survey Soils Report from 2007
1 Field sampling and Bulk Density
Table 11 Number of squares surveyed in each survey year which included soil sampling in each
country of GB
Country 1978 1998 2007
England 126 302 289
Scotland 108 203 195
Wales 22 64 107
Total 256 569 591
The soil variables were selected for inclusion in the 2007 survey according to a range of criteria including
relevance to policy needs scientific questions uniqueness of CS soils data both in isolation and when
combined with other CS variables value for money and links and compatibility with other soil monitoring
programmes It should be noted that with the exception of soil invertebrates many CS soil variables are
currently included in the list of recommended primary indicators of soil quality by the UK Soil Indicator
Consortium namely soil organic matter (LOI) and soil organic carbon bulk density soil acidity (pH) total-N
(N) an indicator of phosphorus availabilty (Olsen-P) an indicator of nitrogen availability (mineralisable-N)
total copper zinc cadmium and nickel All variables with the exception of soil invertebrates are measured in
the top 15cm of the soil profile only Soil invertebrates are recorded for the top 8cm of soil This focus on the
top 15cm of soil mirrors the focus of several other soil monitoring programmes (eg NSI) as it is thought the
top soil horizons are thought to be the most susceptible to change over time as they are more immediately
affected by land management activities and environmental change Ideally future soil monitoring should
include lower soil horizons as they are important for storage of carbon supply of nutrients filter ing and
storage of contaminants and as a habitat for soil biota This is particularly important for carbon storage in
peat soils where significant carbon in stored below 15cm
12 Soil sampling and preparation for analysis
As part of the 1978 survey soil samples from the top approximately 0-15cm were collected from a soil pit in
the centre of each of the five Main bdquoX‟ Plots (200m2) randomly located in each of the 256 1km x 1km squares
Maps were drawn to help future relocation In 1990 permanent metal markers were placed immediately
adjacent to the south corner of all plots as mapped in 1978 (or according to an alternative detailed protocol if
within-field placement was inappropriate) during a CS survey which did not involve soil sampling Samples
were taken 15cm to the north of the inner 2m x 2m plot in the centre of the Main Plots in 1998 and to the
south in 2007 In 1998 and 2007 maps and markers were requested from the surveyors for all new or
changed locations Samples from 1998 and 2007 were therefore resampled 2-3m apart between each survey
This compares to 20-50m for the National Soil Inventory In total the 1978 survey collected 1197 soil
samples for analysis During 1998 surveyors collected soil samples from all plots used for soil sampli ng in
the original 1978 squares and 1098 samples were returned for analysis (Note a total of 569 squares were
visited across GB in 1998 but soil sampling was only included in the original 256 squares) In 2007 591 1 km
squares were sampled with a total of ca 11000 samples returned for analysis (591 squares x 5 Main Plots x
4 core types (Table 12) of which 2614 (591 squares x 5 Main plots ndash missing cores) were used for bulk
density analyses Some samples could not be taken for practical reasons or were not suitable for analysis
11
Countryside Survey Soils Report from 2007
1 Field sampling and Bulk Density
Table 12 Description of CS soil cores
Core No Colour and length Core measurements Comments
1 Black 15cm pH LOI Bulk density
N Olsen P metals
Insufficient sample for all analyses if soil
was peaty Core 4 was used in that
situation
2 White 8cm Invertebrate diversity
3 White 15cm Microbial diversity
Persistent organic
pollutants (POPs)
Frozen on arrival Microbial diversity
analyses are part of a NERC funded
project and are not reported as part of CS
POP analysis was not funded but sampled
preserved in case funding becomes
available
4 White 15cm Mineralisable-N Samples also used for metals and Olsen P
if insufficient sample in Core 1
The soil (0-15cm) samples enable changes in several key topsoil characteristics to be studied including pH
soil carbon and nitrogen concentrations and content a measure of available phosphorus heavy metal
concentrations and soil biota In addition measurements of potentially mineralisable nitrogen and bulk
density were made for the first time Three soil samples only were collected from each Main Plot from the top
15cm of the soil profile and a fourth for the invertebrate sample from the top 8cm only In 1998 and 2007 this
was carried out using a plastic corer hammered into the soil and then pulled out with the sample intact The
plastic was grey or black ABS (acrylonitrile butadiene styrene) water pipe In 1978 a soil pit was dug and soil
was collected from the top 15 cm of the profile in the side of the pit In all t hree years loose vegetation and
fresh litter were cleared from the soil surface before the sample was taken Samples were stored in cold
boxes and posted back to the laboratory for analysis On arrival at the laboratory all soil cores were logged
in the core extruded from the plastic tube a digital photograph taken and basic core dimensions taken
before processing began For full information on methodology and Standard Operating Procedures for all
variables see the CS Soils Manual (Emmett et al 2008 available at
httpwwwcountrysidesurveyorguktech_reportshtml)
13 Bulk density
Soil bulk density (BD) is the single most useful parameter of soil physical structure It is a direct measure of
soil compaction (or loosening) and is essential to assess total available pore space within a soil (that is total
porosity) Soil pore space occupies roughly half of the soils volume and is essential for the sustainable use
of soils since the pores hold air water and soil biodiversity Bulk density is an excellent measure of a most
important contemporary form of soil degradation that which occurs due to ill -timed cultivation compaction by
vehicles and stocking and also affects soil biodiversity since increased BD means reduced macropore
volume which is associated with decreases in microbial biomass and activity The rationale for measurement
is outlined in Table 13
The BD of a soil is also essential in the estimation of soil carbon (C) densities where it is necessary to
convert from soil organic carbon (SOC) to SOC per unit volume (eg g cm-3
) Soil carbon stocks (0-15cm)
can then be calculated by combining carbon densities with area of Broad Habitat Changes to soil C density
and stocks represent a major component of UK greenhouse gas emissions and under the Kyoto Protocol the
UK is required to make estimates of net carbon emissions to the atmosphere Changes in soil C stock will
12
Countryside Survey Soils Report from 2007
1 Field sampling and Bulk Density
need to be included in inventories and reporting if these estimates are to be meaningful To date our
knowledge of soil C stocks and changes is limited recent work by National Soil Resources Institute (Bellamy
et al 2005) indicates that large changes have occurred recently but these changes can only be related to
broad habitat types Determinations of soil BD in CS in 2007 will allow the calculation of topsoil C stocks and
change from 1998 whilst relating these observed changes to potential pressures and drivers such as land
use change climate change and atmospheric deposition
We assessed the different methods of extracting soil from the ground for BD determination including coring
and digging a soil pit Five different cores were tested 10 cm long x 5 cm diameter round core 15 cm x 64
cm round core 10 cm long x 5 cm square metal core 10 cm long x 8 cm s quare metal core 8 cm long x 4 cm
diameter round core The soil pit method involved digging a pit then filling the resulting hole with a plastic
bag and using water to measure the volume
Five field sites were visited to allow the comparison of 5 dif ferent soil types Soils tested were clayey soil
sandy soil peaty soil stony soil and a woodland loam Three replicates per extraction method (both coring
and pit extraction) per soil type were taken (excepting sand and clayey sand as it was deci ded that the
soils were uniform enough for just one sample to be taken) In the laboratory samples were weighed
separated out onto a tray and dried at 105degC Once dry the soils were sieved and stones and soil separated
All components were weighed and the BD calculated excluding stones and other debris
Table 13 Bulk density rationale for measurement
Facts Comments
History in CS
None
Links and compatibility to other monitoring programmes
National Soil Inventory - England amp Wales (NSI EampW) Bulk density estimated from original survey measurements National Soil Inventory (NSI Scotland) - Scotland Some bulk density values available Environmental Change Network Sample soils at 12 terrestrial sites every 5- and 20- years Bulk density measured every 20 years to depth of 120cm or bedrock
Obvious links to NSI EampW and NSI Scotland particularly in the 2007 Scottish resurvey which will happen at the same time as CS in 2007 However BD estimation methods differ and will need to be compared with caution Only one 20-year sampling has been made ndash next due in 2013 High intensity measurements on limited number of sites will complement CS data
Uniqueness of CS
No national dataset to estimate bulk density on every soil sample measured for C
Value for money (Policy priority or interpretative value X cost)
High High policy and interpretative value low cost Cheap reliable way of assessing soil physical structure Pedotransfer functions highly relevant for other survey and monitoring programmes
13
Countryside Survey Soils Report from 2007
1 Field sampling and Bulk Density
Overall the different core types tested gave fairly consistent BD values across soil types and no one core
type gave consistently higherlower BD values (Emmett et al 2008) The values of BD estimated from cores
and pits were similar and were within the ranges of typical values expected for each of the soil types
However any methods used for sampling in CS must take into account the time available in the field the
capacity of the field team to carry equipment and the logistics of t he survey The recommendations for BD
measurements in CS were as follows
The pit extraction method is not feasible due to the amount of heavy equipment needed and the
complexity of the task
Although the metal square cores tended to hammer in more easily they tended to distort easily in
difficult soils making their use limited In bdquosticky‟ soils some of the sample was left in the corners
of the core They are also heavier to transport by post
Taking the above into account the coring method is the only method which can be realistically
carried out in a consistent manner on such a large scale
The black 15 cm cores used in the 1998 are acceptable to use for measuring bulk density in the
majority of soils on the condition that surveyorslab personnel follow careful instructions
provided in the CS Field Handbook
Thus in 2007 CS soils were sampled using the 15 cm long x 5 cm diameter core hammered into the ground
and removed using pliers as in the 1998 soil survey
Bulk density was estimated for each soil sample by making detailed weight measurements throughout the soil
processing procedure Briefly the exact dimensions of the sampled soil core were recorded before the soil
was extruded from the plastic tube and the soil was then weighed homo genised reweighed before drying at
room temperature for up to two weeks At the end of this period the soil was again weighed and then sieved
to 2 mm and the weight and volume of the debris remaining (largely composed of stones and plant material
and called unsieved debris) recorded A sub-sample of 10 g of soil was then accurately weighed and dried
overnight at 105 degC before LOI determination The moisture loss at each stage of the process was used to
estimate the initial moisture content of the soil and from that the initial dry weight of the soil Bulk density
was then estimated using the equation
Data were analysed using the standard mixed model analysis appropriate to CS measurements The
statistical approach used for analys is for change involved bootstrapping which allows for non-normality in the
data without the necessity of knowing details of actual distribution As such it provides a more accurate
measurement of significance Annex F of Emmett et al (2008) provides a background document describing
this approach
14 Results
Results are presented for three major categories Broad Habitats Aggregate Vegetation Class and Loss on
Ignition Category
Broad Habitat - The Broad Habitat classification consists of 27 habitats which account for the entire
land surface of Great Britain and the surrounding sea Countryside Survey reports on 10 major
terrestrial habitats
Aggregate Vegetation Class (AVC) ndash is a high level grouping of vegetation types produced from a
quantitative hierarchical classification of the different plant species found in the original Countryside
Survey sample plots
( debris) unsieved of volume - collected core of volume
debris) unsieved of weight- soil of t(dry weigh )cm (gdensity Bulk 3-
14
Countryside Survey Soils Report from 2007
1 Field sampling and Bulk Density
Loss on ignition (LOI) category ndash soil type based on soil organic matter content defined as mineral (0-
8 LOI 0-44 g C kg-1
) humus-mineral (8 ndash 30 LOI 44-165 g C kg-1
) organo-mineral (30 ndash 60
LOI 165-330 g C kg-1
) and organic (60 ndash 100 gt 330 g C kg-1
)
Topsoil bulk density in individual samples in 2007 ranged from 002 to 195 g cm-3
and was negatively
correlated with soil C concentration with mineral soils exhibiting the highest bulk density values and organic
soils the lowest Average topsoil bulk density across AVC and BH classes varied between 0 2 and 12 g cm-3
and was lowest in bog soils and highest in arable and horticultural soils (Table 14) However within each
AVC or BH large ranges of BD values were observed
There was a strong relationship between C concentration and soil BD in the 20 07 data (Fig 11) which is
significantly different to the commonly used pedotransfer function from Howard et al (1995) and used by
Bellamy et al (2005) This relationship can be applied to the 1978 and 1998 LOI data to estimate BD in those
years This is required if estimates of soil density of C or other element are required between surveys To
limit the accumulation of errors through applying successive empirical transformations to the data the 2007
relationship between C concentration and density (calculated directly from the 2007 data) was used to
estimate C density from concentration in 1978 and 1998 in Section 23 and 24 Since the relationship
between C concentration and bulk density is non-linear average C densities cannot be calculated directly
from average concentration and bulk density values ie multiplying the values in C in Section 2 Tables
24 26 28 210 will not produce the C density estimates in Tables 25 27 29 211 and 212
CS estimates of topsoil C density assume that the relationship between C concentration and BD in 2007 is
the same in 1978 and 1998 Since there are no studies of changes in BD over time across the entire range of
C concentrations this assumption remains untested A range of factors such as land -use specific effects and
soil moisture variation are likely to contribute to the large variation in BD at any given C concentration ( Fig
11) but given the large sample size and representative nature of CS data it is unlikely that the overall C
concentration-BD relationship will change significantly over time
15
Countryside Survey Soils Report from 2007
1 Field sampling and Bulk Density
Table 14 Bulk density (g cm-3) in different Broad Habitat Classes Aggregate Vegetation Classes and Loss on ignition () categories
a) Great Britain - Broad Habitat
Broad Habitat 2007
Broadleaved Mixed and Yew Woodland 078
Coniferous Woodland 052
Arable and Horticulture 123
Improved Grassland 097
Neutral Grassland 090
Acid Grassland 043
Bracken 043
Dwarf Shrub Heath 035
Fen Marsh and Swamp 045
Bog 017
All habitat types 078
b) AVC - whole dataset
Aggregate Vegetation Class 2007
Upland Woodland 053
Lowland Woodland 082
Fertile Grassland 103
Infertile Grassland 088
Moorland Grass Mosaics 041
Heath and Bog 021
Tall Grass and Herb 105
Crops and Weeds 125
c) Loss on ignition category
LOI category () 2007
Mineral (0-8) 117
Humus-mineral (8-30) 077
Organo-mineral (30-60) 036
Organic (60-100) 014
16
Countryside Survey Soils Report from 2007
1 Field sampling and Bulk Density
Figure 11 Relationship between topsoil C concentration and bulk density in CS in 2007 Circles are estimates
from Countryside Survey samples in 2007 the solid line is the regression line of the data (y = 129e-00206x
+
251e-00003x
-2057) the dashed line is the estimate of bulk density derived from a commonly-used pedotransfer
function (y = 13 - 0275ln(x10) Howard et al1995 as used in Bellamy et al 2005)
15 Discussion and Policy Implications
To our knowledge our measurements of topsoil BD represent the most comprehensive dataset available for
GB to date Figure 11 compares our BD results with that of the pedotransfer function first used by Howard
et al (1995) and subsequently by Bellamy et al (2005) For C concentrations greater than 68 g C kg-1
the
Howard et al 1995 equation overestimates BD especially at high C concentrations Using the Howard et
al 1995 equation soils containing gt400 g C kg-1
are constrained to possess a BD of 022-028 g cm-3
but
CS results show that 92 of soils containing gt400 g C kg-1
exhibit BD lt02 g cm-3
and 51 have a BD lt01
g cm-3
Very low BD for highly organic topsoils has been reported by other authors (eg Givelet et al 2004
van der Linden et al (2008) The differences in the two BD equations have implications for the estimates of
topsoil C stock and change given by Bellamy et al 2005 Our estimate of 949 Tg for the total topsoil C stock
of England and Wales in 1978 is substantially larger than the 864 Tg estimated by Bellamy et al (2005)
however this is partly due to different conversion factors used assuming that C is 50 of LOI (as Bellamy et
al 2005) rather than 55 (the value used here) CS data yields an estimate of 863 Tg C for England and
Wales in 1978 However the different BD equations produce estimates of C stock at specific C
concentrations that vary considerably Bellamy et al (2005) estimated that soils in England and Wales which
contained gt300 g C kg-1
in 1978 had a total topsoil (0-15 cm) C stock of 122 Tg Using the more realistic CS
equation to estimate topsoil C stock for these soils reduced this value to ca 73 Tg and on the same basis
would reduce the estimated loss of C from these soils from 21 to ca 12 Tg yr-1
However these revised
17
Countryside Survey Soils Report from 2007
1 Field sampling and Bulk Density
estimates of topsoil C stocks do not explain the substantial differences between our results and those of
Bellamy et al 2005 in terms of change in topsoil C concentration and stock Reasons for this continue to be
explored The importance of the modified transfer function is less important when bulk density is used as an
indicator of soil quality associated with land management practices as change rather than absolute value in
these situations is usually of greater interest
16 References
Bellamy PH Loveland PJ Bradley RI Lark RM and Kirk GJD 2005 Carbon losses from all soils
across England and Wales 1978-2003 Nature 437 245-248
Carey PD Wallis S Chamberlain PM Cooper A Emmett BA Maskell LC McCann T Murphy J
Norton LR Reynolds B Scott WA Simpson IC Smart SM Ullyett JM 2008 Countryside Survey
UK Results from 2007 NERCCentre for Ecology amp Hydrology 105pp (CEH Project Number C03259)
Emmett BA Frogbrook ZLChamberlain PM Griffiths R Pickup R Poskitt J Reynolds B Rowe
E Rowland P Spurgeon D Wilson J Wood CM 2008 Countryside Survey Soils Manual Countryside
Survey Technical Report No0407
Givelet N Le Roux G Cheburkin A Chen B Frank J Goodsite M E Kempter H Krachler M
Noernberg T Rausch N Rheinberger S Roos-Barraclough F Sapkota A Scholz C and Shotyk W
2004 Suggested protocol for collecting handling and preparing peat cores and peat samples for physical
chemical mineralogical and isotopic analyses J Environ Monit 6 481-492 2004
Howard PJA Loveland PJ Bradley RI Dry FT Howard DM Howard DC 1995 The carbon
content of soil and its geographic distribution in Great Britain Soil Use and Management 11 9-15
Scott WA 2008 Countryside Survey Statistical Report Countryside Survey Technical Report No407
NERCCentre for Ecology amp Hydrology and Pond Conservation 15pp (CEH Project Number C03259)
van der Linden M Barke J Vickery E Charman D J and van Geel B2008 Late Holocene human
impact and climate change recorded in a North Swedish peat deposit Palaeogeography Palaeoclimatology
Palaeoecology 258 1-27
18
Countryside Survey Soils Report from 2007
2 Carbon
Summary
Carbon concentration in the soil (0-15 cm) increased in Great Britain between 1978 and 1998 and
decreased between 1998 and 2007 Overall there was no change in carbon concentration in the soil
(0-15 cm) in Great Britain between 1978 and 2007 and cannot confirm the loss reported by the
National Soil Inventory
The one consistent exception is loss of carbon (0-15cm) from the intensively managed Arable and
Horticulture Broad Habitat Crops and Weeds Aggregate Vegetation Class This suggests that
current policies in place to limit soil degradation are not maintaining soil quality in cropped land
The mean soil (0-15cm) carbon density across Great Britain in 2007 was calculated to be 69 tha
ranging between a mean of 47 tha in the Arable Broad Habitat to a mean of 91 tha in Acid
Grassland Peat soils do not contain the highest density in topsoil due to low bulk densities A new
transfer function between bulk density and C has been defined which significantly changes past
estimates of soil carbon densities stocks and change (0-15cm) of organic soils previously
published for other surveys
Area estimates for each Broad Habitat were used to convert soil carbon densities to soil (0 -15cm)
carbon stock for GB and individual countries Soil (0-15cm) values were 1582 TgC for GB and
795TgC 628 TgC and 159 TgC for England Scotland and Wales in 2007 respectively It must be
emphasised this significantly underestimates the total carbon stock in soils due to the large carbon
stores at depth particularly in peat soils This has greatest impact for estimates f or Scotland
However topsoil carbon stocks may be most vulnerable to land management activities and
environmental change
21 Policy Background1
Key question Can we confirm the loss of soil carbon (0-15cm) as reported by Bellamy et al 2005
Measurements Organic matter content by loss-on-ignition of soil (0-15cm) in repeats of all plots sampled in
1978 and 1998 and all additional plots sampled in 2007 Carbon concentration data of soil (0-15cm) in
repeats of all plots sampled in 1998 and repeated in 2007 By combining these data and linking to bulk
density measurements CS in 2007 has delivered
Whole GB and country-level assessment of status and change of soil (0-15cm) carbon
concentration density and stock between 1978 1998 and 2007
19
Countryside Survey Soils Report from 2007
2 Carbon
Soil organic C (SOC) is one of the headline indictors of soil quality and there is a wide acceptance that
carbon is fundamental to soil functioning as it is the primary energy source in soils and has a critical role in
maintaining soil structural condition and resil ience and water retention All soils therefore need to retain
carbon However soil C changes are measured against large background stocks and high spatial
heterogeneity and more information is needed to be able to manage this resource better Specific policy
requirements which require improved information on the status and change of soil carbon content include UK
and EU legislation soil protection measures that will help to conserve soil carbon The reformed Common
Agriculture Policy requires all farmers in receipt of the single payment to take measures to protect their soil
from erosion organic matter decline and structural damage Changes to soil C content also represent a major
component of UK greenhouse gas emissions and under the Kyoto Protocol the UK is required to make
estimates of net carbon emissions to the atmosphere However knowledge of soil C stocks and changes is
limited recent work by the NSRI (Bellamy et al 2005) indicates that large changes have occurred recently
but there has been some debate concerning possible causes (Smith et al 2007) In addition if stocks could
be related to more detailed vegetation and other environmental data this would al low better mitigation
targeting Whereas above ground carbon cycling is well understood there are great uncertainties in climate
impacts on soil carbon cycling CS soil C data will contribute to knowledge of how soil C is changing how
this relates to vegetation change and land use and management and provide evidence of the effectiveness of
soil protection legislation
Soil samples taken for Countryside Survey in 2007 will be the third in a time series of samples from 1978 and
1998 this will be the first national soil time-series in Europe and possibly globally Analyses of topsoil C in
2007 will allow further quantification of topsoil C contents and change across all major UK land uses and
crucially through the link to other CS and spatially relevant information will allow the assignment of
pressures and drivers to the observed changes be they climate change land use and management or
atmospheric deposition This link to drivers of change will be reported in the CS Integrated Assessment
Report and peer-reviewed literature
22 Methods
221 Proof of concept
Loss-on-ignition (LOI) is a simple and inexpensive method for determining soil organic matter and estimating
soil organic carbon concentration (hereafter called soil C concentration) using an appropriate conversion
equation An analysis of the benefits of including the measurement in the 2007 survey is summarised in
Table 21
LOI values were determined for 1197 plots within 256 1km squares in 1978 1098 plots within 256 squares in
1998 and 2614 plots within 591 squares in 2007 The increase in sample number was necessary to provide
adequate statistical power to detect change within all three GB countries Power analysis of the exist ing CS
dataset (1978 amp 1998) was performed to determine the number of squares needed in 2007 to give adequate
reporting power for soils in Wales and greater power for soils in Scotland and England For further
information see Emmett et al (2008) Essentially sampling within CS can determine significant differences in
soil C concentration if these are greater than 8 of previous estimates
In 1978 and 1998 LOI was performed on 10 g soil at 375degC for 16 hours and on 1 g soil at 550degC for 3 hours
respectively In the preparation phase for CS in 2007 it was identified that the 1998 LOI method had resulted
in higher values of LOI across the enti re soil organic matter range relative to the 1978 method and it was
decided that all available 1998 soils would be reanalysed using the 1978 method Additionally it was
decided to use the 1978 LOI method in 2007 as 1) this would yield a consistent dataset across 1978 1998
and 2007 and 2) the use of 10 g soil for LOI is preferable since it is more representative than 1 g
Alongside LOI measurements soil C concentration was determined by elemental analyser analysis in 1998
and again in 2007 This measurement complements the LOI data since it is an actual measurement of C
20
Countryside Survey Soils Report from 2007
2 Carbon
concentration in soil however in soils with high amounts of carbonates the soil C concentration may be
considerably larger than the organic C concentration Soil C concentration cannot replace LOI as a method
of measuring soil C because 1978 samples were only analysed by LOI and not by soil C concentration
A conversion factor of 05 from the literature has been used to convert LOI to soil C concentration for CS
reports to date The completed analysis of the combined analysis of 1998 and 2007 data for LOI has
indicated a different value of 055 which is now being used in all estimates of soil C concentration and
carbon density
To calculate topsoil carbon density on a g cm-3
basis a measurement of C per unit volume is needed
Combining bulk density measurements reported in Chapter 1 for the 2007 samples with LOIsoil C
concentration values result in estimates of topsoil C density on an area basis This in turn can be combined
with Broad Habitat area estimates from the CS surveys leading to the first national survey assessment of
topsoil carbon stock (0-15cm) derived from co-located measured variables
Table 21 LOI soil C concentration density and stock Rationale for measurement
Issue Facts Comments
History in CS Loss-on-ignition Topsoil total C content () Topsoil carbon density (g cm
-3)
Measured in 1978 and 1998 for 256 squares Expanded to 591 squares in 2007 Gives total soil C content measured by elemental analyser in 1998 and 2007 on original plots which can be used to convert all 2007 LOI values A conversion function will be obtained from 2007 bulk density values
Repeat sampling will maintain the time series The increased spatial coverage will support country-level reporting by giving greater statistical power especially for Wales (see below) Data obtained from same analytical run as that of total soil N content This function will allow change in soil carbon density to be determined for all time periods
Links and compatibility to other monitoring programmes
National Soil Inventory- England amp Wales Information from 5500 locations in England amp Wales including C and soil horizon information National Soil Inventory - Scotland Data from 770 locations includes C and soil horizon information A partial repeat survey in Scotland was carried out 2007 ndash 2009 Environmental Change Network Soil monitoring at 12 terrestrial sites every 5 amp 20 years Total organic C and bulk density in both 5 and 20-year determinands Dissolved organic C
Data comparability exercise for Defra (Project SP0515) Analysis of repeat survey results in progress ECN data not available
21
Countryside Survey Soils Report from 2007
2 Carbon
measured in soils every 2 weeks Representative Soil Sampling Scheme (RSSS) Carried out since 1969 - 2003 soil samples taken from stratified random sample of 180 farms Runs on a five-year sampling cycle with a subset of the selected farms sampled each year UK Woodland resurvey Biosoil and Level II plots
RSSS not measured SOC since 1984 Data available for 103 woodlands Data in preparation
Uniqueness of CS LOI and C (0-15cm) Carbon density and stock (0-15cm)
CS soil samples are spatially linked to many other data collected at the same time It is unique in that the results can be linked to pressures and drivers eg vegetation deposition land management CS measures the bulk density of each soil sample which when combined with area enables anb estimate of soil (0-15cm) C stock
Sampling of soil in close proximity to the detailed vegetations characterisations is vital in the investigation of relationships between land usehabitat and soil characteristics Topsoil bulk density (BD) has not been measured within any large-scale soil survey until now The data can be used to determine how stable BD is over time and whether BD measured or estimated are required to assess soil carbon changes
Value for money (Policy priority or interpretative value x cost) LOI and soil C concentration (g kg
-1)
Topsoil C stock
High High
High policy and interpretative value (time series) low cost Expansion to all CS squares future-proofs data for further Surveys High policy and interpretative value low cost
22
Countryside Survey Soils Report from 2007
2 Carbon
222 Laboratory analysis
Samples for LOI were collected using the 15cm long by 5cm diameter black plastic core following the field
protocol described in Chapter 1 and in more detail in Emmett et al (2008) LOI was measured on a 10 g air
dried sub-sample taken after sieving to 2 mm The sub-sample was dried at 105degC for 16 hours to remove
moisture weighed then combusted at 375degC for 16 hours The cooled sample was then weighed and the
loss-on-ignition () calculated Soil C concentration was determined using a total elemental analyser for the
original 256 squares The method used was CEH Lancaster UKAS accredited method SOP3102 Details of
the method are given in Emmett et al (2008)
223 Quality Assurance and Quality Control
The DefraNERC Joint Codes of Practice were followed throughout
Method comparability A selection of 40 soils from 1998 were analysed by LOI using the methodologies
used in the 1978 and 1998 surveys (Table 22) Results gave good agreement over the whole range of LOI
values (Fig 21) but across the whole dataset mean LOI values were significantly lower (-12) using the
1978 method compared to the 1998 method (Table 23) This difference in the results using the 1978 method
was present regardless of whether the soils were heated for 2frac14 or 3 hr (mean decrease -114 and -143
respectively
Table 22 LOI method conditions in 1978 and original 1998 method
Survey Amount of soil (g) Temp (degC) Time (hr)
1978 10 375 16
1998 1 550 Not less than 2
23
Countryside Survey Soils Report from 2007
2 Carbon
Figure 21 Comparison of LOI using 1978 and original 1998 method
y = 1013x - 17343
R2 = 09982
0
20
40
60
80
100
0 20 40 60 80 100
LOI CS2000 method
LO
I 1
97
8 m
eth
od
Table 23 Differences in LOI results as a deviation from 1978 results using 1978 and original 1998 methods
LOI Mean difference
1978-1998 SD SE
lt20 -15 08 02
20-80 -12 32 11
gt80 -06 03 01
The results also show that the observed differences in LOI results are more pronounced at lower organic
matter contents where the 1978 method gave LOI values approx 15 lower than the 1998 method at LOI
values lt 20 compared with 06 lower at LOI values gt80 (Table 23) These lower LOI values
produced by the 1978 method are much more important when the organic matter content is low as a small
change in total organic matter content is a large relative change in organi c matter
These differences were not considered acceptable and all 1998 samples with sufficient sample remaining
were re-analysed using the 1978 method A transformation was devised for the remaining samples using the
relationship derived from those where dual analyses were available All samples in 2007 were analysed using
the 1978 methodology
Analytical QC In each analytical batch of samples for LOI in 2007 one soil was repeated The comparison
between the two replicates indicates clear reproducibility of results (Fig 22)
LOI 1998 method
24
Countryside Survey Soils Report from 2007
2 Carbon
Figure 22 Reproducibility of LOI measurements on repeated samples in 2007
0
20
40
60
80
100
0 20 40 60 80 100
Loss-on-ignition ()
Re
pe
at
los
s-o
n-i
gn
itio
n (
)
Conversion to soil C concentration For the main CS report released in November 2008 the soil loss -on-
ignition (LOI) to soil C concentration (g kg-1
) relationship was considered to be
soil C concentration = 05LOI
This value was derived from the literature and was used because at that time only soil C concentration data
for 1998 were available and it was not known if the new LOI to soil C concentration relationship was stable
and reproducible between years The soil C concentration data for 2007 are now available and have been
compared with that from 1998 Fig 23 demonstrates that to two decimal places the regression relationship
between LOI and soil C concentration was the same in both 1998 and 2007
soil C concentration = 055LOI
25
Countryside Survey Soils Report from 2007
2 Carbon
Figure 23 The relationship between LOI and soil C concentration () for 1998 and 2007 soils
y = 05453x + 04366
R2 = 09853
0
10
20
30
40
50
60
70
0 20 40 60 80 100
LOI
C
1998
2007
It should be noted that whilst these relationships have been shown for 1998 and 2007 we have no
measurements for 1978 It cannot therefore be demonstrated that such a relationship would hold in that year
However there seems no scientific reason to consider that the relationship would not hold in 1978
Since there is now a CS-specific LOI-soil C concentration relationship better estimates of topsoil C
concentration and density will be produced if the CS relationship is used compared to the literature derived
value However the estimates reported in the main CS report will then differ from those in the CS soils
report The difference is simple since the proportion of LOI accounted for by C has increased by 10 (from
05 to 055) all previous estimates of C concentration and density will also increase by 10
224 Reporting
The Broad Habitat (BH) classification has been developed over the last 15 years and currently consists of 27
habitats which account for the entire land surface of Great Britain and the surrounding sea ( Jackson 2000)
The BH areas in CS have a minimum mappable unit size of 400 m2 (Carey et al 2008) Since some Broad
Habitats contain no soil and others are rare and so not encountered frequently in CS only 10 BH are
reported here Additionally due to the lack of mapped habitat information in 1978 all reporting by BH refers
to the 2007 habitat allocation for the parcel in which each vegetation p lot resides except when the plot was
not sampled in 2007 in which case the 1998 BH allocation was used In summary t he BH is a description of
a parcel of land (eg an arable field) whilst the AVC is a description of a plot within a parcel (eg a smal l
patch of lowland woodland at the edge of an arable field) the AVC may not therefore be representative of the
whole parcel and may differ from the BH but is representative of the vegetation above the soil sampling
locations BH areas in 2007 were taken from Carey et al (2008) A soil type category has also been
developed based on soil organic matter content In summary
26
Countryside Survey Soils Report from 2007
2 Carbon
Broad Habitat - The Broad Habitat classification consists of 27 habitats which account for the entire
land surface of Great Britain and the surrounding sea Countryside Survey reports on soils for 10
major terrestrial habitats
Aggregate Vegetation Class (AVC) ndash is a high level grouping of vegetation types produced from a
quantitative hierarchical classification of the different plant species found in the original Countryside
Survey sample plots Loss on ignition (LOI) category ndash soil type based on soil organic matter content defined as mineral (0 -
8 LOI 0-44 g C kg-1
) humus-mineral (8 ndash 30 LOI 44-165 g C kg-1
) organo-mineral (30 ndash 60
LOI 165-330 g C kg-1
) and organic (60 ndash 100 gt 330 g C kg-1
) The soil C concentration values were mapped using kriging to interpolate between the Countryside Survey
sample points Routine checking of data for outliers was conducted and the working data set was transformed
using a normal score procedure to obtain a Gaussian distribution The data were then interpolated on a 1km
UK grid using ordinary kriging and finally the kriged data were back-transformed to produce an interpolated
map of soil C concentration In addition Sequential Gaussian simulation (SGs) was conducted on the data to
obtain the E-type estimate (mean) and the spatial uncertainty for the data (conditional variance) Both the
coefficient of variation CV (standard deviation mean) and the signal to noise ratio SNR (mean standard
deviation) are reported
23 Results
231 Structure of soil (0-15cm) LOI data and conversion to soil C concentration
Recorded LOI values were in the range 10 ndash 985 corresponding to topsoil C concentrations of 55 ndash 5418
g C kg-1
) The maximum C concentration possible in a soil is 550 g kg-1
using the conversion factor 055
The distribution of C concentrations across the observed range is shown in Fig 24 The mix of soils across
GB has a characteristic bi-modal U-shaped distribution pattern with the majority of soils containing lt100 g C
kg-1
Across the three Surveys mineral humus-mineral organo-mineral and organic topsoils accounted for
34-39 35-38 6-7 and 17-21 of all samples respectively
Within CS 58 of samples (2843 samples) come from plots which have been sampled more than once
Therefore 42 of samples come from plots only sampled once primarily due to the many extra sampling
locations in 2007 Some variation in C concentration in repeat plots would be expected due to occasional
failure in relocating the exact plot soil heterogeneity differences in sampling procedures across the Surveys
and real change over t ime However the vast majority of observed differences in repeat plots were small
(Fig 24) 83-91 of differences in repeat plots were lt100 g C kg-1
(lt20 LOI) At the other end of the
scale 1-5 of all differences from repeat plots were gt300 g kg-1
(gt60 LOI) Such large differences are
highly unlikely to be due to real change in soil C concentration and suggest that soils in some locations were
extremely heterogeneous or that surveyors were not always successful in accurately re -locating plots
27
Countryside Survey Soils Report from 2007
2 Carbon
Figure 24 Distribution of Countryside Survey soil C concentration data (0 -15cm) (a) Number of observations for
25 g kg-1
divisions (b) Cumulative frequency
232 Change in soil (0-15cm) C concentration and density across Great Britain
At the highest level of analysis for GB as a whole and for the whole 29 year period between 1978 and 2007
no net significant change in soil C concentration (0-15cm) was observed (Fig 25a amp b) Trends over time
were significant for Scotland and GB only with both showing a significant increase between 1978 and 1998
followed by a significant decline between 1998 and 2007 with no overall change over the whole 29 year
period The 1998 Survey contained a greater frequency of soils with higher LOI values whi ch led to higher
estimates of soil C concentrations that year We can find no systematic bias in our data (eg an
undersampling of a particular habitat soil type or geographical area) which could lead to this distribution and
the potential drivers of this temporal pattern is currently being investigated and will be reported in the
Integrated Assessment Report The overall picture is one of little large -scale change in topsoil C
concentrations in the long term
Mean soil C concentrations for individual countries vary due to the different frequencies of soil type Soil C
concentration increases in the order EnglandltWalesltScotland No significant change by soil carbon category
was observed (Fig 25b) Trends for individual countries are discussed more full y in the individual country
sections
28
Countryside Survey Soils Report from 2007
2 Carbon
Figure 25 Change in soil C concentration (0-15cm) for GB and individual countries (a) over time and (b) net
change between 1978 and 2007 Standard errors are indicated Significant differences ( plt0001 plt0 01
plt005) are shown between the years bracketed
a) b)
Significant changes were observed within and between the different Broad Habitat Aggregate Vegetation
Classes soil carbon categories and between the individual su rvey years (Table 24)
Amongst BHs which represent the larger habitat unit within which each soil sampling location resides topsoil
C concentrations in 1978 and 2007 were significantly different in Arable and Horticulture Bracken and
Broadleaf Woodland soils (Table 24a) Note that the BH is based on 2007 recording (and occasionally on
the 1998 data) since the BH classification did not exist in 1978 There were very low numbers of soil
samples in the Bracken BH in 1978 and 1998 ndash 10 and 12 respectively ndash so estimates for these years are
likely to be inaccurate The 2007 estimate which is based on 53 samples is more likely to represent a
reasonable value of the C concentration in the Bracken BH and the significant change is likely an effect of
better representation in 2007
The pattern of higher C concentrations in 1998 compared with the other Survey years also occurred within
many Aggregate Vegetation Classes although changes were not always significant ( Table 24b Fig 26)
Within AVCs the only significant differences in topsoil C concentration over the whole 29 year period were a
decrease in arable soils (AVC Crops and Weeds) and an increase in all woodlands (the combined Lowland
and Upland Woodland AVCs) (Fig 27a) In 1978 1998 and 2007 CS sampled 23 29 and 81 lowland
woodlands respectively and 76 71 and 198 Upland Woodlands Coverage of these AVCs was low in both
1978 and 1998 due to the smaller number of samples taken in these years and the infrequent occurrence of
woodlands in the GB countryside Larger areas of woodlands and greater numbers of soil samples collected
have contributed to greater numbers of woodland soil samples in 2007 Our report of topsoil C concentration
change in woodlands should therefore be seen in the context of low sample numbers in 1978 and 1998 and
represents our best estimates based on available CS data
To remove the effects of large-scale vegetationland use change we also estimated topsoil C concentrations
in plots which were sampled in all three Surveys and in which the AVC did not change over time ( Table
24c) Since the AVC of the plots is only known for the Survey years we cannot rule out changes in the
intervening years eg rotation between arable and grassland systems Therefore plo ts where the AVC has
-8
-6
-4
-2
0
2
4
6
8
10
12
GB England Scotland Wales
Ch
an
ge
in
ca
rbo
n c
on
ce
ntr
ati
on
(g
Ck
g)
0
50
100
150
200
250
300
1975 1980 1985 1990 1995 2000 2005 2010
Me
an
ca
rbo
n c
on
ce
ntr
ati
on
(g
Ck
g)
GB England Scotland Wales
29
Countryside Survey Soils Report from 2007
2 Carbon
not changed are plots in which the vegetation composition has been largely consistent in 1978 1998 and
2007 Only 405 plots had consistent AVCs in the three Surveys and because of this there were insufficient
samples in the Tall Grass and Herb AVC and soils in this category were ignored Additionally the lowland
and Upland Woodland AVCs were grouped into one category all woodlands due to the small number of
samples in each category individually Nevertheless trends in these plo ts were broadly consistent with those
observed for the whole dataset suggesting that shifts in AVC (ie land use change) are unlikely to be a major
factor in determining soil C concentration changes over time
Within soil C group categories there were significant increases in soil C concentration between 1978 and
1998 for mineral and organic soils however subsequent declines in the period 1998 to 2007 led to no
significant changes between 1978 and 2007 (Table 24d Fig 27b)
When soil C concentration (0-15cm) was converted to carbon density using the bulk density transfer function
the significant reduction in Broad Habitat Arable and Horticulture and AVC Crops and Weeds categories was
again apparent (Fig 28 Table 25) This appears the most consistent of all trends identified by CS in 2007
whether expressed as C concentration or density
Figure 26 The change in soil C concentrations (0-15cm) between 1978 1998 and 2007 across AVC
classifications characterised by (a) low ndash medium topsoil C concentrations and (b) high topsoil C
concentrations Significant changes are indicated in Table 24
a) b)
0
50
100
150
200
250
300
350
400
450
1975 1980 1985 1990 1995 2000 2005 2010
Me
an
ca
rbo
n c
on
ce
ntr
ati
on
(g
Ck
g)
Upland Woodland Moorland grass mosaic
Heath and Bog
0
10
20
30
40
50
60
70
80
90
100
1975 1980 1985 1990 1995 2000 2005 2010
Mean
carb
on
co
ncen
trati
on
(g
Ck
g)
Crops and Weeds Tall grass and herbs
Fertile grassland Infertile grassland
Lowland woodland
30
Countryside Survey Soils Report from 2007
2 Carbon
Figure 27 Overall change in soil C concentrations (0-15cm) between 1978 and 2007 (a) across AVC categories
and (b) LOI categories Standard errors are indicated Significant differences ( plt0001) are shown
a) b)
Figure 28 Overall change in soil C density (0-15cm) between 1978 and 2007 (a) across AVC categories and (b)
LOI categories Standard errors are indicated Significant differences ( plt005) are shown
a) b)
-6
-4
-2
0
2
4
6
8
Mineral Humus-mineral Organo-mineral Organic
Ch
an
ge
in
ca
rbo
n d
en
sit
y (
gC
cm
3)
-50
-40
-30
-20
-10
0
10
20
30
40
Mineral Humus-mineral Organo-mineral Organic
Ch
an
ge
in
ca
rbo
n c
on
ce
ntr
ati
on
(g
Ck
g)
-20
-10
0
10
20
30
40
50
60
Cro
ps amp
wee
ds
Tall g
rass
and
her
b
Fertile
gras
slan
d
Infe
rtile g
rass
land
Lowland
woo
dlan
d
Upl
and
woo
dlan
d
Moo
rland
gra
ss m
osaics
Hea
th a
nd b
ogCh
an
ge
in
ca
rbo
n c
on
ce
ntr
ati
on
(g
Ck
g)
-10
-5
0
5
10
15
Cro
ps amp
wee
ds
Tall g
rass
and
her
b
Fertile
gras
slan
d
Infe
rtile g
rass
land
Lowland
woo
dlan
d
Upl
and
woo
dlan
d
Moo
rland
gra
ss m
osaics
Hea
th a
nd b
og
Ch
an
ge
in
ca
rbo
n d
en
sit
y (
gC
cm
3)
31
Countryside Survey Soils Report from 2007
2 Carbon
Table 24 Changes in soil C concentration (0-15cm) in GB for (a) Broad Habitats (b) Aggregate Vegetation Class (AVC) (c) AVCs unchanged since 1978 and (d) LOI categories Arrows denote significant change (plt005 level) in the direction shown Diagonal line indicates too few samples to provide reliable value
a) Great Britain - Broad Habitat
Broad Habitat 1978 1998 2007 1978-1998 1998-2007 1978-2007
Broadleaved Mixed and Yew Woodland 624 1022 887
Coniferous Woodland 2037 2220 1978
Arable and Horticulture 345 335 307
Improved Grassland 564 583 569
Neutral Grassland 671 701 680
Acid Grassland 2351 2567 2285
Bracken 1552 1547 1959
Dwarf Shrub Heath 3053 2987 2849
Fen Marsh and Swamp 2317 2528 2286
Bog 4118 4499 4329
All habitat types 1356 1465 1370
b) AVC - whole dataset
Aggregate Vegetation Class 1978 1998 2007 1978-1998 1998-2007 1978-2007
All Woodlands 1037 1430 1309
Upland Woodland 1282 1780 1598
Lowland Woodland 580 861 655
Fertile Grassland 473 516 483
Infertile Grassland 624 696 661
Moorland Grass Mosaics 2186 2420 2258
Heath and Bog 3710 4127 3898
Tall Grass and Herb 536 463 470
Crops and Weeds 349 332 313
Aggregate Vegetation Class 1978 1998 2007 1978-1998 1998-2007 1978-2007
All Woodlands 800 1394 1465
Upland Woodland
Lowland Woodland
Fertile Grassland 509 555 548
Infertile Grassland 694 731 711
Moorland Grass Mosaics 2646 2941 2649
Heath and Bog 4137 4527 4366
Tall Grass and Herb
Crops and Weeds 289 282 251
d) Loss on ignition category
LOI category () 1978 1998 2007 1978-1998 1998-2007 1978-2007
Mineral (0-8) 298 327 302
Humus-mineral (8-30) 761 787 762
Organo-mineral (30-60) 2521 2682 2322
Organic (60-100) 4466 4824 4679
Mean carbon concentration gkg-1 Direction of significant changes
Mean carbon concentration gkg-1 Direction of significant changes
Mean carbon concentration gkg-1 Direction of significant changes
Mean carbon concentration gkg-1 Direction of significant changes
c) AVC unchanged
32
Countryside Survey Soils Report from 2007
2 Carbon
Table 25 Changes in soil C density (0-15cm) in GB for (a) Broad Habitats (b) Aggregate Vegetation Class (AVC)
(c) AVCs unchanged since 1978 and (d) LOI categories Arrows denote significant change (plt005 level) in the
direction shown Diagonal line indicates too few samples to provide reliable value
a) Great Britain - Broad Habitat
Broad Habitat 1978 1998 2007 1978-1998 1998-2007 1978-2007
Broadleaved Mixed and Yew Woodland 659 769 729
Coniferous Woodland 837 840 814
Arable and Horticulture 530 518 473
Improved Grassland 657 679 672
Neutral Grassland 655 717 686
Acid Grassland 916 889 906
Bracken 743 992 847
Dwarf Shrub Heath 842 839 899
Fen Marsh and Swamp 857 821 828
Bog 834 813 856
All habitat types 687 706 693
Aggregate Vegetation Class 1978 1998 2007 1978-1998 1998-2007 1978-2007
All Woodlands 722 796 796
Upland Woodland 761 835 847
Lowland Woodland 649 707 683
Fertile Grassland 608 659 626
Infertile Grassland 690 736 716
Moorland Grass Mosaics 869 897 898
Heath and Bog 824 835 844
Tall Grass and Herb 596 604 581
Crops and Weeds 509 512 479
Aggregate Vegetation Class 1978 1998 2007 1978-1998 1998-2007 1978-2007
All Woodlands 662 905 784
Upland Woodland
Lowland Woodland
Fertile Grassland 628 690 699
Infertile Grassland 711 738 729
Moorland Grass Mosaics 817 919 807
Heath and Bog 847 846 788
Tall Grass and Herb
Crops and Weeds 515 488 462
d) Loss on ignition category
LOI category () 1978 1998 2007 1978-1998 1998-2007 1978-2007
Mineral (0-8) 506 541 513
Humus-mineral (8-30) 750 777 763
Organo-mineral (30-60) 988 974 997
Organic (60-100) 834 809 849
b) AVC - whole dataset
Mean Carbon Density (tha) Direction of significant changes
Mean Carbon Density (tha) Direction of significant changes
Mean Carbon Density (tha) Direction of significant changes
c) AVC unchanged
Mean Carbon Density (tha) Direction of significant changes
33
Countryside Survey Soils Report from 2007
2 Carbon
233 Change in soil (0-15cm) C concentration and density (0-15cm) for England
Mean soil C concentrations in England (Table 26) are generally lower than those for GB as a whole This is
due to lower frequency of carbon rich soils in England and Wales relati ve to Scotland No significant change
was observed for the country between individual surveys (Fig 25a) or the whole 29 year period (Fig 25b)
There were fewer significant differences observed within individual vegetation and soil categories for tops oils
in England relative to GB and there was an insufficient number of samples to report on some categories
Consistent with changes observed for GB were significant reductions for the Arable and Horticulture Broad
Habitat and Crops and Weed Aggregate Vegetation Class Significant differences ( plt0001) are shown
(Fig 29) Significant increases for GB woodland soils were not reflected in the results for England However
a significant increase was observed for Infertile Grassland in England which was n ot observed for GB When
transformed to carbon density similar trends were observed (Fig 210 Table 27) Significant differences for
the whole 29 year period were only observed for Crops and Weeds and Moorland Grass Mosaic Aggregate
Vegetation Class
Figure 29 Change in soil C concentration (0-15cm) for England between 1978 and 2007 for different AVCs
Standard errors are indicated Significant differences ( plt0001 plt005) are shown
Figure 210 Change in soil C density (0-15cm) for England between 1978 and 2007 for different AVCs Standard
errors are indicated Significant differences ( plt0001 plt005) are shown There was insufficient samples to
report for Tall Grass and Herb Mean change for Upland Wood was lt 01 gcm3
-10
-5
0
5
10
15
20
25
Cro
ps amp
wee
ds
Tall g
rass
amp her
b
Fertile
gras
slan
d
Infe
rtile
gra
ssla
nd
Lowla
nd w
ood
Upl
and
woo
d
Moo
rland
gra
ss m
osai
c
Hea
th a
nd b
og
Ch
an
ge
in
ca
rbo
n d
en
sit
y (
gC
cm
3)
-30
-20
-10
0
10
20
30
40
50
60
70
80
Crops amp
weeds
Fertile
grassland
Infertile
grassland
Lowland
wood
Upland
wood
Moorland
grass
mosaic
Heath and
bog
Ch
an
ge in
ca
rbo
n c
on
ce
ntr
ati
on
(g
Ck
g)
34
Countryside Survey Soils Report from 2007
2 Carbon
Table 26 Changes in soil C concentration (0-15cm) in England for (a) Broad Habitats (b) Aggregate Vegetation
Class (AVC) (c) AVCs unchanged since 1978 and (d) LOI categories Arrows denote significant change (plt005
level) in the direction shown Diagonal line indicates too few samples to provide reliable value
a) England - Broad Habitat
Broad Habitat 1978 1998 2007 1978-1998 1998-2007 1978-2007
Broadleaved Mixed and Yew Woodland 546 804 687
Coniferous Woodland 1173 1578 1312
Arable and Horticulture 339 328 300
Improved Grassland 503 542 531
Neutral Grassland 601 693 648
Acid Grassland 1970 2006 2098
Bracken 1150 1273 1535
Dwarf Shrub Heath 2980 2275 2292
Fen Marsh and Swamp 2888 2789 2738
Bog 1978 4313 3985
All habitat types 744 797 756
Aggregate Vegetation Class 1978 1998 2007 1978-1998 1998-2007 1978-2007
Upland Woodland 1050 1625 1313
Lowland Woodland 596 876 691
Fertile Grassland 450 501 446
Infertile Grassland 546 667 630
Moorland Grass Mosaics 1980 1898 2174
Heath and Bog 3022 3544 3390
Tall Grass and Herb 434 433
Crops and Weeds 340 323 307
Aggregate Vegetation Class 1978 1998 2007 1978-1998 1998-2007 1978-2007
Upland Woodland
Lowland Woodland
Fertile Grassland 521 550 557
Infertile Grassland 633 741 723
Moorland Grass Mosaics
Heath and Bog
Tall Grass and Herb
Crops and Weeds 282 275 249
d) Loss on ignition category
LOI category () 1978 1998 2007 1978-1998 1998-2007 1978-2007
Mineral (0-8) 290 318 292
Humus-mineral (8-30) 684 742 705
Organo-mineral (30-60) 3454 2349 2101
Organic (60-100)
b) AVC - whole dataset
Mean carbon concentration gkg-1 Direction of significant changes
Mean carbon concentration gkg-1 Direction of significant changes
Mean carbon concentration gkg-1 Direction of significant changes
c) AVC unchanged
Mean carbon concentration gkg-1 Direction of significant changes
35
Countryside Survey Soils Report from 2007
2 Carbon
Table 27 Changes in soil C density (0-15cm) in England for (a) Broad Habitats (b) Aggregate Vegetation Class
(AVC) (c) AVCs unchanged since 1978 and (d) LOI categories Arrows denote s ignificant change (plt005 level) in
the direction shown Diagonal line indicates too few samples to provide reliable value
a) England - Broad Habitat
Broad Habitat 1978 1998 2007 1978-1998 1998-2007 1978-2007
Broadleaved Mixed and Yew Woodland 578 761 688
Coniferous Woodland 896 760 779
Arable and Horticulture 491 498 469
Improved Grassland 629 685 646
Neutral Grassland 624 656 659
Acid Grassland 766 720 955
Bracken 959 728 941
Dwarf Shrub Heath 771 1018 966
Fen Marsh and Swamp 819 941 967
Bog 1060 1198 852
All habitat types 696 715 702
Aggregate Vegetation Class 1978 1998 2007 1978-1998 1998-2007 1978-2007
Upland Woodland 814 684 814
Lowland Woodland 698 718 681
Fertile Grassland 616 639 609
Infertile Grassland 688 708 693
Moorland Grass Mosaics 777 898 880
Heath and Bog 796 857 912
Tall Grass and Herb 554 613 585
Crops and Weeds 497 501 469
Aggregate Vegetation Class 1978 1998 2007 1978-1998 1998-2007 1978-2007
Upland Woodland
Lowland Woodland
Fertile Grassland 631 690 687
Infertile Grassland 745 760 795
Moorland Grass Mosaics
Heath and Bog
Tall Grass and Herb
Crops and Weeds 498 476 439
d) Loss on ignition category
LOI category () 1978 1998 2007 1978-1998 1998-2007 1978-2007
Mineral (0-8) 504 523 496
Humus-mineral (8-30) 754 783 744
Organo-mineral (30-60) 1172 1011 885
Organic (60-100)
Mean Carbon Density (tha) Direction of significant changes
b) AVC - whole dataset
Mean Carbon Density (tha) Direction of significant changes
Mean Carbon Density (tha) Direction of significant changes
c) AVC unchanged
Mean Carbon Density (tha) Direction of significant changes
36
Countryside Survey Soils Report from 2007
2 Carbon
234 Change in soil (0-15cm) C concentration and density (0-15cm) across Scotland
Mean soil C concentrations in Scotland are generally higher than that for GB as a whole This is due to
higher frequency of carbon rich soils relative to England and Wales A significant increase was observed
between 1978 and 1998 and a significant decline between 1998 and 2007 which was mirrored in the GB
trends (Fig 25a) There was no significant change over the whole 29 year period (Fig 25b)
There were fewer significant differences for individual vegetation and soil categories for topsoils in Scotland
relative to GB and there was insufficient number of samples to report on some categories (Table 28)
Consistent with changes observed for GB were a significant increase for the Broadleaved Mixed and Yew
Woodland Broad Habitat and a significant decline in Crops and Weed Aggregate Vegetation Class (Fig
211) Significant increases for the GB Bracken Broad Habitat was not observed for Scotland Transformation
to carbon density confirmed a significant decline in soil carbon status of the Crops and Weeds Aggregate
Vegetation Class (Fig 212 Table 29)
Figure 211 Change in soil C concentration (0-15cm) for Scotland between 1978 and 2007 for different AVCs
Standard errors are indicated Standard errors are indicated Significant differences ( plt005) are shown
Figure 212 Change in soil C density for Scotland (0-15cm) between 1978 and 2007 for different AVCs Standard
errors are indicated Standard errors are indicated Significant differences ( plt0005) are shown
-20
-10
0
10
20
30
40
50
60
70
Crops amp
weeds
Fertile
grassland
Infertile
grassland
Upland wood Moorland
grass
mosaic
Heath and
bog
Ch
an
ge
in
ca
rbo
n c
on
ce
ntr
ati
on
(g
Ck
g)
-15
-10
-5
0
5
10
Crops amp
weeds
Fertile
grassland
Infertile
grassland
Upland wood Moorland
grass
mosaic
Heath and
bog
Ch
an
ge
in
ca
rbo
n c
on
ce
ntr
ati
on
(g
Ck
g)
37
Countryside Survey Soils Report from 2007
2 Carbon
Table 28 Changes in soil C concentration (0-15cm) in Scotland for (a) Broad Habitats (b) Aggregate Vegetation
Class (AVC) (c) AVCs unchanged since 1978 and (d) LOI categories Arrows denote significant change (plt005
level) in the direction shown Diagonal line indicates too few samples to provide reliable value
a) Scotland - Broad Habitat
Broad Habitat 1978 1998 2007 1978-1998 1998-2007 1978-2007
Broadleaved Mixed and Yew Woodland 889 1719 1451
Coniferous Woodland 2385 2456 2289
Arable and Horticulture 358 356 323
Improved Grassland 646 640 650
Neutral Grassland 911 842 835
Acid Grassland 2628 2919 2479
Bracken 2383 2312 2932
Dwarf Shrub Heath 3189 3310 3138
Fen Marsh and Swamp 2145 2700 2282
Bog 4242 4539 4382
All habitat types 2385 2578 2420
Aggregate Vegetation Class 1978 1998 2007 1978-1998 1998-2007 1978-2007
Upland Woodland 1441 1888 1847
Lowland Woodland
Fertile Grassland 470 525 492
Infertile Grassland 840 895 827
Moorland Grass Mosaics 2236 2541 2293
Heath and Bog 3926 4329 4097
Tall Grass and Herb
Crops and Weeds 369 371 322
Aggregate Vegetation Class 1978 1998 2007 1978-1998 1998-2007 1978-2007
Upland Woodland
Lowland Woodland
Fertile Grassland
Infertile Grassland 779 759 703
Moorland Grass Mosaics 2804 3202 2881
Heath and Bog 4168 4574 4409
Tall Grass and Herb
Crops and Weeds
d) Loss on ignition category
LOI category () 1978 1998 2007 1978-1998 1998-2007 1978-2007
Mineral (0-8) 305 336 314
Humus-mineral (8-30) 877 882 859
Organo-mineral (30-60) 2558 2888 2329
Organic (60-100) 4475 4820 4686
b) AVC - whole dataset
Mean carbon concentration gkg-1 Direction of significant changes
Mean carbon concentration gkg-1 Direction of significant changes
Mean carbon concentration gkg-1 Direction of significant changes
c) AVC unchanged
Mean carbon concentration gkg-1 Direction of significant changes
38
Countryside Survey Soils Report from 2007
2 Carbon
Table 29 Changes in soil C density (0 -15cm) in Scotland for (a) Broad Habitats (b) Aggregate Vegetation Class
(AVC) (c) AVCs unchanged since 1978 and (d) LOI categories Arrows denote significant change (plt005 level) in
the direction shown Diagonal line indicates too few samples to provide reliable value
a) Scotland - Broad Habitat
Broad Habitat 1978 1998 2007 1978-1998 1998-2007 1978-2007
Broadleaved Mixed and Yew Woodland 752 629 776
Coniferous Woodland 874 793 804
Arable and Horticulture 536 526 523
Improved Grassland 688 724 701
Neutral Grassland 728 713 739
Acid Grassland 938 937 884
Bracken 682 944 874
Dwarf Shrub Heath 881 821 900
Fen Marsh and Swamp 930 948 766
Bog 834 883 833
All habitat types 776 780 787
Aggregate Vegetation Class 1978 1998 2007 1978-1998 1998-2007 1978-2007
Upland Woodland 878 799 818
Lowland Woodland 00 00 00
Fertile Grassland 661 697 655
Infertile Grassland 690 779 728
Moorland Grass Mosaics 926 916 904
Heath and Bog 853 836 826
Tall Grass and Herb
Crops and Weeds 563 583 507
Aggregate Vegetation Class 1978 1998 2007 1978-1998 1998-2007 1978-2007
Upland Woodland
Lowland Woodland
Fertile Grassland
Infertile Grassland 682 678 720
Moorland Grass Mosaics 897 903 878
Heath and Bog 852 869 816
Tall Grass and Herb
Crops and Weeds
d) Loss on ignition category
LOI category () 1978 1998 2007 1978-1998 1998-2007 1978-2007
Mineral (0-8) 499 522 520
Humus-mineral (8-30) 778 806 815
Organo-mineral (30-60) 1009 931 899
Organic (60-100) 858 775 853
Mean Carbon Density (tha) Direction of significant changes
b) AVC - whole dataset
Mean Carbon Density (tha) Direction of significant changes
Mean Carbon Density (tha) Direction of significant changes
c) AVC unchanged
Mean Carbon Density (tha) Direction of significant changes
39
Countryside Survey Soils Report from 2007
2 Carbon
235 Change in soil (0-15cm) C concentration and density (0-15cm) across Wales
Mean soil C concentrations (0-15cm) in Wales are intermediate relative to England and Scotland No
significant change between surveys or over the whole 29 year period was observed ( Fig 25 a amp b)
There was only one significant difference observed within individual categories a decrease for the
Coniferous Woodland Broad Habitat (Table 210) There was no significant change with the two Aggregate
Vegetation Classes we are able to report either for soil (0 -15cm) concentration or density (Fig 213 amp 214
Table 210 amp 211) The low number of reporting categories are due to the lower number of sampl es for
Wales relative to England and Scotland which were sampled in 1978 Reporting change over the full 29 year
reporting period is therefore only possible for Fertile and Infertile Grasslands which have the largest number
of sample squares The increase in sample number in 2007 survey will ensure this improves in future surveys
as we now have baseline measurements for 7 Broad Habitat categories
Figure 213 Change in soil C concentration (0-15cm) for Wales between 1978 and 2007 for the AVC categories
with sufficient sample number to allow reporting for the full 29 year reporting period No significant change was
observed
Figure 214 Change in soil C density (0-15cm) for Wales between 1978 and 2007 for the AVC categories with
sufficient sample number to allow reporting for the full 29 year reporting period Standard error bars are
indicated No significant change was observed
-10
-8
-6
-4
-2
0
2
4
6
8
Fertile grassland Infertile grassland
Ch
an
ge
in
ca
rbo
n c
on
ce
ntr
ati
on
(g
Ck
g)
-12
-10
-8
-6
-4
-2
0
2
Fertile grassland Infertile grassland
Ch
an
ge i
n c
arb
on
den
sit
y (
gC
cm
3)
40
Countryside Survey Soils Report from 2007
2 Carbon
Table 210 Changes in soil C concentration (0-15cm) in Wales for (a) Broad Habitats (b) Aggregate Vegetation
Class (AVC) (c) AVCs unchanged since 1978 and (d) LOI categories Arrows denote significant change (plt005
level) in the direction shown Diagonal line indicates too few samples to provide reliable value
a) Wales - Broad Habitat
Broad Habitat 1978 1998 2007 1978-1998 1998-2007 1978-2007
Broadleaved Mixed and Yew Woodland 672 721 870
Coniferous Woodland 1766 2336 1843
Arable and Horticulture 385 349
Improved Grassland 680 663 606
Neutral Grassland 533 574 621
Acid Grassland 1982 2082 2077
Bracken
Dwarf Shrub Heath 2107 2672 2800
Fen Marsh and Swamp
Bog
All habitat types 1076 1089 1086
Aggregate Vegetation Class 1978 1998 2007 1978-1998 1998-2007 1978-2007
Upland Woodland 1424
Lowland Woodland
Fertile Grassland 545 539 568
Infertile Grassland 637 632 612
Moorland Grass Mosaics 2208
Heath and Bog 3338
Tall Grass and Herb
Crops and Weeds
Aggregate Vegetation Class 1978 1998 2007 1978-1998 1998-2007 1978-2007
Upland Woodland
Lowland Woodland
Fertile Grassland
Infertile Grassland
Moorland Grass Mosaics
Heath and Bog
Tall Grass and Herb
Crops and Weeds
d) Loss on ignition category
LOI category () 1978 1998 2007 1978-1998 1998-2007 1978-2007
Mineral (0-8)
Humus-mineral (8-30) 714 688 691
Organo-mineral (30-60)
Organic (60-100)
b) AVC - whole dataset
Mean carbon concentration gkg-1 Direction of significant changes
Mean carbon concentration gkg-1 Direction of significant changes
Mean carbon concentration gkg-1 Direction of significant changes
c) AVC unchanged
Mean carbon concentration gkg-1 Direction of significant changes
41
Countryside Survey Soils Report from 2007
2 Carbon
Table 211 Changes in soil C density (0-15cm) in Wales for (a) Broad Habitats (b) Aggregate Vegetation Class
(AVC) (c) AVCs unchanged since 1978 and (d) LOI categories Arrows denote significant change (plt005 level) in
the direction shown Diagonal line indicates too few samples to provide reliable value
a) Wales - Broad Habitat
Broad Habitat 1978 1998 2007 1978-1998 1998-2007 1978-2007
Broadleaved Mixed and Yew Woodland 772 614 790
Coniferous Woodland 657 940 762
Arable and Horticulture 708 560
Improved Grassland 726 690 681
Neutral Grassland 644 671 694
Acid Grassland 892 928 838
Bracken
Dwarf Shrub Heath 1341 1068 1033
Fen Marsh and Swamp
Bog
All habitat types 765 802 752
Aggregate Vegetation Class 1978 1998 2007 1978-1998 1998-2007 1978-2007
Upland Woodland
Lowland Woodland
Fertile Grassland 731 714 686
Infertile Grassland 718 663 697
Moorland Grass Mosaics
Heath and Bog
Tall Grass and Herb
Crops and Weeds
Aggregate Vegetation Class 1978 1998 2007 1978-1998 1998-2007 1978-2007
Upland Woodland
Lowland Woodland
Fertile Grassland
Infertile Grassland
Moorland Grass Mosaics
Heath and Bog
Tall Grass and Herb
Crops and Weeds
d) Loss on ignition category
LOI category () 1978 1998 2007 1978-1998 1998-2007 1978-2007
Mineral (0-8)
Humus-mineral (8-30) 718 795 800
Organo-mineral (30-60)
Organic (60-100)
Mean Carbon Density (tha) Direction of significant changes
b) AVC - whole dataset
Mean Carbon Density (tha) Direction of significant changes
Mean Carbon Density (tha) Direction of significant changes
c) AVC unchanged
Mean Carbon Density (tha) Direction of significant changes
42
Countryside Survey Soils Report from 2007
2 Carbon
24 Discussion
It is estimated that European soils contain 75-79Pg C (Schils et al 2008) of which UK soils store 6-7 Pg
The top 15 cm of soils in GB (ie the UK without Northern Ireland) store ca 16 Pg C (Table 211) Soils are
the largest terrestrial pool of C There is a need to track and understand trends in soil C and to optimise
future soil C storage through land management and use Although measurements of topsoil organic C are
available in all member EU countries very few countries have repeated sampling campaigns (Saby et al
2008) and to our knowledge Countryside Survey is the first survey in Europe to sample soils three times
The approach to monitoring programs in Europe has been reviewed by Kibblewhite et al (2008) Morvan et
al (2008) and Schils et al (2008) current national monitoring programs are criticised because of lack of soil
BD measurements insufficient sample numbers and lack of repeated explanatory measurements
Countryside Survey particularly the 2007 Survey addresses these particular issues for GB
The mapped distributions of soil C concentrations (as ) in 2007 ( Fig 215a) follows the anticipated pattern
with high concentrations in upland peatland areas such as NW Scotland N England and upland areas of
Wales The coefficient of variation (CV standard deviation mean an indicator of the spread of the data
around the mean value) is lowest in areas dominated by either low carbon soils which are intensively
managed or high carbon soils in upland areas where there is little variation (Fig 215b) Conversely the
signal to noise ratio (SNR mean standard deviation) indicates that for values above 1 the signal is stronger
than the noise High SNR‟s are consistent with managed arable areas acros s Eastern England and the
upland and peat areas across the UK but especially in N Scotland (Fig 215c) This may occur because the
soil management leads to greater uniformity of carbon levels across these areas In areas less intensively
managed natural variation in soil carbon levels across the landscape may lead to the low SNR‟s observed
Figure 215 Maps of soil C concentration (0-15cm) in 2007(a) using ordinary Kriging (C) (b) coefficient of
variation and (c) signal to noise ratio
43
Countryside Survey Soils Report from 2007
2 Carbon
Multiplying soil C density by area of habitats for individual countries results in the estimate of carbon
currently stored in 0-15cm of GB soils (Table 211)
Table 211 Estimate of soil carbon stock (0-15cm) for GB and individual countries
Country km2 Soil C density
(0-15cm)
tha
Soil C stock
(0-15cm)
TgC
se
GB 228226 6931 1582 29
England 127284 6245 795 15
Scotland 79849 7879 628 11
Wales 21091 7519 159 3
The CS estimate for England and Wales (954 Tg) in soils (0 -15cm) compares with an estimate of 864 Tg for
England and Wales estimated by Bellamy et al (2005) One major cause of this difference is the new
conversion factor for LOI to soil C concentration of 055 defined by CS compared to the factor of 05 used by
Bellamy et al (2005) The new pedotransfer function for bulk density measurements to soil C concentration
described in Chapter 1 primarily affects estimates of stock and change for organic soils only and has only
limited effect on total stock estimates (0-15cm) at the national scale
The results from the Countryside Survey of Great Britain reported here suggest that the topsoil C
concentration and stock of GB and its constituent countries has not changed significantly since 1978
Results for topsoil C density are a combination of changes in soil C concentration and estimated bulk density
and we observed no overall change at a GB level in C concentration although there was a significant
increase (+8) between 1978 and 1998 and a decrease ( -65) in 1998 and 2007 Examining C
concentration by other strata (eg country soil C group AVC) produced similar results with consistent
differences between 1978 and 2007 only occurring in arable and woodland systems Particularly significant
in light of Bellamy et al (2005) is the lack of change in topsoil C concentrations in organic soils although this
disagrees with Bellamy et al (2005) it is in agreement with other reports and the outputs of soil C models
There are unfortunately few monitoring studies from W Europe with which to c ompare our topsoil results
some studies only report changes in C concentration some only C density some only to 1m depth Our
results for changes in topsoil C concentrations in arable and grassland systems are comparable with the
ranges reported by various studies on Belgian soils (Goidts and van Wesemael 2007) but are smaller than
those reported by Bellamy et al (2005) for England and Wales For woodland soils CS estimates of change
are larger than those reported from a major UK resurvey of 103 wood lands (Kirby et al 2005) and in the
opposite direction to reports of C changes in woodland soils in Belgium (Stevens and van Wesemael 2008)
and to that of Bellamy et al (2005) for England and Wales Given the small number of woodlands sampled in
CS in 1978 and 1998 a potentially more accurate picture of changes in topsoil C concentration in GB
woodlands was reported by Kirby et al (2005) whose survey specifically examined changes in woodlands
between 1971 and 2000-2003 and found no significant change in topsoil C concentration which remained
around 88 g C kg -1 However CS estimates of changes in woodland topsoil C densities (12-30 g C m
-2 yr
-1)
are similar to model estimates of European forest soils by Liski et al (2002) and Nabuurs et al (2003)
which suggest net sequestration of 19 and 11 g m-2
yr-1
respectively
A range of potential factors responsible for soil C change have been proposed including climate change
nutrient deposition management practices increasing atmospheric CO 2 concentrations and land use and
land use change However at the large scale the attributi on of change is complicated by the presence of
multiple drivers which can simultaneously affect the balance of C inputs (largely plant biomass) and outputs
(mostly microbial respiration) Our results also suggest that land use change (as measured by the AVC) is
not responsible for the few significant observed changes in topsoil C concentration Climate change is
unlikely to be the cause of change in topsoil C since changes in temperature and rainfall across GB since
44
Countryside Survey Soils Report from 2007
2 Carbon
1978 have been insufficient to cause large-scale changes in mineral soil C concentration or density (Smith et
al 2007) Model estimates of climate change-related variation in C density for England Scotland and Wales
are -001 +003 and +001 yr -1 respectively if changes in net primary productivity (NPP) are included
(Smith et al 2007) CS estimates of change are much larger than these -009 to -021 +01 to +013 and
+018 to +039 yr -1 for all arable grassland and forest soils respectively across GB Since land use change
and climate change may be excluded as primary drivers of change and trends differ between habitat types
other habitat-specific drivers must be responsible for the long-term changes observed in arable and woodland
soils The most consistent finding from CS in 2007 is the reduction in soil C (0-15cm) concentration and
density in cropland A reduction in mean total N concentration as well (Chapter 4) suggests processes such
as erosion deep ploughing (which brings soil with lower CN ratio soil to the surface) and or increased
decomposition may be responsible for this trend Intensification of farming practices are often thought to be
the dominant factor (Stoate et al 2001) In Broadleaved Woodland where a significant increase was
observed changes in tree age structure and reduced harvesting are likely to be the main drivers of soil C
concentration increases (Liski et al 2002 De Vries et al 2006) Efforts to attribute the observed soil (0-
15cm) C changes in CS are ongoing and will be reported in the CS Integr ated Assessment Report
25 Policy Implications
The results from CS in 2007 do not confirm the widespread loss of soil carbon (0-15cm) as reported by
Bellamy et al (2005) for soils (0-15cm) as part of the National Soils Inventory monitoring programme in
England and Wales between 1978 and 2003 The one consistent exception is loss of carbon (0-15cm) from
the intensively managed Arable and Horticulture Broad Habitat Crops and Weeds Aggregate Vegetation
Class soils This suggests that current policies in place to limit soil degradation are not maintaining soil
quality in cropped land
The stability in soil carbon measurements in other land use types could be a combination of a complex mix of
factors some of which may increase soil (0-15cm) C concentration eg increased carbon inputs from plants
due to nitrogen deposition and increased carbon dioxide in the atmosphere whilst some may reduce soil C
concentration eg intensive land management Only by further analysis of the spatial patterns within the CS
datasets in combination with experimental and survey data from other studies and modelling approaches will
it be possible to advise on the likely future trends of soil carbon and indeed help to explain the general trend
of an increase between 1978 and decrease from 1998 to 2007 It should also be remembered these are
results for soil 0-15cm only and not the whole soil profile It does not include soil lost by erosion although a
reduction in soil C concentration would be expected if the latter was widespread as soil decreases in soil C
concentration down the soil profile
A major change for CS in 2007 was the introduction of data which enables calculation of carbon stock (0 -
15cm) This takes into account not only the soil C concentration of soil in the top 15cm but also the amount of
soil The amount of soil may change due to changes in the compaction of the soil for example due to the use
of heavy machinery or increased animal numbers The increased information this provides has resulted in
greater confidence in the reduction in soil carbon for intensively managed arable and crop soils as this trend
is observed in both soil C concentration and C density results and is the most consistent result within
individual categories By combining C density data wi th areas of Broad Habitats a national estimate of the
topsoil (0-15cm) carbon stock from co-located bulk density and soil C concentration measurements is now
available for the first time
The data provide an evidence base for monitoring the protection o f soil carbon stores highlighted as a priority
within the new Soils Strategy for England the Environment Strategy in Wales and Scottish Soil Framework
The new data have now been selected as an indicator of soil quality for State of the Environment Repor ting
45
Countryside Survey Soils Report from 2007
2 Carbon
26 References
Bellamy PH Loveland PJ Bradley RI Lark RM Kirk GJD 2005 Carbon losses from all soils
across England and Wales 1978-2003 Nature 437 245-248
Carey PD Wallis S Chamberlain PM Cooper A Emmett BA Maskell LC McCann T Murphy J
Norton LR Reynolds B Scott WA Simpson IC Smart SM Ullyett JM 2008 Countryside Survey
UK Results from 2007 NERCCentre for Ecology amp Hydrology 105pp (CEH Project Number C03259)
De Vries W Reinds GJ Gundersen P Sterba H 2006 The impact of nitrogen deposition on carbon
sequestration in European forests and forest soils Global Change Biology 12 1151-1173
Emmett BA Frogbrook ZL Chamberlain PM Griffiths R Pickup R Poskitt J Reynolds B Rowe
E Spurgeon D Rowland P Wilson J and Wood CM 2008 CS Technical Report No 307 Soils
Manual NERCCentre for Ecology amp Hydrology 180 pp (CEH Project Number C03259)
Goidts E van Wesemael B 2007 Regional assessment of soil organic carbon changes under agriculture in
Southern Belgium (1955-2005) Geoderma 141 341-354
Jackson DL 2000 Guidance on the interpretation of the Biodiversity Broad Habitat Classification (terrestrial
and freshwater types) Definitions and the relationship with other classifications JNCC Peterborough UK
Kibblewhite MG Jones RJA Baritz R Huber S Arrouays D Micheli E Stephens M 2008
ENVASSO Final Report Part I Scientific and Technical Activ ities ENVASSO Project (Contract 022713)
coordinated by Cranfield University UK for Scientific Support to Policy European Commission 6th
Framework Research Programme
Kirby KJ Smart SM Black HIJ Bunce RGH Corney PM Smithers RJ 2005 Long term
ecological change in British woodlands (1971-2001) English Nature Peterborough UK
Liski J Perruchoud D Karjalainen T 2002 Increasing carbon stocks in the forest soils of western Europe
Forest Ecology and Management 169 159-175
Morvan X Saby NPA Arrouays D Le Bas C Jones RJA Verheijen FGA Bellamy PH
Stephens M Kibblewhite MG 2008 Soil monitoring in Europe A review of existing systems and
requirements for harmonisation Science of the Total Environment 391 1-12
Nabuurs G J Schelhaas M J Mohren G M J and Field C B 2003 Temporal evolution of the
European forest sector carbon sink from 1950 to 1999 Global Change Biol 9 152-160
Saby NPA Bellamy PH Morvan X Arrouays D Jones RJA Verheijen FGA Kibblewhite MG
Verdoodt A Berenyiuveges J Freudenschuss A Simota C 2008 Will European soil-monitoring networks
be able to detect changes in topsoil organic carbon content Global Change Biology 14 2432-2442
Schils R Kuikman P Liski J van Oijen M Smith P Webb J Alm J Somogyi Z van den Akker J
Billett M Emmett BA Evans C Lindner M Palosuo T Bellamy P Jandl R Hiederer R 2008
Review of existing information on the interrelations between soil and climate change European Commission
Brussels
Smith P Chapman SJ Scott WA Black HIJ Wattenbach M Milne R Campbell CD Lilly A
Ostle N Levy PE Lumsdon DG Millard P Towers W Zaehle S amp Smith JU (2007) Climate
change cannot be entirely responsible for soil carbon loss observed in England and Wales 1978 -2003
Global Change Biology 13 2605-2609
46
Countryside Survey Soils Report from 2007
2 Carbon
Stevens Avan Wesemael B 2008 Soil organic carbon dynamics at the regional scale as influenced by
land use history a case study in forest soils from southern Belgium Soil Use and Management 24 69-79
Stoate C Boatman ND Borralho RJ Carvalho CR de Snoo GR Eden P 2001 Ecological impacts
of arable intensification in Europe Journal of Environmental Management 63 337-365
47
Countryside Survey Soils Report from 2007
3 Soil pH
Summary
The mean pH of soils (0-15cm) increased in less acidic soils across Great Britain (GB) between
1998 and 2007 continuing a trend observed between 1978 and 1998 These soils are associated with
Broadleaved Woodland Arable and Horticulture Improved Grassland and Neutral Grassland Broad
Habitats This increase in pH is consistent with the expected b enefit of continued reductions in
sulphur emissions
There was no significant change in mean soil (0-15 cm) pH in more acidic organic-rich soils across
Great Britain between 1998 and 2007 This will affect Broad Habitats such as Bog Dwarf Shrub
Heath and Acid Grassland Data analysis is ongoing to determine if the lower sulphur reductions in
the north and west of the Great Britain or other drivers of change such as nitrogen deposition and
land management are responsible in the organic soils where pH did not significantly increase
between 1998 and 2007 Conversion between land uses between surveys was not responsible as
similar trends were observed in soils with or without conversion
One exception with no apparent trends between any time period was Coniferous Woodland It is
possible the acidification of soils associated with intensive forestry due to base cation uptake and
enhanced capture of acidic pollutants by the tree canopy may be offsetting the effects of reduced
sulphur emissions
The results for individual countries broadly reflected those for Great Britain as a whole with
continued increase in soil pH only observed in less acidic soils Insufficient sample size for some
habitat types with lower area in individual countries prevented significant trends being identified in
some cases
The implications of these findings are that current emission control policies combined with current
policies to protect soil through sustainable land management practices have had some major
benefits but they may not be sufficient to promote continued recovery from acidification i n organic-
rich soils
31 Policy background
Key question Has the recovery from acidification detected by Countryside Survey between 1978 and 1998
continued
Measurements The pH of soils (0-15 cm) from all plots sampled in 1978 and 1998 and all additional plots
sampled in 2007
Soil pH is probably the most commonly measured soil chemical parameter It gives an indication of soil
acidity and therefore has direct policy relevance in a number of areas primarily recovery from acidification
and impacts on biodiversity Soil pH is a key variable for predicting the mobility and bioavailability of metals
in soils and helps determine the response of plant species to changes in atmospheric nitrogen and acid
deposition It is currently estimated that 58 of ter restrial semi-natural habitats across GB receive acidic
deposition in excess of their buffering capacity thus potentially causing long term damage according to the
critical load methodology (RoTAP 2010)
The soil pH data from the Countryside Survey in 1998 provided unique nationwide evidence of soil pH change
(0-15 cm) since the first measurements in 1978 Preliminary data were incorporated within the report of the
National Expert Group on Transboundary Air Pollution (NEGTAP 2001) as providing evidence of a possible
48
Countryside Survey Soils Report from 2007
3 Soil pH
response to the reduction in acid deposition over the twenty year period between the two surveys The MASQ
report (Monitoring and Assessing of Soil Quality Black et al 2000) provided a more complete analysis of the
Countryside Survey soils data and confirmed an increase in soil pH (0-15 cm) between 1978 and 2000 in all
but Coniferous Woodlands Broad Habitat irrespective of whether the data were analysed by Environmental
Zone Broad Habitat ITE Land Class Aggregate Vegetation Class (AVC) or major soil group More
importantly the vegetation survey indicated a change in vegetation structure towards more nitrophilous less
acid tolerant species from 1990 to 1998 (Haines-Young et al 2000) providing corroboration for the soil data
and an excellent example of the power of the Countryside Survey approach in combining co-located
synchronous data collection of a wide range of variables A new review of changes in soil pH is due to be
published later in 2010 Review of Transboundary Air Pollution (RoTAP) and current indications are that
trends identified by CS are mirrored in other surveys (RoTAP 2010)
The rationale for including measurement of soil pH at 0-15 cm depth in the survey in 2007 is summarised in
Table 31 Measurement of soil (0-15 cm) pH will deliver
An extended time series of soil pH from 1978
Increased reporting power for individual countries (especially Wales) by making measurements in all
squares sampled during Countryside Survey in 2007 (591)
An assessment as to whether the decrease in soil acidity across all major soil groups and the majority of
Broad Habitats observed between 1978 and 1998 has continued
Improved prediction of plant species composition change using linked biogeochemical plant species
models
49
Countryside Survey Soils Report from 2007
3 Soil pH
Table 31 Rationale for measurement of soil (0-15 cm) pH
Issue Facts Comments
History in Countryside Survey
Measured on soils collected from Main Plots in the original 256 squares which formed the ldquoITE Ecological Survey of the UKrdquo Countryside Survey in 1998 re-measured pH from the same 256 squares
256 squares essential to maintain time series data 591 squares will provide better spatial information Soil pH is a critical interpretative variable
Country level reporting Power analysis has indicated only 256 squares are needed to quantify pH change at country level based on change between 1978 and 1998
It is unlikely that the pH change between Countryside Survey in 1998 and Countryside Survey in 2007 will be as great or consistent as between 1978 and Countryside Survey in 1998 The time period is shorter and the deposition change has been less Soil pH is a critical parameter for interpretation of plant species change (Ellenberg pH) bioavailability of P N and metals Recommendation is therefore for soil pH (0-15 cm) to be measured in all 591 squares
Links and compatibility to other monitoring programmes
Comparable data to those collected in the National Soil Inventory (NSI) Representative Soil Sampling Scheme (RSSS) for same horizon (0-15cm) Environmental Change Network (ECN) provides more information to depth and more frequent monitoring of soil solution but from few sites
Countryside Survey will provide data for three time points There were partial resurveys of the NSI in 19945 19956 and 2003 RSSS have data reported to 2001 Soil pH was measured at many ECN sites in 1993 1998 and 2003 Countryside Survey in 2007 will provide the only update for spatially extensive data on soil pH (0-15 cm) in Great Britain A comparison of these surveys was reported in Defra project SP0515 (Defra 2003)
Uniqueness of Countryside Survey
Time series is unique The integrated approach enabling links to vegetation management and water quality change is unique
Value for money (Policy priority or interpretative value x cost)
Very high High policy and interpretative value low cost
50
Countryside Survey Soils Report from 2007
3 Soil pH
32 Methods
321 Proof of concept
The measurement of soil pH in a suspension of de-ionised water is a very well established technique and was
used in both 1978 and for Countryside Survey in 1998 However measurements of pH in water are subject to
a number of uncertainties some of which are fundamentally related to the effects of changes in the ionic
strength of the soil-water suspension on ions sorbed to the soil particles One of the main consequences of
this is the so called dilution effect whereby different pH values are measured depending on the soilwater
ratio in the suspension A solution of 001M Calcium Chloride (CaCl2) has approximately the same ionic
strength as the soil solution in fertilised temperate soils and has been recommended as a more appropriate
medium for soil pH measurement (Schofield and Taylor 1955) Measurement of pH in CaCl2 yields more
consistent results the pH value in CaCl2 is lower than measured in water but closer to the value observed
under equilibrium conditions using repeated extractions (White 1969) The relationship between soil pH
measured in water and CaCl2 is not consistent For example over a wide pH range in lowland grassland soils
(Fig 31) soil pH in CaCl2 was approximately 08 pH units lower than the corresponding measurements in
deionised water There was also considerable scatter in the relationship particularly for more acid soils
In the 1978 Ecological Survey soil pH in water was measured at ITE Bangor using a modified version of the
method used by the Soil Survey of England and Wales (Avery and Bascomb 1974) In 1998 soil pH was
measured at CEH Merlewood using the protocol described in Allen et al (1989) The latter resulted in a
suspension with a soil to water ratio of approximately 12 by weight compared to the 1978 analyses with a
soil to water ratio of 125 by weight It is unlikely that this small difference in ratio result ed in a significant
difference in pH between the two methods As soil pH in CaCl2 was to be measured in 2007 in addition to pH
in water the original method used in 1978 was chosen Soil pH in CaCl2 can easily be measured using the
1978 method by adding a few millilitres of concentrated CaCl2 solution to the water pH suspension This
saves the time required to re-weigh and mix a second sample and conserves valuable soil for other analyses
The comparability of the 1978 and 1998 methods was checked prior to the survey in 1998 using archive soils
taken in 1971 from woodland habitats across Great Britain (Black et al 2000) The method used in 1971 was
the same as that used in 1978 and the re-analysis on dried archived soils used the 1998 method No
statistically significant differences were found between pH values measured on dried archive soils from 1971
using the 1998 method and the original data obtained from field moist soils in 1971
Figure 31 Soil pH (0-15 cm) measured in deionised water and 001M CaCl2 for a range of lowland
grassland soils (unpublished data CEH Bangor and CCW)
y = 101x - 080
R2 = 0953
3
4
5
6
7
8
9
3 4 5 6 7 8
Soil pH in water
So
il p
H i
n C
aC
l 2
11 line
51
Countryside Survey Soils Report from 2007
3 Soil pH
322 Laboratory analysis
Samples for soil pH measurement were collected using the 15 cm long by 5 cm diameter black plastic core
following the field protocol described in the Soils Manual (Emmett et al 2008)
The pH of fresh soil in water was measured using 10 g of field -moist soil in a 50 ml plastic beaker to which 25
ml of deionised water was added giving a ratio of soil to water of 125 by weight The suspension was stirred
thoroughly and left to stand for 30 minutes after which time the pH electrode was inserted into the
suspension and a reading taken after a further 30 seconds Following the measurement of soil pH in water 2
ml of 0125M CaCl2 were added to the suspension which on dilution with the 25 ml of water resulted in a
solution concentration of approximately 001M CaCl 2 The suspension was stirred thoroughly and left for 10
minutes after which time the pH electrode was inserted into the suspension and a reading taken after a
further 30 seconds Measurements of soil pH in water and CaCl 2 were repeated on all samples using 10 g of
air dried lt 2mm sieved soil
The fresh soil pH measurements were made as soon as possible after the sample was opened Care was
taken to ensure that the temperature of the buffer solutions used to calibrate the pH meter differed by no
more than 1degC from the temperature of the soil suspensions The pH electrode was carefully rinsed and dried
between each measurement Particular care was taken to clean the electrode following calibration with buffer
solutions
323 Quality Assurance and Quality Control
The DefraNERCBBSRC Joint Codes of Practice were followed
Method comparability Soil pH measurements in deionised water were made on a subset of
approximately 200 soils taken from the 1998 soil sample archive to check the comparability of the method
used in 2007 with that used in 1998
Figure 32 Results of repeat soil pH measurements on archived air dried soil samples collected in
1998
A plot of the repeated measurements from 1998 survey (Fig 32) shows close agreement between the two
datasets with no discernible bias and points clustering along the 11 line From these data it was concluded
that the difference between the methods used in 1998 and 2007 1978 would not bias the pH time series
data However it was noted that in 1978 soil pH was reported to 005 pH units whereas in 1998 and 2007
data were reported to 001 pH units
y = 103x - 023
R2 = 0955
2
4
6
8
10
2 4 6 8 10
Dry soil pH in 1998
Re
peat
dry
so
il p
H in
2007
1 1 line
52
Countryside Survey Soils Report from 2007
3 Soil pH
Analytical Quality Control The calibration of the pH meter was checked after a batch of 25 samples
using pH 4 and pH 7 buffer solutions If either of the buffer solution calibration values differed by more than
002 pH units from the expected value the meter was re-calibrated A standard soil a certified reference soil
and a duplicate analysis was performed on every batch of 25 samples (Fig 33) Soil pH in water and CaCl2
was reported to 001 pH units
Figure 33 Results for batch repeats of pH measurements in a) water and b) CaCl 2
324 Reporting
Soil pH data (0-15 cm) have been analysed to provide information on the state of soil acidity in 2007 and the
change in soil acidity since 1978 The statistical approach used for analysing the data for change involved
bootstrapping which allows for non-normality in the data without the necessity of knowing de tails of the actual
distribution As such it provides a more accurate measurement of significance Annex F of Emmett et al
(2008) provides a background document describing this approach
Prior to the 2007 survey a power analysis was undertaken of the sampling requirements to reliably detect
change in soil pH (0-15 cm) at the country level and details of the outcome are included in Emmett et al
(2008) The resulting increase in the number of squares for Countryside Survey in 2007 to 591 has enabled
reporting of soil pH by Broad Habitat at the Great Britain level (Carey et al 2008) and at the level of the
individual countries (Smart et al 2009 for Wales Norton et al 2009 for Scotland Countryside Survey 2009
for England)
The data in this report describe soil acidity in 2007 and change since 1978 by Broad Habitat Aggregate
Vegetation Class and Loss-on-Ignition (LOI) class In summary
Broad Habitat - The Broad Habitat classification consists of 27 habitats which account for the entire
land surface of Great Britain and the surrounding sea Countryside Survey reports on soils for 10
major terrestrial habitats
Aggregate Vegetation Class (AVC) ndash is a high level grouping of vegetation types produced from a
quantitative hierarchical classification of the different plant species found in the original Countryside
Survey sample plots Loss on ignition (LOI) category ndash soil type based on soil organic matter content defined as minera l (0-
8 LOI 0-44 g C kg-1
) humus-mineral (8 ndash 30 LOI 44-165 g C kg-1
) organo-mineral (30 ndash 60
LOI 165-330 g C kg-1
) and organic (60 ndash 100 gt 330 g C kg-1
)
y = 102x - 012
R2 = 0969
3
4
5
6
7
8
9
3 4 5 6 7 8 9
Sample pH
Re
peat
sam
ple
pH
1 1 line
a) pH in water
y = 102x - 008
R2 = 0976
2
3
4
5
6
7
8
9
2 3 4 5 6 7 8 9
Sample pH
Re
peat
sam
ple
pH
1 1 line
b) pH in CaCl2
53
Countryside Survey Soils Report from 2007
3 Soil pH
The soil pH data were mapped using kriging to interpolate between the Countryside Survey sample points
Routine checking of data for outliers was conducted and the working dataset was transformed using a normal
score procedure to obtain a Gaussian distribution The data were then interpolated on a 1km UK grid using
ordinary kriging and finally the kriged data were back-transformed to produce an interpolated map of soil pH Prior to the 2007 survey data were too sparse to give meaningful and statistically valid interpolation in space and thus no maps of change are presented This will be poss ible in future surveys due to the enhanced baseline
33 Results
331 Structure of the soil pH data
The measured soil pH (0-15 cm) across the three surveys ranged between pH 320 and pH 915 The
distributions of pH values changed with each survey revea ling a progressive reduction in the frequency of
acid values (pHlt5) and an increase in the frequency of values in the range pH 58 to 62 The frequency of
values gt pH 8 also increased across the surveys (Fig 34)
Figure 34 Histograms showing distribution of soil pH (0-15 cm) measurements for a) 1978 b) 1998 c)
2007 and d) cumulative frequency Histogram frequencies normalised to percentage of total number of
samples analysed in each survey
a) 1978
00
20
40
60
80
100
33
64
24
85
4 66
67
27
88
4 9
Soil (0-15 cm) pH
No
o
f o
bserv
ati
on
s (
)
b) 1998
00
20
40
60
80
33
64
24
85
4 66
67
27
88
4 9
Soil (0-15 cm) pH
No
o
f o
bserv
ati
on
s (
)
c) 2007
00
20
40
60
80
33
64
24
85
4 66
67
27
88
4 9
Soil (0-15 cm) pH
No
o
f o
bserv
ati
on
s (
)
d)
00
02
04
06
08
10
3 5 7 9
Soil (0-15 cm) pH
Cu
mu
lati
ve
freq
uen
cy (
)
1978 1998 2007
54
Countryside Survey Soils Report from 2007
3 Soil pH
Approximately 42 of plots were sampled only once in the three surveys (Table 32) reflecting the large
increase in the number of plots in sampled 2007 For plots with repeat measurements an increase of 02 pH
units or more was recorded for an average 66 of plots 11 of plots s howed no change and 22 showed a
decrease in pH of 02 pH units or more (Table 33) This reflects the range of variability always seen in large
scale surveys such as CS Statistical significance in the categories of interest however are the critical issue
Table 32 Number of plots recording a measurement of soil pH (0-15 cm) in each Countryside Survey
Table 33 Percentage of samples from repeat plots in each Countryside Survey showing a decrease in
pH of 02 units or more (ΔpH-ve) no change in pH (ΔpH 0) or an increase in pH of 02 units or more
(ΔpH +ve)
332 Change in mean soil pH (0-15 cm) across Great Britain
The state and change in soil pH across Great Britain over the three Countryside Surveys is summarised in
Table 34 Soils beneath Broad Habitats in Great Britain covered a wide range of pH the most acid soils
comprised those beneath Coniferous Woodland Bog and Dwarf Shrub Heath Broad Habitats where mean pH
in 2007 was asymp 45 whilst the least acid soils (0-15 cm) were those in the enclosed farmland Broad Habitats
with mean pH values ranging between 63 and 72 in 2007
With the exception of Coniferous Woodlands mean soil pH (0-15 cm) increased significantly in all Broad
Habitats over the 29 years from the first survey in 1978 Mean soil pH beneath Coniferous Woodland
remained unchanged over the 29 year period whilst beneath Bracken Broad Habitat the only significant
increase in mean pH was between 1978 and 2007 No significant increases in mean pH were observed
amongst the more acid (1978 mean pH lt 5) and organic -rich Broad Habitats between 1998 and 2007 In
contrast mean soil pH increased between each Countryside Survey in those Broad Habitats with a 1978
mean pH gt5
Analysis of the data in relation to AVC broad ly reflected the results by Broad Habitat In the less acid AVCs
(Fertile and Infertile Grassland and Crops and Weeds mean pH 2007 gt 6) there was a significant increase in
mean soil pH between all three surveys For those AVCs with a mean pH in 2007 of 5 or less there was no
significant change in mean soil pH between 1998 and 2007 but a significant increase was observed between
1978 and 1998 which largely accounted for the increase between 1978 and 2007 There were no significant
changes in mean soil pH in the Tall Grass and Herb AVC and in Lowland Woodlands the only significant soil
pH increase occurred between 1978 and 2007
ΔpH -veΔ p H 0
Δ p H + v e
1978-1998 27 9 64
1998-2007 23 14 63
1978-2007 19 9 72
Mean 23 11 66
No of sites
1978 1998 2007
1978 only 274 274
1998 only 160 160
2007 only 1719 1719
1978 amp1998 only 111 111 222
1998 amp 2007 only 173 173 346
1978 amp 2007 only 179 179 358
1978 amp 1998 amp 2007 688 688 688 2064
Total number of plots 1252 1132 2759 5143
Total number of
samples
Survey years
55
Countryside Survey Soils Report from 2007
3 Soil pH
Table 34 Changes in mean soil pH (0-15 cm) across Great Britain for a) Broad Habitats b) Aggregate
Vegetation Classes (AVC) c) AVCs unchanged since 1978 and d) LOI categories Arrows denote a
significant change (plt005) in the direction shown Diagonal line indicates too few samples to provide
reliable value
a) Great Britain - Broad Habitat
Broad Habitat 1978 1998 2007 1978-1998 1998-2007 1978-2007
Broadleaved Mixed and Yew Woodland 509 547 575
Coniferous Woodland 432 439 450
Arable and Horticulture 659 681 720
Improved Grassland 579 606 627
Neutral Grassland 552 599 614
Acid Grassland 444 472 478
Bracken 414 447 464
Dwarf Shrub Heath 419 450 455
Fen Marsh and Swamp 464 535 545
Bog 429 449 451
All habitat types 539 567 587
Mean pH Direction of significant changes
Aggregate Vegetation Class 1978 1998 2007 1978-1998 1998-2007 1978-2007
All Woodland 452 487 501
Upland Woodland 417 453 459
Lowland Woodland 506 531 566
Fertile Grassland 605 623 645
Infertile Grassland 549 586 610
Moorland Grass Mosaic 440 477 477
Heath and Bog 426 442 444
Tall Grass and Herb 645 685 689
Crops and Weeds 657 679 725
b) Great Britain - AVC whole dataset
Mean pH Direction of significant changes
Aggregate Vegetation Class 1978 1998 2007 1978-1998 1998-2007 1978-2007
All Woodlands 421 454 482
Upland Woodland
Lowland Woodland
Fertile Grassland 600 608 643
Infertile Grassland 549 581 619
Moorland Grass Mosaic 439 476 478
Heath and Bog 435 457 457
Tall Grass and Herb
Crops and Weeds 701 694 738
Mean pH Direction of significant changes
c) Great Britain - AVC unchanged
56
Countryside Survey Soils Report from 2007
3 Soil pH
In order to remove the effects of vegetation land use change statistical analysis was performed on a subset
of the plots which had been sampled in all three Surveys and for which the AVC had remained unchanged
over time AVC is only recorded at the time of each Countryside Survey so change in the intervening years
cannot be ruled out but the plots for which AVC has not changed will have a vegetation composition that has
remained largely consistent in 1978 1998 and 2007
Restricting the analysis to plots where AVC has remained unchanged since 1978 resulted in three Classes
having insufficient data for analysis (Upland and Lowland Woodland and Tall Grass and Herb) Amongst the
remaining unchanged AVCs the only differences in the results were for Fertile Grass land and Crops and
Weeds where the significant increase in mean soil pH between 1978 and 1998 was lost For Fertile
Grassland the mean soil pH values recorded for the whole dataset and for the AVC unchanged data were
very similar suggesting that significance was lost due to a reduction in the number of samples In contrast
for Crops and Weeds the 1978 mean values differ by 044 units between the two datasets suggesting that
restricting the analysis to unchanged plots has eliminated some that were either mis-classified in 1978 or
were responding to changes in landuse vegetation prior to 1978
In all three surveys the most acid soils corresponded to those with the highest organic matter content (Table
34) reflecting the broad inverse relationship between soil pH and LOI (Fig 35) The lower boundary pH
values to this relationship decreased approximately linearly from pH 4 to pH 34 across the full range of LOI
values The upper boundary value decreased more steeply from pH 915 at less than 1 LOI to pH 496 at
96 LOI Mineral soils therefore had a much wider pH range (eg pH 394 to 86 at 4 LOI) compared with
organic soils (eg pH 35 to 51 at 95 LOI) Due to the logarithmic pH scale the range in hydrogen ion
concentrations was actually greater in organic soils (equivalent to 771 μEq kg at 95 LOI) compared to
mineral soils (equivalent to 287 μEq kg at 4 LOI)
Mean soil pH increased significantly across all three Countryside Surveys in mineral soils with an LOI less
than 30 (Table 34) There was no significant change in mean soil pH for organo-mineral and organic soils
between 1998 and 2007 although there was a significant increase in mean pH between 1978 and 1998 which
largely accounted for the significant increase between 1978 and 2007 (Fig 36)
d) Great Britain - Loss on ignition category
LOI category () 1978 1998 2007 1978-1998 1998-2007 1978-2007
Mineral (0-8) 619 643 674
Humus-mineral (8-30) 530 567 590
Organo-mineral (30-60) 458 495 496
Organic (60-100) 425 445 444
Mean pH Direction of significant changes
57
Countryside Survey Soils Report from 2007
3 Soil pH
Figure 35 The relationship between soil pH (0-15 cm) and Loss on Ignition in 2007
Figure 36 The change in the mean pH of soils (0-15 cm) for mineral soils (0-8 LOI) and organic soils
(60-100 LOI) between 1978 and 2007 Significant changes ( plt0001) are show between the dates
bracketed 95 CI are shown for each data point
333 Change in mean soil pH (0-15 cm) across England
Mean soil pH (0-15 cm) values in the All Broad Habitats category for England were approximately 05 pH
units higher compared to Great Britain as a whole (Fig 37) with significant increases observed between
each survey and over the 29 year period since 1978 (Table 35 and Fig 38)
2
3
4
5
6
7
8
9
10
0 10 20 30 40 50 60 70 80 90 100
LOI ()
pH
300
400
500
600
700
800
1973 1978 1983 1988 1993 1998 2003 2008
pH
LOI category 0-8 LOI category 60-100
58
Countryside Survey Soils Report from 2007
3 Soil pH
Figure 37 Differences between England and Great Britain in mean soil pH (0-15 cm) for all Broad
Habitats
Soils beneath enclosed farmland Broad Habitats were the least acid in England with mean pH values gt 65 in
2007 and significant increases in mean soil pH between each survey Mean soil pH (0 -15 cm) in English
enclosed farmland was asymp 025 pH units higher than for Great Britain as a whole (Fig 37) In contrast to
Great Britain Bog soils were the most acid in England (2007 mean pH 401) and no significant changes in
mean pH were recorded across the 29 year period of Countryside Survey Apart from Bog Fen Marsh and
Swamp and Coniferous Woodland all other Broad Habitats showed a significant increase in mean soil pH
between 1978 and 2007 In contrast to Great Britain as whole mean soil pH in Bracken and Dwarf Shrub
Heath Broad Habitats increased significantly between 1998 and 2007 but not between 1978 and 1998 the
mean pH of Acid Grassland soils increased significantly between all three surveys
With the exception of Heath and Bog AVC where no significant changes were observed a nd Crops and
Weeds where there were too few samples for statistical analysis the mean soil pH (0 -15 cm) increased
significantly in all AVCs between 1978 and 2007 in England (Table 35) This broadly reflects the results for
analysis by Broad Habitat except that soil pH increased significantly in the Upland Woodland AVC but not in
Coniferous Forest Broad Habitat possibly due to the inclusion of some broadleaf woodland within the Upland
Woodland AVC and exclusion of lowland coniferous woodland Mean soil pH increased significantly between
1998 and 2007 in Moorland Grass Mosaic in England in contrast to Great Britain where no significant change
was recorded over this period Restricting statistical analysis to unchanged AVCs eliminated several classes
due to small sample numbers Significance was lost for the change in mean soil pH between 1978 and 1998
for Infertile Grassland and Crops and Weeds This may be due to a reduction in sample numbers but for
Crops and Weeds the mean soil pH for the unchanged dataset (pH 709) was approximately 03 pH units
higher than for the whole dataset Restricting the analysis to unchanged plots may have eliminated some
plots that were either mis-classified in 1978 or responding to changes in landuse vegetation prior to 19 78
For England the most organic-rich (60-100 LOI category Table 35) soils were not represented in
sufficient numbers for statistical analysis Mean soil pH (0 -15 cm) was highest in the mineral category (2007
pH 702) and lowest in the organo-mineral soils (2007 pH 502) Mean soil pH increased significantly between
each Survey and across the 29 years since 1978 in soils with less than 30 LOI For organo-mineral soils
(30-60 LOI) mean soil pH increased significantly between 1978 and 1998 which large ly accounted for the
significant increase between 1978 and 2007 These results were consistent with those for Great Britain as a
whole
-060
-040
-020
000
020
040
060
080B
roa
dle
ave
d
Mix
ed
an
d
Ye
wC
on
ife
rou
s
Wo
od
lan
d
Ara
ble
an
d
Ho
rtic
ultu
re
Imp
rove
d
Gra
ssla
nd
Ne
utr
al
Gra
ssla
nd
Acid
Gra
ssla
nd
Bra
cke
n
Dw
arf
Sh
rub
He
ath
Fe
n M
ars
h
an
d S
wa
mp
Bo
g
All
ha
bita
t
typ
es
Dif
fere
nc
e in
me
an
pH
59
Countryside Survey Soils Report from 2007
3 Soil pH
Figure 38 The change in the mean pH of soils (0-15 cm) for across all Broad Habitats in England and
Great Britain between 1978 and 2007 Significant changes ( plt0001) are show between the dates
bracketed 95 CI are shown for each data point
Table 35 Changes in mean soil pH (0-15 cm) across England for a) Broad Habitats b) Aggregate
Vegetation Classes (AVC) c) AVCs unchanged since 1978 and d) LOI categories Arrows denote a
significant change (plt005) in the direction shown Diagonal line indicates too few samples to provide
reliable value
a) England - Broad Habitat
Broad Habitat 1978 1998 2007 1978-1998 1998-2007 1978-2007
Broadleaved Mixed and Yew Woodland 523 583 607
Coniferous Woodland 431 413 444
Arable and Horticulture 671 702 743
Improved Grassland 614 629 658
Neutral Grassland 572 618 641
Acid Grassland 404 451 474
Bracken 411 408 489
Dwarf Shrub Heath 400 412 440
Fen Marsh and Swamp 515 583 548
Bog 409 409 401
All habitat types 589 619 651
Mean pH Direction of significant changes
300
400
500
600
700
800
1973 1978 1983 1988 1993 1998 2003 2008
pH
England Great Britain
60
Countryside Survey Soils Report from 2007
3 Soil pH
d) England - Loss on ignition category
LOI category () 1978 1998 2007 1978-1998 1998-2007 1978-2007
Mineral (0-8) 640 670 702
Humus-mineral (8-30) 573 601 640
Organo-mineral (30-60) 449 504 502
Organic (60-100)
Mean pH Direction of significant changes
334 Change in mean soil pH (0-15 cm) across Scotland
There was a significant increase in mean soil pH in the All Broad Habitats category for Scotland from 1998 to
2007 (Table 36) Earlier increases in pH between 1978 and 1998 and overall from 1978 to 2007 were also
significant (Table 35) Overall mean soil pH was more acid in Scotland compared to Great Britain as a
whole most notably for the enclosed farmland Broad Habitats and for Broadleaved Woodland and Neutral
Grassland (Fig 39)
b) England - AVC whole dataset
Aggregate Vegetation Class 1978 1998 2007 1978-1998 1998-2007 1978-2007
Upland Woodland 401 434 457
Lowland woodland 518 539 572
Fertile grassland 624 640 672
Infertile grassland 575 610 630
Moorland grass mosaics 405 438 465
Heath and Bog 398 416 424
Tall grass and Herb 700 706
Crops and weeds 672 703 750
Mean pH Direction of significant changes
Aggregate Vegetation Class 1978 1998 2007 1978-1998 1998-2007 1978-2007
Upland Woodland
Lowland woodland
Fertile grassland 619 628 666
Infertile grassland 582 609 637
Moorland grass mosaic
Heath and Bog
Tall grass and Herb
Crops and weeds 709 705 753
Mean pH Direction of significant changes
c) England - AVC unchanged
61
Countryside Survey Soils Report from 2007
3 Soil pH
Figure 39 Differences between Scotland and Great Britain in mean soil pH (0-15 cm) for all Broad
Habitats
Soils beneath the Arable Broad Habitat were the least acidic in Scotlan d (2007 mean pH 628) and this was
the only Broad Habitat to record a significant increase in mean soil pH between 1998 (pH 598) and 2007 (pH
628) Mean soil pH in the Arable Broad Habitat did not increase significantly between 1978 and 1998 or
across the entire period from 1978 to 2007
There was no significant change in mean soil pH beneath woodland Broad Habitats in Scotland between
1998 and 2007 or between 1978 and 1998 or between 1978 and 2007 There was a significant increase in
soil pH between 1978 and 1998 for Improved Grassland Neutral Grassland Dwarf Shrub Heath Fen Marsh
and Swamp and Bog Broad Habitats which largely accounted for the significant increase in mean soil pH over
the entire period from 1978 to 2007 in these Broad Habitats Mean soil pH beneath Acid Grassland increased
significanly between 1978 (pH 461) and 2007 (pH 482) but not between 1978 and 1998 or between 1998
and 2007 Bracken was the most acidic Broad Habitat in Scotland in 2007 (mean pH 451) but there were no
significant changes in mean soil pH between any of the Surveys or over the 29 year period from 1978
Infertile Grassland and Crops and Weeds were the only AVCs in Scotland to record a significant increase in
mean soil pH between 1997 and 2007 For Infertile Grassland this continued the trend of significant mean
soil pH increase between 1978 and 1998 and across the entire period from 1978 to 2007 No other significant
changes in mean soil pH were observed for Crops and Weeds There was a significant increase in mean soil
pH for Moorland Mosaics and Heath and Bog between 1978 and 1998 which largely accounted for the
significant increases between 1978 and 2007 For Upland Woodland there was a significant increase in mean
soil pH between 1978 and 2007 but no other significant changes were observed
Restricting the statistical analysis to unchanged AVCs eliminated all but three classes due to small sample
numbers The only difference in the results for the remaining AVCs was the loss of significance for the
increase in mean soil pH in Infertile Grassland between 1978 and 1998 The mean pH values for 1978 and
1998 and the differences between 1978 and 1998 are similar for the unchanged and the whole Infertile
Grassland dataset indicating that a reduction in sample numbers may have caused the loss of significance
-100
-080
-060
-040
-020
000
020B
roadle
aved
Mix
ed a
nd
Yew
Co
nifero
us
Woodla
nd
Ara
ble
and
Ho
rtic
ulture
Impro
ved
Gra
ssla
nd
Ne
utr
al
Gra
ssla
nd
Acid
Gra
ssla
nd
Bra
cken
Dw
arf
Shru
b
He
ath
Fen M
ars
h
and S
wam
p
Bog
All
habitat
types
Dif
fere
nce in
mean
pH
62
Countryside Survey Soils Report from 2007
3 Soil pH
Table 36 Changes in mean soil pH (0-15 cm) across Scotland for a) Broad Habitats b) Aggregate
Vegetation Classes (AVC) c) AVCs unchanged since 1978 and d) LOI categories Arrows denote a
significant change (plt005) in the direction shown Diagonal line indicates too few samples to provide
reliable value
a) Scotland - Broad Habitat
Broad Habitat 1978 1998 2007 1978-1998 1998-2007 1978-2007
Broadleaved Mixed and Yew Woodland 500 485 526
Coniferous Woodland 442 452 461
Arable and Horticulture 614 598 628
Improved Grassland 544 584 595
Neutral Grassland 531 571 572
Acid Grassland 461 483 482
Bracken 442 481 451
Dwarf Shrub Heath 431 463 466
Fen Marsh and Swamp 459 524 531
Bog 434 453 459
All habitat types 481 502 509
Mean pH Direction of significant changes
b) Scotland - AVC whole dataset
Aggregate Vegetation Class 1978 1998 2007 1978-1998 1998-2007 1978-2007
Upland Woodland 432 464 470
Lowland woodland
Fertile grassland 575 594 608
Infertile grassland 535 567 589
Moorland grass mosaics 451 490 487
Heath and Bog 434 450 453
Tall grass and Herb
Crops and weeds 607 578 616
Mean pH Direction of significant changes
Aggregate Vegetation Class 1978 1998 2007 1978-1998 1998-2007 1978-2007
Upland Woodland
Lowland woodland
Fertile grassland
Infertile grassland 525 554 593
Moorland grass mosaic 451 486 489
Heath and Bog 440 461 461
Tall grass and Herb
Crops and weeds
Mean pH Direction of significant changes
c) Scotland - AVC unchanged
63
Countryside Survey Soils Report from 2007
3 Soil pH
In 2007 the mean soil pH in mineral and humus-mineral soils in Scotland was approximately 05 pH units
lower compared to the equivalent soils across Great Britain as a whole (Tables 34 and 36) In contrast the
mean soil pH of the organic-rich soils (gt 30 LOI) was approximately the same in Scotland and across Great
Britain in 2007 For soils in all LOI categories there was a significant increase in mean pH between 1978 and
2007 but the patterns of change with respect to LOI category for other periods were much less consistent in
Scotland compared to Great Britain as a whole Mineral so ils were the only category to record a significant
increase in mean soil pH between 1998 and 2007 The mean pH of humus -mineral and organic soils
increased significantly between 1978 and 1998 which largely accounted for the increase in mean soil pH
between 1978 and 2007 For organo-mineral soils (30-60 LOI) there were no significant changes in mean
soil pH between 1978 and 1998 or between 1998 and 2007
335 Change in mean soil pH (0-15 cm) across Wales
The most acid soils in Wales in 2007 were those beneath Coniferous Woodland (pH 414) whilst soils
beneath enclosed farmland Broad Habitats were the least acid (Table 37) There were no significant
changes in mean soil pH for any of the Broad Habitats in Wales between 1998 and 2007 The mean pH of
soils beneath Broadleaved Woodland Improved Grassland and Neutral Grassland increased significantly
between 1978 and 1998 and this accounted for much of the significant increase in mean soil pH between
1978 and 2007 in these Broad Habitats For Coniferous Woodland Acid Grassland and Dwarf Shrub Heath
there were no significant changes in mean soil pH between any of the Surveys or across the entire period
between 1978 and 2007 Mean soil pH was more acid in Wales for all Broad Habitats relative to mean values
for Great Britain (Fig 310)
Figure 310 Differences between Wales and Great Britain in mean soil pH (0-15 cm) for all Broad
Habitats
-080
-070
-060
-050
-040
-030
-020
-010
000
Bro
ad
lea
ve
d
Mix
ed
an
d
Ye
wC
on
ife
rou
s
Wo
od
lan
d
Ara
ble
an
d
Ho
rtic
ultu
re
Imp
rove
d
Gra
ssla
nd
Ne
utr
al
Gra
ssla
nd
Acid
Gra
ssla
nd
Bra
cke
n
Dw
arf
Sh
rub
He
ath
Fe
n M
ars
h
an
d S
wa
mp
Bo
g
All
ha
bita
t
typ
es
Dif
fere
nc
e in
me
an
pH
d) Scotland - Loss on ignition category
LOI category () 1978 1998 2007 1978-1998 1998-2007 1978-2007
Mineral (0-8) 575 582 605
Humus-mineral (8-30) 496 535 545
Organo-mineral (30-60) 464 487 496
Organic (60-100) 430 451 450
Mean pH Direction of significant changes
64
Countryside Survey Soils Report from 2007
3 Soil pH
Infertile Grassland and Fertile Grassland were the only AVCs to have sufficient data to report st ate and
change for all three Countryside Surveys (Table 37) The mean pH of soils beneath Fertile Grassland did not
change significantly between any of the Surveys or across the period from 1978 to 2007 For Infertile
Grassland there was a significant increase in mean soil pH between 1998 and 2007 between 1978 and 1998
and across the entire period from 1978 to 2007 Restricting the statistical analysis to unchanged AVCs
eliminated all but Infertile Grassland which showed very similar results to the AVC d ataset as a whole It is
unlikely therefore that the changes observed in mean soil pH for Infertile Grassland in Wales resulted from a
change in land use or vegetation composition
There was no significant change in the mean soil pH of mineral or humus -mineral soils in Wales between
1998 and 2007 and there were too few data to report on state and change in mean soil pH for organo -mineral
and organic soils (Table 37) The mean pH of mineral soils (0-15 cm) did not change significantly between
any of the surveys or across the entire period from 1978 to 2007 There was a significant increase in the
mean pH of humus mineral soils (0-15 cm) between 1978 and 1998 and this largely accounted for the
significant increase in mean soil pH between 1978 and 2007
Table 37 Changes in mean soil pH (0-15 cm) across Wales for a) Broad Habitats b) Aggregate
Vegetation Classes (AVC) c) AVCs unchanged since 1978 and d) LOI categories Arrows denote a
significant change (plt005) in the direction shown Diagonal line indicates too few samples to provide
reliable value
a) Wales - Broad Habitat
Broad Habitat 1978 1998 2007 1978-1998 1998-2007 1978-2007
Broadleaved Mixed and Yew Woodland 453 524 540
Coniferous Woodland 373 422 414
Arable and Horticulture 500 648
Improved Grassland 536 574 594
Neutral Grassland 506 585 582
Acid Grassland 434 441 474
Bracken
Dwarf Shrub Heath 413 453 440
Fen Marsh and Swamp
Bog
All habitat types 500 543 556
Mean pH Direction of significant changes
b) Wales - AVC whole dataset
Aggregate Vegetation Class 1978 1998 2007 1978-1998 1998-2007 1978-2007
Upland Woodland 441
Lowland woodland
Fertile grassland 585 608 608
Infertile grassland 507 554 590
Moorland grass mosaics 464
Heath and Bog 429
Tall grass and Herb
Crops and weeds
Mean pH Direction of significant changes
65
Countryside Survey Soils Report from 2007
3 Soil pH
34 Discussion and Policy Implications
Soils (0-15 cm) in Great Britain and regionally within individual countries covered a wide range of pH in 2007
from a minimum of pH 32 to a maximum of pH 915 Organic soils were consistently the most acid whilst the
highest pH values were encountered in mineral soils which also showed the widest range in soil pH The
least acidic soils with a mean pH in excess of 6 were generally found in moderate to intensively managed
agricultural land such as Arable and Improved Grassland Broad Habitats and Fertile Grassland and Crops
and Weeds AVCs Acidic soils with a mean pH less than 5 were associated with Coniferous Woodland Acid
Grassland Dwarf Shrub Heath and Bog Broad Habitats and the Upland Woodland Moorland Grass Mosaic
and Heath and Bog AVCs These generally had organic -rich soils whereas managed agricultural land was
associated with soils with a low organic matter content (Chapter 2)
The mapped distribution of soil pH in 2007 (Fig 311) followed the anticipated pattern with lower pH soils in
the upland areas of Wales Pennines and much of Scotland The coefficient of variation (CV standard
deviation mean an indicator of the spread of the data around the mean value) was lowest in areas
dominated by either high pH soils which are intensively managed or low pH soils in upland areas where there
is little variation Conversely the signal to noise ratio (SN R mean standard deviation) indicated that for
values above 1 the signal was stronger than the noise High SNRs were observed across managed arable
areas in eastern England and agricultural land in southern central England This may occur because soil
management leads to greater uniformity of pH values across these areas High SNRs in the uplands reflect
the presence of acidic peaty and peaty mineral soils in Acid Grassland Dwarf Shrub Heath Bog and
Coniferous Woodland Broad Habitats For England and Wales the broad patterns in the soil pH data (Fig
311) correspond well to maps originating from the National Soil Inventory dataset (NSI McGrath and
Loveland 1992) and the Representative Soil Sampling Scheme (RSSS Baxter et al 2006) although the
latter are restricted to managed agricultural land
d) Wales - Loss on ignition category
LOI category () 1978 1998 2007 1978-1998 1998-2007 1978-2007
Mineral (0-8) 554 588 613
Humus-mineral (8-30) 487 547 555
Organo-mineral (30-60)
Organic (60-100)
Mean pH Direction of significant changes
Aggregate Vegetation Class 1978 1998 2007 1978-1998 1998-2007 1978-2007
Upland Woodland
Lowland woodland
Fertile grassland
Infertile grassland 505 550 609
Moorland grass mosaic
Heath and Bog
Tall grass and Herb
Crops and weeds
c) Wales - AVC unchanged
Mean pH Direction of significant changes
66
Countryside Survey Soils Report from 2007
3 Soil pH
Figure 311 Maps of soil (0-15 cm) pH in 2007 (a) using ordinary Kriging (pH units) (b) coefficient of variation
and (c) signal to noise ratio
Across Great Britain and regionally within the individual countries soils (0 -15 cm) showed evidence of
increasing pH (decreasing acidity) between 1978 and 2007 This is consistent with a response to a reduction
in acid deposition over the last 29 years (NEGTAP 2001 RoTAP 2010) For the more organic -rich soils and
their associated Broad Habitats and AVCs the significant increase in mean pH between 1978 and 2007 was
largely accounted for by the increase between 1978 and 1998 General ly there was no significant pH change
recorded between 1998 and 2007 for organic-rich soils (gt30 LOI) In contrast for mineral and humus-
mineral soils and associated Broad Habitats and AVCs significant increases in soil pH were often observed
between each Survey as well as across the entire period from 1978 to 2007 This was a consistent pattern for
plots with unchanged AVC classification in the different surveys indicating land use change was not
responsible for the trends observed However land managem ent within squares such as changes in rates of
lime and fertiliser applications or stocking densities may play an important role which is currently being
investigated
When comparing changes in pH between different soil types Broad Habitats or AVCs it must be remembered
that pH is a logarithmic scale An equal rate of recovery in terms of pH units would not be expected for a
low pH and a high pH soil Conversion of pH data to hydrogen ion concentrations reveals that annual rates of
change in hydrogen ion concentration for high pH low organic matter soils has been sustained across the 29
year period The large annual rate of change between 1978 and 1998 for more organic -rich low pH soils
slowed dramatically between 1998 and 2007 The different trends observed for mineral and organic soils
may indicate that the soil response to reducing mineral acid inputs from the atmosphere is influenced by soil
organic matter content possibly as a result of buffering by organic acids As the concentration of mineral
a)
)
b)
)
c)
)
67
Countryside Survey Soils Report from 2007
3 Soil pH
acids in the soil declines and soil solution pH rises organic acids will come into solution and de -protonate
providing a buffering mechanism to further pH change In addition organic -rich soils are broadly located in
the north and west of the British Is les where initial pollution levels were lowest and reductions in acid
deposition have been smaller than anticipated given the size of the emission reductions and less than in
regions such as central England which are closer to the main emission sources ( Fig 312 NEGTAP 2001
RoTAP 2010)
Figure 312 a) The regional grouping of sites in the UK precipitation chemistry network used in the statistical
analysis of trends B) Trends in SO2 over the last 20 years in the four groups of monitoring stations
a) b)
Identifying the relative influence of these factors is important to assessing the ldquosuccessrdquo of emission control
policy for acid deposition and will be the subject of further analysis Thus in semi -natural systems on the
more organic-rich soils the implications for biodiversity and metal mobilisation are not clear until further
analysis determines the cause of the lack of change in soil pH Current risk assessment tools using the
critical load methodology indicate the majority of these systems remain at risk from acidic deposition and
thus the lack of further increases in soil pH needs to be investigated closely (RoTAP 2010) One possibility
is the variability in initial acidic deposition inputs and subsequent tre nds (Fig 312)
The significant increase in mean soil pH between 1978 and 2007 observed for managed agricultural land will
be influenced by farming practice such as moves towards deeper cultivation bringing relatively unweathered
chalk parent material to the soil surface In England many areas of arable and arable ley or short term
grassland are located in areas close to emission sources and will have experienced relatively large
reductions in acid deposition loading especially from dry deposition of S O2 (NEGTAP 2001) compared to
areas further west where wet deposition dominates inputs
Group=4
Group=3
Group=2
Group=1
Years since 1986
25
30
0
10 5
10
20
15 0
15
-5
5
20
SO2 concentration (microgm-3)
68
Countryside Survey Soils Report from 2007
3 Soil pH
The influence of agricultural management is difficult to separate from external factors and the evidence from
other soil surveys is contradictory The RSSS (Skinner et al 1992) is exclusively focussed on soils under
agricultural management Re-analysis of the RSSS data (Oliver et al 2006) showed that the temporal
change in agricultural soil pH was small between 1971 and 2001 Spatial disaggregation of the RSSS dat a
indicated that soil pH declined in areas of permanent grassland such as the west of England and Wales
possibly because farmers did not maintain lime inputs following the loss of subsidy in 1976 (Skinner and
Todd 1998 Baxter et al 2006) The RSSS data also showed that soil pH had changed little over time in
arable and arable ley systems with the interpretation that arable farmers have maintained optimal pH levels
for crop production (Oliver et al 2006) Selective re-sampling of arable arable-ley and permanent
(managed) grassland sites of the National Soil Inventory showed an increase in soil pH of between 01 and
03 pH units between the early 1980s and 199596 (Defra 2003) The NSI data corroborate the results from
Countryside Survey for England and Wales between 1978 and 1998 mean pH values for equivalent land use
types are also similar Currently there are no other published national -scale datasets to provide evidence of
pH change in agricultural soils between 1998 and 2007
The soil pH data show an increase over time in the frequency of pH values in excess of pH 85 In 2007
approximately two thirds of the 54 plots with pH gt 85 were in the Arable Broad Habitat with values
approaching pH 9 in some plots Soil pH values in excess of 83 indicat e that calcium carbonate solubility is
no longer controlling soil pH and there is an influence from sodium salts accumulating in the soil Two of the
sample points with the highest pH values are very close to the coast and are mapped as Littoral Sediment o r
Supra-littoral Sediment Broad Habitats where sodium will be abundant Several sample sites are located in
the fens of East Anglia and again there may be abundant sodium in these soils The remaining sites are
further west in Oxfordshire and may be influenced by irrigation which can lead to sodium accumulation in the
soil
Across Great Britain and within individual countries Coniferous Woodland was consistently amongst the most
acidic of the Broad Habitats and showed no significant temporal changes in m ean soil pH Whilst sample
numbers were relatively low in England and Wales (c40) Broad Habitats with fewer samples have shown
significant pH increases and samples numbers in Scotland (125) and across Great Britain as a whole (207)
were easily sufficient to detect change The implication from Countryside Survey is that soils beneath
Coniferous Woodlands are either responding very slowly to changes in acid deposition or other factors such
as accumulation of acidic organic matter are controlling soil pH in these systems Large areas of conifer
forest are located at relatively high altitude in the north and west of Britain where annual rainfall is high wet
deposition enhanced by seeder-feeder effects dominates atmospheric inputs (Dore et al 1992) and forest
canopies are frequently enveloped in cloud which even now can contain high concentrations of atmospheric
pollutants Given this environment and the ability of conifer canopies to efficiently scavenge air pollutants
from the atmosphere (Fowler et al 1989) the positive effects of emission reductions may be attenuated in
Coniferous Woodland There is also a known interaction between forest age or maturity and atmospheric
nitrogen deposition which can potentially acidify forest soils through ldquonitrogen sa turationrdquo (Emmett et al
2003 Emmett and Reynolds 1996) Atmospheric nitrogen deposition has changed little over the past 29
years whilst conifer plantations have grown older as trees planted in the 1960s reach maturity The ongoing
effects of nitrogen deposition may therefore offset the benefits of lower sulphur deposition Aside from
external influences the build up of acidic forest floor and accumulation of base cations into standing
biomass especially in those areas with a naturally ldquoacidicrdquo geolog y and soils may also be contributing to the
sustained acidity of surface soils in Coniferous Woodland The policy consequences of these results are
more likely to affect the aquatic rather than the terrestrial environment In Wales for example surface w ater
acidification in afforested headwater catchments and the persistence of acid episodes has already been
identified as a significant threat to achieving compliance to the Water Framework Directive in some upland
water bodies
69
Countryside Survey Soils Report from 2007
3 Soil pH
341 Policy implications
The increased soil pH observed for the more mineral soils is consistent with the expected benefit of
continued reductions in sulphur emissions Data analysis is ongoing to determine if other drivers of change
such as nitrogen deposition or land management is slowing recovery in the organic soils where pH did not
significantly increase between 1998 and 2007 Conversion from one land use to another does not seem to be
an important factor Land management may be affecting soil pH in more intensively managed agricultural
land and further work is required to separate this influence from the response to reduced acid and nitrogen
deposition The implications of these findings are that current emission control policies combined with current
policies to protect soil through sustainable land management practices may not currently be sufficient to
promote continued recovery from acidification in organic -rich soils
35 References
Allen SE (ed) 1989 Chemical analysis of ecological materials Blackwell Scientific Publications Oxford
368 pp
Avery BW Bascomb CL 1974 Soil Survey Laboratory Methods Soil Survey Technical Monograph No 6
Harpenden
Baxter SJ Oliver MA Archer JR 2006 The Representative Soil Sampling Scheme of England and
Wales the spatial variation of topsoil nutrient status and pH between 1971 and 2001 Soil Use and
Management 22 383-392
Black HIJ Garnet JS Ainsworth G Coward PA Creamer R Ellwood S Horne J Hornung M
Kennedy VH Monson F Raine L Osborn D Parekh NR Parrington J Poskitt JM Potter E
Reeves N Rowland AP Self P Turner S Watkins J Woods C Wright J 2000 MASQ Monitoring
and Assessing Soil Quality in Great Britain Countryside Survey Module 6 Soils and Pollution RampD
Technical Report E1-063TR Environment Agency Bristol
Carey PD Wallis S Chamberlain PM Cooper A Emmett BA Maskell LC McCann T Murphy J
Norton LR Reynolds B Scott WA Simpson IC Smart SM Ullyett JM 2008 Countryside Survey
UK Results from 2007 NERCCentre for Ecology amp Hydrology 105pp (CEH Project Number C03259)
Countryside Survey 2009 England Results from 2007 (published September 2009) NERCCentre for Ecology
amp Hydrology Department for Environment Food and Rural Affairs Natural England 119pp (CEH Project
Number C03259)
Defra 2003 Comparability of soil properties derived from different data sources Report by National Soil
Resources Institute Defra Project SP0515
Dore AJ Choularton TW Fowler D 1992 An improved wet deposition map of the United Kingdom
incorporating the seeder-feeder effect over mountainous terrrain Atmospheric Environment 26 1375-1381
Emmett BA Frogbrook ZL Chamberlain PM Griffiths R Pickup R Poskitt J Reynolds B Rowe
E Spurgeon D Rowland P Wilson J and Wood CM 2008 CS Technical Report No 307 Soils
Manual NERCCentre for Ecology amp Hydrology 180 pp (CEH Project Number C03259)
Emmett BA Reynolds B Stevens PA Norris DA Hughes S Gorres J Lubrecht I 1993 Nitrate
leaching from afforested Welsh catchments - interactions between stand age and nitrogen deposition Ambio
22 386-394
70
Countryside Survey Soils Report from 2007
3 Soil pH
Emmett BA Reynolds B 1996 Nitrogen critical loads for spruce plantations in Wales is there too much
nitrogen Forestry 69 205-214
Fowler D Cape JN and Unsworth MH 1989 Deposition of atmospheric pollutants on forests
Philosophical Transactions of the Royal Society B 324 247-265
Fowler D Coyle M Apsimon HM Ashmore MR Bareham SA Battarbee RW Derwent RG
Erisman JW Goodwin J Grennfelt P Hornung M Irwin J Jenkins A Metcalfe SE Ormerod SJ
Reynolds B Woodin S 2001 Transboundary Air pollution Acidification Eutrophication and Ground -Level
Ozone in the UK NEGTAP 2001 314pp DEFRA Contract No EPG 13153
Haines-Young RH Barr CJ Black HIJ Briggs DL Bunce RGH Clarke RT Cooper A Dawson
FH Firbank LG Fuller RM Furse MT Gillespie MK Hill R Hornung M Howard DC McCann
T Morecroft MD Petit S Sier ARJ Smart SM Smith GM Stott AP Stuart RC and Watkins
JW 2000 Accounting for nature assessing habitats in the UK countryside Centre for Ecology and
Hydrology Department of the Environment Transport and the Regions 134 pp
McGrath SP Loveland PJ 1992 The Soil Geochemical Atlas of England and Wales Blackie Academ ic
and Professional
NEGTAP 2001 Transboundary Air Pollution Acidification Eutrophication and Ground -Level Ozone in the
UK Prepared by the National Expert Group on Transboundary Air Pollution on behalf of the UK Department
for Environment Food and Rural Affairs (DEFRA) and the Devolved Administrations 314 pp
Norton LR Murphy J Reynolds B Marks S Mackey EC 2009 Countryside Survey Scotland Results
from 2007 NERCCentre for Ecology amp Hydrology The Scottish Government Scottish Natural Heritage
83pp (CEH Project Number C03259)
Oliver MA Archer JR Baxter SJ Todd AD Skinner RJ 2006 The Representative Soil Sampling
Scheme of England and Wales a statistical analysis of topsoil nutrient status and pH between 197 1 and
2001 Soil Use and Management 22 372-382
RoTAP 2010 Review of Transboundary Air Pollution Acidification Eutrophication Ground Level Ozone and
Heavy Metals in the UK Defra
Schofield RK Taylor AW1955 The measurement of soil pH Soil Science Society of America Journal 19
164-167
Skinner RJ Todd AD 1998 Twenty-five years of monitoring pH and nutrient status of soils in Enlgand and
Wales Soil Use and Management 14 162-169
Skinner RJ Church BM Kershaw CD 1992 Recent trends in soil pH and nutrient status in England and
Wales Soil Use and Management 8 16-20
Smart SM Allen D Murphy J Carey PD Emmett BA Reynolds B Simpson IC Evans RA
Skates J Scott WA Maskell LC Norton LR Rossall MJ Wood C 2009 Countryside Survey Wales
Results from 2007 NERCCentre for Ecology amp Hydrology Welsh Assembly Government Countryside
Council for Wales 94pp (CEH Project Number C03259)
White RE 1969 On the measurement of so il pH Journal of the Australian Institute of Agricultural Science
35 3-14
71
Countryside Survey Soils Report from 2007
4 Total nitrogen and CN
Summary
There were small but significant decreases in mean soil (0-15 cm) total nitrogen concentration
between 1998 and 2007 in many Broad Habitats and Aggregate Vegetation Classes across Great
Britain and the individual countries no reporting category recorded an increase in mean soil (0 -15
cm) total nitrogen concentration
For semi-natural and woodland soils continued input of nitrogen deposition at 20-30 kgNhayr for
many parts of Great Britain has not caused the expected average increase of 3 -4 in this basic soil
property Instead the decreases observed combined with a trend for an increase in total carbon to
nitrogen ratio suggest there may be increased nitrogen loss or uptake possibly combined with a
trend for increased carbon density as reported for some soils in Chapter 2 The effects of one or
both of these processes would be to effectively bdquodilute‟ the soil (0 -15cm) nitrogen concentration
signal Both processes (increased nitrogen loss and increased carbon fixation by plants leading to
storage in soil) are known possible consequences of nitrogen enrichment which can result in
vegetation composition change and thus this parameter may not be a sensitive indicator of
eutrophication from atmospheric nitrogen deposition
There was no change or a small significant decline in mean soil total nitrogen concentrations in
improved and fertile grassland categories between 1998 and 2007 across Great Britain and within
individual countries despite major reductions in fertiliser use As there is no change in the soil (0 -
15cm) total carbon to nitrogen ratio this indicates farmers have maintained soil nitrogen status in
managed grassland systems despite a reduction in mineral fertiliser use possibly due to use of
alternative organic sources of nitrogen such as slurry and organic waste products
In cropland systems a significant decline in soil (0-15cm) total nitrogen concentrations and total
carbon to nitrogen ratios was observed between 1998 and 2007 for Great Britain and England A
significant decline in soil (0-15cm) total carbon concentrations was also reported (Chapter 2) As
there is only a small decline in fertiliser use in these systems and there is evidence of combined
carbon and nitrogen loss deep ploughing erosion or increased decomposition rates may be the
most likely explanation of this trend
41 Introduction
Key question Can the trend of eutrophication of the countryside be detected in the soil as well as the
vegetation using this basic soil property
Measurements Repeat measurement of soil (0-15 cm) total nitrogen concentration measured in all plots
sampled in 1998
Soil total nitrogen concentration (hereafter called soil N concentration) and stock are basic fundame ntal
measurements of soil fertility They are relatively insensitive to short -term changes but over a longer time
period give an overall indication of trends in soil fertility and changes in nutrient status in relation to other
parameters such as carbon (C) Changes in plant species composition were observed following the
Countryside Survey (CS) in 1998 (Haines-Young 2000) and these were ascribed to ecosystem eutrophication
following enhanced deposition of atmospheric N compounds
In response to the key question soil N concentration data can be used to provide
72
Countryside Survey Soils Report from 2007
4 Total Nitrogen and CN
National and country-level assessments of soil N concentration and change in soil N concentration
since 1998
Attribution of change in and form of soil N in response to pressures and drivers
Attribution of change in plant species composition in relation to internal N status versus
atmospheric N deposition
Assessment of soil N in relation to changes in soil C status
The deliverables for total soil (0-15 cm) N from CS in 2007 will be
National and country-level assessments of status and change in soil (0-15 cm) total N concentration
and stock since 1998
Assessment of soil N in relation to changes in soil C status
411 Rationale for measurement
The rationale for the measurement of soil total N concentration and stock is given in Table 41 Total N has
not been measured in surveys of soil quality in England and Wales apart from forest and woodland systems
in the BIOSOIL and British Woodland Survey It is a parameter within the National Soil In ventory for Scotland
(NSIS) and is included in the soil measurements at Environmental Change Network sites
Table 41 Total N rationale for measurement
Facts Comments History in CS Total N measured in CS
in 1998
Maintain time series Enables stock and change
Links and compatibility to other monitoring programmes
Not measured in NSI
Total N has been measured in the NSIS (Scotland) BIOSOIL and the British Woodland Survey
Uniqueness of CS No other known national datasets
Only integrated sample which can be linked to vegetation and land management
Value for money (Policy priority or interpretative value x cost)
High High policy and interpretative value low cost
42 Methods
The soil used for total N analysis was taken from the bdquoBlack core‟ and there were no specific sampling
requirements beyond those normally employed for collecting these samples (See Emmett et al 2008 Annex
1)
One thousand and twenty four samples were analysed at CEH Lancaster for total N in 2007 using the UKAS
accredited method SOP3102 Samples were analysed using an Elementar Vario -EL elemental analyser
(Elementaranalysensysteme GmbH Hanau Germany) The Vario EL is a fully automated analytical
instrument working on the principle of oxidative combustion followed by thermal conductivity detection
Following combustion in the presence of excess oxygen the oxides of N and C flow through a reduction
column which removes excess oxygen C is trapped on a column whilst N is carried to a detector C is then
73
Countryside Survey Soils Report from 2007
4 Total nitrogen and CN
released from the trap and detected separately Sample weights are usually 15 mg for peat and 15 -60 mg for
mineral soil samples
The concentration of total N is expressed in dry weight of soil which is abbreviated in the text to N
To calculate topsoil total N density a measurement of N content per unit volume is needed Combining bulk
density measurements reported in Chapter 1 for the 2007 samples with soil N concentration values result in
estimates of topsoil (0-15 cm) N density on an area basis expressed in units of tha
421 Quality Assurance and Quality Control
The DefraNERCBBSRC Joint Codes of Practice were followed
Due to the fully automated nature of the instrument calibration was performed infrequently with daily runs
being factorised to the instrument calibration through the use of a certified standard (acetanilide) Quality
control was achieved by using two in-house reference materials analysed with each batch of samples and by
the analysis of duplicate samples
Results of the analysis of standard reference materials (SRM) SR3 and SR8 which cover a range of soil N
concentration values are shown using Shewhart charts (Fig 41a and Fig 41b) The same standards were
used in the sample batches from 1998 and 2007 and the relative performance of the a nalysis can be
compared
Figure 41 Shewhart QC charts for total N analysis () of standard reference materials a) SR3 and b) SR8
a) SR3 - QC ChartMean = 065 limits +- 2 SD of mean
050
055
060
065
070
075
0 50 100 150 200 250
Arbitrary sample no
N
1998 2007 Mean Upper limit Lower limit
b) SR8 - QC ChartMean = 030 limits +- 2 SD of mean
025
028
030
033
035
0 20 40 60 80 100 120 140 160 180 200
Arbitrary sample no
N
1998 2007 Mean Upper limit Lower limit ISO median
74
Countryside Survey Soils Report from 2007
4 Total Nitrogen and CN
The Quality Control charts provide evidence of acceptable results for the analyses under taken in 1998 for
both SRMs More points fall outside the 2SD limit for both SRMs in 2007 For SR3 there is an upward trend
in the results whereas a downward trend is suggested for SR8 with values falling closer to the ISO median
value of 029 N Taken overall the values for the repeated SRM analyses fall within acceptable Quality
Control limits and there is no evidence to indicate a consistent bias in the results
422 Reporting
Soil N concentration data (0-15 cm) have been analysed to provide information on the state of soil N
concentration in 2007 and the change since 1998 The statistical approach used for analysing the data for
change involved bootstrapping which allows for non-normality in the data without the necessity of knowing
details of the actual distribution As such it provides a more accurate measurement of significance Annex F
of Emmett et al (2008) provides a background document describing this approach
The data in this report describe mean soil N concentrations in soils (0-15 cm) in 2007 and change since 1998
by Broad Habitat Aggregate Vegetation Class (AVC) and Loss-on-Ignition (LOI) category for Great Britain
(GB) and for the individual countries In summary these are defined as
Broad Habitat - The Broad Habitat classification consists of 27 habitats which account for the entire
land surface of Great Britain and the surrounding sea Countryside Survey reports on soils for 10
major terrestrial habitats
Aggregate Vegetation Class (AVC) ndash is a high level grouping of vegetation types produced from a
quantitative hierarchical classification of the different plant species found in the original Countryside
Survey sample plots Loss on ignition (LOI) category ndash soil type based on soil organic matter content defined as mineral (0 -
8 LOI 0-44 g C kg-1
) humus-mineral (8 ndash 30 LOI 44-165 g C kg-1
) organo-mineral (30 ndash 60
LOI 165-330 g C kg-1
) and organic (60 ndash 100 gt 330 g C kg-1
)
To remove the effects of large-scale vegetation and or land use change mean soil N concentrations have
also been estimated for plots where the AVC has not changed over time The AVC is only known for the
survey years and may change during intervening periods for example due to arable -grassland rotation The
plots where the AVC has not changed can therefore be regarded as plots where the vegetation has been
largely consistent in 1978 1998 and 2007
Soil (0-15 cm) total N density (tha) has been estimated for 2007 using the total N concentration and the bulk
density data These values are reported using the same categories for GB and individual countries Total N
density has not been estimated for AVC unchanged as change in density cannot be reported
43 Results
431 Structure of the total nitrogen concentration data
Total N concentration was measured in samples from 1024 plots in 2007 and from 1110 plots in 1998 75 of
plots sampled in 2007 had also been sampled in 1998 Concentrations of total N measured in soils (0-15 cm)
in 2007 ranged between 004 and 277N compared to a range of values betw een 008 and 322 N in 1998
The common practice in agricultural soils to determine N on a volume basis (mglitre) makes comparison
difficult particularly when combined with different depth of 0 -75cm compared to 0-15cm in CS for grassland
soils although ranges for CS soils seem broadly comparable
75
Countryside Survey Soils Report from 2007
4 Total nitrogen and CN
Between 1998 and 2007 the proportion of samples with a total N concentration of 1N or less increased
from 71 to 80 whilst the proportion of samples with greater than 2N decreased from 9 to 54
Overall there was evidence of a downward shift in total N concentrations across the entire range of values
between 1998 and 2007 (Fig 42) The populations in 1998 and 2007 were skewed and slightly bimodal
Figure 42 Distribution of soil (0-15cm) N concentrations a) Histogram for 1998 and 2007 b) Cumulative
frequency for 1998 and 2007 Histogram frequencies normalised to percentage of total number of samples
analysed in each survey
Soil N concentration was strongly and positively correlated to loss on ignition (r2 = 089) although there was
more scatter in both datasets at higher values of LOI and total N (Fig 43a) Total N concentration decreased
with increasing bulk density in a logarithmic relationship (r2 = 079 Fig 43b) and together the results show
not unexpectedly that peaty soils with low bulk density contain the highest concentrations of N Below pH
55 soil N concentrations varied across the full range of values measured (04 to 28N) whilst abov e pH 6
the majority of samples contained between 01 and 06 N (Fig 43c) There was no clear relationship
0
3
6
9
12
15
18
01 05 09 13 17 21 25 29 33
Total N ( dry wt of soil)
Fre
qu
en
cy
1998 2007
a)
0
20
40
60
80
100
0 1 2 3 4
Total N ( dry wt of soil)
Cu
mu
lati
ve
fre
qu
en
cy
1998 2007
b)
76
Countryside Survey Soils Report from 2007
4 Total Nitrogen and CN
between total N concentration and Olsen-P (Fig 43d) A wide range of total N values were encountered at
Olsen-P concentrations below 50 mgP kg-1
although samples with very high Olsen-P values in excess of
150 mgP kg-1
generally had low total N concentrations (lt05 N)
Figure 43 Relationships between soil N concentration in 2007 and a) Loss-on-ignition b) bulk density c) soil
pH and d) Olsen-P concentration
Figure 44 Plots of soil N concentration change between 1998 and 2007 (Delta soil N concentration) and 2007
values for a) Loss-on-ignition b) bulk density c) soil pH and d) Olsen-P concentration
-3
-2
-1
0
1
2
3
0 20 40 60 80 100 120
2007 LOI ( dry wt soil)
Delt
a
N
a)
-3
-2
-1
0
1
2
3
0 05 1 15 2
2007 Bulk density (gcm3)
Delt
a
N
b)
-3
-2
-1
0
1
2
3
3 4 5 6 7 8 9
2007 pH
Delt
a
N
c)
-3
-2
-1
0
1
2
3
0 50 100 150 200 250
2007 Olsen-P (mgPkg)
Delt
a
N
d)
0
1
2
3
0 100 200 300 400
Olsen P (mgkg)
To
tal
N (
d
ry w
t s
oil
) d)
0
1
2
3
3 5 7 9
pH
To
tal
N (
d
ry w
t s
oil
)
c)
y = -06385Ln(x) + 03753
R2 = 07927
0
1
2
3
0 05 1 15 2
Bulk density (gcm3)
To
tal
N (
d
ry w
t s
oil
) b)y = 00758x
07302
R2 = 0891
0
1
2
3
0 20 40 60 80 100
LOI ( dry wt soil)
To
tal
N (
d
ry w
t s
oil
) a)
77
Countryside Survey Soils Report from 2007
4 Total nitrogen and CN
Changes in soil N concentration between 1998 and 2007 occurred across the full range of LOI
concentrations (Fig 44a) whereas large changes were more prevalent in soils with a bulk density below asymp07
gcm3 and pH less than 55 (Figs 44b and 44c) Soils with relatively low Olsen-P concentrations (lt20 mgP
kg-1
) showed the largest decrease in total N concentration (Fig 44d) with decreases of up to 2N
432 Change in mean total nitrogen concentration in soils (0-15 cm) across Great
Britain
There was a significant approximately 10 decrease in soil (0-15 cm) N concentration between 1998 and
2007 across GB as a whole (Table 42) This was reflected in many Broad Habitats The magnitude of
change varied between Broad Habitats with the smallest significant decrease (7 ) measured in Arable which
also had the lowest soil N concentrations in 1998 (027 N) and 2007 (025 N) The biggest percentage
decrease between the surveys (21) occurred in Coniferous Woodland The highest soil N concentrations in
both surveys were measured in soils in the Bog Broad Habitat (178 N in 1998 and 159 N in 2007) The
soil N concentration in soils (0-15 cm) beneath Broadleaved Woodland Improved Grassland Bracken and
Fen Marsh and Swamp did not change significantly between 1998 and 2007
The largest total N density (60 tha) was measured in Improved Grassland reflecting the intermediate mean
N concentration and relatively high bulk density Despite having the highest mean total N concentration soils
in the Bog and Coniferous Woodland had the lowest N densities (38 tha) due to the low bulk density values
in these Broad Habitats
There was a significant decrease in soil N concentration in all AVCs except Lowland Woodland Tall Grass
and Herb and Crops and Weeds between 1998 and 2007 (Table 42b) The lowest soil N concentrations were
observed in Crops and Weeds in 1998 (026 N) and 2007 (025 N) whilst Heath and Bog AVC had the
highest mean values in 1998 (17 N) and 2007 (147 N) The soil N concentrations in soils (0-15 cm) for
plots in which the AVC did not change (Table 42c) were broadly consistent with the dataset as a whole
(Table 42b) Significant changes were only observed in Heath and Bog and Infertile Grassland for the
unchanged dataset This suggests that some of the significant change in soil N concentrations observed in
the dataset as a whole may have arisen because of a change in land use between the surveys
Heath and Bog AVC had the lowest total N density in 2007 (38 tha) and Fertile Grassland the highest (59
tha) These values compare closely with values measured in Bog and Improved Grassland Broad Habitats
respectively
Soil N concentrations decreased significantly across all LOI categories (Table 42d Fig 45) with the
largest change observed in organo-mineral soils where mean total N in soils (0-15 cm) declined by more than
20 In both surveys the highest soil N concentrations were observed in organic soils which accounted for
the high concentrations measured in Broad Habitats and AVCs with organic -rich soils (Dwarf Shrub Heath
and Bog Broad Habitats Moorland Grass Mosaic and Heath and Bog AVCs) Organic soils had the lowest
total N density (38 tha) while the highest density was observed in humus -mineral soils (60 tha)
The soil N concentration data were combined with C data to calculate changes in soil CN ratio (0-15cm) The
CN variable provides information on the relative change in C and N storage in soils The general trend
across all Broad Habitats is for no change or an increase in CN rat io (Table 43)
78
Countryside Survey Soils Report from 2007
4 Total Nitrogen and CN
Table 42 Change between 1998 and 2007 in N concentration of soils (0-15 cm) and total N density of soils (0-15
cm) in 2007 for GB for a) Broad Habitats b) Aggregate Vegetation Classes (AVC) c) AVCs unchanged since 1978
and d) LOI categories Arrows denote a significant change (plt005) in the direction shown Diagonal line
indicates too few samples to provide reliable value
a) Great Britain ndash Broad Habitat
Broad Habitats Mean Total Nitrogen ( dry wt soil)
Direction of
significant changes
Total Nitrogen
density (tha)
1998 2007 1998 - 2007 2007
Broadleaved Mixed and
Yew Woodland
070 065 51
Coniferous Woodland 112 088 38
Arable and Horticulture 027 025 43
Improved Grassland 047 045 60
Neutral Grassland 052 047 56
Acid Grassland 149 123 51
Bracken 084 095
Dwarf Shrub Heath 131 114 47
Fen Marsh and Swamp 122 108 48
Bog 178 159 38
All Habitat Types 079 071 49
b) Great Britain ndash AVC whole dataset
Aggregate Vegetation
Class
Mean Total Nitrogen ( dry wt soil) Direction of
significant changes
Total Nitrogen
density (tha)
1998 2007 1998 - 2007 2007
Upland Woodland 091 073 40
Lowland Woodland 060 058 51
Fertile Grassland 044 041 59
Infertile Grassland 057 052 58
Moorland Grass Mosaic 128 113 48
Heath and Bog 170 147 38
Tall Grass and Herb 036 036 48
Crops and Weeds 026 025 43
c) Great Britain ndash AVC unchanged
Aggregate Vegetation
Class
Mean Total Nitrogen ( dry wt soil) Direction of
significant changes
Total Nitrogen
density (tha)
1998 2007 1998 - 2007 2007
Upland Woodland 090 072
Lowland Woodland 065 067
Fertile Grassland 047 044
Infertile Grassland 059 053
Moorland Grass Mosaic 138 124
Heath and Bog 170 151
Tall Grass and Herb 032 032
Crops and Weeds 025 024
79
Countryside Survey Soils Report from 2007
4 Total nitrogen and CN
d) Great Britain ndash Loss on Ignition category
LOI category () Mean Total Nitrogen ( dry wt soil)
Direction of
significant changes
Total Nitrogen
density (tha)
1998 2007 1998 - 2007 2007
Mineral (0-8) 029 027 44
Humus-mineral (8-30) 060 056 60
Organo-mineral (30-60) 146 114 51
Organic (60-100) 191 180 38
Figure 45 Change in soil (0-15 cm) N concentration across LOI categories in Great Britain between 1998 and
2007 Significant changes are shown as plt0001 plt001 plt005 95 CI are shown for each bar
-06
-05
-04
-03
-02
-01
0
Mineral Humus-mineral Organo-mineral Organic
Soil LOI categories
Dif
fere
nce
1998-2
007
(
N)
80
Countryside Survey Soils Report from 2007
4 Total Nitrogen and CN
Table 43 Change in CN ratio of soils (0-15 cm) across Great Britain for a) Broad Habitats b) Aggregate
Vegetation Classes (AVC) c) AVCs unchanged since 1978 and d) LOI categories Arrows denote a significant
change (plt005) in the direction shown
a) Great Britain ndash Broad Habitat
Broad Habitats Mean CN ratio
Direction of
significant changes
1998 2007 1998 - 2007
Broadleaved Mixed and
Yew Woodland
140 142
Coniferous Woodland 201 215
Arable and Horticulture 117 113
Improved Grassland 118 120
Neutral Grassland 123 127
Acid Grassland 177 182
Bracken 152 165
Dwarf Shrub Heath 229 231
Fen Marsh and Swamp 164 177
Bog 262 282
All Habitat Types 156 160
b) Great Britain ndash AVC whole dataset
Aggregate Vegetation
Class
Mean CN ratio Direction of
significant changes
1998 2007 1998 - 2007
Upland Woodland 179 193
Lowland Woodland 134 142
Fertile Grassland 117 121
Infertile Grassland 124 130
Moorland Grass Mosaic 189 196
Heath and Bog 260 268
Tall Grass and Herb 117 118
Crops and Weeds 118 113
c) Great Britain ndash AVC unchanged
Aggregate Vegetation
Class
Mean CN ratio Direction of
significant changes
1998 2007 1998 - 2007
Upland Woodland 171 183
Lowland Woodland 140 150
Fertile Grassland 117 122
Infertile Grassland 124 130
Moorland Grass Mosaic 190 199
Heath and Bog 273 294
Tall Grass and Herb 115 120
Crops and Weeds 117 112
81
Countryside Survey Soils Report from 2007
4 Total nitrogen and CN
d) Great Britain ndash Loss on Ignition category
LOI category () Mean CN ratio
Direction of
significant changes
1998 2007 1998 - 2007
Mineral (0-8) 117 116
Humus-mineral (8-30) 134 142
Organo-mineral (30-60) 194 204
Organic (60-100) 266 278
433 Change in mean total nitrogen concentration in soils (0-15 cm) across England
Total N concentration was measured only on the Main Plots within the original 256 squares sampled in 1978
giving a maximum potential sample number of 1281 of which 1024 were sampled in 2007 and 1110 in 1998
For this reason sample numbers decline rapidly in country-level data analysis A minimum cut-off of 20
samples was applied for country-level analysis of total N concentration by Broad Habitat AVC and LOI
Category As a result there are several gaps in the results Missing data are denoted by a horizontal line
across the cell in the table
There was a relatively small (115) but significant decrease in soil N concentration across the All Broad
Habitats category in England between 1998 and 2007 (Table 44a) Arable soils (0-15 cm) contained the
lowest soil N concentrations in England in 1998 (027 N) and 2007 (025 N) and there was a small (7)
but significant decrease between the two surveys Soil N concentrations in soils (0-15 cm) beneath Improved
Grassland and Neutral Grassland in England were very similar in 2007 ( asymp 048 N) and a significant
decrease in concentration was observed in the latter between 1998 and 2007 (Table 44a) No significant
changes were observed in N concentrations in soils (0-15 cm) beneath Broadleaved Mixed and Yew
Woodland and Acid Grassland in England between 1998 and 2007 There were insufficient samples to make
a valid estimate of the mean and change in N concentration in soils (0-15 cm) in the remaining Broad
Habitats in England
Total N density was lowest in the Arable Broad Habitat (4 4 tha) and highest in Improved Grassland (61
tha) these figures were very similar to the data for these Broad Habitats across GB (Table 42a)
There were significant decreases in soil N concentration in Fertile Grassland and Infertile Grassland AVCs in
England between 1998 and 2007 (Table 44b) Of the AVCs with sufficient data to provide a valid estimate of
the mean the highest concentrations in 1998 and 2007 were measured in soils (0-15 cm) beneath Moorland
Grass Mosaic (109 N) The highest total N density was measured in Infertile Grassland AVC (61 tha)
whilst Upland Woodland and Crops and Weeds jointly had the lowest total N density (43 tha)
Restricting the analysis to plots where AVC remained unchanged resulted in only three AVCs having
sufficient samples for statistically valid estimates of the mean (Table 44c) Infertile Grassland was the only
AVC showing a significant reduction in mean soil N concentration between 1998 and 2007 Mean values for
Fertile Grassland and Crops and Weeds for the unchanged dataset were very similar to those for the dataset
as a whole
There was small (asymp10) but significant decrease in soil N concentration in mineral and humus-mineral soils
in England between 1998 and 2007 (Table 44d) Organo-mineral soils did not change significantly between
the surveys and there were insufficient data to provide valid estimates for organic soils in England The
lowest total N density was observed in mineral soils (45 tha) and humus-mineral soils contained the most
total N (67 tha)
82
Countryside Survey Soils Report from 2007
4 Total Nitrogen and CN
Table 44 Change between 1998 and 2007 in N concentration of soils (0-15 cm) and total N density of soils (0-15
cm) in 2007 for England for a) Broad Habitats b) Aggregate Vegetation Classes (AVC) c) AVCs unchanged since
1978 and d) LOI categories Arrows denote a significant change (plt005) in the direction shown Diagonal line
indicates too few samples to provide reliable estimate
a) England ndash Broad Habitat
Broad Habitats Mean Total Nitrogen ( dry wt soil)
Direction of
significant changes
Total Nitrogen
density (tha)
1998 2007 1998 - 2007 2007
Broadleaved Mixed and
Yew Woodland
064 058 56
Coniferous Woodland
Arable and Horticulture 027 025 44
Improved Grassland 047 045 61
Neutral Grassland 052 046 59
Acid Grassland 110 092 54
Bracken
Dwarf Shrub Heath
Fen Marsh and Swamp
Bog
All Habitat Types 052 046 53
b) England ndash AVC whole dataset
Aggregate Vegetation
Class
Mean Total Nitrogen ( dry wt soil) Direction of
significant changes
Total Nitrogen
density (tha)
1998 2007 1998 - 2007 2007
Upland Woodland 106 089 43
Lowland Woodland 061 060 53
Fertile Grassland 045 039 59
Infertile Grassland 056 051 61
Moorland Grass Mosaic 109 109 58
Heath and Bog
Tall Grass and Herb 036 037 49
Crops and Weeds 027 025 43
c) England ndash AVC unchanged
Aggregate Vegetation
Class
Mean Total Nitrogen ( dry wt soil) Direction of
significant changes
Total Nitrogen
density (tha)
1998 2007 1998 - 2007 2007
Upland Woodland
Lowland Woodland
Fertile Grassland 049 045
Infertile Grassland 060 055
Moorland Grass Mosaic
Heath and Bog
Tall Grass and Herb
Crops and Weeds 025 024
83
Countryside Survey Soils Report from 2007
4 Total nitrogen and CN
d) England ndash Loss on Ignition category
LOI category () Mean Total Nitrogen ( dry wt soil)
Direction of
significant changes
Total Nitrogen
density (tha)
1998 2007 1998 - 2007 2007
Mineral (0-8) 029 026 45
Humus-mineral (8-30) 062 056 67
Organo-mineral (30-60) 145 110 63
Organic (60-100)
434 Change in mean total nitrogen concentration in soils (0-15 cm) across Scotland
In Scotland there was a small (11) but significant decline in soil N concentration for the All Broad Habitats
category (Table 45a) between 1998 and 2007 Significant decreases in N concentration in soils (0-15 cm)
were also observed in Coniferous Woodland Acid Grassland Dwarf Shrub Heath and Bog Broad Habitats
but there were no significant changes in soil N concentration in Broadleaf Woodland Arable Improved
Grassland and Neutral Grassland Improved Grassland contained the most total N (52 tha) and Coniferous
Woodland had the lowest total N density (37 tha) The figure for Coniferous Woodland is comparable with
that for GB but Improved Grassland in Scotland contains 08 tha less total N compared to GB
Infertile Grassland and Heath and Bog AVCs all showed a significant decrease in total N concentration
between 1998 and 2007 (Table 45b) There were no significant changes in Upland Woodland Moorland
Grass Mosaic Fertile Grassland or Crops and Weeds The latter contained the smallest soil N concentrations
in 1998 and 2007 (024 N and 023 N respectively) whilst the highest mean concentrations were
measured in Heath and Bog (148 N in 2007) Despite the high mean soil (0 -15 cm) N Heath and Bog
had the lowest total N density (36 tha) reflecting the relatively low bulk density of organic -rich soils Infertile
Grassland contained the largest quantity of soil (0 -15 cm) N (52 tha)
Restricting the analysis to unchanged AVCs removed the Crops and Weeds AVC but for the other AVCs the
results were consistent with those for the dataset as a whole (Table 45c)
Table 45 Change between 1998 and 2007 in N concentration of soils (0-15 cm) and total N density of soils (0-15
cm) in 2007 for Scotland for a) Broad Habitats b) Aggregate Vegetat ion Classes (AVC) c) AVCs unchanged since
1978 and d) LOI categories Arrows denote a significant change (plt005) in the direction shown Diagonal line
indicates too few samples to provide reliable value
a) Scotland ndash Broad Habitat
Broad Habitats Mean Total Nitrogen ( dry wt soil)
Direction of
significant changes
Total Nitrogen
density (tha)
1998 2007 1998 - 2007 2007
Broadleaved Mixed and
Yew Woodland
081 076 40
Coniferous Woodland 111 092 37
Arable and Horticulture 026 026 41
Improved Grassland 045 043 52
Neutral Grassland 052 046 49
Acid Grassland 163 134 46
Bracken
Dwarf Shrub Heath 134 117 42
84
Countryside Survey Soils Report from 2007
4 Total Nitrogen and CN
Fen Marsh and Swamp
Bog 178 158 38
All Habitat Types 112 100 43
b) Scotland ndash AVC whole dataset
Aggregate Vegetation
Class
Mean Total Nitrogen ( dry wt soil) Direction of
significant changes
Total Nitrogen
density (tha)
1998 2007 1998 - 2007 2007
Upland Woodland 082 070 38
Lowland Woodland
Fertile Grassland 040 037 51
Infertile Grassland 064 054 52
Moorland Grass Mosaic 127 112 45
Heath and Bog 172 148 36
Tall Grass and Herb
Crops and Weeds 024 023 42
c) Scotland ndash AVC unchanged
Aggregate Vegetation
Class
Mean Total Nitrogen ( dry wt soil) Direction of
significant changes
Total Nitrogen
density (tha)
1998 2007 1998 - 2007 2007
Upland Woodland 086 075
Lowland Woodland
Fertile Grassland 044 041
Infertile Grassland 063 052
Moorland Grass Mosaic 143 124
Heath and Bog 172 153
Tall Grass and Herb
Crops and Weeds
d) Scotland ndash Loss on Ignition category
LOI category () Mean Total Nitrogen ( dry wt soil)
Direction of
significant changes
Total Nitrogen
density (tha)
1998 2007 1998 - 2007 2007
Mineral (0-8) 027 025 39
Humus-mineral (8-30) 058 053 50
Organo-mineral (30-60) 144 111 45
Organic (60-100) 189 178 36
There was no significant change in soil N concentration of mineral and humus-mineral soils in Scotland
between 1998 and 2007 (Table 45d) Soil N concentration decreased significantly by over 20 in organo-
mineral soils but there was a much smaller (6) significant decrease in organic soils between 1998 and
2007 The highest soil N concentrations in 1998 and 2007 were observed in organic soils (189 N and 178
N respectively) these had the lowest total N density in 2007 (36 tha) Humus-mineral soils contained the
most N (50 tha) in Scotland
85
Countryside Survey Soils Report from 2007
4 Total nitrogen and CN
435 Change in mean total nitrogen concentration in soils (0-15 cm) across Wales
The small number of samples from Wales placed a major restriction on data analysis with only seven
reporting categories having sufficient data to report valid statistics for status and change in soil N
concentration (Table 46) There was no significant change in soil N concentration across Wales as a whole
between 1998 and 2007 (Table 46a) Improved Grassland was the only Broad Habitat to have sufficient data
to provide stock and change statistics in Wales and this showed no significant change in soil N concentration
between 1998 and 2007 Total N density in Improved Grassland in Wales in 2007 (72 tha) was relatively
high compared with other countries and with GB as a whole For Wales as a whole total N density was 61
tha in 2007 which was a comparatively high figure and reflected the pre-dominance in Wales of samples
from Improved Grassland (43 of samples) and the virtual absence of samples from Broad Habitats with
more organic-rich soils which have a lower total N density
Infertile Grassland and Fertile Grassland were the only AVCs in Wales to have sufficient sample points to
provide valid statistics for stock and change (Tables 46 b and 46c) Mean concentrations of total N did not
change significantly between 1998 and 2007 in either AVC The largest total N density was measured in
Fertile Grassland (75 tha) this was the highest value for this AVC of all three countries Restricting the
dataset to unchanged AVCs (Table 46c) reduced the number of reporting categories to Infertile Grass land
and mean soil N concentration did not change between 1998 and 2007
There were no significant changes in mean soil N concentrations in mineral and humus -mineral soils in Wales
between 1998 and 2007 (Table 46d) These were the only soil LOI categories to have sufficient samples to
report status and change Total N densities in 2007 in mineral and humus-mineral soils were 53 tha and 64
tha respectively
Table 46 Change between 1998 and 2007 in N concentration of soils (0-15 cm) and total N density of soils (0-15
cm) in 2007 for Wales for a) Broad Habitats b) Aggregate Vegetation Classes (AVC) c) AVCs unchanged since
1978 and d) LOI categories Absence of arrows denote no significant change (plt005) were observed Diagonal
line indicates too few samples to provide reliable value
a) Wales ndash Broad Habitat
Broad Habitats Mean Total Nitrogen ( dry wt soil)
Direction of
significant changes
Total Nitrogen
density (tha)
1998 2007 1998 - 2007 2007
Broadleaved Mixed and
Yew Woodland
Coniferous Woodland
Arable and Horticulture
Improved Grassland 057 057 72
Neutral Grassland
Acid Grassland
Bracken
Dwarf Shrub Heath
Fen Marsh and Swamp
Bog
All Habitat Types 074 070 61
86
Countryside Survey Soils Report from 2007
4 Total Nitrogen and CN
b) Wales ndash AVC whole dataset
Aggregate Vegetation
Class
Mean Total Nitrogen ( dry wt soil) Direction of
significant changes
Total Nitrogen
density (tha)
1998 2007 1998 - 2007 2007
Upland Woodland
Lowland Woodland
Fertile Grassland 054 056 75
Infertile Grassland 056 055 61
Moorland Grass Mosaic
Heath and Bog
Tall Grass and Herb
Crops and Weeds
c) Wales ndash AVC unchanged
Aggregate Vegetation
Class
Mean Total Nitrogen ( dry wt soil) Direction of
significant changes
Total Nitrogen
density (tha)
1998 2007 1998 - 2007 2007
Upland Woodland
Lowland Woodland
Fertile Grassland
Infertile Grassland 051 051
Moorland Grass Mosaic
Heath and Bog
Tall Grass and Herb
Crops and Weeds
d) Wales ndash Loss on Ignition category
LOI category () Mean Total Nitrogen ( dry wt soil)
Direction of
significant changes
Total Nitrogen
density (tha)
1998 2007 1998 - 2007 2007
Mineral (0-8) 035 035 53
Humus-mineral (8-30) 061 059 64
Organo-mineral (30-60)
Organic (60-100)
87
Countryside Survey Soils Report from 2007
4 Total nitrogen and CN
44 Discussion and Policy Implications
The policy question which led to the inclusion of this parameter in the CS in 2007 was ldquoCan the
eutrophication trend in the countryside be detected in the soil as well as the vegetation using this basic soil
propertyrdquo As there were no significant increases in mean soil N concentration in any reporting category in
GB or in the individual countries between 1998 and 2007 the conclusion must be a negative Instead
significant decreases in soil N concentration were detected for many reporting categories The decreases for
woodlands and semi-natural habitats were generally small (5-10 of 1998 levels) with a maximum of 21 in
Coniferous Woodland In intensively managed soils the question of in terest although not specified would
have been ldquoCan the decline in fertiliser use in improved grassland and cropland be detected in the soil using
this basic soil property ldquo There is not as clear evidence for this as might have been expected with no
change or a small decline (4-7 of 1998 levels) observed
For semi-natural and woodland systems the results imply that sustained levels of atmospheric N deposition
over the decade from 1998 to 2007 have not resulted in measurable increases in soil (0 -15 cm) N
concentration as expected Average inputs across GB are ca 20 kgNhayr which is equivalent to 018tNha
This translates to a potential increase of ca 3-4 in soil nitrogen concentrations (0-15cm) In contrast to the
expected increase in soil N concentration there was a significant decline in many habitats The trend for
increased CN ratios (significant for Coniferous Woodland and Neutral Grassland) indicates that there is
either increased removal of N from the soil by vegetation leaching or gas eous pathways and or greater
inputs and storage of C due to increased plant productivity Change in plant fixation of C and uptake of N
may be driven by the combined and possibly interactive effects of N deposition and climate change on plant
productivity No significant increase in soil (0-15cm) carbon density was observed for any semi-natural
habitat or woodland (Chapter 2) although there were positive trends observed for Acid Grassland Dwarf
Shrub Heath and Bog (Table 25)
For managed grasslands the overall trend is not clear Whilst there was no change over this period in soil (0 -
15cm) nitrogen concentrations for Improved Grassland Broad Habitat there was a significant decline for the
Fertile Grassland AVC for GB No significant change in CN was o bserved for either category The relatively
small signal observed is unexpected as fertiliser application rates to grassland declined dramatically by asymp
40 to 65 kgNha between 1998 and 2007 (BSFP 2008) Taking England as an example combined land use
and fertiliser statistics showed a reduction in total use of N fertilisers between 1998 and 2007 of 33 for
grassland The grassland statistic for England combined the effects of a reduction in application rate (by
c40) and a small (12) increase in land area under grassland (June Agricultural Census data for 1998 and
2007) This result could imply either that livestock farmers are using alternative sour ces of N such as farm
yard manure slurries and other organic waste products to maintain N levels in managed grassland soils or
soil (0-15 cm) N is an insensitive indicator of soil response to changes in fertiliser use
For cropped systems a decline in N and CN ratios was observed suggesting the loss of soil C (0 -15cm)
reported in Chapter 2 is matched by a loss of N (9 and 75 respectively between 1998 and 2007) As there
was only a small decline in N fertiliser application rates to tilled land acro ss GB between 1998 and 2007 (eg
in England 6 drop for tilled land) it is most likely that processes which would remove C and N in equal
proportions may be responsible eg erosion or deep ploughing resulting in lower soil horizons characterised
by lower CN coming to the surface
441 Policy implications
In semi-natural systems the decline in N is contrary to expectations due to the ongoing input of N
atmospheric deposition across the GB landscape at an average of ca 20-30kgNhayr (RoTAP 2010) There
may be either increased removal of N from the soil by vegetation leaching or gaseous pathways and or
greater inputs and storage of C due to increased plant productivity Increased loss of N is known to be linked
to N inputs although evidence for this is currently limited for GB (RoTAP 2010) Change in plant uptake of C
88
Countryside Survey Soils Report from 2007
4 Total Nitrogen and CN
and N may be driven by the combined and possible interactive effects of N deposition and climate change on
plant productivity Increased plant productivity is one of the primary dri vers of vegetation composition change
in semi-natural systems (NEGTAP 2001 RoTAP 2010) This apparent bdquodilution‟ of the N signal in the soil
may also have major implications for current soil and pollution monitoring programmes which rely on the
gross soil measurements such as N and CN to indicate the impact of N deposition in semi -natural systems
A more sensitive indicator of plant available-N such as Mineralisable-N (Chapter 5) may need to be
combined with plant productivity and vegetation composition change in the future Ongoing analysis will help
resolve the links between the changes in the C and N storage rates and the possible underlying drivers
In improved grassland systems the lack of any clear decline in N despite a major reduction in N fe rtiliser
use over the same period suggests farmers are using alternative sources of N such as slurry and other
organic waste solids and or that N is an insensitive indicator of change in fertiliser use If indeed farmers
are continuing to maintain total soil N concentrations in managed grassland whilst reducing use of mineral N
fertiliser this would be a positive outcome as the energy costs associated with mineral fertiliser use will have
been reduced without detriment to soil N status Fertiliser use is one of the indicators used by Defra to gauge
progress in reducing the environmental cost of the food chain under the Sustainable Farming and Food
Strategy N fertiliser has been chosen because N contributes to diffuse pollution and fertiliser production has
a high energy cost However there is a risk that the maintenance of soil N status possibly through other
sources of N may limit the intended benefits of reduced fertiliser use for diffuse pollution control
In cropped soils the loss of soil C (0-15cm) reported in Chapter 2 combined with the reported decline in soil
N concentrations here suggest erosion deep ploughing or increased decomposition may be responsible for
the 7-9 reduction for C and N as there is little change in fertiliser application rates This suggests that
policies in place to protect soils in cropped system may not be adequate
45 References
BSFP 2008 The British Survey of Fertiliser Practice Report for 2008 httpwwwdefragovuk
Emmett BA Frogbrook ZL Chamberlain PM Griffiths R Pickup R Poskitt J Reynolds B Rowe
E Spurgeon D Rowland P Wilson J and Wood CM 2008 CS Technical Report No 307 Soils
Manual NERCCentre for Ecology amp Hydrology 180 pp (CEH Project Number C03259)
Haines-Young RH Barr CJ Black HIJ Briggs DL Bunce RGH Clarke RT Cooper A Dawson
FH Firbank LG Fuller RM Furse MT Gillespie MK Hill R Hornung M Howard DC McCann
T Morecroft MD Petit S Sier ARJ Smart SM Smith GM Stott AP Stuart RC and Watkins
JW 2000 Accounting for nature assessing habitats in the UK countryside Department of the Environment
Transport and the Regions Centre for Ecology and Hydrology 134pp
Smith J Smith P Wattenbach M Zaehle S Hiederer R Jones RJA Montanarella L Rounsevell
MDA Reginster I Ewert F 2005 Projected changes in mineral soil carbon of European croplands and
grasslands 1990-2080 Global Change Biology 11 2141 ndash 2152
89
Countryside Survey Soils Report from 2007
5 Mineralisable-N
Summary
Mineralisable-N stock (kgN ha) in soil (0-15cm) was a sensitive indicator of recognised differences
in nitrogen availability between different vegetation types suggesting it is a promising indicator of
eutrophication of the countryside
Initial investigations testing the link between mineralisable-N and occurrence of plant species in 45
test sites suggests it provides additional information to mean total nitrogen concentration data
(N) possibly linked to short term changes in nitrogen availability or specific vegetation or soil
types
There were strong geographical trends in the proportion of mineralised-N transformed to the mobile
form nitrate which suggest a close relationship to broad-scale climatic or soil parameters
Future analyses will separate out the inherent variability associated with climate vegetation and
soil type to identify spatial patterns which can be linked to atmospheric deposition and changes in
management
51 Policy background
Policy question Can the trend of eutrophication of the countryside be detected in the soil as well as the vegetation using this sensitive soil process method
Measurements Concentrations of ammonium- and nitrate-N in soil (0-15cm) after a standard incubation The
measurement was carried out for the first time in 2007 Soils were collected from plots included in the original
1978 survey Countryside Survey (CS) in 2007 has provided
Whole GB and country-level assessment of soil mineralisable N status in 2007
Explanatory data to contribute to the analysis of other CS datasets such as those describing changes in plant species composition
Data likely to decrease uncertainty in model chains used to predict impacts of N deposition on biodiversity
Changes in plant species composition observed following CS in 1998 have been ascribed to eutrophication
following increased deposition of atmospheric nitrogen (N) compounds (Braithwaite et al 2006 Maskell et al
2010) This eutrophication is unlikely to be closely linked to changes in soil total N and total CN since the
soil N stock is large in relation to annual fluxes and contains much N that is not available to plants The
purpose of the measurement of mineralisable N within CS in 2007 is to develop a simple but robust index of
plant-available N This will help determine causal drivers of change in species composition by linking
measures of soil N status with plant species composition across a wide range of Broad Habitats
geographical locations and soil types Mineralisable N measurements will also be used to improve models of
soil biogeochemistry used at national scale to predict carbon (C) and N cycling and the effects of N pollution
on biodiversity The data will also be useful in identifying one aspect of nutrient cycling at a national scale
between different habitats and the relationship to different drivers Nutrient cycling is one of the ecosystem
supporting services currently under review as part of the National Ecosystem Assessment
Several types of analyses have been proposed to measure plant -available N including measurements of net
N mineralisation flux gross mineralisation flux and proxies such as near-infra-red absorption analysis
Plants are able to take up N even from soils with no net mineralisation flux (eg Dyck et al 1987) due to
interception of available N before it can be re-immobilised Such temporarily-available N pools can be
measured using isotopic dilution or by adsorption onto strong ion-exchange resins but these measurements
probably overestimate plant-available N (Fierer et al 2001) While net mineralisation measurements
90
Countryside Survey Soils Report from 2007
5 Mineralisable-N
underestimate plant-available N in low-N systems particularly where plants take up a substantial proportion
of N in dissolved organic form net N mineralisation remains useful to distinguish soils across a range of N
availability (Schimel and Bennett 2004)
Plant species may vary in their preference for dissolved organic reduced or oxidised N (Miller and Bowman
2003) species typical of infertile habitats are more likely to use dissolved organic N whereas species typical
of fertile habitats are more likely to be adapted for nitrate assimilation Thus while mineralisable N is an index
of plant available-N the two concepts do not correspond directly since some plants use dissolved organic N
directly and also since plants exert some contro l over mineralisation and therefore N availability within the
rhizosphere The relative availability of ammonium and nitrate may be more important than gross fluxes for
explaining species occurrence (Bengtson et al 2006) A measure of net nitrification during incubation was
also included to assess whether this distinguished soil types more clearly and to provide extra information for
plant species occurrence models
Policy decisions concerned with the abatement o f atmospheric emissions of sulphur dioxide and oxidised and
reduced forms of N are currently informed through the critical load approach The general definition of the
critical load is ldquoa quantitative estimate of an exposure to one or more pollutants belo w which significant
harmful effects on specified sensitive elements of the environment do not occur according to present
knowledgerdquo (UNECE 2004) Critical loads for N are calculated using either empirical or steady-state mass
balance approaches (UNECE 2004) Empirical approaches rely on data from experiments with critical loads
for each habitat agreed by consensus at an EUUNECE level However neither of these approaches allows a
timescale of changes to be identified and so dynamic models are being developed to improve forecasting of
both soil and plant species change Hitherto soil total N and total C have been used as the abiotic indicators
of N availability that link biogeochemical and floristic parts of these models These bulk measures only
explain around 60 of the variation in mean Ellenberg N (a floristic indicator of eutrophication) Abiotic
measurement of N status are thought to be the major source of uncertainty in such model chains (Wamelink
et al 2002) A more sensitive measurement of available N is required to provide a better indication of
excessive N deposition and a more accurate predictor of floristic change and improve the accuracy of model
chains used to develop policy in relation to the UNECE process
52 Methods
521 Proof of concept
Net mineralisation flux has generally been measured by comparing the amounts of extractable nitrate and
ammonium before and after a period of incubation using paired soil samples eg (Keeney 1980 Waring and
Bremner 1964) Soil disturbance can change mineralisation and immobilisation rates so methods that keep
the core intact are preferred (Raison et al 1987) However the established method may be unsuitable for
large surveys in which the transit of cores to the laboratory cannot be completely contro lled since
mineralisation in transit is likely to lead to large variation in mineral N contents on arrival at the laboratory
which inevitably increases error in the calculation of net flux For this reason a new method was developed
during the CS in 2007 pilot study in which soils were flushed through with approximately four pore -volumes
of an artificial rain solution to remove any accumulation of mineral N during transit
Water tension during incubation affects the mineralisation rate and nitrification and denitrification fluxes and
hence the ratio of ammonium to nitrate Measuring water tension is time -consuming and so calculating the
amount of water that needs to be added or evaporated to reach a particular proportion of water -holding
capacity for a given soil is not straightforward Instead water tension was standardised to approximately that
at field capacity by applying suction to the saturated soil to drain the larger pores
A pilot study showed that the new mineralisable N measurement greatly improved the prediction of floristic
composition as represented by mean Ellenberg N score (Rowe et al in prep) The method was applied to a
large set of cores taken in CS in 2007 A full description of the m ethod is given in the CS in 2007 Soils
91
Countryside Survey Soils Report from 2007
5 Mineralisable-N
Manual (Emmett et al 2008) Three of the five Main Plots were selected for analysis at random from each of
the original 256 CS squares Access restrictions to some of the CS plots prevented collection of some c ores
and 699 of the planned 768 analyses were carried out
Three metrics were chosen to express measurements of mineral N ie ammonium and nitrate contents The
total mineral N per g soil reflects availability to plants but gives the impression of lar ge available N contents
in organic sols with low bulk density Total mineral N per g organic matter may provide a better index of N
availability since large carbon contents are likely to inhibit the net release of mineral N from organic matter
Nitrate content after incubation is a measure of net nitrification (since N is initially released from organic
matter in reduced forms) To separate this signal from that of overall quantity of mineral N nitrate -N content
was expressed as a proportion of total mineral N
The rationale for including mineralisable N within the CS measurement suite is summarised in Table 51
Table 51 Summary of rationale for measurement of soil mineralisable nitrogen within CS in 2007
Issue Facts Comments History in CS No measurements previously
made Better measure of plant-available N than total or soluble N
Country level reporting No Dataset confined to 1978 CS squares which limits the power of analysis for Country level reporting for habitat vegetation and soil types stratifications
Links and compatibility to other monitoring programmes
No known datasets at national scale
Linked to N storage and turnover hence to water quality and floristic monitoring eg Environmental Change Network
Uniqueness of CS No known datasets at national scale
Only integrated sample which can be linked to vegetation and land management
Value for money (Policy priority or interpretative value x cost)
Medium High policy and interpretative value medium cost
522 Analytical method
An extra soil core was taken in 2007 in addition to those taken in previous surveys for mineralisable N analyses A 15 cm long by 5 cm diameter plastic pipe was knocked into the ground to obtain this core according to the detailed field protocol set out in (Emmett et al 2008 Chapter 1) Once extracted and logged the long white cores were returned by mail to CEH Bangor Cores were stored at 4
oC until a
sufficient number had been received for an analytical batch
The lab protocol is set out in detail in (Emmett et al 2008) In short the plastic sampling pipe was split open
and the intact soil core laid on a perforated rack The core was misted repeatedly with a solution with the
same concentrations of major ions as UK rain in 2007 as estimate d using the FRAME model (except with
zero N concentrations) until approximately 150 ml solution had passed through Suction was applied using a
vacuum line to drain larger pores of solution The core was wrapped in a thin plastic bag to restrict aeration
and incubated for four weeks at 10 oC After the full 4 week incubation period the core was carefully
homogenised and a subsample extracted using a 1-molar solution of potassium chloride (KCl) for analysis of
ammonium and nitrate content Mineralisable N was expressed in mg N kg dry soil
92
Countryside Survey Soils Report from 2007
5 Mineralisable-N
523 Quality assurance
Replicate cores were not available but replicate subsamples were taken after incubation for KCl extraction and analysis from two cores per batch of approximately 30 samples Two standard re ference soils (CEH Bangor Reference Soils 1 and 2) were also analysed per batch Several steps were taken to minimise potential artefacts by standardising sample collection flushing incubation and analysis Initial mineral contents were standardised by f lushing with a minus-N solution A standard amount of solution was passed through each core This took less time for coarse -textured soils than for fine clay and peat soils To standardise temperature conditions during the flushing step all cores were retained in the flushing room at 4
oC for the same length of time
Incubation took place under standard conditions of temperature and aeration and for a standard time
The duplicate analyses undertaken on replicate subsamples were very consistent for nitr ate (R2 = 98 ) but
not as good for ammonium (R2 = 63 ) (Fig 51) Since duplicate samples were only separated during
subsampling after incubation the likely cause of this inconsistency was the incomplete homogenisation of
cores before subsampling The effect was worse for ammonium presumably due to localised production of
ammonium in anaerobic microsites together with lower rates of diffusion for ammonium ions than for the more
weakly-adsorbed nitrate ions
Figure 51 Consistency of ammonium and nitrate analyses between duplicate subsamples
NO3
0
001
002
003
004
005
0 001 002 003 004 005
Duplicate 1 nitrate concentration mg NO3-N
g dry soil
Du
plicate
1 n
itra
te c
on
cen
trati
on
mg
NO
3-N
g
dry
so
il
NH4
0
001
002
003
004
005
0 001 002 003 004 005
Duplicate 2 ammonium concentration mg
NH4-N g dry soil
Du
plicate
1 a
mm
on
ium
co
ncen
trati
on
m
g N
H4-N
g
dry
so
il
Analyses of reference samples showed some variation between batches but there was no evidence of systematic bias (Fig 52) The coefficient of variation (cv) for nitrate was somewhat greater for the low -N BS2 standard (15) than for the high-N BS1 standard (9) The cv for ammonium was similar (12) for the low-N and high-N standards
93
Countryside Survey Soils Report from 2007
5 Mineralisable-N
Figure 52 Nitrate (a amp c) and ammonium (b amp d) contents in high-N (BS1 a amp b) and low-N (BS2 c amp d)
reference soils included with sample batches during CS in 2007 mineralisable N analyses
a) b)
BS1 NO3-N
0
50
100
150
200
250
300
350
400
17607 6807 25907 141107 3108 22208
Date
BS1 NH4-N
0
50
100
150
200
250
17607 6807 25907 141107 3108 22208
Date
c) d)
BS2 NO3-N
0
1
2
3
4
5
6
17607 6807 25907 141107 3108 22208
Date
BS2 NH4-N
0
5
10
15
20
25
30
35
40
45
50
17607 6807 25907 141107 3108 22208
Date
Taken overall the QC data suggest that nitrate-N and total mineral N are more consistent than ammonium -N
524 Reporting
Soil mineralisable N data have been analysed to provide information on the state of mineralisable N in 2007
The data in this Report describe mineralisable N concentration in 2007 in dry soil and in soil organic matter
mineralisable N stock (ie amount per hectare) and nitrate proportion of mineralisable N (all measured in
soil from 0-15 cm depth) categorised by Broad Habitat Aggregate Vegetation Class (AVC) and soil type (LOI
class) Concentrations in organic matter were obtained using the primary loss -on-ignition value recorded for
the plot in 2007 ie from a core taken adjacent to the core used for mineralisable N analyses In summary
reporting categories are defined as
Broad Habitat - The Broad Habitat classification consists of 27 habitats which account for the entire
land surface of Great Britain and the surrounding sea Countryside Survey reports on soils for 10
major terrestrial habitats
Aggregate Vegetation Class (AVC) ndash is a high level grouping of vegetation types produced from a
quantitative hierarchical classification of the different plant species found in the original Countryside
Survey sample plots Loss on ignition (LOI) category ndash soil type based on soil organic matter content defined as mineral (0 -
8 LOI 0-44 g C kg-1
) humus-mineral (8 ndash 30 LOI 44-165 g C kg-1
) organo-mineral (30 ndash 60
LOI 165-330 g C kg-1
) and organic (60 ndash 100 gt 330 g C kg-1
)
94
Countryside Survey Soils Report from 2007
5 Mineralisable-N
Mineralisable N was not measured in previous surveys so no results regarding change can be presented
Log-transformed data were analysed by REML using the mixed models procedure of SAS (SAS Institute
2006) Back-transformed means and standard errors are presented Significant results relate to statistical
significance with their ecological and policy relevance highlighted where appropriate More details can be
found in Emmett et al (2008) Annex F
The data for mineralisable N concentration in soil and in organic matter and for nitrate proportions were
mapped using kriging to interpolate between the Countryside Survey sample points Routine checking of data
for outliers was conducted and the working dataset was transformed using a normal score procedure to
obtain a Gaussian distribution The data were then interpolated on a 1km UK grid using ordinary kriging and
finally the kriged data were back-transformed to produce interpolated maps In addition sequential Gaussian
simulation (SGs) was conducted on the data to obtain the E-type estimate (mean) and the spatial uncertainty
for the data (conditional variance) The coefficient of variation CV (standard devia tion mean) is reported
53 Results
531 Total mineralisable N concentration in soil
The log-average concentration of mineralisable N measured across all British soils was 102 mg N kg dry soil The distributions of mineralisable N concentration by Broad Habitat AVC and LOI class are shown in Fig 53 The greatest concentrations were found in the Lowland Woodland AVC and the aggregation by Broad Habitat suggests that concentrations were high in both Coniferous and BroadleafMixedYew Woodland Similar concentrations were found in the Fertile Grassland and Infertile Grassland AVCs but the greater disaggregation in the Broad Habitat data allows a difference between infertile grassland types to be distinguished with lower concentrations of minera lisable N in Neutral Grassland than in Acid Grassland (P lt 005) There was a clear increase in mineralisable N concentration with the organic matter content of the soil as illustrated by the differences in mean concentration among loss -on-ignition classes
Mean mineralisable N concentrations across all habitat types were not significantly different among England Scotland and Wales Where more than 20 mineralisable N analyses were available for a Broad Habitat within a country mean concentrations were derived (Table 52) Comparisons across countries are only possible for a limited set of Broad Habitats Mineralisable N concentrations were similar ( P gt 005) in England and Scotland for Arable and Horticulture and for Neutral Grassland Concentrations i n Improved Grassland were similar in all three countries
95
Countryside Survey Soils Report from 2007
5 Mineralisable-N
Figure 53 Mean (+- one standard error) mineralisable nitrogen concentration (mg per kg dry soil) in soil (0 -15
cm depth) within a) Broad Habitats b) Aggregate Vegetation Classes and c) Soil Loss-on-ignition categories
across Britain Analyses were on log-transformed data means and error bars back-transformed to the original
scale
a) Broad Habitats b) Aggregate Vegetation Classes
c) LOI categories
96
Countryside Survey Soils Report from 2007
5 Mineralisable-N
Table 52 Mineralisable N concentrations (mg N kg dry soil) in soils (0-15 cm depth) across all habitats and in
selected Broad Habitats in England Scotland and Wales
a) England
Mean total mineralisable N (mg N kg dry
soil)
Broad Habitat 2007
Broadleaved Mixed and Yew Woodland 160
Arable and Horticulture 83
Improved Grassland 101
Neutral Grassland 69
All habitat types 98
b) Scotland
Mean total mineralisable N (mg N kg dry
soil)
Broad Habitat 2007
Coniferous Woodland 127
Arable and Horticulture 108
Improved Grassland 101
Neutral Grassland 85
Acid Grassland 113
Dwarf Shrub Heath 76
Bog 115
All habitat types 104
c) Wales
Mean total mineralisable N (mg N kg dry
soil)
Broad Habitat 2007
Improved Grassland 100
All habitat types 112
97
Countryside Survey Soils Report from 2007
5 Mineralisable-N
532 Total mineralisable N concentration in soil organic matter
The log-average concentration of mineralisable N in organic matter measured across all British soils was 76 mg N kg loss-on-ignition The distributions of mineralisable N concentration in soil organic matter by Broad Habitat Aggregate Vegetation Class and soil loss -on-ignition class are shown in Figure 54 Differences in mineralisable N concentration in organic matter among Broad Habitats Aggregate Vegetation Classes and loss-on-ignition categories are clearly distinguishable compared with differences in concentrations in soil (Fig 54) Mineralisable N concentration in organic matter was greater in habitats with fertiliser inputs andor fast litter turnover (eg Broadleaved Mixed and Yew Woodland and Arable and Horticulture Broad Habitats or Lowland Woodland and Crops and Weeds AVCs) than in habitats receiving little or no fertiliser input and with impeded litter turnover (eg Dwarf Shrub Heath and Bog Broad Habitats or the Heath and Bog AVC) This measurement distinguished mineralisable N concentrations in organic matter in different grassland AVCs with greater concentrations in Fertile Grassland than in Infertile Grassland In contrast to concentration in dry soil the Neutral Grassland Broad Habitat had greater concentrations of mineralisable N in organic matter than did Acid Grassland (P lt 001) Concentrations in organic matter in Neutral Grassland and Improved Grassland Broad Habitats were similar (P gt 001)
Figure 54 Mean (+- one standard error) mineralisable nitrogen concentration in soil organic matter (mg N kg
loss-on-ignition) in soils (0-15 cm depth) within a) Broad Habitats b) Aggregate Vegetation Classes and c) Soil
Loss-on-ignition categories across Britain Analyses were on log-transformed data means and error bars back-
transformed to the original scale
a) Broad Habitats b) Aggregate Vegetation Classes c) LOI categories
98
Countryside Survey Soils Report from 2007
5 Mineralisable-N
Mean mineralisable N concentrations in organic matter across all habitat types were lower in Wales than in England (P lt 005) and lower in Scotland than in Wales (P lt 005) Where more than 20 mineralisable N analyses were available for a Broad Habitat within a country mean conce ntrations were derived (Table 53) Comparisons across countries are only possible for a limited set of Broad Habitats As with concentrations in soil mineralisable N concentrations in organic matter were similar ( P gt 005) in England and Scotland for Arable and Horticulture and for Neutral Grassland and concentrations in Improved Grassland were similar (P gt 005) in all three countries
Table 53 Mineralisable N concentrations in soil organic matter (mg kg loss-on-ignition) in soils (0-15 cm
depth) across all habitats and in selected Broad Habitats in England Scotland and Wales
a) England
Mean total mineralisable N (mg N kg loss-
on-ignition)
Broad Habitat 2007
Broadleaved Mixed and Yew Woodland 1491
Arable and Horticulture 1893
Improved Grassland 1181
Neutral Grassland 860
All habitat types 1265
b) Scotland
Mean total mineralisable N (mg N kg loss-
on-ignition)
Broad Habitat 2007
Dwarf Shrub Heath 156
Bog 160
Coniferous Woodland 580
Arable and Horticulture 1974
Improved Grassland 1214
Neutral Grassland 1007
Acid Grassland 275
All habitat types 412
c) Wales
Mean total mineralisable N (mg N kg loss-
on-ignition)
Broad Habitat 2007
Improved Grassland 1105
All habitat types 914
99
Countryside Survey Soils Report from 2007
5 Mineralisable-N
533 Total mineralisable N stock
The log-average mineralisable N stock measured across all British soils was 88 kg ha
-1 in 0-15 cm depth
soil The distributions mineralisable N stock by Broad Habitat Aggregate Vegetation Class and soil loss -on-ignition class are shown in Figure 55 The measurement distinguished soils and habitats that are considered fertile from those considered infertile more clearly than mineralisable N concentrations in soil and arguably more clearly than mineralisable N concentrations in soil organic matter Broad Habitats such as Arable and Horticulture and Improved Grassland had consistently large mineralisable N stocks and Bog and Dwarf Shrub Heath had consistently large stocks but the stocks in Fen Marsh and Swamp Broad Habitats were more variable Coniferous and Broadleaf Mixed and Yew Woodland Broad Habitats had similar mineralisable N stocks but the Lowland Woodland AVC had significantly greater stocks than the Upland Woodland AVC Mineralisable N stocks were similar in the 0-8 and 8-30 loss-on-ignition categories but smaller in the 30-60 loss-on-ignition category (P lt 005) and still smaller in the 60-100 loss-on-ignition category (P lt 005)
Figure 55 Mean (+- one standard error) stock of total mineralisable nitrogen (kg N ha-1) in the top 15 cm of
soil within a) Broad Habitats b) Aggregate Vegetation Classes and c) Soil Loss -on-ignition categories across
Britain
a) Broad Habitats b) Aggregate Vegetation Classes c) LOI categories
Mean mineralisable N stocks in 0-15 cm depth soil across all habitat types were lower in Scotland than in England or Wales (P lt 005) Where more than 20 mineralisable N analyses were available for a Broad Habitat within a country mean concentrations were derived (Table 54) As with concentrations in soil and in
100
Countryside Survey Soils Report from 2007
5 Mineralisable-N
soil organic matter mineralisable N stocks were similar (P gt 005) in England and Scotland for Arable and Horticulture and for Neutral Grassland and stocks in Improved Grassland were simi lar (P gt 005) in all three countries Table 54 Mean (+- one standard error) stock of total mineralisable nitrogen (kg N ha-1) in the top 15 cm of soil
across all habitats and in selected Broad Habitats in England Scotland and Wales
a) England
Mean total mineralisable N stock
(kg N ha in 0-15 cm soil)
Broad Habitat 2007
Broadleaved Mixed and Yew Woodland 187
Arable and Horticulture 153
Improved Grassland 146
Neutral Grassland 101
All habitat types 137
b) Scotland
Mean total mineralisable N stock
(kg N ha in 0-15 cm soil)
Broad Habitat 2007
Coniferous Woodland 72
Arable and Horticulture 172
Improved Grassland 143
Neutral Grassland 111
Acid Grassland 39
Dwarf Shrub Heath 26
Bog 22
All habitat types 52
c) Wales
Mean total mineralisable N stock
(kg N ha in 0-15 cm soil)
Broad Habitat 2007
Improved Grassland 140
All habitat types 114
534 Nitrate proportion of mineralisable N
The mean proportion of nitrate in total mineralisable N measured across all British soils was 052 g NO3-N g
-1
total mineralisable N and there was considerable variation in nitrate proportion among Broad Habitats Aggregate Vegetation Classes and soil loss-on-ignition classes (Fig 56) There was no overall correlation of nitrate proportion with mineral N concentration in soil (P gt 005) but nitrate proportion was correlated with mineral N concentration in soil organic matter (c = 039 P lt 005) The pattern of mean nitrate proportion among vegetation and soil classes was similar to the pattern of mineral N concentration in soil organic
101
Countryside Survey Soils Report from 2007
5 Mineralisable-N
matter with the greatest proportions of nitrate in the Arable and Horticulture Broad Habitat and the Crops and Weeds AVC and small nitrate proportions in less fertile habitats such as B og Acid Grassland and Dwarf Shrub Heath The nitrate proportion could also be clearly related to soil organic matter content with the lowest nitrate proportion in the soil category with greatest loss -on-ignition
Figure 56 Mean (+- one standard error) nitrate proportion of total mineralisable nitrogen in soils (0 -15 cm
depth) within a) Broad Habitats b) Aggregate Vegetation Classes and c) Soil Loss -on-ignition categories
across Britain
a) Broad Habitats b) Aggregate Vegetation Classes c) LOI categories
Mean nitrate proportions across all habitat types were similar in England and Wales ( P gt 005) and lower in Scotland than in either country (P lt 005) (Table 55) Where more than 20 mineralisable N analyses were available for a Broad Habitat within a country mean concentrations were derived Comparisons across countries are only possible for a limited set of Broad Habitats As with total mineralisable N concentrations in soil and in organic matter nitrate proportions were similar (P gt 005) in England and Scotland for Arable and Horticulture and for Neutral Grassland and nitrate proportions in Improved Grassland were similar ( P gt 005) in all three countries
102
Countryside Survey Soils Report from 2007
5 Mineralisable-N
Table 55 Nitrate proportion of total mineralisable nitrogen in soils (0-15 cm depth) across all habitats and in
selected Broad Habitats in England Scotland and Wales
a) England
Mean nitrate proportion of mineralisable N
Broad Habitat 2007
Broadleaved Mixed and Yew Woodland 067
Arable and Horticulture 087
Improved Grassland 068
Neutral Grassland 054
All habitat types 069
b) Scotland
Mean nitrate proportion of mineralisable N
Broad Habitat 2007
Coniferous Woodland 030
Arable and Horticulture 088
Improved Grassland 060
Neutral Grassland 050
Acid Grassland 011
Dwarf Shrub Heath 031
Bog 019
All habitat types 037
c) Wales
Mean nitrate proportion of mineralisable N
Broad Habitat 2007
Improved Grassland 057
All habitat types 057
535 Spatial distributions of measured properties
High concentrations of mineralisable N in soil were found in several areas of Britain (Fig 571a amp b) This pattern is difficult to interpret but is perhaps due to the combined effects of greater organic matter conte nts in some areas (and hence a greater total N pool some of which is available for mineralisation) and a history of greater N deposition in the same or other areas By contrast high concentrations of mineralisable N in organic matter (Fig 572a amp b) appear more related to management practices and concentrations of N deposition in particular in areas with more mineral soils There was less small-scale variation in the proportion of nitrate in mineralisable N (Fig 573a amp b) with low proportions in the north and west of Scotland and greater proportions in eastern Britain in particular in central England suggesting links to spatial drivers at large scale such as soil moisture deficit soil pH andor N fertiliser application rate
103
Countryside Survey Soils Report from 2007
5 Mineralisable-N
Figure 57 Maps of a) kriged values and b) coefficients of variation for 1) total mineralisable N (mg N kg-1
soil)
2) total mineralisable N concentration in organic matter (mg N kg-1
loss-on-ignition) and 3) nitrate proportion of
total mineralisable N
a) b)
1)
2)
3)
104
Countryside Survey Soils Report from 2007
5 Mineralisable-N
536 Mineralisable N as an indicator of floristic change
To assess the effectiveness of mineralisable N data as an indicator of eutrophication it will be necessary to analyse the data in relation to other soil measurements and species occurrence data which is beyond the scope of this report Some results are presented here from a pilot study conducted in 2006 as a trial of the mineralisable N method for CS in 2007 All UK plant species have been assigned ldquoEllenberg Nrdquo scores which indicate whether they are likely to occur on high- or low-fertility sites A key test of potential soil indicators of eutrophication is whether they are associated with mean Ellenberg N score A PCA plot of results from the pilot study (Fig 58) demonstrates clearly that mean Ellenberg N is most closely associated with bulk soil properties ndash for example the vector for Ellenberg N has a small angle with NC ratio The position of the NC ratio vector opposite that for moisture shows that these are strongly b ut inversely related This reflects the overall tendency for low-fertility plant communities to occur on organic soils with low NC ratios and high moisture contents The explanatory power of mineralisable N is also considerable as shown by the length of this vector and its position shows that the variation explained by mineralisable N is orthogonal to that explained by total soil NC In other words mineralisable N describes variation in mean Ellenberg N that is not explained by bulk soil properties implying that it is detecting a shorter -term enrichment signal or different soil or vegetation types This is borne out by the considerable increase in proportion of the variance in Ellenberg N that is explained by moving from a regression model using only m oisture content (R
2 = 50) to a
model using both moisture content and mineralisable N (R2 = 70) (Rowe et al in prep Emmett et al 2008)
Figure 58 Ordination of measurements from the Countryside Survey pilot study in 2006 on first and second
principal components of the variation EllenbergN = mean fertility indicator score for plant species present
Nminpot = total N mineralised during a four-week incubation NC = total soil N total soil C pH = soil pH in
water Moisture = g water g-1
fresh soil
-03 -02 -01 00 01 02 03
-03
-02
-01
00
01
02
03
PC1
PC
2
1
2
3
4
5
6
7
8
9
10
11
12
13
14
15
16
17
18
19
20
21
22
2324
25
26
27
28
29
30
31
32
33
34
35
36 37
38
39
40
4142
4344
45
-5 0 5
-50
5
EllenbergN
Nminpot
NC
pH
Moisture
105
Countryside Survey Soils Report from 2007
5 Mineralisable-N
54 Discussion
Net N mineralisation and nitrification result directly in increased exposure of plants to N and increased N
leaching so the mineralisable N results are indicators of N pollution pressure in the sense of a direct cause
of loss of biodiversity and of water quality The results also provide indicators of the state of the soil
ecosystem in that net N mineralisation is likely to increase as the capacity of the soil organic matter pool to
buffer N pollution is depleted These indicators wil l be useful to discriminate which components of the loss of
biodiversity and water quality are due to N pollution The results will also be used to improve understanding
of soil and vegetation processes in particular habitats and improve models of water q uality and biodiversity
change Measurements at a single point in time do not allow direct assessments of change in mineralisable N
or nitrate proportion but a repetition of the measurements would provide evidence for increased damage or
recovery from N pollution The measurements also enable some assessment of nutrient cycling in different
ecosystems as required for the National Ecosystem Assessment It should be noted that an increase in
mineralisable-N would be considered a negative indicator for semi-natural ecosystems and a positive
indicator for intensively managed productive systems
The different measurements included in CS in 2007 allow a choice of the variable used to express mineralisable N Total mineralisable N concentrations in soil are re lated to the quantity of the substrate so mineralisable N concentration in soil is most clearly related to organic matter content (Fig 53) The high mineralisable N concentrations in soil in the Lowland Woodland AVC may be explained in that Lowland Woodland tends to occur on mineral soils but could also be the result of increased interception of N pollutants by woodland or alternatively a greater proportion of labile N in woodland plant litter Mineralisable N concentration in organic matter is more directly relevant to underlying processes since the N available per unit carbon reflects the value of the organic matter as a source of N for decomposers Indeed this variable appears to more clearly reflect the overall fertility of habitats with large concentrations in the Arable and Horticulture and Improved Grassland Broad Habitats as well as in Broadleaved Mixed and Yew Woodland This reflects the improved quality of the soil organic matter due to fertilisation tillage and presence of crops with high litter quality and confirms the sensitivity of the assay to known differences in soil nitrogen availability for plants In contrast to mineralisable N concentration in soil there was a clear lower concentration in organic matter on more organic soils which reflects the known increase in N limitation as soils become more organic Thus whilst Broad Habitats such as Bog and Dwarf Shrub Heath are associated with high soil organic matter contents they are generally N-limited as this organic matter contains relatively little net mineralisable N
The stock of mineralisable N (ie the amount in a given volume of soil) also clearly reflected the overall
fertility of habitats Unlike concentrations in soil or in soil organic matter which are more relevant for mineral
and organic soils respectively stock is a measure of mineralisable N within a consistent soil volume This
reflects N availability within the rooting zone and so more closely represents plant -available N across a
variety of habitats
To establish evidence of change in mineralisable N and thus of deposition -driven changes in soil processes likely to affect plant species composition it will be necessary to analyse these data in combination with a range of external datasets such as pollutant load grazing pressure climate drivers which may affect the spatial trends observed This work is ongoing and will be reported in the CS Integrated Assessment report later in 2010
The proportion of nitrate in mineralisable N is known to be affected by aer ation during the incubation The
texture of the soil on fine scales (eg clay silt and sand fractions or degree of humification of organic
matter) and medium scales (eg porosity and aggregation) will affect the diffusion of air into the soil core
Both organic and mineral soils can vary considerably in porosity and hence the increase in nitrate proportion
with decreasing organic matter content cannot be clearly related to soil texture effects Nitrification rates may
also indicate the size of the nitr ifying bacteria population and hence greater nitrate proportions may be
related to a history of elevated N inputs The clear spatial effect on nitrate proportion (Fig 56) implies that
large scale drivers affect nitrate proportion more than soil texture which varies at a smaller scale These
106
Countryside Survey Soils Report from 2007
5 Mineralisable-N
large scale drivers may include climate pollutant load soil pH and N fertiliser application rate which all vary
from NW to SE Britain in ways that are consistent with the spatial pattern of nitrate proportion Fur ther
analyses of nitrate proportion in relation to site-specific total N deposition history loads of pollutant and
fertiliser NOx and NHy and soil and habitat properties will provide more insights into the processes governing
nitrate proportion and will be reported in the Integrated Assessment These analyses will also inform whether
nitrate proportion is of value as a pressure or state indicator
As well as aiding the development of understanding and models of biogeochemical processes the
mineralisable N results will be useful to explain patterns of floristic change Results from the CS in 2007 pilot
study indicate that mineralisable N explains changes in plant species composition (specifically mean
Ellenberg N score) that cannot be explained by bulk soil properties such as total N or CN ratio (Fig 57)
This will considerably reduce uncertainty in model chains used by the UNECE -CCE to predict floristic change
resulting from N deposition The result is consistent with the understanding from soil proc ess ecology that a
large and habitat-specific fraction of the soil N pool is effectively inert with plant N supply being governed by
the turnover of the more labile organic matter pools The nitrate proportion in mineralisable N may also be a
useful predictor of floristic change (Diekmann and Falkengren-Grerup 1998) for example because plants
typical of lower-fertility habitats are not adapted for nitrate uptake
In conclusion the new measurements of mineralisable N provide a wealth of information useful for
developing science and policy around the ecosystem impacts of N pollution The measurements define a
fraction of the soil N pool that is available to be taken up by plants efficiently andor leached and thus
provide a sensitive indicator of N pollution and ecosystem saturation Soils buffer N pollution particularly
when CN ratios are high and there are large stocks of labile C so N pollutant loads cannot be directly
related to impacts relevant to water quality and biodiversity conservation objectives The measurements will
provide test data for biophysical models of soil change and will also allow improved paramet erisation of
models predicting plant species occurrence and biodiversity change Mineralisable N measurements will
decrease uncertainty associated with linking these two classes of models and thus improve predictions of
biodiversity responses to N pollutant load Future analyses will separate out the inherent variability
associated with climate vegetation and soil type to identify spatial patterns which can be linked to
atmospheric deposition and changes in management
55 Policy Implications
The new national scale mineralisable N measurements will allow
Separation of the effects of N pollution on biodiversity and water quality from effects of other drivers
Assessment of the relative impact of N deposition on different soils and habitats
Improved forecasts of changes in water quality and biodiversity in relation to N deposition rate for use in calculating critical loads under the UNECE Convention on Long -Range Transboundary Air Pollution (CLRTAP)
107
Countryside Survey Soils Report from 2007
5 Mineralisable-N
56 References
Bengtson P Falkengren-Grerup U Bengtsson G 2006 Spatial distributions of plants and gross N
transformation rates in a forest soil Journal of Ecology 94 754-764
Braithwaite ME Ellis RW Preston CD 2006 Change in the British Flora 1987-2004 Botanical Society
of the British Isles
Diekmann M Falkengren-Grerup U 1998 A new species index for forest vascular plants development of
functional indices based on mineralization rates of various forms of soil nitrogen Journal of Ecology 86 269-
283
Dyck W Mees C Hodgkiss P 1987 Nitrogen availability and comparison to uptake in two New Zealand
Pinus radiata forests New Zealand Journal of Forest Science 17 338ndash352
Emmett BA Frogbrook ZL Chamberlain PM Griffiths R Pickup R Poskitt J Reynolds B Rowe
E Spurgeon D Rowland P Wilson J Wood CM 2008 CS Technical Report No 307 Soils Manual
NERCCentre for Ecology amp Hydrology 180 pp (CEH Project Number C03259)
Fierer N Schimel J Cates R Zou J 2001 The influence of balsam poplar tannin fractions on carbon
and nitrogen dynamics in Alaskan taiga floodplain soils Soil Biology and Biochemistry 33 1827ndash1839
Keeney DR 1980 Prediction of soil nitrogen availability in forest ecosy stems a review Forest Science
26 159-171
Maskell LC Smart SM Bullock JM Thompson K Stevens CJ 2010 Nitrogen deposition causes
widespread loss of species richness in British habitats Global Change Biology 16 671ndash679
Miller AE Bowman WD 2003 Alpine plants show species-level differences in the uptake of organic and
inorganic nitrogen Plant and Soil 250 283-292
Raison RJ Connell MJ Khanna PK 1987 Methodology for studying fluxes of soil mineral -N in situ
Soil Biology amp Biochemistry 19 521-530
Rowe EC Emmett BA Smart SM Frogbrook ZL in prep A single -extraction mineralisable nitrogen
assay improves predictions of floristic composition Journal of Vegetation Science
SAS Institute 2006 SAS Enterprise Guide 41
Schimel JP Bennett J 2004 Nitrogen mineralization Challenges of a changing paradigm Ecology 85
591-602
UNECE 2004 The condition of forests in Europe 2004 executive report 51 pp
Wamelink GWW Joosten V van Dobben HF Berendse F 2002 Validity of Ellenberg indicator values
judged from physico-chemical field measurements Journal of Vegetation Science 13 269-278
Waring SA Bremner JM 1964 Ammonium production in soil under waterlogged con ditions as an index of
nitrogen availability Nature 104 951-952
108
Countryside Survey Soils Report from 2007
6 Olsen-P
Summary
Mean Olsen-P concentrations in soil (0-15cm) is an index of the fertility of agricultural soils It‟s
use and relevance in semi-natural and organic soils is less certain Soils collected during
Countryside Survey in 1998 and 2007 indicated there had been a significant decrease in Olsen -P
concentrations in soil (0-15cm) in most Broad Habitats or Aggregate Vegetation Classes across
Great Britain and within individual countries
Olsen-P concentrations in soil (0-15cm) decreased significantly in all soil organic matter categories
across Great Britain and within individual countries between 1998 and 2007 apart from humus -
mineral soils in Scotland where no change was observed
The data do not confirm a trend of increasing P status in intensive grasslands or any other habitat
soils (0-15cm) but indicate a loss of available phosphorus between 1998 and 2007 across a wide
range of habitats and soil types This is likely to be linked to the large reductions in phosphorus
fertiliser use over the same period
61 Introduction
Key question Can the trend of increasing P status in intensive grasslands be confirmed and is it matched in
other habitats
Measurements Repeat measurement of Olsen-P concentrations in soils (0-15 cm) from all plots sampled in
1998
Olsen-P (Olsen et al 1954) has been widely used in England and Wales to assess the fertility of agricultural
soils (MAFF 2000) It was also measured as an integral part of several natio nal soil monitoring schemes
including the Representative Soil Sampling Scheme (RSSS Archer et al 2003) the National Soil Inventory
(NSI McGrath and Loveland 1992) the Environmental Change Network (ECN Morecroft et al 2009) and the
Soil Geochemical Atlas of Northern Ireland (Emmett et al 2008) Olsen-P has also been used in conjunction
with the phosphorus sorption index to provide an index of the leaching risk of dissolved P from soils to
freshwaters (Hughes et al 2001) In the UK Olsen-P has been recommended as an indicator for
environmental interactions between the soil and other linked ecosystems such as freshwaters (Black et al
2008)
Olsen-P was measured in soils taken from the 256 bdquosoil squares‟ during CS in 1998 but the samples were not
analysed until 2002 or reported in the Monitoring and Assessing Soil Quality (MASQ) report (Black et al
2000) although they are held on the CS databaseThe data were not included in the Defra funded study
which examined the comparability of soil properties measured by different surveys and monitoring schemes
where it was erroneously reported that total -P was measured in CS in 1998 (Bradley et al 2003)
611 Choice of Olsen-P in 2007
A wide range of extractants have been used to measure the more soluble weakly bound or bdquoavailable‟ forms
of phosphorus in soils Some of the more commonly used extractants include 1 citric acid 25 acetic
acid dilute buffered sulphuric acid (Truog‟s reagent) acetic acid -sodium acetate buffer (Morgan‟s reagent)
and sodium bicarbonate buffered at pH 85 (Olsen-P) There has been a long standing debate as to the most
appropriate measure of soil available-P in relation to soil type Olsen-P has been favoured for limed fertilised
agricultural soils and semi-natural ecosystems on base rich or circum-neutral soils whilst acid extractions are
considered to be more appropriate for the more acidic soils found in many semi -natural and woodland
ecosystems Numerous studies have compared the performance of the different test s with each other with
plant response and with other factors (see eg Allen 1989 Foy et al 1997 and discussion in Emmett et al
109
Countryside Survey Soils Report from 2007
6 Olsen-P
2008) The evidence so far from these and other studies reported in the literature suggests that it is unlikely
that a simple robust relationship can be established between Olsen-P and other extractants A study
comparing Olsen-P data from two different surveys the Representative Soil Sampling Scheme (RSSS) and
the National Soil Inventory (NSI) concluded that where the same analytical method had been used the data
for phosphorus were entirely comparable (Bradley et al 2003)
The literature indicates that no one extractant is ideal for use across the range of soil fertility and pH
gradients encountered in Countryside Survey Thus one option considered for CS in 2007 was to use more
than one extractant with the choice being determined by the characteristics of each soil sample For example
an acid extractant for semi-natural acidic low fertility soils and Olsen-P for more base-rich fertile soils This
would have made the data very hard to interpret particularly in relation to changes since CS in 1998 and for
those soils with bdquointermediate‟ characteristics where the choice of extractant was not clear Furthermore to
maximise the use of pre-existing 1998 data it would be hard to justify using another extractant even though
Olsen-P might not be ideal across the range of soil conditions encountered in Countryside Survey Bearing
these factors in mind the decision was made to measure Olsen-P in 2007
612 Deliverables for 2007
CS in 2007 has provided the following deliverables
Whole GB and country-level assessment of soil available-P status in 2007
GB-level assessment of change in soil available-P status between Countryside Survey in 1998 and
Countryside Survey in 2007
Explanatory data to contribute to the analysis of other Countryside Survey datasets such as those
describing changes in vegetation species and the trophic status of freshwaters
The Olsen-P data collected in 2007 can also contribute to the assessment of Broad and Priority Habitat
condition in relation to soil fertility and the data will provide a baseline assessment for a recommended UK
soil indicator The rationale for including Olsen-P within the Countryside Survey measurement suite is
summarised in Table 61
Table 61 Rationale for measurement Olsen-P
Issue Facts Comments
History in Countryside Survey Olsen-P measured on samples from 256 squares in CS in 1998
Olsen-P used as a measure of available-P
Links and compatibility to other monitoring programmes
NSI and RSSS used Olsen-P as a measure of available-P to the same depth (0-15 cm) as Countryside Survey
Defra project SP0515 concluded that measurements were comparable between NSI and RSSS
Uniqueness of CS There was a partial resurvey of the NSI in 2003 RSSS has data reported to 2001 Soil pH was measured at many ECN sites in 1998 and 2003 Unique combination of soil vegetation amp land use measured together
High interpretative value for i) terrestrial vegetation species change in response to fertility in combination with soil nitrogen ii) trophic status of linked freshwaters
Value for money (Policy priority or interpretative value X cost)
Recommended UK soil indicator for environmental interaction cheap simple measurement High value for money
Measurement will be made on bdquoblack core‟ soil sample used for pH amp LOI core measurements
110
Countryside Survey Soils Report from 2007
6 Olsen-P
So far measures of soil available-P have not been included in models exploring the relationships between
vegetation species change recorded in CS in 1998 and soil nitrogen enrichment through atmospheric nitrogen
deposition However soil-P data are likely to have strong interpretative power in the analysis of model
simulations and predictions
62 Methods
The soil used for phosphorus analysis was taken from the bdquoblack core‟ and there were n o specific sampling
requirements beyond those normally employed for collecting the bdquoblack core‟ sample (See Chapter 1 amp
Emmett et al 2008 Annex 1)
A total of 1054 black cores were collected from the 5 Main Plots in the original 256 ldquosoilrdquo squares Air -dried
and sieved samples (lt2 mm) were analysed for Olsen-P at CEH in Lancaster in the autumn of 2008 following
the standard operating procedure (Emmett et al 2008) This involved extraction of 5 g of air-dried sieved
soil with 100 ml of 05M sodium bicarbonate at pH 85 The phosphorus in the extract was determined
colorimetrically using a continuous flow analyser The analyser method used molybdenum blue at 880nm with
the addition of a dialysis step to overcome the effect of the Olsen‟s reagent
Olsen-P is expressed in mgPkg dry soil Samples collected from 1998 were analysed in 2002 and those
from 2007 in 2008
621 Quality Assurance and Quality Control
The DefraNERCBBSRC Joint Codes of Practice were followed
A number of factors can contribute to errors in the analysis of Olsen -P and steps were taken to minimise
potential artefacts
Effect of drying ndash drying soil affects the release of phosphorus with enhancements of up to 30 possible
from drying at 40 ordmC (Jackson 1958) The effect varies with soil type (Allen 1989) If field moist soil is
used larger quantities are recommended for the extraction (10 g to 100 ml for mineral soil and up to 25 g
to 100 ml for peats Allen 1989) Methodological consistency is very important Since the Olsen -P
measurements made on 1998 soils used air -dried soils the same procedure was used in 2007
Extraction temperature ndash the extraction is temperature sensitive and must be performed under constant
temperature conditions Extraction procedure and conditions were matched to those used for the analysis
of 1998 soils
Soilsolution ratio and extraction time ndash these may affect the amount of phosphorus extracted and a
consistent method should be employed The same standard operating procedure was used in 1998 and
2007
Effect of organic matter ndash the high pH of the Olsen-P extraction means that some organic matter is also
extracted Organic phosphorus is not measured by the molybenum blue method The wavelength used for
the molybdenum blue determination (880 nm) is a long way from any likely interference effects from
extracted humic acids
111
Countryside Survey Soils Report from 2007
6 Olsen-P
A replicate analysis two standard reference soils and one certified reference soil were ana lysed per batch of
25 samples The same standard reference soils were used in the analysis of samples from 1998 and 2007
providing a check on the consistency of the analyses between the two surveys
The results from the standard reference soils are summarised in Fig 61 Fig 62 and Table 62 For SR2
and SR3 the data show the expected variation around the mean value (Fig 61) A simple t-test showed that
the mean value of SR2 in 2008 (146 mgPkg) was significantly higher (plt0001) compared to the mean in
2002 (128 mgP kg) there was no significant difference between the mean values for SR3 Fewer values
outside the limits on the Shewhart charts and smaller coefficients of variation (Table 62) indicate that the
results for both standard reference soi ls were more consistent in 2008 compared to 2002
Figure 61 Shewhart Quality Control charts for CEH standard reference soils SR2 and SR3 analysed
with sample batches from CS in 1998 and 2007
SR3 - QC chartMean 184 mgP kg
-1 limits +- 2SD of mean
0
5
10
15
20
25
30
M11
675
M11
726
M11
735
M11
755
M11
799
M11
807
M11
813
M11
814
M12
269
EF67
1
EE71
6
EE85
2
EE86
0
EF00
1
EF77
0
Analytical batch number
Ols
en
-P m
gP
kg
-1
CS2000 data CS2007 data Mean Upper limit Lower limit
SR2 - QC chartMean 137 mgP kg
-1 limits +- 2SD of mean
0
5
10
15
20
25
30
M11
675
M11
726
M11
735
M11
755
M11
800
M11
808
M11
813
M11
841
M12
174
EF22
1
EE71
4
EE85
0
EE85
8
EE86
6
EF00
7
EF79
4
Analytical batch number
Ols
en
-P m
gP
kg
-1
CS2000 data CS2007 data Mean Upper limit Lower limit
1998
2007
1998
2000
112
Countryside Survey Soils Report from 2007
6 Olsen-P
Table 62 Mean values (mgPkg) and coefficients of variation (CV ) for the standard reference soils
analysed with samples from CS in 1998 and 2007
Standard reference soil SR2 SR3 ISE921
Mean 1998 (CV) 128 (24) 186 (17) 1055 (10)
Mean 2007 (CV) 146 (13) 177 (13) 1208 (2)
The mean and median values for the standard reference soil (Fig 62) are those obtained from data
submitted by all the laboratories participating in the scheme Unfortunately there is a limited stock of this
material at CEH Lancaster so that only four samples were analysed with the 2008 batches The Shewhart
chart (Fig 62) shows some expected variation but 84 of the points lie within the limit values The four
points at the end of the chart were produced during the 2008 analyses and are within the range of results
obtained in 2002 The 2008 mean value is somewhat higher (Table 62) but as only four samples of ISE921
were analysed with the 2008 batches this result must be interpreted with care
Figure 62 Shewhart QC chart for ISE standard reference soil ISE921 analysed with sample batches
from CS in 1998 and Countryside Survey 2007
The duplicate analyses undertaken within sample batches in 2002 and 2008 were very consistent with most
points falling on or close to the 11 line (Fig 63) The mean difference between duplicates was small in 2002
(-01 mgP g) and 2008 (06 mgPkg) Differences between duplicates were larger for samples with high
concentrations of Olsen-P
Taken overall the Quality Control data show strong consistency within and between the measurements made
in 2002 and 2008 and give little cause for concern regarding a comparison of Olsen -P data from 1998 and
2007 There is a suggestion that the results for the standard reference soils were m ore consistent in 2008
with higher mean values The values obtained in 2008 generally fall within the range measured in 2002 and
within acceptable limits on the Shewhart charts
ISE921 - QC chartISE median value 104 mgP kg
-1 Mean 107 mgP kg
-1 limits +- 2SD of mean
60
70
80
90
100
110
120
130
140
M11
678
M11
724R
M11
736
M11
750
M11
755
M11
776
M11
799
M11
802
M11
806
M11
737
M11
814
M11
776R
M11
816
M11
831
M11
867
M12
227
M12
269
EF28
9
EE80
3-4
Analytical batch number
Ols
en
-P
mg
P k
g-1
CS2000 CS2007 Median Mean Upper limit Lower limit1998
2007
113
Countryside Survey Soils Report from 2007
6 Olsen-P
Figure 63 Scatter plot of duplicate Olsen-P analyses from sample batches analysed in 2002 and 2008
622 Reporting
Soil Olsen-P data (0-15 cm) have been analysed to provide information on the state of Olsen -P in 2007 and
the change since 1998 The statistical approach used for analysing the data fo r change involved
bootstrapping which allows for non-normality in the data without the necessity of knowing details of the actual
distribution As such it provides a more accurate measurement of significance Annex F of Emmett et al
(2008) provides a background document describing this approach
The data in this report describe mean Olsen-P concentrations in soils (0-15 cm) in 2007 and change since
1998 by Broad Habitat Aggregate Vegetation Class (AVC) and Loss-on-Ignition (LOI) category LOI classes
are defined as mineral (0-44 g C kg-1
) humus-mineral (44-165 g C kg-1
) organo-mineral (165-330 g C kg-1
)
and organic (gt 330 g C kg-1
) To remove the effects of large-scale vegetation and or land use change mean
Olsen-P concentrations have also been estimated for plots where the AVC has not changed over time The
AVC is only known for the survey years and may change during intervening periods for example due to
arable-grassland rotation The plots where the AVC has not changed can be regarded as plots wh ere the
vegetation has been largely consistent in 1978 1998 and 2007
The soil Olsen-P concentrations were mapped using indicator kriging to interpolate between the Countryside
Survey sample points The use of indicator kriging rather than ordinary krig ing and spatial interpolation
arises because of the type of data being analyzed In the case of Olsen -P the assumption of connectivity
between sample points with extreme values in space is not valid For instance fertilizer applications in one
location may have no spatial link to those in another As a result ordinary kriging incorporating these
extreme values provides erroneous interpolation biased towards these extreme values Indicator kriging
provides a method of spatially interpreting the underlying patterns in the data without such a bias
interpolating the probability that the data falls above or below a given threshold Semi -variogram analysis
revealed a low level of spatial structure strongest at the threshold level of 18mgkg Full indicator k riging
0
40
80
120
160
200
0 40 80 120 160 200
Duplicate 1 Olsen-P mgP kg-1
Du
plicate
2 O
lsen
-P m
gP
kg
-1
CS2000 CS2007 1 1 line 1998
2007
114
Countryside Survey Soils Report from 2007
6 Olsen-P
was used to interpolate the probability of exceeding this threshold A probability of 1 or above indicates that
the data exceeds the specified threshold value at that location Data was interpolated onto a 1 km UK grid
63 Results
631 Structure of Olsen-P data
Olsen-P was measured in samples from 1068 plots in 2007 of which 65 were also sampled in 1998
Concentrations of Olsen-P measured in soils (0-15 cm) in 2007 ranged between 2 and 380 mgPkg Between
1998 and 2007 the proportion of samples containing 40 mgPkg Olsen-P or less increased from 64 to 76
whilst the proportion samples with greater than 80 mgPkg decreased from 12 to 75 Overall there was
evidence of a downward shift in Olsen-P concentrations across the entire range of values between 1998 and
2007 (Fig 64) The population of values in 1998 and 2007 was highly skewed There were no clear
relationships between change in Olsen-P concentration and 2007 values for soil pH LOI moisture content or
change in soil pH and LOI between 1998 and 2007
632 Change in mean Olsen-P concentration in soils (0-15cm) across Great Britain
The mean Olsen-P concentration in soil (0-15cm) across all Broad Habitat types in Great Britain decreased
from 43 mgPkg to 32 mgPkg or by 26 between 1998 and 2007 (Table 63a) This change was evident in
all individual Broad Habitats except Bracken (Fig 65) The magnitude of change varied between Broad
Habitats with the smallest significant decrease (11) measured in Arable which also had the hig hest mean
concentration of Olsen-P in 2007 (44 mgPkg) The biggest percentage decrease between the surveys (58)
occurred in Dwarf Shrub Heath which also contained the highest mean concentration of Olsen -P (56 mgPkg)
in 1998 The lowest mean concentration of Olsen-P (13 mgPkg) which did not change significantly between
surveys was measured in soils (0-15cm) beneath Bracken
There was a significant decrease in mean Olsen-P concentration between 1998 and 2007 across all AVCs
except for Lowland Woodland (Table 63b) The largest percentage decrease in mean values (51) was
observed in Moorland Grass Mosaics Heath and Bog had the highest mean concentration of Olsen -P in 1998
(52 mgPkg) Crops and Weeds showed the smallest percentage change between surve ys in Olsen-P (11)
this AVC had the highest mean Olsen-P concentration in 2007 (44 mgPkg)
115
Countryside Survey Soils Report from 2007
6 Olsen-P
Figure 64 Distribution of soil Olsen-P (0-15 cm) measurements a) Histogram for 1998 and 2007 b)
Cumulative frequency for 1998 and 2007 Histogram frequencies normalised to percentage of total
number of samples analysed in each survey
0
10
20
30
0 40 80 120 160 200 240 280 320 360
Olsen-P mgPkg
Fre
qu
en
cy
1998 2007
a)
0
25
50
75
100
0 50 100 150 200 250 300 350 400
Olsen-P mgPkg
Cu
mu
lati
ve f
req
ue
nc
y
1998 2007
b)
116
Countryside Survey Soils Report from 2007
6 Olsen-P
Table 63 Change in mean Olsen-P concentration of soils (0-15 cm) across Great Britain for a) Broad
Habitats b) Aggregate Vegetation Classes (AVC) c) AVCs unchanged since 1978 and d) LOI
categories Arrows denote a significant change (plt005) in the direction shown
a) Great Britain - Broad Habitat
Broad Habitats
Mean Olsen-P (mgPkg) Direction of significant
changes
1998 2007 1998 - 2007
Broadleaved Mixed and
Yew Woodland
404 238
Coniferous Woodland 364 274
Arable and Horticulture 496 442
Improved Grassland 405 329
Neutral Grassland 306 245
Acid Grassland 464 211
Bracken 173 130
Dwarf Shrub Heath 560 236
Fen Marsh Swamp 275 194
Bog 533 384
All Habitat Types 428 318
b) Great Britain ndash AVC whole dataset
Aggregate Vegetation
Class
Mean Olsen-P (mgPkg) Direction of significant
changes
1998 2007 1998 - 2007
Upland Woodland 296 182
Lowland Woodland 247 295
Fertile Grassland 426 335
Infertile Grassland 301 210
Moorland Grass Mosaic 495 242
Heath and Bog 521 333
Tall Grass and Herb 449 322
Crops and Weeds 494 442
) Great Britain ndash AVC unchanged
Aggregate Vegetation
Class
Mean Olsen-P (mgPkg) Direction of significant
changes
1998 2007 1998 - 2007
Upland Woodland 319 183
Lowland Woodland 206 270
Fertile Grassland 438 347
Infertile Grassland 261 173
Moorland Grass Mosaic 590 267
Heath and Bog 471 318
Tall Grass and Herb 424 294
Crops and Weeds 499 438
117
Countryside Survey Soils Report from 2007
6 Olsen-P
d) Great Britain ndash Loss on Ignition Category
LOI Category () Mean Olsen-P (mgPkg) Direction of significant
changes
1998 2007 1998 - 2007
Mineral (0-8) 405 339
Humus-mineral (8-30) 329 241
Organo-mineral (30-60) 409 194
Organic (60-100) 630 441
The mean Olsen-P concentrations in soils (0-15 cm) for plots in which the AVC did not change (Table 63c)
were broadly consistent with the dataset as a whole (Table 63b) The exception was Tall Grass and Herb
where no significant change in mean Olsen-P was observed for plots with consistent AVCs between surveys
(Table 64b) This suggests that some of the change in Olsen-P observed for this AVC in the dataset as a
whole may have arisen because of a change in land use between the surveys
Figure 65 Change in mean Olsen-P concentration within Broad Habitats in Great Britain between
1998 and 2007
-60
-40
-20
0
20
Bro
adle
aved
Woodla
nd
Conife
rous
Woodla
nd
Ara
ble
Impro
ved G
rass
Neu
tral
Gra
ss
Aci
d Gra
ss
Bra
cken
Dwar
f Shru
b Hea
th
Fen M
arsh
Swam
p
Bog
Ch
an
ge
in
Ols
en
-P (
mg
kg
)
Mean Olsen-P concentrations decreased significantly across all LOI categories (Table 63d) with the largest
change observed in organo-mineral soils where mean Olsen-P declined by nearly 50 In both surveys the
highest mean Olsen-P concentrations were observed in organic soils reflecting the high mean concentrations
measured in Broad Habitats and AVCs with organic -rich soils (Dwarf Shrub Heath and Bog Broad Habitats
Moorland Grass Mosaic and Heath and Bog AVCs
632 Change in mean Olsen-P concentration in soils (0-15cm) across England
Olsen-P was measured only on the Main Plots within the original 256 squares sampled in 1978 giving a
maximum potential sample number of 1281 of which 1068 were sampled in 2007 and 943 in 1998 For this
reason sample numbers decline rapidly in country-level data analysis A minimum cut-off of 20 samples was
applied for country-level analysis of Olsen-P by Broad Habitat AVC and LOI Category As a result there are
several gaps in the analysis missing values in the tables are signifi ed by a diagonal line across the cell
118
Countryside Survey Soils Report from 2007
6 Olsen-P
There was a significant (16) decrease in mean Olsen-P for the All Broad Habitats category in England
between 1998 and 2007 (Table 64) this was the smallest overall change observed amongst the three
countries Arable soils (0-15 cm) contained the highest mean concentrations of Olsen-P in England 1998
(454 mgPkg) and 2007 (418 mgPkg) and there was a small (8) but significant decrease between the two
surveys Mean Olsen-P concentrations in soils (0-15 cm) beneath Improved Grassland and Neutral Grassland
in England were very similar in 2007 (asymp 26 mgPkg) following significant decreases from levels observed in
1998 (Table 64)
Table 64 Change in mean Olsen-P concentration of soils (0-15 cm) across England for a) Broad
Habitats b) Aggregate Vegetation Classes (AVC) c) AVCs unchanged since 1978 and d) LOI
categories Arrows denote a significant change (plt005) in the direction shown Diagonal line
indicates too few samples to provide reliable value
a) England - Broad Habitat
Broad Habitats
Mean Olsen-P (mgPkg) Direction of significant
changes
1998 2007 1998 - 2007
Broadleaved Mixed and
Yew Woodland
338 269
Coniferous Woodland
Arable and Horticulture 454 418
Improved Grassland 332 260
Neutral Grassland 347 263
Acid Grassland 412
Bracken
Dwarf Shrub Heath
Fen Marsh Swamp
Bog
All Habitat Types 396 332
b) England ndash AVC whole dataset
Aggregate Vegetation
Class
Mean Olsen-P (mgPkg) Direction of significant
changes
1998 2007 1998 - 2007
Upland Woodland
Lowland Woodland 248 272
Fertile Grassland 403 320
Infertile Grassland 273 171
Moorland Grass Mosaic
Heath and Bog
Tall Grass and Herb 423 330
Crops and Weeds 454 413
119
Countryside Survey Soils Report from 2007
6 Olsen-P
c) England ndash AVC unchanged
Aggregate Vegetation
Class
Mean Olsen-P (mgPkg) Direction of significant
changes
1998 2007 1998 - 2007
Upland Woodland
Lowland Woodland
Fertile Grassland 401 323
Infertile Grassland 262 156
Moorland Grass Mosaic
Heath and Bog
Tall Grass and Herb
Crops and Weeds 472 427
d) England ndash Loss on Ignition Category
LOI Category () Mean Olsen-P (mgPkg) Direction of significant
changes
1998 2007 1998 - 2007
Mineral (0-8) 394 342
Humus-mineral (8-30) 346 244
Organo-mineral (30-60) 360 239
Organic (60-100)
There were insufficient samples in 2007 in the Acid Grassland Broad Habitat to make a valid estimate of the
mean No significant change was observed in mean Olsen-P beneath Broadleaved Mixed and Yew Woodland
Broad Habitat in England between 1998 and 2007
There were significant decreases in mean Olsen-P in the Fertile Grassland and Infertile Grassland AVCs in
England between 1998 and 2007 (Table 64b) Of the AVCs with sufficient data to provide a valid estimate of
the mean the highest mean concentrations in 1998 and 2007 were observed in Crops and Weeds
Restricting the analysis to plots where AVC remained unchanged resulted in only three AVCs having
sufficient samples for statistically valid estimates of the mean (Table 64c) Mean values for Infertile
Grassland Fertile Grassland and Crops and Weeds for the unchanged dataset were very similar to those for
the dataset as a whole There were significant decreases in mean Olsen -P in Infertile Grassland and Crops
and Weeds between 1998 and 2007 in the unchanged dataset
Mean Olsen-P decreased significantly in all three LOI categories in England between 1998 and 2007 (Table
64d) The smallest change (13) was observed in mineral soils and the largest in organo-mineral soils
(39) As a result in 2007 humus-mineral and organo-mineral soils had virtually the same mean Olsen-P
concentrations (asymp 24 mgPkg) which were approximately 10 mgPkg less than for mineral soils This
represented an increase in the relative difference in mean Olsen -P between mineral soils and the other
categories compared to 1998
633 Change in mean Olsen-P concentration in soils (0-15cm) across Scotland
In 1998 and 2007 Arable and Horticulture (69 mgPkg and 52 mgPkg) and Improved Grassland (59 mgPkg
and 56 mgPkg) Broad Habitats in Scotland had the highest mean Olsen -P concentrations amongst the three
countries There was a 25 decrease in mean Olsen-P in Scottish Arable soils (0-15 cm) between 1998 and
2007 but no significant change was observed for Improved Grassland (Table 65a) There was a significant
120
Countryside Survey Soils Report from 2007
6 Olsen-P
decrease in mean Olsen-P in semi-natural grassland Broad Habitats in Scotland Scottish Broadleaf
Woodland soils (0-15 cm) had a much higher mean Olsen-P value (51 mgPkg) in 1998 compared to England
(34 mgPkg) but too few samples were taken to provide a reliable estimate of the mean for Scotland in 2007
Upland Woodland Infertile Grassland Moorland Grass Mosaic and Heath and Bog AVCs in Scotland all
showed a significant decrease in mean Olsen-P concentration between 1998 and 2007 (Table 65b) There
were no significant changes in Fertile Grassland or Crops and Weeds The latter contained the largest mean
concentration of Olsen-P in 2007 (50 mgPkg) and AVCs in Scotland were more enriched in Olsen -P
compared to the equivalents in England and Wales Restricting the analysis to unchanged AVCs removed th e
Upland Woodland AVC but for other AVCs results were consistent with those for the dataset as a whole
(Table 65c)
Table 65 Change in mean Olsen-P concentration of soils (0-15 cm) across Scotland for a) Broad
Habitats b) Aggregate Vegetation Classes (AVC) c) AVCs unchanged since 1978 and d) LOI
categories Arrows denote a significant change (plt005) in the direction shown Diagonal line
indicates too few samples to provide reliable value
a) Scotland - Broad Habitat
Broad Habitats
Mean Olsen-P (mgPkg) Direction of significant
changes
1998 2007 1998 - 2007
Broadleaved Mixed and
Yew Woodland
509
Coniferous Woodland 399 295
Arable and Horticulture 689 516
Improved Grassland 591 562
Neutral Grassland 284 249
Acid Grassland 486 215
Bracken
Dwarf Shrub Heath 646 249
Fen Marsh Swamp
Bog 544 365
All Habitat Types 491 328
b) Scotland ndash AVC whole dataset
Aggregate Vegetation
Class
Mean Olsen-P (mgPkg) Direction of significant
changes
1998 2007 1998 - 2007
All Woodland
Upland Woodland 290 219
Lowland Woodland
Fertile Grassland 485 404
Infertile Grassland 362 318
Moorland Grass Mosaic 533 228
Heath and Bog 548 339
Tall Grass and Herb
Crops and Weeds 609 495
121
Countryside Survey Soils Report from 2007
6 Olsen-P
c) Scotland ndash AVC unchanged
Aggregate Vegetation
Class
Mean Olsen-P (mgPkg) Direction of significant
changes
1998 2007 1998 - 2007
All Woodland
Upland Woodland
Lowland Woodland
Fertile Grassland 482 422
Infertile Grassland 302 240
Moorland Grass Mosaic 656 289
Heath and Bog 463 295
Tall Grass and Herb
Crops and Weeds
d) Scotland ndash Loss on Ignition Category
LOI Category () Mean Olsen-P (mgPkg) Direction of significant
changes
1998 2007 1998 - 2007
Mineral (0-8) 477 383
Humus-mineral (8-30) 315 262
Organo-mineral (30-60) 442 181
Organic (60-100) 616 406
The mean Olsen-P concentration in Scottish mineral soils decreased significantly between 1998 and 2007
but there was no significant change observed for humus-mineral soils (Table 65d) Organic soils in Scotland
had a very high mean Olsen-P concentration in 1998 (62 mgPkg) which decreased significantly in 2007 to 41
mgPkg Mean Olsen-P concentrations in organo-mineral soils decreased significantly by more than 60
between 1998 and 2007
634 Change in mean Olsen-P concentration in soils (0-15cm) across Wales
The small number of samples from Wales placed a major restriction on data analysis with only four reporting
categories having sufficient data to provide valid statistics for status and change in Olsen -P (Table 66) The
largest percentage change (41) in the All Broad Habitats category was observed in Wales between 1998
and 2007 reflecting the large significant decrease (47) in mean Olsen-P in the Improved Grassland Broad
Habitat Much of the Improved Grassland in Wales is located on humus -mineral soils which largely accounts
for the significant decrease in Olsen-P between 1998 and 2007 Infertile Grassland was the only AVC in
Wales to have sufficient sample points to provide valid statistics for stock and change (Tables 66b and
66c) Mean concentrations of Olsen-P in this AVC decreased significantly between 1998 and 2007 with or
without changed AVC
122
Countryside Survey Soils Report from 2007
6 Olsen-P
Table 66 Change in mean Olsen-P concentration of soils (0-15 cm) across Wales for a) Broad
Habitats b) Aggregate Vegetation Classes (AVC) c) AVCs unchanged since 1978 and d) LOI
categories Arrows denote a significant change (plt005) in the direction shown Diagonal line
indicates too few samples to provide reliable value
a) Wales - Broad Habitat
Broad Habitats
Mean Olsen-P (mgPkg) Direction of significant
changes
1998 2007 1998 - 2007
Broadleaved Mixed and
Yew Woodland
Coniferous Woodland
Arable and Horticulture
Improved Grassland 408 215
Neutral Grassland
Acid Grassland
Bracken
Dwarf Shrub Heath
Fen Marsh Swamp
Bog
All Habitat Types 323 189
b) Wales ndash AVC whole dataset
Aggregate Vegetation
Class
Mean Olsen-P (mgPkg) Direction of significant
changes
1998 2007 1998 - 2007
Upland Woodland
Lowland Woodland
Fertile Grassland
Infertile Grassland 214 143
Moorland Grass Mosaic
Heath and Bog
Tall Grass and Herb
Crops and Weeds
c) Wales ndash AVC unchanged
Aggregate Vegetation
Class
Mean Olsen-P (mgPkg) Direction of significant
changes
1998 2007 1998 - 2007
Upland Woodland
Lowland Woodland
Fertile Grassland
Infertile Grassland 183 116
Moorland Grass Mosaic
Heath and Bog
Tall Grass and Herb
Crops and Weeds
123
Countryside Survey Soils Report from 2007
6 Olsen-P
d) Wales ndash Loss on Ignition Category
LOI Category () Mean Olsen-P (mgPkg) Direction of significant
changes
1998 2007 1998 - 2007
Mineral (0-8)
Humus-mineral (8-30) 309 174
Organo-mineral (30-60)
Organic (60-100)
64 Discussion and Policy Implications
The results from Countryside Survey in 2007 show a significant decrease between 1998 and 2007 in mean
Olsen-P concentrations in soils (0-15 cm) for most Broad Habitats AVCs and LOI categories across Great
Britain Mean Olsen-P has remained unchanged in a few Broad Habitats and AVCs but no increases in mean
Olsen-P have been observed Changes in mean Olsen-P concentrations in Broad Habitats within individual
countries between 1998 and 2007 reflect this pattern
These results raise the question as to whether the changes observed between 1998 and 2007 are real or an
artefact of field sampling and chemical analysis and whether the Countryside Survey data are consistent with
those from other monitoring schemes It is difficult to compare with results from other surveys due to the
common use of mgl for monitoring agricultural soils compared to mgkg in CS
The same sampling protocol was used in 1998 and 2007 but two important potential sou rces of sampling
variability can be identified The first of these arises because of the strong vertical gradient in Olsen-P
concentration encountered in many soils under different vegetation types (see for example Table 67 and
Fig 66) The highest Olsen-P concentrations are generally encountered in the surface soil layers (0 -5 cm)
which must be sampled consistently in repeat surveys if change is to be assessed accurately A consistent
failure to identify and sample the true soil surface layer could sig nificantly bias results between surveys
Table 67 Vertical distribution of Olsen-P (mgPkg) in a) brown earth soil beneath neutral grassland at
the Snowdon ECN site and b) stagnogley soil beneath improved grassland at Pontbren
Snowdon ECN site Pontbren (CEH unpublished data)
Olsen-P mgPkg Olsen-P mgPkg
Depth cm Mean Std Dev Depth cm Mean Std Dev
0-5 274 223 2-5 234 40
5-10 163 112 5-15 104 25
10-20 78 25 15-30 56 26
20-30 53 10 30-60 33 16
124
Countryside Survey Soils Report from 2007
6 Olsen-P
Figure 66 Vertical distribution of Olsen-P (mgPkg) in three blocks of farm woodland on stagnogley
soils at Pontbren (CEH unpublished data)
A second source of error which affects all analytes arises because re -sampling in each Main Plot does not
occur at exactly the same spot The cores in 1998 and 2007 were taken from points located 2 -3 m apart from
permanently marked locations (Chapter 1) This will introduce random variability into the data due to small
scale heterogeneity in soil properties alongside any surveyor error in re-locating the plots The size of the
effect is unknown but is unlikely to have caused systematic bias between the surveys and there is
significantly less potential for relocation error in CS relative to NSI where no permanen t markers are used
The quality of the chemical analyses for 1998 and 2007 has been discussed in Section 621 Taken overall
the Quality Control data show strong consistency within and between the measurements made in 2002 and
2008 and give little cause for concern regarding a comparison of Olsen-P data from 1998 and 2007
Countryside Survey Olsen-P data are broadly consistent with results from other surveys and monitoring sites
(Tables 68 and 69) Fixed depth sampling at the ECN sites does not include 0-15 cm depth but the data
broadly confirm values measured by Countryside Survey The ECN data further illustrate the strong vertical
gradient in Olsen-P concentrations across a range of land use and habitat types
Table 68 Olsen-P concentrations measured in Arable and Improved Grassland in the National Soil
Inventory in 1980 and 1996 from Bradley et al (2003)
Broad Habitat Olsen-P mgPkg
NSI 1980 (0-15 cm)
Olsen-P mgPkg
NSI 1996 (0-15 cm)
Arable 330 428
Improved
Grassland
227 229
00 100 200 300 400 500
2-5
5-15
15-30
30-60
60-90
De
pth
be
low
su
rfa
ce
(c
m)
Olsen-P (mgPkg)
Cae Draens Tyn-y-Fron Pant Powsi
125
Countryside Survey Soils Report from 2007
6 Olsen-P
Table 610 Olsen-P concentrations measured at two depths in soils at selected Environmental Change
Network sites Samples were not collected at 0-15 cm depth at the ECN sites
ECN site name Land use Olsen-P mgPkg
0-5 cm depth
Olsen-P mgPkg
5-10 cm depth
Drayton Permanent pasture 937 416
North Wyke Permanent pasture 673 357
Snowdon Upland grassland 274 163
Wytham Deciduous woodland 227 114
Alice Holt Oak woodland 135 65
Figure 67 Map of probability of 2007 Olsen-P concentration being greater than 18 mgPkg Probability
scale between zero and one
Analysis of the 2007 Olsen-P data revealed very little spatial structure which is reflected in the map which
predicts the probability on exceeding the threshold o f 18mgPkg on a scale from zero to one a value of one
indicating the threshold has been exceeded (Fig 67) Visual inspection of the mapped data for Olsen-P from
the NSI (McGrath and Loveland 1992) showed a broad separation in Olsen -P concentrations between areas
of managed agricultural land in central southern and eastern England and those under semi -natural
vegetation and forest mainly in the north and west Within the areas of managed land there was a wide range
of concentrations with large differences in values between adjacent NSI mapping units Probability maps for
Olsen-P from the RSSS (Baxter et al 2006) show some limited correspondence between the map for the
2001 RSSS data and Countryside Survey It is important to remember the differences in sampling strategy
and survey design when comparing the data from these three surveys but it is generally apparent that there
are no strong spatial patterns in Olsen-P concentrations
126
Countryside Survey Soils Report from 2007
6 Olsen-P
Assuming that the Countryside Survey data from 1998 and 2007 provide va lid estimates of Olsen-P across
Great Britain a number of hypotheses can be invoked to account for the decrease observed over the nine
year period These are briefly discussed below as detailed exploration is beyond the scope of this Report
Reduction in external inputs of phosphorus- Data on fertiliser use compiled as a core indicator
under the Defra Sustainable Farming and Food Strategy showed a 53 decline in the total use of phosphate
fertiliser between 1984 and 2007 in England Across Great Britain application rates of phosphate (P2O5) to
tillage crops decreased from 51 kgha to 32 kgha and to grass from 21 kgha to 14 kgha between 1998 and
2007 (BSFP 2008) The figures for 2007 correspond to the lowest application rates since statistics were firs t
compiled in 1983 and presumably reflect changes in agricultural management in response to environmental
and economic pressures (Baxter et al 2006)
Taking England as an example combining application rates with agricultural land area data from the Jun e
Agricultural Survey showed a large decline in phosphate use Total application of phosphate in England in
2007 was 123 kT P2O5 to tilled land and 48 kT to grassland compared with 209 kT and 72 kT respectively for
1998 Soil phosphorus status in enclosed agricultural land will also be influenced by more subtle changes in
crop and livestock management and by changes in the type of fertiliser used Oliver et al (2006) commenting
on the decrease in Olsen-P observed in the RSSS between 1971 and 2001 attribu ted the decline to a steady
reduction in phosphorus fertiliser inputs but also noted that for grassland there had been a progressive shift
away from insoluble forms of phosphorus fertiliser such as rock phosphate to more water soluble materials
Deeper ploughing will also bring subsoil with a relatively low phosphorus status to the surface This would
dilute the existing topsoil phosphorus stock unless fertiliser was added
The amount of phosphorus deposited annually across Great Britain from the atmospher e is poorly quantified
with a recent estimate for the United Kingdom of 03 kgPhayr (White 2006) Phosphorus concentrations in
rain are low and the main vector is dry deposition of dust As far as can be ascertained there are no data to
describe trends in atmospheric phosphorus inputs to Great Britain over time Use of clean -up technology for
sulphur emissions from coal burning may have led to a decline in phosphorus emissions with a knock on
effect on atmospheric deposition A reduction in mineral ferti liser use would also reduce the amount of
particulate phosphorus in the atmosphere derived from re-suspended soil The quantities of phosphorus
deposited on semi-natural systems are likely to be relatively small but there is little information as to how
they compare to inputs from sources such as mineral weathering
Effect of atmospheric nitrogen deposition- A number of studies have reported that non-
agricultural ecosystems in Great Britain could be moving towards phosphorus limitation in response to
increased availability of nitrogen from atmospheric deposition In moorland vegetation high foliar NP ratios
have been correlated positively with nitrogen deposition (Kirkham 2001) On the Carneddau in Wales
montane heath vegetation had relatively high foliar NP ratios compared with similar systems receiving less
atmospheric nitrogen deposition in Scotland (Britton et al 2005) Both studies have been cited as examples
of potential phosphorus limitation In contrast Rowe et al (2007) reported that foliar NP ratios in Calluna
collected during 1998 decreased with nitrogen deposition They suggested that enzyme production or
mycorrizal activity may have allowed Calluna to access additional soil phosphorus resources In upland
plantation Sitka spruce forests root bioassay techniques have shown increased phosphorus demand in older
crops where excess nitrogen was leached as nitrate in soil and stream waters (Harrison et al 1995) The
authors inferred that supplies of available phosphorus in soils may have lim ited the ability of older trees to
utilise incoming atmospheric nitrogen Phosphorus deficiency has also been reported in Dutch forests
receiving large amounts of nitrogen deposition probably because of soil acidification (Mohren et al 1986)
The overall implication of these studies is that sustained levels of atmospheric nitrogen deposition may have
increased plant demand on soil phosphorus resources In the soil this may have decreased the size of the
labile phosphorus pool (as measured by Olsen-P) at a time when external sources of phosphorus may also
have declined
127
Countryside Survey Soils Report from 2007
6 Olsen-P
Effects of pH change on phosphorus binding capacity in soils ndash The chemistry of
phosphorus in soils is complex and pH dependent through a number of processes related to the clay mineral
content and presence of sesquioxides and exchangeable aluminium in the soil In fertilised alkaline soils or
calcareous soils phosphorus availability is greatest between pH 6 and pH 7 As pH in these soils increases
above about pH 65 phosphate solubility decreases rapidly with the formation of insoluble calcium salts
which contribute to the unavailable or non-labile soil phosphorus pool In acid mineral soils phosphate ions
combine readily with iron and aluminium to form insoluble compounds whilst fixati on by hydrous iron and
aluminium oxides and clay minerals can sequester large amounts of phosphorus As pH increases so does
the solubility of basic iron and aluminium phosphates (solubility minima between pH 3 and 4) and some of the
fixed phosphorus will also be released resulting in a maximum pool of readily available phosphorus at soil
pH values between 6 and 65 (Brady 1974)
Soil pH increased significantly across many Broad Habitats AVCs and soil LOI categories between 1998 and
2007 In the Broad Habitats and AVCs representative of managed agricultural land mean soil pH across
Great Britain was well above pH 6 and was over pH 7 in the Arable and Horticultural Broad Habitat and Crops
and Weeds AVC in 2007 If calcium was abundant in these soils th e high pH values would favour the
formation of insoluble salts and may reduce the pool of more labile phosphorus In many of the Broad
Habitats and AVCs which would typically have more acid mineral soils (eg Acid Grassland Broad Habitat
Moorland Grass Mosaic AVC) soil pH did not increase significantly between 1998 and 2007 and mean
values were typically around pH 45 In this pH range the relatively available pool of soil phosphorus would
still be small compared with that fixed by hydrous oxides of ir on and aluminium or held in precipitates
Sustained atmospheric nitrogen deposition may have increased plant demand on this pool particularly in
systems where grazing or other forms of biomass harvesting result in nutrient removal from the site
65 References
Allen SE (ed) 1989 Chemical analysis of ecological materials Blackwell Scientific Publications Oxford
368 pp
Archer J Oliver M and Baxter S 2003 Review of the Representative Soil Sampling Scheme (RSSS) Final
report to Defra John Archer Consulting and Department of Soil Science University of Reading
Baxter SJ Oliver MA and Archer JR 2006 The Representative Soil Sampling Scheme of England and
Wales the spatial variation of topsoil nutrient status and pH between 1971 and 2001 Soil Use and
Management 22 383-392
Black HIJ et al 2000 MASQ Monitoring and assessing soil quality in Great Britain Countryside Survey
Module 6 Soils and Pollution RampD technical Report E1-063TR Environment Agency Bristol
Black H Bellamy P Creamer R Elston D Emmett B Frogbrook Z Hudson G Jordan C Lark M
Lilly A Marchant B Plum S Potts J Reynolds B Thompson R and Booth P 2008 Design and
operation of a UK soil monitoring network Contract Report Environmental Agency ISBN 978-1-84432-936-
6
Bradley RI Bellamy PH Loveland PJ Black HIJ Hornung M Scott A Lane A Webb J
Jackson DR 2003 Comparability of soil properties derived from different data sources Defra project code
SP0515
Brady NC 1974 The Nature and Properties of Soils 8th
Edition Macmillan Publishing New York
Britton AJ Pearce ISK and Jones B 2005 Impacts of grazing on montane heath vegetation in Wales
and implications for the restoration of montane areas Biological Conservation 125 515-524
BSFP 2008 The British Survey of Fertiliser Practice Report for 2008 wwwdefragovuk
128
Countryside Survey Soils Report from 2007
6 Olsen-P
Emmett BA Black HIJ Bradley RI Elston D Reynolds B Creamer R Frogbrook ZL Hudson G
Jordan C Lilly A Moffat A Potts J Vanguelova E 2006 National soil monitoring network Review and
assessment study Final Report Project LQ09 SNIFFER Edinburgh
Emmett BA Frogbrook ZL Chamberlain PM Griffiths R Pickup R Poskitt J Reynolds B Rowe
E Spurgeon D Rowland P Wilson J Wood CM 2008 CS Technical Report No 307 Soils Manual
NERCCentre for Ecology amp Hydrology 180 pp (CEH Project Number C03259)
Foy RH Tunney H Carroll MJ Byrne E Gately T Bailey JS Lennox SD 1997 A comparison of
Olsen and Morgan soil phosphorus test results from the cross -border region of Ireland Irish Journal of
Agricultural and Food Research 36 185-193
Harrison AF Stevens PA Dighton J Quarmby C Dickinson AL Jopnes HE Howard DM 1995
The critical load of nitrogen for Sitka spruce forests on stagnopodsols in Wales Role of nutrient limitations
Forest Ecology and Management 76 139-148
Hughes S Reynolds B Bell SA Gardner C 2000 Simple phosphorus saturation index to estimate risk
of dissolved P in runoff from arable soils Soil Use and Management 16 206-210
Jackson ML 1958 Soil Chemical Analysis Prentice Hall London
Kirkham FW 2001 Nitrogen uptake and nutrient limitation in six hill moorland species in relation to
atmospheric nitrogen deposition in England and Wales Journal of Ecology 89 1041-1053
MAFF 2000 Fertilser recommendations for agricultural and horticultu ral crops (RB209) Seventh Edition The
Stationery Office 177pp
McGrath SP Loveland PJ 1992 The Soil Geochemical Atlas of England and Wales Blackie Academic
and Professional
Mohren GMJ van den Berg J Burger FW 1986 Phosphorus defic iency induced by nitrogen input in
Douglas fir in the Netherlands Plant and Soil 95 191-200
Morecroft MD Bealey CE Beaumont DA Benham S Brooks DR Burt TP Critchley CNR Dick
J Littlewood NA Monteith DT Scott WA Smith RI Walmsley C Watson H The UK Environmental
Change Network Emerging trends in the composition of plant and animal communities and the physical
environment Biological Conservation 142 2814-2832
Oliver MA Archer JR Baxter SJ Todd AD Skinner RJ 2006 The Representative Soil Sampling
Scheme of England and Wales a statistical analysis of topsoil nutrient status and pH between 1971 and
2001 Soil Use and Management 22 372-382
Olsen SR Cole CV Watanabe FS Dean LA 1954 Estimation of available phosphorus in soils by
extraction with sodium bicarbonate United States Department of Agriculture Washington DC Circular No
939 19pp
Rowe EC Smart SM Kennedy VH Emmett BA Evans CD 2008 Nitrogen deposition increases the
acquisition of phosphorus and potassium by heather Calluna Vulgaris Environmental Pollution 155 201-207
White RE 2006 Principles and Practice of Soil Science Fourth Edition Blackwell Publishing Oxford
129
Countryside Survey Soils Report from 2007
7 Soil metal concentrations
Summary
A comparison of back corrected Countryside Survey soils (0-15cm) analyses for 1998 and 2007
samples indicated that as would be expected only relative small changes in soil trace metal
concentrations occurred between surveys despite reported declines in atmospheric deposition due
to the long residence time of metals in soils
Of seven metals for which repeat measurement were made during the 2007 survey only for one Cu
was a statistically significant difference in soil (0-15cm) concentrations (an increase) found at the
GB level
When the data for repeat metal measurements were stratified by Broad Habitat Aggregate
Vegetation Class and soil organic matter category further statistically significant differences were
seen For Cu generally significant increases were observed whilst for two metals Cd and Pb
changes were small and idiosyncratic between stratifications For three metals Cr Ni Zn changes
were generally characterised by reduction in crop lands and no change or slight increases in less
managed habitats
For some metals such as Cu and Cd it is l ikely that additional sources (animal manures and
possibly sewage sludge manures and compost for Cu and fertiliser for Cd) beyond atmospheric
inputs are important in maintaining or even increasing soil concentrations principally in managed
areas For the remaining metals especially Cr Ni and Zn there is some suggestion that in areas
where cropping takes place output fluxes may now exceed inputs enabling soil concentrations to
decline
Managed landscape where intensive cropping takes place but sewage sludge animal manures and
composts are rarely applied may be among the first habitats to return from their slight-moderately
elevated states to their pre-industrial background concentrations and could be a focus for future
monitoring
71 Policy background
Key Question Is the decline in atmospheric deposition as reported by the Heavy Metals Monitoring Network reflected in soil metal concentrations measured with CS Measurements Concentrations of Cd Cr Cu Ni Pb V and Zn is soils (0-15cm) collected in repeat sampling of plots that were also sampled and analysed for the same metals in 1998 measurement of concentrations of Li Be Al Ti Mn Fe Co As Rb Se Sr Mo Sb Sn Cs Ba W Hg U in CS in 2007 soil samples as an initial survey of a wider range of trace element From this analysis CS in 2007 has provided
Whole Great Britain (GB) and Broad Habitats Aggregate Vegetation Classes (AVC) and soil type
stratified assessments of soil trace element concentrations in soil (0-15cm) in 2007
Information of the change in concentrations of trace metals (Cd Cr Cu Ni Pb V Zn) in GB soil (0-
15 cm) since previous measurements made at the same plots in 1998
Data to contribute to analysis of source changes in the distribution of trace elements in a range of
GB habitats vegetation types and soil classes
130
Countryside Survey Soils Report from 2007
7 Soil metal concentrations
Background In the European Union and internationally a set of research programmes have focused on assessing the risks of trace metals to ecosystems This work has been driven by policy initiatives which include new procedures for the mandatory risk assessment according to European Commission regulation 148894 and studies to support the 1998 Convention on Long-Range Transboundary Air Pollution Aarhus Protocol on Heavy Metals The focus of policy makers and researchers on the risk assessment of metals recognises the harm that elevated trace element concentrations can do to soil ecosystems A number of keystone soil taxa (eg earthworms springtails nitrifying bacteria) are particularly sensitive to metals High metal concentration in soils can reduce the abundance and diversity of communities of these and other taxa potentially resulting in a breakdown of specific soil functions such as decomposition nutrient turnover and the regulation of hydrological flows through soil Metals are not broken-down over time (unlike most organic chemicals) and so can be removed only by the relatively slow process of cropping and leaching the accumulation of metals offers one of the more serious long-term threats to soil sustainability worldwide The environmental risks of metals for UK soils are currently being asssed in two projects improving current critical loads methods for application within UNECE Convention and developing models that can be used to describe and predict the effects of changes in input rates on soil and freshwater metal pools Both project will benefit from good quality soil metal survey data Key measurements required include information on current concentrations of metals in soils (representing combined geogenic and past anthropogenic inputs) and also predicted rates of change Modification in metal concentration in surface soils will represent the balances between input fluxes associated with natural and anthropogenic inputs and output fluxes associated with crop removal and leaching Measurements of the input rates of atmospheric metal deposition to rural soils in the UK since 2004 have come from analyses of rain water and airborne particulate metal concentrations made within the UK bdquoHeavy Metal Deposition Monitoring Network‟ This network has collected information on the concentrations of a suite of metals of regulatory interest including Cd Cu Ni Pb Zn and Hg Other impo rtant routes for the input of metals to soils are associated with the addition of sewage sludge animal manures and other solid waste streams to soils principally in agricultural areas Information on these inputs can be derived from Defra supported long-term monitoring projects focussing on solid waste receiving systems For estimates of losses from cropping and leaching prediction of removal rates have been made by modelling studies conducted to support development of a critical loads approach for metals in soils Despite this knowledge because the Heavy Metal Deposition Network covers only a small number of sites (15 in GB) and there is little large scale data on the local patterns of solid waste inputs and cropping and leaching removals available the input and output flux estimates that are currently available are very uncertain Although uncertain and spatially variable estimates made by the Heavy Metal Deposition Monitoring Network other large-scale monitoring programs and by source inventory assessment have suggested that rates of atmospheric metal deposition to UK soils are declining For example a European wide survey of trace metal concentration in over 6000 moss samples identified a decline in concentrations of As of 72 Pb of 72 V of 60 Cd of 52 and Fe of 45 between 1990 and 2005 Smaller declines were also found for Zn of 29 Cu of 20 and Ni of 20 Declines for Hg (12) and Cr (2) were not significant While it is apparent that atmospheric deposition is likely to be declining it is not known whether these reductions have yet passed the point beyond which output losses exceed inputs and so overall metal concentrations can begin to decline Dynamic modelling within Defra funded projects on critical loads assessment have suggested that the residence time of metals in soils will be at least many decades and for some metals such as lead possibly millennia (Tipping et al 2006a) Extensive datasets on the rates of change of concentrations of metals in soils are not currently available to validate these model predictions By resampling and measuring soil metal concentration in samples collected countrywide after a 9 year gap it was hoped that CS could provide an initial prototype of just such a dataset
131
Countryside Survey Soils Report from 2007
7 Soil metal concentrations
72 Methods
721 Proof of concept
As part of the Measuring and Assessing Soil Quality of CS in 1998 over 1100 soil samples were successfully analysed for seven trace metals (Cd Cr Cu Ni Pb V Zn) using aqua regia digestion and an ICP -OEC analysis method Measured concentrations showed regional trends with higher value generally found in England and Wales than in Scotland Concentrations also differed between Broad Habitats with highest concentrations in Arable and Horticulture and Improved Grassland soils and lowest concentrations in Dwarf Shrub Heath and Bogs The GB wide sampling and measurement programme of CS in 1998 provided information on the concentrations of metals in the rural soils that are the focus of CS rather than urban or industrial soils that are often considered in pollution assessment programs These rural soils are primari ly influenced by diffuse rather than point source inputs and so are relevant to studies to assess the potential for large scale pollution effects resulting from diffuse exposure To provide initial knowledge on the potential dynamics of metal concentra tions in GB soils a repeat analysis of a sub-set of samples collected within CS in 1998 has been undertaken as part of CS in 2007 This was done to allow the key policy question of interest to stakeholders to be addressed namely Is the decline in atmospheric deposition as reported by the Heavy Metals Monitoring Network reflected in soil metal concentrations measured with CS To address the highlighted policy issue and assess wider implications relating to metal distribution of GB soils the metal componen t of CS in 2007 was designed to provide
A nationwide assessment of the concentrations of 26 metal or metalloid elements namely lithium
(Li) beryllium (Be) aluminium (Al) titanium (Ti) vanadium (V) chromium (Cr) manganese (Mn)
iron (Fe) cobalt (Co) nickel (Ni) copper (Cu) zinc (Zn) arsenic (As) rubidium (Rb) selenium (Se)
strontium (Sr) molybdenum (Mo) cadmium (Cd) antimony (Sb) tin (Sn) caesium (Cs) barium (Ba)
tungsten (W) mercury (Hg) lead (Pb) uranium (U) in almost 500 GB soils collected in CS in 2007
Information on the change in concentrations of metals in GB soils for seven metals (Cd Cr Cu Ni
Pb V Zn) that were also analysed in CS samples collected in 1998 and in the 2007 repeat analyses
An assessment of the influence of Broad Habitats AVC and soil type on measured metal
concentration and rates of change between survey years
Countryside Survey in 2007 has provided a large-scale re-sampling of soil metal concentrations with the framework of an integrated nationwide monitoring program The full rationale for the repeat measurement of soil metal concentrations is set out in Table 71 and the progression of the development of the resampling and analysis approach used set out in detail below
In CS in 1998 concentrations of Cd Cu Cr Ni Pb Zn were measured in soils collected from all Main Plots within squares first sampled for soil (pH LOI soil texture) in the 1978 survey (Chapter 1) This gave a potential total of 1256 soils for metals analysis although actual numbers were somewhat lower due to plot or sample losses meaning that in total 1119 soils were actually analysed Competing priorities for resources during the design of the 2007 survey and measurement program meant that within the available budget a full analysis of all previous analysed Main Plots re-sampled in CS in 1998 could not be supported During preparation for CS a power analysis of the 1998 survey data was conducted to evaluate within and between square variability and to assess the implications of changing sample number for the power of the analysis to detect change in metal concentrations Results of this power analysis indicated lower within square than between square variability Further it was indicated that a reduction in the number of M ain Plots analysed per square from 5 in CS in 1998 to only 2 in CS in 2007 would actually have only a very limited effect on the power to detect change in CS in any repeat analysis Based on this evaluation in 2007 metals analysis was limited to two Main Plots for all squares previously samples in 1978
132
Countryside Survey Soils Report from 2007
7 Soil metal concentrations
Table 71 Summary of rationale for measurement of soil metal concentrations within CS in 2007
Issue Facts Comments History in CS Measured in 1097 samples in
CS in 1998
Measurement of 2007 re-samples will give
capability to establish a time series for the first time
Country level reporting No CS in 1998 did not give country level statistics
Reduced dataset in 2007 limits the power of
analysis for Country level reporting for habitat
vegetation and soil types stratifications
Links and compatibility to other
monitoring programmes
UK heavy metal monitoring
network
BGS G-BASE for soils and
stream sediments
Comparable data to those
collected in the NSI for same
horizon (0-15cm)
Environment Agency Soil and
Herbage Survey
Potential to link soils metal levels with predicted
deposition
Able to link soil metal levels with stream sediment
database
Can compare CS to NSI metal concentrations
Can compare with data for rural but not urban or
industrial site soils
Uniqueness of CS The only national dataset that
reports on metal distribution
and trends within an integrated
monitoring programme
Increase scope by inclusion of additional trace
element analytes within an extended analytical
suite
Value for money (Policy
priority or interpretative value x
cost)
Priority - medium
Value for money - medium
Sound fit with current priorities and good fit with
existing projects
ICP-MS and ICP-OES method delivers data on 26
metals and also on total P and total S
In the intervening period between the analysis of the CS in 1998 samples and the collection of samples from CS in 2007 several analytical developments were introduced into the procedures for trace metal analysis used at the UKAS accredited analytical facility at CEH in Lancaster During the movement of the metal analysis laboratory from its previous location at CEH Merlewood it was necessary to dismantle the hotplate reflux system that was used for digestion of all soils in CS in 1998 L ogistical requirement meant that the equipment could not be rehoused in the new analytical laboratories at CEH in Lancaster Instead it was decided to procure a new microwave digestion system that would be used for soil digestions Although both systems use aqua regia as the reagent for digestion the change in available instrumentation for conducting digestion from a hot plate reflux system to microwave digestion still could have the potential to confound the comparison of the 1998 and 2007 data if the two method show different extraction efficiencies Before detailed analysis of the data was conducted a careful comparison of the two methods was conducted using the available quality assurance information to check the comparability of the two methods In addition to a change in digestion apparatus purchase of new equipment for the analysis laboratory meant that as well as Inductively Coupled Plasma Optical Emission Spectroscopy ( ICP-OES) a further detection method Inductively Coupled Plasma Mass Spectrometry (ICP-MS) could also be used in CS in 2007 In the preparatory work for CS in 2007 the accuracy and precision of the two detection methods was compared for a representative set of aqua regia digests of 1998 CS soils Results indicated a good comparabi lity between the two detection techniques Since the resource implications for the use of the two instruments in parallel were minimal it was decided to use a comprehensive approach for the full analysis that included use of both procedures This approach both ensured any new analytical measures were compatible with CS in 1998 measures from digests and also delivered concentrations for an extended analyte suite The analytical
133
Countryside Survey Soils Report from 2007
7 Soil metal concentrations
strategy used involved a 5 stage approach based on 1) aqua regia digestion 2) analysis by ICP- OES for Cd Cr Cu Pb Ni V Zn P and S 3) further analysis of the same samples for further metals by ICP-MS 4) careful data evaluation 5) targeted re-measurement for any problem analytes
722 Analytical method
The field method used for soil core collection at each Main Plot was the same as in CS in 1998 The cores used for metal analysis were collected using a 15 cm long by 5 cm diameter black plastic core following the detailed field protocol set out in Emmett et al (2008) Once extracted and logged all cores were returned by mail to CEH in Lancaster as the quickest route of return On receipt samples for metal analysis were tak en from the bdquoBlack core‟ (See Emmett et al 2008 Annex 1) A total of 1054 black cores were collected from the 5 Main Plots in the original 256 1978 squares From this total number a subset of two cores from each visited square was chosen for trace met al analysis Cores were chosen at random from the subset of collected samples that were also analysed for concentrations of mineralisable nitrogen (see Chapter 5) All metal analyses were carried out by the UKAS accredited inorganic analysis laboratory at CEH in Lancaster After initial processing of the core to obtain a homogenous sample (See Emmett et al 2008 Annex 1) soil samples were ball-milled before analysis A 05g sub-sample of the dried milled material was used for analysis Digestion of the soil samples was conducted using an aqua regia mixture (3 ml of 37 hydrochloric acid and 9 ml of 69 nitric acid both bdquoaristar‟ grade reagents ) employing microwave heating under pressure The microwave digestion method was adapted from that used by the US EPA (method 3051A) to fit the specific requirements of the available digestion equipment at CEH in Lancaster The use of microwave digestion differed from the procedure used for measurement of soil metal concentration in CS in 1998 as outlined previously As a result of the change in digestion procedure detailed checks of the quality assurance data were conducted to verify the comparability of the analysis methods (see quality assurance section below) Further a series of validation checks have also bee n conducted of samples measured in the CS in 1998 using the CS in 2007 protocol This targeted re -measurement includes samples of a range of soil LOI and pH values and has been used in combination with available quality control information to support interpretations within this report
After digestion all samples were prepared for analysis of Cd Cr Cu Ni Pb V Zn P and S using ICP-OES and the technical method and operational limits relevant to the selected analytes Additionally for each digestion a parallel analysis was conducted that measured concentration of a suite of additional elements namely Li Be Al Ti V Cr Mn Fe Co Ni Cu Zn As Rb Se Sr Mo Cd Sb Sn Cs Ba W Hg Pb U using ICP-MS For reporting all values for metal concentrations derived from both detection methods were expressed as mgkg (equivalent to ppm and μgg) on a dry weight basis
134
Countryside Survey Soils Report from 2007
7 Soil metal concentrations
Table 72 Summary of quality control data for measurement of certified reference soil BCR CRM141R The table
highlights the repeatability of the measurements made in 1998 (top) and 2007 (middle) but also the difference in
the measured quantity resulting from the necessitated change in digestion procedure between CS in 1998 and
CS in 2007 The bottom table shows a comparison of the mean measured total of Cd Cr Cu Ni Pb V and Zn
made using the different method in each survey and the estimation of the correction factor used to back correct
CS in 1998 samples to account for digestion related differences Subsequent data analyse s was done comparing
back corrected CS in 1998 measurements with uncorrected CS in 2007 measured concentrations
1998 CS2000 Reflux digestionICPOES measurement BCR CRM141R
Mgkg Cd
Mgkg
Cr
Mgkg
Cu
Mgkg
Ni
Mgkg
Pb
Mgkg
V
Mgkg
Zn
Mgkg
mean 1360 14100 4700 9730 4860 5030 26100
sigma 070 530 170 370 330 210 930
CV 515 376 362 380 679 417 356
certified 1400 13800 4690 9400 5130 na 27000
recovery 9714 10217 10021 10351 9474 na 9667
bias -040 300 010 330 -270 na -900
bias -286 217 021 351 -526 na -333
error 180 1360 350 1070 930 na 2760
Error 1324 965 745 1100 1914 na 1057
2008 CS2007 microwave digestionICPOES (-oes) or ICPMS (-ms) measurement BCR CRM141R Cd-ms
Mgkg
Cr-ms
Mgkg
Cu-oes
Mgkg
Ni-ms
Mgkg
Pb-ms
Mgkg
V-oes
Mgkg
Zn-oes
Mgkg
Mean 1270 12120 4670 8366 4954 3580 28460
sigma 016 130 060 113 081 190 540
CV 126 107 128 135 164 531 190
Certified 1400 13800 4690 9400 5130 na 27000
recovery 9071 8783 9957 8900 9657 na 10541
bias -130 -1680 -020 -1034 -176 na 1460
bias -929 -1217 -043 -1100 -343 na 541
Error 162 1940 140 1260 338 na 2540
Error 1276 1601 300 1506 682 na 892
BCR CRM141R ndash 19982007 comparison all validation Cd-ms
Mgkg
Cr-ms
Mgkg
Cu-oes
Mgkg
Ni-ms
Mgkg
Pb-ms
Mgkg
V-oes
Mgkg
Zn-oes
Mgkg
1998 1360 14100 4700 9730 4860 5030 26100
2007 1182 10989 4327 7872 4724 2820 26632
19982007 115 128 109 124 103 178 098
135
Countryside Survey Soils Report from 2007
7 Soil metal concentrations
723 Quality assurance
Within each batch of 20 samples a minimum of one blank and two certified reference material (CRM) and one local reference material (LRM) were always analysed The t wo CRMs used were the BCR CRM141R calcareous loam soil and International Soil Exchange ISE 921 river clay both of which have certified values for a range of metals included within the analytical suite Quality control checks for each analytical batch were conducted to ensure that total analytical error was not greater than 20 comprising a 10 error in precision and 10 error in bias This criterion is more rigorous than that used by the Environment Agencies MCERTS performance standard for laboratories undertaking chemical testing of soil (NB MCERTS defines total allowable error of 25 - 10 bias + 15 precision) For the 2007 soils analysed using microwave digestion with ICP-OES or ICP-MS detection certified values for the repeat analysed metals (Cd Cr Cu Ni Pb Zn) indicated that the total error of the method is within the allowable 20 Compared with results from the CS in 1998 survey the analytical method used in CS in 2007 provided a similar and in both cases satisfactory precision of measurement in all cases ( Table 72) This confirms the suitability of the method used Even though both the microwave and hotplate digestion method performed within quality assurance targets it must be remembered that both digestion procedure remain operationally defined This means that the two aqua regia digest ion based techniques do not give a full measurement of all metals present in soils Some metal remains unextracted These residual ions are however mostly bound to silicate minerals and as such are widely considered to be unimportant for estimating the mobility and behaviour of trace elements in soil This operational component to the effectiveness of the method does however raise the potential for the two procedures to produce slightly different estimates of metal concentrations from the same soil To provide a cross check between measurements made by the two different digestion methods two separate approaches were used For the first a comparison was made of the measurements made of the BCR CRM141R calcareous loam soil which was extensively analysed during both the CS in 1998 and CS in 2007 measurement campaigns Comparison of quantifications of the CRM in the two surveys indicated that 6 of the 7 metals showed higher concentrations in BCR CRM141R soil in CS in 1998 than in CS in 2007 (Table 72) Cd Cr Cu Ni and Pb showed concentrations that were between 3 (Pb) and 28 (Cr) higher in CS in 1998 Concentrations of V in CS in 1998 were 78 higher in the CRM in measurements made in CS in 1998 than in CS in 2007 Of measured metals in the CRM only Zn concentrations were lower (by 2) in CS in 1998 than in CS in 2007 The second approach to comparison of the two digestion techniques was through a repeat analysis of samples that were originally measured following hotplate reflux digestion as part of the CS survey in 1998 but this time using the CS in 2007 microwave method Twenty six samples that had been archived from the 1998 survey were digested using the microwave method and analysed for concentration of the seven trace elements (Cd Cr Cu Ni Pb V Zn) that were originally measured during the 1998 analysis The results of this targeted re-measurement confirm the initial indication gained from the comparison of certified reference material analyses in all cases except for V The method compari son highlights that there is an approximate 30 increase in measured Cr and Ni concentrations using the reflux technique Cd and to a lesser extent Cu concentrations are also marginally higher with hotplate reflux (3 -10) while Pb and Zn concentrations are similar to within a few percent using both methods (Table 73) For V the comparison between soils highlights a small underestimation of concentrations using reflux while in contrast a large overestimation was indicated by the CRM comparison
136
Countryside Survey Soils Report from 2007
7 Soil metal concentrations
Table 73 Summary data for measurement of soil trace metal concentrations measured in selected (26) soil
samples collected in CS in 1998 using the hot reflux digestion protocol used for all CS in 1998 analyses and also
the microwave digestion protocol used for analysis in CS in 2007 samples The table highlights the repeatability
of the measurements made in 1998 (top) and 2007 (middle) but also the difference in the mean measured total of
Cd Cr Cu Ni Pb V and Zn made using the different methods as shown by the comparison of measured
concentration between the two procedures
Cd-ms
mgkg
Cr-ms
mgkg
Cu-oes
mgkg
Ni-ms
mgkg
Pb-ms
mgkg
V-oes
mgkg
Zn-oes
mgkg
1998 soils by reflux 036 3575 1703 2847 6738 4145 6146
SD 026 5219 1754 5487 9835 3859 4222
1998 soil by microwave 034 2775 1594 2041 7122 4061 6298
SD 023 3937 1515 4282 9392 3838 4196
RefluxMicrowave 111 131 103 136 096 098 097
SD 040 064 017 057 013 016 013
Because the differences relating to the efficiency of the digestion techniques used between surveys could
contribute to any indicated differences between surveys it was decided to ldquonormaliserdquo one set of
measurements to allow direct comparison As the 2007 measurements showed the highest precision for the
majority of the metals measured in both surveys (Cd Cu Pb Zn) and the microwave digestion method will be
applied in future soil metal research within CEH including any potential future CS analyses it was decided to
normalise the 1998 data to give concentration estimates for soil collected in 1998 assuming analysis
conducted according to the CS in 2007 method The back correction of the 1998 concentrations was
achieved by dividing the measured value by the ratio of mean 1998 2007 measurements for the BCR
CRM141R reference soil Correction was undertaken according to measurement in the reference soil for two
reasons Firstly these analyses were made at the same time that the CS soils themselves were measured
meaning that they are most likely to relate to operational conditions at the time of CS sample assessment
Secondly the CRM dataset contains a greater number of total measurements than the repeated 1998
dataset The back correction of the 1998 measurements gives an estimated value for 1 998 soils if measured
using the 2007 protocol The back correction procedure was conducted for 6 metals Cd Cr Cu N Pb Zn
but not for V This was because the large discrepancy in BCR CRM141R measurement between survey s for
this metal (78) and the mismatch between this comparison and the repeat measures questions the
reliability of the extraction method and data ldquonormalisationrdquo approaches used for this metal As a result V
has been excluded from the analysis of change between surveys
137
Countryside Survey Soils Report from 2007
7 Soil metal concentrations
Figure 71 Comparison of change in measure metal concentration following back correction of 1998 data to
account for differences resulting from changes in digestion procedure between the 1998 and 2007 survey in
relation to pH of the measure soil Red line indicates linear trend of change in relation to pH Absence of a
strong trend for change in relation to soil pH indicate that there is no effect of soil pH on the size of the
difference resulting from the digestion change meaning that a single value for back correction is applicable to
soils independent of pH
-2000
-1500
-1000
-0500
0000
0500
1000
1500
3 4 5 6 7 8 9 10
Soil pH
Ch
an
ge
soil C
d 1
99
8-2
007
(m
gk
g)
-40000
-20000
0000
20000
40000
60000
80000
100000
120000
140000
3 4 5 6 7 8 9 10
Soil pH
Ch
an
ge
soil C
r 1
99
8-2
007
(m
gk
g)
-30000
-20000
-10000
0000
10000
20000
30000
40000
50000
60000
3 4 5 6 7 8 9 10
Soil pH
Ch
an
ge
soil C
u 1
99
8-2
007
(m
gk
g)
-80000
-60000
-40000
-20000
0000
20000
40000
60000
3 4 5 6 7 8 9 10
Soil pH
Ch
an
ge
soil N
i 1
99
8-2
007
(m
gk
g)
-1000000
-800000
-600000
-400000
-200000
0000
200000
400000
600000
3 4 5 6 7 8 9 10
Soil pH
Ch
an
ge
soil P
b 1
99
8-2
007
(m
gk
g)
-40000
-20000
0000
20000
40000
60000
80000
3 4 5 6 7 8 9 10
Soil pH
Ch
an
ge
soil V
199
8-2
007
(m
gk
g)
-500000
-400000
-300000
-200000
-100000
0000
100000
200000
3 4 5 6 7 8 9 10
Soil pH
Ch
an
ge
soil Z
n 1
99
8-2
007
(m
gk
g)
Cd Cr
Cu Ni
Pb V
Zn
Cd_98_07_change = 0759 + 000300 PH2007 Cr_98_07_change = 018 - 00196 PH2007
Cu_98_07_change = 235 + 00427 PH2007 Ni_98_07_change = 036 - 000637 PH2007
Pb_98_07_change = - 022 + 000466 PH2007 V_98_07_change = 899 + 0211 PH2007
Zn_98_07_change = - 177 - 00425 PH2007
138
Countryside Survey Soils Report from 2007
7 Soil metal concentrations
Figure 72 Comparison of change in measure metal concentration following back correction of 1998 data to
account for differences resulting from changes in digestion procedure between the 1998 and 2007 survey in
relation to soil LOI Red lines indicate the linear trend for change as a function of LOI Absence of a strong trend
for change in relation to soil pH indicate that there is no effect of soil p H on the size of the difference resulting
from the digestion change meaning that a single value for back correction is applicable to soils independent of
LOI
Cd Cr
Cu Ni
Pb V
Zn
-2000
-1500
-1000
-0500
0000
0500
1000
1500
0 20 40 60 80 100
Soil loss on ignition
Ch
an
ge
soil
Cd
19
98
-20
07
(m
gk
g)
-40000
-20000
0000
20000
40000
60000
80000
100000
120000
140000
0 20 40 60 80 100
Soil loss on ignition
Ch
an
ge
soil
Cr
19
98
-20
07
(m
gk
g)
-30000
-20000
-10000
0000
10000
20000
30000
40000
50000
60000
0 20 40 60 80 100
Soil loss on ignition
Ch
an
ge
soil
Cu
19
98
-20
07
(m
gk
g)
-80000
-60000
-40000
-20000
0000
20000
40000
60000
0 20 40 60 80 100
Soil loss on ignition
Ch
an
ge
soil
Ni
19
98
-20
07
(m
gk
g)
-1000000
-800000
-600000
-400000
-200000
0000
200000
400000
600000
0 20 40 60 80 100
Soil loss on ignition
Ch
an
ge
soil
Pb
19
98
-20
07
(m
gk
g)
-40000
-20000
0000
20000
40000
60000
80000
0 20 40 60 80 100
Soil loss on ignition
Ch
an
ge
soil
V 1
99
8-2
00
7 (
mg
kg
)
-500000
-400000
-300000
-200000
-100000
0000
100000
200000
0 20 40 60 80 100
Soil loss on ignition
Ch
an
ge
soil
Zn
19
98
-20
07
(m
gk
g)
Cr_98_07_change = 015 - 000509 LOI2007
Cu_98_07_change = 270 + 000924 LOI2007 Ni_98_07_change = 045 - 000205 LOI2007
Pb_98_07_change = 225 + 000046 LOI2007 V_98_07_change = 104 + 00479 LOI2007
Zn_98_07_change = - 217 - 00104 LOI2007
Cd_98_07_change = 0938 + 0000107 LOI2007
139
Countryside Survey Soils Report from 2007
7 Soil metal concentrations
A potential concern with the back correction approach used to ldquonormaliserdquo measurements between surveys was that this could results in the false identification of change in some habit ats if the difference in digestion technique resulted in different ratios of measured metals in soils of differing properties such as pH LOI and metal concentration Any such trends with soil properties could under or over correct concentrations in particular soils types Since some habitats and vegetation classes are associated with certain soils (eg Bogs with low pH organic soils) this could lead to the erroneous identification of change in certain data stratifications To investigate whether soil properties had the potential to bias result by differentially affecting extraction efficiency between CS in 1998 and 2007 methods correlation plots were drawn between the predicted change between surveys and the potentially key soil properties of pH LOI a nd metal concentration For pH 5 metals (Cd Cu Ni Pb Zn) showed no clear trend of change with soil acidity ( Fig 71) This suggested that the relative digestion efficiency of the different methods is not affected by this parameter A small dependency of change in Cr concentration with pH was found indicating that association of habitats and vegetation classes with low pH could result in the incorrect identification of change with errors relating to indications of increased change in low pH soil and reduced change in high pH soil V showed a marked dependency of change on soil pH providing further support for exclusion of this metal from further analysis Against LOI all metals except V showed no clear trend of change ( Fig 72) Ideally investigation of the effect of metal concentration on relative extraction efficiency would also have been tested however this analysis is affected by regression to the mean issues which means that the significant trends seen which indicates positive change at low concentrations and negative change at high concentrations are explained by statistical chance rather than a real concentration dependent effect Overall the analysis of the effect of all testable soil properties supported the use of a single factor for back correction of the CS in 1998 measurements with a slight caveat for soil Cr concentrations in respect of pH
724 Reporting
Measured soil elemental concentrations for Li Be Al Ti V Cr Mn Fe Co Ni Cu Zn As Rb Se Sr Mo Cd Sb Sn Cs Ba W Hg Pb U P and S have been analysed to provide information on the state and in seven cases (Cd Cr Cu Ni Pb V and Zn) change since CS in 1998 Data were analysed using the standard mixed model analysis appropriate to CS measurements The statistical approach used for analys is for change involved bootstrapping which allows for non-normality in the data without the necessity of knowing details of actual distribution As such it provides a more accurate measurement of significance A nnex F of Emmett et al (2008) provides a background document describing this approach The data in this report describes analysis of concentrations in CS in 2007 and changes since CS in 1998 for Cd Cr Cu Ni Pb Zn in soils (0 -15 cm) by Broad Habitat Aggregate Vegetation Class (AVC) and soil LOI class
Results are reported by three major categories for Great Britain and individual countries
Broad Habitat - the Broad Habitat classification consists of 27 habitats which account for the entire
land surface of Great Britain and the surrounding sea Countryside Survey reports on 10 major
terrestrial habitats
Aggregate Vegetation Class (AVC) ndash is a high level grouping of vegetation types produced from a
quantitative hierarchical classification of the different plant species found in the original Countryside
Survey sample plots Soil organic matter (LOI) category - mineral (0-8 LOI 0-44 g C kg
-1) humus-mineral (8 ndash 30 LOI
44-165 g C kg-1
) organo-mineral (30 ndash 60 LOI 165-330 g C kg-1
) and organic (60 ndash 100 gt 330 g
C kg-1
) Analysis of concentrations by Broad Habitat class and soil type is also briefly reported for As Mn Se Co Hg Mo Al and Ti Significant results relate to statistical significance with their ecological and policy relevance highlighted where appropriate Soil Arsenic (As) levels were interpolated using median indicator kriging to predict the probability of a threshold value of As concentration (807 mgkg) being exceeded A probability of 1 or above indicates that the data exceeds the specified threshold value at that location This method of spatial interpolation is particularly suited to interpreting heavy metals where point values can h ave large point scale variability rendering ordinary kriging unsuitable Data was interpolated onto a 1 km UK grid The change for soil Cu was
140
Countryside Survey Soils Report from 2007
7 Soil metal concentrations
mapped using kriging to interpolate between the Countryside Survey sample points Routine checking of data for outliers was conducted and the working data set was transformed using a normal score procedure to obtain a Gaussian distribution The data were then interpolated on a 1km UK grid using ordinary kriging and finally the kriged data were back-transformed to produce an interpolated map of Cu change
73 Results
731 Repeat measured metals comparison of CS data in 1998 and 2007
Cadmium The mean concentration of Cd measured in GB soils collected in 2007 was 0404 mgkg This compares with an mean concentration of 0417 mgkg measured in soil sample for CS in 1998 (Table 73 Fig 73) This represents a non-significant change in measured Cd concentration of 0013 mgkg between surveys Stratification of the data indicated that significant changes in soil Cd concentrations were not found in any Broad Habitat although it was notable that four habitats that are associated with minimal management namely Coniferous Woodland Acid Grassland Dwarf Shrub Heath and Fen Marsh and Swamp showed relatively large non-significant decreases in soil Cd concentration (in the region of 005 mgkg magnitude) In contrast habitats associated with more intensive management such as Arable and Horticulture and Improved Grassland showed smaller changes represented by a decline of 0003 mgkg and increase of 0029 mgkg respectively Bog habitats also showed a small non-significant increase in measured soil Cd Stratification by AVC indicated a significant reduction in measured soil Cd concentrations in Heath and Bog Here mean measured concentrations reduced to 0399 mgkg in 2007 from a mean of 0475 mgkg in 1998 Significant change was not found for any other AVC Stratification by soil LOI category indicated no significant change in Cd concentrations in Mineral Humus mineral and Organic soils In Organo-mineral soils a significant decrease of 0309 mgkg was found in 2007 when compared to 1998 values This category of soils is however represented by only a relatively small number of samples in the repeat sample dataset f or Cd which may be a contributing factor towards the observed change for this LOI class
141
Countryside Survey Soils Report from 2007
7 Soil metal concentrations
c) Great Britain - Soil LOI Category
Soil LOI category 1998 2007 1998-2007
Mineral 032 0332
Humus-mineral 0421 0412
Organo-mineral 0557 0246
Organic 0483 0452
Direction of
significant
changes
Soil Cd concentration
(mgkg)
Table 74 Changes in concentration of Cd (mgkg) in soils (0 -15 cm depth) within a) Broad Habitats b)
Aggregate Vegetation Classes and c) Soil LOI categories across Great Britain Arrows denote a significant
change (plt005) in the direction shown
a) Great Britain - Broad Habitats
Broad Habitat 1998 2007 1998-2007
Broadleaved Mixed and Yew Woodland 0413 0418
Coniferous Woodland 0308 0256
Arable and Horticulture 0355 0352
Improved Grassland 0389 0418
Neutral Grassland 0458 0416
Acid Grassland 0458 0404
Dwarf Shrub Heath 0457 0392
Fen Marsh and Swamp 0553 042
Bog 0631 0646
All habitat types 0417 0404
b) Great Britain - Aggregate Vegetation Class
AVC 1998 2007 1998-2007
Crops and weeds 0355 0359
Tall grass and Herb 0447 0409
Fertile grassland 0367 0365
Infertile grassland 0475 0446
Lowland woodland 0576 0612
Upland Woodland 0269 0197
Moorland grass mosaics 0405 0376
Heath and bog 0475 0399
All vegetation types 0417 0404
Direction of
significant
changes
Direction of
significant
changesSoil Cd concentration
(mgkg)
Soil Cd concentration
(mgkg)
142
Countryside Survey Soils Report from 2007
7 Soil metal concentrations
Figure 73 Changes (+- 95 CIs) in measured soil Cd concentration in soils (0-15 cm depth) within a) Broad
Habitats b) Aggregate Vegetation Classes and c) Soil LOI categories across Great Britain Standard errors are
indicated Significant differences p lt 005 p lt 001 p lt 0001 are shown
The mean concentration of Cr in GB soils was 213 mgkg in CS in 2007 compared to the mean of 224 mgkg in 1998 (Table 75 Fig 74) This represents a non-significant decrease of 11 mgkg Stratification of the data to assess change in measured Cr by Broad Habitats indicated significant reductions in soil Cr concentrations between surveys in Broadleaved Woodland Arable and Horticulture and Improved and Neutral Grasslands In contrast in Bogs there was a significant increased in measured soil Cr T his increase was however from a low baseline level as Cr concentrations in Bog were lower than in any other habitat in both surveys (46 mgkg in 1998 and 76 mgkg in 2007) In other Broad Habitats observed changes were non-significant with Coniferous Woodland Dwarf Shrub Heath and Fen Marsh and Swamp all showing small non-significant increases in mean measured Cr concentration Stratification by AVC partly reflected the trends seen within the Broad Habitats Significant decreases in measured Cr concentrations were found in Crop and Weed and Fertile Grassland Non-significant decreases were found in Tall Grass and Herb and Infertile Grassland In contrast a significant increase in measured soil Cr was found in Heath and Bog soils and non-significant increases in Upland Woodland and Moorland Grass Mosaic Stratification by soil LOI category indicated a significant decrease in measured Cr concentrations in Mineral and Humus -mineral soils and a significant increase in Organic soils
-020
-015
-010
-005
000
005
010
Bro
adlea
f
Coni
fer
Ara
ble
Impro
ved
Gra
ss
Neut
ral G
rass
Acid
Gra
ss
Shr
ub Hea
th
Bog
All ha
bita
ts
Ch
an
ge i
n s
oil
Cd
co
ncen
trati
on
(mg
kg
)
-020
-015
-010
-005
000
005
010
Cro
ps a
nd w
eeds
Tall g
rass
and
Her
b
Fertile
grass
land
Infe
rtile g
rass
land
Upla
nd W
oodlan
d
Moo
rland
gra
ss m
osaics
Heat
h and
bog
All ve
geta
tion
type
s
Ch
an
ge i
n s
oil
Cd
co
ncen
trati
on
(mg
kg
)
-040
-030
-020
-010
000
010
020
Min
eral
Hum
us-m
iner
al
Org
ano
-min
eral
Org
ani
c
Ch
an
ge in
so
il C
d c
on
cen
trati
on
(mg
kg
)
a) Broad Habitats
c) LOI categoriesb) Aggregate vegetation class
143
Countryside Survey Soils Report from 2007
7 Soil metal concentrations
c) Great Britain - Soil LOI Category
Soil LOI category 1998 2007 1998-2007
Mineral 268 236
Humus-mineral 28 264
Organo-mineral 183 247
Organic 41 53
Direction of
significant
changes
Soil Cr concentration
(mgkg)
Table 75 Changes in concentration of Cr (mgkg) in soils (0-15 cm depth) within a) Broad Habitats b) Aggregate
Vegetation Classes and c) Soil LOI categories across Great Britain Arrows denote a significant change (plt005)
in the direction shown
a) Great Britain - Broad Habitats
Broad Habitat 1998 2007 1998-2007
Broadleaved Mixed and Yew Woodland 227 195
Coniferous Woodland 128 139
Arable and Horticulture 295 254
Improved Grassland 282 264
Neutral Grassland 276 239
Acid Grassland 169 199
Dwarf Shrub Heath 11 186
Fen Marsh and Swamp 208 216
Bog 46 76
All habitat types 224 213
b) Great Britain - Aggregate Vegetation Class
AVC 1998 2007 1998-2007
Crops and weeds 295 261
Tall grass and Herb 321 288
Fertile grassland 286 262
Infertile grassland 27 253
Upland Woodland 232 237
Moorland grass mosaics 157 173
Heath and bog 48 71
All vegetation types 224 213
Direction of
significant
changesSoil Cr concentration
(mgkg)
Soil Cr concentration
(mgkg)
Direction of
significant
changes
144
Countryside Survey Soils Report from 2007
7 Soil metal concentrations
Figure 74 Changes (+- 95 CIs) in measured soil Cr concentration in soils (0-15 cm depth) within a) Broad
Habitats b) Aggregate Vegetation Classes and c) Soil LOI categories across Great Britain Standard errors are
indicated Significant differences p lt 005 p lt 001 p lt 0001 are shown
Copper The mean concentration of Cu in GB soils analysed in CS in 2007 was 186 mgkg ( Table 76 Fig 75) This is higher than the mean concentration of 166 mgkg measured in 1998 This represents a statistically significant increase in soil Cu concentrations of 2 mgkg between surveys Stratification of the data to analyse change by Broad Habitats indicated that the increase in Cu concentration detected in the GB wide soil dataset was evident in all Broad Habitats with the magnitude of change ranging from 02 mgkg in Arable and Horticulture soils to 6 mgkg in Dwarf Shrub Heath In 3 of the 9 Broad Habitats the increase in soil Cu was statistically significant These were Improved Grassland Dwarf Shrub Heath and Bogs which showed changes in measured soil Cu concentrations of 26 6 and 41 mgkg respectively Stratification by AVC indicated an increase in soil Cu concentrations in all vegetation types except for Tall Grass and Herb and Upland Woodland for which small non-significant decreases were found Three AVC categories showed significant increases in measured soil Cu There were Fertile Grassland Moorland Grass Mosaic and Heath and Bog within which increases were 41 5 and 33 mgkg respectively Analysis by soil LOI category indicated an increase of between 17 and 33 mgkg for the four soil type stratifications The measured increases were significant for 3 out of 4 categories namely the Mineral Humus-mineral and Organic soils
-10
-5
0
5
10
15
20
25
Bro
adlea
f
Coni
fer
Ara
ble
Impro
ved
Gra
ss
Neut
ral G
rass
Acid
Gra
ss
Shr
ub Hea
th
Bog
All ha
bita
ts
Ch
an
ge i
n s
oil
Cr
co
ncen
trati
on
(mg
kg
)
-10
-5
0
5
10
15
20
25
Min
eral
Hum
us-m
iner
al
Org
ano-m
iner
al
Org
anic
Ch
an
ge in
so
il C
r co
ncen
trati
on
(mg
kg
)
-10
-5
0
5
10
15
20
25
Cro
ps a
nd w
eeds
Tall g
rass
and
Her
b
Fertile
grass
land
Infe
rtile g
rass
land
Upla
nd W
oodlan
d
Moo
rland
gra
ss m
osaics
Heat
h and
bog
All ve
geta
tion
type
s
Ch
an
ge i
n s
oil
Cr
co
ncen
trati
on
(mg
kg
)
a) Broad Habitats
c) LOI categoriesb) Aggregate vegetation class
145
Countryside Survey Soils Report from 2007
7 Soil metal concentrations
c) Great Britain - Soil LOI Category
Soil LOI category 1998 2007 1998-2007
Mineral 178 195
Humus-mineral 198 221
Organo-mineral 161 195
Organic 74 103
Direction of
significant
changes
Soil Cu concentration
(mgkg)
Table 76 Changes in concentration of Cu (mgkg) in soils (0 -15 cm depth) within a) Broad Habitats b)
Aggregate Vegetation Classes and c) Soil LOI categories across Great Britain Arrows denote a significant
change (plt005) in the direction shown
a) Great Britain - Broad Habitats
Broad Habitat 1998 2007 1998-2007
Broadleaved Mixed and Yew Woodland 259 263
Coniferous Woodland 92 102
Arable and Horticulture 205 207
Improved Grassland 169 195
Neutral Grassland 226 237
Acid Grassland 124 147
Dwarf Shrub Heath 10 16
Fen Marsh and Swamp 172 191
Bog 69 11
All habitat types 166 186
b) Great Britain - Aggregate Vegetation Class
AVC 1998 2007 1998-2007
Crops and weeds 194 20
Tall grass and Herb 266 258
Fertile grassland 198 239
Infertile grassland 189 202
Lowland wooded 349 368
Upland Woodland 133 124
Moorland grass mosaics 109 159
Heath and bog 73 106
All vegetation types 166 19
Direction of
significant
changes
Direction of
significant
changesSoil Cu concentration
(mgkg)
Soil Cu concentration
(mgkg)
146
Countryside Survey Soils Report from 2007
7 Soil metal concentrations
Figure 75 Changes (+- 95 CIs) in measured soil Cu concentration in soils (0-15 cm depth) within a) Broad
Habitats b) Aggregate Vegetation Classes and c) Soil LOI categories across Great Britain Standard errors are
indicated Significant differences p lt 005 p lt 001 p lt 0001 are shown
Nickel The mean concentration of Ni in GB soils collected and analysed in the 2007 survey was 18 mgkg (Table 77 Fig 76) This is slightly although not significantly lower than the mean measured concentration in 1998 of 184 mgkg Within the different Broad Habitat categories a statistically significant decrease in soil Ni was found in 3 These were Broadleaved Woodland where concentrations fell by 2 mgkg and Arable and Horticulture where concentrations reduced by 18 mgkg and Neutral Grassland where a 21 mgkg decrease were found There was one habitat where measured soil Ni concentrations significantly increased between surveys This was Bog within which mean measured soil Ni concentrations increased 41 mgkg Analysis by AVC indicated significant change of measured Ni concentrations in Crop and We ed only Here a significant reduction in measured concentrations of 17 mgkg was found Analysis by soil LOI category indicated no significant change across any of the four soil classes
-8
-4
0
4
8
12
Bro
adlea
f
Coni
fer
Ara
ble
Impro
ved
Gra
ss
Neut
ral G
rass
Acid
Gra
ss
Shr
ub Hea
th
Bog
All ha
bita
ts
Ch
an
ge i
n s
oil
Cu
co
ncen
trati
on
(mg
kg
)
-8
-4
0
4
8
12
Min
eral
Hum
us-m
iner
al
Org
ano
-min
eral
Org
ani
c
Ch
an
ge in
so
il C
u c
on
cen
trati
on
(mg
kg
)
-8
-4
0
4
8
12
Cro
ps a
nd w
eeds
Tall g
rass
and
Her
b
Fertile
grass
land
Infe
rtile g
rass
land
Upla
nd W
oodlan
d
Moo
rland
gra
ss m
osaics
Heat
h and
bog
All ve
geta
tion
type
s
Ch
an
ge i
n s
oil
Cu
co
ncen
trati
on
(mg
kg
)
a) Broad Habitats
c) LOI categoriesb) Aggregate vegetation class
147
Countryside Survey Soils Report from 2007
7 Soil metal concentrations
c) Great Britain - Soil LOI Category
Soil LOI category 1998 2007 1998-2007
Mineral 197 189
Humus-mineral 195 191
Organo-mineral 249 253
Organic 35 35
Direction of
significant
changes
Soil Ni concentration
(mgkg)
Table 77 Changes in concentration of Ni (mgkg) in soils (0 -15 cm depth) within a) Broad Habitats b) Aggregate
Vegetation Classes and c) Soil LOI categories across Great Britain Arrows denote a significant change (plt005)
in the direction shown
a) Great Britain - Broad Habitats
Broad Habitat 1998 2007 1998-2007
Broadleaved Mixed and Yew Woodland 179 159
Coniferous Woodland 9 99
Arable and Horticulture 219 201
Improved Grassland 169 195
Neutral Grassland 226 205
Dwarf Shrub Heath 102 160
Fen Marsh and Swamp 172 191
Bog 69 110
All habitat types 184 18
b) Great Britain - Aggregate Vegetation Class
AVC 1998 2007 1998-2007
Crops and weeds 216 199
Tall grass and Herb 23 228
Fertile grassland 195 194
Infertile grassland 205 193
Lowland wooded 184 18
Upland Woodland 143 148
Moorland grass mosaics 25 24
Heath and bog 70 74
All vegetation types 184 18
Direction of
significant
changes
Direction of
significant
changesSoil Ni concentration
(mgkg)
Soil Ni concentration
(mgkg)
148
Countryside Survey Soils Report from 2007
7 Soil metal concentrations
Figure 76 Changes (+- 95 CIs) in measured soil Ni concentration in soils (0 -15 cm depth) within a) Broad
Habitats b) Aggregate Vegetation Classes and c) Soil LOI categories across Great Britain Standard errors are
indicated Significant differences p lt 005 p lt 001 p lt 0001 are shown
Lead The mean measured concentration of Pb in GB soils in 2007 was 804 mgkg ( Table 78 Fig 77) This is slightly although not significantly lower than the measured mean concentration of 825 mgkg found in 1998 Stratification of the data by Broad Habitat indicated that there was an increase of between 04 and 204 mgkg in 4 of 8 habitats In two habitats namely Improved Grassland and Dwarf Shrub Heath this increase was statistically significant The remaining habitats showed non -significant decreases in measured soil Pb concentrations ranging from 17 mgk in Fen Marsh and Swamp to 455 mgkg in Acid Grassland When data was analysed by AVC no significant changes in soil Pb concentration were found for any category Similarly stratification of the data by Soil LOI class did not highlight significant changes in measured soil Pb concentration between different soi l types
-15
-10
-5
0
5
10
15
Bro
adlea
f
Coni
fer
Ara
ble
Impro
ved
Gra
ss
Neut
ral G
rass
Shr
ub H
eath
Bog
All ha
bita
ts
Ch
an
ge i
n s
oil
Ni
co
ncen
trati
on
(mg
kg
)
-15
-10
-5
0
5
10
15
Cro
ps a
nd w
eeds
Tall g
rass
and
herb
Fertile
grass
land
Infe
rtile g
rass
land
Upla
nd w
ooded
Moo
rland
gra
ss m
osaics
Heat
h and
bog
All ve
geta
tion
type
s
Ch
an
ge i
n s
oil
Ni
co
ncen
trati
on
(mg
kg
)
-15
-10
-5
0
5
10
15
Min
eral
Hum
us-m
iner
al
Org
ano
-min
eral
Org
ani
c
Ch
an
ge in
so
il N
i co
ncen
trati
on
(mg
kg
)
a) Broad Habitats
c) LOI categoriesb) Aggregate vegetation class
149
Countryside Survey Soils Report from 2007
7 Soil metal concentrations
Table 78 Changes in concentration of Pb (mgkg) in soils (0 -15 cm depth) within a) Broad Habitats b)
Aggregate Vegetation Classes and c) Soil LOI categories across Great Britain Arrows denote a significant
change (plt005) in the direction shown
a) Great Britain - Broad Habitats
Broad Habitat 1998 2007 1998-2007
Coniferous Woodland 816 782
Arable and Horticulture 415 419
Improved Grassland 55 664
Neutral Grassland 609 526
Acid Grassland 1188 763
Dwarf Shrub Heath 679 883
Fen Marsh and Swamp 642 625
Bog 562 592
All habitat types 825 804
b) Great Britain - Aggregate Vegetation Class
AVC 1998 2007 1998-2007
Crops and weeds 449 454
Tall grass and Herb 638 614
Fertile grassland 560 617
Infertile grassland 627 589
Upland Woodland 853 780
Moorland grass mosaics 887 829
Heath and bog 704 705
All vegetation types 825 804
Direction of
significant
changes
Direction of
significant
changesSoil Pb concentration
(mgkg)
Soil Pb concentration
(mgkg)
c) Great Britain - Soil LOI Category
Soil LOI category 1998 2007 1998-2007
Mineral 413 426
Humus-mineral 1295 1269
Organo-mineral 997 985
Organic 752 682
Direction of
significant
changes
Soil Pb concentration
(mgkg)
150
Countryside Survey Soils Report from 2007
7 Soil metal concentrations
Figure 77 Changes (+- 95 CIs) in measured soil Pb concentration in soils (0-15 cm depth) within a) Broad
Habitats b) Aggregate Vegetation Classes and c) Soil LOI categories across Great Britain Standard errors are
indicated Significant differences p lt 005 p lt 001 p lt 0001 are shown
Zinc The mean concentration of Zn in GB soils in CS in 2007 was 773 mgkg ( Table 79 Fig 78) This is lower than the mean concentration of 804 mgkg found in 1998 This reduction of 31 mgkg in soil Zn in GB is not statistically significant Stratification of the data to analyse change in soil Zn concentration by Broad Habitat indicated that mean concentration were lower in 2007 than in 1998 in 7 of 10 h abitats This reduction in soil Zn was significant in two habitats These were Arable and Horticulture in which concentration fell on average by 57 mgkg and Neutral Grassland in which concentrations fell by 104 mgkg A significant increase in soil Zn concentration of 72 mgkg was found in Bog habitats All other changes in measured soil Zn by Broad Habitats were not significant When data was analysed by AVC no significant changes in soil Zn concentration were indicated for any vegetation class Strat ification of the data by LOI class also failed to identify significant changes in measured Zn between soil types
-100
-80
-60
-40
-20
0
20
40
Bro
adlea
f
Coni
fer
Ara
ble
Impro
ved
Gra
ss
Neut
ral G
rass
Acid
Gra
ss
Shr
ub Hea
th
Bog
All ha
bita
ts
Ch
an
ge i
n s
oil
Pb
co
ncen
trati
on
(mg
kg
)
-100
-80
-60
-40
-20
0
20
40
Cro
ps a
nd w
eeds
Tall g
rass
and
Her
b
Fertile
grass
land
Infe
rtile g
rass
land
Upla
nd W
oodlan
d
Moo
rland
gra
ss m
osaics
Heat
h and
bog
All ve
geta
tion
type
s
Ch
an
ge i
n s
oil
Pb
co
ncen
trati
on
(mg
kg
)
-100
-80
-60
-40
-20
0
20
40
Min
eral
Hum
us-m
iner
al
Org
ano
-min
eral
Org
ani
c
Ch
an
ge in
so
il P
b c
on
cen
trati
on
(mg
kg
)
a) Broad Habitats
c) LOI categoriesb) Aggregate vegetation class
151
Countryside Survey Soils Report from 2007
7 Soil metal concentrations
c) Great Britain - Soil LOI Category
Soil LOI category 1998 2007 1998-2007
Mineral 885 824
Humus-mineral 100 1006
Organo-mineral 61 357
Organic 342 376
Direction of
significant
changes
Soil Zn concentration
(mgkg)
Table 79 Changes in concentration of Zn (mgkg) in soils (0 -15 cm depth) within a) Broad Habitats b)
Aggregate Vegetation Classes and c) Soil LOI categories across Great Britain Arrows denote a significant
change (plt005) in the direction shown
a) Great Britain - Broad Habitats
Broad Habitat 1998 2007 1998-2007
Broadleaved Mixed and Yew Woodland 864 857
Coniferous Woodland 446 485
Arable and Horticulture 901 844
Improved Grassland 1076 1043
Neutral Grassland 995 891
Acid Grassland 422 439
Bracken 507 399
Dwarf Shrub Heath 407 389
Fen Marsh and Swamp 682 583
Bog 485 577
All habitat types 804 773
b) Great Britain - Aggregate Vegetation Class
AVC 1998 2007 1998-2007
Crops and weeds 943 919
Tall grass and Herb 117 1055
Fertile grassland 1033 1024
Infertile grassland 1061 776
Lowland woodland 1046 1087
Upland Woodland 513 482
Moorland grass mosaics 45 433
Heath and bog 357 363
All vegetation types 804 77
Direction of
significant
changesSoil Zn concentration
(mgkg)
Soil Zn concentration
(mgkg)
Direction of
significant
changes
152
Countryside Survey Soils Report from 2007
7 Soil metal concentrations
Figure 78 Changes (+- 95 CIs) in measured soil Zn concentration in soils (0 -15 cm depth) within a) Broad
Habitats b) Aggregate Vegetation Classes and c) Soil LOI categories across Great Britain Standard errors are
indicated Significant differences p lt 005 p lt 001 p lt 0001 are shown
732 Metals measured only in CS in 2007
Use of a combined ICP-OES approach allowed extension of the suite of measured metal concentrations beyond the initial set of seven metals measured in 1998 to include a total assessment of the concentrations of 26 metal or metalloid elements (Li Be Al Ti V Cr Mn Fe Co Ni Cu Zn As Rb Se Sr Mo Cd Sb Sn Cs Ba W Hg Pb U as well as Cd Cr Cu Ni Pb V and Zn) in almost 500 GB soil samples Seven of these single time point measured metals are reported here but the full dataset is available for download from the CS website The analysis includes stratification of the data available for each chosen metal by Broad Habitat and Soil LOI category The seven chosen metals and metalloids have been selected for initial assessment because they have a known toxicity to humans and wildlife and so have been of long -standing
-75
-50
-25
0
25
Bro
adlea
f
Coni
fer
Ara
ble
Impro
ved
Gra
ss
Neut
ral G
rass
Acid
Gra
ss
Shr
ub Hea
th
Bog
All ha
bita
ts
Ch
an
ge i
n s
oil
Zn
co
ncen
trati
on
(mg
kg
)
-75
-50
-25
0
25
Cro
ps a
nd w
eeds
Tall g
rass
and
Her
b
Fertile
grass
land
Infe
rtile g
rass
land
Upla
nd W
oodlan
d
Moo
rland
gra
ss m
osaics
Heat
h and
bog
All ve
geta
tion
type
s
Ch
an
ge i
n s
oil
Zn
co
ncen
trati
on
(mg
kg
)
-75
-50
-25
0
25
Min
eral
Hum
us-m
iner
al
Org
ano
-min
eral
Org
ani
c
Ch
an
ge in
so
il Z
n c
on
cen
trati
on
(mg
kg
)
a) Broad Habitats
c) LOI categoriesb) Aggregate vegetation class
153
Countryside Survey Soils Report from 2007
7 Soil metal concentrations
regulatory concern because they are essential metals that can elicit both deficiency at low concentration and toxicity at high concentration and or because new application (fuel additive nanomaterial) means that current commercial and consumer product uses are increasing Specific reason for selection for each metalmetalloid are
Al is selected as it is common in soils and has been w idely implicated in toxicity during
acidification
As is selected as it is a known risk for food chain transfer to wildlife and humans
Mn is selected as it is widely used in an increasing number of commercial products
Hg is selected because it is the focus of the Defra Critical Loads metals project and also because
no change has been detected in European Moss Surveys indicating continued deposition at historic
rates
Mo is selected as it is essential and is currently one of the focus metals for EU wide m etals risk
assessment activities
Se is selected as it has a small ldquowindow of essentialityrdquo meaning it is known to cause toxicity at
high concentration but and also to be deficient at low levels in soil
Ti is selected as it is of growing regulatory concern due to commercial uses including in
nanoparticle forms
Aluminium Concentrations of aluminium were higher than those of Cd Cu Cr Ni Pb Zn As Mn Hg Mo Se or Ti by at least a factor of ten and more than this in many cases Within Broad Habitats concentration ranged from 2060 mgkg in Bog to almost 12000 mgkg in Arable and Horticulture and Improved Grassland soils Habitats that are associated with lowland areas on mineral soils such as Improved and Neutral Grassland and Arable and Horticulture contained significantly higher Al concentrations than habitats such as Dwarf Shrub Heath and Bog which are associated with upland areas on organic of organo -mineral soils (Fig 79) The analysis by LOI indicates that Al concentrations in soils are significantly different in organic soils when compared to the three remaining soil categories Since organic soils are most commonly found in habitats such as Bog and Dwarf Shrub Heath this suggests that the soil type associated with these habitats may have important influences on soil Al concentration Particularly important are likely to be the lower pH of soils in upland habitats and also high rainfall rates found in these areas Both of these factors can lead to greater metal mobility resulting in greater leaching losses Figure 79 Measured soil Al concentration (+- 95 CIs) in soils (0-15 cm depth) within a) Broad Habitats b) Soil
LOI categories across Great Britain Columns not sharing the same letter are significantly different at p lt 005
level
ba
0
2000
4000
6000
8000
10000
12000
14000
16000
Bro
adlea
f
Coni
fer
Ara
ble
Impro
ved
Gra
ss
Neut
ral G
rass
Acid
Gra
ss
Shr
ub Hea
th
Bog
S
oil
Al
co
ncen
trati
on
(mg
kg
) a
bb
ab
a
c
d
a
0
2000
4000
6000
8000
10000
12000
14000
Min
eral
Hum
us-
min
era
l
Org
ano-
min
eral
Org
anic
So
il A
l co
ncen
trati
on
(mg
kg
)
aa
b
a
154
Countryside Survey Soils Report from 2007
7 Soil metal concentrations
Arsenic
Concentrations of arsenic analysed by Broad Habitat ranged 302 mgkg in Bog to 1102mgkg in soils under
Improved Grassland (Fig 710) When As concentration are compared across habitats it is evident that the
highest concentration like those for Al are found in Arable and Horticulture and Improved and Neutral
Grasslands Acid Grassland and Broadleaved and Coniferous Woodland soils were intermediate while
habitats associated with more remote and upland area such as Bogs and Dwa rf Shrub Heath soils contain
significantly lower As concentration than soils in lowland agricultural habitats ( Fig 710) Analysis by soil LOI
category indicated that soil As concentrations were significantly higher in mineral soils than in Organo -
mineral and Organic soils (Fig 710)
Figure 710 Measured soil As concentration (+ - 95 CIs) in soils (0-15 cm depth) within a) Broad Habitats b)
Soil LOI categories across Great Britain Columns not sharing the same letter are significantly different at p lt
005 level
Soil Arsenic (As) levels in GB soils measure in CS in 2007 were interpolated using median indicator kriging
to predict the probability of exceeding the median value of the data set (807 mgkg) The use of indicator
kriging rather than ordinary kriging and spatial interpolation arises because of the type of data being
analyzed In the case of soil metals and metalloids the assumption of connectivity between sample points
with extreme values in space is not necessarily va lid As a result ordinary kriging incorporating these
extreme values provides erroneous interpolation biased towards extreme s Indicator kriging provides a
method of spatially interpreting the underlying patterns in the data without such a bias interpo lating the
probability that the data falls above or below a given threshold A probability of 1 or above indicates that the
data exceeds the specified threshold value represented by the median concentration (As 807 mgkg) at that
location Data were interpolated in this manner onto a 1 km GB grid Mapping of As concentration as the
probability to exceed median values indicates highest probability of exceedance (ie high likelihood of high
concentrations) in soil in the Midlands and south of England and Wales (Fig 711) This spatial distribution of
As reflects patterns in As concentration measured in previous soil and stream sediment surveys such as the
NSI soil metal survey and G-BASE The higher frequency of above average soil As concentrations found in
these regions can be linked to the known presence pf As rich Jurassic and Cretaceous rocks from which the
surfaces soils are derived Indeed areas of the south-west of England notably in Devon and Cornwall are
well known for the prevalence of historic arsenic mining areas (eg in the Tamar valley)
ba
0
2
4
6
8
10
12
14
Bro
adlea
f
Coni
fer
Ara
ble
Impro
ved
Gra
ss
Neut
ral G
rass
Acid
Gra
ss
Shr
ub Hea
th
Bog
So
il A
s c
on
cen
trati
on
(mg
kg
) bc
a a
c
ab
cd
d
bc
0
2
4
6
8
10
12
Min
eral
Hum
us-
min
era
l
Org
ano-
min
eral
Org
anic
So
il A
s c
on
cen
trati
on
(mg
kg
)
b
c
a
ab
155
Countryside Survey Soils Report from 2007
7 Soil metal concentrations
Figure 711 Map of probability that a plot exceeds the median value of 807 mgKg As in soils (0 -15 cm)
collected from across GB in CS in 2007 ndash value of one indicate guaranteed exceedance values of 0 non
exceedance
Manganese
Mean manganese concentrations varied between Broad Habitats by approximately an order of magnitude
ranging from 46 mgkg in Bog and 566 mgkg in Dwarf Shrub Heath to 558 mgkg and 495 mgkg in the
Arable and Horticulture and Improved Grassland soils As for Al and As highest Mn concentrations were
found in habitat categories that are associated with lowland areas located principally on mineral soils These
include soils in Improved and Neutral Grassland and Arable and Horticulture habitats Upland habitats
located on acid organic soils such as Bog Dwarf Shrub Heath and also Acid Grassland showed the lowest
Mn concentrations Coniferous and Broadleaved Woodlands were intermediate Analysis by L OI supported a
role for soil type alone in determining the patterns of Mn concentration between Broad Habitats A clear
pattern of significant reduction in measured Mn concentrations was found in soil categories of increasing LOI
(Fig 712) This suggests that the soil characteristics in some habitats such as the lower mineral soil
content and typically lower pH values of Bog Dwarf Shrub Heath and Acid Grassland habitats coupled to
high rainfall in the upland areas may be important in explaining obser ved differences through their effects on
leaching rates
156
Countryside Survey Soils Report from 2007
7 Soil metal concentrations
Figure 712 Measured soil Mn concentration (+ - 95 CIs) in soils (0-15 cm depth) within a) Broad Habitats b)
Soil LOI categories across Great Britain Columns not sharing the same letter are sig nificantly different at p lt
005 level
Mercury Mercury was the sole metal amongst the 13 discussed in detail in this chapter for which measured concentration frequently did not exceed the analytical limits of detection Of the 414 samples successfully digested and analysed for Hg concentration 175 (42) contained Hg concentrations that were below the detection limit of 0067mgkg When correcting the low level unquantified samples to a value of half the analytical detection limit in accordance with standard practice measured Hg concentration between habitats ranged from 0052 mgkg in Arable and Horticulture soil to 0187 in Bog Stratification by Broad Habitat indicated a contrasting trend to Al As and Mn for soil Hg Thus highest concentrations were found in Bogs Dwarf Shrub Heath and Acid Grassland and lowest concentration in Arable and Horticulture and Improved and Neutral Grassland Hg concentrations were also influence by soil LOI category showing significant differences between all treatments with highest values in organic soils ( Fig 713) At high concentrations Hg is known to be toxic to biota and also to accumulate in food chains High Hg concentrations have for example been detected in tissues of piscivorus species in the UK Predatory Bird Monitoring Scheme suggesting that this may be an important exposure route particularly for organic mercury The presence of higher concentrations of Hg associated with habitats such as Acid Grassland Dwarf Shrub Heath and Bog and with Organic soils indicates that the greatest potential for Hg exposure in wildlife is likely to occur in these principally upland areas
ba
0
100
200
300
400
500
600
700
Bro
adlea
f
Coni
fer
Ara
ble
Impro
ved
Gra
ss
Neut
ral G
rass
Acid
Gra
ss
Shr
ub Hea
th
Bog
So
il M
n c
on
cen
trati
on
(mg
kg
)
cd
a a
b
deef
f
bc
0
100
200
300
400
500
600
700
Min
eral
Hum
us-m
iner
al
Org
ano-
min
eral
Org
anic
So
il M
n c
on
cen
trati
on
(mg
kg
)
c
d
b
a
157
Countryside Survey Soils Report from 2007
7 Soil metal concentrations
Figure 713 Measured soil Hg concentration (+ - 95 CIs) in soils (0-15 cm depth) within a) Broad Habitats b)
Soil LOI categories across Great Britain Columns not sharing the same letter are significantly different at p lt
005 level
Molybdenum Mean molybdenum concentrations ranged between Broad Habitats by less than a factor of two Highest concentrations of 0979 mgkg were found in Dwarf Shrub Heath soils and lowest concentrations of 0581 mgkg in Coniferous Woodlands (Fig 714) The difference in Mo concentration between these two Broad Habitats was significant This was not the case for any other Broad Habitat pair except Coniferous Woodland and Bog Stratification by LOI indicated that mineral soils contain significantly lower Mo concentration than either Organo-mineral or Organic soils Difference in mean concentration were however a ctually rather small (maximum difference 02 mgkg between Mineral and Humus-mineral soils)
Figure 714 Measured soil Mo concentration (+ - 95 CIs) in soils (0-15 cm depth) within a) Broad Habitats b)
Soil LOI categories across Great Britain Columns not sharing the same letter are significantly different at p lt
005 level
ba
0
005
01
015
02
025
Bro
adlea
f
Coni
fer
Ara
ble
Impro
ved
Gra
ss
Neut
ral G
rass
Acid
Gra
ss
Shr
ub Hea
th
Bog
So
il H
g c
on
cen
trati
on
(mg
kg
)
c
d d
bc
ab
c
a
d
0
005
01
015
02
025
Min
eral
Hum
us-m
iner
al
Org
ano-
min
eral
Org
anic
So
il H
g c
on
cen
trati
on
(mg
kg
)
b
a
cd
ba
0
02
04
06
08
1
12
14
16
Bro
adlea
f
Coni
fer
Ara
ble
Impro
ved
Gra
ss
Neut
ral G
rass
Acid
Gra
ss
Shr
ub Hea
th
Bog
So
il M
o c
on
cen
trati
on
(mg
kg
) b abab ab
ab
a
aab
0
02
04
06
08
1
12
14
Min
eral
Hum
us-m
iner
al
Org
ano-
min
eral
Org
anic
So
il M
o c
on
cen
trati
on
(mg
kg
)
a
a
ab
b
158
Countryside Survey Soils Report from 2007
7 Soil metal concentrations
Selenium Se is an essential trace element that is also toxic at high concentrations Hence it is often stated to have a small ldquowindow of essentialityrdquo for env ironmental concentration within which neither deficiency or toxic would be anticipated Measured mean Se concentrations in CS in 2007 soils differed between Broad Habitats by approximately a factor of 4 Highest concentrations were in habitats associated w ith low pH organic rich upland soils such as Bog Dwarf Shrub Heath and Acid Grassland Lowest concentrations were in Arable and Horticulture and Improved and Neutral Grassland soils (Fig 715) Analysis by soil LOI stratification indicated significant differences in Se concentrations between all soils types with highest Se concentration associated Organic soils and a clear trend for decreasing concentration in lower LOI soils Cases of Se toxicity have most frequently been associated with point sourc e industrial release scenarios or the local consumption of vegetables grown on selenium-rich carbonaceous shale derived soils (as affected member of a rural Chinese population) Such exposure scenarios are not relevant to the GB situation indicating that Se toxicity is unlikely to be a major national issue of concern As well as high concentrations being toxic to humans as well as other plant and animal species Se can also affect plant growth and animal health as a result of deficiency Again in China th is has been linked both to effects of crop production and also to human disease (Wang and Gao 1998) Currently no criteria exist that set a critical concentration for Se deficiency in soils For plants growing on potentially Se deficient soils it is clear that the value for deficiency will depend on both the plant species considered and also the effect of soil properties on Se bioavailability Further for establishing a lower level for human food consumption and for animal (incl uding livestock) health the composition of the diet and the proportion that is grown on Se deficient soils is also an important factor especially when a prominent portion of diet sourced locally On the basis of published studies probable concentrations for deficiency are likely to be in the range 01-025 mgkg In GB soils no plot contains Se levels below these concentrations Taking a conservative value of 05 mgkg as an indication of potentially deficient soil only 8 of 414 plots (19) contain soi l Se level below this value Hence it is unlikely that deficiency in soils Se concentration is a major factor that is influencing the nature of prevalent plant communities across GB Figure 715 Measured soil Se concentration (+ - 95 CIs) in soils (0-15 cm depth) within a) Broad Habitats b)
Soil LOI categories across Great Britain Columns not sharing the same letter are significantly different at p lt
005 level
Titanium TiO2 is currently one of the most widely used nanoparticle types in consumer products Concerns about the potential effects of nanoparticle on human health and wildlife have resulted in a growing interest in the biogeochemistry of titanium Particularly important is to establish baseline concentration of Ti in so il waters and sediments since these provide a natural background against which any additional input of Ti in
ba
0
05
1
15
2
25
3
35
4
45
Bro
adlea
f
Coni
fer
Ara
ble
Impro
ved
Gra
ss
Neut
ral G
rass
Acid
Gra
ss
Shr
ub Hea
th
Bog
So
il S
e c
on
cen
trati
on
(mg
kg
)
a
aa a
a
a
a
a
0
05
1
15
2
25
3
35
4
Min
eral
Hum
us-m
iner
al
Org
ano-
min
eral
Org
anic
So
il S
e c
on
cen
trati
on
(mg
kg
)
b
a
c
d
159
Countryside Survey Soils Report from 2007
7 Soil metal concentrations
nanoparticle form would have to be detected In GB soil measured Ti concentrations ranged between Broad Habitats by approximately a factor of 3 from a highest concentration of 109 mgkg in Bog soils to 325 mgkg in Neutral Grassland (Fig 716) Between Broad Habitats soils from Bog Dwarf Shrub Heath and Acid Grassland contained higher concentrations than Arable and Horticulture and Neutral and Improved Grassland with Broadleaved and Coniferous Woodland intermediate Stratification by LOI indicated that mineral soils contained significantly lower Ti concentration than Oragno -mineral soils The analysis indicates a relatively high background level of Ti in GB soils (50-100 mgkg) against which any future inputs of titanium must be detected Figure 716 Measured soil Ti concentration (+ - 95 CIs) in soils (0-15 cm depth) within a) Broad Habitats b)
Soil LOI categories across Great Britain Columns not sharing the same letter are significantly different at p lt
005 level
74 Discussion and Policy Implications
A number of surveys have measured metal concentrations in soils and stream sediments collected from a network of sites within GB or constituent countries The UK Soil and Herbage Survey conducted by the Environment Agency (EA) for England and Wales measured concentrations of 13 elements (Cd Cr Cu Mn Hg Ni Pb Pt Ti V Zn Sn As Zn) in soil and vegetation from 122 rural sites 29 urban sites and 54 industrial sites across the UK (Ross et al 2007) Measurement of soil (015cm) trace element concentrations were accompanied by additional measurements of the concentration of organic pollutants including polychlorinated biphenyls polycyclic aromatic hydrocarbons and polychlorinated dioxins and furans Analysis of the data was conducted to assess mean concentration o f measure trace pollutants and metals in soil according to Country (England Scotland Wales) and site location ( rural urban industrial) All data from the UK Soil and Herbage Survey has been published To date however the sampling and analysis campaig n has not been repeated meaning that an assessment of change in trace element concentration is not possible within the dataset An extensive survey of metal concentration in UK soils has also been conducted within the framework of the National Soil Inventory (NSI) program This study has reported on a range of properties of UK soils including total and extractable metal concentrations in over 6000 soil samples collected across England and Wales with further data for Scotland available through the NSI Scotland Phase 1 and 2 projects A set of detailed spatially resolved maps have been produced from this data which include maps of soil metal concentration (McGrath and Loveland 1992) The Geochemical Baseline Survey of the Environment (G-BASE) which is coordinated by the British Geological Survey (BGS) is also a large scale and long running survey of stream water stream sediment and soil chemistry that has measured metal concentrations in stream and soil
ba
0
20
40
60
80
100
120
140
160
180
Bro
adlea
f
Coni
fer
Ara
ble
Impro
ved
Gra
ss
Neut
ral G
rass
Acid
Gra
ss
Shr
ub Hea
th
Bog
S
oil
Ti
co
ncen
trati
on
(mg
kg
)
bc
d cd d
ab
aa
cd
0
50
100
150
200
250
Min
eral
Hum
us-m
iner
al
Org
ano-
min
eral
Org
anic
So
il T
i co
ncen
trati
on
(mg
kg
)
a
a
a
b
160
Countryside Survey Soils Report from 2007
7 Soil metal concentrations
samples (5-20 cm depth) collected at an average density of one sample every 1ndash2 km2 of UK land surface
(wwwbgsacukgbasehomehtml) To date G-BASE has been completed for all regions except the Southern third of England with this area is scheduled for completion over the next decade Compared to the EA NSI and BGS surveys the soil component of Countryside Survey in 2007 has a spatial resolution for the trace metals comparable with that of the EA‟s UK Soils and Herbage survey The Soil and Herbage survey included 205 sample sites while CS has measurements for 256 squares although within each square 5 samples in CS in 1998 and 2 in CS in 2007 have been measured The spatial resolution of CS is however below those of either the G-BASE or the NSI datasets which each comprise a much greater number of analysed samples Compared to the other major soil and stream sediment survey con ducted in the UK CS is unique because sites are visited over a single season at time periods separated over a number of years (6-9 year intervals between surveys) Within the soil component of CS samples have been collected on three occasions in survey years (1978 1998 2007) and trace metal concentrations measured in the surveys in 1998 and 2007 This means that CS has the unique ability to look for large scale change in soil properties including trace metal concentrations over time within GB top soils (0-15 cm) Despite the (relatively) sparse spatial resolution CS soil metal analyses can nonetheless be a valuable addition to current knowledge on trace element concentrations in GB soils In particular because soil metal concentrations are not measured in isolation but instead form part of a wider survey of the physical chemical and biological characteristics of GB habitats measurement of soil metal concentrations can be stratified and correlated according to a range of other measurement parameters Metal content of soil is derived from two main sources (Boruvka et al 2005) - either naturally from the geogenic weathering of base rock during soil formation (pedogenesis) or anthropogenically through point source or diffuse pollution andor solid waste disposal (Merian et al 2004) There is therefore a need to consider both potential sources when assessing d ifference in metal concentration between habitats and also over time In the absence of human inputs it can be expected that the metal concentration of soils will reach a steady state which represents the balance of inputs derived from weathering and natu ral deposition (eg volcanic) and outputs due to leaching and vegetative off -take Additional human associated inputs can result in an increase in soil metal concentrations because the increased fluxes to soils will mean that inputs exceed outputs thereby allowing concentrations to rise As soil concentrations start to increase due to for example human associated deposition rates of leaching will begin to increase until eventually a new steady state at a higher soil metal concentration is reached - although this may take decades to hundreds of years depending upon the metal If inputs then reduce long-term reductions in soil concentrations may be initiated as leaching rates exceed inputs Available evidence from the UK Heavy Metal Deposition Monitor ing herbarium studies and Europe-wide survey of metal concentration in moss samples suggests that currently the rates of aerial deposition of metals to soils peaked in the UK in the 1960-1970s and are now in steady decline (RoTAP 2010) Legislation on the concentrations of metals present in fertilisers (especially Cd) domestic and industrial sludges and other waste streams regularly recovered to land have also been effective in reducing input concentrations for a range of trace elements Although input ra tes are likely to be decreasing work within Defra supported projects to assess environmental risks of metals for UK soils still predict exceedances of estimated critical load for Cd and Pb in 96 and 6 of UK soil respectively (Hall et al 2006) Comparison of the concentrations of Cd Cu Pb and Zn measured in CS soil samples in 1998 also indicated that measured concentrations exceeded the soil pH and LOI corrected critical limits for these metals as developed by Lofts et al (2004) within Defra funded projects to develop a critical loads approach for trace metals by at least a factor of 3 in 0 207 155 and 221 of soil samples for Cd Cu Pb and Zn respectively (Spurgeon et al 2008) These analyses suggest that soil metal concentrations in GB are elevated as a result of direct inputs and that risk to soil communities as a result of this metal loading cannot be excluded With inputs in potential decline a key aim in CS was to see whether the trend for increasing soil surface metal concentration has been reversed to the point where leaching and other losses may exceed inputs and so measured soil metal concentrations may have started to decline a t a rate detectable in the timeframe of successive Countryside Surveys When looking for change between temporally separate surveys it is important to consider the influence that any difference in survey methods may play since differences in method may lead to potentially spurious indications of change Unfortunately in the case of soil metal analysis within CS a major change in the analytical procedure had to be implemented because of changes in the infrastructure available at the analytical laboratory In particular the hot plate reflux system used for the
161
Countryside Survey Soils Report from 2007
7 Soil metal concentrations
digestion of all soil in CS in 1998 was not available for the reanalysis in 2007 The alternative method used was microwave digestion For both procedures the regent used was Aqua Regia While use of the same reagent for digestion is an important consideration it is also possible that the changes in the temperature and pressure condition during digestion may have an effect on digestion efficiency and on concentrations measured from similar samples To investigate this results for the standard reference material BCR CRM141R calcareous loam soil which was measured multiple times through the analysis programme of both surveys were compared to determine whether the different digestion methods used result ed in similar estimates of trace element concentration in the CRM The CRM assessment was supported by a targeted reanalysis of 1998 collected soils using the 2007 method The comparison of measured concentration in the CRM revealed that the two methods gave slightly different quantification for Cd Cr Cu Ni Pb V and Zn concentrations (Table 72) and this was supported the results of the reanalysis of CS in 1998 soils (Table 73) Thus to allow change analysis a back correction of 1998 measurements wa s conducted to recalculate measured concentration for the 1998 soils to a predicted concentration that would be expected assuming analysis using the 2007 method This was done by dividing 1998 measurements by the ratio of the 19982007 mean measured concentrations for the BCR CRM141R analyse Checks that a single value for correction was applicable to all soils were conducted by plotting predicted change between surveys against both the LOI and pH measured in CS in 2007 soils These plots indicated no clear trend for difference with LOI for 6 of 7 metals and no clear trend for 5 of 7 metals for pH Exceptions were V which showed dependency of change on pH and LOI and Cr which showed slight dependency for pH With metal inputs to GB soils estimated to be fa lling dynamic modelling within Defra funded projects on critical loads assessment has been used to estimate the potential residence times of some existing pollutant metals in UK soils This has suggested that the metals will reside in soils for at least m any decades even for relatively mobile metals (eg Cd Zn) and possibly many millennia for metals that have a high affinity to soil organic matter (eg Cd Pb) (Tipping et al 2006b) Extensive datasets on the rates of change of concentrations of metals in soils are currently however scarcely available against which to validate these model predictions The analysis of change between back corrected 1998 data and measurements made in CS in 2007 outlined here can be used to provide initial insight into the rates of change of soil trace metal concentrations Results indicated that generally only small scale changes in measured soil metal concentrations were found between survey years Comparison of concentration indicated that a change in estimated 1998 and measured 2007 concentrations of greater than 10 wer e found in 6 of 21 stratification levels (Broad Habitat AVC soil LOI Category) for Cd 9 of 21 for Cr 13 of 21 for Cu 3 of 20 for Ni 3 of 20 for Pb and 5 of 22 for Zn The small magnitude of change in soils estimated between surveys means that a sig nificant change in concentrations at the GB scale was detected only for Cu For this metal a small magnitude but highly significant estimated increase in measure concentration of 2 mgkg was detected No other metal showed a significant change in measured concentration across GB Stratification of the data by Broad Habitat AVC and soil LOI revealed addition information about patterns of change in soil metal concentrations in different strata All metals showed significant change for at least one category level Importantly when considering stratification by so many categories the potential for type 1 statistical error is increased in line which the number of strata considered To include analysis by broad AVC and soil LOI category involves separate statistical testing of approximately 20 separate categories for each metal Since the significance of each is calculated separately and the cut off for statistical significance was 005 it will be expected that for each analyte one type I error (ie a false positive where a truly non-significant result is deemed significant in a test) would be anticipated within the analysis While multiple sample correct algorithms can be used to control for type I error arising from multiple testing for significance in CS such algorithms are not used because the extra stringency for type 1 error come with the penalty of an increase probability of type 2 errors (ie a truly significant result deemed non-significant in a test) This could mean that truly significant effects at the national scale are missed with potential impact for the environment and policy Where statistically significant effects are found careful review of relevant evidence that supports these as true responses is needed In particular identification of po tential drivers of change is needed as discussed briefly below Cadmium Soil (0-15cm) Cd showed only relatively small changes between survey with an overall decline of 0013 mgkg (3) in 2007 soils The only statistically significant change found related to a significant decrease in soil Cd in Heath and Bog vegetation and Organo-mineral soils The overall decline in Cd concentration might reflect declining deposition of this metal as detected in monitoring programs Cd is a particularly labile metal
162
Countryside Survey Soils Report from 2007
7 Soil metal concentrations
and as a result it may be expect to show relatively rapid leaching from soils leading to reduced soil Cd levels There is no obvious reason why either Heath and Bog vegetation or Organo -mineral soil should show significant reductions in soil Cd while other habi tats do not One possibility is that the remaining presence of Cd in some fertiliser may be maintaining Cd concentration in farmed soils while in soils that are not subjected to fertiliser application during land management soil Cd loses may now exceed in puts allowing concentration to reduce Chromium Soil (0-15cm) Cr showed a decrease of 09 mgkg (46) between 1998 and 2007 Broadleaved Wooodland Arable and Horticulture and Improved and Neutral Grassland soils characterised by Crop and Weed and Fertile Grassland vegetation showed significant decreases in soil Cr levels Decreases were also found in Mineral and Humus-mineral soils Bogs and Organo-mineral soil showed significantly higher soil Cr concentrations The results for Cr initially suggest that in managed habitats particularly those where crops including grass for livestock are grown the predominant trend of soil Cr concentration is down This is not though the case with Acid Grassland Dwarf Shrub Heath and Fen Marsh and Swamp soils which i n addition to Bogs showed increased Cr concentrations There are two potential explanations for the differences in trend in Cr concentration between habitats as observed The first potential cause of the apparent trend in soil Cr concentration is that me asurement errors relating to difference in digestion efficiency between high pH low LOI mineral soils and low pH high LOI organic soils may be in part responsible Comparisons of change across the 2007 soil pH and LOI range indicates that there is no trend for Cr concentration to show greater change in more organic rich soil ( Fig 72) A slight trend for greater change in high pH soil is however indicated ( Fig 71) At a neutral pH this effect results with a potential discrepancy of up to 27 mgkg in back corrected 1998 concentrations Effects of the method shift between surveys may therefore be the cause of some of the observed declines in mineral neutral soils and associated habitats and vegetation classes For low pH soils effects associated wi th method change are likely to be less important as a cause of Cr concentration increase since comparison suggests comparability between predicted 1998 and measured 2007 concentrations at higher pHs In those habitats that are characterised by low pH such as Bogs Acid Grassland and Dwarf Shrub Heath the increased Cr concentration found cannot therefore be disregarded as a methodological error suggesting that in these areas deposition loads may still exceed loses A second potential reason for the habitat difference found in the direction of change of soil Cr concentration that is also worth consideration is the role of cropping as an additional loss flux The habitats where Cr concentrations were increasing namely Arable and Horticulture and Grassla nds are predominately used for agricultural production In these systems harvesting of plants and livestock may provide a route of loss of Cr from soil that is not relevant to areas not under agricultural production Such increased loss may contribute to the reduction in soil Cr found in these areas when compared to uncropped areas Copper Soil (0-15cm) Cu was the only metal that showed a significant change at the GB scale increasing by a mean value of 2 mgkg across the full dataset Comparison of the effect of the change in digestion procedure between surveys by analysis of CRMs indicated that only a small change in measured Cu concentration resulted This meant that only a small correction factor needed to be applied to the 1998 measured values Analysis of change in soil Cu between back corrected 1998 and 2007 values in relation to both soil pH and LOI indicated that the magnitude of Cu change in soils could not be related to either parameter The small size of overall change between CRM measurements made by different methods and also the absence of trends with soil pH and LOI suggests that the change in digestion procedure was not a major contributing factor behind the observed increase in soil Cu concentrations Within habitats Improved Grasslands Dwarf Shrub Heath and Bog also showed significant increases in soil Cu as did the AVCs associated with these habitats Significant changes in 3 of 4 soil LOI categories were also found Cu has a high affinity with soil organic matter and so it may be expected to show only very low rates of leaching loss from soils Even if inputs of Cu in soils were reduced to zero it would be anticipated that the Cu that has already been loaded into GB soils would take a considerable time (perhaps many centuries) to be completely leached Monitoring networks have shown that the concentrations of Cu being deposited to soil are likely to be decreasing as a result of tighter emission controls However in contrast to other metals the
163
Countryside Survey Soils Report from 2007
7 Soil metal concentrations
magnitude of these decreases in deposition remains relatively modest For example Cu deposition had reduced by only 20 in a European wide survey of metal concentration in mosses compared to 72 for As 72 for Pb 60 for V and 52 for Cd At the same time while deposition has been slight ly decreasing there is a growing body of evidence to suggest that the use of Cu containing supplements in the livestock industry are potentially increasing the Cu load being added to soils under grazed areas and in areas to which animal manures are applied Additionally Cu concentrations are known to be associated with sewage sludge material and green waste which are frequently recovered to land The fact that among habitats Improved Grasslands were found to contain Cu concentrations significantly increas ed by 26 mgkg suggests that the presence of Cu concentration in animal manure may indeed being playing a role in increasing national soil Cu levels to some extent That Cu concentration were also increasing in all other habitats and significantly in some cases can be taken as quite strong evidence that currently Cu inputs still exceed outputs from leaching and cropping leading to further elevation in Cu concentrations over time
Figure 717 Map of estimated change in measures soil Cu concentration (mgkg) in soils (0-15 cm) collected
from across GB in CS in 1998 and 2007
Figure 917 Map of estimated change in
measured soil Cu concentration in soils
(0-15 cm) collected from across GB in CS
in 1998 and in 2007
164
Countryside Survey Soils Report from 2007
7 Soil metal concentrations
An analysis of the spatial structure within estimated change in soil Cu concentrations was conducted by using
kriging to interpolate values for change (Fig 717) This analysis was done using ordinary kriging to
interpolate between the Countryside Survey sample points Routine checking of data for outliers was
conducted and the working data set was transformed using a normal score procedure to obtain a Gaussian
distribution The data were then interpolated on a 1km UK grid using ordinary kriging and finally the kriged
data were back-transformed to produce an interpolated map of Cu change Mapping highlighted significant
spatial structure within the change dataset with greatest increases being associated with hotspots in areas
of the Northern England and Mid and South Wales uplands Where decreases were indicated these were
associated most commonly with reductions in concentration in lowland areas of the South and East England
that are associated with intensive arable land use Mapping of change thus highlights that increases in soil
Cu occurred principally in upland areas where both output fluxes associated with cropping may be limited and
also where livestock rearing may play a role as a potential additional source of Cu input Nickel Soil (0-15cm) Ni increased across all soils by 16 mgkg between survey years Two habitats showed significant decreases in measured soil Ni These were Broadleaved Woodland and Arable and Horticulture Crop and Weed vegetation also showed significant decrease Ni increased significantly in Neutral Grassland and Bogs As decreases were concentrated in habitats associated frequently with neutral low organic soils this raises the possibility that differential digestion efficiency may be a factor in the observed difference as was suggested to be the case for Cr Comparison of trends of change between back corrected 1998 and 1998 measurements however suggests that this was not the case as no trend with either pH or LOI was observed (Fig 71 and 72) The fact that the habitats that showed increases in Ni are associated with different soils types also suggests that analytical artefacts are not the primary cau se of the observed change A second potential cause of change may be the role of cropping as an additional loss flux for this metal as also highlighted for Cr In particular in Arable and Horticulture area harvesting of plants may provide an additional route of loss that allows soil Ni concentrations to decrease Such losses would not be relevant to less productive land such as Bogs where removal of plant biomass does not regularly take place
Lead Soil (0-15cm) Pb concentrations showed a small non-significant decrease between surveys This is potentially consistent with an overall loss of soil Pb in particular as the move to unleaded petrol has substantial decreased Pb inputs over the past two decades Although the overall dataset indicated slight losses two habitats showed significant increases There is no obvious reason why these two habitats Improved Grassland and Dwarf Shrub Heath should show such increases particularly as they are associated with different soil types Among AVCs and soil type no significant change in soil Pb concentrations were found The relatively small change in measured soil Pb and limited significant change in only a small number of unrelated habitat strata suggests that the high affinity of Pb to soil organic matter whi ch results in long predicted residence times for of Pb in soils may currently be limiting rates of Pb loss from soils Thus while deposition maybe decreasing soil Pb concentrations may be doing so only very slowly or not at all Zinc Zn (0-15cm) showed a small non-significant decrease between surveys and Zn concentrations were significantly reduced in two habitats Arable and Horticulture and Neutral Grassland No dependency of change between back corrected 1998 and 2007 measurements on either soil pH or LOI was detected in the dataset This suggests that the decreases seen are probably not the result of an analytical artefact relating to different efficiencies of soil digestion Instead the potential role of cropping as an additional loss flux as highlighted earlier for Cr and also for Ni may be important As deposition rates decrease in those areas where there is loss both from leaching and cropping it is possible that outputs may exceed current rates of metal inputs leading to a small but in some cases significant overall loss of soil Zn
165
Countryside Survey Soils Report from 2007
7 Soil metal concentrations
741 Policy implications The results of the comparison of back corrected 1998 and CS in 2007 analyses indicated that as would be expected only relative small changes in soil trace metal concentrations had occurred between surveys For one metal Cu the difference (an increase) was statistically significant For all metal s when data was stratified further statistically significant differences were seen For Cu these were mainly associated with significant increases for two metals Cd and Pb the changes were small and apparently idiosyncratic while for three metals (Cr Ni Zn) the changes were somewhat similar with reduction seen particularly in crop lands and no change or in some case slight and sometimes significant increases found in less managed habitats Overall the results suggests that at present the changes in deposition that have occurred over recent decades have yet to lead to substantial changes in measure d soil metal concentrations For some metals such as Cu and Cd it is l ikely that additional sources (animal manures and possibly sewage sludge manures and compost for Cu and fertiliser for Cd) beyond atmospheric inputs are important in maintaining or even increase soil concentrations principally in managed areas For the remaining metals especially Cr Ni and Zn there is some suggestion that in areas where cropping takes place output fluxes may now exceed inputs meaning that soil concentrations can start to decline Overall this suggest s that the managed landscape where intensive cropping takes place but sewage sludge animal manures and composts are rarely applied may be among the first habitats to show a return of GB soil metal concentrations from their current slight -moderately elevated states to their pre-industrial background concentrations These areas could thus be a focus for future monitoring
75 References
REFERENCES
Boruvka L Vacek O Jehlicka J 2005 Principal component analysis as a tool to indicate the origin of
potentially toxic elements in soils Geoderma 128 289-300
Emmett BA Frogbrook ZL Chamberlain PM Griffiths R Pickup R Poskitt J Reynolds B Rowe
E Spurgeon D Rowland P Wilson J Wood CM 2008 CS Technical Report No 307 Soils Manual
NERCCentre for Ecology amp Hydrology 180 pp (CEH Project Number C03259)
Hall JR Ashmore M Fawehinmi J Jordan C Lofts S Shotbolt L Spurgeon DJ Svendsen C
Tipping E 2006 Developing a critical load approach for national risk assessments of atmospheric metal
deposition Environmental Toxicology and Chemistry 25 883-890
Lofts S Spurgeon DJ Svendsen C Tipping E 2004 Deriving soil critical limits for Cu Zn Cd and Pb
a method based on free ion concentrations Environmental Science and Technology 38 3623-3621
McGrath SP Loveland PJ 1992 The Soil Geochemical Atlas of England and Wales Blackie Academic
and Professional Glasgow
Merian E Anke M Inhat M Stoeppler M (Eds) 2004 Elements and their Compounds in the
Environment Wiley VCH Weinheim Germany
Ross SM MD W Copplestone D Warriner M Crook P 2007 UK Soil and Herbage Pollutant Survey
Environmental concentrations of heavy metals in UK soil and herbage UK Soil and Herbage Pollutant
Survey Environment Agency p 132
RoTAP 2010 Review of Transboundary Air Pollution Acidification Eutrophication Ground Level Ozone and
Heavy Metals in the UK Defra
166
Countryside Survey Soils Report from 2007
7 Soil metal concentrations
Spurgeon DJ Rowland P Ainsworth G Rothery P Long S Black HIJ 2008 Geographical and
pedological drivers of distribution and risks to soil fauna of seven metals (Cd Cu Cr Ni Pb V and Zn) in
British soils Environmental Pollution 153 273-283
Tipping E Lawlor AJ Lofts S 2006a Simulating the long-term chemistry of an upland UK catchment
Major solutes and acidification Environmental Pollution 141 151-166
Tipping E Lawlor AJ Lofts S Shotbolt L 2006b Simulating the long-term chemistry of an upland UK
catchment Heavy metals Environmental Pollution 141 139-150
Wang ZJ Gao YX 1998 Biogeochemical cycling of selenium in Chinese environments 1st Asia Pacific
Symposium on Environmental Geochemistry Pergamon-Elsevier Science Ltd Hong Kong Peoples R China
pp 1345-1351
167
Countryside Survey Soils Report from 2007
8 Soil invertebrates
Summary
There were an estimated 128 quadrillion (128x1016
) soil invertebrates present in the top 8 cm of
Great Britain soils during the time of Countryside Survey sampling in 2007 C omparing these
results with those from the survey in 1998 has enable change in soil biodiversity to be estimated at
a national scale
A significant increase in total invertebrate catch in samples from soils (0-8cm) from all Broad
Habitats Aggregate Vegetation Classes and soil organic matter categories except for agricultural
areas on mineral soils was found in Countryside Survey in 2007 The increase in invertebrate catch
was mainly the result of an increase in the catch of mites in 2007 samples This resulted in an
increase in the mite springtail ratio but a decreased Shannon diversity due to the dominance of
mites in 2007 cores
A small reduction in the number of soil invertebrate broad taxa (0 -8cm) was recorded which is not
inconsistent with reported declines in soil biodiversity However repeat sampling is required to
ensure this is not linked to different seasonal conditions in the two sampling years F urther
analysis through focussed study may be needed to assess whether the changes in soil chemistry
land management annual weather patterns or merely natural population variation can explain
observed soil invertebrate community changes
81 Policy background
Key Question Does CS provide any evidence to indicate that there has been a loss of soil biodiversity as has been stated by the EU Measurements Enumeration of the number of soil invertebrate presence within Tullgren funnel extractions of 927 separate 4 cm diameter 8 cm long soil cores collected from plots across GB to give 1) total catch of invertebrates from all broad taxa 2) the number of broad taxa represented by the presence of at least one individual in a core 3) total catch of mites and springtails 4) the ratio of Mites Springtails 5) the Shannon Diversity statistic calculated using counts of the number of individuals within broad taxa including springtail superfamily From this analysis CS in 2007 has provided
Whole Broad Habitats Aggregate Vegetation Class and soil type stratified assessments of the
characteristic (total catch broad taxa representation total catch and relative catch of mites and
springtails Shannon Diversity) of soil invertebrate communities across Great Britain
Information of the change in characteristic of soil invertebrate communities in Great Britain soils
(0-8cm) since initial measurement in Countryside Survey in 1998
Data to contribute to analysis of changes in vegetation selected soil properties and other habitat
characteristics between successive Countryside Surveys in 1998 and 2007
The activities of the soil biota are critical for the provision of many important soil functions and resulting ecosystem services These include but are not limited to biomass production storing filtering and transforming nutrients contaminants and water and acting as a biodiversity pool from which future novel applications and products can be derived Because they are intimately involved in many important soil functions and are fundamental to maintaining soil quality the biological components of soils have considerable potential as indicators of soil quality National-level requirements for biological indicators were
168
Countryside Survey Soils Report from 2007
8 Soil invertebrates
outlined in the Soil Action Plan for England (Defra 2004) and have been investigated in a series of projects funded by Defra as part of the UK Soil Indicators Consortium These have been assessing the relative performance of a range of potential soil bioindicators under field conditions At present comparatively l ittle is known about the biodiversity of soil compared to for example above ground diversity In the microbial realm molecular approaches such as terminal restriction fragment length polymorphism (tRFLP) phylogenetic microarrays and metagenomics are starting to reveal patterns in the diversity and distribution of soil microbes For the soil meio- meso- and macro-fauna molecular approaches to biodiversity assessment still remain in development For some key groups such as earthworms and springtails good keys to the UK and other national fauna do exist although even in these cases traditional morphological taxonomy can be hampered by cryptic speciation (ie occurrence of groups of species which are reproductively isolated from each other but have high morphological similarity) and other taxonomic uncertainties Beyond these better known groups in taxa like mites and nematodes there are significant issues for morphological identification associated with the lack of keys laborious nature of the work and declining expert base Because they are often poorly known few soil species are recognised for their conservation value A few such as some ants and fungi are covered by UK Biodiversity Action Plan (UK BAPs) However as knowledge of soil biodiversity is often sparse it is not well known if and how climate land use land management change and pollution affect populations of even these relatively well known and highly valued species let alone the large amount of often hidden diversity that maybe present in soils Beyond the few soil species covered by BAPs there is a well recognised need to quantify soil biodiversity and determine whether it is possible to observe consistent patterns of population and community structure against a dynamic background of spatial and seasonal variability Key questions in this area of research and conservation relate to determining if and how soil biodiversity changes over time and the nature of the environmental drivers of any such changes Large-scale biodiversity assessment as well as long-term experiments and focussed mesocosm and laboratory studies are all important tools that can contribute data to improve current knowledge in this area
82 Methods
821 Proof of concept
Invertebrate diversity was first measured as part of CS in 1998 and CS is the first and only national scale monitoring of soil biodiversity in the UK The inclusion of invertebrate diversity measurements in CS in 1998 was partially driven by a 1996 report of the Royal Commission on Environmental Pollution (RCEP) on the Sustainable Use of Soils which identified the development of indices of soil biological activity and diversity as a key research priority In the RCEP report it was recognised that a major difficulty in developing soil biodiversity based indicators was the requirement for baseline data on population and community structure and how these change over time It was within this context of a need for baseline information that an assessment of soil biodiversity was deemed timely within CS in 1998 CS was chosen as a suitable vehicle for the assessment because the existing survey infrastructure and sampling regime used in CS could provided a cost-effective framework for integrating a soil biological survey into a study that already included assessment for other land use soil vegetation and water parameters The aim of the soil invertebrate diversity measurements that were conducted in CS in 1998 (enumeration of mainly mesofauna groups collected by Tullgren extraction of a relatively small soil core) was not to sample and identify all invertebrate diversity within a given plot Such an all-taxa biodiversity inventory would instead require use of a wide range of sampling techniques and would be a massive undertaking and highly expensive Instead the aim of CS in 1998 was to produce an initial baseline dataset of invertebrate group level community composition across all major soil groups and habitats of Great Britain The strategy was to capture soil invertebrates that would be abundant and relatively cost -effective to identify The group of soil
169
Countryside Survey Soils Report from 2007
8 Soil invertebrates
invertebrates that best suited these criteria was the soil mesofauna To sample the soil fauna intact soil cores (4 cm diameter 8 cm long) were collected for laboratory extraction of mesofauna This approach was favoured over the use of an on-site hand-sorting technique which would be effective for macroinvertebrates or pitfall trapping which would preferentially sample soil surface active invertebrates Identification of the extracted invertebrates was conducted to broad taxa (phylum order) level for all available and successfully extracted samples (total 1076) collected from CS squares that were initially visited in the 1978 survey Table 81 Overview of soil invertebrate samples and level of taxonomic resolution for CS in 1998 and 2007
1998
2007
Main Plots
km-squares
Main Plots
km-squares
Total sampled 1286 256 927 238 Broad invertebrate taxa 1076 237 927 238 Mites (Acari) Separated to broad group a
-
-
238
90
Checked for Oribatid presence 963 237 238 90 Oribatids present 504 182 212 90 Oribatids identified to species b 504 182 - - Springtails (Collembola) Checked for Collembola presence Separated to broad group c
1076
237
927
238
Collembola present 837 233 816 238 Collembola identified to species 336 176 - -
a Separated into Oribatids Mesostigmatids and Prostigmatids
b PresenceAbsence data only
c Separated into Entomobryoidea Poduroidea Neelidae and Sminthuridae
While the invertebrate sampling undertaken in CS in 1998 identified and enumerated invertebrates extracted to broad taxa for all cores it was also decided to undertake a limited identification of some taxa to a deeper taxonomic resolution (Table 81) Of the two main mesofaunal groups the mites and springtails the mites (Acari) were checked for the presence of the most common major group the oribatidae in the community sample while the Collembola were identified into the superfamily groups of entomobryoidea neelidae poduroidea and sminthuridae In the CS in 1998 samples 504 samples were check for the presence of oribatids mites and all 1076 separated to superfamily for the Collembola In all of the 504 samples checked for oribatids additional identification of mites was undertaken to establish the presenceabsence of individual oribatid species This species level identification was conducted on a voluntary basis by Mr Frank Monson For the springtails species identification and enumeration was conducted for 336 samples representing approximately one third of available samples Analysis of the patterns of distribution of invertebrates in CS in 1998 detected significant differences in invertebrate diversity between Environmental Zones Broad Habitats ITE L and Classes Aggregate Vegetation Classes and Soil Types The 1998 CS dataset forms a valuable baseline that can be used to place specific site region and country-scale changes within a regional and national environmental context Resampling of the CS sites in 2007 provided an opportunity to determine whether these patterns of invertebrate diversity can be consistently detected against a background of spatial and temporal heterogeneity within soil communities The detailed protocols that were developed for soil invertebrate sampling in CS in 1998 have been used for the re-sampling in 2007 By returning to the majority of the CS plots first sampled in 1998 CS in 2007 can
170
Countryside Survey Soils Report from 2007
8 Soil invertebrates
provide information on the temporal stability of soil communities Resource limitations in 2007 meant that it was not possible to identify all invertebrates in all the cores that were collected from the remaining Main Plots that were first sampled in 1998 Of the cores that were available from re -sampled sites a total of 927 cores have been enumerated to broad taxa Of these 927 samples superfamily level identification was conducted for the springtails for all cores and separation of mites to major group for 238 Limited resources meant that no species level identification could be supported although all extracted invertebr ates have been stored and can be made available for future identification on request Soil invertebrate sampling and analysis throughout the CS project is summarised in Table 82 below Table 82 Summary of rationale for measurement of soil invertebrate community composition in CS
Facts Comments
History in CS First measured in CS in 1998 for Main Plots in original 1978 squares only (total 1076 samples)
Repeat of most plots in CS in 2007 to initiate first ever national time-series for soil community assessment
Country level reporting No CS in 1998 did not give country level statistics Smaller data-set in 2007 limits power for Country level reporting for habitat vegetation and soil types stratifications
Links and compatibility to other monitoring programmes
No other GB wide survey or monitoring programmes for soil mesofauna Earthworms surveys being undertaken in Scotland and as part of the Opal project run by the Natural History Museum London
CS unique in UK as soil biodiversity assessment is integrated with other survey approaches that measure land use vegetation soil properties and waters Other countries such as the Netherlands Germany and Canada also have programmes involving biodiversity assessments Measurements of microarthropods are compatible with these schemes
Uniqueness of CS No other GB datasets Only UK wide dataset for mesofauna communities Only UK dataset with time series from repeat visits
Value for money (Policy priority or interpretative value x cost)
Medium Policy relevant and scientifically significant Relatively low cost
Important to establish whether it is possible to detect meaningful changes against spatial and temporal variability
Important in interpreting other data such as UK microbial survey and for integrated assessment
Samples for invertebrate identification and enumeration were collected at all selected Main Plots This included all of the original 1978 256 squares sampled in CS in 1978 that could be revisited Sampling was undertaken using 4 cm diameter by 8 cm long white plastic core following the detailed field protocol described in Emmett et al (2008) and briefly summarised in Chapter 1 Briefly surface vegetation was removed to reveal the soil surface Any litter layer present was not removed The core was knocked into the
171
Countryside Survey Soils Report from 2007
8 Soil invertebrates
ground to the full length of the core using a mallet and plate In stony or shallow soils the sampling point was moved if a full core depth would not be obtained Any such variations in core location were recorded On removal of the core from the ground the outside of the core was cleaned and any excess soil trimmed from the bottom of the core Caps were then gently pushed over the ends of the core and the intact sample posted to CEH in Lancaster as the quickest route of return given the countrywide nature of the sampling programme Soil invertebrates were extracted from cores as soon as possible using a dry Tullgren extraction method This uses surface heating of the exposed surface of the core to drive the soil fauna downwards and out of the open bottom end of the core and into the collection bottles filled with a 70 ethanol preservative below Once collected soil invertebrates were identified to major taxa (Taxonomic level 1) and counted The broad taxa categories used for enumeration was acari araneae chilopoda ndash geophilomorpha chilopoda ndash lithobiomorpha chilopoda coleoptera collembola ndash entomobryoidea collembola ndash neelidae collembola ndash poduroidea collembola ndash sminthuridae copepoda diptera diplura diplopoda gastropoda hemiptera hymenoptera isopoda lepidoptera nematoda nematomorpha oligochaeta opiliones pauropoda protura pseudoscorpions psocoptera pulmonata symphyla thysanura thysanoptera unknown All extracted invertebrates collected from counted cores have been stored in ethanol and are available for further species level identification to interested parties Invertebrate numbers were reported for each quantified soil core
822 Quality control
After an initial identification to broad taxa mite group and springtail superfamily at regular intervals the samples were reassembled and resorted identified and enumerated by an alternative member of staff This second identification and count ing step was then compared with the original count to assess the potential for operator error during processing If any substantive differences in count were found by this cross checking procedure counting was halted and the differences in identifications that lay behind the discrepancies resolved by the counting team Any such changes were noted on the record sheets kept for each sample
823 Reporting
Change in the composition of the soil invertebrate communities as represented by c ounts of the macro and mesofaunal group collected by Tullgren extraction of soil cores collected in CS in 1998 and 2007 have been analysed using a mixed modelling approach using the SAS statistical software platform The statistical approach used for analysing the data for change involved bootstrapping which allows for non-normality in the data without the necessity to know details of the actual distribution As such it provides a more accurate measurement of significance than alternative approaches Annex F of Emmett et al (2008) provides a background document describing the basis of the mixed model procedure As well as looking for overall change at the GB wide scale statistical analyses have been conducted to assess change of measured or calculated parameters soil community parameters within different strata w ithin the data-set These include analysis according to stratification by Broad Habitat Aggregate Vegetation Class and Soil Loss on Ignition (LOI) category which are briefly described here
Broad Habitat - The Broad Habitat classification consists of 27 habitats which account for the entire
land surface of Great Britain and the surrounding sea Countryside Survey reports on 10 major
terrestrial habitats
Aggregate Vegetation Class (AVC) ndash is a high level grouping of vegetation types produced from a
quantitative hierarchical classification of the different plant species found in the original Countryside
Survey sample plots Soil organic matter (LOI) category - mineral (0-8 LOI 0-44 g C kg
-1) humus-mineral (8 ndash 30 LOI
44-165 g C kg-1
) organo-mineral (30 ndash 60 LOI 165-330 g C kg-1
) and organic (60 ndash 100 gt 330 g
C kg-1
)
172
Countryside Survey Soils Report from 2007
8 Soil invertebrates
Measured and calculated parameters that were used as inputs for the analysis were
1 Total catch of invertebrates from all broad taxa to give a measure of overall abundance of invertebrates in CS cores
2 Number of broad taxa represented by the presence of at least one individual in each CS core as a measure of community taxa richness
3 Total catch of mites and springtails only since these two mesofauna groups usually comprised the majority of the invertebrates present in each core
4 The ratio of Mites Springtails since this parameter was found to change in relation to climatic conditions as indicated by annual precipitation (highest mite springtail ratio was found in plots where annual precipitation was highest within GB) in the 1998 data-set
5 Shannon Diversity calculated for each sample using counts of individual number within broad taxa including counts for springtail superfamily as available for all 1998 and 2007 samples
As well as analysis of each parameter according the outlined stratification a spatial analysis was undertaken using geostatistics For the measured parameters tested namely total invertebrate catch mite springtail ratio and Shannon Diversity the semi-variograms identified no spatial correlation at the regional scale For this reason spatial interpolation or mapping of change is not feasible and as a result is not reported further in this chapter
83 Results
831 Total invertebrate catch
The mean number of invertebrates collected from cores in CS in 1998 was 523 and 77 in 2007 ( Table 83) This represented an overall increase of 47 in total catch in CS in 2007 The highest catches of invertebrates were in woodland habitats with high catches also recorded in Acid Grassland and Dwarf Shrub Heath Lowest numbers occurred in three habitats Arable and Horticulture Improved Grassland and Neutral Grassland that are most frequently the subject of intensive management practices Catches in Arable and Horticulture habitats in particular were notably low in both surveys
173
Countryside Survey Soils Report from 2007
8 Soil invertebrates
Table 83 Changes in total invertebrate catch of soils (0 -8cm depth) within a) Broad Habitats b) Aggregate
Vegetation Classes and c) Soil LOI categories across Great Britain Arrows denote a significant change (plt005)
in the direction shown
C) Great Britain - Soil LOI Category
Soil LOI category 1998 2007 1998-2007
Mineral 367 451
Humus-mineral 553 895
Organo-mineral 816 1179
Organic 697 1053
Direction of
significant
changesTotal catch
a) Great Britain - Broad Habitats
Broad Habitat 1998 2007 1998-2007
Broadleaved Mixed and Yew Woodland 922 1032
Coniferous Woodland 904 1524
Arable and Horticulture 309 316
Improved Grassland 385 575
Neutral Grassland 422 86
Acid Grassland 859 1139
Dwarf Shrub Heath 757 1192
Fen Marsh and Swamp 641 843
Bog 493 774
All habitat types 523 77
b) Great Britain - Aggregate Vegetation Class
AVC 1998 2007 1998-2007
Crops and weeds 316 302
Tall grass and Herb 319 552
Fertile grassland 362 525
Infertile grassland 448 799
Upland Woodland 97 1404
Moorland grass mosaics 843 1276
Heath and bog 606 89
All vegetation types 523 77
Direction of
significant
changes
Direction of
significant
changesTotal catch
Total catch
174
Countryside Survey Soils Report from 2007
8 Soil invertebrates
Figure 81 Changes (+- 95 CIs) in total invertebrate catch of soils (0-8cm depth) within a) Broad abitats b)
Aggregate Vegetation Classes and c) Soil LOI categories across Great Britain Standard errors are indicated
Significant differences p lt 005 p lt 001 p lt 0001 are shown
Analysis using the mixed model indicated that the increase seen in total catch in GB soils in CS in 2007 was highly significant (plt0001) Stratification of the data to assess change by Broad Habitat indicated that a significant increase in catch was detected in 5 of 9 Broad Habitats (Fig 81) For the remaining 4 habitats small non-significant increases in catch were found These were Broadleaved Woodlands Acid Grassland and Fen Marsh and Swamp which all showed non-significant increases of 12 325 and 315 respectively and Arable and Horticulture which showed only a 2 increase in mean catch No habitat showed a mean decrease in total invertebrate catch The absence of a clear increase in total invertebrate catch which was evident in all other habitats and significant in most Arable and Horticulture areas is particularly interesting because the absence of an effect is not the result of low sample numbers in the analysis In fact Arable systems are the second best represented habitat after Improved Grasslands in the repeat sampled soi l invertebrate dataset with 217 enumerated samples This suggests that the factor that is responsible for the general increase in invertebrate catches in soil cores sampled from across GB is not applicable to Arable and Horticulture systems
-40
0
40
80
120
160
Min
eral
Hum
us-m
iner
al
Org
ano
-miner
al
Org
anic
Ch
an
ge t
ota
l in
vert
eb
rate
catc
h p
er
plo
t
-40
0
40
80
120
160
Cro
ps a
nd w
eeds
Tall g
rass
and
Her
b
Fertile
grass
land
Infe
rtile g
rass
land
Upla
nd W
oodlan
d
Moo
rland
gra
ss m
osaics
Heat
h and
bog
All ve
geta
tion
type
s
Ch
an
ge t
ota
l in
vert
eb
rate
catc
h p
er
plo
t
-40
0
40
80
120
160
Bro
adlea
f
Coni
fer
Ara
ble
Impro
ved
Gra
ss
Neut
ral G
rass
Acid
Gra
ss
Shr
ub Hea
th
Fen
Bog
All ha
bita
ts
Ch
an
ge t
ota
l in
vert
eb
rate
catc
h p
er
plo
t
a) Broad Habitats
c) LOI categoriesb) Aggregate vegetation class
175
Countryside Survey Soils Report from 2007
8 Soil invertebrates
Further stratification of the data by AVC indicated patterns of change that were generally in line with those indicated by the habitat analysis No significant increase in catch was found between Crops and Weeds and Tall Grass and Herb which are vegetation classes associated with arable landscapes while total catch was significantly higher in all other vegetation classes Analysis by LOI class indicated significant change in total invertebrate catch in all classes with three classes highly significant (plt0001) and the mineral soil (LOI lt 0-8) significant at plt005 Smallest overall increase in total catch was found for the mineral soils in terms of both absolute numbers and percentage change Since these included a large proportion of the Arable and Horticulture s oils (189 of 371 soils in the 0-8 LOI category are from Arable and Horticulture habitats) this suggests that the low organic matter content of these soils possibly in combination with arable land management practice may be a contributing factor preventing increase in the total catch of invertebrates in the mineral soil category to the same extent found in soil with higher LOI
832 Total broad taxa in catch
The mean number of invertebrate taxa represented by at least one individual in soil cores in 1998 was 434 and was 385 in 2007 (Table 84) This represented an overall decrease of 11 in average taxa representation in CS in 2007 compared to 1998 This reduction is highly statistically significant (plt0001) Because of the small size of the core sample used for invertebrate extraction in CS the number of taxa that may be represented within a catch at any given plot is rather idiosyncratic Further both the core size and extraction technique used (surface heating within a Tullgren funnel apparatus ) is targeted at collecting mainly hard bodied soil mesofauna Thus while small arthropods such as mites and springtails are usually well sampled (Van Straalen and Rijninks 1982) soft bodied meiofauna such as nematodes and tardigrade and larger macrofauna such as Oligochaetes centipedes millipedes and woodlice are not well represented in the extracted sample As a result within any one sample the total number of taxa present can be affected not only by habitat and soil conditions but also by the chance inclusion of individuals of larger invertebrates within the sample Taxa representation as a result is subject to large variation in measurement between samples that is independent of fixed factor effects When analysed by Broad Habitats the highest average number of invertebrate taxa was found in Broadleaved Mixed and Yew Woodland in both the CS in 1998 and 2007 (Table 84) High taxa representation in these habitats is consistent with the high overall catches recorded in these areas since there is a positive relationship between overall catch and number of represented taxa within the CS data-set In remaining habitats trends for representation of taxa in different systems varied slightly between surveys Bogs showed low taxa richness in both surveys and Arable and Horticulture systems also had relatively low taxa richness that is consistent with the low overall catch in these areas in both surveys
176
Countryside Survey Soils Report from 2007
8 Soil invertebrates
Table 84 Changes in total number of sampled taxa represented by at least one individual in soil samples (0 -8cm
depth) within a) Broad Habitats b) Aggregate Vegetation Classes and c) Soil LOI categories across Great
Britain Arrows denote a significant change (plt005) in the direction shown
a) Great Britain - Broad Habitats
Broad Habitat 1998 2007 1998-2007
Broadleaved Mixed and Yew Woodland 581 495
Coniferous Woodland 435 466
Arable and Horticulture 413 34
Improved Grassland 454 374
Neutral Grassland 453 433
Acid Grassland 460 397
Dwarf Shrub Heath 426 364
Fen Marsh and Swamp 394 411
Bog 335 328
All habitat types 434 385
b) Great Britain - Aggregate Vegetation Class
AVC 1998 2007 1998-2007
Crops and weeds 427 342
Tall grass and Herb 416 415
Fertile grassland 452 367
Infertile grassland 462 423
Lowland woodland 648 561
Upland Woodland 500 461
Moorland grass mosaics 434 397
Heath and bog 356 336
All vegetation types 434 385
c) Great Britain - Soil LOI Category
Soil LOI category 1998 2007 1998-2007
Mineral 437 373
Humus-mineral 466 408
Organo-mineral 451 425
Organic 360 346
Direction of
significant
changesNumber of broad taxa
Number of broad taxa
Direction of
significant
changesNumber of broad taxa
Direction of
significant
changes
177
Countryside Survey Soils Report from 2007
8 Soil invertebrates
Figure 82 Changes (+- 95 CIs) in total number of sampled taxa represented by at least one individual in soils
(0-8cm depth) within a) Broad Habitats b) Aggregate Vegetation Classes and c) Soil LOI categories across Great
Britain Standard errors are indicated Significant differences p lt 005 p lt 001 p lt 0001 are shown
Analysis of taxa richness using the mixed model indicated that the reduction in the total number of collected taxa in CS in 2007 compared to 1998 was highly significant (plt0001) Stratification of the data to assess change by Broad Habitat indicated that in 5 out of 9 cases (Broadleaved Woodland Arable and Horticulture Improved Grassland Acid Grassland and Dwarf Shrub Heath) the reduction in taxa representation indicated was statistically significant (Fig 82) Analysis using AVC revealed further information about the changes in taxa representation between surveys Thus while all AVC categories showed a reduction in taxa richness greatest change was found for Crops and Weeds and in Fertile Grassland In both cases these changes were statistically significant (plt0001) with a further significant decrease (plt005) also found in soils from Infertile Grassland Because these Arable and Grassland areas are subject to the greatest anthropogenic influence through land management this suggests that land management practice may be in some way influencing the representation and distribution of some soil taxa in these systems Analysis by LOI class indicated a reduction in taxa representation in all soil classes The change in representation was greatest in the mineral (0-8 LOI) and humus-mineral (8-30 LOI) soils rather than in soils with a higher LOI This is consistent with the reduction in taxa catch detected in the Arable habitats and Crop and weed AVC class and Improved Grassland habitat and Fertile Grassland AVC since these habitats and vegetation types are extensively represented within the less organic rich soils within the low LOI class
-3
-2
-1
0
1
2
3
Bro
adlea
f
Coni
fer
Ara
ble
Impro
ved
Gra
ss
Neut
ral G
rass
Acid
Gra
ss
Shr
ub Hea
th
Fen
Bog
All ha
bita
ts
Ch
an
ge b
road
taxa
catc
h p
er
plo
t
-3
-2
-1
0
1
2
3
Cro
ps a
nd w
eeds
Tall g
rass
and
Her
b
Fertile
grass
land
Infe
rtile g
rass
land
Lowland
Wood
land
Upla
nd W
oodlan
d
Moo
rland
gra
ss m
osaics
Heat
h and
bog
All ve
geta
tion
type
s
Ch
an
ge b
road
taxa
catc
h p
er
plo
t
-3
-2
-1
0
1
2
3
Min
eral
Hum
us-m
iner
al
Org
ano-m
iner
al
Org
anic
Ch
an
ge b
road
taxa
catc
h p
er
plo
t
a) Broad Habitats
c) LOI categoriesb) Aggregate vegetation class
178
Countryside Survey Soils Report from 2007
8 Soil invertebrates
833 Total catch of mites and springtails
The average combined number of mites and springtails present in CS in 1998 was 389 compared to 721 in 2007 In 1998 mites and springtails comprised 743 of all invertebrates captured while in 2007 this had increased to 936 Springtails and mites thus increased in their overall dominance between the two surveys Because springtails and mites dominate total invertebrates to such an extent their patterns of abundance between habitats reflect those also found for total invertebrate catch ( Table 85) The highest combined catches of mites and springtails were in woodland habitats (notably Coniferous Woodland) with high numbers also found in habitats such as Acid Grassland and Dwarf Shrub Heath Lowest counts were found in Arable and Horticulture and Improved Grassland habitats Since these habitats are often intensively managed this suggests a potential influence of management regime on these two important soil mesofauna groups Table 85 Changes in combined catch of mites and springtails in soils (0 -8cm depth) within a) Broad Habitats b)
Aggregate Vegetation Classes and c) Soil LOI categories across Great Britain Arrows denote a significant
change (plt005) in the direction shown
a) Great Britain - Broad Habitats
Broad Habitat 1998 2007 1998-2007
Broadleaved Mixed and Yew Woodland 688 937
Coniferous Woodland 769 1459
Arable and Horticulture 210 281
Improved Grassland 254 533
Neutral Grassland 281 805
Acid Grassland 694 1085
Dwarf Shrub Heath 61 1158
Fen Marsh and Swamp 554 777
Bog 381 74
All habitat types 389 721
b) Great Britain - Aggregate Vegetation Class
AVC 1998 2007 1998-2007
Crops and weeds 209 266
Tall grass and Herb 216 501
Fertile grassland 222 483
Infertile grassland 309 747
Upland Woodland 857 1338
Moorland grass mosaics 66 1222
Heath and bog 492 85
All vegetation types 389 721
Direction of
significant
changes
Direction of
significant
changesAbundance mites and
springtails
Abundance mites and
springtails
179
Countryside Survey Soils Report from 2007
8 Soil invertebrates
Figure 83 Changes (+- 95 CIs) in the combined catch of mites and springtails from soils (0-8cm depth) within
a) Broad Habitats b) Aggregate Vegetation Classes and c) Soil LOI categories across Great Britain Standard
errors are indicated Significant differences p lt 005 p lt 001 p lt 0001 are shown
Data analysis using the mixed model indicated that the increase in the combined catch of sprigtails and mites in CS in 2007 compared to 1998 was highly significant (plt0001) when considering all soils (Fig 83) Stratification of the data to assess change by Broad Habitat indicated effects that were consistent with those for total invertebrate number Thus combined mite and springtail catches were increased in all analysed habitat classes and no habitat showed a mean decrease in mite and springtail catch For 7 out of 9 habitats (Coniferous Woodland Arable and Horticulture Improved Grassland Neutral Grassland Acid Grassland Dwarf Shrub Heath and Bog) the increase in combined mite and springtail catch was statistically sig nificant with Arable and Horticulture soils showing the lowest overall change Because of the low starting point in Arable soils the actual percentage increase in combined catch (342 increase) was only slightly below the
c) Great Britain - Soil LOI Category
Soil LOI category 1998 2007 1998-2007
Mineral 244 411
Humus-mineral 411 839
Organo-mineral 685 1129
Organic 586 1015
Direction of
significant
changesAbundance mites and
springtails
-40
0
40
80
120
Cro
ps a
nd w
eeds
Tall g
rass
and
Her
b
Fertile
grass
land
Infe
rtile g
rass
land
Lowland
Wood
land
Moo
rland
gra
ss m
osaics
Heat
h and
bog
All ve
geta
tion
type
s
Ch
an
ge m
ites a
nd
sp
rig
tail
catc
h p
er
plo
t
-40
0
40
80
120
Bro
adlea
f
Coni
fer
Ara
ble
Impro
ved
Gra
ss
Neut
ral G
rass
Acid
Gra
ss
Shr
ub Hea
th
Fen
Bog
All ha
bita
ts
Ch
an
ge m
ites a
nd
sp
rig
tail
catc
h p
er
plo
t
-40
0
40
80
120
Min
eral
Hum
us-m
iner
al
Org
ano
-min
eral
Org
ani
c
Ch
an
ge m
ites a
nd
sp
rig
tail
catc
h p
er
plo
t
a) Broad Habitats
c) LOI categoriesb) Aggregate vegetation class
180
Countryside Survey Soils Report from 2007
8 Soil invertebrates
lower end of level of change found for the remaining habitats (36-186) The remaining 2 habitats each showed non-significant increases in combined catch Analysis by AVC indicated an effect of vegetation on combined mite and springtail catch in line with those for total invertebrate numbers A significant increase in the combined catch was found in all vegetation classes with the exception of Crop and Weeds and Coniferous Woodland Analysis by LOI class indicated significant change in mite and springtail catch in all classes Absolute size of the increase was lowest for the mineral soil (LOI lt 0-8) with the other soil classes each showing similar change However when changes are calculated as percentage difference from CS in 1998 the change in the mineral soils (68) is not inconsistent with the percentage change in the remaining LOI categories (65 -104) That a significant increase in combined mite and springtail catch was found for the low LOI soil suggests that the limited changes in total mite and springtail catch that were s een in Arable habitats dominated by the Crop and Weed AVC category is not merely a result of the low LOI of soils in these areas Instead other land management practices may be important in limiting the extent of observed change
834 Ratio of mites springtails
Analysis was conducted of the change in the ratio of Mites Springtails since this parameter was found to vary in relation to annual precipitation (and as a result habitat) in CS in 1998 Highest catches of mites were found in plots at which rainfall was highest while springtails favoured lower rainfall plots Mite springtail ratios thus varied systematically with increasing rainfall (Fig 84) In CS in 1998 the average mite springtail ratio in GB soils was 63 and in CS in 2007 this value had increased to 89 (Table 86 Fig 85) Highest mite springtail ratios were found in habitats that are associated with high rain fall particularly in upland regions of GB A pattern that is consistent with the recognised trend (Fig 84) Habitats with highest mite springtail ratio were Bog Dwarf Shrub Heath and Acid Grassland Woodlands were intermediate while values in Arable and Horticulture Neutral Grassland and Improved Grassland soils were the lowest of the studied habitats The patte rn of mite springtail ratio found between the Broad Habitats for in CS in 2007 supports the importance of moisture availability on the relative abundance of the major meiofaunal groups as indicated initially in CS in 1998 Figure 84 Mite abundance and relative abundance of Collembola in relation to mean annual precipitation
Trends (with 95 confidence intervals) are calculated based on data collected from 1097 Tullgren samples
collected across GB in 1998
0 500 1000 1500 2000 2500 3000 35000 500 1000 1500 2000 2500 3000 3500
500
750
2500
5000
7500
25000
50000
75000
Acari
abundance (
log
10
m- 2
+ 1
00
02
04
06
08
10
rela
tive a
bundance o
f colle
mbola
(arc
sin
e
+ 0
5)
Number of mites m-2
Relative abundance of Collembola m-2
Fig 84 Mite abundance and relative
abundance of Collembola in relation to
mean annual precipitation Trends (with
95 confidence intervals) are calculated
based on data collected from 1097 Tullgren
samples collected across GB in CS2000
181
Countryside Survey Soils Report from 2007
8 Soil invertebrates
All Broad Habitats included in the stratified analysis showed a significant increase in mite springtail ratio Statistical analysis indicated that this increase was significant in all habitats except for Dwarf Shrub Heath and Bog the two habitats that had the highest ratios i n both CS in 1998 and 2007 The significant increase in the mite springtail ratio found in the majority of habitats was largely the result of an increase in the total number of mites caught rather than a reduction in springtail catches The increase in mi te numbers is also the major reason for the increase in both the combined number of mites and springtails and total invertebrate catch (since mites are a major contributor to overall invertebrate numbers) Analysis of the data by AVC indicated clear effects of vegetation class on mite springtail ratio These effects were largely consistent with the trends found for Broad Habitats There was a significant increase in the mite springtail ratio in all vegetation classes except Moorland Grass Mosaic and Hea th and Bog the two classes for which ratios in CS in 1998 and 2007 were highest Analysis by LOI class was also consistent with the changes in mite springtail ratio across other stratifications A significant increase in the mite springtail ratio wer e found in mineral humus-mineral and organo-mineral soils associated with the lowland habitats and vegetation classes in which mite springtail ratio showed a significant increase Only in organic soils associated with upland areas was the increase in ratio between the 1998 and 2007 not significant
Table 86 Changes in ratio of mites springtails in soils (0 -8cm depth) within a) Broad Habitats b) Aggregate
Vegetation Classes and c) Soil LOI categories across Great Britain Arrows denote a significant change (plt005)
in the direction shown
a) Great Britain - Broad Habitats
Broad Habitat 1998 2007 1998-2007
Broadleaved Mixed and Yew Woodland 554 1008
Coniferous Woodland 644 1464
Arable and Horticulture 183 531
Improved Grassland 402 820
Neutral Grassland 406 966
Acid Grassland 1053 1839
Dwarf Shrub Heath 1302 1140
Bog 1383 1526
All habitat types 63 109
b) Great Britain - Aggregate Vegetation Class
AVC 1998 2007 1998-2007
Crops and weeds 187 53
Tall grass and Herb 25 62
Fertile grassland 262 791
Infertile grassland 501 1109
Upland Woodland 67 1129
Moorland grass mosaics 1391 1748
Heath and bog 1477 1754
All vegetation types 628 1087
Direction of
significant
changes
Direction of
significant
changesMites springtails
Mites springtails
182
Countryside Survey Soils Report from 2007
8 Soil invertebrates
c) Great Britain - Soil LOI Category
Soil LOI category 1998 2007 1998-2007
Mineral 357 750
Humus-mineral 402 1034
Organo-mineral 927 1540
Organic 1731 1833
Direction of
significant
changesMites springtails
Figure 85 Changes (+- 95 CIs) in the ratio of mites springtails in soils (0 -8cm depth) within a) Broad
Habitats b) Aggregate Vegetation Classes and c) Soil LOI categories across Great Britain Standard errors are
indicated Significant differences p lt 005 p lt 001 p lt 0001 are shown
835 Shannon Diversity
Shannon diversity was calculated using counts of the number of individuals within broad taxa (nb counts of springtails to superfamily were included as separate broad taxa in the analysis) Mean Shannon diversity in CS in 1998 was 102 and in 2007 this value has reduced to 072 ( Table 87) This represented an overall reduction of 03 units in CS in 2007 Shannon diversity showed only a limited difference between different habitats Broadleaved Woodland showed the highest Shannon statistic in both 1998 and 2007 (121 and 087 respectively) while Bogs showed lowest Shannon diversity in both surveys (071 and 052 respectively)
-8
-4
0
4
8
12
16
20
Bro
adlea
f
Coni
fer
Ara
ble
Impro
ved
Gra
ss
Neut
ral G
rass
Acid
Gra
ss
Shr
ub Hea
th
Bog
All ha
bita
tsCh
an
ge p
rop
ort
ion
mit
es
pri
ng
tail
s
per
plo
t
-8
-4
0
4
8
12
16
20
Cro
ps a
nd w
eeds
Tall g
rass
and
herb
Fertile
grass
land
Infe
rtile g
rass
land
Lowland
woo
ded
Upla
nd w
ooded
Moo
rland
gra
ss m
osaics
Heat
h and
bog
All ve
geta
tion
type
s
Ch
an
ge p
rop
ort
ion
mit
es
pri
ng
tail
s
per
plo
t
-8
-4
0
4
8
12
16
20
Min
eral
Hum
us-m
iner
al
Org
ano
-min
eral
Org
ani
c
Ch
an
ge p
rop
ort
ion
mit
es
pri
ng
tails
per
plo
t
a) Broad Habitats
c) LOI categoriesb) Aggregate vegetation class
183
Countryside Survey Soils Report from 2007
8 Soil invertebrates
Statistical analysis indicated that the decrease in Shannon diversity in 2007 was highly significant (plt0001) when considered for GB wide soils (Table 87) Stratification of the data to assess change by Broad Habitat indicated a significant decrease in diversity in 8 of 9 habitats ( Fig 86) Only in Fen Marsh and Swamp was the reduction in Shannon diversity not significant Analysis by AVC indicated that the reduction in Shannon diversity was also significant in the majority of vegetation classes (Fig 86) Of the 8 AVCs represented in the data-set all showed a significant reduction in Shannon diversity except for Tall Grass and Herb Analysis by LOI class in dicated significant change in all soil LOI classes indicating that reduced Shannon diversity was associated with all soil types Table 87 Changes in invertebrate Shannon diversity based on enumeration to broad taxa of invertebrates
collected from soils (0-8cm depth) within a) Broad Habitats b) Aggregate Vegetation Classes and c) Soil LOI
categories across Great Britain Arrows denote a significant change (plt005) in the direction shown
a) Great Britain - Broad Habitats
Broad Habitat 1998 2007 1998-2007
Broadleaved Mixed and Yew Woodland 121 087
Coniferous Woodland 093 061
Arable and Horticulture 110 085
Improved Grassland 117 079
Neutral Grassland 109 073
Acid Grassland 089 055
Dwarf Shrub Heath 087 063
Fen Marsh and Swamp 081 073
Bog 071 052
All habitat types 102 072
b) Great Britain - Aggregate Vegetation Class
AVC 1998 2007 1998-2007
Crops and weeds 115 085
Tall grass and Herb 109 092
Fertile grassland 117 081
Infertile grassland 111 073
Lowland woodland 127 092
Upland Woodland 104 067
Moorland grass mosaics 085 057
Heath and bog 074 054
All vegetation types 102 072
Direction of
significant
changesShannon Diversity
Shannon Diversity
Direction of
significant
changes
184
Countryside Survey Soils Report from 2007
8 Soil invertebrates
c) Great Britain - Soil LOI Category
Soil LOI category 1998 2007 1998-2007
Mineral 112 082
Humus-mineral 112 074
Organo-mineral 094 062
Organic 069 051
Direction of
significant
changesShannon Diversity
Figure 86 Changes (+- 95 CIs) in invertebrate Shannon diversity based on enumeration to broad taxa of
invertebrates collected from soils (0-8cm depth) within a) Broad Habitats b) Aggregate Vegetation Classes and
c) Soil LOI categories across Great Britain Standard errors are indicated Significant differences p lt 005 p
lt 001 p lt 0001 are shown
-8
-4
0
4
8
12
16
20
Bro
adlea
f
Coni
fer
Ara
ble
Impro
ved
Gra
ss
Neut
ral G
rass
Acid
Gra
ss
Shr
ub Hea
th
Bog
All ha
bita
tsCh
an
ge p
rop
ort
ion
mit
es
pri
ng
tail
s
per
plo
t
-8
-4
0
4
8
12
16
20
Cro
ps a
nd w
eeds
Tall g
rass
and
herb
Fertile
grass
land
Infe
rtile g
rass
land
Lowland
woo
ded
Upla
nd w
ooded
Moo
rland
gra
ss m
osaics
Heat
h and
bog
All ve
geta
tion
type
s
Ch
an
ge p
rop
ort
ion
mit
es
pri
ng
tail
s
per
plo
t
-8
-4
0
4
8
12
16
20
Min
eral
Hum
us-m
iner
al
Org
ano
-min
eral
Org
ani
c
Ch
an
ge p
rop
ort
ion
mit
es
pri
ng
tails
per
plo
t
a) Broad Habitats
c) LOI categoriesb) Aggregate vegetation class
185
Countryside Survey Soils Report from 2007
8 Soil invertebrates
84 Discussion and Policy Implications
841 Introduction
Soils are critical components of the terrestrial ecosystems They are vulnerable to the effects of anthropogenic activity such as the release of pollutant chemicals and accelerating climate change Within the soil the micro- meio- meso- and macro-fauna all play a critical role in the provision of many important soils functions and resulting ecosystem services The poorly established taxonomy of many common soil macroinvertebrate taxa coupled to a declining taxonomic base means that the effects of human activity on subterranean invertebrate community structure is not well understood These include not only nematodes mites and springtails whose morphological taxonomy is ldquodifficultrdquo but also groups such as Oligochaetes and Molluscs for which there is strong evidence for a high frequency of morphologically similar cryptic species (King et al 2008) Countryside Survey represents one of only a limited number of programmes that have attempted national scale monitoring of soil biodiversity CS is unique in co-ordinating soil biodiversity monitoring at a GB scale with other surveying approaches for land use vegetation soils and waters Other countries such as the Netherlands Germany and Canada do have programmes involving soil biodiversity assessments however unlike CS which is temporally synchronised in a single season these other programs take a rolling approach to sample collection (ie sampling a certain percentage of sites in each year) As outlined the aim of soil invertebrate sampling in CS was not to provide a comprehensive assessment of soil biodiversity since this would require use of a wide range of techniques Instead a snapshot of the abundance of principally the main soil mesofauna groups the mites and springtails with some information on meiofauna (eg nematodes) and macrofauna is gathered Microbial diversity was not measured in the main part of CS although bacterial diversity in all soils for which soil invertebrate communities were assessed have been analysed in separate work supported through NERC grants raising the potential for a more integrated assessment of the microbial and invertebrate diversity data From the re-sampling in CS in 2007 the key policy question to be addressed was whether CS could provide any evidence to indicate that there has been a loss of soil biodiversity as has been stated in previous statements made by the EU Because it was not feasible within available resources to identify collected fauna to species levels due to both the number of invertebrates captured and the challenge of species level identification for groups such as the oribatid mites it is certainly not possible to provide a comprehensive answer to the policy question Between year variation in seasonal weather patterns may also strongly influence patterns observed While a complete answer is not possible useful insight into the status of soil communities at the GB scale and with habitats vegetation classes and different soil typ es can be derived from the survey results The re-sampling of soil communities in 2007 showed clear trends at the national scale Mean number of invertebrates collected significantly increased across GB Overall there was an increase of 47 in total catc h in the CS in 2007 survey compared to 1998 Calculated at the level of individual per m
2 based on the 4 cm
2
diameter of the sample core used the total catch measured equates to around 41500 individual soil invertebrates per m
2 within the top 8 cm of the soil in 1998 and over 61252 in 2007 Values for individual
habitats varied from around 25000 individuals per m2 for both 1998 and 2007 in Arable and Horticulture
habitats to around 73000 in 1998 and 89000 in 2007 for Broadleaved Woodlands The estimat e of total catch m
2 for Bog soils of around 39000 for 1998 and 61000 for 2007 are above the range of 5000 -10000 in
a dry summer (2003) found previously in peatland and birchwood soils (Osler et al 2006) Studies at the same sites in a wetter summer (2004) did produce values of 14000 -100000 mite m
2 and 1500-26000
springtail m2 that are more comparable with estimates from CS in 2007 Values for deciduous woodland are
close to the upper limit of the range of 15000-90000 for the total catch of mites and springtails found in control and disturbed woodland (Maraun et al 2003) This suggests that the method used for invertebrate sample collection in CS produced estimates of abundance that are largely compatible with results from published studies Scaling up estimates of invertebrate numbers to a GB scale based on measured density and GB land area indicates that there were an estimated 128 quadrillion (128x10
16) soil invertebrates
186
Countryside Survey Soils Report from 2007
8 Soil invertebrates
present in the top 8 cm of GB soils during the time of CS in 2007 This number is up 41 quadrillion (41x1015
) since CS in 1998 when ldquoonlyrdquo 87 quadrillion (872x10
15) invertebrates were estimated to be present
Stratification of the data indicated that the increase in total invertebrate catch was detectable in all habitats except arable and managed grassland areas largely associated with mineral soils Because total invertebrate catch was dominated by mites and springtails the increase in the combined total catch of these two groups was broadly consistent with patterns found for total invertebrate catch An in crease in the mite springtail ratio indicated that the increase in combined mite and springtail and total invertebrate catch was mainly the result of an increase in the number of mites retrieved Shannon diversity was reduced in all soils This was partly the result of an increase in the catch of mites the increased dominance of which within the samples results in a corresponding reduction in the Shannon diversity statistic although the reduction in diversity was not solely the result of an increase in the dominance of mites as a reduction in the richness of broad taxa represented by at least one individual in each core was also found
842 Cause of change in soil invertebrate communities between surveys
An important consideration when comparing results between repeat surveys is to ensure that the methods used for both sampling occasions are comparable In certain cases changes in instrumentation in available facilities or of staff can result in shifts in methods that require careful thought befor e conclusions are drawn from results Because large differences in invertebrate catch were seen between the 1998 and 2007 surveys consideration was given as to whether there were methodological shifts in 2007 compared to 1998 that could have contributed to the observed differences Five stages of the sampling and enumeration process were identified within which potential variations in procedure could occur Methods used in both surveys were compared in relation to these five areas and the potential impact of any sampling and handling differences between surveys considered 1 Preparation of the plot area for sampling In the field survey in CS in 2007 core sampling locations were decided according to instructions set out the field sampling protocol (Emmett et al 2008) The approach was consistent with that used in 1998 For sampling the cores used for invertebrate enumeration surveyors were instructed to leave the litter layer present on the soil surface intact In CS in 1998 similar instructions were not given explicitly to the surveyors Observation of the receipt of core from both surveys suggests that in reality this potential discrepancy is of minor importance For example for grassland sites cores were almost always received with the turf layer still intact at the top of the core throughout both surveys This suggests that sampling in the large number of grassland plots present within CS wa s conducted in an identical way For plots where grass was not present it is harder to tell if the litter layer has been similarly treated If the tendency was for litter removal in CS in 1998 but not in 2007 this could play a part in the higher catches in 2007 since invertebrate densities are highest in the surface litter layer and this layer would be more prevalent in the cores taken in the later survey If this was indeed the case though it would be expected that catches would be increased by a greater amount in woodland than grassland plots since it is know from the intact vegetation that grassland plots were similarly treated Comparison of the relative change in the woodland and grassland habitats suggests that in fact changes in catches in the tw o habitats were broadly similar This suggests that differences in the treatment of the litter layer during sampling are not likely to be the cause of the different in community parameters observed between surveys 2 Soil core insertion and on site handling Exactly the same cores were used for CS in 2007 as were used in 1998 (white 4 cm diameter 8 cm long plastic cores) Cores were knocked into the ground using a mallet and plate on both occasions Once the core had been inserted and removed it was nec essary to cap the core to prevent desiccation affecting invertebrate survival during transit Caps used in CS in 1998 were designed to fit into the inner rim of the core while those used in CS in 2007 fitted over the out rim The caps that were used in CS in 1998 were noted to slightly compress the core during insertion while the same was not true of the caps in 2007 For invertebrates to escape from soils during Tullgren extraction it is necessary that they are able to freely move through the soil profi le to allow escape and capture It is conceivable that the slight compaction of CS in 1998 soils may have impeded invertebrate escape during extraction with a resulting small reduction in catch in CS in 1998 While a compaction effect on Tullgren extractio n can not be fully excluded the extent of compaction of cores in 1998 was actually rather small Given the magnitude of the shift in community parameters between surveys it is difficult to envisage that this small difference could have
187
Countryside Survey Soils Report from 2007
8 Soil invertebrates
lead to the almost 50 increase in catch found in 2007 compared to the earlier survey particularly as catches in both surveys are towards the upper range of previous invertebrate counts taken in similar habitats (Osler et al 2006 Maraun et al 2003) 3 Core transport to the laboratory During both the 1998 and 2007 surveys the fauna cores were immediately placed into cool boxes after being dug from the soil and then posted first class to the laboratory at the first opportunity Return by post was selected as the most rapid means of core return even from dist ant locations It was acknowledged during initial survey design that the transport process was not well controlled and that the cores may be subject to stressful conditions notably high temperatures as sampling was mainly conducted over the summer months Many soil invertebrates have a low tolerance to heat stress Thus it is certainly possible that some temperature intolerant invertebrates in particular cores may have been lost (ie died) during transit Because the same approach to core return was used and also because the post service worked equally effectively for both surveys this suggests that differences in the time of transit while possibly affecting the integrity of individual samples can not account for community changes detected between surveys Further work to trace temperature data relating to the survey period is needed to investigate if different in average conditions during transit were prevalent between survey that could play a role 4 Soil invertebrate extraction method and conditions Different methods of extraction will collect a different sample of invertebrates from a given sample Tullgren extraction is particularly well suited to the collection of hard bodied mesofauna groups such as mites and springtails (Van Straalen and Rijninks 1982) Exactly the same Tullgren funnel system was used for invertebrate extraction in both Countryside surveys In CS in 2007 the funnel system was housed in a laboratory that received direct sun and so regularly reached temperature of 25
oC while in CS in 1998 the extractions took place in a laboratory that was shaded and so ambient
conditions did not regularly reach these higher temperatures High temperatures can be expected to stress soil invertebrates resulting in possible mortality within cores meaning that individuals are not extracted It was initially a concern in CS in 2007 that the high ambient temperatures in the laboratory used for the extractions could affect invertebrate catches with high temperature resulting in some mortality within cores and so lower catches Since actual catch observed in CS in 2007 we re significantly higher than in 1998 it seems unlikely that ambient conditions had any effect on the efficiency of soil extraction and ultimately on observed community change 5 Soil invertebrate sorting identification and enumeration Different personnel were involved in enumeration in the 1998 and 2007 surveys This could lead to discrepancies between surveys However the involvement of multiple staff for sorting and identification in both surveys and also the use of quality assurance checks during enumeration are both factors that suggest that identification and counting errors are unlikely to lie behind observed community change found between survey years As outlined a comparison of the detailed protocols for the two surveys indicated only small discrepancies between surveys These related to tube capping ambient conditions during extraction and changes in staff involved in enumeration In practice the changes were actually rather small The majority of the two procedures (cores sampling method return procedure Tullgren system quality assurance system) were rather similar Given the magnitude of community changes it seems unlikely that changes in capping which results in slight core compaction could account for the difference in catches se en Ambient temperature during sampling would have been expect to lower catches in 2007 compared to 1998 while quality assurance and training procedure precluded difference resulting from personnel change For this reason it is difficult to argue that the difference seen in soil invertebrate community between surveys namely an increased catch of especially mites leading to a high mite springtail ratio and higher combined mite and springtail number coupled with a reduction in diversity resulting from both increased mite dominance and lower representation of broad taxa in CS in 2007 samples are solely down to methodological difference Real differences in community parameters between sample years seem instead to be the most reasonable explanation
188
Countryside Survey Soils Report from 2007
8 Soil invertebrates
843 Initial attribution of soil invertebrate community change
The lag in completing the enumeration of the soil fauna means that at present attribution of changes in the soil invertebrate community remain in process Even though detailed attribution of changes in soil invertebrate community structure is yet to be completed it is possible even now to identify a number of potential candidate drivers that could be responsible for the quite substantial changes detected in soil communities between the two survey years Soil invertebrate communities are known to be sensitive to climatic condition For example in 1998 it was noted that the number of oribatid mites tended to increase in plots that are subjected to high mean annual rainfall while springtail were more frequent in plots where precipitation was lower The survey year of 2007 in the UK was one of the wettest summers on record While it must also be recognised that 1998 was also a relatively wet summer the rainfall amounts that occurred over the k ey survey month of June and July in GB in 2007 were notably higher and in some areas reached record levels indicating the extent of rainfall in the later survey year Wetter soil resulting from more rain can have both a positive and a negative effect on soil invertebrate catches from Tullgren extractions Wet soils tend to swell As a result this means that within the restricted volume of the sample soil core a smaller weight of soil will be sampled Lower soil layers in particular can as a result be missed This reduced sampling at depth could result in the loss of some invertebrates from the sample Since the majority of soil invertebrates live in or on the surface soil and soil litter layers the actual number of individuals missed by the reduced sampling of deeper soils may actually be rather small A potentially more important effect of wetter soils may be that they maintain soil invertebrate s in an active state that would not be the case in soils that were drier It is well known that many soil i nvertebrates are sensitive to drought conditions This is because most below-ground invertebrates have water permeable integuments and so are unable to resist water loss in drying environments The sensitivity of some soil taxa to drought stress is recognised as an important determinant of their habitat preferences As a result the ecophysiology of desiccation tolerance and water balance in some taxa has been studied in detail Some species such as earthworms and springtails may burrow into the deeper so il layers where soil moisture is retained to escape from drought condition Other species use a range of desiccation tolerance mechanisms (eg anhydrobiosis estivation) If escape to moist deeper soil microsites is used then this can prevent the initial capture of individuals within a defined depth soil sample If a desiccation tolerance strategy is used this can preclude the individual from responding to desiccation as a result of Tullgren extraction in a manner that allows capture In either case this may limit invertebrate catches in drier soils Initial attribution work focussing on 1998 and 2007 soil moisture measurements has indicated that there is no clear evidence for an increase in soil moisture content and sampling time (data not shown) This c omparison does not preclude a potential influence of high rainfall on community parameters since communities are likely to response to longer term changes in soil moisture regime This means that even though there is no clear evidence of soil moisture levels between surveys it remains possible that the high rainfall found in 2007 may indeed play some role in the observed different between soil communities found between survey years It is widely recognised that soil invertebrate communities are sensitive to a range of land management practices (Schon et al 2008) including land cover change (Black et al 2003) tillage regime and disturbance (Maraun et al 2003) pesticides and heavy metals (Frampton 1999 Pedersen et al 1999) and nitrogen inputs (Lindberg and Persson 2004) Because the changes in soil community structure detected between surveys was relevant to all habitats and vegetation classes except intensively managed land mainly on mineral soils attribution of changes in soil community composition to a particular driver must be relevant for a range of habitats and soil types This means that changes in land management such as stocking density pesticide application rates or tillage regimes that apply only to certain habitat types cannot explain all of the observed difference At a national scale one major difference that has occurred that has had a major effect on soil properties is the change in sulphur deposition and resulting effect on soil pH Measures to reduce sulphur emission have resulted in reduced rate of deposition and a resulting increase in soil pH across GB of almost 05 pH units since 1978 The pH of the soil is known to play a key role i n determining the structure of below ground communities Within CS in 2007 a negative relationship exists between soil pH and total invertebrate catch (Fig 87) This is explained because the highly abundant oribatid mite group do not favour neutral soil habitats associated with mineral soils in agricultural landscapes but instead favour low
189
Countryside Survey Soils Report from 2007
8 Soil invertebrates
pH organic soils in more upland areas Thus while important for determining overall composition of the soil community (eg high catch and dominance of mites in Dwar f Shrub Heath and Bogs) change in soil pH alone is unlikely to be a major driver of community change between survey years Comparison of communities in different habitats indicates that larger soil invertebrate communities are found in habitats such as woodland while Arable and Horticulture and managed grassland have smaller communities with fewer broad taxa It is often assumed because they are recently planted that Coniferous Woodland have a lower conservation value than older Broadlea ved Woodland Full species identification and enumerations of different woodland of known age would be needed to test this hypothesis for soil fauna The GB wide survey from CS does indicate that in terms of community size and frequency of broad taxa the two woodland types differ little in their harboured soil communities For the conservation of soil biodiversity on the basis of this analysis woodlands emerge as potentially important targets The small community size and low taxa representation for managed habitats suggests impacts of land management practices such as tillage fertiliser inputs and pesticide application on soil communities in these areas Arable and grassland areas emerge as potential targets for soil biodiversity restoration Figure 87 Relationship between soil pH measured in soils sample (0-15 cm depth) in CS in 2007 and the total
catch of soil invertebrates from soil core (0-8) depth
Within the land use and habitat survey of CS one of the most notable changes over time has been a significant increase in woodland cover in the UK Because woodland harbours large soil communities it would be expected that this increase in woodland area would be beneficial to the national stock of soil invertebrates Within CS the designation of Broad Habitats is done by surveyors on each sampling occasion This means that areas designated as woodland in each survey are done on the basis of current habitat distribution Similarly vegetation class is determined directly by analysis of the flora present at the actual sample plots Since the statistical analysis links invertebrate catch directly to recorded Broad Habitat and AVC in each category changes in soil community composition between surveys cannot be linked simply to changing in woodland frequency In fact because new woodland may be expected to still be undergoing community succession land cover change to woodland may be expected to have a slight negative effect on invertebrate community catch and diversity within woodland cate gories in a substantial amount of new
y = 46489e-0368x
R2 = 01776
1
10
100
1000
10000
3 4 5 6 7 8 9
Soil pH CS 2007
Lo
g s
oil
in
verte
bra
te c
atc
h
CS
20
07
Fig X7 Relationship between soil pH measured
in soils sample (0-15 cm depth) in CS2007 and
the total catch of soil invertebrates from soil core
(0-8 cm) depth
Soil pH 1998
Log soil invertebrate
catch in 2007
190
Countryside Survey Soils Report from 2007
8 Soil invertebrates
woodland becomes included within later surveys Increasing woodland may therefore play only a limited role as a driver of overall change
844 Concluding remarks
Re-sampling of the soil invertebrate community was undertaken in CS in 2007 as part of the soil work -package according the published CS methodology A total of 945 samples were enumerated Results indicated an overall significant increase in total invertebrate catch in samples from all habitats AVCs an d soil types except for agricultural areas located predominately on mineral soils The increase in invertebrate catch predominantly related to an increase in the catch of mites in CS in 2007 sample s This was shown in the increase in mite springtail ratio found across GB and in many Broad Habitats AVCs and soil LOI categories The increased dominance of mites was a major factor that decreased Shannon diversity in CS in 2007 cores although there was also a small reduction in the number of broad taxa represented in sample cores at the GB scale and also when the data was stratified to Broad Habitat AVC and soil type (by LOI) A single repeat sampling campaign such as CS cannot prove or disprove whether a large scale and long term change in soil biodiversity is underway Particularly effects of short term temporal effects such as seasonal weather patterns on invertebrate communities or sampling efficiency cannot be excluded Nonetheless on the basis of the survey data it is certainly not possible to confidently refute the possibility that such a change may be occurring This suggests that further analysis through focussed study may be needed to tease out whether the changes in soil chemistry land management or climate are playing a role in the observed so il invertebrate community change
85 References
Black HIJ Parekh NR Chaplow JS Monson F Watkins J Creamer R et al 2003 Assessing soil biodiversity across Great Britain national trends in the occurrence of het erotrophic bacteria and invertebrates in soil Journal of Environmental Management 67 255-266
Emmett BA Frogbrook ZL Chamberlain PM Griffiths R Pickup R Poskitt J Reynolds B Rowe
E Spurgeon D Rowland P Wilson J Wood CM 2008 CS Technical Report No 307 Soils Manual
NERCCentre for Ecology amp Hydrology 180 pp (CEH Project Number C03259) Frampton GK 2009 Spatial variation in non-target effects of the insecticides chlorpyrifos cypermethrin and pirimicarb on Collembola in winter wheat Pesticide Science 55 875-886 King RA Tibble AL Symondson WOC 2008 Opening a can of worms unprecedented sympatric cryptic diversity within British lumbricid earthworms Molecular Ecology 17 4684-4698 Lindberg N Persson T 2004 Effects of long-term nutrient fertilisation and irrigation on the microarthropod community in a boreal Norway spruce stand Forest Ecology and Management 188 125-135 Maraun M Salamon JA Schneider K Schaefer M Scheu S 2003 Oribatid mite and collembolan diversity density and community structure in a moder beech forest (Fagus sylvatica) effects of mechanical perturbations Soil Biology amp Biochemistry 35 1387-1394 Osler GHR Cole L Keith AM 2006 Changes in oribatid mite community structure associated with the succession from heather (Calluna vulgaris) moorland to birch (Betula pubescens) woodland Pedobiologia 50 323-330 Pedersen MB Axelsen JA Strandberg B Jensen J Attrill MJ 1999 The impact of a copper gradient on a microarthropod field community Ecotoxicology 8 467-483
191
Countryside Survey Soils Report from 2007
8 Soil invertebrates
Schon NL Mackay AD Minor MA Yeates GW Hedley MJ 2008 Soil fauna in grazed New Zealand hill country pastures at two management intensities Applied Soil Ecology 40 218-228 Van Straalen NM Rijninks PC 1982 The efficiency of Tullgren apparatus with respect to interpretation seasonal-changes in age structure of soil arthropod populations Pedobiologia 24 197-209
192
Countryside Survey Soils Report from 2007
This report was produced by the Centre for Ecology amp Hydrology with input from the other members of the Countryside Survey partnership Copyright of the report and photographs is owned by the Natural Environment Research Council Copyright enquiries should be addressed to Knowledge Transfer Team Centre for Ecology amp Hydrology Maclean Building Benson Lane Wallingford OX10 8BB This publication excluding logos may be reproduced free of charge in any format or medium for research private study or the purposes of internal use within an organisation This is subject to it being reproduced accurately and not being subject to any treatment that could be considered derogatory The reproduced material must be acknowledged as NERC Copyright (except where otherwise s tated) and the publication cited as follows Emmett BA Reynolds B Chamberlain PM Rowe E Spurgeon D Brittain SA Frogbrook Z Hughes S Lawlor AJ Poskitt J Potter E Robinson DA Scott A Wood C Woods C 2010 Countryside Survey Soils Report from 2007 Technical Report No 907 NERCCentre for Ecology amp Hydrology 192pp (CEH Project Number C03259)
For further information on Countryside Survey see wwwcountrysidesurveyorguk
Or contact Countryside Survey Project Office Centre for Ecology amp Hydrology
Lancaster Environment Centre Library Avenue Bailrigg Lancaster LA1 4AP
Telephone 01524 595811 Email enquiriescehacuk Countryside Survey in 2007 was funded by a partnership of government -funded bodies led by the Natural Environment Research Council (NERC) and the Department for Environment Food and Rural Affairs (Defra)
Disclaimer Any decisions or actions informed by this Technical Report are taken entirely at your own risk In no event shall NERC be liable for any damages including loss of business loss of opportunity loss of data loss of profits or for any other indirect or consequential loss or damage whatsoe ver arising out of the use of or inability to use the material presented in this report The Countryside Survey partnership has endeavoured to ensure that the results presented in this report are quality assured and accurate Data has been collected to es timate the stock change extent andor quality of the reported parameters However the complex nature of the experimental design means that results can not necessarily be extrapolated andor interpolated beyond their intended use without reference to the original data