
Country: Russia Overseas Market Introduction Service · PDF fileReport on Seafood Export...
23
The Overseas Market Introduction Service (‘OMIS’) is provided by the Commercial Departments of Diplomatic Service Posts overseas as part of the joint trade development operation, UK Trade & Investment (‘UKTI’), of the Foreign and Commonwealth Office (‘the FCO’) and the Department for Business, Innovation and Skills (‘BIS’). Whereas every effort has been made to ensure that information provided through OMIS is accurate, these Commercial Departments, UKTI, the FCO and BIS accept no liability for any errors, omissions or misleading statements in such information and accept no responsibility as to the standing of any firm, company or individual mentioned. Any party interested in the goods and services provided by any company referred to in OMIS material should undertake their own research and should not consider a reference in OMIS material to be an endorsement of any goods, services or companies mentioned. Country: Russia Overseas Market Introduction Service Report on Seafood Export Profiles Russia Sea Fish Industry Authority Produced by: Galina Solomonova Trade Adviser British Embassy in Moscow Date of Report: 25.07.2012
Transcript of Country: Russia Overseas Market Introduction Service · PDF fileReport on Seafood Export...

The Overseas Market Introduction Service (‘OMIS’) is provided by the Commercial Departments of Diplomatic Service Posts overseas as part of the joint trade development operation, UK Trade & Investment (‘UKTI’), of the Foreign and Commonwealth Office (‘the FCO’) and the Department for Business, Innovation and Skills (‘BIS’). Whereas every effort has been made to ensure that information provided through OMIS is accurate, these Commercial Departments, UKTI, the FCO and BIS accept no liability for any errors, omissions or misleading
statements in such information and accept no responsibility as to the standing of any firm, company or individual mentioned. Any party interested in the goods and services provided by any company referred to in OMIS material should undertake their own research and should not consider a reference in OMIS material to be an endorsement of any goods, services or companies mentioned.
Country: Russia
Overseas Market Introduction Service
Report on Seafood Export Profiles Russia
Sea Fish Industry Authority
Produced by:
Galina Solomonova Trade Adviser
British Embassy in Moscow
Date of Report: 25.07.2012
- 2 -
CONTENTS
Executive Summary 3
Summary of the Enquiry Methodology
SECTION 1 MATCHING PROFILE
1.1 Business and Trade Environment 4
1.2 The Seafood Sector 5
1.3 Consumer Trends 11
1.4 UK Share and Export Opportunities 12
SECTION 2 DOING BUSINESS PROFILE 2.1 The Supply Structure 15
2.3 The Foodservice Channel 18
2.4 Key Regulations and Tariffs 19
2.5 Tips and Useful Links 22
Follow Up Action 23

- 3 -
EXECUTIVE SUMMARY
Summary of the Enquiry
UKTI Russia received a request for the present service from Seafish.
Seafish is an organization funded by a levy on the first sale of seafood landed and imported in the UK. It aims to support and improve the environmental sustainability, efficiency and cost-effectiveness of the industry, as well as
promoting sustainably-sourced seafood.
Seafish commissioned this activity to update existing market report on Russia: Though UKTI did our best to obtain the necessary data we cannot guarantee that
we have found everything as listed. UKTI uses different methods when searching and compiling information. Basically, we search open public sources - internet
and professional publications. Specific statistics and data are quite hard to obtain in Russia through open sources - it is scarce and usually not the latest. Some paragraphs describing general information were left unchanged as the
information is still actual and relevant.
Methodology UK Trade & Investment have prepared this report using information obtained on
a selective basis from the following sources -
Commercial databases Web-based research
Industry contacts, previously established by the UKTI Trade associations and other relevant organisations Trade publications
Note: some figures in this report are indicated in US Dollars and not converted
into GBP due to frequent changes of exchange rates.

- 4 -
SECTION 1 MATCHING PROFILE 1.1 BUSINESS AND TRADE ENVIRONMENT
Fast facts Source Euromonitor International, Rosstat
Land area 17,075,400 sq km
Russia is bounded by Arctic Ocean seas (Barents, White, Karsk,
Laptev, Eastern Siberian, Chukotka seas); Pacific Ocean seas (Bering, Оkhotsk, Japanese
seas); Atlantic Ocean seas (Baltic, Black, Azov seas)
The longest rivers Lena 4337 km, Yenisei (with Angara) 3844 km, Volga 3694 km, Ob’ 3676 km, Amur 2855 km
The largest lakes Baikal 31.5, Ladoga 17.7, Onega 9.7 thousand sq. km
Population 142,9 million
Inhabitants per km 8.4
No. of households 52.5 million
Capital Moscow
Other main cities St Petersburg, Novosirbirsk, Ekaterinburg, Nizhny Novgorod, Samara, Omsk, Kazan,
Chelyabinsk, Rostov, Ufa
Language Russian
Religion Russian Orthodox, Muslim
Currency Rouble (RUB)
Exchange rate (2011 average) £ 1 = RUB 47.04
Total GDP (2011) RUB 54,586 billion (≈£ 1,160 billion)
Real GDP growth rate (2011) 4.3%
GDP per capita 31,439.5 RUB (≈£ 668,36)
Inflation (2011) 8.5%
Unemployment (2010) 3.9%
International status Member of Commonwealth of Independent
States; expected to become member of World Trade Organization (WTO) in 2012
Government type Federal Republic
Total food and drink imports (2011) $ 42,476 billion
Total food and drink exports (2011) $ 11,964 billion
Top 3 import countries (2010) China, Germany, Ukraine
Russia’s economy remains in good short-term health, with GDP expected to grow
by around 4% this year. The budget is close to balance, and unemployment and inflation are low. The main downside risk is from adverse developments in the world economy, principally the euro zone, and a sustained fall in world energy
prices, which would undermine Russia’s export and budget revenues and financial stability. In the medium term, economic and institutional reforms are
needed if Russia’s economy is to achieve its full potential and reduce its vulnerability to global commodity price changes. These reforms include modernising and diversifying the economy; improving investment, innovation

- 5 -
and the business environment, notably by tackling corruption and reducing the
role of the state; and reorienting public spending towards healthcare, education and infrastructure.
In May 2012 Vladimir Putin was inaugurated as President and nominated Medvedev as the new Prime Minister. The ministerial reshuffle brings a mixture
old and new faces to economic portfolios. Putin issues executive orders setting out his priorities. The economy grows by a brisk 4.9% in the year to 2012 Q1 and inflation falls to 3.6%. But renewed turbulence in the euro zone and weaker
oil prices are clouding the outlook for the rest of the year, causing the rouble and stock market to fall sharply.
Russia was ranked 112th of 132 countries (and behind China, Brazil and India) in the World Economic Forum’s new “Enabling Trade Index”, which measures
whether a country has the institutions, policies and services to facilitate the free flow of goods over borders and to destination. The WEF commented that Russia
would benefit from a freer trade policy, more efficient border administration, and a less burdensome regulatory environment.
President Vladimir Putin signed the bill ratifying Russia's entry to the World Trade Organization on 21st July, 2012.
Overall, Russia remains a dynamic market with potential for major further growth over the next 10 years.
1.2 THE SEAFOOD SECTOR
The category of fish/seafood is one of the most important in food industry. The
great majority of Russians are consumers of this category. Production of fish/seafood demonstrated significant growth over recent years driven both by increased harvest and growing demand. In 2010 per capita consumption of
fish/seafood in Russia was about 20 kg. Significant increase of consumption observed in 2009 was determined by switch of many consumers from meat to
less expensive fish during recession. Table 1: Average food expenditure by category 2011
Food category Market share, %
Bread products 14.9
Potatoes 1.8
Vegetables 8.1
Fruits and berries 6.2
Meat and meat products 28.9
Fish and fish products 5.4
Milk and dairy products 14.6
Sugar and confectionery 8.5
Vegetable oil and other fats 1.9
Tea, coffee and other drinks and food 8.4
- 6 -
In the list of essential foodstuff of Russians fish and seafood are at bottom
positions. For instance, in 2008 Russian households consumed by 3.8 times more of meat and meat products in comparison to fish /seafood; consumption of sugar and confectionery exceeded consumption of fish/seafood by 1.6 times.
Noteworthy, share of fish/seafood in daily energy value of an average Russian’s diet during the review period constituted just 1.6%.
In the summary it should be mentioned that recession had no serious negative impact upon Russian market of fish/seafood; on the contrary, it stimulated
demand for inexpensive fish/seafood offerings as a good alternative to meat. Along with after-crisis recovery of Russian economy demand for more expensive
kinds of fish/seafood will grow. Considering recovery dynamics of Russian economy after recession, in short term
perspective production of fish/seafood is expected to grow by 5-6% annually, and consumption in the review category will increase from 20 kg/person to 23.7
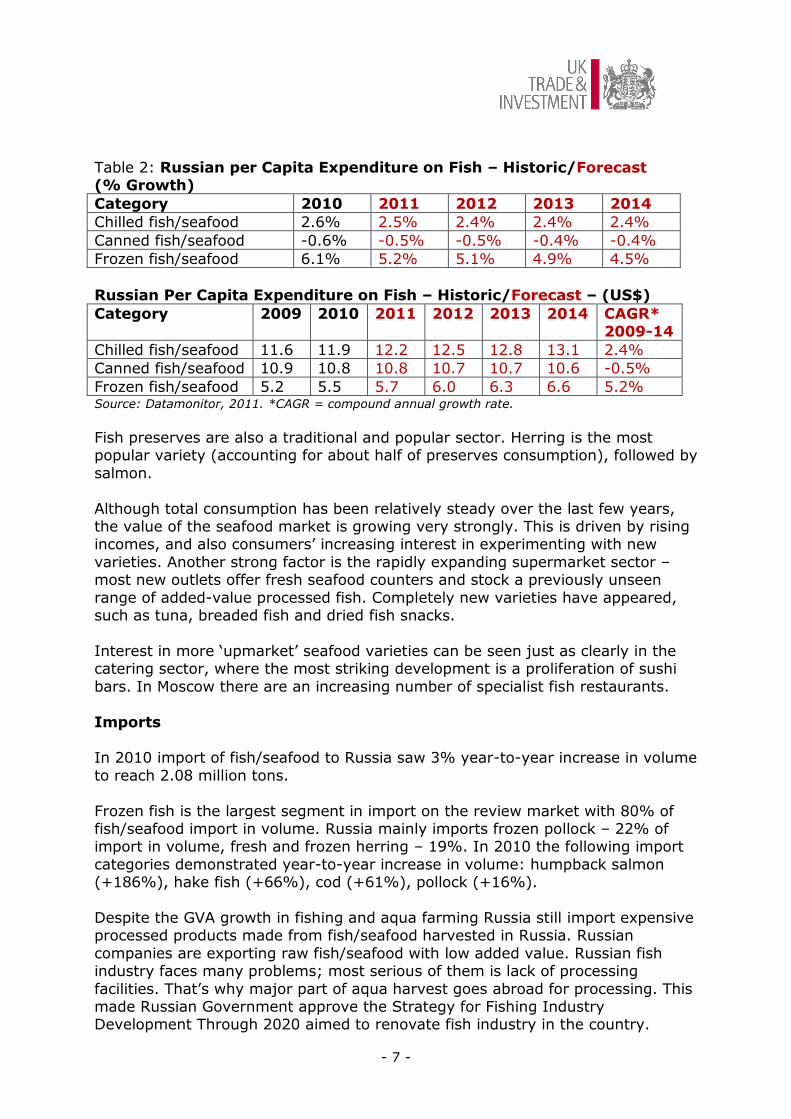
kg/person annually. Table 2 indicates the main types of fish consumed. Frozen fish dominates,
although fresh and chilled fish are now growing strongly. Frozen fish/seafood constitutes major part of domestic production – over 70%. Second large
segment is live fish – 22%, meanwhile fresh/chilled fish provides just 6.7% of production volume which is related to complicacy of storage/shipment procedures required by this category.
Certainly canned fish, in generic unbranded packs, is a long-standing market in
Russia and the category now appears buoyant as suppliers introduce new varieties in more appealing branded packaging. Popular varieties include salmon,
pink salmon, sprats and mackerel. In 2010 total production volume of processed and canned fish/seafood constituted 3400 thousand tonnes – plus 2.8% over 2009.
Fish consumption patterns depend heavily on household incomes. Consumption
preferences amongst the Russian population include herring, pollock, mackerel, salmon, and trout. Premium fish and seafood products are primarily favoured by consumers with higher incomes, and are eaten once or twice a week. Lower- to
middle-income Russians treat fish and seafood products as holiday or special occasion fare, consuming these dishes just once, on average, in a three- to four-
month period. Average monthly expenditure of Russian households for fish/seafood in 2008
constituted RUB 167.9 per person, i.e. 6.2% of essential food expenditure.
Consumption volume of fish/seafood products is directly related to family size, number of kids, and income level of consumers. For instance, one-person households averagely consume 31.6 kg of fish and seafood annually with
monthly expenditure of RUB 273.5. Meanwhile large families – 5 people and more – averagely consume 14.6 of fish/seafood per person annually with
monthly expenditure of RUB 117.2 per person.
- 7 -
Table 2: Russian per Capita Expenditure on Fish – Historic/Forecast (% Growth)
Category 2010 2011 2012 2013 2014
Chilled fish/seafood 2.6% 2.5% 2.4% 2.4% 2.4%
Canned fish/seafood -0.6% -0.5% -0.5% -0.4% -0.4%
Frozen fish/seafood 6.1% 5.2% 5.1% 4.9% 4.5%
Russian Per Capita Expenditure on Fish – Historic/Forecast – (US$)
Category 2009 2010 2011 2012 2013 2014 CAGR* 2009-14
Chilled fish/seafood 11.6 11.9 12.2 12.5 12.8 13.1 2.4%
Canned fish/seafood 10.9 10.8 10.8 10.7 10.7 10.6 -0.5%
Frozen fish/seafood 5.2 5.5 5.7 6.0 6.3 6.6 5.2% Source: Datamonitor, 2011. *CAGR = compound annual growth rate.
Fish preserves are also a traditional and popular sector. Herring is the most popular variety (accounting for about half of preserves consumption), followed by
salmon.
Although total consumption has been relatively steady over the last few years, the value of the seafood market is growing very strongly. This is driven by rising incomes, and also consumers’ increasing interest in experimenting with new
varieties. Another strong factor is the rapidly expanding supermarket sector – most new outlets offer fresh seafood counters and stock a previously unseen
range of added-value processed fish. Completely new varieties have appeared, such as tuna, breaded fish and dried fish snacks.
Interest in more ‘upmarket’ seafood varieties can be seen just as clearly in the catering sector, where the most striking development is a proliferation of sushi
bars. In Moscow there are an increasing number of specialist fish restaurants.
Imports In 2010 import of fish/seafood to Russia saw 3% year-to-year increase in volume
to reach 2.08 million tons.
Frozen fish is the largest segment in import on the review market with 80% of fish/seafood import in volume. Russia mainly imports frozen pollock – 22% of import in volume, fresh and frozen herring – 19%. In 2010 the following import
categories demonstrated year-to-year increase in volume: humpback salmon (+186%), hake fish (+66%), cod (+61%), pollock (+16%).
Despite the GVA growth in fishing and aqua farming Russia still import expensive processed products made from fish/seafood harvested in Russia. Russian
companies are exporting raw fish/seafood with low added value. Russian fish industry faces many problems; most serious of them is lack of processing
facilities. That’s why major part of aqua harvest goes abroad for processing. This made Russian Government approve the Strategy for Fishing Industry Development Through 2020 aimed to renovate fish industry in the country.

- 8 -
Table 3: Russian Imports of Fish and Crustaceans, Molluscs and Other Aquatic Invertebrates (Excluding Processed)
Description Cost, USD % Share % Change 2009/10
2008 2009 2010 2008 2009 2010
Fish and
Seafood (Fresh
or Frozen)
2,190,180,295 1,839,014,835 2,054,496,450 100.0 100.0 100.0 11.7
Fish, Frozen
(No Fish Fillets
or Other Fish
Meat)
871,596,119 751,764,974 793,990,891 39.8 40.9 38.7 5.6
Fish, Fresh Or
Chilled (No
Fillets or Other
Meat)
407,087,804 460,128,187 660,056,165 18.6 25.0 32.1 43.5
Fish Fillets and
Other Fish
Meat, Fresh,
Chilled or
Frozen
519,629,214 358,285,424 265,126,032 23.7 19.5 12.9 -26.0
Crustaceans
Live Fresh etc.,
Cooked etc.,
Flours and
Meals for
Human
Consumption
233,110,240 180,368,884 216,554,592 10.6 9.8 10.5 20.1
Molluscs &
Aquatic
Invertebrates
Nesoi, Live
etc.; Flours etc.
89,105,835 45,063,697 61,469,980 4.1 2.5 3.0 36.4
Fish, Dried,
Salted etc.,
Smoked, etc;
Edible Fish Meal
62,284,738 36,060,100 43,049,254 2.8 1.9 2.1 19.4
Fish, Live 7,366,344 7,343,570 14,249,535 0.3 0.4 0.7 94.0
Source: Global Trade Atlas, 2011.
Import of fresh, processed and canned/preserved fish increases mainly driven by changing consumer preferences and shift to more expensive products.
The largest importers of dried, salted and smoked fish to Russia were Estonia, China, Thailand and Vietnam. The largest product category was “dried, unsalted
or salted, non-smoked fish” with 87.1% of import volume and 89.6% of its value. More than half of this category – 52% – was imported from China. Noteworthy, importance of China in fish supplies grows immensely over the
recent years forcing out from Russian market Kazakhstan and Thailand with similar products. Supplies of smoked herring were also very impressive – 100%
supplier of this category was Estonia. Share of processed and preserved fish in

- 9 -
import is declining.
Demand is increasing for more upmarket added-value products, with fish fillets, smoked fish, molluscs and crustaceans showing marked growth. In the case of
crustaceans, it is frozen coldwater prawns that are driving the growth (the market for warm water prawns is only just emerging and is limited to premium
retail outlets and caterers). The only import category that is in decline is canned fish. This reflects the
strengthening of domestic fish processing companies, who are becoming increasingly innovative and sophisticated in marketing their products.
Dried fish and stockfish is the only category of Russian market of ready fish/seafood products where import volume exceeds domestic production. In
2008 import of dried fish and stockfish constituted 24.4 thousand tonnes in volume and $ 86 million in value which corresponded to 66% of import on the
review market. In the first half of 2009 share of dried fish and stockfish in total import reached 69%. Most important supplier of this product category to Russia is China.
Table 4: Main types of fish and seafood imported to Russia
2005 2006 2007 2008 2009 2010
Fish and crustaceans, molluscs and other
aquatic invertebrates, million US dollar
958 1207 1739 2036 1698 2040
Of them:
Fish, fresh or chilled, excluding fish fillets,
thousand tonnes
50.1 30.0 64.4 78.6 89.9 104
Frozen fish, excluding fish fillets, thousand
tonnes
658 556 637 553 527 550
Fish fillets and other fish meat, fresh, chilled
or frozen, thousand tonnes
78.9 101 169 250 178 137
Fish, dried, salted or in brine, thousand
tonnes
20.9 23.4 24.4 20.2 11.0 12.9
Crustaceans, live, fresh, chilled, frozen,
dried, salted or in brine, thousand tonnes
45.6 46.6 68.3 65.8 52.6 62.0
Molluscs and other aquatic invertebrates,
thousand tonnes
10.8 17.4 17.6 35.3 14.8 21.4
Ready products of meat of fish or
crustaceans or molluscs and other aquatic
invertebrates, million US dollars
303 350 426 564 457 491
Of them:
Ready or preserved fish, sturgeon caviar and
caviar substitutes, thousand tonnes
97.3 87.6 90.6 96.3 73.0 94.2
Ready or preserved crustaceans, molluscs
and other aquatic invertebrates, thousand
tonnes
10.9 8.1 10.5 13.2 8.8 11.2
Imports of fish and fishery products in 2011 fell by 11% from 889,000 tonnes in 2010 to 790,000 tonnes in 2011. Import of chilled and frozen fish declined by
24.4 % to USD 171 million. For April 2012 compared to April 2011, they were down 18.9%.
- 10 -
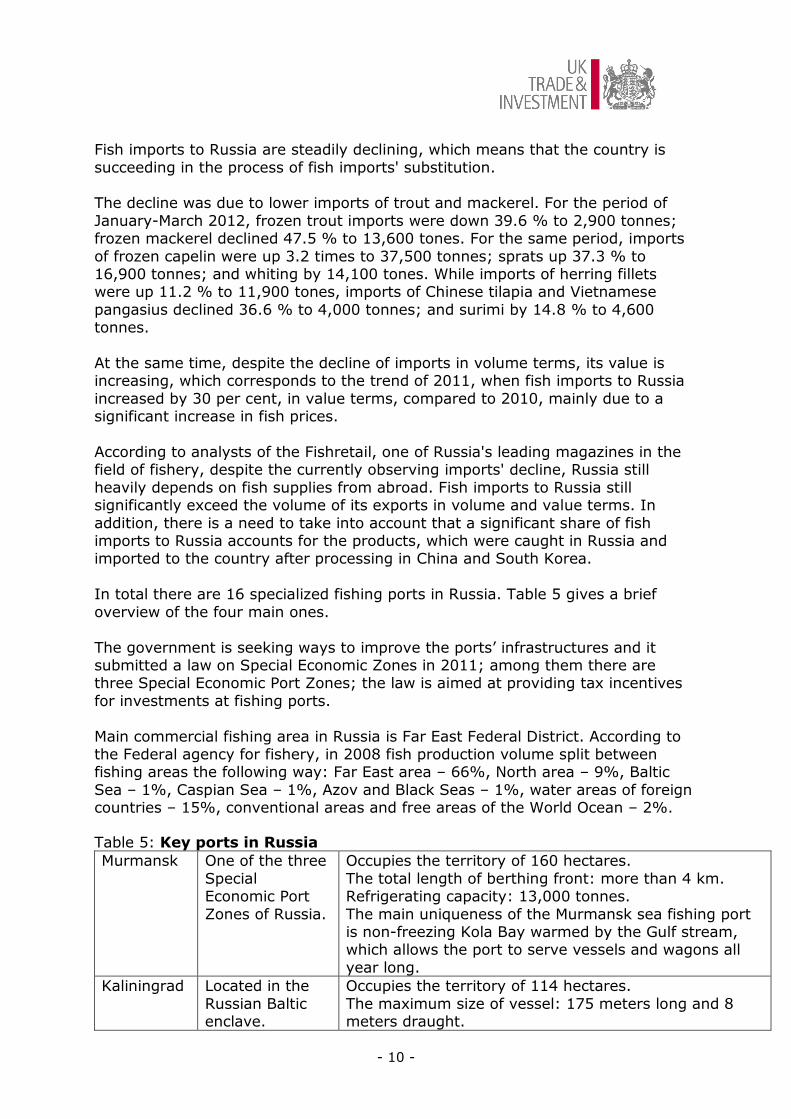
Fish imports to Russia are steadily declining, which means that the country is
succeeding in the process of fish imports' substitution. The decline was due to lower imports of trout and mackerel. For the period of
January-March 2012, frozen trout imports were down 39.6 % to 2,900 tonnes; frozen mackerel declined 47.5 % to 13,600 tones. For the same period, imports
of frozen capelin were up 3.2 times to 37,500 tonnes; sprats up 37.3 % to 16,900 tonnes; and whiting by 14,100 tones. While imports of herring fillets were up 11.2 % to 11,900 tones, imports of Chinese tilapia and Vietnamese
pangasius declined 36.6 % to 4,000 tonnes; and surimi by 14.8 % to 4,600 tonnes.
At the same time, despite the decline of imports in volume terms, its value is increasing, which corresponds to the trend of 2011, when fish imports to Russia
increased by 30 per cent, in value terms, compared to 2010, mainly due to a significant increase in fish prices.
According to analysts of the Fishretail, one of Russia's leading magazines in the field of fishery, despite the currently observing imports' decline, Russia still
heavily depends on fish supplies from abroad. Fish imports to Russia still significantly exceed the volume of its exports in volume and value terms. In
addition, there is a need to take into account that a significant share of fish imports to Russia accounts for the products, which were caught in Russia and imported to the country after processing in China and South Korea.
In total there are 16 specialized fishing ports in Russia. Table 5 gives a brief
overview of the four main ones.
The government is seeking ways to improve the ports’ infrastructures and it submitted a law on Special Economic Zones in 2011; among them there are three Special Economic Port Zones; the law is aimed at providing tax incentives
for investments at fishing ports.
Main commercial fishing area in Russia is Far East Federal District. According to the Federal agency for fishery, in 2008 fish production volume split between fishing areas the following way: Far East area – 66%, North area – 9%, Baltic
Sea – 1%, Caspian Sea – 1%, Azov and Black Seas – 1%, water areas of foreign countries – 15%, conventional areas and free areas of the World Ocean – 2%.
Table 5: Key ports in Russia
Murmansk
One of the three
Special Economic Port
Zones of Russia.
Occupies the territory of 160 hectares.
The total length of berthing front: more than 4 km. Refrigerating capacity: 13,000 tonnes.
The main uniqueness of the Murmansk sea fishing port is non-freezing Kola Bay warmed by the Gulf stream, which allows the port to serve vessels and wagons all
year long.
Kaliningrad Located in the
Russian Baltic enclave.
Occupies the territory of 114 hectares.
The maximum size of vessel: 175 meters long and 8 meters draught.

- 11 -
Kaliningradskaya
region has the status of the
Tourism and Recreational Special
Economic Zone.
The total length of berthing front : 3088 meters
Warehousing: 89,993 square meters; 2 refrigerators for 16,000 tonnes.
The port can annually serve more than 2000 Russian and foreign vessels.
St.
Petersburg
One of the
largest trading ports in the
country.
The maximum size of vessel: 260 meters long and 11
meters draught. The total length of berthing front: 660 meters
Warehousing: 19,400 square meters Refrigerating capacity: 4,000 tonnes on the area of 4,600 square meters.
Has a year-round navigation, with the assistance of icebreakers during the winter-period.
Vladivostok Russia’s largest port on the
Pacific Ocean.
Occupies the territory of 323,700 square meters. The total length of berthing front: 2,020 meters.
Warehousing: 58,000 square meters. There are two 4-storey and 5-storey refrigerators occupying the area of 47,784 square meters.
Vladivostok sea fishing port is located on the southern shore of the bay Zolotoy Rog. This non-freezing bay is
well protected from the winds and has a year-round navigation.
1.3 CONSUMER TRENDS
The Russian seafood sector is undergoing major change. During the Soviet era and the early nineties, the offering to consumers was overwhelmingly frozen and
canned fish – generally sold as generic products with minimal or no branding. In recent years, a combination of fast-rising incomes, expanding retail chains, rising interest among foreign suppliers and increasingly sophisticated local producers
has led to a rapidly expanding range of fish products being consumed. In particular consumers are gradually moving to more upmarket product options
such as chilled fish, fish fillets, smoked fish, crustaceans and molluscs. Frozen fish is a traditionally popular option, however, experts believe that higher
imports of chilled fish and ready-to-eat products, in the wake of growing consumer demand, signal national economic recovery.
According to Federal Centre of Fish Genetics and Selection (FSGCR), Russian consumers mainly purchase live and frozen fish/seafood – 64.5% of respondents.
Meanwhile salted, smoked and dried fish/seafood is preferred by 21.3% of respondents.
Mintel reports that variety and quality are increasingly important to Russian consumers. To satisfy demand, local retail outlets and restaurants offer an
expansive selection of traditional products and exotic items. In addition to the customary herring, mackerel, and salmon, consumers can now find squid,
prawns, mussels, live scallops, snails, and oysters.

- 12 -
Increase of consumer demand for fish/seafood was driven by income growth,
wide offer of the category including both affordable products and delicacy, by growing popularity of fish/seafood snacks, and by some other factors.
Volume of the market of ready non-canned fish/seafood – salted, smocked, dried, in spicy sauce, in marinade, and also of fish/seafood gastronomy –
exceeded 300 thousand tonnes in 2008. According to “Informanalysis” findings, value of the review market constituted in 2008 about RUB 50 billion. Imported products constituted 12% of market volume or 37 thousand tons.
Considering volumes of domestic production, import and export, in 2008 about
33% of Russian market of ready-to-serve fish/seafood products in volume was provided by gastronomy – including surimi-based ready products. Shares of salted herring and smocked fish constituted respectively 21 and 19% of market
volume. Dried fish and stockfish provided 13% of market volume, while salted fish except herring – 11%.
For evening meals at home, it is traditional in Russia to eat whitefish, salmon, trout and sturgeon. The fish is typically fried, baked or – in the summer –
barbecued on skewers or grilled. While new varieties and processed fish are emerging, the traditional approach still dominates in terms of overall
consumption. Out of home, in cafés, small sandwiches topped with smoked fish are very much the norm. Probably the main development in out of home consumption is the striking proliferation of sushi bars in major cities across
Russia. These are playing a significant role in introducing consumers to new fish varieties. The popularity of Japanese food is such that most supermarkets now
stock a sushi range.
Increasing interest in health and nutrition is expected to support growth in the seafood sector long term. However, interest in healthy eating is clearly apparent only in Moscow and St Petersburg, and further consumer education will be
required to capture the potential of this international consumer trend.
As a rule, urban consumers eat more fish/seafood than rural dwellers. For instance, in 2008 average per capita consumption of the review category in urban Russia constituted 18.2 kg while in rural settlements this index was 17.2
kg. Urban dwellers more often buy canned fish and fish/seafood gastronomy – respectively 10 and 4% of total consumption volume of fish/seafood; meanwhile
in rural Russia, the said categories constitute 8 and 2% of consumption respectively. However, salted and smocked fish is more popular among rural dwellers – 23% of fish/seafood consumption volume against 18% in urban
Russia.
1.4 UK SHARE AND EXPORT OPPORTUNITIES The UK is Russia’s fifth largest foreign supplier of seafood, accounting for about
4% of total seafood imports by value.
The leading supplier is Norway, which accounted for about a third of all imports by value last year. Its major items are herring, farmed Atlantic salmon and trout,
- 13 -
and mackerel. Norway is a particularly strong supplier of chilled fish; indeed,
80% of Russia’s chilled fish imports are sourced from this country. China and Vietnam are both showing consistently growing exports to Russia.
Vietnam’s main growth areas are pangasius and surimi. For China, the lead product is Alaskan pollack fillets, which accounts for about a quarter of its
exports to Russia. Next in importance are surimi and squid. It should be mentioned that pollock offered by the market is harvested in Russia,
but due to lack of processing facilities major part of the harvest goes to other countries for processing – as a rule, to China. Thus, Russia imports “re-frozen”
fish with degraded nutrition value. In 2010 Russia exported 1412 thousand tonnes of fish/seafood – plus almost
20% over 2009.
Segmentation of Russian export of fish/seafood is similar to import with obvious dominance of frozen fish – over 90% in volume. Other export segments are fish fillet (4%), crustaceans (2%) and mollusks (1%).
Pollock is the largest category of export just like of import – in 2010 this kind of
fish provided 67% of export volume with 32% year-to-year increase. Total export of pollock from Russia constituted 942.1 thousand tonnes. 602.9 thousand tonnes went to China, and 35% or 329.6 thousand tonnes – to
Korea.
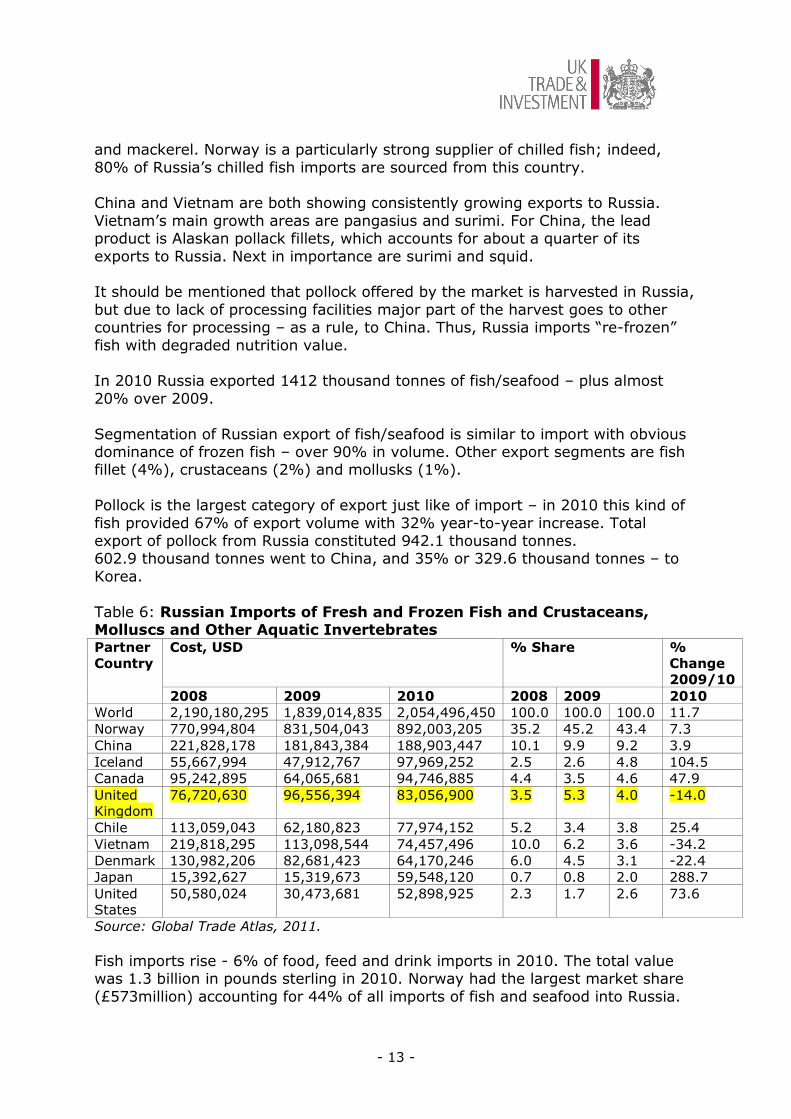
Table 6: Russian Imports of Fresh and Frozen Fish and Crustaceans, Molluscs and Other Aquatic Invertebrates Partner
Country
Cost, USD % Share %
Change
2009/10
2008 2009 2010 2008 2009 2010
World 2,190,180,295 1,839,014,835 2,054,496,450 100.0 100.0 100.0 11.7
Norway 770,994,804 831,504,043 892,003,205 35.2 45.2 43.4 7.3
China 221,828,178 181,843,384 188,903,447 10.1 9.9 9.2 3.9
Iceland 55,667,994 47,912,767 97,969,252 2.5 2.6 4.8 104.5
Canada 95,242,895 64,065,681 94,746,885 4.4 3.5 4.6 47.9
United
Kingdom
76,720,630 96,556,394 83,056,900 3.5 5.3 4.0 -14.0
Chile 113,059,043 62,180,823 77,974,152 5.2 3.4 3.8 25.4
Vietnam 219,818,295 113,098,544 74,457,496 10.0 6.2 3.6 -34.2
Denmark 130,982,206 82,681,423 64,170,246 6.0 4.5 3.1 -22.4
Japan 15,392,627 15,319,673 59,548,120 0.7 0.8 2.0 288.7
United
States
50,580,024 30,473,681 52,898,925 2.3 1.7 2.6 73.6
Source: Global Trade Atlas, 2011.
Fish imports rise - 6% of food, feed and drink imports in 2010. The total value was 1.3 billion in pounds sterling in 2010. Norway had the largest market share
(£573million) accounting for 44% of all imports of fish and seafood into Russia.

- 14 -
China exported £124million, followed by Iceland (£65million) and Canada
(£59million). The UK exported £53 million in 2010 (mostly frozen mackerel) – more than
Denmark (£41million), Spain (£22million) and Ireland (£15million)
Table 7: Average annual UK exports to Russia from 2008 to 2010 (Thousand Tonnes)
Frozen whole mackerel 35.5
Frozen herring 4.2
Frozen blue whiting 2.7
Frozen salmon 1.2
Other frozen saltwater fish 0.5 Source: DEFRA
For UK suppliers, the general buoyancy in the seafood market creates substantial
export opportunity. Specific areas of opportunity include the following:
Premium canned seafood. While local competition has increased dramatically, gaps remain in the premium sector.
Crustaceans and molluscs. Current ranges are generally branded weakly,
leaving opportunity for a sophisticated marketing strategy in this sector. Targeting key retail chains. Cost of entry is high (due to listing fees, etc.),
but one possible strategy is to focus distribution via a selection of key retailers and expand after critical mass is achieved.
Targeting wholesalers. For economy products, volumes remain substantial
through the traditional retail sector which is supplied by wholesaler intermediaries. The approach offers a lower cost of entry than targeting
the major chains directly. Seek private label contracts. Leading retail chains are keen to identify new
fish products suitable for selling under their own branding.
Targeting the catering sector. The sector is small by international standards but is expected to show major growth over the next few years.
- 15 -
SECTION 2 DOING BUSINESS PROFILE
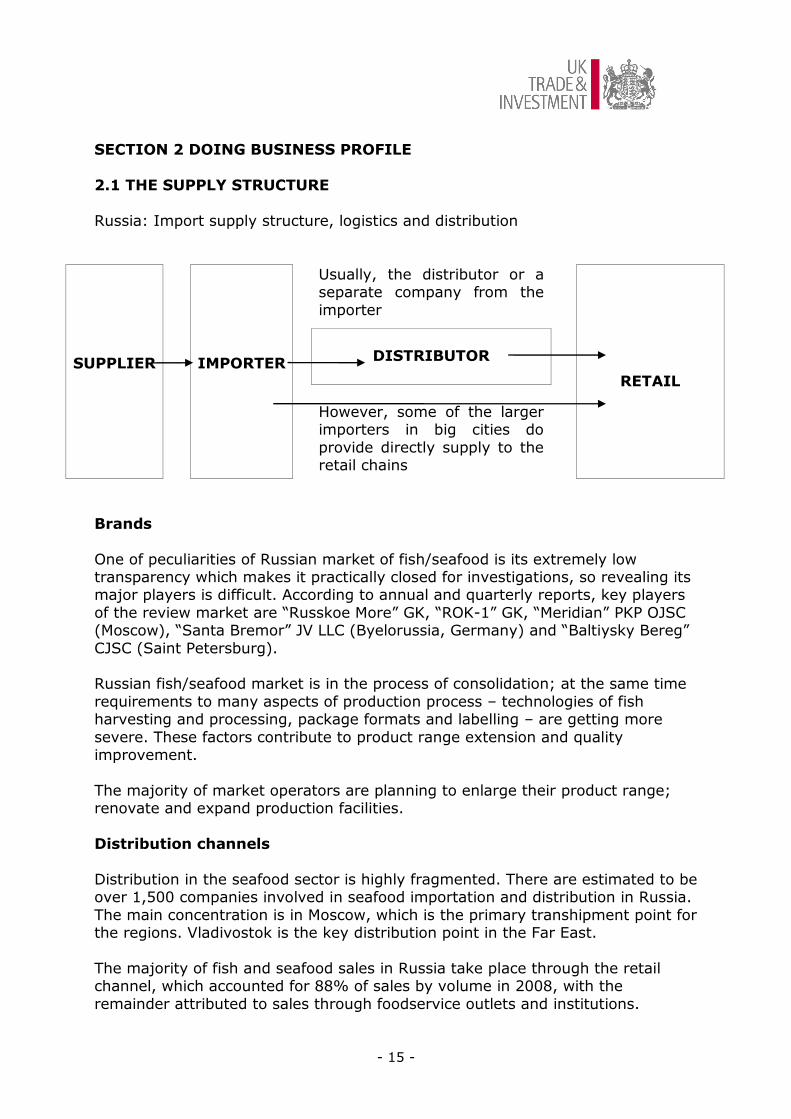
2.1 THE SUPPLY STRUCTURE
Russia: Import supply structure, logistics and distribution
SUPPLIER
IMPORTER
Usually, the distributor or a separate company from the
importer
RETAIL
DISTRIBUTOR
However, some of the larger importers in big cities do
provide directly supply to the retail chains
Brands
One of peculiarities of Russian market of fish/seafood is its extremely low transparency which makes it practically closed for investigations, so revealing its major players is difficult. According to annual and quarterly reports, key players
of the review market are “Russkoe More” GK, “ROK-1” GK, “Meridian” PKP OJSC (Moscow), “Santa Bremor” JV LLC (Byelorussia, Germany) and “Baltiysky Bereg”
CJSC (Saint Petersburg). Russian fish/seafood market is in the process of consolidation; at the same time
requirements to many aspects of production process – technologies of fish harvesting and processing, package formats and labelling – are getting more
severe. These factors contribute to product range extension and quality improvement.
The majority of market operators are planning to enlarge their product range; renovate and expand production facilities.
Distribution channels
Distribution in the seafood sector is highly fragmented. There are estimated to be over 1,500 companies involved in seafood importation and distribution in Russia.
The main concentration is in Moscow, which is the primary transhipment point for the regions. Vladivostok is the key distribution point in the Far East.
The majority of fish and seafood sales in Russia take place through the retail channel, which accounted for 88% of sales by volume in 2008, with the
remainder attributed to sales through foodservice outlets and institutions.

- 16 -
Table 8: Distribution Channels of Fish and Seafood Sales in Russia by
Value Share (%)
Channel 2009 2010
Supermarkets/Hypermarkets 56.4 56.8
Independent Retailers 27.4 27.1
Specialist Retailers 7.5 7.3
Convenience Stores 4.6 4.6
Service Stations 3.1 3.1
Department Stores (including duty-free shops) 1.0 1.0
Pharmacies/Drugstores n/a n/a
Vending Machines n/a n/a
Others n/a n/a
The rise of national retail chains is changing the role of distributors. Whereas
previously the latter were responsible for supplying a very large number of individual retail outlets, an increasing number of retail chains now run their own
centralised distribution centres and expect supply to a limited number of distribution points. This reduces complexity for seafood suppliers but there is a price to pay in terms of reduced distributor margin.
The increasingly powerful retail chains are also placing new demands on
suppliers in terms of storage conditions and reliability of supply. This is actually having a positive effect on the quality of the distribution infrastructure in Russia.
Most exporters to Russia find it beneficial to work through a single importer, rather than appointing a number of direct customers. While the latter approach
can create healthy competition between the importers, and a degree of security if one fails, it seems the most successful route to market is to focus business through a single company, with contract extension subject to volume target
achievement and a transparent agreement on trade mark-ups.
The retail market in Russia is largely dominated by supermarkets/hypermarkets, and most of these grocery stores are located in Moscow and St. Petersburg. The leading grocery retailers in Moscow include the X5 Retail Group, Auchan and
Sedmoi Kontinent. St. Petersburg's retail landscape is somewhat saturated and is dominated by O’Key, the X5 Retail Group, and Lenta.
Auchan, one of the top three retailers in Russia as a whole, has significantly increased its store network by acquiring Turkey-based Ramenka hypermarkets.
Auchan plans to triple its number of hypermarket outlets by 2016.
Another key foreign market player Metro Cash and Carry has expanded into Siberia.
In April 2009, OAA Moscow (the American Office of Agricultural Affairs) conducted a price survey of fish and fish products in Southern Moscow retail
outlets and open markets. This survey revealed a wide variety of traditional fish products available to the Russian consumer, such as herring, mackerel, and
salmon, as well as exotic products including squid, mussels, prawns, snails, scallops, and oysters.
- 17 -
The survey found that prices differed significantly between retail outlets and
open markets. Average fish prices in Russian supermarkets tended to be 10% to 30% higher than in the open markets.
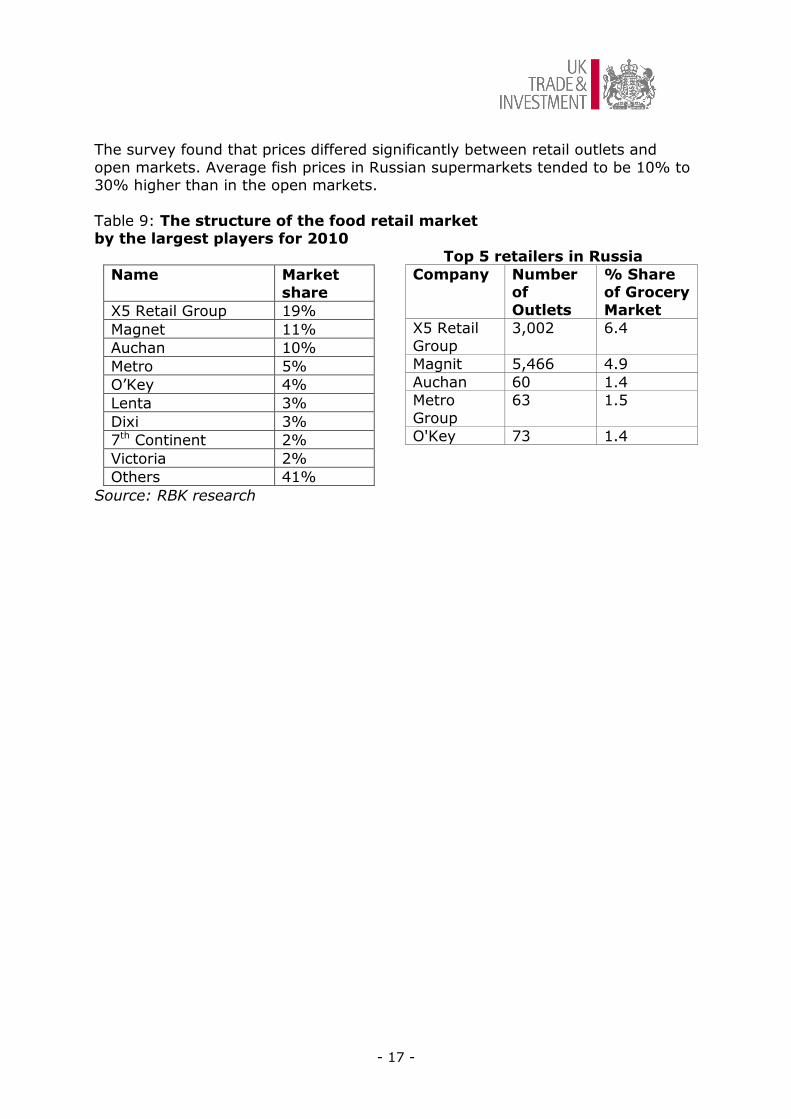
Table 9: The structure of the food retail market by the largest players for 2010
Name Market
share
X5 Retail Group 19%
Magnet 11%
Auchan 10%
Metro 5%
O’Key 4%
Lenta 3%
Dixi 3%
7th Continent 2%
Victoria 2%
Others 41%
Source: RBK research
Top 5 retailers in Russia
Company Number of
Outlets
% Share of Grocery
Market
X5 Retail
Group
3,002 6.4
Magnit 5,466 4.9
Auchan 60 1.4
Metro
Group
63 1.5
O'Key 73 1.4
The Overseas Market Introduction Service (‘OMIS’) is provided by the Commercial Departments of Diplomatic Service Posts overseas as part of the joint trade development operation, UK Trade & Investment (‘UKTI’), of the Foreign and Commonwealth Office (‘the FCO’) and the Department for Business, Innovation and Skills (‘BIS’). Whereas every
effort has been made to ensure that information provided through OMIS is accurate, these Commercial Departments, UKTI, the FCO and BIS accept no liability for any errors, omissions or misleading statements in such information and accept no responsibility as to the standing of any firm, company or individual mentioned. Any party interested in the goods and services provided by any company referred to in OMIS material should undertake their own research and should not consider a reference in OMIS material to be an endorsement of any goods, services or companies mentioned.
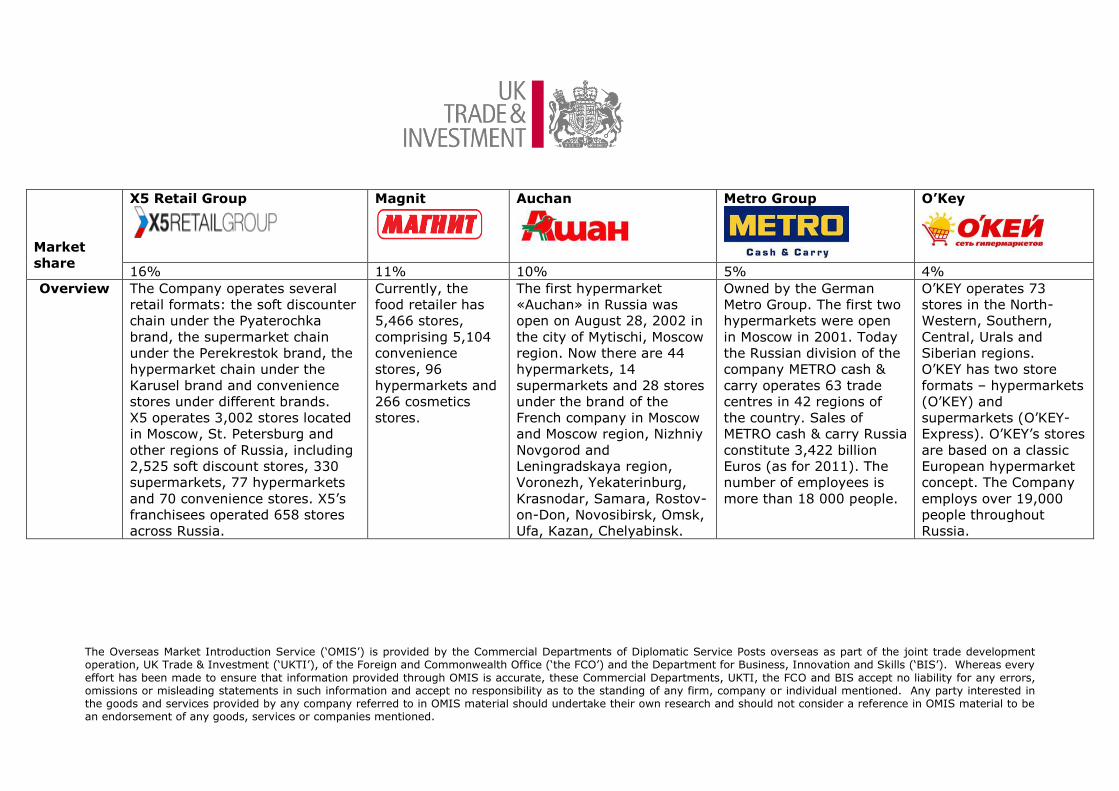
Market
share
X5 Retail Group
Magnit
Auchan
Metro Group
O’Key
16% 11% 10% 5% 4%
Overview The Company operates several
retail formats: the soft discounter
chain under the Pyaterochka
brand, the supermarket chain
under the Perekrestok brand, the
hypermarket chain under the
Karusel brand and convenience
stores under different brands.
X5 operates 3,002 stores located
in Moscow, St. Petersburg and
other regions of Russia, including
2,525 soft discount stores, 330
supermarkets, 77 hypermarkets
and 70 convenience stores. X5’s
franchisees operated 658 stores
across Russia.
Currently, the
food retailer has
5,466 stores,
comprising 5,104
convenience
stores, 96
hypermarkets and
266 cosmetics
stores.
The first hypermarket
«Auchan» in Russia was
open on August 28, 2002 in
the city of Mytischi, Moscow
region. Now there are 44
hypermarkets, 14
supermarkets and 28 stores
under the brand of the
French company in Moscow
and Moscow region, Nizhniy
Novgorod and
Leningradskaya region,
Voronezh, Yekaterinburg,
Krasnodar, Samara, Rostov-
on-Don, Novosibirsk, Omsk,
Ufa, Kazan, Chelyabinsk.
Owned by the German
Metro Group. The first two
hypermarkets were open
in Moscow in 2001. Today
the Russian division of the
company METRO cash &
carry operates 63 trade
centres in 42 regions of
the country. Sales of
METRO cash & carry Russia
constitute 3,422 billion
Euros (as for 2011). The
number of employees is
more than 18 000 people.
O’KEY operates 73
stores in the North-
Western, Southern,
Central, Urals and
Siberian regions.
O’KEY has two store
formats – hypermarkets
(O’KEY) and
supermarkets (O’KEY-
Express). O’KEY’s stores
are based on a classic
European hypermarket
concept. The Company
employs over 19,000
people throughout
Russia.
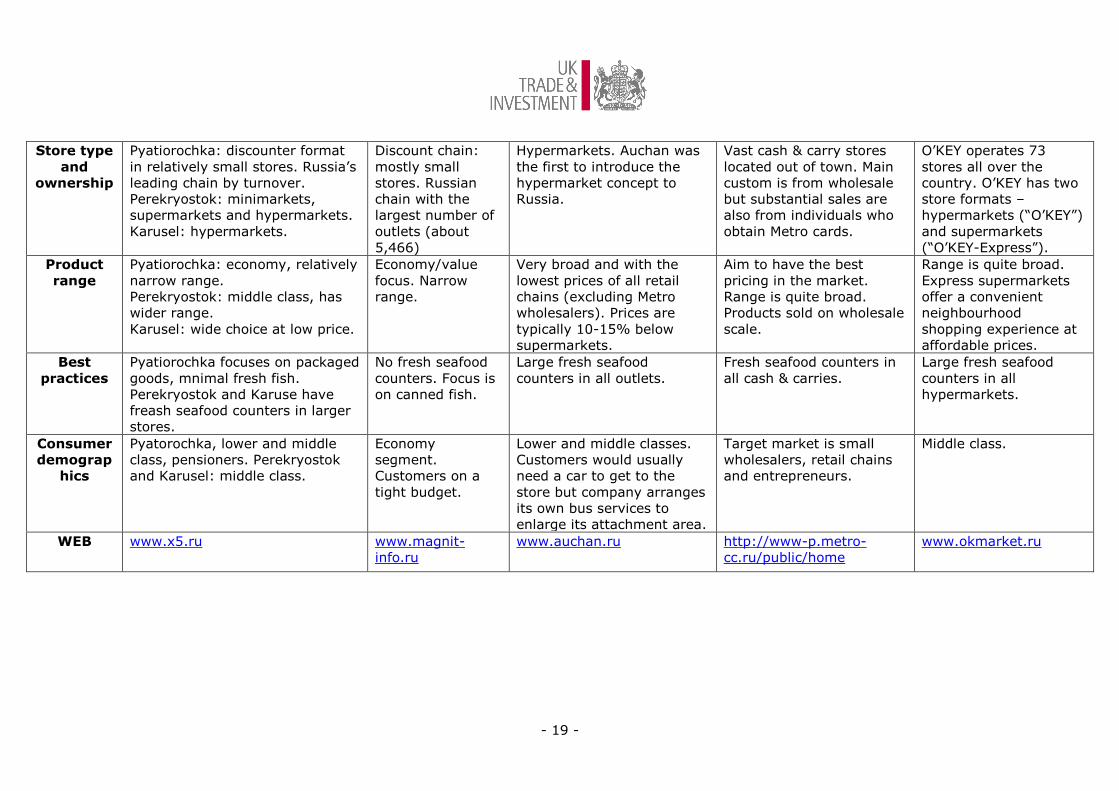
- 19 -
Store type
and
ownership
Pyatiorochka: discounter format
in relatively small stores. Russia’s
leading chain by turnover.
Perekryostok: minimarkets,
supermarkets and hypermarkets.
Karusel: hypermarkets.
Discount chain:
mostly small
stores. Russian
chain with the
largest number of
outlets (about
5,466)
Hypermarkets. Auchan was
the first to introduce the
hypermarket concept to
Russia.
Vast cash & carry stores
located out of town. Main
custom is from wholesale
but substantial sales are
also from individuals who
obtain Metro cards.
O’KEY operates 73
stores all over the
country. O’KEY has two
store formats –
hypermarkets (“O’KEY”)
and supermarkets
(“O’KEY-Express”).
Product
range
Pyatiorochka: economy, relatively
narrow range.
Perekryostok: middle class, has
wider range.
Karusel: wide choice at low price.
Economy/value
focus. Narrow
range.
Very broad and with the
lowest prices of all retail
chains (excluding Metro
wholesalers). Prices are
typically 10-15% below
supermarkets.
Aim to have the best
pricing in the market.
Range is quite broad.
Products sold on wholesale
scale.
Range is quite broad.
Express supermarkets
offer a convenient
neighbourhood
shopping experience at
affordable prices.
Best
practices
Pyatiorochka focuses on packaged
goods, mnimal fresh fish.
Perekryostok and Karuse have
freash seafood counters in larger
stores.
No fresh seafood
counters. Focus is
on canned fish.
Large fresh seafood
counters in all outlets.
Fresh seafood counters in
all cash & carries.
Large fresh seafood
counters in all
hypermarkets.
Consumer
demograp
hics
Pyatorochka, lower and middle
class, pensioners. Perekryostok
and Karusel: middle class.
Economy
segment.
Customers on a
tight budget.
Lower and middle classes.
Customers would usually
need a car to get to the
store but company arranges
its own bus services to
enlarge its attachment area.
Target market is small
wholesalers, retail chains
and entrepreneurs.
Middle class.
WEB www.x5.ru www.magnit-
info.ru
www.auchan.ru http://www-p.metro-
cc.ru/public/home
www.okmarket.ru
The Overseas Market Introduction Service (‘OMIS’) is provided by the Commercial Departments of Diplomatic Service Posts overseas as part of the joint trade development operation, UK Trade & Investment (‘UKTI’), of the Foreign and Commonwealth Office (‘the FCO’) and the Department for Business, Innovation and Skills (‘BIS’). Whereas every effort has been made to ensure that information provided through OMIS is accurate, these Commercial Departments, UKTI, the FCO and BIS accept no liability for any errors, omissions or misleading
statements in such information and accept no responsibility as to the standing of any firm, company or individual mentioned. Any party interested in the goods and services provided by any company referred to in OMIS material should undertake their own research and should not consider a reference in OMIS material to be an endorsement of any goods, services or companies mentioned.
2.3 THE FOODSERVICE CHANNEL
With Russia being the most populated country in the Eastern European region, the number of eating-out establishments in Poland, for instance, accounts for 96
thousand which is nearly two times higher than in Russia (54 thousand in 2010). The Western European countries, like Spain and Italy outperform Russia by
almost six times with 305 and 312 thousand outlets in each country respectively. Thus, Russian foodservice market is far from saturation. The market is expected to demonstrate further confident growth meeting new players. Both local and
international players will be getting more active in the overall market through various franchising and joint ventures scheme. The Russian consumer
foodservice market is predicted to reach $ 14.4 billion by the end of 2015. Fast-food saw the highest expansion in terms of both, current value sales and
number of outlets. The best growth in fast-food was registered in burger fast-food category, with the accelerating expansion of McDonalds being the main
growth engine. Another trend to emerge in fast-food on the post-recessionary market was
consumer demand for more exotic and diverse foodservice environment and growing focus on health and wellness, particularly among more affluent
consumers. Asian food, which enjoyed the exploded popularity in Russia in the past few
years, felt well in 2010 with recorded 12% growth in current value terms. It is expected that Asian fast-food and Asian full-service restaurant markets will add $
32 and $ 135 million respectively to the total foodservice value sales over the next five years.
For a long time the fate of the Russian fish on a professional kitchen was unenviable: it was mainly purchased frozen and of inexpensive varieties (cod,
hake). Today, restaurants more often include in their menus fresh turbot, catfish and silver carp. Cooks say the use of local fish is one of the main trends now,
though purchasing it is still associated with difficulties. The growth of demand on the local fish is driven by a desire to diversify their
menus and to offer an interesting product, which is relatively inexpensive to purchase. Guests are tired of dorada and sea bass, and so fresh tench, turbot or
pikeperch are perceived as exotic. According to some restaurateurs Russian fish is a good alternative to both wild and artificially grown imported fish.

- 21 -
2.4 KEY REGULATIONSANDTARIFFS
Import regulations
The seafood sector in Russia is notorious for its bureaucracy in foreign trade, with sudden changes in procedures and requirements often creating obstacles for
Russian importers. For foreign suppliers, the situation is more straightforward as the main issues apply to importers, who handle the procedures with the customs and veterinary authorities. These difficulties explain a trend for Russian
processors, distributors and retail chains to source product from specialised importers, rather than try to handle the process directly.
As for specific import requirements, the key ones are Certificate of Origin, Health Certificate, Certificate of Conformity/Hygiene (which states that the product in
question confirms to Russian standards) and Quality Certificate from the country of origin. All documents need to be provided in Russian.
The standard import duty on almost all live, fresh, chilled and frozen fish for all species, including fillets, is 10%. For some species of fish, however, the rate may
be 20%. Fish meal is 5%. In most cases these duties are subject to a minimum rate per kg. The full list of tariffs for different species of fish can be obtained
from the web-site of Customs Tariff of The Russian Federation. There is a concession on import taxes relating to the Russian Baltic enclave of
Kaliningrad. This region is a Free Economic Zone, with numerous exemptions on import and other taxes. Not surprisingly, the enclave has become Russia’s
leading seafood processing region. As part of the objective of Russian authorities to redirect more Russian caught fish to domestic production (rather than export),
there are often calls in government circles to introduce quotas on imported fish. Product safety
There are a large number of regulations and standards regarding quality and
safety of food products, including seafood, in Russia. All establishments wishing to export fish and seafood to the Russian Federation must be approved by the Russian authorities (Federal Service for Veterinary and Phytosanitary
Surveillance (VPSS) – Rosselkhoznadzor).
Approval by the Russian authorities is based on compliance with Russian standards and is a prerequisite for exporting fish and seafood. Import of fish products from Great Britain from non-accredited plants has been banned since
15 April 2008. The list of the accredited UK plants can be found on the web-site of VPSS:
http://fsvps.ru/fsvps/importExport/uk/enterprises.html?productType=7&_language=en
Ministry of Agriculture Order No462 for Veterinary and Sanitary Laboratory Testing of Fish and Caviar provides rules for veterinary testing for all types and
species of fish: wild or farmed fish and caviar. According to the order, fish and caviar are subject to veterinary and sanitary laboratory testing with the objective

- 22 -
of determining, whether products are fit for human consumption, as well as for
fish farming, reproduction and acclimatization. Please refer to GAIN RS9034 “Sanitary and Veterinary Rules for Seafood Testing” for more information. More information on GOST R (the official term for State Standards) and
certification schemes can be found on http://www.gost-r.ru/eng.php?page=gostreng
Certificate of Quality may be required for seafood and fish products and may be issued by the supplier/manufacturer.
Veterinary certificates are required for fish and sea-products and products of
their processing. Veterinary certificate is issued by VPSS either after inspection of cargo or/and on the basis of relevant certificates of the exporting country submitted to VPSS by importer. GAIN report RS7081 reproduces in English
translation the list of imported items including those issued by the Russian Service for Veterinary and Phyto-Sanitary Surveillance (VPSS), subject to
veterinary inspection when crossing the Russian Federation border. Labelling
Legal labelling requirements for fish are set out in State Standard GOST R-
51074-2003. The standards are different for fresh/frozen seafood and canned/preserved seafood.
Canned/preserved seafood For the latter category, the label must indicate in Russian: product name,
ingredients, name/address of manufacturer, grade (if any), net weight, nutritional content and value, storage requirements, date of production,
shelf life and Russian certification number.
Fresh/frozen seafood
Legal labelling requirements for fish are set out in State Standard GOST R-51074-2003. These standards define two groups of fish: ‘Fish, Seafood &
Seafood Products’ (Group 4.5) and ‘Canned & Preserved Fish & Seafood’ (Group 4.6). For both groups of fish, the following information is required in Russian language: product name, ingredients (including food additives
and biologically active components), grade (if any), name and legal address of the manufacturer, trademark, net weight (without brine in the
case of preserves), nutritional values, storage requirements, certification information and standards in accordance with which the product was manufactured. Additional requirements for Group 4.5 are: fishing region,
length of fish, type of dressing, type of treatment and salinity. For Group 4.6 date of production must also be provided. This list gives an overview
of the requirements and exporters are advised to examine the GOST standards referred to above for full details in this important area.
- 23 -
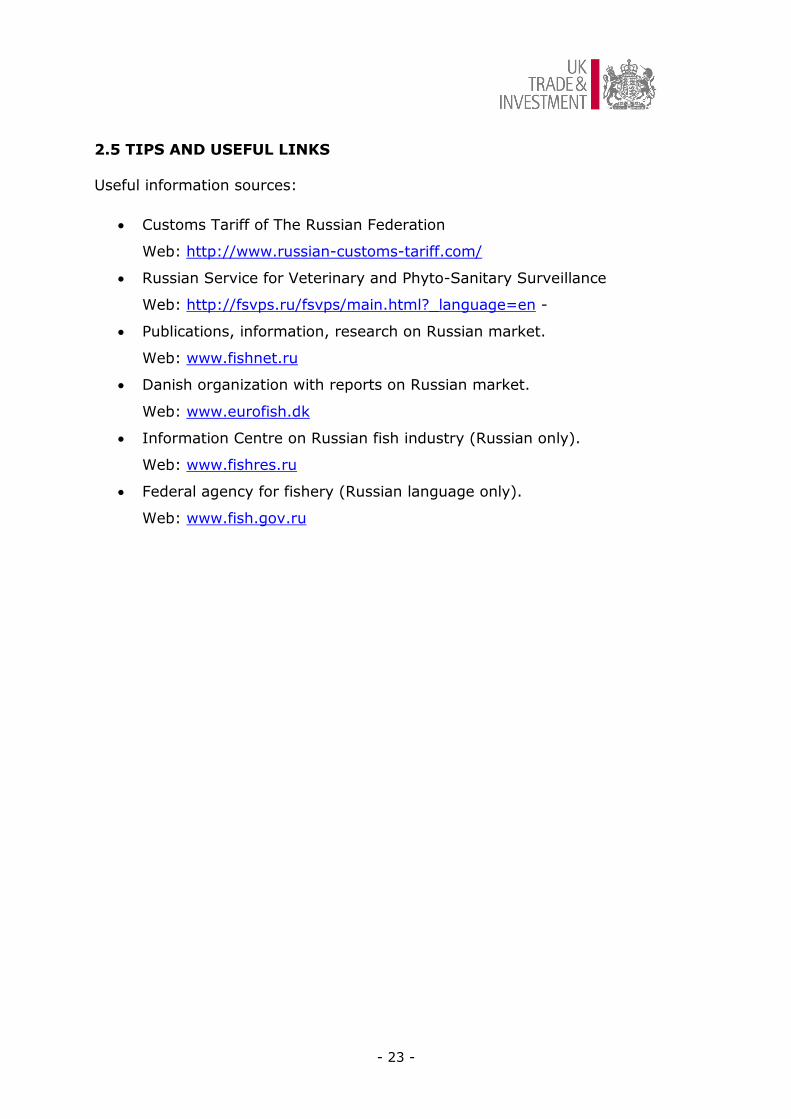
2.5 TIPS AND USEFUL LINKS
Useful information sources:
Customs Tariff of The Russian Federation
Web: http://www.russian-customs-tariff.com/
Russian Service for Veterinary and Phyto-Sanitary Surveillance
Web: http://fsvps.ru/fsvps/main.html?_language=en -
Publications, information, research on Russian market.
Web: www.fishnet.ru
Danish organization with reports on Russian market.
Web: www.eurofish.dk
Information Centre on Russian fish industry (Russian only).
Web: www.fishres.ru
Federal agency for fishery (Russian language only).
Web: www.fish.gov.ru


