Country Report 2019 INDIA - afsaworld.org · With GVA of Rs. 50.43 lakh crore, Industry sector...
29
Country Report 2019 INDIA
Transcript of Country Report 2019 INDIA - afsaworld.org · With GVA of Rs. 50.43 lakh crore, Industry sector...

Country Report 2019
INDIA

Table of Contents INDIA OVERVIEW .................................................................................................................................................................... 1
Demographics ..................................................................................................................................................................... 1
ECONOMIC OVERVIEW ........................................................................................................................................................... 2
GDP trends .......................................................................................................................................................................... 2
Comparison of Indian GDP with Other Countries ............................................................................................................... 3
Recent reforms ................................................................................................................................................................... 3
Inflation ............................................................................................................................................................................... 3
Current Account Deficit (CAD) ............................................................................................................................................ 4
Fiscal Deficit ........................................................................................................................................................................ 4
Foreign Exchange Reserve .................................................................................................................................................. 5
Index of Industrial Production (IIP) ..................................................................................................................................... 5
Financial System ................................................................................................................................................................. 6
Banking system – signs of improvement ........................................................................................................................ 6
Non-Banking Financial Companies (NBFCs) – minor hiccups; robust growth outlook ................................................... 6
Economic Outlook for India in Fiscal 2020.......................................................................................................................... 6
NATIONAL BUDGET 2O19-20 .................................................................................................................................................. 7
Budget at a glance .............................................................................................................................................................. 7
Infrastructure focus ............................................................................................................................................................ 8
INFRASTRUCTURE OUTLOOK .................................................................................................................................................. 9
Sectoral Overview (Key) ...................................................................................................................................................... 9
Roads .............................................................................................................................................................................. 9
Railways ........................................................................................................................................................................ 10
Power ............................................................................................................................................................................ 11
Urban Development ..................................................................................................................................................... 11
Irrigation and Water Supply .......................................................................................................................................... 12
Mining ........................................................................................................................................................................... 13
Ports .............................................................................................................................................................................. 14
Housing ......................................................................................................................................................................... 14
FMCG OUTLOOK ................................................................................................................................................................... 16
Demand Drivers ................................................................................................................................................................ 16
Government initiatives ..................................................................................................................................................... 16
LEASING OUTLOOK ............................................................................................................................................................... 17
Key Segments .................................................................................................................................................................... 17
Scenario post GST implementation .................................................................................................................................. 18
Overview of leasing in CME financing ............................................................................................................................... 18
Opportunity sizing: Key segments .................................................................................................................................... 20
Construction, Mining and Allied Equipment (CME) ...................................................................................................... 20
Information Technology (IT) equipment....................................................................................................................... 24
Farm Equipment ........................................................................................................................................................... 25
Automobiles .................................................................................................................................................................. 26

1 | P a g e
INDIA OVERVIEW
India is one of the oldest civilizations in the world with a kaleidoscopic variety
and rich cultural heritage. It has achieved all-round socio-economic progress
during the last 70 years of its Independence. India boasts of an immensely rich
cultural heritage that includes numerous languages, traditions and people (of
ethnic sub-sects). The country holds its uniqueness in its diversity and hence has
adapted itself to international changes with poise and comfort. While the
economy has welcomed international companies to invest in the country with
open arms since liberalisation in 1990s, Indians have been prudent and pro-
active in adopting global approach and skills. Indian villagers proudly take up
farming, advanced agriculture and unique handicrafts as their profession on one
hand, while modern industries and professional services sectors are coming up
in a big way on the other side.
India has become self-sufficient in agricultural production and is now one of the
top industrialised countries in the world and one of the few nations to have gone into outer space to conquer nature for
the benefit of the people. It covers an area of 32,87,263 sq. km (1,269,346 sq. mi), extending from the snow-covered
Himalayan heights to the tropical rain forests of the south. As the 7th largest country in the world, India stands apart
from the rest of Asia, marked off as it is by mountains and the sea, which give the country a distinct geographical entity.
Bounded by the Great Himalayas in the north, it stretches southwards and at the Tropic of Cancer, tapers off into the
Indian Ocean between the Bay of Bengal on the east and the Arabian Sea on the west.
Lying entirely in the northern hemisphere, the mainland extends between latitudes 8° 4' and 37° 6' north, longitudes 68°
7' and 97° 25' east and measures about 3,214 km from north to south between the extreme latitudes and about 2,933
km from east to west between the extreme longitudes. It has a land frontier of about 15,200 km. The total length of the
coastline of the mainland, Lakshadweep Islands and Andaman & Nicobar Islands is 7,516.6 km
Demographics
India, a South Asian nation, is the seventh largest country by area, the second most populated with
over 1.33 Billion people (spread across 29 states and 7 union territories) and the most populous
democracy in the world.
India has more than 50% of its population below the age of 25 and more than 65% below the age of
35. It is expected that, in 2020, the average age of an Indian will be 29 years, compared to 37 for
China and 48 for Japan.
Huge population, mostly comprising of educated youth, is a strong driver for demand and an ample source of
manpower.

2 | P a g e
ECONOMIC OVERVIEW
According to the Central Statistics Organisation, India (“CSO”) and the International Monetary Fund (“IMF”), India has
emerged as the fastest growing major economy in the world. As per the Second Advance Estimates of GDP by CSO, the
growth in GDP during 2018-19 is estimated at 6.8 percent as compared to the growth rate of 7.2 percent in 2017-18.
The improvement in the country’s economy accelerated in 2015 with the combined impact of strong government
reforms and the Reserve Bank of India’s (RBI) focus on inflation, supported by benign global commodity prices. As per
World Bank, India's GDP growth is expected to accelerate moderately to 7.5 per cent in Fiscal Year 2019-20, driven by
continued investment strengthening, particularly private-improved export performance and resilient consumption.
Services sector is the largest sector of India. Gross Value Added (GVA) at current prices for Services sector is estimated
at 92.26 lakh crore INR in 2018-19. Services sector accounts for 54.40% of total India's GVA of 169.61 lakh crore Indian
rupees. With GVA of Rs. 50.43 lakh crore, Industry sector contributes 29.73%. While, Agriculture and allied sector shares
15.87%.
The share of key sectors in total GVA is given in the chart below.
Overview of Key Sectors in Total GVA (%)
GDP trends The following charts show the GDP trends in India.
Overview of GDP Trends
17.7 17.9 17.2 16.1
30.0 29.4 29.3 29.6
52.3 52.7 53.5 54.3
2015-16(3rd RE)
2016-17(2nd RE)
2017-18(1st RE)
2018-19(PE)
Services
Industry
Agriculture

3 | P a g e
Comparison of Indian GDP with Other Countries Figure 3 – Overview of Indian GDP and other Countries
According to the 2016 estimates by the World Bank, India is currently ranks seventh in the world in terms of GDP. India
is likely to overtake Japan and Germany to become the third largest economy in the next ten years, but needs to be
consistent in reforms.
Recent reforms
Goods and Service Tax, India’s biggest Tax Reforms
From 1 July 2017, a comprehensive Goods and Services Tax (GST) has replaced the complex multiple indirect tax
structure, which included a multitude of taxes including Excise Duty, Additional Customs Duty, Value Added Tax
(VAT), Central Sales Tax (CST), Octroi, Entry Tax, Purchase Tax, etc.
Bankruptcy Law
The Government has in the recent past rolled out new Bankruptcy law, The Insolvency and Bankruptcy Code,
2016 (IBC) which seeks to consolidate the existing framework by creating a single law for insolvency and
bankruptcy.
Ease of doing business
Several reforms have been undertaken to improve the ease of doing business as a result of which, India has
recorded a jump of 23 positions against its rank of 100 in 2017 to be placed now at 77th rank among 190
countries assessed by the World Bank (Doing Business Report; DBR, 2019). India's leap of 23 ranks in the Ease of
Doing Business ranking is significant considering that last year India had improved its rank by 30 places, a rare
feat for any large and diverse country of the size of India. As a result of continued efforts by the Government,
India has improved its rank by 53 positions in last two years and 65 positions in last four years.
Inflation Inflation measurement in India: There are two main sets of inflation indices for measuring price level changes in India -
the Wholesale Price Index (WPI) and the Consumer Price Index (CPI). WPI, where prices are quoted from wholesalers, is
constructed by Office of Economic Affairs, Ministry of Commerce and Industries. In the case of CPI (prices quoted from
retailers), there are several indices to measure it like CPI for industrial labourers (CPI-IL), agricultural labourers (CPI-AL)
and rural labourers (CPI-RL) besides an all India CPI.

4 | P a g e
In addition, Gross Domestic Product (GDP) deflator and Private Final Consumption Expenditure (PFCE) deflator from the
National Accounts Statistics (NAS) provide an implicit economy-wide inflation estimate. The graph below captures the
inflation trend in India from 2013-14.
In India, the months of January through May are highly inflationary, June through September are moderately
inflationary and October through December produce the lowest increase in prices and are often even deflationary The
wholesale inflation in the economy has moved in the upward trajectory after seeing a sustained decline during
consecutive four months during Oct’18 to Jan’19.
Current Account Deficit (CAD) The CAD which had remained benign in the last four years is expected to increase to ~2.5% of the GDP for FY19 on the
back of a higher trade deficit. The CAD is expected to widen slightly on account of rising oil prices but will remain in a
comfortable zone. The same will not have much of an impact on the county’s external situation as forex reserves are still
high.
Fiscal Deficit India's April-March fiscal deficit touched Rs 6.45 trillion, or 101.7 per cent of the budgeted target for the current fiscal
year. The overall fiscal deficit for FY’20 is expected to be at 3.4% of the GDP.
5.24
1.24
-3.69
1.732.74
4.473.46
2.76 2.93 3.2 3.1
20
13
-14
20
14
-15
20
15
-16
20
16
-17
20
17
-18
No
v-18
De
c-18
Jan-1
9
Feb
-19
Mar-1
9
Ap
r-19
WPI
1.71.3
1.1
0.6
1.9
2.4
2.92.5
20
13
-14
20
14
-15
20
15
-16
20
16
-17
20
17
-18
Q1
FY19
Q2
FY19
Q3
FY19
CAD as a % of GDP

5 | P a g e
Foreign Exchange Reserve India’s forex reserves had touched a life-time high of USD 426.028 billion in the week to April 13, 2018. Since then, it has
been on a slide, though still being healthy. As of May 31, 2019, the reserves stood at USD 421.9 billion. The reserves
stood at USD 411.905 billion in the week to March 29, 2019.
Index of Industrial Production (IIP) During April-March 2018-19, industrial output grew at 3.6 per cent as against 4.4 per cent in the same period of the
previous fiscal. Growth in mar’19, was the lowest growth rate in 21 months and significantly lower than the 5.3%
growth witnessed in the comparable period a year ago.
Growth % (y-o-y)
Apr-18 May-18 Jun-18 Jul-18 Aug-18 Sep-18 Oct-18 Nov-18 Dec-18 Jan-19 Feb-19 Mar-19
General 4.5 3.8 7.0 6.5 4.8 4.6 8.4 0.3 2.6 1.7 0.1 0.1
Mining 3.8 5.8 6.5 3.4 -0.6 0.1 7.3 2.7 -1.0 3.9 2.0 0.8
Manufacturing 4.9 3.6 6.9 7.0 5.2 4.8 8.2 -0.6 3.0 1.4 -0.3 -0.4
Electricity 2.1 4.2 8.5 6.6 7.6 8.2 10.8 5.1 4.4 0.8 1.2 2.2
4.54.1 3.9
3.5 3.5 3.4 3.4
20
13
-14
20
14
-15
20
15
-16
20
16
-17
20
17
-18
20
18
-19
RE
20
19
-20
BE
Fiscal Deficit as a % of GDP

6 | P a g e
Financial System
Banking system – signs of improvement
The Indian Banking systems have been plagued with ballooning non-performing assets (NPAs) in the recent past.
However, after a prolonged period of stress, the banking sector appears to be on course to recovery. As per the recent
Financial Stability Report (December 2018) by Reserve Bank of India (RBI), India’s banking sector have shown signs of
improvement, even though the global economic environment and the emerging trends in financial sector pose
challenges.
Credit growth of scheduled commercial banks (SCBs) has improved between March 2018 and September 2018, driven
largely by private sector banks (PVBs). The asset quality of banks showed an improvement with the gross non-
performing assets (GNPA) ratio of SCBs declining from 11.5 per cent in March 2018 to 10.8 per cent in September 2018.
Under the baseline scenario, GNPA ratio may decline from 10.8 per cent in September 2018 to 10.3 per cent in March
2019.
Non-Banking Financial Companies (NBFCs) – minor hiccups; robust growth outlook
The Non-banking finance companies (NBFCs) are an integral part of Indian financial system. NBFCs in India are governed
by the Reserve Bank of India Act, 1934 (the “RBI Act”) which makes it mandatory for every NBFC to get itself registered
with the RBI in order to be able to commence any of its activities. An NBFC may be registered as a deposit-accepting
NBFC (“NBFC-D”) or as a non-deposit accepting NBFC (“NBFC-ND”). With their strategic presence in lending segments
and deeper reach, NBFCs have carved out a niche for themselves and complement the Banking system.
Some of the segments where NBFCs have a strong presence include Infrastructure Finance, Construction Equipment
Finance, Loan against Property, Low-cost housing finance, Auto finance, Microfinance, Gold finance, Consumer durable
finance.
In the second half of CY2018, defaults by a blue-chip infrastructure development and finance company resulted in a
contagion effect on lenders confidence on the sector, temporarily impacting the liquidity profiles of NBFCs.
Disbursement during Oct-Dec 2018 reduced by 20-40% in the non-retail segment as the players focused on conserving
liquidity. As a result, growth in Assets under Management (AUM) of NBFCs is expected to halve to 9-10% (annualized) in
H2 FY19 because of constraint in access to funding, after a strong 20% (annualized) increase in H1. The situation is still
evolving and the NBFCs are expected to grow by ~15% in the medium term.
Over the last decade, growth for NBFCs has significantly outpaced the aggregate credit growth (19% CAGR vs. overall
credit growth of 14%).
As per an industry report, NBFCs accounted for around 18 per cent of the overall systemic credit as of March 2018.
Economic Outlook for India in Fiscal 2020 The Monetary Policy Committee (MPC) in its review in April 2019, observed that the Central Statistics Office (CSO) has
pegged India’s real gross domestic product (GDP) growth at 6.8 per cent in 2018-19, revised down from 7.0 per cent in
its first advance estimates. More recent high frequency indicators point to manufacturing growth slowing down, while
investment demand is subdued. Credit flows to micro and small as well as medium industries remains muted, though
they somewhat improved somewhat for large industries. Capacity utilisation (CU) in the manufacturing sector is running
above its long-term average. There is also some improvement in business sentiment. High frequency indicators of the
services sector such as sales of commercial vehicles and freight traffic indicate moderation in activity.
As per RBI, GDP growth for 2019-20 is projected at 7.0 per cent – in the range of 6.4-6.7 per cent in first half of 2019-20
and 7.2-7.5 per cent in the second half – with risks evenly balanced.
7 | P a g e
NATIONAL BUDGET 2O19-20
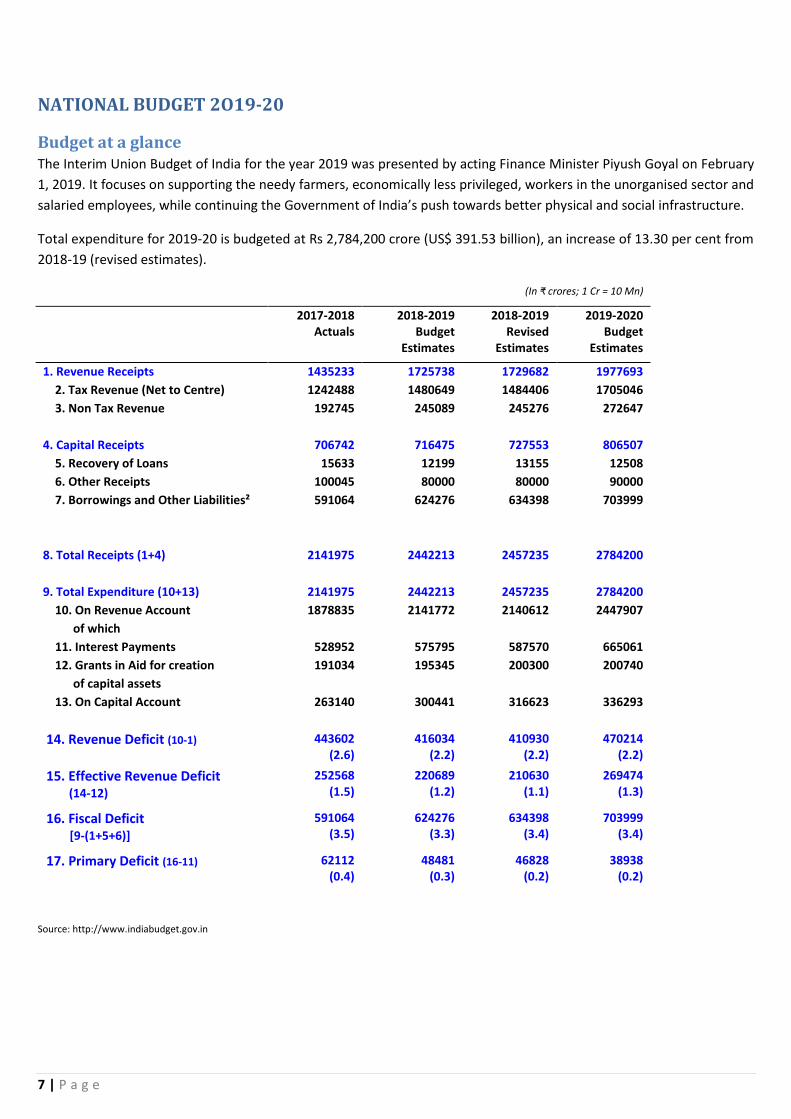
Budget at a glance The Interim Union Budget of India for the year 2019 was presented by acting Finance Minister Piyush Goyal on February
1, 2019. It focuses on supporting the needy farmers, economically less privileged, workers in the unorganised sector and
salaried employees, while continuing the Government of India’s push towards better physical and social infrastructure.
Total expenditure for 2019-20 is budgeted at Rs 2,784,200 crore (US$ 391.53 billion), an increase of 13.30 per cent from
2018-19 (revised estimates).
(In ₹ crores; 1 Cr = 10 Mn)
2017-2018 Actuals
2018-2019 Budget
Estimates
2018-2019 Revised
Estimates
2019-2020 Budget
Estimates
1. Revenue Receipts 1435233 1725738 1729682 1977693
2. Tax Revenue (Net to Centre) 1242488 1480649 1484406 1705046
3. Non Tax Revenue 192745 245089 245276 272647
4. Capital Receipts 706742 716475 727553 806507
5. Recovery of Loans 15633 12199 13155 12508
6. Other Receipts 100045 80000 80000 90000
7. Borrowings and Other Liabilities² 591064 624276 634398 703999
8. Total Receipts (1+4) 2141975 2442213 2457235 2784200
9. Total Expenditure (10+13) 2141975 2442213 2457235 2784200
10. On Revenue Account 1878835 2141772 2140612 2447907
of which
11. Interest Payments 528952 575795 587570 665061
12. Grants in Aid for creation 191034 195345 200300 200740
of capital assets
13. On Capital Account 263140 300441 316623 336293
14. Revenue Deficit (10-1) 443602 (2.6)
416034 (2.2)
410930 (2.2)
470214 (2.2)
15. Effective Revenue Deficit (14-12)
252568 (1.5)
220689 (1.2)
210630 (1.1)
269474 (1.3)
16. Fiscal Deficit [9-(1+5+6)]
591064 (3.5)
624276 (3.3)
634398 (3.4)
703999 (3.4)
17. Primary Deficit (16-11) 62112 (0.4)
48481 (0.3)
46828 (0.2)
38938 (0.2)
Source: http://www.indiabudget.gov.in
8 | P a g e
Infrastructure focus The Infrastructure sector remained to be a key focus area for Government in the Union Budget 2019-20. Some of the
key highlights relating to infrastructure are given below:
Roads and Highways
Budgetary support of Rs 83,016 crore to the highways sector under the interim budget for FY20 from Rs 78,626 crore (Revised Estimates; RE) in FY19.
Under the Pradhan Mantri Gram Sadak Yojana (PMGSY), construction of rural roads has been tripled. 15.80 lakh habitations out of a total of 17.84 lakh habitations have already been connected with pucca roads and work is going on to complete the rest very soon.
PMGSY is being allocated INR 19,000 crore in BE 2019-20 as against INR 15,500 crore in RE 2018-19. Railways
Budgetary support towards railways is increased to Rs 66,769 crore in FY20 from Rs 55,135 crore (RE) in FY19.
Capital support of Rs 645.9 bn has been provided to railways in FY20 (BE), up by 21.7% from FY19 (RE).
The Railways’ overall capital expenditure programme is of INR 1,58,658 crore. The Operating Ratio is expected to improve from 98.4% in 2017-18 to 96.2% in 2018-19 (RE) and further to 95% in 2019-20 (BE).
Launch of “Vande Bharat Express”, an indigenously developed semi high-speed train. Aviation
Allocation reduced to Rs 45 bn in FY20 from Rs 97 bn (RE) in FY19.
Of this, Rs 26 bn has been allocated for FY20 towards servicing Air India’s debt. This is to be done by way of transfers to Air India Asset Holding Ltd, an SPV set up as part of the financial restructuring plan.
Shipping, Ports and Waterways
Allocation towards shipping sector reduced marginally to Rs 19.03 bn in FY20 from Rs 19.39 bn (RE) in FY19.
However, allocation towards Sagarmala project enhanced to Rs 5.5 bn in FY20 from Rs 3.81 bn (RE) in FY19. Rural Infrastructure
Allocation towards Pradhan Mantri Gram Sadak Yojana (PMGSY) enhanced to Rs 190 bn in FY20 from Rs 155 bn (RE) in FY19.
However, allocation towards Pradhan Mantri Awas Yojana (PMAY) declined marginally to Rs 190 bn in FY20 from Rs 199 bn (RE) in FY19.
The Government has set a target of creating 100,000 Digital Villages over the next five years.
Allocation of Rs 8 bn towards Shyama Prasad Mukherjee Rurban Mission in FY20 from Rs 4.51 bn in FY19 (RE). Social Infrastructure
Under the National Rural Health Mission (NRHM), Rs 13.49 bn has been allocated for setting up Ayushman Bharat – Health and Wellness Centers, an increase of 35% over previous year.
Metro Projects
Allocation towards Mass Rapid Transportation Systems (MRTS) and Metro Projects enhanced to Rs 191.52 bn in FY20 from Rs 156 bn (RE) in FY19.
Smart Cities Mission
Allocation towards Smart Cities Mission enhanced by 7% to Rs 66 bn in FY20 from Rs 61.69 bn (RE) in FY19.

9 | P a g e
INFRASTRUCTURE OUTLOOK
Infrastructure sector is a key driver for the Indian economy. The sector is largely responsible for propelling India’s
overall development and enjoys intense focus from Government for initiating policies that would ensure time-bound
creation of world class infrastructure in the country. Infrastructure sector includes Power, Bridges, Roads, Railways,
Airports, Sea-ports, urban infrastructure development, Irrigation.
Foreign Direct Investment (FDI) in Infrastructure Development sector (townships, housing, built up infrastructure and
construction development projects) from April 2000 to December 2018 stood at Rs 2,095 billion according to the
Department of Industrial Policy and Promotion (DIPP).
Source: National Statistical Office
Growth Rate: GVA at constant prices
Construction contributions to GVA at current prices
RE: Revised Estimates
PE: Provisional Estimates
Sectoral Overview (Key)
Roads
Indian road network carries around 65% of the total freight traffic, 80% of the passenger traffic and plays a vital role in
the economic development. The country has one of the largest road networks comprising of expressways, national
highways (NHs), state highways (SHs), major district roads (MDRs) and rural roads (RRs). As per MORTH annual report
2017-18, the total road length is about 5.48 million kms. of which most account for rural roads (61%) followed by MDR
(20%), urban roads (9%), project roads (6%), SH (3%) and NH (2%).
9.2 8.9 8.57.9 7.8 7.8 8
0.3
2.7
4.33.6
6.15.6
8.7
2012-13 2013-14 2014-15 2015-16(3rd RE)
2016-17(2nd RE)
2017-18(1st RE
2018-19(PE)
Contribution of Construction sector to GVA
% Contribution % Growth

10 | P a g e
National Highways - The government has plans to invest over Rs 4,550 Billion in the construction of national highways
by 2020. To finance these projects, the strategy is to set up a road financing corporation in partnership with Japanese
investors.
State Highways and Rural Roads - Many states have formed “State Road Corporations” to accelerate the highway
construction within each state. Depending on the government and its focus, these states can be classified as progressive
and laggards. Most progressive states are Gujarat, Rajasthan, Maharashtra, Chhattisgarh, and Madhya Pradesh. Road
Construction in North East states have been taken up by the centre / NHAI under NHIDCL, a fully owned company of
Ministry of Road Transport & Highways, Government of India. There have been a lot of project announcement under
NHIDCL, but the progress has been slow considering the extreme conditions (Weather, Terrain, etc.)
Rural roads (rural development) are executed under the PMGSY (Pradhan Mantri Gram Sadak Yojana) scheme and has
been progressing well over the last few years.
The total expenditure of the Ministry of Road Transport and Highways for FY 2018-19 is estimated at INR 710 Billion
which is 16% higher than the revised estimates for FY 2017-18.
Figure: Future investment under Bharatmala project (2017-22)
Railways
Indian Railways is the third largest globally in terms of route length. The total track length is about 119,630 Kms while
the running track length is 92,081. Considering the requirements of the economy and size of the country, the expansion
of the railway network has been inadequate. There are many areas like North East and Himalayan regions where limited
connectivity is seen.
Oct 2017

11 | P a g e
Construction of railways is recording significant growth while creating opportunities for contractors. One of the key
enablers is 100% FDI for high speed rail, and railway lines from coal mines to ports, electrification and suburban
corridors.
With Indian Railways (IR) targeting Rs 8,560 Billion investments from 2015 to 2020, it is set for a structural change.
While high speed trains, metros and redevelopment of stations will change the travelling experience in coming days,
Dedicated Freight Corridors (DFC) will revitalize the transportation system in the country. DFC has the potential to
reduce ~10% of India’s logistics cost. A large part of investment by Railways is also happening for metro projects.
Strengthening the railway network and enhancing Railways carrying capacity has been a major focus of the
Government. Railways Capex for the year FY 2018-19 has been pegged at INR 1,485 Billion. A large part of the Capex is
devoted to capacity creation. 18,000 kilometres of doubling, third and fourth line works and 5,000 kilometres of gauge
conversion would eliminate capacity constraints and transform almost entire network into Broad Gauge.
Power
Power sector constitutes of 3 main areas i.e., Generation, Transmission and Distribution. India is the third largest
producer and the fourth largest consumer of power in the world with an installed capacity of 344 GW, as of April 2018.
The breakup of the mentioned capacity by type of fuel and ownership is given in the chart below.
Within thermal (223 GW), power generation by coal based plants account for 88% (~59% in the all India capacity)
followed by gas based which accounts to 11.5% (~7.5% in the all India capacity) and oil-fired plants account to 0.4%.
India’s total power generation capacity has increased at a CAGR of 9.16% in the last 10 years (FY 2007-08 to FY 2017-18).
The current government is working towards major goals which are directed at transforming the industry:
Target to increase the installed capacity of renewable energy based power generation to 175 GW by the year
2022. This installed capacity is expected to constitute 100 GW of solar energy, 60 GW of wind power and the
rest coming from biomass and small-scale hydro power projects.
The Ministry of Coal has been gradually ramping up its production targets, however with an assessment
suggesting the current trend may not warrant pursuing the projected coal output target of 1 billion tonnes by
2020, during April 2018, the government gave an indication of revising the production target, though the
revised targets have not been yet announced.
The country currently has about 78 GW of power generation capacity under various stages of construction.
Urban Development
The urban development sector has reported high growth, especially during the 11th five-year plan (2007-2012), where
achievement was more than 160% of the target. The target for the 12th five-year plan (2012-2017) has, as a result, been
increased by 567% over the previous plan.
12 | P a g e
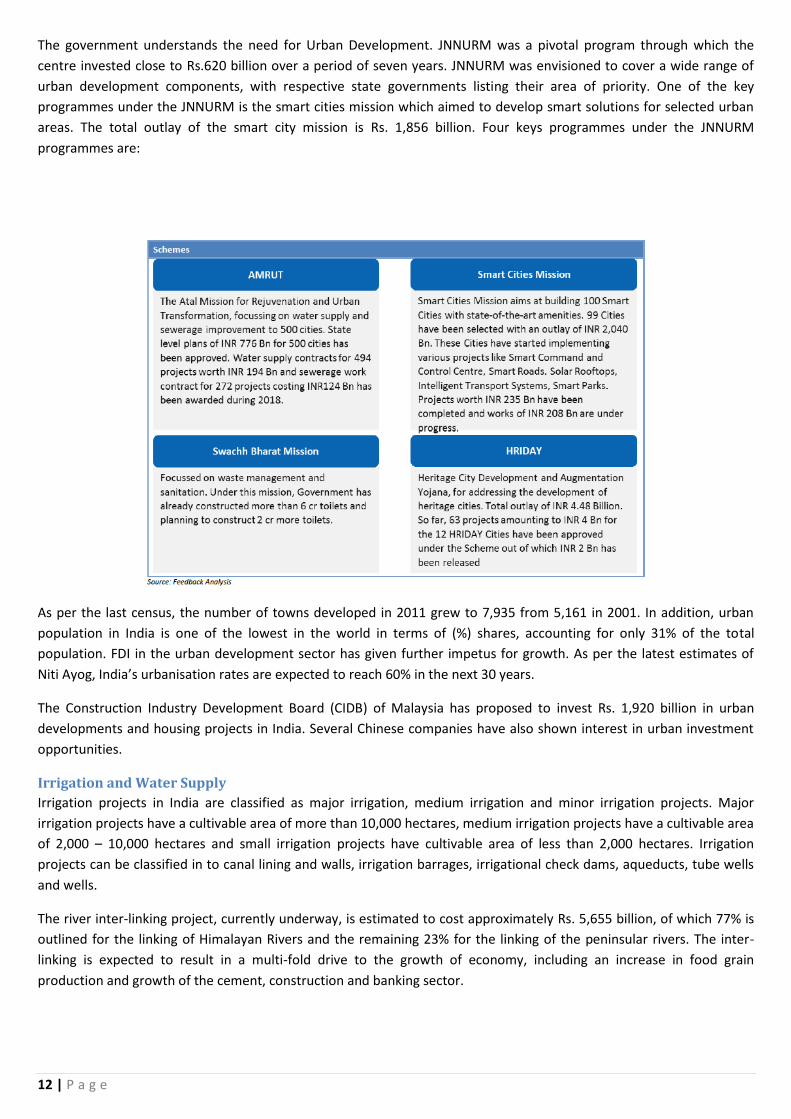
The government understands the need for Urban Development. JNNURM was a pivotal program through which the
centre invested close to Rs.620 billion over a period of seven years. JNNURM was envisioned to cover a wide range of
urban development components, with respective state governments listing their area of priority. One of the key
programmes under the JNNURM is the smart cities mission which aimed to develop smart solutions for selected urban
areas. The total outlay of the smart city mission is Rs. 1,856 billion. Four keys programmes under the JNNURM
programmes are:
As per the last census, the number of towns developed in 2011 grew to 7,935 from 5,161 in 2001. In addition, urban
population in India is one of the lowest in the world in terms of (%) shares, accounting for only 31% of the total
population. FDI in the urban development sector has given further impetus for growth. As per the latest estimates of
Niti Ayog, India’s urbanisation rates are expected to reach 60% in the next 30 years.
The Construction Industry Development Board (CIDB) of Malaysia has proposed to invest Rs. 1,920 billion in urban
developments and housing projects in India. Several Chinese companies have also shown interest in urban investment
opportunities.
Irrigation and Water Supply
Irrigation projects in India are classified as major irrigation, medium irrigation and minor irrigation projects. Major
irrigation projects have a cultivable area of more than 10,000 hectares, medium irrigation projects have a cultivable area
of 2,000 – 10,000 hectares and small irrigation projects have cultivable area of less than 2,000 hectares. Irrigation
projects can be classified in to canal lining and walls, irrigation barrages, irrigational check dams, aqueducts, tube wells
and wells.
The river inter-linking project, currently underway, is estimated to cost approximately Rs. 5,655 billion, of which 77% is
outlined for the linking of Himalayan Rivers and the remaining 23% for the linking of the peninsular rivers. The inter-
linking is expected to result in a multi-fold drive to the growth of economy, including an increase in food grain
production and growth of the cement, construction and banking sector.

13 | P a g e
Mining
Coal Mining
India has coal reserves of approximately 315.15 billion tonnes. More than 90% of the coal produced in India is by
government owned companies. Coal India Ltd is the largest firm in India, producing coal accounting for 84% of the total
coal produced. The role played by private companies is limited, mines are owned for captive use. Companies involved in
the manufacture of steel, cement, fertiliser and power generation mostly have captive mines, with power being one of
the sectors that is heavily dependent on coal. Mining equipment is extensively used by all companies across regions.
Despite India’s large coal reserve, some companies in India are importing coal. Approximately 20-25% of the coal
demand is met through imports. The government has set a target of 1.6 billion tonnes of coal production by Fiscal 2020,
which will be met through increase in the number of mines set up and reallocation of existing mines.

14 | P a g e
Iron Ore Mining
The Indian iron ore industry was once the third largest exporter globally, but is currently under pressure to fulfil
domestic demand. Illegal mining and environmental degradation has led to a blanket ban of iron ore mining and
exportation in several states such as Karnataka and Goa. Imports were small until last year, but increased to 15 million
tonnes in Fiscal 2015 to bridge the supply-demand gap as there were no signs of the recovery of the domestic iron ore
production. The following years saw an increase in production post the lifting of ban against iron ore mining. Imports
also reduced gradually as a result of higher production and the commissioning of new mines.
From Fiscal 2017 onwards, several state governments planned and increased their focus on iron ore production. Odisha
contributed nearly 143 million tonnes during Fiscal 2018. The government of Odisha has planned to auction around 10-
12 large mines to boost supply. Demand from real estate and automotive sectors, along with an increase in
infrastructure projects is expected to aid growth of steel production. The steel industry is likely to have a total installed
capacity of 300 million tonnes by 2025.
Government investment in the mining sector was increased by 79% in the 12th five-year plan (2012-2017) as compared
to the previous plan, amounting to Rs. 1,631.5 Billion. It provided fresh impetus to the domestic mining sector.
Ports
India has a coastline of 7,517 kms which is shared amongst nine states. Approximately 95% of India’s trade by volume,
and 68% by value, is moved through maritime transport.
Ports in India can be divided into two types; major ports and minor ports. At present, there are 13 major ports in India
which are under the scope of central government through the Ministry of Shipping. There are approximately 200 minor
ports, however only 70 of these are in operation. All of the minor ports are administered by their respective state
governments.
Currently the handling capacity at major ports is 1,451 million tonnes (as of Fiscal 2018). The capacity addition at the
major ports in Fiscal 2018 over previous year was approximately 44%.
The government has initiated the ‘Sagarmala Programme’ to promote port-led development in the country. There are
577 projects worth INR 8,762 Billion in the Sagarmala Programme. The projects identified under Sagarmala Programme
are expected to mobilize more than INR 12,000 Billion of infrastructure investment, generate logistic cost savings of INR
350-400 Billion per annum, boost merchandize exports by INR 7,392 Billion and enable creation of 10 million new jobs,
including 4 million direct jobs in the next 10 years.
Housing
As per 2011 Census, the total population of India was about 1.2 billion comprising of nearly 246 households. As per The
World Population Prospects: The 2017 Revision, published by the UN Department of Economic and Social Affairs, the
population of the country is expected to reach around 1.44 billion by 2024, matching China’s population, and further
increase to 1.5 billion by 2030. With increase in number of households, the housing demand is expected to grow in
line. Some of the other factors which will support a rising housing demand include:
Growing nuclearisation of families
Growing urbanisation
Increasing disposable income
Tax incentives by Government
Increase in ease of availing finance

15 | P a g e
Government Initiatives in the segment
The Real Estate (Regulation and Development) Act, 2016, which seeks to protect home-buyers as well as help boost investments in the real estate industry
Pradhan Mantri Awas Yojana (PMAY), with two components Pradhan Mantri Awas Yojana (Urban) (PMAY-U) for the urban poor and Pradhan Mantri Awaas Yojana (Gramin) for the rural poor, is an initiative in which affordable housing will be provided to the urban poor with a target of building 20 million affordable houses by 31 March 2022
In order to promote affordable housing, the government has granted infrastructure status to affordable housing

16 | P a g e
FMCG OUTLOOK
The FMCG sector has grown from US$ 31.6 billion in 2011 to US$ 52.75 billion in 2017-18. The sector is further expected to grow at a Compound Annual Growth Rate (CAGR) of 27.86 per cent to reach US$ 103.7 billion by 2020 (as per IBEF). The industry can broadly be categorised into Food Products, Healthcare, and Household & Personal care. As per an industry report, Household & Personal care is the most dominant sector accounting for almost 50 per cent of the total FMCG sales, followed by Healthcare which accounts for around 31 per cent.
Under Household & Personal Care, Hair care accounts for about 23 per cent followed by Oral care at 15 per cent, Home care at 6 per cent and Skin care at 5 per cent.
Demand Drivers Demographic dividend: India has more than 50% of its population below the age of 25 and more than 65%
below the age of 35. Huge population, mostly comprising of ‘earning population’, is a strong driver for demand.
The industry benefits from increasing urbanisation (the urbanisation rate in India is highest among the major economies) which leads to increase in income and consequent increase in demand. It also benefits from the growing demand in the semi-urban and rural households. Rural India accounts for around 60 per cent of the FMCG demand, up from around one-third in 2008.
Rising income levels aided by a strong GDP growth has led to increased disposable income, ultimately driving consumption of FMCG products. India’s GDP per capita at current prices is expected to increase from US$ 1,481.56 in 2012 to US$ 3,273.85 in 2023.
Government initiatives Government spending and policies are increasingly focused to benefit the rural sector which accounts for
around 69 per cent of the national population (2011 census). In 2016, the government had announced its ambitious target of doubling farmer incomes by 2022.
The Government has slowly been opening up the sector to foreign players. Recently it allowed 100 per cent Foreign Direct Investment (FDI) in single-brand retail trading through the automatic route. The sector witnessed healthy FDI inflows of US$ 14.42 billion, during April 2000 to December 2018.
Steps taken to revamp the Consumer Protection laws with special emphasis on ensuring simple, speedy, accessible, affordable and timely delivery of justice to consumers.
The recently introduced Goods and Services Tax (GST) is also proving to be beneficial for the FMCG industry as
the companies saving a considerable amount of expenses on logistics. Also many of the FMCG products (soaps, toothpaste, hair oil etc.) have now come under a lower tax rate, benefitting the demand.
Dairy product, Tea/coffee,
Sugar, Vegetable oils, Bakery
products, Confectionery,
Processed foods, Branded flour,
etc.
Over the counter (OTC)
products & ethicals
Oral care, skin care, Soaps & Detergents, Tooth powder, Hair Shampoo, Toothpaste, Hair oil, Creams & lotions, Agarbattis, Fragrances & essential oils, etc.
17 | P a g e
LEASING OUTLOOK
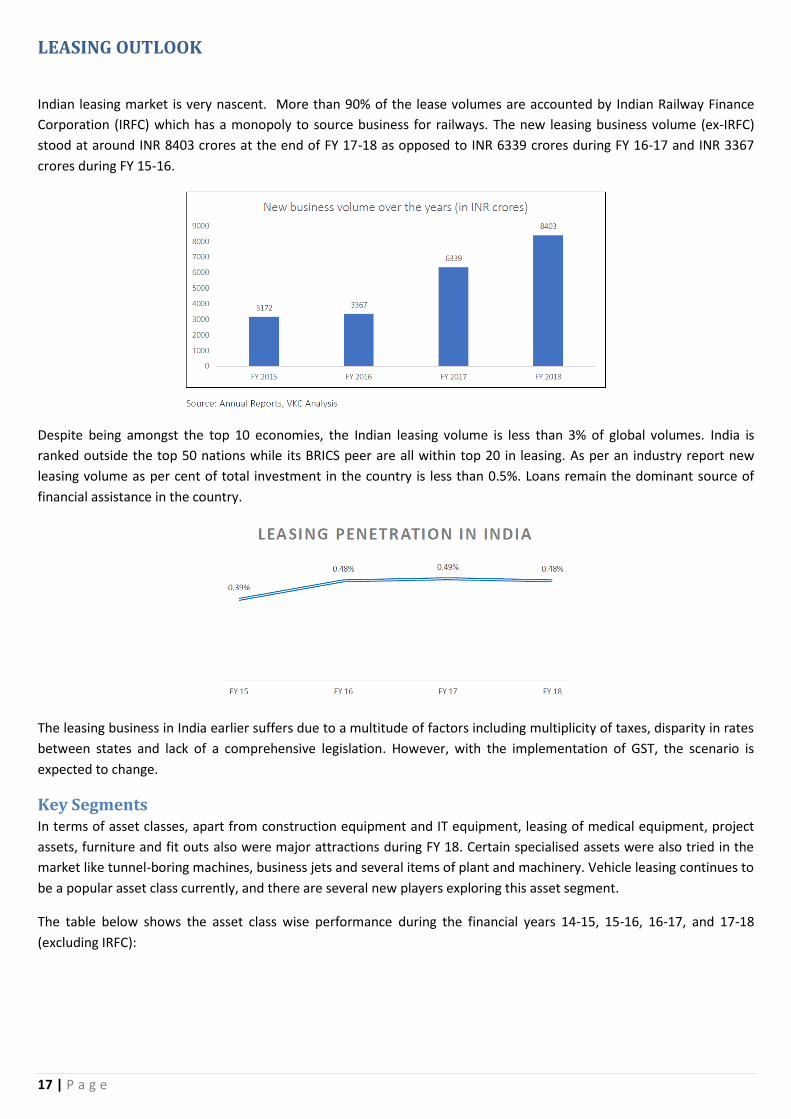
Indian leasing market is very nascent. More than 90% of the lease volumes are accounted by Indian Railway Finance
Corporation (IRFC) which has a monopoly to source business for railways. The new leasing business volume (ex-IRFC)
stood at around INR 8403 crores at the end of FY 17-18 as opposed to INR 6339 crores during FY 16-17 and INR 3367
crores during FY 15-16.
Despite being amongst the top 10 economies, the Indian leasing volume is less than 3% of global volumes. India is
ranked outside the top 50 nations while its BRICS peer are all within top 20 in leasing. As per an industry report new
leasing volume as per cent of total investment in the country is less than 0.5%. Loans remain the dominant source of
financial assistance in the country.
The leasing business in India earlier suffers due to a multitude of factors including multiplicity of taxes, disparity in rates
between states and lack of a comprehensive legislation. However, with the implementation of GST, the scenario is
expected to change.
Key Segments In terms of asset classes, apart from construction equipment and IT equipment, leasing of medical equipment, project
assets, furniture and fit outs also were major attractions during FY 18. Certain specialised assets were also tried in the
market like tunnel-boring machines, business jets and several items of plant and machinery. Vehicle leasing continues to
be a popular asset class currently, and there are several new players exploring this asset segment.
The table below shows the asset class wise performance during the financial years 14-15, 15-16, 16-17, and 17-18
(excluding IRFC):

18 | P a g e
Scenario post GST implementation The introduction of GST has eliminated the tax differentials which demotivated lease transactions in the past. The VAT
regime had incremental and non-VATable tax burden in form of CST, and several states denying the benefit of set off to
lease transactions. Under the GST law, the input taxes paid on lease transactions are full off-settable, irrespective of
whether the lease is inter-state or intra-state.
Additionally, the myth about tax shelters existing in case of lease transactions has gradually vanished, with the
continued reforms of depreciation rates.
Overview of leasing in CME financing In India, construction equipment leasing is still at a nascent stage accounting for 8-10% of the overall construction
equipment market as of Fiscal 2018, whereas the global average for leasing is 50-60% of the overall construction
equipment business.
Leases are gaining popularity because of tax benefits. The bulk of MSMEs are opting to finance their equipment.
Market Size The market for organised used equipment leasing is estimated at approximately 8%-10% of the overall disbursements of
finance companies in0 the CME segment. The current value of the organised leasing construction equipment market
accounts for roughly Rs.22-37.5 billion in Fiscal 2018. The market is largely dominated by heavy equipment such as
excavators, motor graders, wheel loaders, dozers, self-loading concrete mixers, concrete pumps, tower cranes, all-
terrain cranes, rough terrain cranes, truck cranes and pavers.
With the implementation of GST during 2017, it is expected to benefit the finance institutions in the equipment leasing
space and the market is expected to reach INR 40,000 - 50,000 million by FY 2019-20, a CAGR of 15%-16%. Before GST
implementation, there was lack of clarity on leasing business and the tax structure was not clearly defined which was

19 | P a g e
curbing the efficiency of the equipment leasing industry. Further the GST rate was reduced from initial 28% to 18% and
the rate is now reasonable as many taxes like VAT, Excise duty and entry tax has been subsumed and credit of entire
GST is available which is expected to drive the leasing industry going forward.
Key Benefits of Leasing in CME Financing With the current government’s focus on infrastructure of the country, there was a fresh infusion of funds towards the
road sector. The Indian government approved a total of 83,677 kms of roads to be constructed in the next five years.
This creates requirement of capital goods on a large scale and increase in the number of contractors executing these
projects.
Most of the actual implementation of project work is carried by SMEs to whom the work gets sub-contracted. They
require high-value assets (such as earth-moving, road, concrete and material handling equipment) and purchasing these
assets would impact cash flows of SME’s. Leasing options help the SMEs to access these assets as it provides more cost
effective solution vis-à-vis owning.
The penetration of leasing and equipment rental is fairly high globally. Compared to countries like the U.S., China and
Japan, India’s leasing and rental business is still at a nascent stage. Unfavourable tax treatment of leasing in India has
been a key reason for such condition. The introduction of GST is expected to clarify the ambiguity on the tax front. The
market sets to become more organised. Another major advantage of GST will be the enhanced mobility of the asset.
Interstate movement of such assets and re-deployment at multiple locations on multiple projects will be easier and
thereby ensuring optimal utilisation of the asset over its economic life. Leasing, as a financial tool will be key for the
infrastructure growth of the country
Traditionally, India has been an outright equipment purchase market for project requirements. However, this could
change. Large contractors who previously outsourced only earthwork and other non-essential activity have begun
subcontracting more activities and modules. Consequently, leasing options with their associated tax benefit
opportunities are becoming more attractive. There are signs among finance companies that the market is becoming
more receptive to alternate financing options.
20 | P a g e
Opportunity sizing: Key segments
Construction, Mining and Allied Equipment (CME)
The CME industry in India can be classified into different categories based on the type of projects for which it is used.
These categories are:
Earthmoving equipment;
Concrete equipment;
Road equipment;
Material handling equipment;
Material processing equipment; and
Warehouse equipment
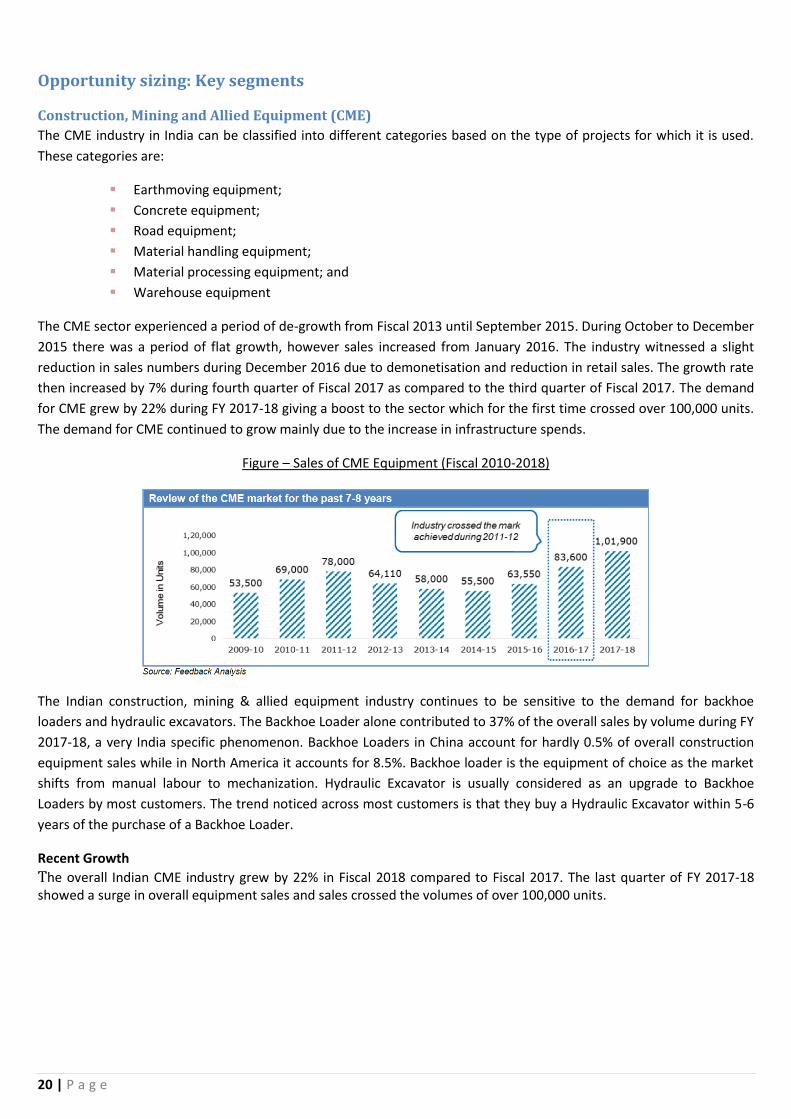
The CME sector experienced a period of de-growth from Fiscal 2013 until September 2015. During October to December
2015 there was a period of flat growth, however sales increased from January 2016. The industry witnessed a slight
reduction in sales numbers during December 2016 due to demonetisation and reduction in retail sales. The growth rate
then increased by 7% during fourth quarter of Fiscal 2017 as compared to the third quarter of Fiscal 2017. The demand
for CME grew by 22% during FY 2017-18 giving a boost to the sector which for the first time crossed over 100,000 units.
The demand for CME continued to grow mainly due to the increase in infrastructure spends.
Figure – Sales of CME Equipment (Fiscal 2010-2018)
The Indian construction, mining & allied equipment industry continues to be sensitive to the demand for backhoe
loaders and hydraulic excavators. The Backhoe Loader alone contributed to 37% of the overall sales by volume during FY
2017-18, a very India specific phenomenon. Backhoe Loaders in China account for hardly 0.5% of overall construction
equipment sales while in North America it accounts for 8.5%. Backhoe loader is the equipment of choice as the market
shifts from manual labour to mechanization. Hydraulic Excavator is usually considered as an upgrade to Backhoe
Loaders by most customers. The trend noticed across most customers is that they buy a Hydraulic Excavator within 5-6
years of the purchase of a Backhoe Loader.
Recent Growth
The overall Indian CME industry grew by 22% in Fiscal 2018 compared to Fiscal 2017. The last quarter of FY 2017-18 showed a surge in overall equipment sales and sales crossed the volumes of over 100,000 units.

21 | P a g e
Figure – Sale Volumes in Fiscal 2017 and Fiscal 2018
Growth in 2017-18 was primarily in Concrete, MHE, MP & Earthmoving and Mining equipment.
Figure 21 –Equipment Growth across Categories
Outlook on the CME Market for the next three years
Figure – Growth in the CME market for Fiscal 2018 to Fiscal 2021
The Construction, Mining and Allied equipment industry is expected to grow at a CAGR of 14-15% till FY 2020-21 to
reach 153,000 units and at a CAGR of 19-20% by value to reach INR 670 billion. In the past, industry growth has slowed
during central elections where spending could be more towards populist measures than on infrastructure development.
But considering that most of the awarded projects, since 2017, have not yet started, the spending on these projects
(from execution perspective) will continue and these projects will drive the industry during next 2-3 years.

22 | P a g e
CME Financing
Overview of the CME Financing Segment in India
Construction equipment finance caters to all types of earthmoving, concrete, material handling, road construction, material preparation, tunnelling and drilling, and warehousing equipment. CME finance in India is offered mainly by NBFCs, banks and captive or private financiers. As the capital outlay is high, close to 80-85% of the total equipment sold in the country, are financed. Most financing is through loans and leasing is still a distant second option. Within equipment categories, close to 80-85% of earthmoving construction equipment users who opt for finance are Micro, Small & Medium Enterprises (MSMEs) with transaction sizes varying between INR 2 million for a Backhoe Loader to INR 4.2 million for a Hydraulic Excavator. Typically, cost of Construction equipment is ~10-30% of the cost of the project, hence the role of CME financiers is critical, in helping to execute the project with the right and productive equipment.
Review of Trends in Disbursements in CME Financing in Last Six Years
The total disbursement for Construction, Mining & Allied equipment finance for FY 2017-18 was estimated at INR ~374,000 million. The disbursements to the sector have grown at a CAGR of 10.9% over the last 6 years, but from the recovery observed in FY 2014-15 onwards, the industry has clocked a growth rate of 24.4%
Figure – Disbursement Trend in CME Financing
Earthmoving and mining equipment contributed 68% of the overall amount disbursed to the CME segment, Concrete equipment 10%, Road construction equipment accounted for 7%, Material Processing /preparation equipment 6%, Material Handling equipment 6% and warehousing equipment 3% in FY 2017-18. During FY 2017-18, disbursements to the Earthmoving & Mining equipment sector increased by 34% and concrete equipment by 144% compared to the previous year (FY 2016-17). Over the last 5 years, disbursements to the Earthmoving and Mining equipment industry have grown by 14.8%, Concrete equipment by 32%, Road Construction equipment by 22%. The government’s initiative to improve infrastructure in India has caused a surge in demand for road construction equipment, thereby increasing the disbursement to the segment. Government focus on building concrete roads (on national and state highways) has boosted the demand for concrete and material processing equipment, though the slowdown in the real estate sector continues.
Market Breakdown by Lender Category
The lender category consists of Banks, NBFCs and private financiers. Data for private financiers is not recorded and
therefore is not publicly available. Analysis is limited to Banks and NBFCs participating in the industry. Private financiers
are estimated to account for approximately Rs.15-20 billion.
Among the NBFCs and Banks, NBFCs account for 59.5% of the overall CME finance market. Though the share of NBFCs
have declined over the last few years, market leaders like SEFL benefitted by increasing their presence in the industry.

23 | P a g e
NBFCs who had exited during the market downturn are now re-entering the segment due to the revival of the
construction equipment segment.
Figure – Market Breakdown by Lender (Banks and NBFCs)
NBFCs currently have the majority of the market share. Historically banks have tended to cater for the needs of large
companies and have started to focus on the retail segment, whereas NBFCs fulfil the fund requirements across the
market.
Overview of Competition in the Industry
Currently the equipment finance industry has approximately 20-25 organised companies (NBFCs and banks) offering
various products and services for the infrastructure equipment segment.
Top 5 companies account for ~ 73.1% of the overall CME finance market. Among the top 5 companies, 3 are private
banks and 2 are NBFCs.
Figure – Market Share in CME Equipment Finance Market
SEFL leads the construction equipment finance market with a market share of approximately 33% in Fiscal 2018
followed by HDFC. Over the years, the market share of banks such as HDFC and Indus Ind in the retail finance segment
has increased. The market share of HDFC bank has increased from 10% in Fiscal 2014 to 14.1% in Fiscal 2018.
IndusInd focuses largely on retail customers for backhoe loaders, excavators and pick and carry cranes, offering better
interest rates than NBFC and are core competitors in the retail segment. After SEFL, HDFC is the second largest finance
institute in the retail industry.
Currently, SEFL is the only end to end solution provider across the entire CME value chain, from asset acquisition
through to deployment, management and resale of the asset, and managing the customer relations across the entire
asset life cycle. SEFL offers customised financial solutions to their customers and has partnerships with OEMs and

24 | P a g e
dealers. SEFL has demonstrated clear market differentiation through its holistic approach to providing equipment
financing solutions.
A study conducted among various customers across key states of India revealed that faster turnaround time, less paper
work and one point stop for all equipment financing needs, attractive schemes offered and innovative solutions to
customers to clear bad debts are the key positives of SEFL. SEFL offers innovative financing solutions to equipment
purchasers under these arrangements, which are relatively new to the Indian equipment financing market.
Information Technology (IT) equipment
In the last decade, India has witnessed a significant rise in the use of IT equipment, due to rising disposable incomes and
reduced prices due to rapid innovation in technology. Growth is expected to continue due to economic development
and household income growth, which will result in a large expansion of the retail hardware market.
Indian IT Equipment is categorised into these major segments:
Figure – Categories of IT Equipment by Segment
The total market size by revenue for Fiscal 2018 was estimated at Rs.726.8 billion. The market has grown at a CAGR of
approximately 3.8% over the last five years.
The chart below shows the growth of the IT equipment market from Fiscal 2014 to Fiscal 2018.
Figure – Growth of IT Equipment Market (Fiscal 2013-2017)
(in Rs billion)
In Fiscal 2016, slowdown in GDP growth was a reflection of the negative investment growth and slowing private
consumption. The demonetisation drive announced on 8 November 2016 resulted in weak consumption and low
expenditure growth. As a result, the overall IT equipment industry in the retail segment was adversely impacted.
Outlook for Growth of IT Equipment Industry over the Next Three Years (Fiscal 2018 to Fiscal 2021)
The IT equipment market is expected to grow at a CAGR of approximately 5.6% over the forecast period from Fiscal
2018 to Fiscal 2021 and valued at Rs.855.9 billion in terms of revenue in Fiscal 2021.

25 | P a g e
Farm Equipment
India’s farm equipment industry has a diverse product portfolio which can be segmented as:
Figure – Product Portfolio in Indian Farm equipment
Tractors have the major share of the farm mechanisation market in India. However, the density of tractors in India is
lesser than the world average (specifically with respect to developed countries). Hence, there is room for sufficient
growth with India being an agriculture-based economy. Power tillers are in demand for paddy cultivation of small land
holdings.
Overview of the Farm Equipment Industry for the Past Five Years
The total market size by volume of farm equipment for the year FY 2017-18 is estimated at 772,570 units. The sales of
Tractor were 711,000 units, Power Tillers were 55,000 units and Combine Harvesters were 6,570 units. The Power Tillers
market has seen a decline about 1.3%, while Tractor and Combine Harvester market has grown about 2.9% and 9.9%
respectively in the last 5 years.
Market Size of Farm Equipment by Volume
In the past two Fiscal 2015 and Fiscal 2016, there have been reported double-digit de-growth due to failed monsoons
and wilted farm sentiment. The Tractor industry witnessed positive growth during FY 2016-17 and FY 2017-18. The
healthy south west monsoon not only augured well for Kharif production but also restored the reservoir levels that
supported Rabi sowing in spite of weak winter monsoon.

26 | P a g e
Outlook for Growth in Farm Equipment Industry for the Next Three Years (Fiscal 2018 to Fiscal 2021)
Figure – Outlook for Growth of Farm Equipment Industry (Fiscal 2018-2021)
Increasing tractor penetration in small and marginal farmers and decreasing ownership cost of less than 20 HP tractors
is likely to drive the demand. Sales of small HP tractors (less than 30 HP and 31 to 40 HP), which are primarily meant for
agricultural activities, will grow at 13% during the forecast period. The 41 to 50 HP tractors segment is likely to grow by
10%. While the government is providing an impetus for increased farm mechanisation by subsidising tractor prices
which is expected to enhance sales in the less than 30 HP segment, the shift in increased usage of several agricultural
implements will probably lead to further increase in market size for high HP tractors in the long term.
Further, government initiatives such as National Rural Employment Guarantee Act (NREGA) and increased usage of
tractor in industrial activities such as haulage in construction and infrastructure projects will further increase demand of
tractors. Long-term drivers of the tractor industry look positive and the industry is expected to grow at a volume CAGR
of 9-10% in the medium term.
Following the increasing support for farm mechanisation and subsidies by the government and reduction in the
conventional practices for crop sowing and reaping, the combine harvester is projected to grow at a CAGR of 6-7% in
Fiscal 2018 – Fiscal 2021 period and expected to reach an annual sales volume of 7,900 units. The power tillage is
expected to grow at CAGR of 7% reaching the sales volume of 68,000 units.
Automobiles
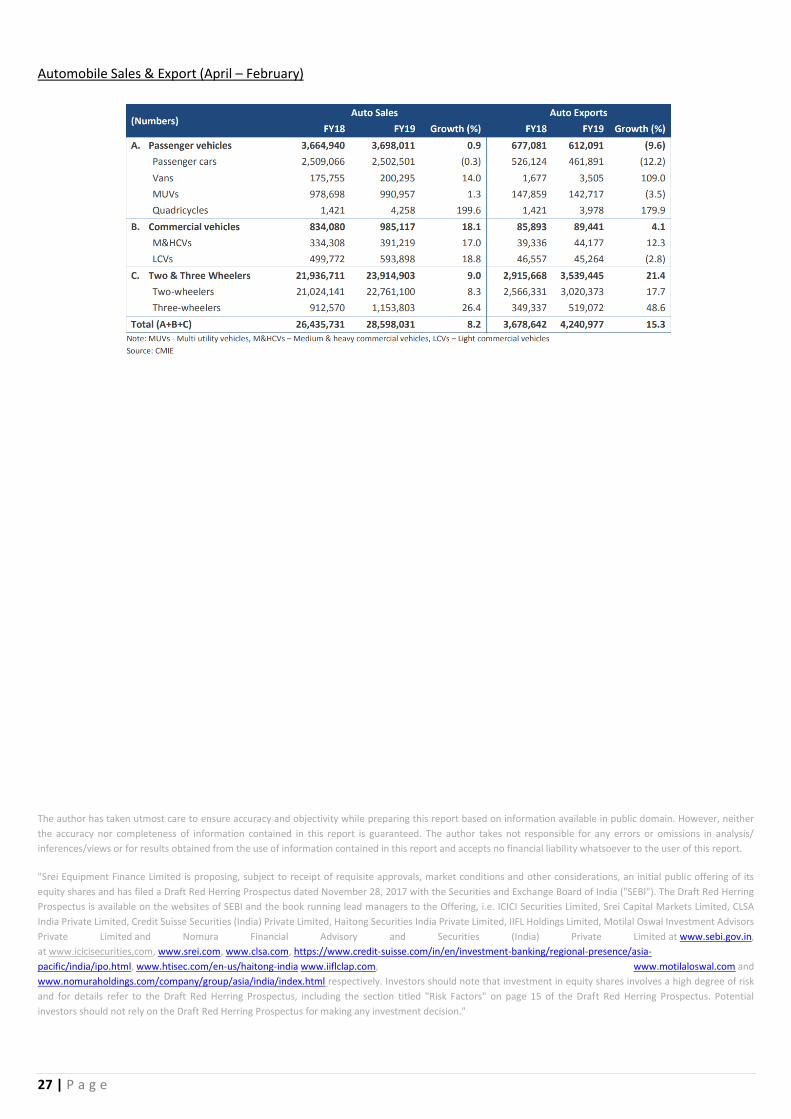
As per CARE Ratings, Automobile industry witnessed a y-o-y sales growth of about 8.2% and exports grew by over 15%
during FY19 (Apr - Feb). In terms of sales, the sharpest growth of over 18% was witnessed in commercial vehicle sales
followed by a 9% growth in two & three wheelers. Passenger vehicles registered a meagre growth of about 0.9% y-o-y in
sales during the period.
Key Drivers – Passenger Vehicles
Rural sales to enhance share of small cars. With cost of ownership likely to decline, first time
buyers and increasing Proportion of rural sales shall drive demand for small cars.
Shift in consumer preference resulting in sedans losing market share to compact UV/ premium hatchback
Key Drivers – Commercial Vehicles
Hub-spoke model, improved infra to drive sale of higher tonnage vehicle
ICV expected to grow at faster pace aided by e-commerce demand.
Tipper sales to prop up with improvement in mining/ construction in longer term
Growth in Pick-ups to outpace sub-one tonne vehicles with higher flexibility in usage and transporter needs
Tourism followed by schools to drive demand of Buses. Shift seen from ICV buses to LCV
27 | P a g e
Automobile Sales & Export (April – February)
The author has taken utmost care to ensure accuracy and objectivity while preparing this report based on information available in public domain. However, neither
the accuracy nor completeness of information contained in this report is guaranteed. The author takes not responsible for any errors or omissions in analysis/
inferences/views or for results obtained from the use of information contained in this report and accepts no financial liability whatsoever to the user of this report.
"Srei Equipment Finance Limited is proposing, subject to receipt of requisite approvals, market conditions and other considerations, an initial public offering of its
equity shares and has filed a Draft Red Herring Prospectus dated November 28, 2017 with the Securities and Exchange Board of India ("SEBI"). The Draft Red Herring
Prospectus is available on the websites of SEBI and the book running lead managers to the Offering, i.e. ICICI Securities Limited, Srei Capital Markets Limited, CLSA
India Private Limited, Credit Suisse Securities (India) Private Limited, Haitong Securities India Private Limited, IIFL Holdings Limited, Motilal Oswal Investment Advisors
Private Limited and Nomura Financial Advisory and Securities (India) Private Limited at www.sebi.gov.in,
at www.icicisecurities,com, www.srei.com, www.clsa.com, https://www.credit-suisse.com/in/en/investment-banking/regional-presence/asia-
pacific/india/ipo.html, www.htisec.com/en-us/haitong-india www.iiflclap.com, www.motilaloswal.com and
www.nomuraholdings.com/company/group/asia/india/index.html respectively. Investors should note that investment in equity shares involves a high degree of risk
and for details refer to the Draft Red Herring Prospectus, including the section titled "Risk Factors" on page 15 of the Draft Red Herring Prospectus. Potential
investors should not rely on the Draft Red Herring Prospectus for making any investment decision."