Country readiness to monitor SDG 4 education targets...
32
Information Paper No. 40 May 2017 Country readiness to monitor SDG 4 education targets: Regional survey for sub-Saharan Africa
Transcript of Country readiness to monitor SDG 4 education targets...

Information Paper No. 40May 2017
Country readiness to monitor SDG 4 education targets: Regional survey for sub-Saharan Africa

UNESCO
The constitution of the United Nations Educational, Scientific and Cultural Organization (UNESCO) was adopted by 20 countries at the London Conference in November 1945 and entered into effect on 4 November 1946. The Organization currently has 195 Member States and 10 Associate Members.
The main objective of UNESCO is to contribute to peace and security in the world by promoting collaboration among nations through education, science, culture and communication in order to foster universal respect for justice, the rule of law, and the human rights and fundamental freedoms that are affirmed for the peoples of the world, without distinction of race, sex, language or religion, by the Charter of the United Nations.
To fulfil its mandate, UNESCO performs five principal functions: 1) prospective studies on education, science, culture and communication for tomorrow's world; 2) the advancement, transfer and sharing of knowledge through research, training and teaching activities; 3) standard-setting actions for the preparation and adoption of internal instruments and statutory recommendations; 4) expertise through technical cooperation to Member States for their development policies and projects; and 5) the exchange of specialized information.
UNESCO Institute for Statistics
The UNESCO Institute for Statistics (UIS) is the statistical office of UNESCO and is the UN depository for global statistics in the fields of education, science, technology and innovation, culture and communication.
The UIS was established in 1999. It was created to improve UNESCO's statistical programme and to develop and deliver the timely, accurate and policy-relevant statistics needed in today’s increasingly complex and rapidly changing social, political and economic environments. Published in 2017 by:
UNESCO Institute for Statistics P.O. Box 6128, Succursale Centre-Ville Montreal, Quebec H3C 3J7 Canada
Tel: +1 514-343-6880 Email: [email protected] http://www.uis.unesco.org
ISBN 978-92-9189-214-3 Ref: UIS/2017/ED/TD/7 DOI: https://doi.org/10.15220/978-92-9189-214-3-en
© UNESCO-UIS 2017
This publication is available in Open Access under the Attribution-ShareAlike 3.0 IGO (CC-BY-SA 3.0 IGO) license (http://creativecommons.org/licenses/by-sa/3.0/igo/). By using the content of this publication, the users accept to be bound by the terms of use of the UNESCO Open Access Repository (http://www.unesco.org/open-access/terms-use-ccbysa-en).
The designations employed and the presentation of material throughout this publication do not imply the expression of any opinion whatsoever on the part of UNESCO concerning the legal status of any country, territory, city or area or of its authorities or concerning the delimitation of its frontiers or boundaries.
The ideas and opinions expressed in this publication are those of the authors; they are not necessarily those of UNESCO and do not commit the Organization.

3
UIS Information Paper Nº 40 | 2017
Table of contents
Page
1. Introduction ......................................................................................................................................... 4
2. Analysis of results ................................................................................................................................ 5 2.1 Availability of data required to measure SDG 4 targets and indicators ........................................... 6 2.2 Disaggregation: Do countries collect the required disaggregated data to generate key
indicators required to measure SDG 4? ..............................................................................................12 2.3 Recent data sources: How updated or outdated are available sources of data? .........................15 2.4 Frequency: How often do countries collect data required to generate
SDG 4 indicators? ..................................................................................................................................16
3. Conclusion and recommendations .................................................................................................. 19
Annex I. Interpretation of figures ............................................................................................................... 22
Annex II. Administration of the survey ...................................................................................................... 23
Annex III. Countries covered by UNESCO Regional Offices for Africa ..................................................... 25
Annex IV. Indicator framework ................................................................................................................... 26
Annex V. SDG 4 indicator metadata ........................................................................................................... 30
List of figures Figure 1. SDG 4 – Education 2030 data availability by region and level of monitoring (%) ................................................... 7
Figure 2. Data availability for global indicators (%) .................................................................................................................... 7
Figure 3. Distribution of indicators by target and level of data availability ............................................................................. 9
Figure 4. Data availability by broad concept and individual indicators (%) ........................................................................... 11
Figure 5. Disaggregation by key characteristics ........................................................................................................................ 13
Figure 6. Disaggregation by selected education indicators ..................................................................................................... 14
Figure 7. Percentage with updated or outdated data to calculate SDG 4 indicators by target .......................................... 15
Figure 8. Frequency of data collection in sub-Saharan Africa ................................................................................................. 17
Figure 9. Percentage of countries based on frequency of data collection (by concept) to calculate SDG 4
indicators ....................................................................................................................................................................... 18

4
UIS Information Paper Nº 40 | 2017
1. Introduction Global consultations to define the highly ambitious set of Sustainable Development Goals (SDGs) commenced in 2014. In the domain of education, SDG 4 focuses on “ensuring inclusive and equitable quality education, and the promotion of lifelong learning opportunities for all”. But how will countries measure this global agenda? In sub-Saharan Africa, SDG consultations on education brought together national, regional and international stakeholders. Experts were drawn from countries in the region and are also members of an Inter-Agency Expert Group on SDGs (IAEG-SDGs)1, which was set up by the United Nations Statistical Commission in 2015 and tasked with overseeing the development of the indicator framework to monitor the SDGs. The work of the IAEG-SDGs culminated in the identification of 17 goals and 169 targets, including 11 global indicators to measure targets related to SDG 4 on education. Following several rounds of global consultations, a Technical Advisory Group (TAG), established by UNESCO in 2014 and chaired by the UNESCO Institute for Statistics (UIS), further elaborated 10 targets and proposed 43 thematic indicators on SDG 4. The thematic indicator framework was subsequently adopted by 184 UNESCO Member States, governments, civil society, non-governmental organization (NGOs) and United Nations Agencies in 2015. In its role as the lead agency to collect and report internationally-comparable data on SDG 4, including developing related indicators, the UIS is working through a Technical Coordination Group (TCG) which it convened in 2016. Six countries from the sub-Saharan African region are members and three are observers in the TCG. The TCG has been set up to:
• Provide a technical platform to support the implementation of the thematic indicator framework on SDG 4–Education 2030;
• Support the work of the IAEG-SDGs and relevant regional bodies and countries on the measurement of the new agenda;
• Guide the production of technical documentation and prepare guidelines to support countries in analysing and reporting on SDG 4–Education 2030; and
• Inform the SDG 4 Education Steering Committee on the implementation of the thematic monitoring framework on education.
The 43 proposed thematic indicators are encapsulated in a number of relevant education-related concepts, including learning, completion, participation, provision, resources, school environment, readiness to learn, knowledge, skills, policies, scholarships, teachers, motivation, support and equity. But the process is not yet
1 For sub-Saharan Africa, the Inter-Agency and Expert Group on SDGs (IAEG-SDGs) is comprised of seven countries: Botswana, Cabo Verde, Cameroon, Tanzania, Uganda, Senegal and Zambia. In Northern Africa, Algeria is part of the IAEG-SDGs.

5 UIS Information Paper Nº 40 | 2017
over. Work on the implementation of the thematic indicator framework is underway. In this regard, the UIS is leading the collection of data and the development of indicators on SDG 4. Monitoring this ambitious agenda will require baseline data to generate indicators elaborated in the global and thematic indicators framework. In 2016, the UIS conducted the first international survey to gauge country readiness to measure and monitor indicators on SDG 4. This survey was implemented in four regions – Africa, Asia and the Pacific, the Arab States and Latin America and the Caribbean. Results from the rapid appraisal survey conducted in sub-Saharan Africa were encouraging, but a lot remains to be accomplished to ensure that countries are in a position to collect and report on SDG 4 indicators. This also comes at a time when several countries in sub-Saharan Africa have embarked on national consultations on SDG 4 to examine how existing education policies and sector plans will be adapted to sufficiently respond to the education targets. This report presents an analysis of the results from the survey conducted in sub-Saharan Africa. It provides insight into the capacities of statistical systems that are already in place in the region, their strengths and challenges in reporting data on SDG 4, and it highlights some of the capacity-building needs and potential areas for further methodological developments that will be required in sub-Saharan Africa and globally to effectively monitor SDG 4. Additional details on the UIS and SDGs can be obtained from the UIS website: www.uis.unesco.org 2. Analysis of results In February 2016, the UIS mailed out a rapid appraisal survey to examine country readiness to collect data required to measure SDG 4. In sub-Saharan Africa, 48 countries received the survey. By April 2016, 40 countries had responded to the survey. The results of the survey provide a detailed mapping of the readiness of countries to collect the 43 proposed thematic indicators to measure SDG 4 and are expected to inform existing capacity gaps in the region. The survey is an important first step to identify potential areas for national, regional and international interventions to support country efforts to collect, report and use relevant data and indicators on SDG 4 for evidence-based policymaking and programming. The results of the survey are organized into four components:
1. Availability of data required to generate global and thematic indicators on SDG 4; 2. Country readiness to report disaggregated indicators; 3. Availability of recent data sources; and 4. Frequency of data updates.
The interpretation of the figures, the methodology used to administer the survey, the list of countries that received the survey are outlined in Annexes I, II and III respectively. The framework for indicators including targets, concepts and indicators is outlined in Annex IV and metadata are presented in Annex V.

6 UIS Information Paper Nº 40 | 2017
2.1 Availability of data required to measure SDG 4 targets and indicators In conjunction with UNESCO Regional Offices in Africa, education stakeholders and development partners, the UIS continually provides statistical capacity-building support to all countries in sub-Saharan Africa. For the purposes of the analysis in this paper and to ensure that the UIS can adequately respond to existing and future capacity gaps that have been identified through the rapid appraisal survey, 48 countries in sub-Saharan Africa are grouped and analysed based on their distribution within five UNESCO Regional Offices in Africa – Abuja, Dakar, Harare, Nairobi and Yaoundé2. Based on the survey conducted in sub-Saharan Africa, Figure 1 shows the status of the availability for both the 11 global indicators and the other 32 thematic indicators. The findings from the rapid appraisal survey in sub-Saharan Africa are quite consistent with the UIS global report on country readiness to measure SDG 4.3 In general, countries in sub-Saharan Africa are facing more challenges in producing data required to monitor the global indicators: just 47% of data are available for this category while 62% are available for other thematic indicators. At the global level, the average percentage of data availability for the four surveyed regions (sub-Saharan Africa, Latin America and the Caribbean, Asia and the Pacific and the Arab States) are quite similar, with 47% data availability for global indicators and 63% for other thematic indicators. When analysing results for global indicators across the five UNESCO Regional Offices in Africa4, countries under the Nairobi and Yaoundé Offices have the lowest rates of data availability and are well below the 47% average in sub-Saharan Africa. Countries under the Nairobi Office report the lowest probability for data availability at 40%, closely followed by countries under the Yaoundé Office at 39%. The findings from other regional offices are more encouraging – for example, countries under the Abuja and Dakar Offices have rates of data availability that are slightly above 50% (51% for the Abuja Office and 57% for the Dakar Office). Regarding other thematic indicators, countries under the Yaoundé and Nairobi Offices are still lagging behind compared to countries under the Abuja, Dakar and Harare Offices. However, most countries under these offices show reasonable rates of data availability, all above 54%. Nevertheless, as shown in the remaining sections of this paper, this sub-regional perspective and the clustering of indicators into two broad categories tends to obscure disparities at the indicator level. At the very least, all countries will be expected to systematically report on the 11 global indicators to effectively monitor progress achieved at the global level on the SDG 4 targets. A closer look at these global indicators reveals larger discrepancies (see Figure 2).
2 The distribution of 48 sub-Saharan African countries in five UNESCO Regional Offices in Africa may not be entirely consistent with the official regional economic communities (RECs) with which these countries may be conventionally associated. However, country readiness to measure SDGs based on specific RECs can be reproduced. 3 Sustainable Development Data Digest: Laying the Foundation to Measure Sustainable Development Goal 4 (2016). Montreal: UNESCO Institute for Statistics. http://www.uis.unesco.org/Education/Pages/uis-sustainable-development-data-digest.aspx 4 The methodology to interpret figures is outlined in Annex 1.

7 UIS Information Paper Nº 40 | 2017
Figure 1. SDG 4-Education 2030 data availability by region and level of monitoring (%)
Source: Rapid appraisal survey to assess the availability of data required to monitor of Education 2030, UNESCO Institute for
Statistics, March 2016 Figure 2: Data availability for global indicators (%)
Source: Rapid appraisal survey to assess the availability of data required to monitor of Education 2030, UNESCO Institute for
Statistics, March 2016

8 UIS Information Paper Nº 40 | 2017
As depicted in Figure 2, Indicator 16.2 on the percentage of youth and adults with ICT skills has one of the lowest rates of data availability in sub-Saharan Africa, at 15%. While the presence of ICTs increases exponentially in sub-Saharan Africa countries, the purposes of their usage by citizens in their daily lives is not well captured through the existing household surveys, and there are currently not enough regional surveys dedicated solely to measuring ICTs beyond administrative data records. Moreover, the operational definition of types of ICT skills is still vague and needs refinement to facilitate the same understanding of the domains captured in this concept which can also be assessed in future surveys and across countries and over time.
Similar observations can be made for Indicator 25 that focusses on mainstreaming new subjects in policies, curricula, student assessment, teachers’ education, global citizenship education and sustainable development. Indicator 25 has the lowest probability for data availability compared to other global indicators, at 14%.
For Indicator 8, which examines readiness to attend school for children under five, the survey revealed that countries have a relatively low rate of data availability, at 18%. In fact, pre-primary education as well as nursery schools are not very well developed in most sub-Saharan Africa countries, although some countries are moving to ensure that the sector is included as part of compulsory or basic education. Even where they exist, measuring the three dimensions of interest (developmentally on track in health, learning and psychosocial well-being) is not guaranteed as it involves a multidisciplinary team that goes beyond teachers assigned to schools. It is then clear that there is a long way to go to ensure that these indicators will be sufficiently available to effectively monitor Indicator 8.
Although the availability of data required to measure Indicators 30, 31 and 32 (availability of enabling infrastructures) and Indicator 39 (trained teachers) is relatively high, the availability of these data could be easily reinforced through targeted capacity-building efforts aimed at widening the scope of data collected through administrative routine data collection systems, such as Education Management Information Systems (EMIS). Improving the availability of data required to measure Indicator 10 related to enrolment in early learning, and still generally collected through EMIS, will require more efforts as it concerns a whole sub-sector which is still underdeveloped in sub-Saharan Africa. Given that available data gathered through EMIS may tend to cover the scope of participation in formal settings alone, secondary sources of data such as Multiple Indicator Cluster Surveys (MICS) could complement administrative data sources for this indicator. Regular use of secondary data sources is not a fully institutionalised practice with statisticians in ministries of education in this region. The same applies for Indicator 15 on the measurement of the participation of youth and adults in formal and non-formal education and training in the last 12 months. In regard to Indicator 1 related to proficiencies in numeracy and literacy at the basic education level, it can be observed that a rather large proportion of countries have conducted national learning assessments during the past five years or have participated in a regional assessment such as CONFEMEN Education Systems (PASEC) and the Southern and Eastern Africa Consortium for Monitoring Educational Quality (SACMEQ). However, it is important to note that the irregularity in the administration of such studies is mainly due to the high costs associated with conducting such assessments. Similarly, the low rate of data availability for Indicator 22 highlights the need for the implementation of more household surveys that would include a rapid assessment on literacy and numeracy levels among the population.

9 UIS Information Paper Nº 40 | 2017
Finally, in regard to Indicator 36 related to information on official development assistance (ODA) to developing countries, the likelihood that information on ODA to developing countries would be available through routine information systems such as EMIS is relatively low. Discussions at the global level suggest that data on ODA will be collected mainly through donors’ administrative records. Additional information on data availability for the indicators across the 10 targets is presented in Figure 3. Figure 3. Distribution of indicators by target and level of data availability
Source: Rapid appraisal survey to assess the availability of data required to monitor of Education 2030, UNESCO Institute for
Statistics, March 2016 Higher rates of data availability: 70% and above As depicted in Figure 3, the majority of indicators in this cluster refer to participation, provision and resources in formal education. Such data are usually collected through administrative routine data collection systems where Indicators 3, 4, 5, 6, 7, 11, 12, 13 and 30 are more easily generated. Given that some countries have underperforming EMIS in place, the rates of data availability observed thus far can still be improved. The case is similar for Indicator 13 on enrolment in higher education and Indicators 37, 38, 39 and 40 on teachers. Despite the high rate of data availability for Indicator 20 (93%) on expenditures per student at different education levels, it is most likely that the type of data available in this case refer mostly to public expenditure data which can be sourced from national ministries of finance. Here the coverage of data, in particular, on household contribution to education financing and the contribution of the international community, will need to be further investigated. Indicator 23 on youth and adult literacy rates also shows a high rate of availability, at 85%. However, it should be noted that most estimates on literacy are obtained through “self-declaration”, most likely by the actual heads of households. Here also, there is a need for countries to develop robust youth and adult literacy assessment modules that can be integrated into regular household surveys or dedicated standard literacy assessment tests that can be adapted by countries into local contexts. At the very least, minimum standards should be set to ensure comparability of the results overtime and across countries.

10 UIS Information Paper Nº 40 | 2017
Marginal availability of data: Between 30% and 69% Indicators 1 and 2 measure students’ learning proficiencies. In fact, only a handful of countries in sub-Saharan Africa have regularly participated in regional assessments or have conducted national learning assessments during the six-year period (2010-2015) assessed through this survey. The same applies for household surveys that include specific modules to measure youth and adult educational attainment (Indicator 17), as well as a level of proficiency in functional literacy and numeracy skills (Indicator 22). Indicator 10, 14, 15 and 24 measure participation in early learning, TVET, youth and adults in formal and non-formal education and literacy programmes respectively. The availability of data to derive these indicators suggests that these sub-sectors are not sufficiently covered by current education information systems in sub-Saharan Africa. Indicators on teachers (41, 42 and 43 respectively), equipment on ICT (Indicator 31) and infrastructure for students with disabilities (Indicator 32) are usually populated by administrative data. This demonstrates the need for additional items to be integrated into current information systems. Moreover, such data will need to be collected at all levels of education, and more harmonised data collection tools and methodologies may need to be developed in the future. In sub-Saharan Africa, it is not uncommon that education data may be fragmented across several sectors, and the establishment of robust sector-wide information systems can be particularly challenging. In several countries in this region, collaboration between national statistical umbrella agencies, such as central statistics offices and primary data producers to collate the data required to generate the bulk of these indicators, is not yet a reality. Indicator 35 refers to the number of higher education scholarships for study abroad that are awarded to students from a given country. The rate of data availability for this indicator is particularly low (48%). It suggests that the majority of countries in sub-Saharan Africa have not yet established reliable mechanisms to record scholarships provided to nationals of a given country that study abroad. In fact, in addition to scholarships provided through official government channels, there are other funding sources that support studies abroad in foreign universities, including foundations, private donors and non-governmental organizations. Unfortunately, these are not well tracked through official government statistics. Also, available data are insufficient to track foreign students in a specific country, particularly when such students are not supported by their families but rather through scholarships provided either by a private donor, a foundation or a university. Lower availability of data: below 30 %
Indicators in this cluster refer to those that have the highest expectation for the integration of new items into existing information systems, and the development or expansion of methodologies in order to produce them. Operational definitions as well as methodologies to measure most of these education-related concepts are not yet fully available, will need to be harmonised or are difficult to implement. This latter category in particular refers to measuring children under five years of age who are developmentally on track or experiencing positive stimulating home environments (Indicators 8 and 9) and measurement of proficiency skills (Indicators 16.1, 16.2, 26 and 27). Additional work will be required to ensure integration of concepts in the curricula, harmonisation of survey constructs and measurement tools to be developed
11 UIS Information Paper Nº 40 | 2017
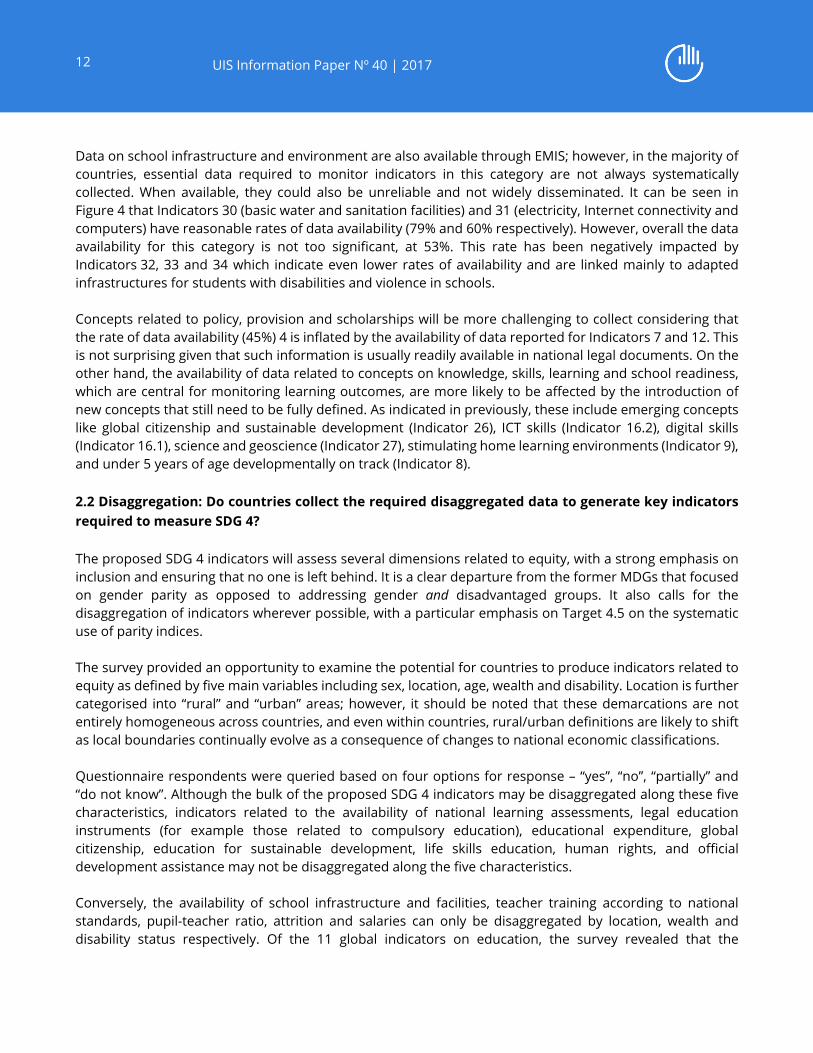
(Indicators 18, 25 to 29, 33 and 34). The majority of indicators under Target 4.7 (global citizenship education and education for sustainable development) will also need to be properly defined and developed.
Data availability by broad concept
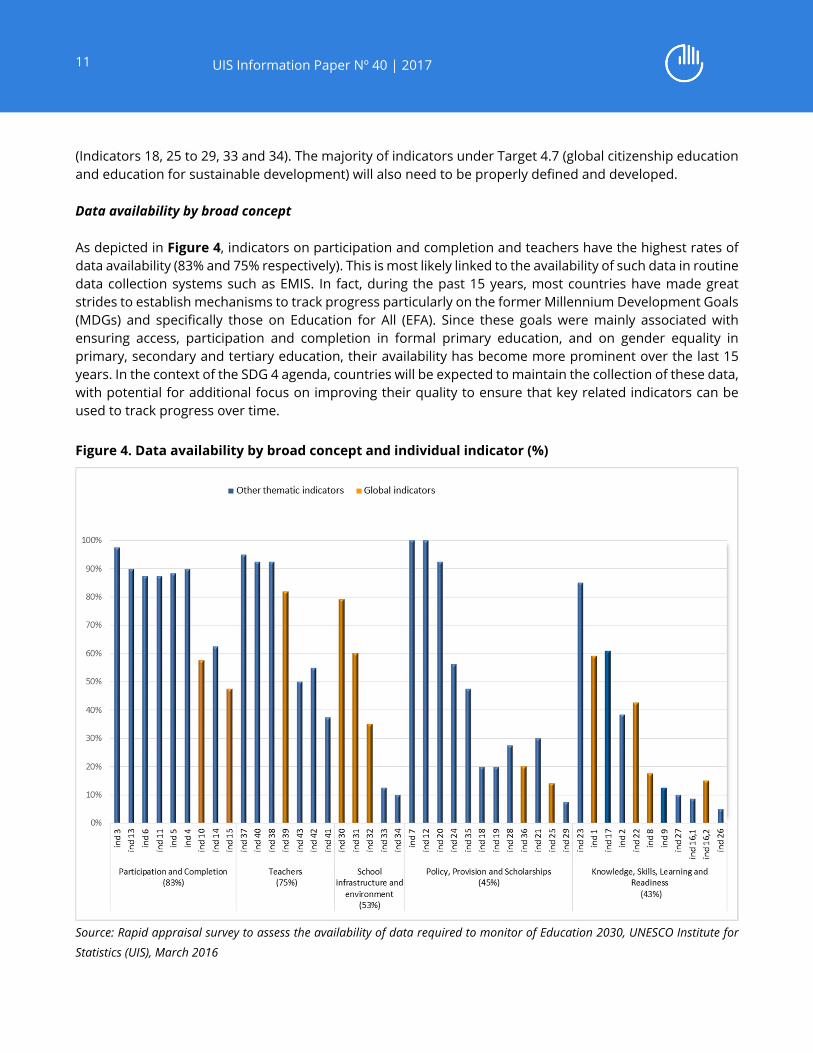
As depicted in Figure 4, indicators on participation and completion and teachers have the highest rates of data availability (83% and 75% respectively). This is most likely linked to the availability of such data in routine data collection systems such as EMIS. In fact, during the past 15 years, most countries have made great strides to establish mechanisms to track progress particularly on the former Millennium Development Goals (MDGs) and specifically those on Education for All (EFA). Since these goals were mainly associated with ensuring access, participation and completion in formal primary education, and on gender equality in primary, secondary and tertiary education, their availability has become more prominent over the last 15 years. In the context of the SDG 4 agenda, countries will be expected to maintain the collection of these data, with potential for additional focus on improving their quality to ensure that key related indicators can be used to track progress over time. Figure 4. Data availability by broad concept and individual indicator (%)
Source: Rapid appraisal survey to assess the availability of data required to monitor of Education 2030, UNESCO Institute for
Statistics (UIS), March 2016
12 UIS Information Paper Nº 40 | 2017
Data on school infrastructure and environment are also available through EMIS; however, in the majority of countries, essential data required to monitor indicators in this category are not always systematically collected. When available, they could also be unreliable and not widely disseminated. It can be seen in Figure 4 that Indicators 30 (basic water and sanitation facilities) and 31 (electricity, Internet connectivity and computers) have reasonable rates of data availability (79% and 60% respectively). However, overall the data availability for this category is not too significant, at 53%. This rate has been negatively impacted by Indicators 32, 33 and 34 which indicate even lower rates of availability and are linked mainly to adapted infrastructures for students with disabilities and violence in schools. Concepts related to policy, provision and scholarships will be more challenging to collect considering that the rate of data availability (45%) 4 is inflated by the availability of data reported for Indicators 7 and 12. This is not surprising given that such information is usually readily available in national legal documents. On the other hand, the availability of data related to concepts on knowledge, skills, learning and school readiness, which are central for monitoring learning outcomes, are more likely to be affected by the introduction of new concepts that still need to be fully defined. As indicated in previously, these include emerging concepts like global citizenship and sustainable development (Indicator 26), ICT skills (Indicator 16.2), digital skills (Indicator 16.1), science and geoscience (Indicator 27), stimulating home learning environments (Indicator 9), and under 5 years of age developmentally on track (Indicator 8). 2.2 Disaggregation: Do countries collect the required disaggregated data to generate key indicators required to measure SDG 4? The proposed SDG 4 indicators will assess several dimensions related to equity, with a strong emphasis on inclusion and ensuring that no one is left behind. It is a clear departure from the former MDGs that focused on gender parity as opposed to addressing gender and disadvantaged groups. It also calls for the disaggregation of indicators wherever possible, with a particular emphasis on Target 4.5 on the systematic use of parity indices. The survey provided an opportunity to examine the potential for countries to produce indicators related to equity as defined by five main variables including sex, location, age, wealth and disability. Location is further categorised into “rural” and “urban” areas; however, it should be noted that these demarcations are not entirely homogeneous across countries, and even within countries, rural/urban definitions are likely to shift as local boundaries continually evolve as a consequence of changes to national economic classifications. Questionnaire respondents were queried based on four options for response – “yes”, “no”, “partially” and “do not know”. Although the bulk of the proposed SDG 4 indicators may be disaggregated along these five characteristics, indicators related to the availability of national learning assessments, legal education instruments (for example those related to compulsory education), educational expenditure, global citizenship, education for sustainable development, life skills education, human rights, and official development assistance may not be disaggregated along the five characteristics. Conversely, the availability of school infrastructure and facilities, teacher training according to national standards, pupil-teacher ratio, attrition and salaries can only be disaggregated by location, wealth and disability status respectively. Of the 11 global indicators on education, the survey revealed that the

13 UIS Information Paper Nº 40 | 2017
availability of crucial indicators to track equity, such as those associated with wealth and disability status, are not as easily disaggregated as indicators disaggregated by characteristics based on age, sex and location. As shown in Figure 5, in sub-Saharan Africa, countries reported that the potential to disaggregate data by sex has the highest potential for disaggregation at 86%, closely followed by location (71%). Disaggregation of data by age is more problematic with only 59% of countries reporting that they have sufficient systems in place to collect such information. Only a handful of countries can generate data disaggregated by disability and wealth status (17% and 15% respectively). Typically, information on the social characteristics of a population can be sourced from both EMIS and household surveys. Figure 5. Disaggregation by key characteristics
Source: Rapid appraisal survey to assess the availability of data required to monitor of Education 2030, UNESCO Institute for
Statistics (UIS), March 2016
When focusing solely on the set of global indicators that have the potential to be disaggregated based on the five characteristics (age, sex, wealth, disability and location), namely Indicators 4.1.1 (student achievements), 4.2.1 (children under 5 development), 4.2.2 (participation in early learning), and 4.6.1 (population with ICT skills), the findings from the survey were mixed. It is evident that the availability of data by age and sex far outweighs the availability of data by wealth and disability status. However, even when assessing the findings on disaggregation that have been gleaned from the surveys in Asia and the Pacific, the Arab States and Latin American and the Caribbean, no region has demonstrated a capacity to disaggregate all indicators by sex, location or age.5
5 Sustainable Development Data Digest: Laying the Foundation to Measure Sustainable Development Goal 4 (2016). Montreal: UNESCO Institute for Statistics. http://www.uis.unesco.org/Education/Pages/uis-sustainable-development-data-digest.aspx

14 UIS Information Paper Nº 40 | 2017
Sustainable economic development will not be achievable without a critical mass of individuals having access to suitable skills for decent jobs and employment. As depicted in Figure 6, the survey revealed that in regard to Target 4.6 on skills of youth and adults and the population that have ICT skills, 88% of countries have the potential to disaggregate data by sex, while 81% and 78% can disaggregate this category by age and location respectively. Figure 6. Disaggregation by selected education indicators
Source: Rapid appraisal survey to assess the availability of data required to monitor of Education 2030, UNESCO Institute for
Statistics (UIS), March 2016
The availability of data by wealth and disability status in this category is relatively low at 31% and 22% respectively, suggesting that the existence of robust information systems to collect such information is an aspect that still needs to be addressed if equity is to be sufficiently assessed in the future. Regarding participation in early learning, 91% and 86% of countries have the potential to disaggregate data by sex and location respectively. The potential to disaggregate data by age is equally encouraging (82%). As is the case with Indicator 4.6.1, Indicator 4.2.2 has low potential for disaggregation by wealth and disability status (14% and 27% respectively). Overall, the survey revealed that indicators on children under 5 have the lowest potential for disaggregation by age, sex and location, at 57% and 71% respectively. Incidentally, 29% of countries have the potential to disaggregate data by wealth for Indicator 4.2.1, the highest proportion when compared to Indicators 4.1.1, 4.2.2 and 4.6.1.

15 UIS Information Paper Nº 40 | 2017
Moreover, as shown in Figure 6, the findings on Indicator 4.1.1 on student achievement are particularly worrying. Only 12% and 15% of countries collect data by wealth and disability status, the lowest proportion when compared to the similar categories for Indicators 4.2.1, 4.2.2 and 4.6.1. 2.3 Recent data sources: How updated or outdated are available sources of data?
The availability of timely data is one of the most important components that affect data quality and is crucial to inform relevant policies to measure the Education 2030 Agenda. This section of the survey examined the extent to which countries have recent data. Questionnaire respondents had the option to report the availability of data for the period prior to 2000 and between the years 2001 to 2016. As indicated in Figure 7, it is commendable that only 4% of countries indicated that they had no information on Target 4.3 concerned with affordable and quality technical, vocational and tertiary education. At the same time, only 5% of countries reported having no information on Targets 4.4 and 4.c on youth and adults possessing relevant skills and the supply of teachers respectively, and only 6% of countries reported having no information to measure Targets 4.5 and 4.6 on the elimination of gender disparities and the achievement of literacy and numeracy respectively. Less than 55% of countries reported that they had more recent data (academic year 2012 and above) on Target 4.2 on early childhood development and pre-primary education. The overwhelming majority of countries (41%) reported that they had no information on this target. Figure 7. Percentage with updated or outdated data to calculate SDG 4 indicators by target
Source: Rapid appraisal survey to assess the availability of data required to monitor of Education 2030, UNESCO Institute for
Statistics (UIS), March 2016

16 UIS Information Paper Nº 40 | 2017
Furthermore, as shown in Figure 7, less than 70% of countries had data older than the academic year 2012 to measure Targets 4.4 and 4.6 (63% and 65% respectively). The survey revealed that 69% of countries have recent information (academic year 2012 and above) to measure Target 4.7 on global citizenship in mainstream curriculum, while 28% of countries had no information on this topic. 89% of countries reported having more recent data (academic year 2012 and above) to measure Targets 4.5, 4a (education facilities) and 4.b. The overwhelming majority of countries (94%) reported that they have data on academic year 2012 and above to measure the supply of teachers (Target 4.c). This is consistent with trends in several countries in sub-Saharan Africa to maintain more than one source of information on the teaching stock, particularly on teachers that may be remunerated through public education systems. Between 1% and 3% of countries reported having outdated information (academic year prior to 2012) to measure Targets 4.7, 4.a and 4.c. There are notable exceptions. Although no country reported having outdated information to measure Target 4.b on scholarships to developing countries, 11% of countries reported not having any information on this topic. This is not entirely surprising as indicated in previous analysis in this paper. Timeliness is another concern for Targets 4.4 and 4.6, where 33% and 29% of countries respectively reported having information older than academic year 2012 to measure these targets. Moving forward, these areas may require closer scrutiny given the large distribution of countries that reported having “outdated” information compared to any other targets. 2.4 Frequency: How often do countries collect data required to generate SDG 4 indicators? Concurrent to requesting countries to provide information on the availability of recent data, the survey queried respondents on the frequency of data collection. Respondents had an option to choose from up to eight responses: “quarterly”, “every 6 months”, “annually”, “every 2 years”, “every 3 to 5 years”, “every 6 to 10 years”, “less frequently” and “do not know”. Although an analysis of the frequency of data collections by UNESCO Regional Offices may not shed sufficient light on other disparities, information obtained through the rapid survey is still useful. As shown in Figure 8, overall in sub-Saharan Africa less than 5% of countries reported that they collect data every 6 to 10 years. In fact, a fair proportion of countries (61%) reported that they collect data on an annual or frequent basis. 7% of countries in sub-Saharan Africa reported that they collect data every 3 to 5 years and only 4% of countries reported that they collect data every 2 years.

17 UIS Information Paper Nº 40 | 2017
Figure 8. Frequency of data collection in sub-Saharan Africa
Source: Rapid appraisal survey to assess the availability of data required to monitor of Education 2030, UNESCO Institute for
Statistics (UIS), March 2016
When analysing the frequency of data collection by concept, as shown in Figure 9, the survey revealed that data required to generate indicators to measure key concepts are collected more frequently than others, for example, those on completion, school infrastructure, teachers and participation are collected annually or more frequently. In this regard, 95% and 92% of countries collect annual data on completion and school infrastructure respectively, while 80% of countries collect annual data on teachers and participation. Not surprisingly, this information would typically be located in Directorates of Planning as part of the administration of annual school censuses. Under 70% of countries collect annual information on school environment and scholarships. Additionally, a significant proportion of countries (66% and 58% respectively) did not indicate “missing data” for the frequency with which they collect data on the provision of education and school readiness. In fact, missing information on concepts related to legal instruments that stipulate the compulsory nature of education for pre-primary, primary and secondary school-aged children, the participation of youth in literacy programmes, and concepts pertaining to global citizenship, life skills and sustainable development in mainstream education curricula or assessment (as revealed in other analysis in this paper) are most likely an indication of the unavailability of such information through routine data collection systems - such as EMIS- rather than the unavailability of such information entirely at country level6. Less than 10% of countries reported that they collect data every 6 to 10 years and mainly in the domains of skills (educational attainment, literacy) and school readiness which would usually be made available through national censuses of sample based household or other similar surveys.
6 Refer to Annex II for information on the targeted survey respondents.

18 UIS Information Paper Nº 40 | 2017
Figure 9. Percentage of countries based on frequency of data collection (by concept) to calculate SDG 4 indicators
Source: Rapid appraisal survey to assess the availability of data required to monitor of Education 2030, UNESCO Institute for
Statistics (UIS), March 2016

19 UIS Information Paper Nº 40 | 2017
Conclusions and recommendations This section presents a summary of findings and recommendations to inform interventions at national, regional global levels.
o In sub-Saharan Africa, the UIS continually conducts national assessments on country abilities to produce quality education data. This has seen the elaboration of targeted strategies to address statistical capacity-building needs to improve education data quality in Africa.7 Nonetheless, this survey comes at an opportune time in sub-Saharan Africa and sheds additional light on current capacity gaps to generate SDG 4 indicators. Such an exercise is also expected to pave the way for future targeted interventions by the UIS and the setting of norms and standards to support the availability and quality of data to measure Education 2030 Agenda.
o The results of the survey suggest that in countries where functional education management information systems (EMIS) are already in place, there is a higher potential to produce the bulk of indicators on SDG 4 that require administrative data. However, this also necessitates that countries begin to invest in the integration within existing information systems of new and relevant items that will be required to monitor SDG 4. As the survey results indicate, there are a number of areas where the potential to expand the scope of available data should be explored. ICT facilities, disability-adapted infrastructures, teachers, children with disabilities or special learning needs, and bulling in schools are all areas that would benefit from extended data coverage. Adopting a sector-wide approach towards data collection, and including data on early learning, higher education, TVET and literacy programmes that occur in both formal and non-formal institutions, are important steps to measure the full range of SDG 4 indicators.
o The survey revealed that several countries have conducted a national assessment of learning during the past five years, or have participated in regional assessments such as the Analysis Programme of the CONFEMEN Education Systems (PASEC) and the Southern and Eastern Africa Consortium for Monitoring Educational Quality (SACMEQ). However, data generated through such assessments are not always comparable from one cycle to another and across countries since they would not typically use the same assessment frameworks and may not target similar populations. If global efforts are not put in place to support the development of sound assessment tools to track progress until 2030, over time, available data may become outdated even where the assessments are comparable. The main challenge in sub-Saharan Africa is the sustainability of these assessments, many of which are still funded by development partners, and the lack of substantial human resources and local expertise. At the global level, the fact that different assessment frameworks are currently in use limits the ability to compare key achievements across countries. To effectively monitor quality in education, countries will be required to integrate the collection of new data items on learning assessments
7 See example: @Assessing Education Data Quality in the Southern Africa Development Community (SADC)@, UIS Information Paper No. 21, January 2014. http://www.uis.unesco.org/Education/Documents/IP-2014-education-data-quality-africa.pdf

20 UIS Information Paper Nº 40 | 2017
within regular statistical production cycles, in addition to improving existing methodologies on student assessment. As well, assessments should not exclude populations with special needs or the identification of equity-related issues, e.g. wealth status.8
o There is a necessity to articulate emerging concepts, such as those related to education for sustainable development, digital skills, ICT skills, global citizenship and readiness to attend school, in order to facilitate a common understanding and develop standardised measurement tools to monitor progress overtime and across countries.
o Noting the areas in the survey where questionnaire respondents indicated that they “do not know” if certain concepts are available in countries and keeping in mind that not all areas in the framework for indicators are currently well defined, findings from this survey should be interpreted with caution. At the national level, the extent of coordination that was achieved in order to collect all the information for the sole purposes of completing the rapid appraisal survey cannot be immediately determined. While several countries did suggest in their initial response that missing information is intended to be collected in the future, this could not be immediately verified.
o Few countries in sub-Saharan Africa have conducted dedicated assessments on adult literacy skills. Mainly subjective questions tend to be included in household surveys and would usually be used to estimate adult literacy skills.
o To better inform evidenced-based policies, national education administrations and stakeholders may need to set aside additional resources to improve the relevance and timeliness of information required to measure all SDG 4 targets. Enhancing existing information systems, including the administration of regular censuses and sample based surveys to succinctly capture SDG 4 targets, is just one consideration.
o For those countries that demonstrated a higher availability of more recent data (academic year 2012 and above) or where the bulk of data required to measure SDG 4 targets could already be readily available continually monitoring data coverage and quality should not be overlooked in the future.
o Countries may need to invest more to ensure that internal coordination mechanisms are put in place to address fragmentation of information and inaccessibility of data to policymakers and stakeholders, including those related to administrative datasets on the entire education system, household surveys, learning assessments and finance and expenditure datasets.
o Although the potential for countries in sub-Saharan Africa to disaggregate data by age appear
encouraging, national policies that do not necessarily enforce the use of birth certificates or other civil vital records to consistently track the ages of all school-aged children merit special attention if all school-aged children are to be sufficiently tracked in the future.
8 Initiatives such the Global Alliance to Monitoring Learning (GAML), a multi-stakeholder initiative aims to develop common standards to addressing measurement challenges based on consensus and collective action in the learning assessment arena while improving coordination among actors.

21 UIS Information Paper Nº 40 | 2017
o Data on disability might be more difficult to interpret and compare across countries mainly because
of instances where data are collected through EMIS – and principally as reported through annual school census forms by school heads - the method used to “diagnose” any type of disability status is not easily verifiable.

22 UIS Information Paper Nº 40 | 2017
Annex I. Interpretation of figures The data analysed in this information paper have been generated through questions (see matrix questionnaire) that required Yes/No responses. There are three main aspects to consider when analysing these figures:
i) Figures are built on the basis of the Yes/No on the availability of data required to calculate the desired indicator, as opposed to simple raw data points. For example, there are two types of raw data points needed to calculate the gross enrolment ratio in a given ISCED level: a) enrolment by grade and age; and b) population data by age. Hence, a Yes answer means objectively that both data points are available, while no refers to lack of at least one of the two data points;
ii) A given designated indicator, for the purposes of the simplification of the graphs, is composed of several individual indicators. For example, Indicator 1 (Target 4.1) includes six individual indicators while Indicator 39 (Target 4.c) includes eight; and
iii) The percentages per indicator used to build the graphs are calculated across the 41 countries of the sub-Saharan African region (or countries in a specific sub-region of sub-Saharan Africa) taking into account the composition of each indicator. For example indicator 1, the total frequency of data points required is 41*∑ i where Ni is the number data points needed for single indicator
i= 1,…,8. However, the percentage analysed is obtained as ( 41 ∗ ∑ i 41 ∗ 8 )*100, where Ii =1 if the answer for data required to calculate single indicator Ii is Yes; and Ii =0 if the answer is not Yes (No, missing or don’t know).
Hence, number 60 in Figure 2 for Indicator 1 means that for a total of 328 (=41*8) indicator points required to obtain the eight indicators across the 41 countries of sub-Saharan Africa, only 0.60*328=197 points would be available or the rate of availability of data required to obtain at least one of the eight single/sub-indicators in all 41 sub-Saharan African countries put together is 60%. Therefore, this figure cannot be simply interpreted that six out of ten countries in Africa can provide the full range of sub-indicators listed under Indicator 1.
The number of sub-indicators per global indicator, as presented in this document, is summarised below.
Global Indicator code 1 8 10 15 16 22 25 30,31&32 36 39
Number of sub-indicators 6 1 1 1 1 2 8 7 1 8

23 UIS Information Paper Nº 40 | 2017
Annex II. Administration of the survey Comprising 10 sections, the rapid appraisal survey questionnaire examined the availability of data required to measure SDG 4. The questionnaire addressed concepts related to learning, completion, participation, school readiness, policy, knowledge, resources and environment, skills, provision of education, and the qualifications and motivation of teaching staff. In sub-Saharan Africa alone, a specific component on mapping education planning processes was deemed relevant.9 Responses were elicited using the following criteria:
The process entailed four key steps: Step 1: Survey mailout The survey was targeted mainly at national experts concerned with official and regular collection and dissemination of education statistics. Experts are typically located in ministries of education, directorates of planning, and by extension are UNESCO focal points responsible for national EMIS. Almost all survey respondents have been engaged with the regular and annual completion of UIS questionnaires on students and teachers, educational expenditure, school facilities, education systems and tertiary statistics. Step 2: Review of country responses Where non-response (demonstrated by blanks in the questionnaire) or partial information was reported by questionnaire respondents, the UIS requested additional clarification. Naturally, questionnaire respondents that would generally be engaged in the routine management of EMIS – and due to the relatively short duration allocated for the completion of the rapid appraisal survey (one and half months) – may not have had sufficient time to coordinate the collation of all the information required to complete the survey.
9 The results pertaining to education mapping processes have been analysed in a separate document and are therefore not part of this paper.
Question 1: Availability of information required to produce an indicator (option 1 = Yes, option 2=No, option 3 = Do not Know) Question 2: Latest year of available data Question 3: Frequency of data collection Questions 4 to 8: Availability of disaggregated data by age, sex, location, wealth and disability (option 1 = Yes, option 2= Partially, option 3=No, option 4=Do not know) Question 9: Data Sources Question 10: Official publication of indicators Question 11: Name of publication and online sources Question 12: Intention to collect data in the future (option 1=Yes, option 2=No) Question 13: Information on national authorities responsible for data Comments: any other information deemed relevant by questionnaire respondents

24 UIS Information Paper Nº 40 | 2017
The degree of non-response to a number of questions related to information that would usually be sourced from institutions outside the ministry of education – such as Central Statistics Offices (CSOs) – or information that would typically be the sourced from departments of social services within ministries of education – such as data associated with bullying, violence in schools, allocation of resources to disadvantaged populations – is not under the purview of routine data collection systems housed by ministries of education. The process of completing the survey was a laborious task, and it is evident that the completion of the survey could not be systematically achieved through a national team composed of multiple institutions that oversee the collection of data on SDG 4. In fact, information on specific indicators generated through household surveys, for example on student learning assessments that are usually administered by independent bodies outside ministries of education, may not have been within the immediate reach of the questionnaire respondents. In several countries in sub-Saharan Africa, education sectors could be managed across several ministries which implies that disparate data collection units and coordination mechanisms to provide the full range of accurate data for this survey could not be immediately addressed. Questionnaire respondents would therefore have tended to focus more closely on those segments of data where they might have been previously exposed. Step 3: Data processing Following country feedback, the UIS integrated responses to the survey into an internal databank to produce relevant analysis. It should, however, be noted that given the nature of the survey sufficient time to elicit comprehensive feedback from national respondents following a first submission of the survey to the UIS could not be guaranteed. While official UIS guidelines10 on the administration of the survey recommended that a national focal point should be identified at the onset of the survey and that responses to all questions should be coordinated through a national technical team responsible for the production of the bulk of the 43 proposed indicators, the time allocated to complete the survey may not have afforded the setting up of an elaborate national team to address all segments of the survey. Step 4: Dissemination of findings The results of the survey were communicated to at least 20 heads of directorates of planning and/or EMIS representing countries in East, West and Southern Africa in July 2016. Additional information and detailed definitions of the 43 proposed indicators to measure SDG 4 – Education 2030 agenda can be accessed on the UIS website: http://uis.unesco.org
10 A metadata document on definitions and limitations of indicators has been produced by the UIS. However, this document was not disseminated to sub-Saharan Africa respondents at the time of this survey.

25 UIS Information Paper Nº 40 | 2017
Annex III. Countries covered by UNESCO Regional Offices for Africa
Abuja
Benin
Dakar
Burkina Faso
Harare
Botswana Côte d'Ivoire Cabo Verde Lesotho Ghana Gambia Malawi Guinea Guinea-Bissau Mozambique Liberia Mali Namibia Nigeria Mauritania South Africa Sierra Leone Niger Swaziland Togo Senegal Zambia
Zimbabwe
Nairobi
Comoros
Yaoundé
Angola Djibouti Burundi Eritrea Cameroon Ethiopia CAR Kenya Chad Madagascar Congo Mauritius Dem. Rep. of Congo Rwanda Equatorial Guinea Seychelles Gabon Somalia Sao Tome and Principe South Sudan Uganda UR Tanzania

26 UIS Information Paper Nº 40 | 2017
Annex IV. Indicator framework
Concepts Indicators Global4.1 By 2030, ensure that all girls and boys complete free, equitable and quality primary and secondary education leading to relevant and effective learning outcomes 4.1 Learning 1. Percentage of children/young people (i) in Grade 2 or 3; (ii) at the
end of primary education; and (iii) at the end of lower secondary education achieving at least a minimum proficiency level in (a) reading and (b) mathematics
4.1.1
2. Administration of a nationally-representative learning assessment (i) in Grade 2 or 3 (ii) at the end of primary education and (iii) at the end of lower secondary education
4.1. Completion 3. Gross intake ratio to the last grade (primary, lower secondary education)
4. Completion rate (primary, lower secondary, upper secondary education)
4.1. Participation
5. Out-of-school rate (primary, lower secondary, upper secondary education)
6. Percentage of children over-age for grade (primary, lower secondary education)
4.1. Provision 7. Number of years of (i) free and (ii) compulsory primary and secondary education guaranteed in legal frameworks
4.2 By 2030, ensure that all girls and boys have access to quality early childhood development, care and pre�primary education so that they are ready for primary education 4.2 Readiness 8. Percentage of children under 5 years of age who are
developmentally on track in health, learning and psychosocial well-being
4.2.1
9. Percentage of children under 5 years of age experiencing positive and stimulating home learning environments
4.2. Participation
10. Participation rate in organized learning (one year before the official primary entry age)
4.2.2
11. Gross enrolment ratio for pre-primary education
4.2. Provision 12. Number of years of (i) free and (ii) compulsory pre-primary education guaranteed in legal frameworks

27 UIS Information Paper Nº 40 | 2017
4.3 By 2030, ensure equal access for all women and men to affordable and quality technical, vocational and tertiary education, including university 4.3. Participation
13. Gross enrolment ratio for tertiary education
14. Participation rate in technical-vocational education programmes (15- to 24-year-olds)
15. Participation rate of youth and adults in formal and non-formal education and training in the last 12 months
4.3.1
4.4 By 2030, substantially increase the number of youth and adults who have relevant skills, including technical and vocational skills, for employment, decent jobs and entrepreneurship
4.4. Skills 16.1. Percentage of youth/adults who have achieved at least a minimum level of proficiency in digital literacy skills
16.2. Percentage of youth/adults with information and communications technology (ICT) skills by type of skill
4.4.1
17. Youth/adult educational attainment rates by age group, economic activity status and programme orientation
4.5 By 2030, eliminate gender disparities in education and ensure equal access to all levels of education and vocational training for the vulnerable, including persons with disabilities, indigenous peoples, and children in vulnerable situations
4.5 Policy 18. Percentage of students in primary education whose first or home language is the language of instruction
19. Extent to which explicit formula-based policies reallocate education resources to disadvantaged populations
20. Education expenditure per student by level of education and source of funding
21. Percentage of total aid to education allocated to low-income countries
4.6 By 2030, ensure that all youth and a substantial proportion of adults, both men and women, achieve literacy and numeracy
4.6. Skills 22. Percentage of population in a given age group achieving at least a fixed level of proficiency in functional (a) literacy and (b) numeracy skills
4.6.1
23. Youth/adult literacy rate
4.6. Provision 24. Participation rate of youth/adults in literacy programmes

28 UIS Information Paper Nº 40 | 2017
4.7 By 2030, ensure that all learners acquire the knowledge and skills needed to promote sustainable development, including, among others, through education for sustainable development and sustainable lifestyles, human rights, gender equality, promotion of a culture of peace and non‐violence, global citizenship and appreciation of cultural diversity and of culture’s contribution to sustainable development 4.7. Provision 25. Extent to which (i) global citizenship education and (ii) education for
sustainable development, including gender equality and human rights, are mainstreamed in (a) national education policies (b) curricula (c) teacher education and (d) student assessment
4.7.1
4.7. Knowledge 26. Percentage of students by age group (or education level) showing adequate understanding of issues relating to global citizenship and sustainability
27. Percentage of 15-year-old students showing proficiency in knowledge of environmental science and geoscience
4.7. Provision 28. Percentage of schools that provide life skills-based HIV and sexuality education
29. Extent to which the framework on the World Programme on Human Rights Education is implemented nationally (as per UNGA Resolution 59/113)
4.a Build and upgrade education facilities that are child, disability and gender sensitive and provide safe, non‐violent, inclusive and effective learning environments for all 4.a. Resources 30. Percentage of schools with access to (i) basic drinking water;
(ii) single-sex basic sanitation facilities; and (iii) basic handwashing facilities (as per the Water, Sanitation and Hygiene for All (WASH) indicator definitions)
4.a.1
31. Percentage of schools with access to (i) electricity; (ii) Internet for pedagogical purposes; (iii) computers for pedagogical purposes
32. Percentage of schools with access to adapted infrastructure and materials for students with disabilities
4.a. Environment
33. Percentage of students experiencing bullying, corporal punishment, harassment, violence, sexual discrimination and abuse
34. Number of attacks on students, personnel and institutions

29 UIS Information Paper Nº 40 | 2017
4.b By 2020, substantially expand globally the number of scholarships available to developing countries, in particular least developed countries, small island developing states and African countries, for enrolment in higher education, including vocational training and information and communications technology, technical, engineering and scientific programmes, in developed countries and other developing countries 4.b. Numbers 35. Number of higher education scholarships awarded by beneficiary
country
36. Volume of official development assistance flows for scholarships by sector and type of study
4.b.1
4.c By 2030, substantially increase the supply of qualified teachers, including through international cooperation for teacher training in developing countries, especially least developed countries and small island developing States 4.c. Qualified 37. Percentage of teachers qualified according to national standards by
education level and type of institution
38. Pupil-qualified teacher ratio by education level 4.c. Trained 39. Percentage of teachers in: (a) pre-primary; (b) primary; (c) lower
secondary; and (d) upper secondary education who have received at least the minimum organized teacher (e.g. pedagogical training) pre-service or in-service required for teaching at the relevant level in a given country
4.c.1
40. Pupil-trained teacher ratio by education level 4.c. Motivated 41. Average teacher salary relative to other professions requiring a
comparable level of education qualification
42. Teacher attrition rate by education level 4.c. Supported 43. Percentage of teachers who received in-service training in the last
12 months by type of training
30 UIS Information Paper Nº 40 | 2017
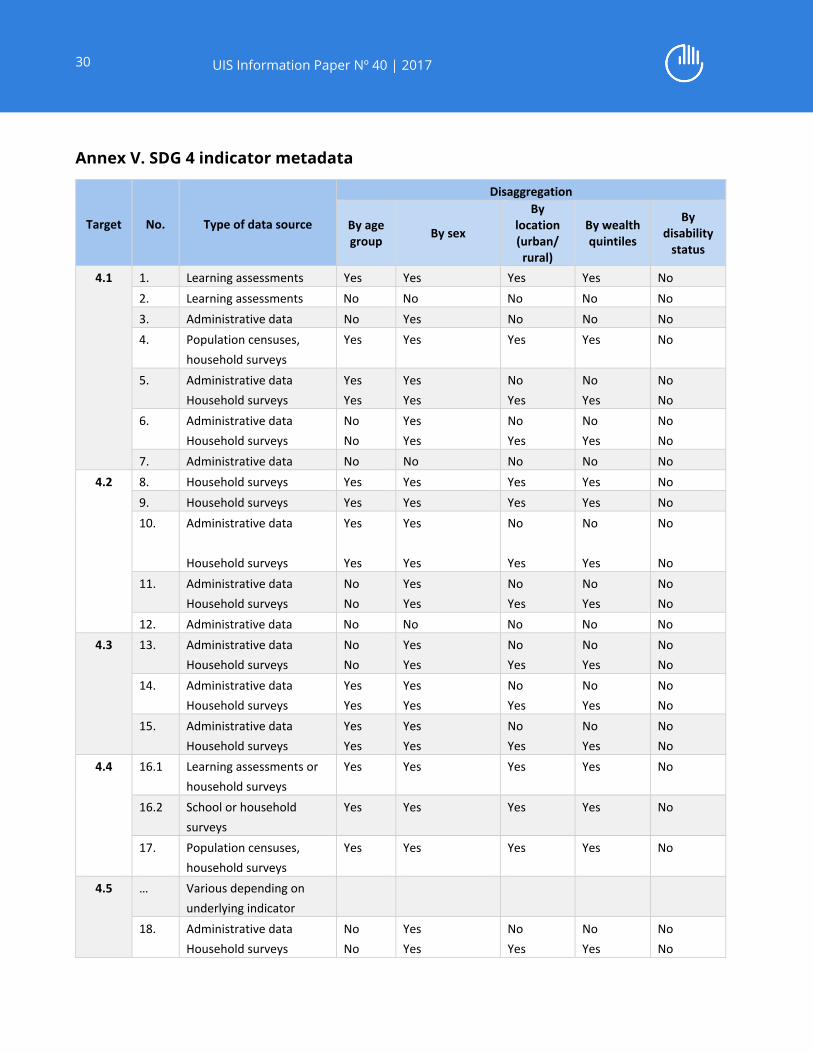
Annex V. SDG 4 indicator metadata
Target No. Type of data source
Disaggregation
By age group By sex
By location (urban/ rural)
By wealth quintiles
By disability
status
4.1 1. Learning assessments Yes Yes Yes Yes No 2. Learning assessments No No No No No 3. Administrative data No Yes No No No 4. Population censuses,
household surveys Yes Yes Yes Yes No
5. Administrative data Household surveys
Yes Yes
Yes Yes
No Yes
No Yes
No No
6. Administrative data Household surveys
No No
Yes Yes
No Yes
No Yes
No No
7. Administrative data No No No No No 4.2 8. Household surveys Yes Yes Yes Yes No
9. Household surveys Yes Yes Yes Yes No 10. Administrative data
Household surveys
Yes Yes
Yes Yes
No Yes
No Yes
No No
11. Administrative data Household surveys
No No
Yes Yes
No Yes
No Yes
No No
12. Administrative data No No No No No 4.3 13. Administrative data
Household surveys No No
Yes Yes
No Yes
No Yes
No No
14. Administrative data Household surveys
Yes Yes
Yes Yes
No Yes
No Yes
No No
15. Administrative data Household surveys
Yes Yes
Yes Yes
No Yes
No Yes
No No
4.4 16.1 Learning assessments or household surveys
Yes Yes Yes Yes No
16.2 School or household surveys
Yes Yes Yes Yes No
17. Population censuses, household surveys
Yes Yes Yes Yes No
4.5 … Various depending on underlying indicator
18. Administrative data Household surveys
No No
Yes Yes
No Yes
No Yes
No No
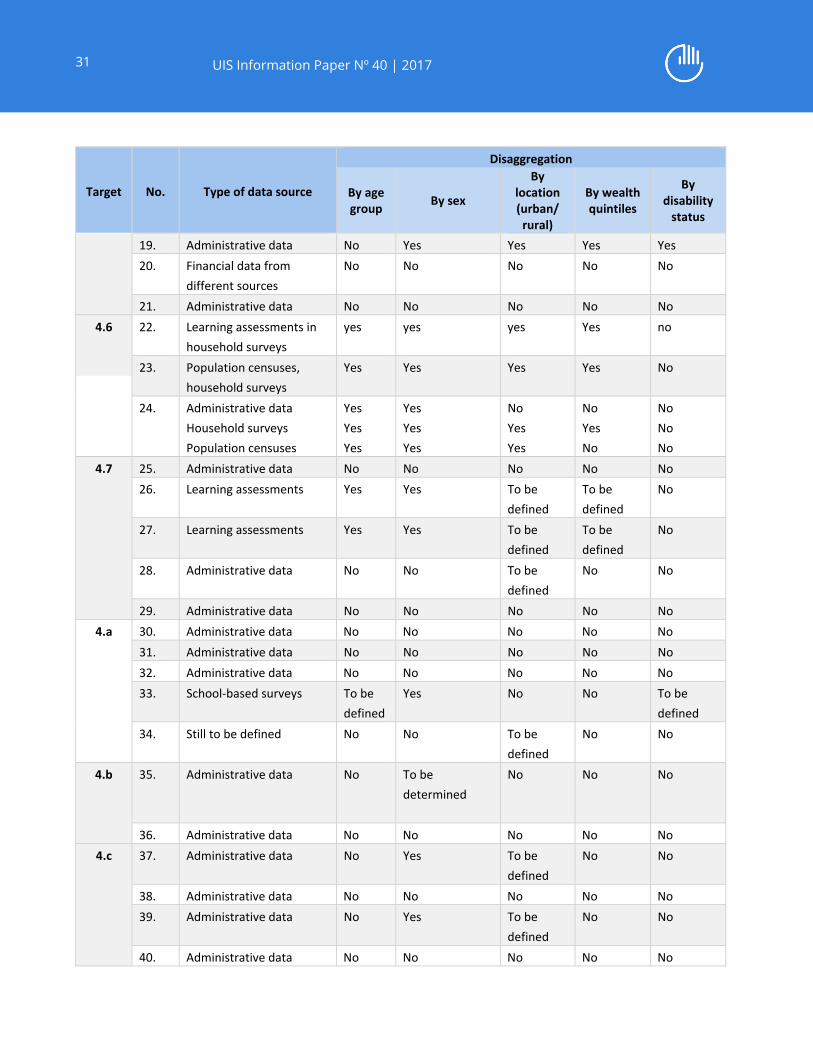
31 UIS Information Paper Nº 40 | 2017
Target No. Type of data source
Disaggregation
By age group By sex
By location (urban/ rural)
By wealth quintiles
By disability
status
19. Administrative data No Yes Yes Yes Yes 20. Financial data from
different sources No No No No No
21. Administrative data No No No No No 4.6 22. Learning assessments in
household surveys yes yes yes Yes no
23. Population censuses, household surveys
Yes Yes Yes Yes No
24. Administrative data Household surveys Population censuses
Yes Yes Yes
Yes Yes Yes
No Yes Yes
No Yes No
No No No
4.7 25. Administrative data No No No No No 26. Learning assessments Yes Yes To be
defined To be defined
No
27. Learning assessments Yes Yes To be defined
To be defined
No
28. Administrative data No No To be defined
No No
29. Administrative data No No No No No 4.a 30. Administrative data No No No No No
31. Administrative data No No No No No 32. Administrative data No No No No No 33. School-based surveys To be
defined Yes No No To be
defined 34. Still to be defined No No To be
defined No No
4.b 35. Administrative data No To be determined
No No No
36. Administrative data No No No No No 4.c 37. Administrative data No Yes To be
defined No No
38. Administrative data No No No No No 39. Administrative data No Yes To be
defined No No
40. Administrative data No No No No No

32 UIS Information Paper Nº 40 | 2017
Target No. Type of data source
Disaggregation
By age group By sex
By location (urban/ rural)
By wealth quintiles
By disability
status
41. Administrative data No No No No No 42. Administrative data No Yes No No No 43. Administrative data or
school-based surveys No Yes No No No