
Countdownto the Algebra I EOC TM · students essential practice in 4 to 8 different standards. ......
10
© 2008 MathWarm-Ups.Com Countdown to the Algebra I EOC TM Overview 2011 Baker & Petsche Publishing LLC MathWarm-Ups.com Version 1 The STAAR Algebra I EOC could be the most rigorous math test your students will encounter this school year, testing them on 26 different Supporting standards and 13 different Readiness standards. Your students need rigorous practice and you need to assess their proficiency. Countdown to the Algebra I EOC provides both in a straightforward and easy-to-implement design. Each page of the Countdown gives your students essential practice in 4 to 8 different standards. Whether it's worked as a daily warm-up or as a homework assignment, by the end of the tenth series your students will have worked 540 exit-level problems! No teacher training or computers required Countdown is simplicity at its finest. And it works! MathWarm-Ups.com When to begin Countdown The problems on the Countdown are exit-level difficulty. We recommend beginning 10 weeks before the test. You can always double up if needed. 10 full-length tests! Print an entire 54-question Algebra I EOC on just 5 sheets of paper! Algebra I Sample Page: Easy to implement Straightforward Affordable Maximize Effectiveness! Check every page with your students, as a class or individually. Then identify problem areas by utilizing the provided Quick Track forms. The time required to empty a tank, y, varies inversely with the rate of pumping, x. If a pump can empty a tank in 45 minutes at a rate of 200 gallons per minute, how long will it take to empty the tank at a pump rate of 450 gallons per minute? 1 The graph shows the relationship between the production rate of a particular oil well after it has reached its peak production rate and the time in years the well is kept in production. Looking at the graph, which statement appears to be most correct? The Sleep Accessories Store sold a total of 316 large and small pillows last month. The total sale value of these pillows was $5,359. Large pillows sold for $22.50 each and small pillows sold for $14 each. Which of these systems of linear equations could be used to find l, the number of large pillows, and s, the number of small pillows sold? 4.A.8.A 3.A.6.C 2.A.2.B Series 2 P6 Countdown to the Algebra I EOC Which of these inequalities best represent the range of the graphed function? A linear function is graphed below. If this line is translated 5 units up, the resulting new line would best be described by which of these equations? 5 2 y x y = x +3 A 1 4 y =4x +3 B y =4x –7 D y = x –7 C 1 4 10 minutes A 20 minutes C 18 minutes B 35 minutes D 5.A.11.B t q Time (years) Quantity of Oil (barrels) 2 4 6 0 6,000 5,000 4,000 3,000 2,000 1,000 Oil Well Production The well’s production rate decreased by 1,500 barrels per year. A The well’s production rate decreased by 500 barrels per year. B The well’s production rate decreased more from Year 0 to Year 1 than in any other year. C The well’s production rate decreased more from Year 5 to Year 6 than in any other year. D 3 1.A.1.E 4 l + s = 5359 22.50l + 14s = 316 A 14l + 22.50s = 316 l + s = 5359 C l + s = 316 14l + 22.50s = 5359 B l + s = 316 22.50l + 14s = 5359 D y 6 A y 1 B y 6 C y 1 D 10 Complete Series Each series resembles a full-length STAAR Algebra EOC (54 problems). You can print an entire test on just 5 pages when printed front to back! Implementation Steps Work 1 or 2 pages a day as homework or in class as a daily warm-up. Check each page with your students, modeling and discussing effective problem-solving strategies. Track progress by using the provided Quick Track form (students fill this out themselves in seconds). Focus on problem areas. Countdown is used in over 700 Texas school districts. Make 2012 the year that your school tries this unique approach!
Transcript of Countdownto the Algebra I EOC TM · students essential practice in 4 to 8 different standards. ......
© 2008 MathWarm-Ups.Com
Countdown to the Algebra I EOCTM Overview
2011 Baker & Petsche Publishing LLCMathWarm-Ups.com Version 1
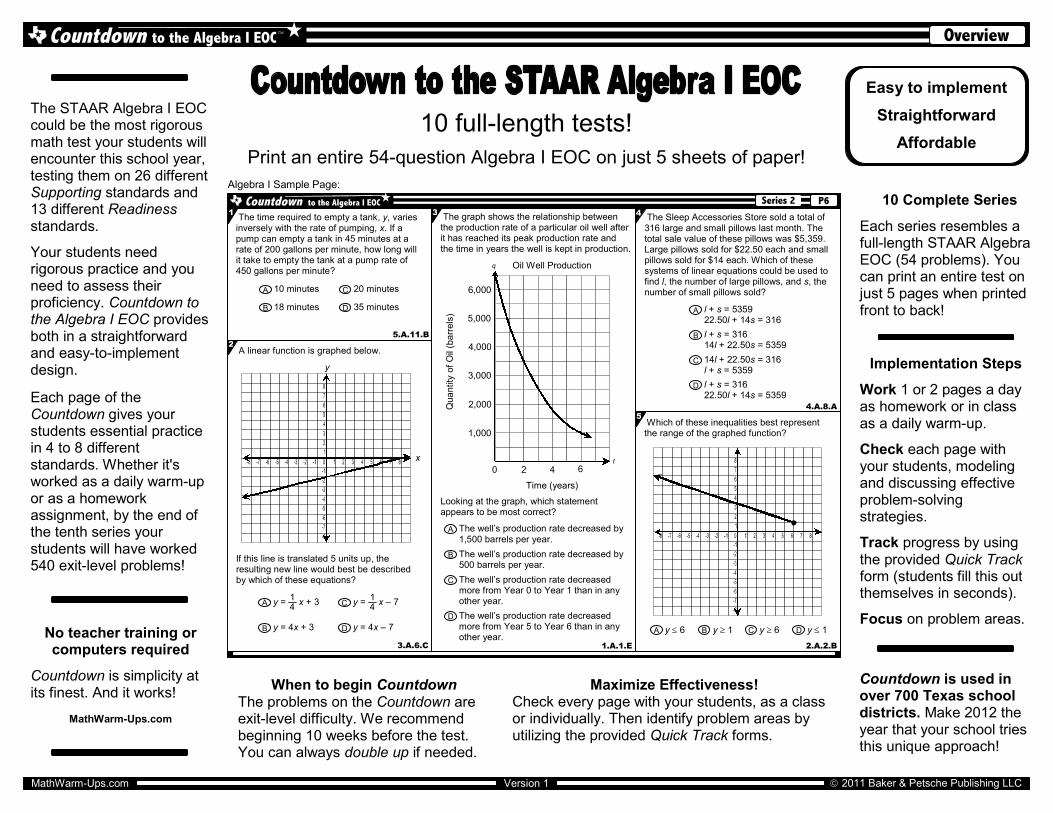
The STAAR Algebra I EOCcould be the most rigorousmath test your students willencounter this school year,testing them on 26 differentSupporting standards and13 different Readinessstandards.
Your students needrigorous practice and youneed to assess theirproficiency. Countdown tothe Algebra I EOC providesboth in a straightforwardand easy-to-implementdesign.
Each page of theCountdown gives yourstudents essential practicein 4 to 8 differentstandards. Whether it'sworked as a daily warm-upor as a homeworkassignment, by the end ofthe tenth series yourstudents will have worked540 exit-level problems!
No teacher training orcomputers required
Countdown is simplicity atits finest. And it works!
MathWarm-Ups.com
When to begin CountdownThe problems on the Countdown areexit-level difficulty. We recommendbeginning 10 weeks before the test.You can always double up if needed.
10 full-length tests!
Print an entire 54-question Algebra I EOC on just 5 sheets of paper!
Algebra I Sample Page:
Easy to implement
Straightforward
Affordable
Maximize Effectiveness!Check every page with your students, as a classor individually. Then identify problem areas byutilizing the provided Quick Track forms.
The time required to empty a tank, y, variesinversely with the rate of pumping, x. If apump can empty a tank in 45 minutes at arate of 200 gallons per minute, how long willit take to empty the tank at a pump rate of450 gallons per minute?
1 The graph shows the relationship betweenthe production rate of a particular oil well afterit has reached its peak production rate andthe time in years the well is kept in production.
Looking at the graph, which statementappears to be most correct?
The Sleep Accessories Store sold a total of316 large and small pillows last month. Thetotal sale value of these pillows was $5,359.Large pillows sold for $22.50 each and smallpillows sold for $14 each. Which of thesesystems of linear equations could be used tofind l, the number of large pillows, and s, thenumber of small pillows sold?
4.A.8.A
3.A.6.C 2.A.2.B
Series 2 P6Countdown to the Algebra I EOC
Which of these inequalities best representthe range of the graphed function?
A linear function is graphed below.
If this line is translated 5 units up, theresulting new line would best be describedby which of these equations?
5
2
y
x
y = x + 3A14
y = 4x + 3B y = 4x – 7D
y = x – 7C14
10 minutesA 20 minutesC
18 minutesB 35 minutesD
5.A.11.B
t
q
Time (years)
Qua
ntit
yof
Oil
(ba
rrels
)
2 4 60
6,000
5,000
4,000
3,000
2,000
1,000
Oil Well Production
The well’s production rate decreased by1,500 barrels per year.
A
The well’s production rate decreased by500 barrels per year.
B
The well’s production rate decreasedmore from Year 0 to Year 1 than in anyother year.
C
The well’s production rate decreasedmore from Year 5 to Year 6 than in anyother year.
D
3
1.A.1.E
4
l + s = 535922.50l + 14s = 316
A
14l + 22.50s = 316l + s = 5359
C
l + s = 31614l + 22.50s = 5359
B
l + s = 31622.50l + 14s = 5359
D
y 6A y 1B y 6C y 1D
10 Complete Series
Each series resembles afull-length STAAR AlgebraEOC (54 problems). Youcan print an entire test onjust 5 pages when printedfront to back!
Implementation Steps
Work 1 or 2 pages a dayas homework or in classas a daily warm-up.
Check each page withyour students, modelingand discussing effectiveproblem-solvingstrategies.
Track progress by usingthe provided Quick Trackform (students fill this outthemselves in seconds).
Focus on problem areas.
Countdown is used inover 700 Texas schooldistricts. Make 2012 theyear that your school triesthis unique approach!

Which of these inequalities represent thedomain of the graphed function?
2011 Baker & Petsche Publishing LLCMathWarm-Ups.com Version 1
Series 1 P1Countdown to the Algebra I EOCTM
1
Craig’s Computer Supply Store sells color inkprinter cartridges for $24.99 and black ink printercartridges for $14.99. Last week the store sold atotal of 27 ink cartridges. If the sales income forthese items was $514.73, not including tax,which of these conclusions is reasonable?
The relationship between C, the temperature indegrees Celsius, and F, the temperature indegrees Fahrenheit, is represented by the
equation C = (F – 32). If the temperature is
20°C, what is the temperature in degreesFahrenheit?
Open/Gridded Response
Two quantities, x and y, have a relationshipwhere y varies directly with x. The graph of thisfunction contains the point (–10, 6). Which of thefollowing represents this relationship?
The standard atmospheric temperature isdependent on the altitude above mean sealevel. The approximate relationship is shown inthe table.
Altitude AboveMean Sea Level
(feet)
Temperature(degrees Celsius)
3000 – 4.5
4000 – 11.0
6000 – 24.0
7000 – 30.5
What would be a reasonable standardatmospheric temperature to expect at 10,000feet above mean sea level?
The relationship between the amount of gasremaining in a car’s tank and the miles driven fora given trip are modeled on the graph below.
Which of these best represents the range of thegraphed function for the car trip?
2.A.2.B2
4.A.8.C
3
59
4.A.7.B4
3.A.6.G
5
– 35.0 °CA
– 37.0 °CB – 50.0 °CD
C – 43.6 °C
2.A.2.D
D y = x53
–
C y = x35
–
y = xB53
A y = x35
8
30 90 120 150 18060 210
Car Trip
Distance Traveled (miles)
Gas
Rem
ain
ing
(ga
llons)
x
y
8
20
4
12
16
0
3.A.5.B
Which of these relations represent a function?
I, II, and IV onlyC
III and IV onlyD
A I and II only
II and III onlyB
I.
II.
III.
IV.
{(0, 0), (1, 3), (3, 3)}
{(0, 0), (2, 2), (4, 8)}
{(0, 0), (3, 1), (3, 3)}
{(0, 0), (0, 2), (0, 4)}
1.A.1.B
A population of 400 sea otters decreases by2.5% per year. At the end of 7 years, there willbe about 335. Which of these functions can beused to determine the number of sea otters, y, inthis population at the end of t years?
6
7
y = 400(2.5)tA y = 400(0.025)t
C
y = 400(1 + 0.025)tB y = 400(1 – 0.025)t
D
5.A.11.C
y
x
B There were more color ink cartridges thanblack ink cartridges sold last week.
A There were more black ink cartridges thancolor ink cartridges sold last week.
C The total sales income, not including tax,for color ink cartridges was $399.84.
D The total sales income, not including tax,for black ink cartridges was $164.89.
B – 6 < x ≤ 0 D – 6 < x ≤ 4
A 0 < y ≤ 5 C – 2 < y < 5
0 ≤ x ≤ 250B
A 15 ≤ x ≤ 165
0 ≤ y ≤ 18D
7 ≤ y ≤ 18C
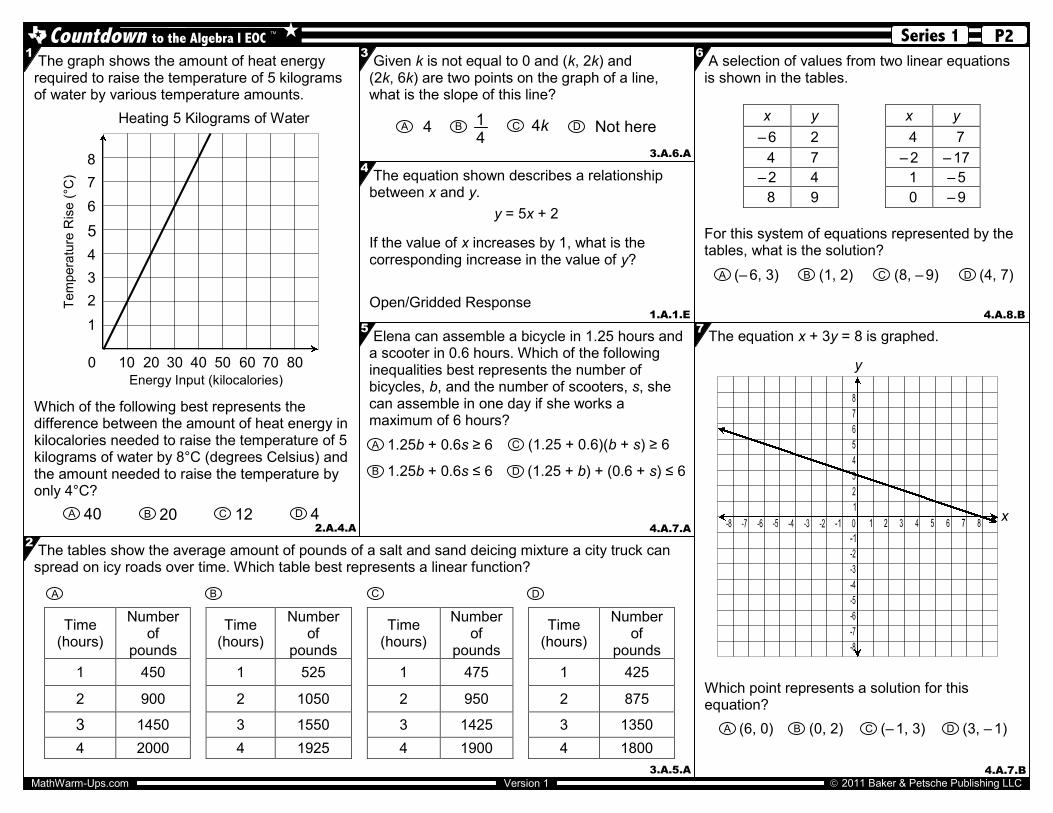
A selection of values from two linear equationsis shown in the tables.
x y x y
– 6 2 04 07
04 7 – 2 – 17
– 2 4 01 – 5
08 9 00 – 9
For this system of equations represented by thetables, what is the solution?
The equation x + 3y = 8 is graphed.
Which point represents a solution for thisequation?
The graph shows the amount of heat energyrequired to raise the temperature of 5 kilogramsof water by various temperature amounts.
Which of the following best represents thedifference between the amount of heat energy inkilocalories needed to raise the temperature of 5kilograms of water by 8°C (degrees Celsius) andthe amount needed to raise the temperature byonly 4°C?
2011 Baker & Petsche Publishing LLCMathWarm-Ups.com Version 1
Series 1 P2Countdown to the Algebra I EOCTM
1
The tables show the average amount of pounds of a salt and sand deicing mixture a city truck canspread on icy roads over time. Which table best represents a linear function?
Time(hours)
Numberof
pounds
Time(hours)
Numberof
pounds
Time(hours)
Numberof
pounds
Time(hours)
Numberof
pounds
1 450 1 525 1 475 1 425
2 900 2 1050 2 950 2 875
3 1450 3 1550 3 1425 3 1350
4 2000 4 1925 4 1900 4 1800
Given k is not equal to 0 and (k, 2k) and(2k, 6k) are two points on the graph of a line,what is the slope of this line?
The equation shown describes a relationshipbetween x and y.
If the value of x increases by 1, what is thecorresponding increase in the value of y?
Open/Gridded Response
2
3
3.A.6.A
4
3.A.5.A 4.A.7.B
4.A.8.B
6
2.A.4.A12C 4DA 40 20B
A 4 C 4k14
B D Not here
y = 5x + 2
1.A.1.E
7
A (6, 0) B (0, 2) (– 1, 3)C (3, – 1)D
Tem
pera
ture
Ris
e(°
C)
Heating 5 Kilograms of Water
Energy Input (kilocalories)
20 40 60 80500
300
100
700
0
3
1
2
4
5
6
7
8
DCBA
(8, – 9)C(1, 2)B(– 6, 3)A (4, 7)D
Elena can assemble a bicycle in 1.25 hours anda scooter in 0.6 hours. Which of the followinginequalities best represents the number ofbicycles, b, and the number of scooters, s, shecan assemble in one day if she works amaximum of 6 hours?
5
4.A.7.A
A 1.25b + 0.6s ≥ 6
1.25b + 0.6s ≤ 6 B
(1.25 + 0.6)(b + s) ≥ 6 C
(1.25 + b) + (0.6 + s) ≤ 6 D
x
y
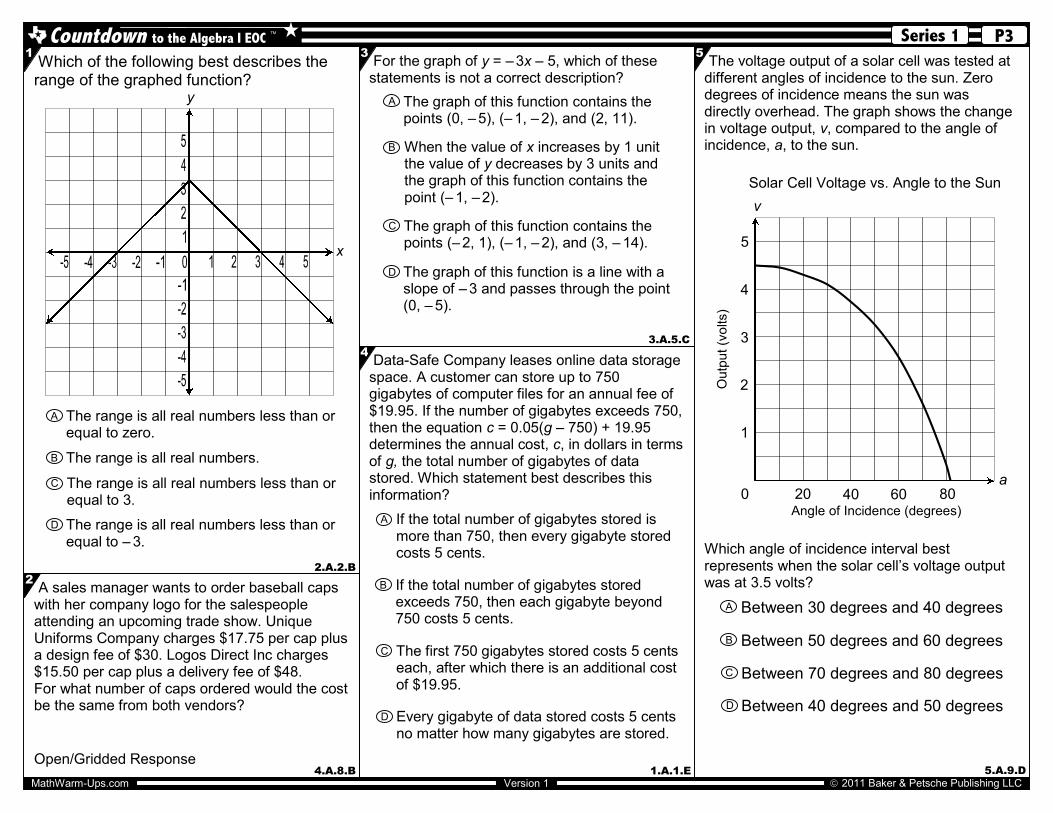
For the graph of y = – 3x – 5, which of thesestatements is not a correct description?
Which of the following best describes therange of the graphed function?
2011 Baker & Petsche Publishing LLCMathWarm-Ups.com Version 1
Series 1 P3Countdown to the Algebra I EOCTM
1
A sales manager wants to order baseball capswith her company logo for the salespeopleattending an upcoming trade show. UniqueUniforms Company charges $17.75 per cap plusa design fee of $30. Logos Direct Inc charges$15.50 per cap plus a delivery fee of $48.For what number of caps ordered would the costbe the same from both vendors?
Open/Gridded Response
Data-Safe Company leases online data storagespace. A customer can store up to 750gigabytes of computer files for an annual fee of$19.95. If the number of gigabytes exceeds 750,then the equation c = 0.05(g – 750) + 19.95determines the annual cost, c, in dollars in termsof g, the total number of gigabytes of datastored. Which statement best describes thisinformation?
2.A.2.B2
4.A.8.B
3
3.A.5.C4
1.A.1.E
The voltage output of a solar cell was tested atdifferent angles of incidence to the sun. Zerodegrees of incidence means the sun wasdirectly overhead. The graph shows the changein voltage output, v, compared to the angle ofincidence, a, to the sun.
Which angle of incidence interval bestrepresents when the solar cell’s voltage outputwas at 3.5 volts?
5.A.9.D
5
D The range is all real numbers less than orequal to – 3.
C The range is all real numbers less than orequal to 3.
A The range is all real numbers less than orequal to zero.
B The range is all real numbers.
Every gigabyte of data stored costs 5 centsno matter how many gigabytes are stored.
D
A If the total number of gigabytes stored ismore than 750, then every gigabyte storedcosts 5 cents.
If the total number of gigabytes storedexceeds 750, then each gigabyte beyond750 costs 5 cents.
B
The first 750 gigabytes stored costs 5 centseach, after which there is an additional costof $19.95.
C
Solar Cell Voltage vs. Angle to the Sun
Angle of Incidence (degrees)
Outp
ut(v
olts
)
v
a4020 80600
3
4
1
2
5
Between 50 degrees and 60 degreesB
Between 70 degrees and 80 degreesC
Between 40 degrees and 50 degreesD
A Between 30 degrees and 40 degrees
C The graph of this function contains thepoints (– 2, 1), (– 1, – 2), and (3, – 14).
When the value of x increases by 1 unitthe value of y decreases by 3 units andthe graph of this function contains thepoint (– 1, – 2).
B
The graph of this function contains thepoints (0, – 5), (– 1, – 2), and (2, 11).
A
The graph of this function is a line with aslope of – 3 and passes through the point(0, – 5).
D
y
x
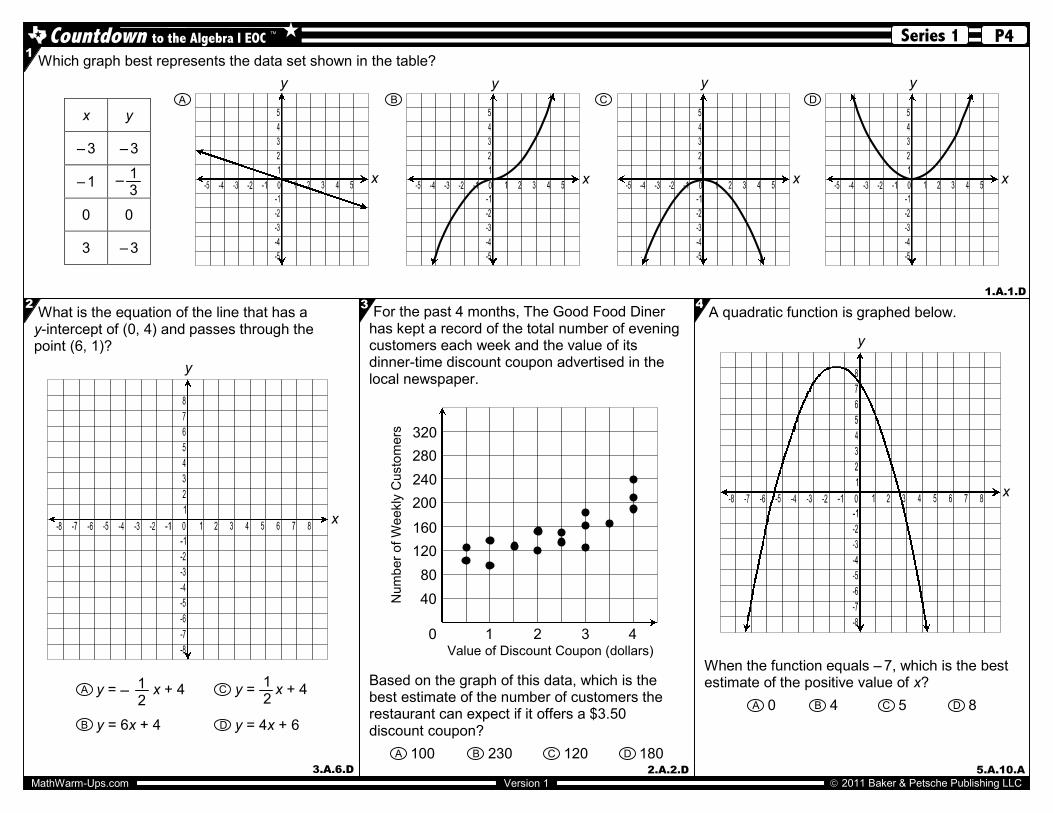
For the past 4 months, The Good Food Dinerhas kept a record of the total number of eveningcustomers each week and the value of itsdinner-time discount coupon advertised in thelocal newspaper.
Based on the graph of this data, which is thebest estimate of the number of customers therestaurant can expect if it offers a $3.50discount coupon?
Which graph best represents the data set shown in the table?
x y
– 3 – 3
– 1
0 0
3 – 3
2011 Baker & Petsche Publishing LLCMathWarm-Ups.com Version 1
Series 1 P4Countdown to the Algebra I EOCTM
1
What is the equation of the line that has ay-intercept of (0, 4) and passes through thepoint (6, 1)?
A quadratic function is graphed below.
When the function equals – 7, which is the bestestimate of the positive value of x?
2
3.A.6.D
3
2.A.2.D 5.A.10.A
1.A.1.D4
D y = 4x + 6y = 6x + 4B
A y = x + 412
– C y = x + 412 0A 5C4B 8D
x
y
x
y
– 13
x
y
x
yA B C D
x
y
x
y
Num
ber
of
We
ekly
Custo
mers
Value of Discount Coupon (dollars)1 2 3 4
80
160
2400
320
40
120
2000
280
0
100A 230B 120C D 180
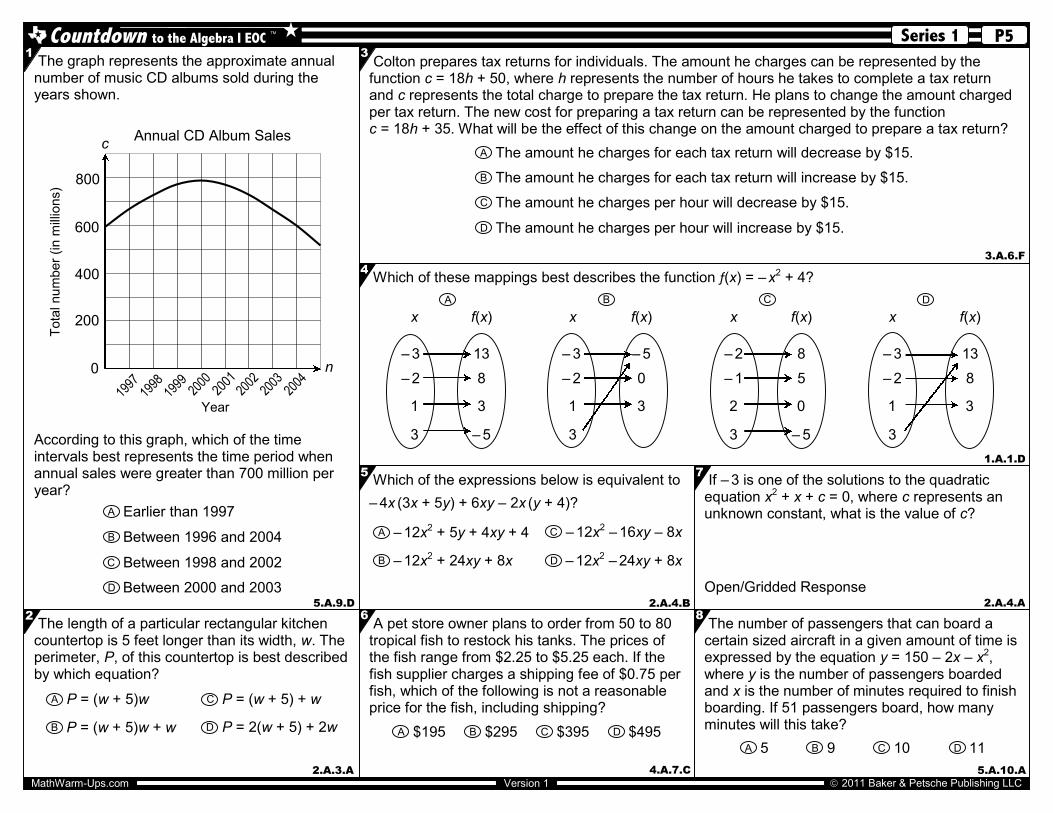
The graph represents the approximate annualnumber of music CD albums sold during theyears shown.
According to this graph, which of the timeintervals best represents the time period whenannual sales were greater than 700 million peryear?
The number of passengers that can board acertain sized aircraft in a given amount of time isexpressed by the equation y = 150 – 2x – x2,where y is the number of passengers boardedand x is the number of minutes required to finishboarding. If 51 passengers board, how manyminutes will this take?
Which of these mappings best describes the function f(x) = – x2 + 4?
x f(x) x f(x) x f(x) x f(x)
– 3 13 – 3 – 5 – 2 8 – 3 13
– 2 8 – 2 0 – 1 5 – 2 8
1 3 1 3 2 0 1 3
3 – 5 3 3 – 5 3
2011 Baker & Petsche Publishing LLCMathWarm-Ups.com Version 1
Series 1 P5Countdown to the Algebra I EOCTM
1
The length of a particular rectangular kitchencountertop is 5 feet longer than its width, w. Theperimeter, P, of this countertop is best describedby which equation?
Colton prepares tax returns for individuals. The amount he charges can be represented by thefunction c = 18h + 50, where h represents the number of hours he takes to complete a tax returnand c represents the total charge to prepare the tax return. He plans to change the amount chargedper tax return. The new cost for preparing a tax return can be represented by the functionc = 18h + 35. What will be the effect of this change on the amount charged to prepare a tax return?
Which of the expressions below is equivalent to
– 4x (3x + 5y) + 6xy – 2x (y + 4)?
5.A.9.D2
2.A.3.A
3
1.A.1.D
5
2.A.4.B
3.A.6.F
If – 3 is one of the solutions to the quadraticequation x2 + x + c = 0, where c represents anunknown constant, what is the value of c?
Open/Gridded Response2.A.4.A
8
5.A.10.A
4
Between 2000 and 2003D
Between 1998 and 2002C
Between 1996 and 2004B
A Earlier than 1997
C P = (w + 5) + wA P = (w + 5)w
B P = (w + 5)w + w D P = 2(w + 5) + 2w
A pet store owner plans to order from 50 to 80tropical fish to restock his tanks. The prices ofthe fish range from $2.25 to $5.25 each. If thefish supplier charges a shipping fee of $0.75 perfish, which of the following is not a reasonableprice for the fish, including shipping?
4.A.7.C
6
C The amount he charges per hour will decrease by $15.
D The amount he charges per hour will increase by $15.
A The amount he charges for each tax return will decrease by $15.
B The amount he charges for each tax return will increase by $15.
A $195 B $295 C $395 D $495
D – 12x2 – 24xy + 8xB – 12x2 + 24xy + 8x
A – 12x2 + 5y + 4xy + 4 – 12x2 – 16xy – 8xC
5A 9B 10C 11D
Year
Annual CD Album Sales
Tota
lnu
mber
(in
mill
ions)
400
0
200
600
800
n
c
A B C D
7
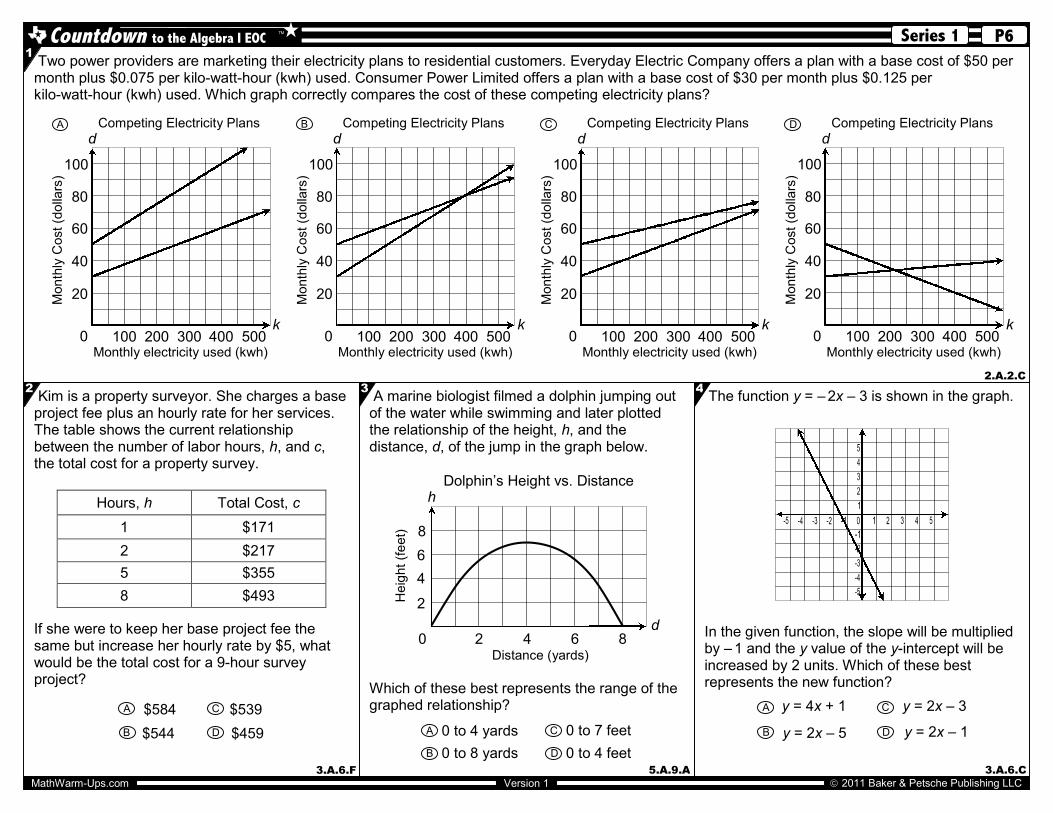
Kim is a property surveyor. She charges a baseproject fee plus an hourly rate for her services.The table shows the current relationshipbetween the number of labor hours, h, and c,the total cost for a property survey.
Hours, h Total Cost, c
1 $171
2 $217
5 $355
8 $493
If she were to keep her base project fee thesame but increase her hourly rate by $5, whatwould be the total cost for a 9-hour surveyproject?
The function y = – 2x – 3 is shown in the graph.
In the given function, the slope will be multipliedby – 1 and the y value of the y-intercept will beincreased by 2 units. Which of these bestrepresents the new function?
Two power providers are marketing their electricity plans to residential customers. Everyday Electric Company offers a plan with a base cost of $50 permonth plus $0.075 per kilo-watt-hour (kwh) used. Consumer Power Limited offers a plan with a base cost of $30 per month plus $0.125 perkilo-watt-hour (kwh) used. Which graph correctly compares the cost of these competing electricity plans?
1
2.A.2.C
3.A.6.F
2A marine biologist filmed a dolphin jumping out
of the water while swimming and later plottedthe relationship of the height, h, and thedistance, d, of the jump in the graph below.
Which of these best represents the range of thegraphed relationship?
5.A.9.A
3 4
3.A.6.C 2011 Baker & Petsche Publishing LLCMathWarm-Ups.com Version 1
Series 1 P6Countdown to the Algebra I EOCTM
0 to 4 feetD
0 to 7 feetC
0 to 8 yardsB
A 0 to 4 yards
A $584
$544B
C $539
D $459 B y = 2x – 5 D y = 2x – 1
y = 2x – 3CA y = 4x + 1
k
A Competing Electricity Plans
Monthly electricity used (kwh)
Month
lyC
ost(d
olla
rs)
0
20
40
60
80
100
100 200 300 400 500
dB Competing Electricity Plans
Monthly electricity used (kwh)
Month
lyC
ost(d
olla
rs)
0
20
40
60
80
100
100 200 300 400 500k
dC Competing Electricity Plans
Monthly electricity used (kwh)
Month
lyC
ost(d
olla
rs)
0
20
40
60
80
100
100 200 300 400 500k
dD Competing Electricity Plans
Monthly electricity used (kwh)
Month
lyC
ost(d
olla
rs)
0
20
40
60
80
100
100 200 300 400 500k
d
Dolphin’s Height vs. Distance
Distance (yards)
Heig
ht(f
eet)
4
2
6
8
0 2 4 6 8d
h

A drink company conducted a survey. It asked15 people how many sports drinks theypurchase each week. Look at the graph.
What is the relationship between a person’s ageand how many sports drinks he or shepurchases weekly?
Use the grid provided to graph y ≤ x + 1.
For this inequality, which of these coordinatepoints is a solution?
The International Space Station orbits the Earthat a constant speed with respect to time asshown on the graph.
Which statement best describes the meaning ofthe slope of the line representing the situation?
For the equation 3x2 – 9x – 54 = 0, what is thesolution set?
2011 Baker & Petsche Publishing LLCMathWarm-Ups.com Version 1
Series 1 P7Countdown to the Algebra I EOCTM
1
Alberto was asked to write the equationy = 2x – 5 using function notation. Which of thefollowing function notations would bestrepresent this equation?
2.A.2.D2
2.A.4.C
5
3.A.6.B6
5.A.10.A
C f(2) = – 5
f(– 5) = 2Df(2x) = – 5B
f(x) = 2x – 5A
The space station travels at a speed ofapproximately 28,000 kilometers per hour.
C
The space station travels at a speed ofapproximately 7,000 kilometers per hour.
B
A The space station travels at a speed ofapproximately 14,000 kilometers per hour.
The space station travels at a speed ofapproximately 20,000 kilometers per hour.
D
0 134
12
14
78
58
38
18
Time (hours)
Dis
tance
Tra
ve
led
(in
thousan
ds
ofkilo
mete
rs)
12
16
4
8
10
14
2
6
18
d
t
Space Station
D There is a constant correlation between anindividual’s age and the number of sportsdrinks he or she purchases.
B The younger a person is the more sportsdrinks he or she buys weekly.
A The older a person is the more sportsdrinks he or she buys weekly.
There is no correlation between anindividual’s age and the number of sportsdrinks he or she purchases.
C
4
4.A.7.B
23
(2, – 3)B(0, 2)A (– 3, 1)C (4, 5)D
Which equation best represents the relationshipbetween the corresponding values of x and ygiven in the table?
x y
– 4 019
– 3 015
02 – 5
05 – 17
3
3.A.5.C
x
y
A y = 2x + 27
y = – x + 15B D y = – 4x + 3
C y = – 5x – 1
Sports Drink Weekly Purchases
Person’s Age (years)
Num
ber
ofsp
ort
sdrinks
10 20 30 400
4
2
6
8
{3, 6}C{– 3, 6}A
{– 3, – 6}B {3, – 6}D

2011 Baker & Petsche Publishing LLCMathWarm-Ups.com Version 1
Series 1 P8Countdown to the Algebra I EOCTM
Alyssa wants to buy a computer for $600. If shepays $75 now and $25 each month, she can payfor it in 21 months. If she were to pay $75 nowand $35 each month, how would the number ofpayments change?
3.A.6.F
1
B She would make 3 fewer monthly payments.
C She would make 5 fewer monthly payments.
A She would make 15 fewer monthly payments.
D She would make 6 fewer monthly payments.
The graph of a system of linear equations isshown.
Which of these is a solution for this system ofequations?
4.A.8.B
2
(3, – 4)A
(0, –5)B
(2, – 3)C
(0, 2)D
x
y
(–3, –6)
(–6, –7)
(–1, 4)
(–3, 8)
Which of the following is equivalent to
3x 4y 16?
2.A.4.A
6
B y x + 443
C y x + 443
D y x – 434
34
A y x 4
The graph of a quadratic function is shown.
Which statement is not true about this graph?
4
5.A.9.D
x
y
A local sports stadium must collect a 9.25%sales tax on all tickets that it sells. The sales taxcollected on an item is a function of the item’sprice. Which of the following is the dependentquantity in this situation?
3
1.A.1.A
A The sales tax rate
B The sales tax amount for a ticket
The number of seats in the stadiumD
The price of each ticketC
Which of the following statements bestdescribes the situation if the slope of equation
y = x – 5 is changed to and the
y-intercept is changed to (0, 5)?
5
34
–34
x
y
The original line is parallel to the new line.D
The original line and the new line have thesame x-intercept.
B
A The original line and the new line have thesame y-intercept.
The original line is perpendicular to the newline.
C
The graph’s line of symmetry is the y-axis.C
The graph has a y-intercept of (0, – 7.5).D
A The graph has an x-intercept at (– 3, 0).
The graph has a minimum point at (1, – 8).B
3.A.6.C
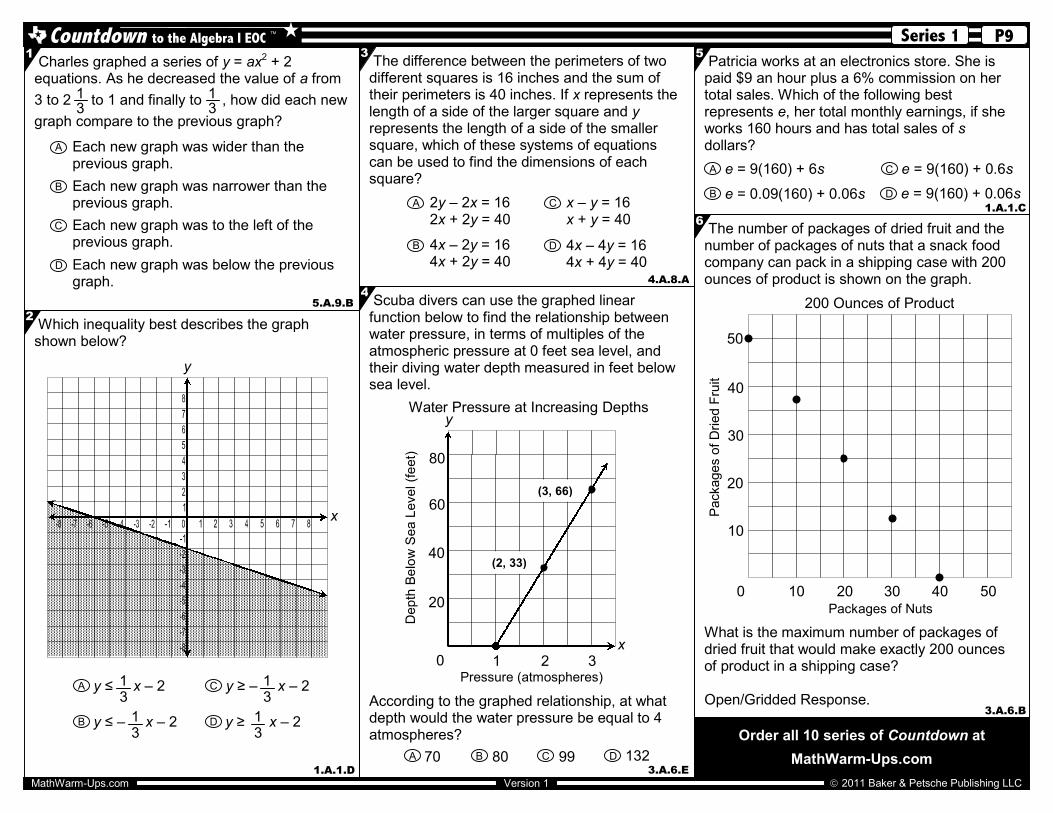
Which inequality best describes the graphshown below?
Scuba divers can use the graphed linearfunction below to find the relationship betweenwater pressure, in terms of multiples of theatmospheric pressure at 0 feet sea level, andtheir diving water depth measured in feet belowsea level.
According to the graphed relationship, at whatdepth would the water pressure be equal to 4atmospheres?
x
y
The difference between the perimeters of twodifferent squares is 16 inches and the sum oftheir perimeters is 40 inches. If x represents thelength of a side of the larger square and yrepresents the length of a side of the smallersquare, which of these systems of equationscan be used to find the dimensions of eachsquare?
Patricia works at an electronics store. She ispaid $9 an hour plus a 6% commission on hertotal sales. Which of the following bestrepresents e, her total monthly earnings, if sheworks 160 hours and has total sales of sdollars?
The number of packages of dried fruit and thenumber of packages of nuts that a snack foodcompany can pack in a shipping case with 200ounces of product is shown on the graph.
What is the maximum number of packages ofdried fruit that would make exactly 200 ouncesof product in a shipping case?
Open/Gridded Response.
2011 Baker & Petsche Publishing LLCMathWarm-Ups.com Version 1
Series 1 P9Countdown to the Algebra I EOCTM
3 5
3.A.6.B
3.A.6.E
4
1.A.1.D
2
B y ≤ – x – 213
C y ≥ – x – 213
y ≤ x – 2A 13
D y ≥ x – 213
Charles graphed a series of y = ax2 + 2equations. As he decreased the value of a from
3 to 2 to 1 and finally to , how did each new
graph compare to the previous graph?
1
5.A.9.B
13
13
D 4x – 4y = 164x + 4y = 40
A 2y – 2x = 162x + 2y = 40
B 4x – 2y = 164x + 2y = 40
C x – y = 16x + y = 40
4.A.8.A
Packages of Nuts
Packages
ofD
ried
Fru
it
200 Ounces of Product
10 20 30 40 500
50
30
40
10
20
e = 0.09(160) + 0.06sB e = 9(160) + 0.06sD
e = 9(160) + 0.6sCe = 9(160) + 6sA
Water Pressure at Increasing Depths
0 1 2 3
20
40
60
80
Pressure (atmospheres)
Depth
Be
low
Sea
Level(f
eet)
y
x
(3, 66)
(2, 33)
D 13299CB 8070A
B Each new graph was narrower than theprevious graph.
D Each new graph was below the previousgraph.
A Each new graph was wider than theprevious graph.
Each new graph was to the left of theprevious graph.
C
1.A.1.C6
Order all 10 series of Countdown at
MathWarm-Ups.com


