COUNT RATE EFFECTS ON PEAK SHAPE AND THROUGHPUT IN DIGITAL …
11
Romanian Reports in Physics, Vol. 64, No. 4, P. 957–967, 2012 NUCLEAR PHYSICS COUNT RATE EFFECTS ON PEAK SHAPE AND THROUGHPUT IN DIGITAL AND ANALOG GAMMA RAY SPECTROMETRY A. DUMITRESCU 1 , GH. CǍTA-DANIL 1,2 1 “Politehnica” University of Bucharest, Physics Department, Splaiul Independenţei 313, 060042, Bucharest, Romania, E-mail: [email protected] 2 ”Horia Hulubei” National Institute for Physics and Nuclear Engineering, Bucharest-Mǎgurele, Romania, E-mail: [email protected] Received February 7, 2012 Abstract. A comparative study of the count rate effects on peak shapes and throughput was performed using a digital and a conventional analogical gamma-ray spectrometer. Low (25%) and medium (60%) efficiency HPGe detectors were used. FWHM, FW1/5M, peak shape ratio and acquisition statistics were analyzed and compared. Key words: digital, gamma-ray, spectrometry, LN2 free cooling, HPGe, peak shape. 1. INTRODUCTION Developments of modern HPGe detectors using liquid nitrogen-free cooling methods increased the number of possible applications for high resolution gamma ray spectrometry. The use of mechanical cooling for these detectors degraded the spectroscopic performance at low energies in favor of application flexibility and customization [1]. In recent years, developments in digital spectroscopy signal processing made possible the customization of the acquisition environment through digital signal shaping and processing. This allows the user to optimize performance beyond the limitations of equivalent analogical solutions in specific applications [2, 3]. In order to determine the importance of acquisition parameter optimization and their effects on energy resolution and peak shape, in the present work, experiments were conducted using sets of purpose optimized parameters. Gamma-ray peak shape analysis is an important issue to be addressed in recent experimental spectroscopy [4]. In the present paper an analysis of count rate effects on energy resolution, peak shape and throughput is presented. The study compares peak shape and throughput characteristics for a digital desktop spectrometer and an analogical counterpart. Another goal of the presented experiments was determining the influence of detector efficiency in the comparison of the two spectrometers. Two high purity
Transcript of COUNT RATE EFFECTS ON PEAK SHAPE AND THROUGHPUT IN DIGITAL …

Romanian Reports in Physics, Vol. 64, No. 4, P. 957–967, 2012
NUCLEAR PHYSICS
COUNT RATE EFFECTS ON PEAK SHAPE AND THROUGHPUT IN DIGITAL AND ANALOG GAMMA RAY SPECTROMETRY
A. DUMITRESCU1, GH. CǍTA-DANIL1,2
1 “Politehnica” University of Bucharest, Physics Department, Splaiul Independenţei 313, 060042, Bucharest, Romania, E-mail: [email protected]
2”Horia Hulubei” National Institute for Physics and Nuclear Engineering, Bucharest-Mǎgurele, Romania, E-mail: [email protected]
Received February 7, 2012
Abstract. A comparative study of the count rate effects on peak shapes and throughput was performed using a digital and a conventional analogical gamma-ray spectrometer. Low (25%) and medium (60%) efficiency HPGe detectors were used. FWHM, FW1/5M, peak shape ratio and acquisition statistics were analyzed and compared.
Key words: digital, gamma-ray, spectrometry, LN2 free cooling, HPGe, peak shape.
1. INTRODUCTION
Developments of modern HPGe detectors using liquid nitrogen-free cooling methods increased the number of possible applications for high resolution gamma ray spectrometry. The use of mechanical cooling for these detectors degraded the spectroscopic performance at low energies in favor of application flexibility and customization [1]. In recent years, developments in digital spectroscopy signal processing made possible the customization of the acquisition environment through digital signal shaping and processing. This allows the user to optimize performance beyond the limitations of equivalent analogical solutions in specific applications [2, 3]. In order to determine the importance of acquisition parameter optimization and their effects on energy resolution and peak shape, in the present work, experiments were conducted using sets of purpose optimized parameters.
Gamma-ray peak shape analysis is an important issue to be addressed in recent experimental spectroscopy [4]. In the present paper an analysis of count rate effects on energy resolution, peak shape and throughput is presented. The study compares peak shape and throughput characteristics for a digital desktop spectrometer and an analogical counterpart.
Another goal of the presented experiments was determining the influence of detector efficiency in the comparison of the two spectrometers. Two high purity
A. Dumitrescu, Gh. Cǎta-Danil 2 958
germanium detectors were used for data acquisition, one with low efficiency (25%) and one with medium efficiency (60%). The detectors were cooled by using mechanical coolers. The measurements were conducted over a spectrum of count rates ranging from ~1 kHz up to ~20 kHz. The peaks to be analyzed were chosen in the 50 keV–1.5 MeV energy range. The recorded data showed notable differences between the two types of spectrometers both in terms of throughput and peak shape. A discussion of the obtained results is presented in Sections 4 and 5 of this paper.
2. ANALOG AND DIGITAL SPECTROMETERS
Digital gamma-ray spectrometers have significantly improved since their introduction about two decades ago. They are functionally different from their analogical counterparts both in structure and in operation [3, 5].
The main two architectural differences between these spectrometric systems are the point where digitization occurs in the signal chain and the way the signal is filtered [5]. The difference in signal filtering translates into higher flexibility in acquisition customization for the digital system. This allows the user to optimize the acquisition parameters of digital spectrometers in order to better suit the application.
In a digital system the signal processing starts by digitizing the analogical signal received from the detector’s preamplifier, using an Analog to Digital Converter (ADC) [5, 6]. After the signal has been digitized, the stream from the ADCs is sent to a real time processing unit. This unit performs digital filtering for the incoming stream of data. The key difference from analogical signal filtering is in the type of filter used. Digital circuits are more suited for the implementation of finite impulse response filters, and in the case of gamma-ray spectroscopy, a trapezoidal filter [7, 8, 10].
The digital system’s filter uses several timing parameters (L and G for each of the two filters), a signal threshold for the fast filter, and other standard parameters [7, 8]. The purpose of these parameters is to offer a large degree of flexibility in data acquisition. The different structure and functionality of analogical and digital spectrometers reflect finally in the shape of the energy spectra. In the present study are compared the two types of spectrometers, pointing out the differences in acquisition results through a range of input count rates of practical interest.
3. EXPERIMENT SETUP AND DATA COLLECTION METHODOLOGY
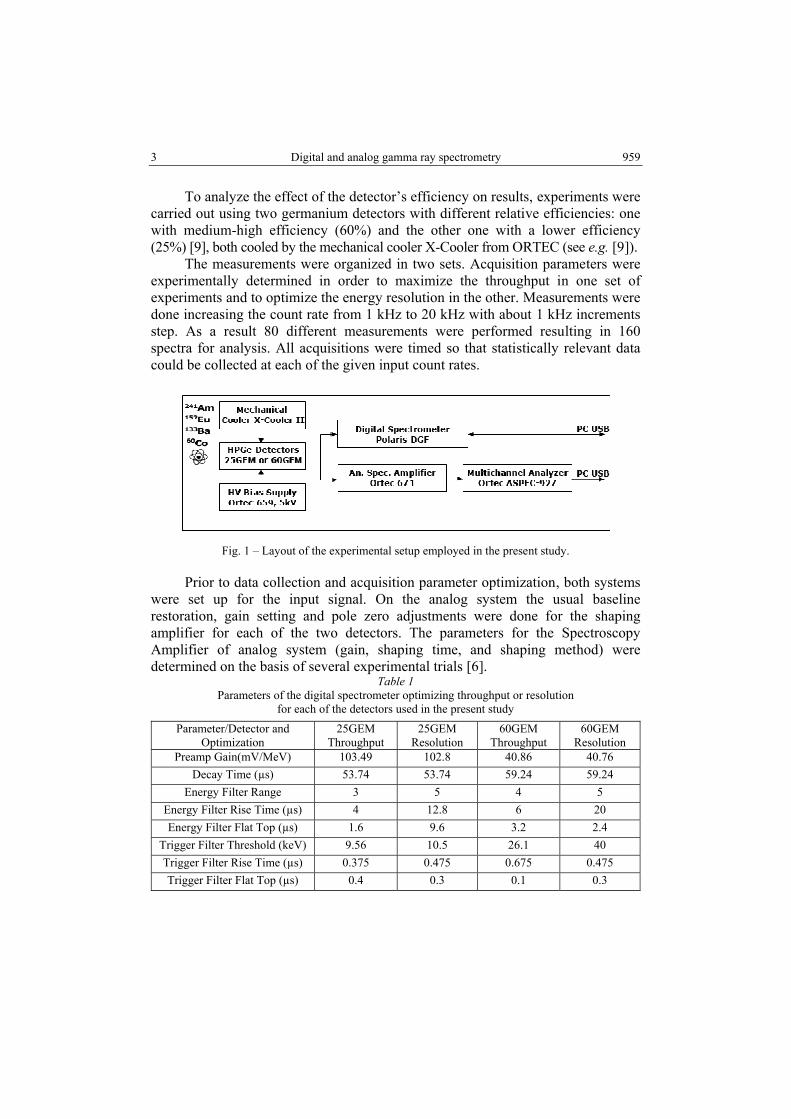
The gamma-ray energies analyzed in this work were 59.5keV, 121.8keV, 356keV, 778keV, 1173.2keV, 1332.5keV and 1408.1keV, obtained using a stack of four radioactive spectroscopic sources (Fig. 1) with activities ranging between 16 to 47 kBq.
3 Digital and analog gamma ray spectrometry 959
To analyze the effect of the detector’s efficiency on results, experiments were carried out using two germanium detectors with different relative efficiencies: one with medium-high efficiency (60%) and the other one with a lower efficiency (25%) [9], both cooled by the mechanical cooler X-Cooler from ORTEC (see e.g. [9]).
The measurements were organized in two sets. Acquisition parameters were experimentally determined in order to maximize the throughput in one set of experiments and to optimize the energy resolution in the other. Measurements were done increasing the count rate from 1 kHz to 20 kHz with about 1 kHz increments step. As a result 80 different measurements were performed resulting in 160 spectra for analysis. All acquisitions were timed so that statistically relevant data could be collected at each of the given input count rates.
Fig. 1 – Layout of the experimental setup employed in the present study.
Prior to data collection and acquisition parameter optimization, both systems were set up for the input signal. On the analog system the usual baseline restoration, gain setting and pole zero adjustments were done for the shaping amplifier for each of the two detectors. The parameters for the Spectroscopy Amplifier of analog system (gain, shaping time, and shaping method) were determined on the basis of several experimental trials [6].
Table 1 Parameters of the digital spectrometer optimizing throughput or resolution
for each of the detectors used in the present study Parameter/Detector and
Optimization 25GEM
Throughput 25GEM
Resolution 60GEM
Throughput 60GEM
Resolution Preamp Gain(mV/MeV) 103.49 102.8 40.86 40.76
Decay Time (µs) 53.74 53.74 59.24 59.24 Energy Filter Range 3 5 4 5
Energy Filter Rise Time (µs) 4 12.8 6 20 Energy Filter Flat Top (µs) 1.6 9.6 3.2 2.4
Trigger Filter Threshold (keV) 9.56 10.5 26.1 40 Trigger Filter Rise Time (µs) 0.375 0.475 0.675 0.475 Trigger Filter Flat Top (µs) 0.4 0.3 0.1 0.3

A. Dumitrescu, Gh. Cǎta-Danil 4 960
On the digital system, the optimization of acquisition parameters was done through the software command interface of the Polaris DGF [7]. The acquisition parameters (preamp gain, decay time, rise time, flat top, trigger threshold presented in Table 1) were set up by monitoring the signal using the integrated software oscilloscope, and analyzing the resulting test spectra. Each detector and each optimization required a different set of acquisition parameters.
The preamp gain was set up according to the dynamic energy range of the experiments (50 keV to 1.5 MeV). By choosing the dynamic range of the acquisition a software routine sets the preamp gain so that the chosen number of analysis channels fits the selected energy range. The preamplifier decay time is used to correct the energy of a pulse sitting on the falling slope of a previous pulse (pileup effects [7, 8]). A first estimate of the decay time was found using the dedicated software routine. A more accurate value was experimentally determined by acquiring test spectra at high count rates and examining the changes produced by this parameter in energy resolution.
The rise time of the energy filter is primarily responsible for energy resolution [7]. Longer rise times result in better resolution but lower throughput. The values for the rise time were obtained by searching for the time values that lead to the lowest FWHM for the 1332.5 keV 60Co peak. The flat top needs to be wide enough to accommodate the longest typical signal rise time from the detector [7]. The values for the flat top of this filter were obtained in the same way.
The trigger threshold should be set as low as possible for best resolution [7, 10]. The threshold values for these sets of experiments were set just above the noise peaks. The parameters of the trigger filter were chosen experimentally to maximize pileup detection and rejection and also to minimize the noise level by discarding events associated with noise present in the input signal.
4. RESULTS AND DISCUSSION ON THROUGHPUT
The throughput for digital systems is usually higher than in analogical systems because the process of event acquisition is different [3, 7]. Quantitatively, dead time is used to compare throughput between devices and experiments [6].
For each experiment dead time was computed as a sum of all the dead times associated with each event. The resulting dead times for each set of experiments were plotted in Fig. 2 as percentages of real time against input count rate. Two graphs were made in order to analyze and compare device performance for both detectors: one for energy resolution optimization (Fig. 2, panel 1) and one for event throughput optimization (Fig. 2, panel 2).
The figures show that dead time rises with input count rate in an almost linear fashion. This is normal because the more incoming events are processed the bigger the load on the processing device and consequently, the larger dead times

5 Digital and analog gamma ray spectrometry 961
due to processing. The experimental set optimized for energy resolution produced about 20%–25% more dead time for the higher count rates compared to the one optimized for throughput. At low count rates there is 5–10% less dead time for the throughput optimized systems [10]. It can be concluded from Fig. 2 that throughput optimization for both spectrometry systems yields lower dead times compared to energy resolution optimizations.
The analogical spectrometer produced slightly better throughput compared to the digital one in the case of energy resolution optimization for both detectors as shown in Fig. 2, panel 1. Generally, the advantage of a digital spectrometer is a better throughput compared to analogical counterparts. The energy resolution optimization comes at the cost of complex and time consuming calculations for pileup rejection, baseline restoration and signal filtering. Dead time in the case of the digital spectrometer acquiring data through a small efficiency detector (25GEM) is significantly lower (Fig. 2, panel 2) than all previous cases at all count rates. The rest of experimental sets using this optimization produced roughly the same throughput. It can be concluded that throughput optimization of the digital device coupled with the use of a smaller detector yielded significantly better throughput and about double the throughput compared to the energy resolution optimized experiments. This is the result both of trading throughput for energy resolution on the digital spectrometer and the use of a smaller efficiency detector which is less susceptible to noise factors.
Fig. 2 – Statistics for acquisitions; panel 1–Dead Time in resolution optimization; panel 2–Dead Time
in resolution optimization; panel 3–Output count rate vs. input count rate.

A. Dumitrescu, Gh. Cǎta-Danil 6 962
A better view of the difference between resulting throughputs for the two sets of optimizations can be obtained by plotting output count rate (OCR) against input count rate (ICR) for the digital spectrometer (Fig. 2, panel 3). Optimization of the digital spectrometer for throughput results in significantly increased throughput performance, effectively doubling the number of processed events. It can be concluded that using a smaller efficiency detector results in better throughput. Both detectors lead to similar throughput while using the energy resolution optimization.
5. RESULTS AND DISCUSSION ON PEAK SHAPE
Energy resolution and peak shape analysis was done for each peak at each of the considered count rates by analyzing the measured spectra.
In the experimental spectra the background was subtracted then the peaks were fitted with Gaussian functions. For each peak FWHAM and FW1§/5M values were extracted and employed to evaluate the peak shape ratio defined in the present work as the ratio between FWHM and FW1/5M. The variation model of peak shape is presented in this section and plotted against the input count rate, for each of the analyzed peaks.
The first experimental set recorded spectra using the analog spectrometer, the 25GEM detector and an energy resolution optimized setup for acquisition parameters. Here the FWHM is proportional to peak energy and also increases with input count rate. These results were expected as FWHM of the Gaussian fitting a gamma ray peak is proportional to the gamma-ray's total absorption peak’s energy. With increasing input count rate, the peak broadens [5] and thus FWHM of the fitting Gaussian increases. The same observations can be made about FW1/5M. For the peaks located in the low energy range of the spectrum the peak shape ratio decreases more with input count rate (Fig. 3, panel 1). This means that the base of those peaks broadens more with input count rate increase compared to the high energy peaks in the same experimental set. Also it can be concluded for this set of experiments, that while FWHM increases with ICR at the same rate for all the peaks considered, FW1/5M increases at different rates depending on the energy of the gamma-ray peak (see resulting peak shapes of 59 keV, 121 keV and 356 keV peaks from Fig. 3). It is also noticeable that FW1/5M increases faster with count rate than FWHM leading to a descending trend for the peak shape ratio plotted against ICR. The best resolution was obtained by using the 25GEM detector while acquiring data through the analogical resolution optimized system. This was expected because analogical spectrometers generally offer better energy resolution than a digital desktop gamma spectroscopy system using low efficiency detectors [3].
The second experimental set recorded spectra using the analog spectrometer, the 25GEM detector and throughput optimized parameters. Results are shown in Fig. 3, panel 2. From this plot can be observed that FWHM and FW1/5M increase with ICR and are proportional to peak energy. Both peak measurements show much smaller increases with input count rate than in the case of resolution

7 Digital and analog gamma ray spectrometry 963
optimization. If the FWHM of all the peaks increased throughout the 20 kHz range, for the energy resolution optimization experiment, with about 1keV, here the FWHM increases with approx. 0.5 keV. The same observation goes for FW1/5M which in the first set increased with about 1.5 keV, while in the second set increased with about 0.7 keV. Correlated with the small FWHM and FW1/5M values obtained in both cases this result shows that for the analogical spectrometer acquiring data from a small detector, throughput optimization yields better resolution for a large ICR range. The shape ratio is preserved much better with increasing ICRs than the first experimental set (Fig. 3, panel 1 and 2). The shape of the Gaussians does not present base broadening for the lower energy peaks (59 keV, 121 keV and 356 keV) like in the first set. Variations with count rate of the peak shape ratio are under 0.02 compared to the almost 0.1 variations in the peak shape ratio presented in Fig. 3, panel 1. This shows that the shape of the peaks in the spectra obtained here, are much more stable with ICR increase.
Fig. 3 – Peak shape ratio for the 25GEM detector experiments set; panel 1–analog, resolution
optimized; panel 2–analog, throughput optimized; panel 3–digital, resolution optimized; panel 4–digital, throughput optimized (common legend presented in panel 2).
The third experimental set recorded spectra by using the digital spectrometer, the 25GEM detector and energy resolution optimized parameters. Here, FWHM and FW1/5M don’t increase with ICR at the same rate for all the considered peaks.
A. Dumitrescu, Gh. Cǎta-Danil 8 964
While FWHM of low energy peaks increases in value with about 2 keV the FWHM for the high energy peaks increases in value with only approx. 1.2–1.5 keV throughout the 20 kHz ICR range. At low ICR, FWHM and FW1/5M values are comparable to the ones obtained in the first experimental set. The values show a significant increase at high count rates compared to the analog device (0.5–1.5 keV difference at 20 kHz). It can be concluded that energy resolution is better, especially at high count rates on the analog spectrometer.
The lower energy peaks (59 keV, 121 keV and 356 keV) suffer significant base broadening in the middle of the ICR range with a maximum around 12 kHz (Fig. 3, panel 3). This means that for ICRs in the 5 kHz–10 kHz interval, these peaks broaden and then, progressing to the 12 kHz–17 kHz the basis of the peaks narrows. It should be emphasized that this result could not be caused by a systematic measurement error as non sequential count rates were selected from the ICR range for each experiment. Further analysis on this issue is underway. The shape of high energy peaks is more stable with ICR compared to the case of the analog spectrometer.
The fourth experimental set recorded spectra by using the digital spectrometer, the 25GEM detector and throughput optimized acquisition parameters. While the analogical spectrometer has slightly better performance with respect to energy resolution, the digital spectrometer shows less increase in FWHM and FW1/5M over the 20 kHz ICR range. Overall, energy resolution in the case of throughput optimization on this detector is very similar between the two spectrometers. Peak shape ratio analysis shows similar results to the second experimental set (Fig. 3, panels 2 and 4). The peaks keep their shape ratio over the 20 kHz ICR range. It can be concluded that using throughput optimization similar results are obtained on both spectrometers.
The fifth experimental set collected spectra using the analog spectrometer, the 60GEM detector and energy resolution optimized acquisition parameters. Here the increase both in FWHM and FW1/5M with count rate is more significant compared to the measurements done with the 25GEM detector. The digital acquisition system offers slightly better resolution at lower energies. At higher energies the analogical system gains a slight advantage compared to the digital system with lower FWHM. Regarding peak shape ratio, results similar to the first experimental set were obtained (Fig. 4, panel 1). While FWHM increases with ICR at the same rate for all the considered peaks, FW1/5M increases at different rates depending on the energy of the gamma-ray peak (see peak at 121 keV). Here FW1/5M increases faster than FWHM leading to a clear descending trend for the peak shape ratio plotted against ICR. This is due to the fact that the larger volume of this detector favors creation of pileup events at the input of the analog spectrometer which lead to broadening of the peak’s base. The base broadening trend over the higher ICRs is more prominent here than in all experimental sets (about a 0.15 difference in value at large count rates compared to small ones).

9 Digital and analog gamma ray spectrometry 965
Fig. 4 – Peak shape ratio for the 60GEM detector experiments set; panel 1–analog, resolution
optimized; panel 2–analog, throughput optimized; panel 3–digital, resolution optimized; panel 4–digital, throughput optimized (common legend presented in panel 2).
The sixth experimental set collected spectra using the analog spectrometer, the 60GEM detector and throughput optimized parameters. FWHM and FW1/5M are similar to those obtained using the other detector in the second set. Both FWHM and FW1/5M show much smaller increases with ICR than in the case of resolution optimization in the previous experimental set. While the peak shape ratio obtained in the second experimental set presented a horizontal trend, here there is a clear descending trend with ICR increase (Fig. 4, panel 2). This is caused by the larger volume of this detector favoring creation of pileup events at the input of the analog spectrometer. This leads to broadening in the peak’s base. The phenomenon is not as accentuated as in the previous experimental set (about a 0.06 difference in value at large count rates compared to small count rates).
The seventh experimental set analyzed data using the digital spectrometer, the 60GEM detector and an energy resolution optimized setup for acquisition parameters. The results are shown in Fig. 4, panel 3. The most notable difference from the sixth experimental set is the fact that both FWHM and FW1/5M show much smaller increases with ICR. These results show better energy resolution over the entire ICR range compared with the sixth experimental set when the analog

A. Dumitrescu, Gh. Cǎta-Danil 10 966
spectrometer was optimized for resolution. This result shows that on a larger efficiency detector, the digital spectrometer performs better than its analog counterpart regarding energy resolution. This was an unlikely result as most spectrometers offer better resolution when processing a smaller number of events associated with smaller efficiency detectors [6]. Peak shape ratio was preserved to a degree similar to the results obtained with the analog spectrometer on the 25GEM detector (Fig. 3, panel 3). Peaks present negligible base broadening compared to the analog spectrometer acquiring data with the 60GEM detector.
The eighth set of spectra was produced by using the digital spectrometer, the 60GEM detector and throughput optimized acquisition parameters. A notable difference from all other experimental sets occurs in the fact that both FWHM and FW1/5M show the smallest increases with ICR from all sets of data. This result confirms the fact that on a larger efficiency detector, the digital spectrometer performs better than its analog counterpart regarding peak shapes. Peak shape ratio (Fig. 4, panel 4) was preserved to a degree similar to the results obtained with the analog spectrometer on the 25GEM detector (Fig. 3, panel 4). The shape of the Gaussians presents negligible base broadening compared to the analog spectrometer acquiring data through the 60GEM detector. Compared to the equivalent 25GEM experimental set, the shape ratio is preserved over the 20 kHz range in the same fashion.
6. CONCLUSIONS
An experimental comparative study on ICR’s effects on peak shape and throughput was done using an analog and a digital spectrometer, two detectors of different efficiencies and two optimization modes.
Eight experimental sets were measured and the results showed that the best results for energy resolution were obtained using 25GEM detector, an energy resolution optimization and the analog spectrometer. Several experimental sets showed that acquisition parameters optimized for resolution can cause peak base broadening. An anomalous effect was observed for the third experimental set when the peak shape ratio value decreased and then increased with ICR, for low energy gamma peaks. This issue is currently subject for further investigation. Generally, throughput optimization yielded more stable peaks with low variations in the values of the FWHM, FW1/5M and peak shape ratio along the investigated ICR range. The digital spectrometer produced better results, compared to the analog one, when used with the 60GEM detector. The throughput optimized digital spectrometer preserved the quality of FWHM, FW1/5 and peak shape ratio throughout the 20 kHz ICR range. In the future developments we expect to be able to improve the performances of the digital spectrometer due to its much higher flexibility in handling detector signals, comparatively with the classical, analog one.

11 Digital and analog gamma ray spectrometry 967
Acknowledgements. The authors acknowledge the financial support within the project POSDRU, PRODOC, financed through the contract POSDRU/88/1.5/S/61178.
REFERENCES
1. R.M. Keyser, R. D. Blingham, T. R. Towmey, Improved performance in germanium detector gamma-spectrometers based on digital signal processing, Journal of Radioanalytical and Nuclear Chemistry, 276, 3, 567–575 (2008).
2. R. GRZYWACZ, Applications of digital pulse processing in nuclear spectroscopy, Nuclear Instrum. Meth. Phys. Res. B 204, 649–659 (2003).
3. D. T. Vo, P. A. Russo, T. E. Sampson, Comparison Between Digital Gamma-Ray Spectrometer (DSPec) and Standard Nuclear Instrumentation Methods (NIM) Systems, LA-13393-MS, UC-706 and UC-700, Los Alamos National Laboratory, 1998.
4. A. H. Fatah, A. H. Ahmed, Analysis of Gamma-Ray Spectra Using Levenberg-Marquardt Method, World Academy of Science, Engineering and Technology, 73, 2011.
5. G.F. Knoll, Radiation Detection and Measurement Third Edition, John Wiley & Son, Inc., New York, 2000.
6. W. R. Leo, Techniques for Nuclear and Particle Physics Experiments, A How-to Approach, Springer-Verlag, Berlin, 1994.
7. XIA LLC, Digital Gamma Finder (DGF) Polaris –User’s Manual, Version 3.40, Rev. 13956, 2009. 8. Wuyun Xiao, Yixiang Wei, Xianyun Ai, Qi Ao, System simulation of digital pulse Spectrometer,
Nuclear Instrum. Meth. Phys. Res. A 555, 231–235 (2005). 9. Ortec, GEM Series HPGe Coaxial Detector System, Rev G, U.S.A, 2008. 10. A. Dumitrescu, Comparison of a digital and an analogical gamma spectrometer at low count
rates, U.P.B. Sci. Bull., Series A, 73, 4, 127–138 (2011).