Council for Economic Education 122 East 42 nd Street, Suite 2600 New York, NY 10168 Phone:...
31
Council for Economic Education 122 East 42 nd Street, Suite 2600 New York, NY 10168 Phone: 212-730-7007 or 1-800- 338-1192 Fax: 212-730-1793 www.councilforeconed.org CEE MISSION The mission of the Council for Economic Education is two-fold: To advocate for better and greater school-based economic and personal finance education at the K-12 level; and to educate young people in the United States and around the world, primarily through well prepared teachers, so they may become empowered with economic and financial literacy.
-
Upload
joseph-stanley -
Category
Documents
-
view
214 -
download
0
Transcript of Council for Economic Education 122 East 42 nd Street, Suite 2600 New York, NY 10168 Phone:...

Council for Economic Education122 East 42nd Street, Suite 2600New York, NY 10168Phone: 212-730-7007 or 1-800-338-1192Fax: 212-730-1793 www.councilforeconed.org
CEE MISSIONThe mission of the Council for Economic Education is two-fold: To advocate for better and greater school-based economic and personal finance education at the K-12 level; and to educate young people in the United States and around the world, primarily through well prepared teachers, so they may become empowered with economic and financial literacy.

ELECTION LESSONS © COUNCIL FOR ECONOMIC EDUCATION, NEW YORK, NY
Election Economics:
http://www.econedlink.org/election-lessons/
LESSON 13 – PUBLIC CHOICE: ECONOMICS GOES TO WASHINGTON AND INTO THE VOTING BOOTH

ELECTION LESSONS © COUNCIL FOR ECONOMIC EDUCATION, NEW YORK, NY
Lesson 3: REVISED “Voters and Elections”This lesson is from “Civics and Government: Focus on Economics,” published by CEE.
The lesson discusses the costs and benefits of voting. From analysis, students try to estimate who is more or less likely to vote in an election. Lesson 6: REVISED “Can Election Futures Markets Be More Accurate Than Polls?”
This lesson is from “Civics and Government: Focus on Economics,” published by CEE. The lesson introduces students to polls and the Iowa election markets. Lesson 1: NEW “Margin of Error”
This new lesson introduces students to the concept of margin of error, which is often reported, but rarely understood. Lesson 8: REVISED “Economic Misery and Presidential Elections”
This lesson is from “Civics and Government: Focus on Economics,” published by CEE. The lesson looks at past U.S. elections and finds that economic conditions can play a large role in whether a party retains the presidency. Lesson 13: “Public Choice Goes to Washington and into the Voting Booth”
This lesson is from “Focus: High School Economics,” published by CEE. The lesson conducts mock elections in which students learn why people may decide not to vote in an election.
LESSON 13 – PUBLIC CHOICE: ECONOMICS GOES TO WASHINGTON AND INTO THE VOTING BOOTH
Suggested evening workshop: 4 hours 4:00 to 4:15 Introduction 4:15 to 4:45 Lesson 3: REVISED “Voters and Elections” 4:45 to 5:30 Lesson 6: REVISED “Can Election Futures Markets Be More Accurate Than Polls?” 5:30 to 6:00 Dinner Break 6:00 to 6:45 Lesson 1: “Margin of Error” 6:45 to 7:20 Discussion of Economic Election Issues 7:20 to 7:50 Lesson 8: REVISED “Economic Misery and Presidential Elections” 7:50 to 8:00 Conclusions
LESSON 13 – PUBLIC CHOICE: ECONOMICS GOES TO WASHINGTON AND INTO THE VOTING BOOTH
Agendas
ELECTION LESSONS © COUNCIL FOR ECONOMIC EDUCATION, NEW YORK, NY

Suggested day workshop: 6 hours 9:00 to 9:15 Introduction 9:15 to 10:00 Lesson 13: “Public Choice Goes to Washington and into the Voting Booth” 10:00 to 10:15 Break 10:15 to 10:45 Lesson 3: REVISED “Voters and Elections” 10:45 to 11:30 Lesson 6: REVISED “Can Election Futures Markets Be More Accurate Than Polls?” 11:30 to 12:00 Lunch 12:00 to 12:45 Lesson 1: “Margin of Error” 12:45 to 2:00 Discussion of Economic Election Issues 2:00 to 2:45 Lesson 8: REVISED “Economic Misery and Presidential Elections” 2:45 to 3:00 Conclusions
LESSON 13 – PUBLIC CHOICE: ECONOMICS GOES TO WASHINGTON AND INTO THE VOTING BOOTH
Agendas
ELECTION LESSONS © COUNCIL FOR ECONOMIC EDUCATION, NEW YORK, NY

LESSON 13: PUBLIC CHOICE: ECONOMICS GOES TO WASHINGTON AND INTO THE VOTING
BOOTHVISUALS

Group # Option A Option B
1 $0 $5
2 $0 $5
3 $3 $0
4 $3 $0
5 $5 $0
Benefits of Electing
1. What are the total benefits if option A is chosen?
2. What are the total benefits if option B is chosen?
3. If each of the five groups has the same number of voters, will option A or option B be chosen?
VISUAL 13.2COSTS AND BENEFITS OF VOTING: ELECTION 1
ELECTION LESSONS © COUNCIL FOR ECONOMIC EDUCATION, NEW YORK, NY
LESSON 13 – PUBLIC CHOICE: ECONOMICS GOES TO WASHINGTON AND INTO THE VOTING BOOTH
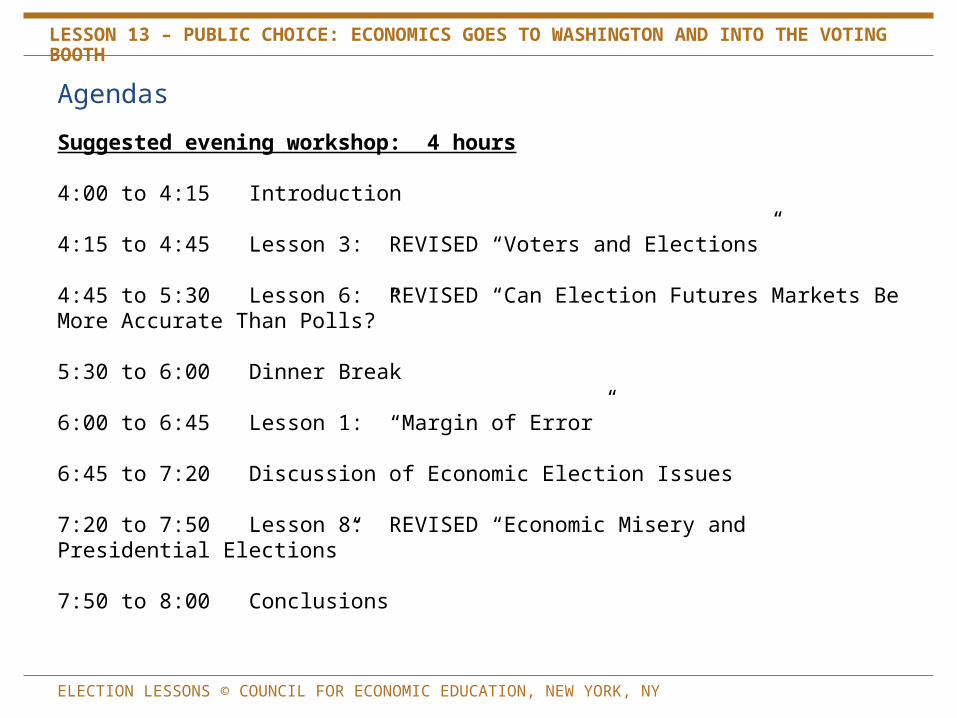
Group # Option A Option B
1 $0 $5
2 $0 $5
3 $3 $0
4 $3 $0
5 $5 $0
Benefits of Electing – Pay $4 to Vote
1. What are the total benefits if option A is chosen?
2. What are the total benefits if option B is chosen?
3. If each of the five groups has the same number of voters, will option A or option B be chosen?
VISUAL 13.2COSTS AND BENEFITS OF VOTING: ELECTION 2
ELECTION LESSONS © COUNCIL FOR ECONOMIC EDUCATION, NEW YORK, NY
LESSON 13 – PUBLIC CHOICE: ECONOMICS GOES TO WASHINGTON AND INTO THE VOTING BOOTH

Group # Option A Option B
1 $0 $10
2 $0 $10
3 $3 $0
4 $3 $0
5 $5 $0
Benefits of Electing
1. What are the total benefits if option A is chosen?
2. What are the total benefits if option B is chosen?
3. If each of the five groups has the same number of voters, will option A or option B be chosen?
VISUAL 13.3COSTS AND BENEFITS OF VOTING: ELECTION 3
ELECTION LESSONS © COUNCIL FOR ECONOMIC EDUCATION, NEW YORK, NY
LESSON 13 – PUBLIC CHOICE: ECONOMICS GOES TO WASHINGTON AND INTO THE VOTING BOOTH

LESSON 3: VOTERS AND ELECTIONS
VISUALS

VISUAL 3.1THE COSTS OF VOTING
1. Dollar costs. No dollar costs may be imposed by fees or taxation. Amendment 24 to the U.S. Constitution rules out dollar costs:
Section 1. The right of citizens of the United States to vote in any primary or other election for President or Vice President, for electors for President or Vice President, or for Senator or Representative in Congress, shall not be denied or abridged by the United States or any state by reason of failure to pay any poll tax or other tax.
2. Other costs. While the Constitution prohibits monetary charges, this does not mean that voting is entirely without costs. Voters will incur opportunity costs. The opportunity cost of voting is what a voter gives up in choosing to vote. Here are some possible opportunity costs:• Time taken to register• Time to find a voting location, or to vote via absentee ballot.• Time taken to vote, which may also mean lost wages for voters who miss work; or babysitting or transportation costs.
• Time needed to investigate candidates and issues.
LESSON 3 – VOTERS AND ELECTIONS
ELECTION LESSONS © COUNCIL FOR ECONOMIC EDUCATION, NEW YORK, NY
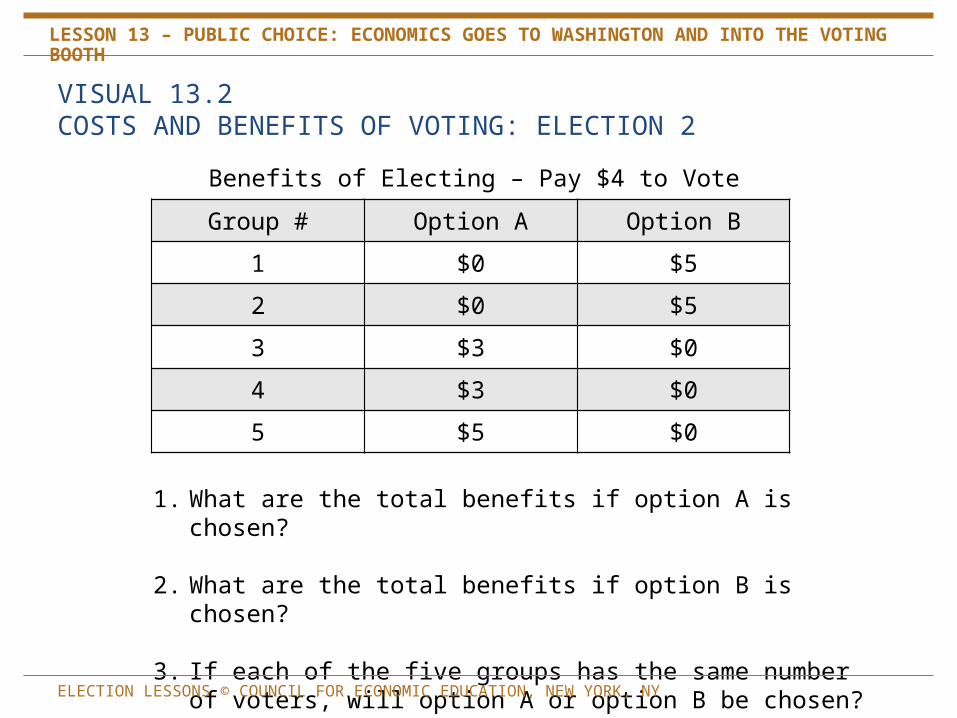
Reason All18-24
10. Inconvenient Polling Place
9. Transportation Problems
10. Forgot
11. Don’t Know/Refused to Answer
12. Registration Problems
13. Out of Town
14. Didn’t Like the Candidates
15. Not Interested
16. Illness or Disability
1. Too Busy
In 2008, citizens aged 18-24 made up 12.6% of the voting age population, but only 9.3% of the voters.
LESSON 3 – VOTERS AND ELECTIONS
VISUAL 3.2TOP TEN REASONS REGISTERED VOTERS GAVE FOR NOT VOTING IN 2008
ELECTION LESSONS © COUNCIL FOR ECONOMIC EDUCATION, NEW YORK, NY
2.7%
2.8%
2.8%
7.0%
8.0%
8.8%
12.9%
13.4%
14.9%
17.8%
2.8%
2.4%
4.5%
11.2%
9.0%
14.2%
8.0%
12.1%
3.2%
21.0%

Men or Women
White or Black or Asian
Naturalized Citizen or Native Born
Married or Never Married
Separated or Divorced
Low Income or High Income
Employed or Unemployed
H.S. Degree or Bachelor’s Degree
Minnesotan or Floridian or Hawaiian
Veteran or Non-Veteran
Renter or Homeowner
Young (18-24) or Old (45-64)
Women 65.7 to 61.5
White 66.1 - Black 64.7 - Asian 47.6
Native 64.4 to 54
Married 69.9 to 53.5
Divorced 59 to 53.5
High Income 91.8 to 51.9
Employed 65.9 to 54.7
Bachelor’s Degree 77 to 54.9
MN. 75 - FL. 63.8 - HI. 51.8
Veteran 70.9 to 62.8
Homeowner 67.8 to 51.6
Old 69 to 49
VISUAL 3.4WHO VOTES MORE?
Of all citizens, who voted most, percentage-wise, in the 2008 presidential election?
LESSON 3 – VOTERS AND ELECTIONS
ELECTION LESSONS © COUNCIL FOR ECONOMIC EDUCATION, NEW YORK, NY
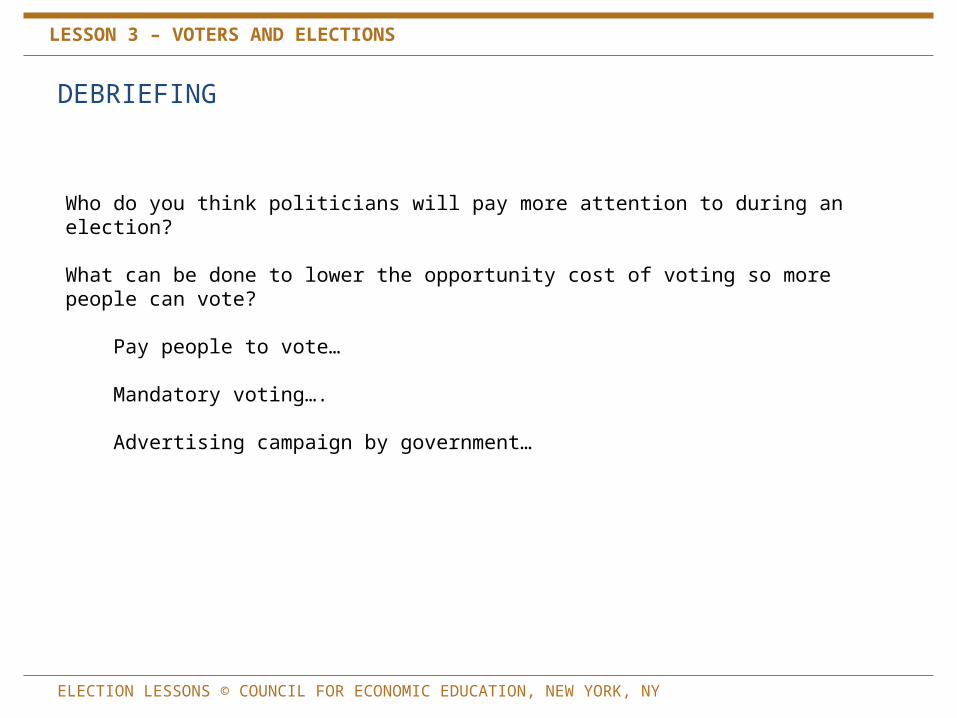
DEBRIEFING
Who do you think politicians will pay more attention to during an election?
What can be done to lower the opportunity cost of voting so more people can vote?
Pay people to vote…
Mandatory voting….
Advertising campaign by government…
LESSON 3 – VOTERS AND ELECTIONS
ELECTION LESSONS © COUNCIL FOR ECONOMIC EDUCATION, NEW YORK, NY

LESSON 6: CAN ELECTION FUTURES MARKETS BE MORE ACCURATE THAN POLLS?
VISUALS

Firm When Conducted
Obama McCain Undecided
Obama Lead
Election Result
11/4 52.9(53.7)*
45.7(46.3)
----- 7.3(7.4)
Harris (Online)
10/30-11/3 52 44 0 8
Fox News 11/1-2 50 43 5 7
Gallup 10/31-11/2 55 44 0 11
Zogby 10/31-11/3 54 43 3 11
GWU 11/2-3 50 48 0 2
NBC/WSJ 11/1-2 51 43 2 8
ABC/WP 10/31-11/3 53 44 2 9
CBS/NYT 10/31-11/2 51 42 5 9
CNN/USA 10/30-11/1 53 46 1 7
IOWA EM 11/3 53.55 46.45 ------ 7.1
LESSON 6 – CAN ELECTION FUTURES MARKETS BE MORE ACCURATE THAN POLLS?
VISUAL 6.1COMPARING POLLS AND MARKETS
ELECTION LESSONS © COUNCIL FOR ECONOMIC EDUCATION, NEW YORK, NY
* The number in parenthesis is the share of vote between two candidates, which is comparable to the Iowa EM vote share payoff.

• Through all the twists and turn of the primary campaign and the final campaign, the Iowa Electronic Markets consistently picked Barack Obama as the leader.
• As illustrated in the figure below, from June 2006 until November 2008, Barack Obama led by similar margins to the final election outcome.
VISUAL 6.3RESULTS FOR THE PRESIDENTIAL ELECTION
ELECTION LESSONS © COUNCIL FOR ECONOMIC EDUCATION, NEW YORK, NY
LESSON 6 – CAN ELECTION FUTURES MARKETS BE MORE ACCURATE THAN POLLS?

THIS YEAR’S ELECCTION
ELECTION LESSONS © COUNCIL FOR ECONOMIC EDUCATION, NEW YORK, NY
LESSON 6 – CAN ELECTION FUTURES MARKETS BE MORE ACCURATE THAN POLLS?

LESSON 1: MARGIN OF ERRORVISUALS

ELECTION LESSONS © COUNCIL FOR ECONOMIC EDUCATION, NEW YORK, NY
LESSON 6 – CAN ELECTION FUTURES MARKETS BE MORE ACCURATE THAN POLLS?
• Each group will get a bag. Do not look inside.• Each bag contains white and red (or maybe green)
chips• Each group should have a pollster and a record keeper.• When instructed, the groups will “poll” by having the
pollster draw a chip. The record keeper will record its color. The chip is then put back into the bag.
We need 9 groups
ELECTION LESSONS © COUNCIL FOR ECONOMIC EDUCATION, NEW YORK, NY
LESSON 6 – CAN ELECTION FUTURES MARKETS BE MORE ACCURATE THAN POLLS?
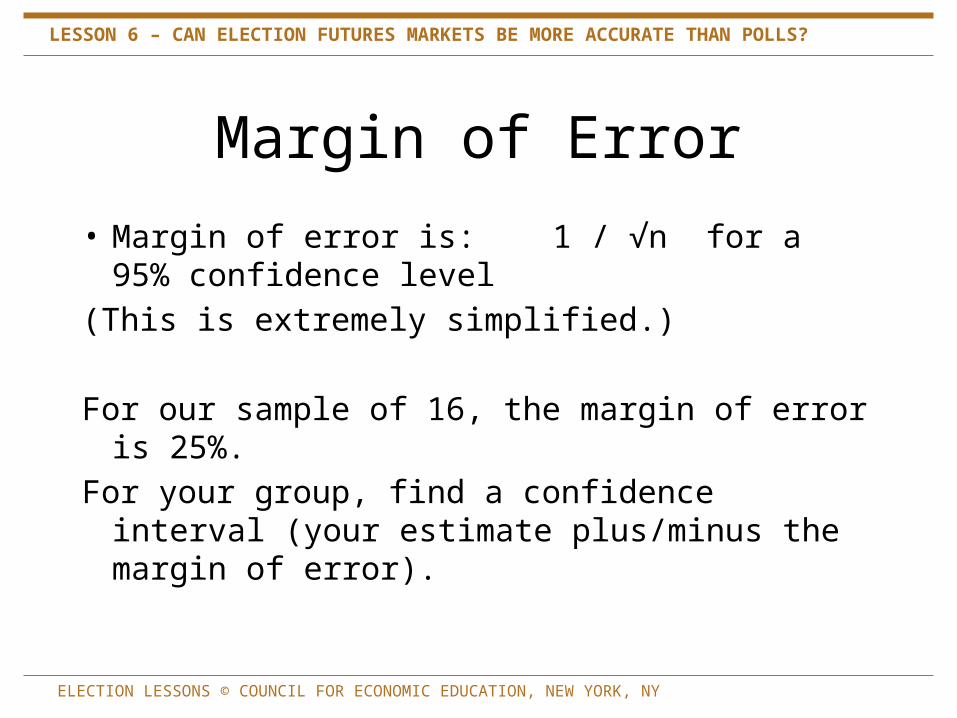
• Margin of error is: 1 / √n for a 95% confidence level(This is extremely simplified.)
For our sample of 16, the margin of error is 25%.For your group, find a confidence interval (your estimate
plus/minus the margin of error).
Margin of Error
ELECTION LESSONS © COUNCIL FOR ECONOMIC EDUCATION, NEW YORK, NY
LESSON 6 – CAN ELECTION FUTURES MARKETS BE MORE ACCURATE THAN POLLS?
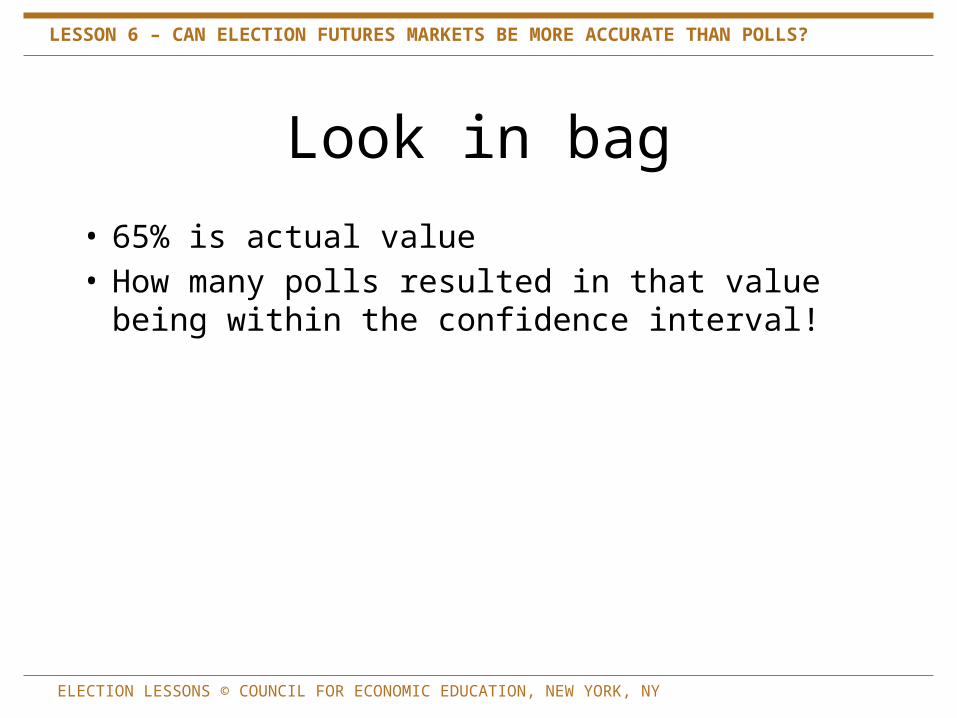
• 65% is actual value• How many polls resulted in that value being within the
confidence interval!
Look in bag

LESSON 1 – MARGIN OF ERROR
VISUAL 1.1
ELECTION LESSONS © COUNCIL FOR ECONOMIC EDUCATION, NEW YORK, NY
Number polled from a large population
Margin of Error with a 95% Confidence Level
144 8.3%
400 5.0%
1,000 3.2%
2,000 2.2%
3,000 1.8%
4,000 1.6%
ISSUES
Lesson 11: How Should Governments Structure the Tax System?

LESSON 8: ECONOMIC MISERY AND PRESIDENTIAL ELECTIONS
VISUALS

A Real GDP per capita growth rule:
The incumbent party usually wins if…
The growth rate of Real GDP per capita is greater than or equal to 2.5% during the year of the election.
A Misery Index rule:
The incumbent party usually wins if…
The Misery Index has not increased from the year prior to the election.
VISUAL 8.3SOME ECONOMIC RULES THAT WORK WELL
ELECTION LESSONS © COUNCIL FOR ECONOMIC EDUCATION, NEW YORK, NY
LESSON 8 – ECONOMIC MISERY AND PRESIDENTIAL ELECTIONS
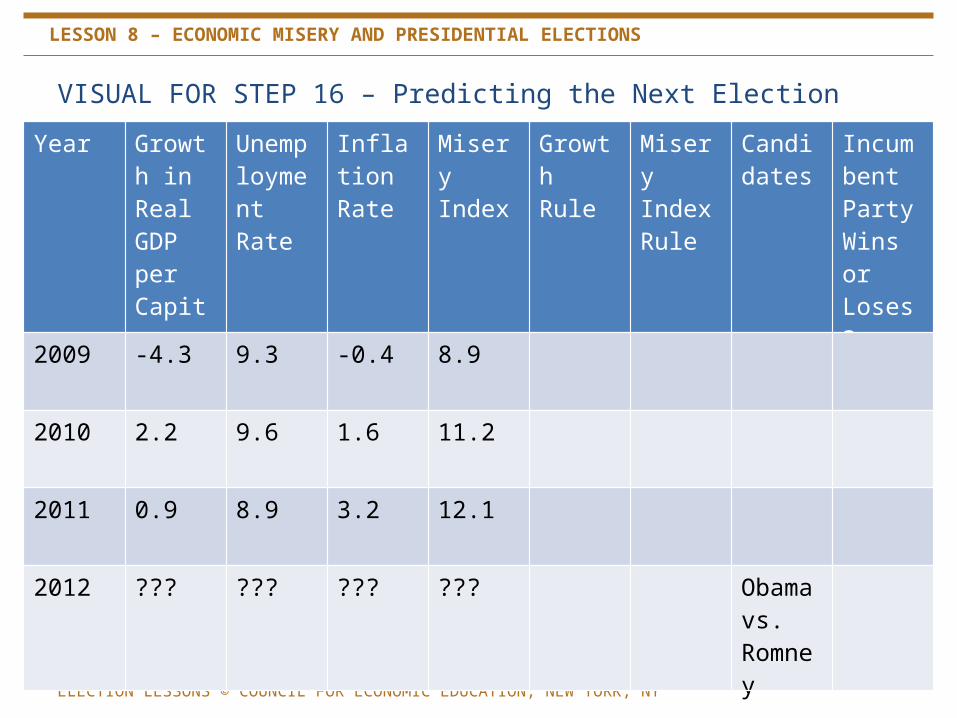
VISUAL FOR STEP 16 – Predicting the Next Election
ELECTION LESSONS © COUNCIL FOR ECONOMIC EDUCATION, NEW YORK, NY
LESSON 8 – ECONOMIC MISERY AND PRESIDENTIAL ELECTIONS
Year Growth in Real GDP per Capita
Unemployment Rate
Inflation Rate
Misery Index
Growth Rule
Misery Index Rule
Candidates
Incumbent Party Wins or Loses?
2009 -4.3 9.3 -0.4 8.9
2010 2.2 9.6 1.6 11.2
2011 0.9 8.9 3.2 12.1
2012 ??? ??? ??? ??? Obama vs. Romney
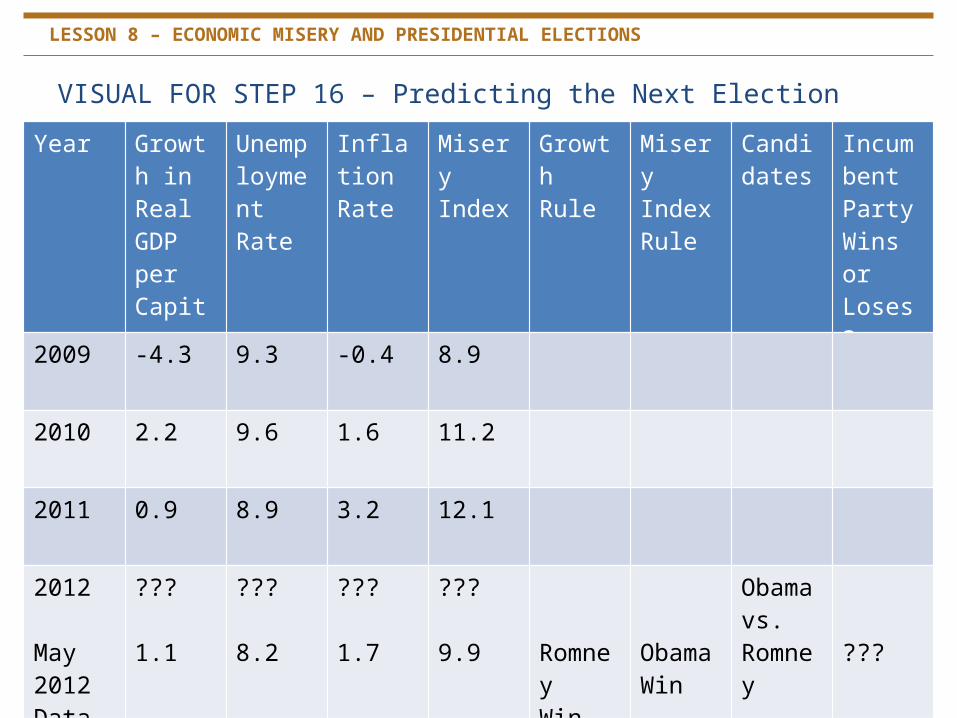
VISUAL FOR STEP 16 – Predicting the Next Election
ELECTION LESSONS © COUNCIL FOR ECONOMIC EDUCATION, NEW YORK, NY
LESSON 8 – ECONOMIC MISERY AND PRESIDENTIAL ELECTIONS
Year Growth in Real GDP per Capita
Unemployment Rate
Inflation Rate
Misery Index
Growth Rule
Misery Index Rule
Candidates
Incumbent Party Wins or Loses?
2009 -4.3 9.3 -0.4 8.9
2010 2.2 9.6 1.6 11.2
2011 0.9 8.9 3.2 12.1
2012
May 2012 Data
???
1.1
???
8.2
???
1.7
???
9.9 RomneyWin
ObamaWin
Obama vs. Romney ???

Spring 2008

Spring 2012