
COUC IL OF Brussels, 14 December 2011 THE …...18633/11 ADD2 DM/ct 1 DG C 1 A E COUC IL OF THE...
55
18633/11 ADD2 DM/ct 1 DG C 1 A E COUCIL OF THE EUROPEA UIO Brussels, 14 December 2011 Interinstitutional File: 2011/0409 (COD) 18633/11 ADD2 ET 290 EV 978 MI 673 CODEC 2448 COVER OTE from: Secretary-General of the European Commission, signed by Mr Jordi AYET PUIGARNAU, Director date of receipt: 9 December 2011 to: Mr Uwe CORSEPIUS, Secretary-General of the Council of the European Union No Cion doc.: SEC(2011) 1505 final Subject: Commission Staff Working Paper Executive summary of the Impact Assessment Accompanying the document Proposal for a Regulation on the sound level of motor vehicles Delegations will find attached Commission document SEC(2011) 1505 final. ________________________ Encl. : SEC(2011) 1505 final
Transcript of COUC IL OF Brussels, 14 December 2011 THE …...18633/11 ADD2 DM/ct 1 DG C 1 A E COUC IL OF THE...

18633/11 ADD2 DM/ct 1 DG C 1 A E�
COU�CIL OF
THE EUROPEA� U�IO�
Brussels, 14 December 2011
Interinstitutional File:
2011/0409 (COD)
18633/11
ADD2
E�T 290
E�V 978
MI 673
CODEC 2448
COVER �OTE
from: Secretary-General of the European Commission,
signed by Mr Jordi AYET PUIGARNAU, Director
date of receipt: 9 December 2011
to: Mr Uwe CORSEPIUS, Secretary-General of the Council of the European Union
No Cion doc.: SEC(2011) 1505 final
Subject: Commission Staff Working Paper
Executive summary of the Impact Assessment
Accompanying the document Proposal for a Regulation on the sound level of motor vehicles
Delegations will find attached Commission document SEC(2011) 1505 final.
________________________ Encl.: SEC(2011) 1505 final

EN EN
EUROPEAN COMMISSION
Brussels, 9.12.2011 SEC(2011) 1505 final
COMMISSIO� STAFF WORKI�G PAPER
IMPACT ASSESSME�T
Accompanying the document
Proposal for a Regulation of the European Parliament and of the Council
on the sound level of motor vehicles
{COM(2011) 856 final} {SEC(2011) 1504 final}

EN 2 EN
Disclaimer: This report commits only the Commission's services involved in its preparation and does not prejudge the final form of any decision to be taken by the Commission.

EN 3 EN
TABLE OF CO�TE�TS
1. Procedural issues and consultation of interested parties .............................................. 6
1.1. Identification ................................................................................................................ 6
1.2. Organisation and timing............................................................................................... 6
1.3. Consultation and expertise ........................................................................................... 6
1.4. Scrutiny by the Impact Assessment Board................................................................... 7
2. Problem definition........................................................................................................ 8
2.1. Policy context: purpose and development of the Motor Vehicle Noise Directive....... 8
2.2. Sources of road noise and ways to reduce noise emissions ......................................... 9
2.3. The problem that requires action................................................................................ 10
2.3.1. Inadequate methods for measuring road traffic noise ................................................ 10
2.3.2. Negative health effects from road traffic noise.......................................................... 12
2.3.3. Potential risk of fragmentation of the internal market ............................................... 14
2.4. Underlying drivers and contributors related to the problem ...................................... 14
2.5. Who is affected, in what ways and to what extent? ................................................... 15
2.6. Evolution of the problem ........................................................................................... 16
2.7. EU right to act ............................................................................................................ 17
3. Objectives................................................................................................................... 17
3.1. Policy objectives ........................................................................................................ 17
3.2. Consistency with other policies and objectives ......................................................... 18
4. Policy options............................................................................................................. 18
5. Analysis of impacts .................................................................................................... 21
5.1. Approach .................................................................................................................... 21
5.2. Environmental impact ................................................................................................ 21
5.3. Social and health impacts........................................................................................... 25
5.4. Economic impacts ...................................................................................................... 28
5.5. Comparison of costs and benefits for each policy option .......................................... 35
5.6. Summary of impacts .................................................................................................. 36
5.7. Other impacts of the preferred option ........................................................................ 40
6. Monitoring and evaluation ......................................................................................... 41

EN 4 EN
6.1. Indicators of progress towards meeting the objectives .............................................. 41
6.2. Ongoing dialogue with stakeholders .......................................................................... 41
ANNEXES ............................................................................................................................... 42
Annex 1:List of European Directives and amendments related to noise from road traffic...... 42
Annex 2:Determination of the best suitable test method ......................................................... 43
Annex 3:Evaluation of the new test method (method B) ......................................................... 43
Annex 4:Calculation of the equivalent sound pressure level at a characteristic distance from the road....................................................................................................................... 46
Annex 5:Overview of road types and lengths with corrections for non-residential stretches, roads with restricted access and low traffic volume .................................................. 48
Annex 6:Parameters used for the economic analysis ............................................................... 48
Annex 7:Calculation of the percentage of annoyed and sleep disturbed people...................... 49
Annex 8:Derivation of future traffic noise emission levels ..................................................... 49
Annex 9:Millions of highly annoyed people per road type for each policy option ................. 50
Annex 10:Millions of highly sleep disturbed people per road type for each policy option..... 51
Annex 11:Effect of fleet and mileage growth on average car fleet emission .......................... 51
Annex 12:Tyre-road noise and power train noise contributions to test results ........................ 52
Annex 13:Prediction of tyre-road noise contribution to future test results .............................. 53

EN 5 EN
I�TRODUCTIO�
This initiative has two kinds of background, firstly EU policies to reduce noise emissions from different sources and secondly the type approval legislation for motor vehicles aimed at smooth functioning of the internal market.
Noise limits for four-wheel motor vehicles are addressed in Directive 70/157/EEC (Motor Vehicle Noise Directive) which forms part of the EC Whole Vehicle Type-Approval system. Under this system, manufacturers can obtain approval for a vehicle type in one Member State if it meets the Community technical requirements and then market it EU-wide with no need for further tests or checks. Registration must be granted on simple presentation of a 'Certificate of Conformity'. The noise limits have been reduced several times, the most recent being in 1995. This last reduction did not have the expected effects and subsequent studies showed that due to changes in vehicle technology, driving behaviour and the amount of road traffic, the measurement method does not reflect real driving behaviour anymore1. The UN/ECE noise expert group therefore decided that, before reducing the limits once again, it is first necessary to develop a new test cycle and bring the driving conditions for the noise test closer to real driving conditions2. Once a more optimal method is selected, further reductions of noise levels can be considered.
In the early stages EU regulations on noise management were based on internal market objectives and focused mainly on setting harmonized noise limits for motor vehicles, household appliances and other noise-generating products. As more information about the health impacts of noise became available, the need for a higher level of protection of EU citizens through further EU-wide measures became more imminent. The Commission's Green Paper on Noise from 19963 estimated that around 20 percent of the EU’s population at the time suffered from noise levels that scientists and health experts consider being unacceptable. Based on information from Member States, the European Environment Agency has estimated, that half of the population in urban areas is exposed to noise levels above 55 dB(A) as a result of ambient road noise. When comparing this with the figures of the Green Paper, no significant progress in reducing people's exposure to noise has yet been made.
1 Noise Emission of Road Vehicles – Effect of Regulations, Final Report 01-1 by the I-INCE Working
Party on the Effect of Regulations on Road Vehicle Noise, International Institute of Noise Control Engineering, U. Sandberg (Convener), Swedish National Road and Transport Research Institute (VTI), Linköping, Sweden, July 2001 Steven, H., Ermittlung der Geräuschemissionsänderung von Kraftfahrzeugen im Strassen-verkehr, Report FIGE GmbH, Herzogenrath, Germany, 1994 Morgan, P.A., P.M. Nelson, H. Steven, Integrated assessment of noise measures in the road transport sector, Project report PR SE/652/03 prepared for project record ETD/FIF.20020051 commissioned by EU Working Group 8 of DG Enterprise, TRL Limited, Wokingham - Berkshire, November 2003. Biegstraaten, F.J.W., E. Gerretsen, J.C. Tukker, Geluidemissie van personenauto’s in stedelijk verkeer – De kwaliteit van de typekeuring en het effect van wijzigingen van grenswaarde of meetmethode (Noise emission of passenger cars in urban traffic – The quality of the type approval test method and the effect of changes in limit values or in the test method), in Dutch, Report nr. 623.109, TNO Institute of Applied Physics, Delft, 27 February 1989. Steven, H., Verbesserung der Geräuschemissionsmessverfahren für Kraftfahrzeuge – Pkw, Fige-bericht 84-105 02 410/03, November 1984.
2 Noise of passenger cars 1974-999 –The paradox of a 2 dB(A) increase in traffic noise and a 8 dB(A) decrease in type approval limits, D. F. de Graaff, M+P Raadgevende Ingenieurs bv, ‘s Hertogenbosch, The Netherlands, 2000
3 Green Paper on Future Noise Policy (COM(96) 540)

EN 6 EN
Over the years, considerable research effort, including large EU-funded projects, has been dedicated to the quantitative assessment of the relationship between environmental noise and its effects. Although the approaches and the scope of the various studies differ, common ground can be found in terms of harmful effects and annoyance that noise generates.
The Communication from the Commission regarding a European strategy on clean and energy efficient vehicles of 28.04.2010 announced that the Commission will present a proposal in 2011 to amend the respective legislation to reduce the noise emissions of motor vehicles.
1. PROCEDURAL ISSUES A�D CO�SULTATIO� OF I�TERESTED PARTIES
1.1. Identification
Lead DG: DG Enterprise and Industry
Other involved DGs: ENV, ENER, MOVE, SANCO, RTD, and SG
Agenda Planning/CWP Reference: 2011/ENTR/012
1.2. Organisation and timing
The present impact assessment was carried out between July 2009 and December 2010. For its purposes an Impact Assessment Steering Group (IASG) was created with participation of DG ENV, ENER, SANCO, RTD and SG. The IASG met three times with the first meeting in July, the second in November and the last one in December 2010. The suggestions of the IASG have been incorporated in the present report.
1.3. Consultation and expertise
The present report builds on the findings of an external study carried out by the Dutch Organisation for Applied Scientific Research (TNO). The study analysed the differences between the currently applicable type approval test method for noise emissions from vehicles (hereafter referred to as test method) and a proposed new test method. The goal of the study was to assess the draft new test protocol against the available noise data and to provide possible new limit values for each category of vehicles, including those types of vehicles which currently benefit from derogations. The report gives an account of the methods that were used for the purposes of the investigation, of the results that were achieved and of the conclusions and recommendations concerning the necessary or possible changes to the noise emission type approval legislation, aiming at a procedure that will be effective and efficient in terms of environmental, social and economic impacts. The European Automobile Manufacturers' Association (ACEA) and the International Organization of Motor Vehicle Manufacturers (OICA) were consulted throughout the elaboration of the report. The findings of the interim report and the final report have been presented to all stakeholders on several occasions.
A targeted consultation was organized for the purposes of this initiative due to its technical character. Sufficient feedback was received since 1990 through ongoing dialogue with all relevant stakeholders through their participation at the different

EN 7 EN
meetings of UN/ECE4 (WP.29, GRB5, Informal Working Group on Regulation No. 51, Informal Working Group on Additional Sound Emission Provisions) representing contracting parties to the 1958 UN/ECE Agreement6 (different ministries and authorities from Member States, suppliers of vehicles, suppliers of parts, consumers, type approval authorities, trade unions, NGOs), the Commission's advisory Motor Vehicle Working Group (MVWG)7 and the Commission's legislative Committee (TCMV). During this process the industry supported the introduction of the new measurement method and agreed to the need of reducing the noise limit values for motor vehicles. The position about the timeline for the introduction of new limit values and their stringency is divided between the different interest groups.
Industry supports the step wise approach proposed in the impact assessment report. Nevertheless some manufacturers claim that the proposed time span is too short when compared to the average vehicle or tyre line evolution of 5 to 6 years.
During the consultation the automotive manufacturers have expressed a divergent opinion concerning the necessary cost to develop less noisy vehicles. They estimate that the development cost and the necessary time frame is higher than expected by the Commission's contractor. In addition industry estimates that more time is needed until the public can benefit from the reduced environmental noise limits. Some tyre manufacturers question the estimated noise contribution of tyres in the new test method and that their capability to comply with the future type approval requirement has been appropriately considered. Industry has no common position regarding the treatment of tyre noise coming from heavy duty vehicles. Some support the Commission's position that an important component like the tyres mounted on the drive axles is required during the test procedure. Other parts of the industry claim that special low noise test tyres should be used to avoid a masking effect of the power train contribution. According to the automotive and the tyre industry additional vehicles subcategories should be introduced, in particular for heavy duty vehicles.
Member States already expressed support for the new measurement method. The planned reduction of limit values got positive feedback as well, taking into account that in some Member States the decision process is not yet finalised. Transport & Environment, a European association of NGOs campaigning for sustainable transport, is in favour of more stringent limit values in the shortest possible time frame.
1.4. Scrutiny by the Impact Assessment Board
The Impact Assessment Board of the European Commission assessed a draft version of the present impact assessment and issued its opinion on 04/02/2011. The Impact
4 United Nations Economic Commission for Europe 5 The Working Party on Noise (GRB) is the subsidiary body of the World Forum for Harmonization of
Vehicle Regulations (WP.29) within UN/ECE 6 Agreement Concerning the Adoption of Uniform Conditions of Approval and Reciprocal Recognition
of Approval for Motor Vehicle Equipment and Parts of the United Nation Economic Commission for Europe
7 The MVWG consists of Member States, industry, consumer organisations and depending on the subject other relevant stakeholders. In the TCMV Member States express their opinion within the 'Comitology' procedure.

EN 8 EN
Assessment Board made several recommendations and, in the light of the latter, the final impact assessment report contains an improved presentation of the baseline scenario, clarifies the design and choice of options and presents a further enhanced const-benefit analysis.
2. PROBLEM DEFI�ITIO�
2.1. Policy context: purpose and development of the Motor Vehicle �oise Directive
Before European type-approval for motor vehicles was introduced, Member States would regulate noise emission levels individually. The legislations often varied from one Member State to another and manufacturers producing for several markets were obliged to adapt their products for each market and have their vehicles tested in each Member State. This was time-consuming and costly. Different national rules consequently hindered trade, and had a negative effect on the internal market. It was therefore necessary to harmonize rules at the EU level including the limitation of the noise emissions for motor vehicles.
This was done through the Motor Vehicle Noise Directive (Directive 70/157/EEC). The Directive and its amendments (for overview see Annex 1) cover the requirements for motor vehicle exterior pass-by noise and the noise from the exhaust system under test conditions, i.e. they describe the testing procedure and set noise limits. The original Directive and subsequent amendments had two objectives. Firstly, they aimed to ensure that for certain categories of motor vehicles noise limits of individual Member States would not form barriers to trade. The second goal was to tighten the noise limits to reduce environmental noise. The amending Directive 92/97/EEC introduced mandatory common noise limits applicable to all Member States. Several of the subsequent amendments specified stricter limits as shown in Figure 1.
1970 1975 1980 1985 1990 1995 2000 200570
75
80
85
90
95
Year
Lp a
t 7.5
m [d
B(A
)]
Type approval noise limits
01/10/1982
01/10/1985 01/10/1989 01/10/1996
Passenger carDelivery van < 2tSmall lorryHeavy lorry

EN 9 EN
Figure 1: Development of EU road vehicle type approval noise limits: Passenger car, delivery van (2 – 3.5 tonnes max. weight), small truck (> 3.5 tonnes and < 75 kW) and a heavy truck (> 3.5 tonnes and > 150 kW), including important dates of amendments and adaptations8
The current formulation of the noise emission requirements within the framework of the type-approval is a combination of limit values for vehicle categories and sub-categories and extra allowances for vehicles within those sub-categories that meet specific criteria.
By Council Decision 97/836/EC, the European Community acceded to the Agreement of the United Nations Economic Commission for Europe (UN/ECE) concerning the adoption of uniform technical prescriptions for wheeled vehicles. This ensures that the EU vehicle type approval is harmonised with a broader range of countries outside the EU, such as Russia, Australia, and Japan so that EU producers can use the same production lines for these export markets as for the internal market. The test procedure and the limit values of UN-ECE Regulation No. 51 are equivalent to those of the EU Directive.
Although Directive 70/157/EEC succeeded in harmonising the type testing procedure and noise limits, it failed in reducing real traffic noise levels, as especially for cars real driving conditions differ from the test conditions, tyre noise increased relative to power train noise and the volume of traffic continuously increased. For this reason noise from road traffic was also approached by the more recent Directive 2001/43/EC and Regulation No 661/2009 covering tyre noise and in Directive 2002/49/EC regarding the assessment of environmental noise (see section 3.2 and Annex 1).
2.2. Sources of road noise and ways to reduce noise emissions
Within overall environmental noise the noise generated by transport plays an important role. The main sources of transport noise are aircrafts, railways and road traffic. The noise generated by traffic can have many sources (tyre-road noise, power train noise, exhaust noise etc.). The rolling noise emission of tyres is subjected to a separate EU Regulation No. 661/2009 which implies that from 1 November 2012 stricter limit values for tyre rolling noise will be in force for new types of tyres and from 1 November 2013 for new types of vehicles equipped with these tyres.9
The exposure of people to noise can be reduced in different ways: through reducing noise limits at the source, i.e. directly reducing noise limits emitted by cars or through other indirect measures such as tax relief schemes for environmentally friendly investments (e.g. Vamil and MIA in the Netherlands)10, standards for acquisition of quiet delivery vehicles (e.g. PIEK11 standard), traffic restrictions (e.g. the low noise truck sign as required on alpine transit routes in Austria), rerouting and speed restrictions or noise abatement solutions (noise barriers, quiet road surfaces,
8 TNO report: VENOLIVA - Vehicle Noise Limit Values; Comparison of two noise emission test
methods Specific Contract No SI2.545143 9 These new requirements will result in an estimated average reduction of 3,8 dB(A) of the limit values
for car tyres and of approximately 3,3 dB(A) for the limit values for truck tyres. From 1 November 2016 the stricter limit values will apply to all new vehicles and all new tyres. As the tyre noise test is conducted under different test conditions and in particular with a different speed the results of the tyre noise test is not directly comparable to the results of the vehicle noise test.
10 http://www.senternovem.nl/vamil_mia/English.asp 11 http://www.bmwt.nl/files_content/Certificatie-%20en%20toezichtprocedures%20PIEK.pdf

EN 10 EN
façade insulation). However, recent studies12 have shown that noise abatement at the source has the biggest potential to reduce exposure and is generally more cost efficient than measures designed to hamper noise propagation.
The effect of limit changes on vehicle noise levels under real conditions depends on whether tyre or power train noise is dominant, which in turn depends on road surface, vehicle design, operating condition (see Figure 2), driving style and wear. More detailed information concerning the tyre-road noise and power train contribution can be found in Annexes 12 and 13.
Figure 2: Illustrative example of the contribution of power train and tyre/road noise source of an
average, moderately accelerating passenger car with a five speed gearbox, as function of vehicle speed. The green line indicates the approximate speed of the type test.13
2.3. The problem that requires action
2.3.1. Inadequate methods for measuring road traffic noise
As it has been mentioned earlier, the permissible sound level of road vehicles are laid down in the Motor Vehicle Noise Directive 70/157/EEC and in the UN-ECE Regulation No 51, which specify the test method for the noise emission test.
The latest amendment to the vehicle noise legislation in 1995 led to a reduction of noise emissions of 85 % for cars (-8 dB(A)) and of over 90% for heavy lorries (-11 dB(A)) compared to the initial limit values established in 1970. However studies have shown that the reduction in actual road traffic noise levels has been much less: only 1 - 2 dB(A). The reasons for this low level of effectiveness can be attributed to: relaxed limits in the early years, a slow replacement of older and noisier vehicles with newer ones, significant growth in traffic, the use of wider tyres with different characteristics for higher speeds and to the test procedure that does not reflect realistic driving conditions.
Following the adoption of the General Safety Regulation in 200914 which lays down improved noise requirements for motor vehicle tyres, the next step to further reduce vehicle noise emissions in the future is through improving the type-approval
12 CE Delft (2007) Traffic noise reduction in Europe. Health effects, social costs and technical and policy
options to reduce road and rail traffic noise. 13 TNO report: VENOLIVA - Vehicle Noise Limit Values; Comparison of two noise emission test
methods Specific Contract No SI2.545143 14 REGULATION (EC) No 661/2009 OF THE EUROPEAN PARLIAMENT AND OF THE COUNCIL
of 13 July 2009 concerning type-approval requirements for the general safety of motor vehicles, their trailers and systems, components and separate technical units intended therefore (OJ L 200/1 of 31.07.2009

EN 11 EN
requirements for the whole vehicle. This includes the reduction of the overall limit values by looking at all noise sources of motor vehicles, from the air intake over the power train to the exhaust with special consideration of the tyre contribution, together with an improved test procedure.
The current noise test protocol, which has been in force since 1970 with subsequent amendments, requires a full throttle acceleration of the test vehicle. However, this does no longer reflect the real life driving behaviour. Due to changes in vehicle technology and the increase in traffic, partial throttle acceleration is nowadays mainly applied. Therefore, an updated test methodology that allows for setting of optimal limit values appears as the main way forward to reduce noise levels.
In response to the identified problem, the UN-ECE Working Party on Noise developed a new test method which was published in 2007. Before it can be used for type-approval purposes it was necessary to monitor its application in parallel with the existing test method in order to evaluate its qualities. The new method has been used on a provisional basis for the past three years15. During the monitoring period, the type approval authorities were obliged to apply both noise emission tests and submit their results to the European Commission. For the type approval of motor vehicles only the results of the current test protocol have been taken into consideration. The monitoring procedure allowed collecting a database of parallel test results which provides a solid basis for assessing the new method and quantifying the differences between the two methods.
The differences between the current type approval test method (hereafter referred to as A) and the proposed new test method (hereafter referred to as B) are outlined below:
Test method A
The currently applicable method ‘A’ for vehicle noise measurement procedure and accompanying limit values are described in detail in Directive 70/157/EEC and in Annex 3 of UN-ECE Regulation No. 5116, from which the measurement method is based on ISO 362. It was developed as a test under worst case urban conditions, i.e. full throttle acceleration in urban areas.
Test method B
The aim of the new method ‘B’ was to develop a ‘design independent’ measurement method and to correspond better to current urban driving conditions in general. Therefore, this method consists of both acceleration and a constant speed test. The vehicle has to enter the test track with such a speed, that after wide open throttle (WOT) acceleration, a speed of 50 km/h is reached at the microphone cross section, i.e. halfway along the 20 m long measurement field.
Although most measurement conditions (test track, microphone positions, meteorological conditions, etc.) are equal to method A, there are some differences between the two methods:
Method B adds a constant speed component to the acceleration component.
15 The monitoring period under UN/ECE Regulation No. 51 lasted from 1 July 2007 until 1 July 2009,
while the monitoring period under the Motor Vehicle Noise Directive (2007/34/EC; amending Directive 70/157/EEC) started on 6 July 2008 and expired on 6 July 2010.
16 http:// OJ L 137/68, 30.05.2007
EN 12 EN
To allow for measurement inaccuracies in method A, all measured sound levels (intermediate results) have to be reduced by 1 dB(A), whereas in method B all intermediate results are rounded to the first decimal and no reduction is applied at all.
In method A the minimum required tyre tread depth is 1.6mm, whereas in method B the tread depth has to be at least 80% of the full depth. This can result in an increase of several dB of the tyre-road noise component, especially for tyres with a rough tread pattern. For further information see Annex 2 about the determination of the best suitable test method and Annex 3 with a further evaluation of test method B.
17
2.3.2. �egative health effects from road traffic noise
According to the EEA report ‘Transport at a crossroads 2008', almost 67 million people (i.e. 55 % of the population living in agglomerations with more than 250 000 inhabitants) are exposed to daily road noise levels exceeding 55 dB LDEN
18. This figure is a commonly established 'threshold value' above which there is a higher likelihood of adverse health effects. Almost 48 million people are exposed to levels exceeding 50 dB Lnight
19 with road noise being by far the largest source of exposure to night time transport noise. Almost 21 million people (i.e. 17 % of the population living in urban agglomerations) live in areas where night-time road noise levels have detrimental effects on health. Road noise again is the main source of transport noise hot spots in these agglomerations.
Since 2000 a number of studies have investigated in more detail annoyance and health effects from road traffic noise20 showing the scale and urgency of the problem.
17 The noise emission requirements as currently formulated are a combination of limit values for vehicle
categories and sub-categories and additional allowances for higher noise emissions from some special sub-categories of vehicles. A need to modify the allowances of certain vehicle sub-categories was identified in order to reflect the technological developments. The allowance of 1 dB(A) for passenger cars and light vans equipped with a direct injection Diesel engine is no longer justified because the average test results of vehicles with Diesel engines is today slightly lower than the results for petrol engines. The allowance of 1 dB(A) for passenger cars with high-powered engines can be sustained. Due to the fact that the engine power of passenger cars steadily increases it is recommended to revise the criterion by introducing a power to mass ratio greater than 150 kW/tonne. The allowance of 1 or 2 dB(A) for vehicle with off-road capabilities finds support in the database and shall be maintained. An accumulation of allowances shall not be applied.
18 LDE� is a measure of noise exposure at a specific local spot, e.g. a street. It is defined as the weighted energy average of day-evening-night levels and strongly depends on the road type, the location and traffic variation during a 24 hour period. In many cases, the numbers of cars are so much larger than other vehicle types that they tend to determine the overall LDEN level, often dominated by the evening or night levels as these have stronger weighting. Along some roads heavily used by freight vehicles, lorries and heavy goods vehicles can sometimes dominate the LDEN.
19 Lnight is mostly dominated by the higher numbers of cars, as most traffic on urban roads runs in the daytime. It contains a mix of power train and tyre noise, but more power train noise for intermittent traffic flow. On routes with significant night time freight traffic such as some motorways, lorries and heavy goods vehicles can sometimes dominate the Lnight.
20 E.g. Knol, A.B., Staatsen, B.A.M., Trends in the environmental burden of disease in the Netherlands 1980 – 2020, RIVM report 500029001, Bilthoven, The Netherlands, 2005; http://www.rivm.nl/bibliotheek/rapporten/500029001.html Valuation of Noise - Position Paper of the Working Group on Health and Socio- Economic Aspects, European Commission, Environment Directorate-General, Brussels, 4 December 2003; WWW.EC.EUROPA.EU/E�VIRO�ME�T/�OISE/PDF/VALUATIO_FI�AL_12_2003.PDF Position paper on dose response relationships between transportation noise and annoyance, European Commission, Brussels, February 2002. TNO report | MON-RPT-2010-02103 | v5 | 14 January 2011 Night Noise Guidelines for Europe, WHO report 2009.
EN 13 EN
In these studies the associated costs and benefits have already been put into perspective, generally resulting in the conclusion that the benefits of noise reduction at source far outweigh the costs.
Traffic noise in urban areas in Europe is a major environmental stressor. In the first place, noise exposure can lead to disturbance of sleep and daily activities, to annoyance and to stress. This stress can in turn trigger the production of certain hormones (e.g. cortisol, noradrenalin and adrenaline), which may lead to a variety of intermediate effects, including increased blood pressure. Over a prolonged period of exposure these effects may in their turn increase the risk of cardiovascular disease and psychiatric disorders. The degree to which noise leads to disturbance, annoyance and stress depends partly on individual characteristics, in particular a person’s attitude and sensitivity to noise. Finally, the relation between noise and personal health and well-being is also influenced by external factors like physical and social environment and lifestyle.
Following the 2008 WHO-report ‘Economic valuation of transport-related health effects, with a special focus on children’21, societal benefits for noise exposure can be identified for various health endpoints. These health endpoints are: severe annoyance, sleep quality, severe sleep disturbance, insomnia, ischemic heart disease (such as myocardial heart disease, hypertension), with limited strength of evidence in relation to noise exposure.
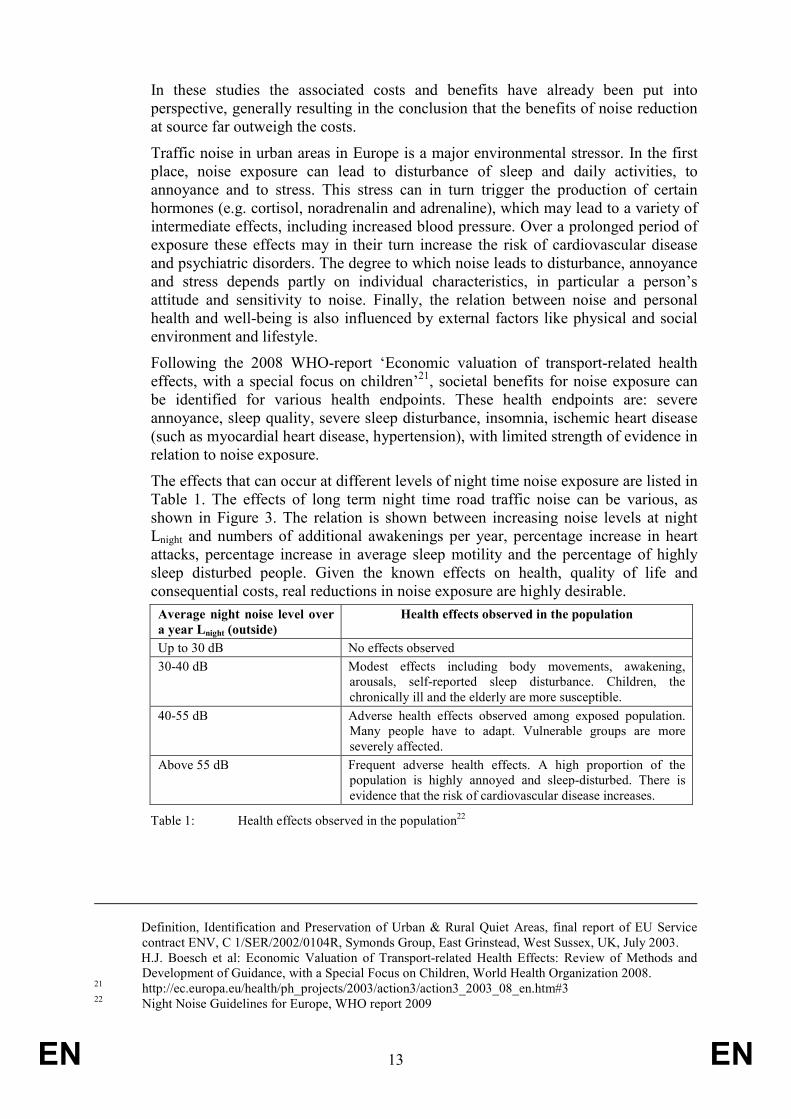
The effects that can occur at different levels of night time noise exposure are listed in Table 1. The effects of long term night time road traffic noise can be various, as shown in Figure 3. The relation is shown between increasing noise levels at night Lnight and numbers of additional awakenings per year, percentage increase in heart attacks, percentage increase in average sleep motility and the percentage of highly sleep disturbed people. Given the known effects on health, quality of life and consequential costs, real reductions in noise exposure are highly desirable.
Average night noise level over
a year Lnight (outside)
Health effects observed in the population
Up to 30 dB No effects observed
30-40 dB Modest effects including body movements, awakening, arousals, self-reported sleep disturbance. Children, the chronically ill and the elderly are more susceptible.
40-55 dB Adverse health effects observed among exposed population. Many people have to adapt. Vulnerable groups are more severely affected.
Above 55 dB Frequent adverse health effects. A high proportion of the population is highly annoyed and sleep-disturbed. There is evidence that the risk of cardiovascular disease increases.
Table 1: Health effects observed in the population22
Definition, Identification and Preservation of Urban & Rural Quiet Areas, final report of EU Service contract ENV, C 1/SER/2002/0104R, Symonds Group, East Grinstead, West Sussex, UK, July 2003. H.J. Boesch et al: Economic Valuation of Transport-related Health Effects: Review of Methods and Development of Guidance, with a Special Focus on Children, World Health Organization 2008.
21 http://ec.europa.eu/health/ph_projects/2003/action3/action3_2003_08_en.htm#3 22 Night Noise Guidelines for Europe, WHO report 2009

EN 14 EN
Figure 3: Effects of road traffic noise at night. Average motility and infarcts are expressed in percent
increase; the number of highly sleep disturbed people is expressed as a percentage of the population; awakenings are expressed in the number of additional awakenings per year.23
2.3.3. Potential risk of fragmentation of the internal market
If the technical requirements regarding the noise emissions of motor vehicles are not updated to technical progress by using an adequate test methodology and applying acceptable limit values there is a risk of fragmentation of the internal market. Member States might see a need to introduce other measures to eliminate negative health effects for their citizens. This could be the introduction of special zones only accessible for low noise vehicles or other local measures as described in section 2.2..
2.4. Underlying drivers and contributors related to the problem
Since the introduction of the Directive, a series of trends have taken effect which are the drivers of the identified problem.
• Increased use of vans and light commercial vehicles with diesel engines which are noisier than cars as they are not designed under comfort aspects.
• Use of wider tyres, resulting in higher noise emission.
• Increased weight of cars due to high power and additional structural components, contributing to more noise.
• Continuous growth in traffic volume on all road types, and thereby an increase in numbers of noise exposed citizens.
Further contributors are:
• Market shift towards environmentally friendly and alternatively powered vehicles such as hybrid, bio fuel, fuel cell, hydrogen and electric vehicles, especially for buses and municipal vehicles but also for cars. Following the reduction of
23 TNO report: VENOLIVA - Vehicle Noise Limit Values; Comparison of two noise emission test
methods Specific Contract No SI2.545143

EN 15 EN
pollutant emissions it is now necessary and feasible to reduce the noise emissions adequately. Modern technology allows the further reduction of noise levels.
• Reduction of power train noise due to improved engine design, including techniques such as electronic engine control, direct fuel injection for diesels, improved balancing, structure optimisation, improved exhaust, intake and shielding design. These improvements in technology can be used for a further reduction of motor vehicle noise levels.
The noise emission from diesel engines of cars has been reduced to levels comparable with those of petrol engines. These improvements in technology can be used for a further reduction of traffic noise.
The following political trends are of relevance:
• Increased awareness of health effects and costs of environmental noise, especially for road traffic noise which is considered one of the main sources.
• Recently, availability of European noise mapping data and exposure statistics of the population (2009).
• Extensive research including EU projects, resulting in detailed knowledge on noise reduction, research road mapping but also environmental impacts and external costs.
• Environmental legislation, both from the EU and at local level, resulting in noise abatement programs such as noise barrier programmes, quieter road surfaces, traffic flow control and rerouting, access limitations and incentives for quieter vehicles and tyres.
• Increasing regulation in relation to safety, exhaust emissions, noise and others, resulting in complex and interacting design requirements.
2.5. Who is affected, in what ways and to what extent?
Current noise emissions from motor vehicles affect all citizens, in particular urban inhabitants of areas with high traffic. The extent to which they are affected depends on the noise levels considered: daytime level LDEN, night level Lnight or individual events24. Other stakeholders affected by the Motor Vehicle Noise Directive include: road authorities, local and national authorities, health authorities, the automotive industry including suppliers and type approval bodies, the consumer market for road vehicles, the professional market for road vehicles (lease and rental companies), truck, van and taxi fleet owners.
Any amendments made to the Directive, be it a reduction of noise from motor vehicles or changes to the test method, are likely to affect the above listed stakeholders in a different way as outlined below:
Stakeholder Effect
1. The public affected by road traffic noise
a) Improved sleep, reduced stress, improved health and quality of life; indirectly: savings on health and effectiveness at work and school
24 Single events with high noise levels which do not determine the LDEN or Lnight may be a significant
source of annoyance, for example due to faulty or illegal exhausts or aggressive driving. Single events causing annoyance are mainly due to engine noise, often at high and intermittent engine speeds (for example revving engine, fast acceleration, noisy exhaust) and for vehicles with higher than average noise levels such as sports, SUV and off-road vehicles. Another example of single events is the noise experienced near bus stops, construction sites or freight access roads where acceleration and deceleration noise is periodically repeated without necessarily dominating the LDEN or Lnight.

EN 16 EN
b) Increased property value c) Improved living, work and recreation environment a) Reduced need for noise abatement programmes (barriers, road surfaces, sound insulation) and cost saving: easier planning of new or upgraded roads b) Less local protest
2. Road authorities, national and local authorities
c) Less need for regulation and enforcement 3. Health authorities and government
a) Reduced healthcare costs
a) Increased costs for extra noise control including design, testing and materials; in particular for lorries, buses and trucks b) Balancing of noise requirements with other design constraints such as weight, fuel consumption, exhaust emissions, cooling and space c) Improved environmental image as a sales point d) In some cases, conflict with sound perception of SUVs, sports and luxury cars (industry claims that drivers of such vehicle types want noisy vehicles)
4. The automotive industry (OEMs, tyre and supplier industry)
e) Technical manipulation or cycle beating may occur to avoid noise reduction cost/effort.
5. Consumer market a) Cars: small price increase a) Price increase, mainly for lorries, trucks and buses 6. Professional market b) Some market advantage for new fleets, for example rental cars and vans, taxis, buses, delivery or municipal vehicles in urban environment or quiet areas. Benefits from tax incentive programmes or privileged access to sensitive areas.
Table 2: Stakeholders and general effects of reducing vehicle noise levels
Once the legislation on noise emissions has been adopted at the EU level and subsequently approved under the UN-ECE umbrella, all Member States and all parties to the 1958 UN-ECE Agreement and to the associated Regulations No. 51 and 59 would be affected.
As the Directive is closely linked to UN/ECE Regulations, it also has a worldwide impact. Countries outside the EU will also benefit from reduced traffic noise levels if the same standards are applied for vehicles imported from the EU.
2.6. Evolution of the problem
The environmental impact of road traffic noise has increased fairly continuously over the past 20 years and is, without a change of policy or major technical or economical developments, expected to continue doing so. The last reduction of the noise limits for motor vehicles did not lead to the expected positive effects for citizens. Reasons for this are mainly the changes in vehicle technology and the inadequate test cycle. In order to reduce the negative impact on citizens it would therefore be necessary to introduce an improved noise test method together with new limit values.
The main factors for the increase of the number of people that are highly annoyed or highly disturbed in their sleep by traffic noise are the increase of traffic intensities, the construction of new roads, the increase of the total population in general and particularly the relative increase of the urban population.
Over the past two decades annual passenger car mileage has increased by 1.6 % per year on average. Buses and coaches have an annual mileage increasing by 0.6 % per year and road freight transport mileages have increased by 1.2 %. These growth rates are assumed constant in the calculation of the future impact of road traffic noise (see the Commission's Green Paper on Noise). The development of average traffic noise

EN 17 EN
levels up to 2030 under the baseline scenario (Option 1) is presented in Figure 4. If current average traffic volume continues to grow as in the past 20 years at 1.6% annually, this would result in a 1.4 dB increase in traffic noise levels.
As the number of highly annoyed and highly sleep disturbed people is related to the total population as a function of the sound exposure, it logically increases with an increasing population. In addition, the already large fraction of the total population living in urban areas of around 50 % will increase faster than the population in rural areas. As the population in urban areas is exposed to higher noise levels, the environmental impact is expected to increase slightly faster there than for the total population.
The construction of new roads will expose new areas and thereby new people to road traffic noise. The environmental impact of new road construction is however deemed to be small in comparison to the two aforementioned effects.
The total amount of vehicle kilometres is expected to increase a factor 10 faster than the total population in the next 20 years. Although the number of quieter vehicles is expected to grow in the future, their annual mileage increases more quickly than their percentage. Traffic intensity growth is therefore the most decisive factor in the evolution of vehicle noise. As the latter is proportionate to the number of highly annoyed and highly sleep disturbed people, the negative impact of road noise on population is expected to grow if no action is taken.
2.7. EU right to act
The legal basis of this initiative is Article 114 of the Treaty on the Functioning of the European Union on the approximation of laws.
Based on this article, Framework Directive 2007/46/EC25, which replaced Directive 70/156/EEC, established an internal market for motor vehicles while ensuring a high level of protection of health, safety and the environment. As it already harmonises the laws of the Member States relating to the noise emission limits and the type-approval procedure for motor vehicles, any modifications to the Directive can only be done at the EU level. This does not only prevent fragmentation of the internal market, but also ensures equal health, safety and environmental standards across the EU and offers advantages of economies of scale: products can be made for the whole European market instead of being customised to obtain national type-approval for every single Member State. Consumers benefit from lower product prices, which are constantly under pressure owing to EU-wide competition.
Given the current levels of environmental noise and affected citizens, and the fact that EU noise limits have not changed in the last decade despite increasing traffic levels, a change in limits to remedy this situation is considered proportional.
3. OBJECTIVES
3.1. Policy objectives
The general objective of the present initiative aims to ensure a high level of health and environmental protection for European citizens while ensuring the good functioning of the internal market for motor vehicles. The specific objective is to reduce the negative impact of noise exposure of European citizens caused by motor
25 http://eur-lex.europa.eu/LexUriServ/LexUriServ.do?uri=OJ:L:2007:263:0001:0160:EN:PDF

EN 18 EN
vehicle traffic. This concerns all new types of passenger cars, trucks, lorries and buses which would be approved after a possible legislative measure comes into force. The operational objective is to update the test method in a way that reflects recent developments in technology, driving conditions and review and further reduce if necessary noise emission levels for motor vehicles.
GE�ERAL SPECIFIC OPERATIO�AL
1. To ensure a high level of health and environmental protection
1. To reduce the negative impact of noise exposure of European citizens caused by motor vehicle traffic
2. To safeguard internal market for motor vehicles
2. To ensure the good functioning of the internal market for motor vehicles with regard to their noise emissions
To modify and improve the applicable test methods and requirements within the European system for the type-approval of motor vehicles with regard to their noise emissions
Table 3: Policy Objectives
3.2. Consistency with other policies and objectives
This initiative is in line with the Commission's goal to reduce the noise emissions of all means of transport (motor vehicles, railways, airplanes) and outdoor machinery in order to improve the living conditions for the European citizens. In particular it complements the previous initiatives that have addressed the issue of noise from roads such as Directive 2001/43/EC and Regulation No 661/2009 covering tyre noise and the Environmental Noise Directive 2002/49/EC.
The planned measure takes into account the new mandatory noise limits for tyres, which are expected to be stricter from 2012 onwards. The initial limits were so lenient that most tyres fulfilled the requirements resulting in no reduction in environmental noise in the short term. An extensive study was performed by the Forum of European National Highway Research Laboratories (FEHRL)26, illustrating that quieter tyres are already on the market, and that stricter limits would not jeopardise safety, such as the braking performance on wet surfaces (wet grip) or the rolling resistance of a tyre on the road which is has a great influence on fuel consumption and CO2 emissions.
The Environmental Noise Directive (END) 2002/49/EC, requires noise mapping of major agglomerations, roads, railways and airports, and action planning. A first round of noise mapping has been completed in 2008 and the END has recently been evaluated. Numbers of seriously affected inhabitants near roads have been quantified, resulting in a more detailed picture of the distribution of noise impact (see Noise Observation and Information Service for Europe: www.eea.eionet.europa.eu). Earlier figures of seriously annoyed inhabitants are confirmed, but it emerges that by far the highest numbers of highly exposed people are in agglomerations, i.e. urban areas. Given the busy traffic on local roads and junctions, and the frequent stop-and-go driving during peak periods, the contribution from power train noise from all types of vehicle may be quite significant.
4. POLICY OPTIO�S
Next to the baseline (Option 1) four alternative options were considered. All alternative options foresee a transition to the new test method as the old method has
26 http://ec.europa.eu/enterprise/sectors/automotive/files/projects/report_tyre_road_noise1_en.pdf

EN 19 EN
proven inadequate. The differences between the alternative options are the proposed limit values and, as concerns Option 4 and 5, the phasing of the limit values.
Although it was clear at the outset that Option 2 and Option 3 were unsuitable for reaching the objectives, the full analysis of their effects was considered necessary to demonstrate the consequences of too little ambition to industry stakeholders. For the elaboration of the limit values in Options 4 and 5 the equivalent limit values derived in Option 3 were taken as a starting point, as these values represent the consequences of the transition to the new test method B. It was then assessed which level of limit value reduction would be effective and feasible. This assessment took the percentage of non-compliant vehicles for different limit value reductions and the impact of the allowances for special vehicle categories into account. The effects of the lowering of tyre noise limit values were also taken into account. Modifications with regard to the allowances are as proposed in Footnote 14 under section 2.3.1 for all the options but Option 1.
An overview of all options and the rationale behind their design is provided below.
Option 1: �o policy change: old test method and the existing limit values
In this option the current limit values together with the allowances will remain valid, as well as the measurement method A.
Option 2: �ew test method and the existing limit values
In this option the new measurement method B will be combined with the current set of limit values. The limit values stay unchanged and are the same as in Option 1.
Option 3: �ew test method and limit values equivalent to old ones
This option aims at the use of the new test method in combination with limit
values, such that they do not lead to more severe requirements than incorporated in the current test method and applicable limit values. This option foresees new limit values that will not modify the level of stringency compared to the old system. The information used to derive the new limit values incorporates the differences between old and new test results, the regression equation of the new test results expressed as a function of the old results, the percentage of non-compliant vehicles under the new limit values and the evaluation of the allowances for special vehicle categories.
Option 4: �ew test method and reduced limit values introduced in one stage
Option 4 proposes new limit values in combination with the new test method in such a way that a reduction of the authorised noise emissions per motor vehicle may be expected.
The proposed reduction of the vehicle noise limit values aims to build on the reduction of tyre road noise, resulting from the introduction of stricter limit values for tyre rolling noise. The reduction of these limit values will come into force on 1 November 2012. Assuming an implementation period of 1 year for less noisy tyres to become available for new vehicles types the introduction of the reduced vehicle noise limit values might take effect from 1 January 2014.
In order to avoid the necessity to change the noise emission of existing types of vehicles, that have already been type approved, within a short period of time, it is proposed to put the reduced limit values into force according to the following schedule.
Light vehicles Heavy vehicles Implementation date

EN 20 EN
1 stage Type-approval of new types of
vehicles
- 3 dB(A) - 2 dB(A) 1 January 2014
From 1 January 2016 the first registration of new vehicles is only possible if they fulfil the proposed new limit values.
Table 4: Option 4 – Proposed reduction of limit values
Option 5: New test method and reduced limit values introduced in two stages
In comparison to Policy Option 4, in Policy Option 5 a more ambitious final target for noise reduction is pursued. For the short term, however, a less ambitious target is aimed for a first step of limit value reduction. This step would be followed by a second step in a later stage that would reach the final goal. The considerations concerning the justification of allowances apply as well.
Also in option 5 the proposed first reduction step of the vehicle noise limit values aims to build on the reduction of tyre road noise resulting from the introduction of stricter limit values for tyre rolling noise. The reduction of these limit values will be in force from 1 November 2012. However, a considerable number of tyres that are currently on the market will be able to fulfil the future limit values for rolling noise.
As the first step of option 5 constitutes a smaller limit value reduction than the proposals of option 4 it is possible to carry out the necessary development work with tyres that are already available. Therefore the first step reduction can be introduced on 1 January 2013. The second step will require more development effort and a more drastic set of technical measures: this step can be introduced from 1 January 2015. The total reduction would be 4 dB(A) for light vehicles and 3 dB(A) for heavy vehicles. The proposed reduction for heavy vehicles in policy options 4 and 5 is lower due to the strong influence of tyre noise for these vehicles in the new test method. Heavy vehicles will be required to use traction tyres on the drive axle which increases the overall noise emissions by at least 1 dB(A).
In order to avoid the necessity to change the noise emission of existing types of vehicles, that have already been type approved, within a short period of time, it is proposed to put the reduced limit values into force according to the following schedule:
Light vehicles Heavy vehicles Implementation date 1st stage Type-approval
of new types of vehicles
- 2 dB(A) - 1 dB(A) 1 January 2013
2nd stage Type-approval of new types of
vehicles
- 2 dB(A) - 2 dB(A) 1 January 2015
From 1 January 2017 on, the first registration of new vehicles is only possible if they fulfil the proposed new limit values of stage 2.
Table 5: Option 5 – Proposed reduction of limit values
More ambitious options have not been explored as stricter limit values than the ones in Options 4 and 5 were considered to be unrealistic under the time limits foreseen. The decision not to go further also took into account the economic situation of the industry and the expected effects of other legislative initiatives that the industry will have to comply with in the foreseeable future, such as new vehicle exhaust emission limits and access to repair and maintenance information. In order to achieve the maximum environmental benefit and taking into account the technical possibilities

EN 21 EN
and the conclusions from the cost benefit analysis a noise reduction for all types of vehicles is proposed. Sectoral combinations like reduced limits for some vehicle categories only are therefore considered inappropriate.
5. A�ALYSIS OF IMPACTS
5.1. Approach
The present impact assessment covers the environmental, social and economic aspects of the five policy options.
All the impacts of the 5 policy options have been monetized in terms of their economic, environmental and social impacts based on the available data and the underlying assumptions will be explained further in the report. The environmental impact is defined in terms of reduction of LDEN, Lnight and single event levels. The social impact takes into account the influence of noise on annoyance, sleep disturbance, health effects and quality of life. The economic impacts include their monetisation, reduced need for traffic noise abatement solutions and costs to industry, following guidelines on cost benefit analysis.
5.2. Environmental impact
Methodology
Lowering vehicle noise limits is intended to reduce the impact of environmental noise on the population. In terms of current legislation the impact of environmental noise is the time averaged equivalent noise level LDEN and the averaged night time noise level Lnight at facades of dwellings, calculated as required by the Environmental Noise Directive 2002/49/EC. Noise levels are presented in noise maps27 on the basis of statutory noise prediction models. Data from noise maps of agglomerations and major roads is further used to assess numbers of affected people (see section 5.3: Social and health impacts).
The average LDEN and LNight for typical EU roads is estimated from the following parameters:
road type: those are grouped into residential roads, main roads, arterial roads and motorways, rural roads and motorways. The total road length for each road type in the EU is based on available data from Eurostat and some national authorities28. (for detailed overview of road types and lengths in the EU27 please refer to Annex 5).
vehicle type and speed: cars, vans, buses, lorries and heavy goods vehicles.
traffic type: it can be divided into intermittent or free flowing. The traffic type only varies for residential and main urban roads. Intermittent traffic conditions cause frequent variation in vehicle engine speeds due to gear change and acceleration/deceleration. It occurs at junctions, crossings and traffic lights, but also in residential areas with traffic humps and obstacles, and is known to be more annoying than continuous noise from a free traffic flow of similar noise level. A general estimate of the percentage of urban/suburban roads with intermittent traffic made for the purpose of this analysis is one third, 33 % of the total urban length of residential and main roads. This assumption can be supported by considering the average distance required for acceleration (from first to third gear) and deceleration
27 EEA NOISE database (Noise Observation and Information Service for Europe)
http://noise.eionet.europa.eu/ 28 UK Department for Transport, German road authorities and the Dutch statistical office CBS.

EN 22 EN
(often using the engine) and the average distance between stopping points such as junctions, crossings and traffic lights. The distance affected near any junction is in the order of 100 meters on either side. For an urban road length of 1 km, then at least 200 m has accelerating or decelerating traffic.
traffic intensity in vehicles/hour for each vehicle type and for day/evening/night
periods: the traffic intensity is estimated based on available noise mapping data but also considering the potential variation in European Member States.
a representative noise emission level for each vehicle type in each road situation is based on an existing database of urban traffic measurements29 which can be related to type test results.
total road length in the EU27: the total road length in the EU27 is 5 million (see Annex 5). For each road type a correction is made for the part without dwellings, for example farmland along rural roads and motorways, commercial or public buildings on urban roads and parks and open areas along residential roads. Some roads also have traffic restrictions or very low traffic volume. As a consequence an estimated 49 million, about 10%30 of the population, is hardly exposed to traffic noise. The population for the EU27 is taken at 500 million in 2010; the numbers of inhabitants per dwelling are taken at 2,4, all based on Eurostat data. On that basis the number of road km deemed to be relevant for the analysis is reduced to less than 3 million km.
average distance of dwelling facades to the road based on the road type and its typical speeds and traffic flow. For arterial roads and motorways with high speeds and traffic intensity, more dwellings are affected per kilometre than residential and main roads. Reflections and attenuation effects are not taken into account here, even though in some situations an increase in exposure levels can occur such as in narrow streets or street canyons. For more detailed information regarding the calculation of the equivalent sound pressure level at a characteristic distance from the road see
Annex 4.
Residential road with
intermittent traffic
Residential road with free
flow traffic
Main road with
intermittent traffic
Main road with free flow
traffic
Arterial road with free flow
traffic
Urban motor way with free
flow traffic
Rural motor way with free
flow traffic
Rural road with free flow
traffic dLDE� Option 1 54,4 52,3 67,3 65,3 74,1 71,5 73,6 55,0 Option 2 56,2 54,1 68,9 67,0 75,7 73,1 75,2 56,6 Option 3 54,4 52,3 67,3 65,3 74,1 71,5 73,6 55,0 Option 4 51,6 49,8 64,4 62,9 71,7 69,1 71,1 52,7 Option 5 50,4 49,4 63,2 62,7 71,4 68,9 70,9 52,3 dL�IGHT Option 1 45,7 43,1 57,0 54,8 65,0 63,4 65,3 46,3 Option 2 47,5 44,9 58,4 56,4 66,7 64,9 66,9 47,8 Option 3 45,7 43,1 57,0 54,8 65,0 63,4 65,3 46,3 Option 4 43,0 40,7 54,2 52,4 62,7 61,0 62,9 43,9 Option 5 41,9 40,1 52,9 52,1 62,4 60,7 62,6 43,5 Table 6 Calculated average LDEN and Lnight levels for policy options 1-5. Highlighted figures indicate levels
above 55/65/70 dB(A) for LDEN and 45/55/60 dB(A) for Lnight which are considered harmful
29 Steven, H., Investigations on Noise Emission of Motor Vehicles in Road Traffic, Final Report of
Research Project 200 54 135, RWTÜV Fahrzeug GmbH, Würselen, February 2005. 30 The population for EU27 is taken at 500 million in 2010; the numbers of inhabitants per dwelling are
taken at 2,4 all based on Eurostat data.

EN 23 EN
The differences between the policy options are set out in Table 7, which shows that the effect on LDEN and Lnight is quite similar, due to the fact that Lnight in most cases determines the LDEN. Option 2 shows an increase in impact due to the fact that effectively, higher noise levels would be allowed (average increase 1,7 dB(A).
Table 7 Differences in LDEN and Lnight for each policy option. Zero reductions or increases are highlighted.
The average reduction in traffic noise levels is 2,5 dB(A) for option 4 and 3,1 dB for option 5. These reductions are higher for intermittent traffic, 2,8 dB(A) for option 4 and 4,1 dB(A) for option 531. They take effect only gradually, and only are fully in place after all vehicles are replaced, i.e. 13 years after coming into force of the new limits as illustrated in Figure 4. Part of the reduction may occur earlier due to the changes in tyre noise levels, especially for free flowing traffic. The level of LDEN = 72 dB(A) is typical along a busy arterial road. For further information regarding the
Average traffic noise level without growth
65
66
67
68
69
70
71
72
73
74
75
76
77
78
79
80
2010 2015 2020 2025 2030
Tra
ffic
nois
e level dB
(A)
Option 4
Option 5
Option 2
Options 1/3
Average traffic noise level including growth
65
66
67
68
69
70
71
72
73
74
75
76
77
78
79
80
2010 2015 2020 2025 2030
Tra
ffic
nois
e level dB
(A)
Option 4
Option 5
Option 2
Options 1/3
computation method see Annex 8.
Figure 4: The effect of options 1 to 5 on average traffic noise levels during 20 years without (left) and with (right) annual growth of traffic volume of 1.6%.32
Time delays in environmental impact
31 Figures calculated as simple average of the values in table 7 32 TNO report: VENOLIVA - Vehicle Noise Limit Values; Comparison of two noise emission test
methods Specific Contract No SI2.545143
Residential road with
intermittent traffic
Residential road with free
flow traffic
Main road with
intermittent traffic
Main road with free flow
traffic
Arterial road with free flow
traffic
Urban motor way with free
flow traffic
Rural motor way with free
flow traffic
Rural road with free flow
traffic
dLden Option 1 0,0 0,0 0,0 0,0 0,0 0,0 0,0 0,0 Option 2 + 1,8 + 1,8 + 1,5 + 1,7 + 1,6 + 1,6 + 1,7 + 1,5 Option 3 0,0 0,0 0,0 0,0 0,0 0,0 0,0 0,0 Option 4 - 2,8 - 2,5 - 2,9 - 2,4 - 2,4 - 2,4 - 2,4 - 2,4 Option 5 - 4,0 - 2,9 - 4,2 - 2,6 - 2,7 - 2,7 - 2,7 - 2,7 dLnight Option 1 0,0 0,0 0,0 0,0 0,0 0,0 0,0 0,0 Option 2 + 1,8 + 1,8 + 1,4 + 1,6 + 1,6 + 1,5 + 1,6 + 1,5 Option 3 0,0 0,0 0,0 0,0 0,0 0,0 0,0 0,0 Option 4 - 2,7 - 2,5 - 2,8 - 2,4 - 2,4 - 2,4 - 2,4 - 2,3 Option 5 - 3,8 - 3,1 - 4,0 - 2,7 - 2,7 - 2,7 - 2,7 - 2,7

EN 24 EN
If the reduced noise limits actually do affect real vehicle noise levels, they will not fully take effect on the traffic noise until the majority of vehicles have been replaced. This period will correspond to the average lifetime of vehicles, typically about 12 years for cars. In addition, due to the increasing amount of road traffic, the benefits in terms of noise reduction may result in delayed increase in environmental noise instead of a net reduction. Another issue related to the timescale of the environmental impact is the mileage of cars depending on car age. New cars run the highest mileages, especially on motorways, whereas for older cars the mileages reduce by more than half but run more in urban and suburban areas. This effect is illustrated in Figure 5 showing the market penetration of quieter cars over time based on vehicle numbers (fleet size) and on mileage. The annual mileage of quieter vehicles increases more quickly than the percentage of quieter vehicles. The implication is that the impact of reduced noise limits does not benefit urban roads as soon as might be expected.
Negative environmental impacts of the measures under consideration are not expected, as the technical modifications required to comply with stricter limit values are unlikely to lead to an increase in fuel consumption and/or emissions.

EN 25 EN
Market penetration of quieter cars
0%
10%
20%
30%
40%
50%
60%
70%
80%
90%
100%
2012 2017 2022 2027 2032
Fra
ction [-]
Fleet fraction
Mileage fraction
Figure 5: Market penetration for the percentage of quieter cars in the fleet and the percentage of
mileage driven by quieter cars.
5.3. Social and health impacts
Methodology
The social impact of road traffic noise is commonly measured as the percentage of seriously annoyed people with LDEN ≥ 55 dB at the dwelling facade. The annoyance levels may affect quality of life and health in general.
Quality of life covers a range of factors including concentration and speech intelligibility at work, home and school, which are difficult to quantify, and quality of residential, recreational and preservation areas, where a quiet environment is valued. Although high noise levels in urban areas affect most people, increasingly effort is also made to protect some rural areas from traffic noise, which is often present.
In terms of health, links have been made to the occurrence of myocardial heart disease, hypertension and stress and sleep disturbance. Also estimates have been made of the number of Disability Adjusted Life Years (DALYs)33 due to environmental factors including noise exposure.
The annoyance level has been demonstrated to correlate well with LDEN for different types of traffic noise source. In a similar way, sleep disturbance is correlated with Lnight. For further information regarding the calculation method see Annex 7.
The overall numbers of seriously annoyed and sleep disturbed people in the EU for the different road types can be globally estimated from average LDEN and Lnight levels, average numbers of exposed people along each type of road and known dose-effect relationships. As intermittent traffic is separately quantified, the part of the
33 http://en.wikipedia.org/wiki/Disability-adjusted_life_year

EN 26 EN
population seriously annoyed mainly by power train noise can also be assessed. This procedure can then be repeated for different noise emission data derived for each policy option resulting in the LDEN and Lnight levels as shown in Table 6. For single events such as individual excessively noisy vehicles, less is known about their impact even though such events are well recognized to cause incidental annoyance. If such events are reoccurring, then they can be included in average noise level assessments, otherwise not.
Analysis
Building on the previously calculated LDEN and Lnight levels, exposed numbers of people and the dose-effect relationships presented in Annex 7, have been made with regard to the number of annoyed, highly annoyed and sleep disturbed people for each policy option. The results are shown in figures 6 and 7.
Millions of Highly Annoyed, Policy Options 1-5
0
5
10
15
20
Residential
(urban/
suburban)
intermittent
Residential
(urban/
suburban) free
flow
Main roads
(urban/
suburban)
intermittent
Main roads
(urban/
suburban) free
flow
Arterial roads
(urban/
suburban)
Urban
motorways
(urban/
suburban)
Rural
motorways
Rural roads
Millions H
A
Option 1
Option 2
Option 3
Option 4
Option 5
Figure 6: Millions of highly annoyed people per road type for each policy option34
Millions of Highly Sleep Disturbed, Policy Options 1-5
0
5
10
15
20
Residential
(urban/
suburban)
intermittent
Residential
(urban/
suburban) free
flow
Main roads
(urban/
suburban)
intermittent
Main roads
(urban/
suburban) free
flow
Arterial roads
(urban/
suburban)
Urban
motorways
(urban/
suburban)
Rural
motorways
Rural roads
Millions H
SD
Option 1
Option 2
Option 3
Option 4
Option 5
Figure 7: Millions of highly sleep disturbed people per road type for each policy option
34 TNO report: VENOLIVA - Vehicle Noise Limit Values; Comparison of two noise emission test
methods Specific Contract No SI2.545143. The detailed values can be found in the Annex.

EN 27 EN
Millions Annoyed and Sleep Disturbed
0
20
40
60
80
100
120
140
Option 1 Option 2 Option 3 Option 4 Option 5
Millions o
f people
MHAnnoyed
MHSD
MAnnoyed
MSD
Million highly annoyed
Million highly sleep disturbed
Million annoyed
Million sleep disturbed
Option 1 27
Option 2 30
Option 3 27
Option 4 22
Option 5 22
Figure 8 and Table 8: Calculated total millions of highly annoyed/annoyed and highly sleep disturbed/sleep disturbed people for each policy option
As the above graphs demonstrate, people living in urban areas, where both traffic intensity and population density are high and much of the population lives close to roads, are mostly affected by road noise.
Table 9 shows the impact of traffic growth over time on numbers of affected people. The average increase in highly annoyed people is approximately 300.000 people per year (0,55%/year) and 100.000 people per year (0,41%/year) for highly sleep disturbed people. Although the effect of the reduction of limit values proposed under policy option 5 will be significant, the impact assessment shows that due to external factors the preferred option may not have such big net benefits in real life. The overall number of annoyed and highly annoyed people might still be unsatisfying. If the expected increase in traffic density in the near future is taken into account a part of the predicted positive effects of the limit value reductions will be reduced.
Highly annoyed Highly sleep disturbed Option
2010 2015 2020 2025 2030 2010 2015 2020 2025 2030 1 55 56 58 60 61 27 27 28 28 29 2 64 65 67 69 71 30 30 31 32 32 3 55 56 58 60 61 27 27 28 28 29

EN 28 EN
4 44 45 46 47 49 22 23 23 24 24 5 41 43 44 45 47 22 22 22 23 23
Figure 9: The predicted number of highly annoyed (HA) and highly sleep disturbed (HSD) people in millions for the different policy options until 2030 (Options 4, 5 with immediate effect from 2010)
The measures under considerations are not expected to affect employment and working conditions. Furthermore, no adverse impact on road safety is expected as the technical measures and modifications necessary to comply with the new test limit values are not likely to affect any of the vehicles' active or passive safety features.
5.4. Economic impacts
The main economic impacts of policy options 1 to 5 are the technical economic impact which is mainly borne by the automotive industry and the social-economic impact which is borne by society.
Economic impact for industry
The technical-economic impact of changing the directive is mainly for the car industry (manufacturers, suppliers and tyre industry) and consists of changes to the test method and the limits, resulting in costs incurred to achieve noise reductions. The future noise reduction due to quieter tyres is assumed to be ensured by the tyre noise directive, and although some costs may be borne by the tyre industry, quieter tyres are already available on the market for no or little additional cost and will be compulsory after 2016. The costs for complying with the Regulation on tyre noise35 are not included in this analysis.
Additional costs for noise reduction consist of additional production costs per unit and development-, engineering- and testing-costs, which are relevant for new models or model upgrades. Additional costs due to administrative burden are not foreseen as the required manpower for testing and administration will not change significantly. The costs for exterior noise reduction borne by industry are estimated based partly on information from industry, partly on expert estimates by the authors of the study performed by TNO, as very little information on this topic is publicly available. The European Automobile Manufacturers' Association (ACEA) and independent experts (University of Duisburg-Essen) were consulted concerning additional costs in relation to stricter noise limits. The following elements were suggested:
(1) Costs can increase exponentially for each dB extra noise reduction.
(2) Additional costs will increase significantly if major design changes are necessary, whereas evolutionary changes using existing solutions are less expensive.
(3) Additional costs will vary per vehicle type and may increase with shorter development time, but do not depend on the vehicle price.
(4) Between 1-2 dB(A) reduction is possible with available technology.
(5) The starting point will determine the costs, i.e. if 1-2 dB(A) is already easily achievable for existing vehicles, less extra development effort for these first dB(A) noise reduction is required.
35 http://eur-lex.europa.eu/LexUriServ/LexUriServ.do?uri=OJ:L:2009:200:0001:0024:EN:PDF

EN 29 EN
(6) Additional production costs may decrease over time due to increased design integration, efficiency in the production process and lower component and materials costs.
(7) Additional production costs are expected to be higher than the additional development costs, in particular for large production series.
ACEA state on their website and in brochures that around 20 billion Euro are spent annually on R&D, or 4% of total turnover, implying a total annual turnover of around 500 billion Euro. It is not known what part of this R&D funding is dedicated to noise control, but given the unchanged limits over the past decade and the many other design priorities it can be assumed that only a small part is spent on exterior noise reduction. For more information on the parameters used for the economic analysis see Annex 6.
Scope for reduction, lead time, short and long term solutions
According to the ACEA website, lead times for vehicle development can be up to 5 years, and the product cycle or time they are kept in production is up to 7 years. This implies that fundamental design changes may only come into production after 5 years, and that all existing vehicle models will be fully replaced after 7 years.
Short term solutions for noise reduction for up to 3 - 5 years ahead may include engine tuning and speed control, engine part damping, shielding and enclosure absorption, quieter engine exhaust and inlet. These solutions are all feasible by modification of existing components and may occur within a normal development process. They may well produce exterior noise reductions of 1 - 4 dB(A), although some recent examples are known of larger reductions up to 8 dB(A), see for example the Dutch PIEK program which has encouraged some manufacturers to produce special versions of delivery vehicles with very low powertrain noise.
Longer term solutions for further than 5 years ahead may include new engine design or powertrain types, which generally are sought also for improvement of other criteria such as fuel efficiency, exhaust emissions and engine performance. As in the past, the powertrain noise may benefit from engine innovations such as was the case for diesel engines in recent years.
The database analysis showed that for most existing vehicles, there is 1 - 2 dB(A) scope for noise reduction, based on the compliance rates. This means that for new vehicle models for which the new directive would be applicable, larger reductions should be feasible, as in practice no more noise reduction is applied than strictly required by the limits.
Analysis
For the purpose of this analysis it is assumed that for all manufacturers all the development costs for exterior noise reduction typically occur within 3 years before production of a new model that must comply with new limits. The additional production costs occur during the production cycle of 7 years. As all the current models on the market will gradually be replaced over a period of 7 years, both the development costs and production costs of all models will be distributed over this 7 year period, with the development costs starting before the introduction of each new model, and the additional production costs commencing at market introduction and gradually diminishing over the 7 year period.

EN 30 EN
Additional development costs are expected over a 7 year period during which new models are developed that must comply with the new limits. The noise reduction must be achieved on power trains, as tyre noise automatically will be reduced due to the Regulation on tyre noise. Estimation formulas for both costs are deemed to be consistent with the available information from consultation. The average additional development cost for 1 dB(A) noise reduction is estimated at 1 man year + facility costs, approximately € 150000. Such costs are considered to be comparable independent of vehicle group (cars, vans, buses, lorries, heavy goods vehicles).
The additional production costs can be calculated from an estimate for additional materials and manufacturing, assumed proportional to the noise reduction, and slowly decreasing over the lifetime of the production cycle to take into account gradual efficiency improvements in production. The additional production costs are assumed for short term noise reduction solutions, but reducing to zero after 7 years due to gradual integration and introduction of longer term and more effective design solutions.
The value of additional production costs is estimated at 20 Euro per unit and dB(A) for cars and vans and 120 Euro per unit and dB(A) for other vehicles. The differences between light and heavy vehicles can be approximately related to vehicle mass. These figures are assumed to rise linearly with increasing noise reduction but reduce to zero over the production cycle of the vehicle (7 years). All additional costs are deemed negligible after 2020.
The combined costs due to development and production show that the production costs are generally much higher than the development costs when taken over a 7 year period. The following table shows the costs for options 4 and 5. The options 1 to 3 do not require a change in the automotive production therefore no additional development and production costs are considered. Those are assumed to be 0 and Option 4 and 5 are only looked at more closely in the tables below.
M€ Option 4 Option 5 Year Development Production Total Incl. discount
4% Development Production Total Incl. discount
4% 2010 42,3 0,0 42,3 42,3 111,1 0,0 111,1 111,1 2011 42,3 0,0 42,3 40,7 111,1 0,0 111,1 106,9
2012 42,3 0,0 42,3 39,1 111,1 0,0 111,1 102,7 2013 42,3 1113,2 1155,5 1027,3 111,1 1608,3 1719,4 1528,5 2014 42,3 954,2 996,5 851,8 111,1 1378,5 1489,6 1273,3 2015 42,3 795,1 837,5 688,3 111,1 1148,8 1259,9 1035,5 2016 42,3 636,1 678,4 536,2 111,1 919,0 1030,1 814,1 2017 0,0 477,1 477,1 362,5 0,0 689,3 689,3 523,8 2018 0,0 318,1 318,1 232,4 0,0 459,5 459,5 335,8 2019 0,0 159,0 159,0 111,7 0,0 229,8 229,8 161,4
2020 0 0 0 0 0 0 0 0,0 2021 0 0 0 0 0 0 0 0,0 2022 0 0 0 0 0 0 0 0,0 2023 0 0 0 0 0 0 0 0,0 2024 0 0 0 0 0 0 0 0,0 2025 0 0 0 0 0 0 0 0,0 2026 0 0 0 0 0 0 0 0,0 2027 0 0 0 0 0 0 0 0,0
2028 0 0 0 0 0 0 0 0,0 2029 0 0 0 0 0 0 0 0,0 2030 0 0 0 0 0 0 0 0,0

EN 31 EN
Total M€ 296 4453 4749 3932 778 6433 7211 5993
Table 10 Additional discounted development and production costs in million Euros for options 4 and 5
The impact on the vehicle industry, consisting primarily of additional development and production costs due to extra noise reduction on vehicles, amounts to 4 billion Euros for Option 4 and 6 billion Euros for Option 5. These costs are incurred over a development and production cycle of 3 + 7 years and consist mainly of additional production costs which are no longer incurred after 10 years.
A negative impact on the EU budget is not expected.
Economic impact for society
The main elements of the social-economic impact are perceived monetised benefits of noise reduction, benefits from savings on health costs and benefits from savings on noise abatement. Additional costs for consumers are already implicitly covered by production costs, which are then passed on to consumers to a certain degree. However, the actual change in costs for consumers is very difficult to estimate as very little data is available and the pass on rate largely depends on market conditions and the competitive situation of the industry.
In assessing the benefits it was considered most appropriate to add up all benefits as they are seen as largely independent. Revealed preference valuation does not directly relate to health cost savings or noise abatement savings, as respondents are likely to give an opinion on the value of noise reduction without being aware of any health effects. Vice versa, health costs savings may be made for people who place no value on noise reduction, but are exposed. Savings by road authorities on noise abatement are also to a certain degree independent from revealed preference. Even if the different types of benefits are assumed to overlap to a certain extent, the benefits still far outweigh the estimated costs. Taking the above considerations into account, the overall annual benefits are the sum of each of the hedonic pricing benefits, health savings benefits and noise abatement savings benefits. All of these benefits occur annually as a function of the noise reduction, which takes effect gradually over a 20 year period, with a discount rate of 4%.
The identified health problems linked to the exposure to noise (see section 2.3.2.) lead to the following typical type of costs:
– Costs of medical care (direct costs);
– Economic production losses (direct costs);
– Suffering and grief (intangible costs).
In most studies the costs are measured by means of costs of illness and willingness to pay. It reflects how much citizens are prepared to pay for noise reduction around their homes, and variation in house prices depending on outdoor traffic noise levels.36
36 Position Paper of the Working Group on Health and Socio-Economic Aspects, European Commission,
Environment Directorate-General; www.ec.europa.eu/environment/noise/pdf/valuatio_final_12_2003.pdf

EN 32 EN
Furthermore the studies used the net economic production losses, in other words the loss of consumption due to life lost is not taken into account. To calculate the effects of noise exposure for the costs of illness the value of life years lost has been used, instead of the statistical life expectancy. A first hint of the potential benefits that could be derived if road transport noise is reduced comes from a study calculating the total health costs to be in the order of 500 million Euro in Switzerland. Two types of effect are distinguished, one for people and one for homes. These two effects are valuated together with a third type of benefit. Due to reduction in noise exposure of road traffic, road operators and local authorities save on abatement measures such as noise barriers, quiet road surfaces and dwelling insulation. These benefits also need to be taken into account in the social benefits, since these resources can be spent on other public needs.
Valuation of noise reduction by hedonic pricing
A recommended method to value the benefits of traffic noise reduction is given in the EU position paper on valuation of noise (2003). It reflects how much citizens are prepared to pay for noise reduction around their homes, and variation in house prices depending on outdoor traffic noise levels.
The perceived benefit of noise reduction per household per year, based on willingness-to-pay and hedonic pricing calculation methods, is a figure of 25 €/dB/household/year (2002). The benefits are calculated for the number of exposed persons in the LDEN calculation, which is 451 million. Assuming 2.4 persons per household (from Eurostat 2008) the number of households affected is 188 million. Around 10 % are assumed not to be significantly exposed due to a housing location free of traffic.
For a noise reduction of 1 dB(A) in 2010, when the valuation VHP is 27 € per dB(A) per household per annum, for the exposed EU27 population of 451 million and an average household occupancy of 2.4 persons, the benefits would amount to 27*451/2,4 = 5074 million €/dB(A). In 2020 for an exposed population of 498.2 million and valuation of 29.80 € the benefits amount to 6186 million €/dB(A). These figures differ only slightly from the 2006 FEHRL report, due to differences in exposed population (10% less), population growth (1% instead of 1.7%) and household size (2.4 person/household instead of 2.45).
The calculation is made for a final average noise reduction of 2.5 dB(A) for option 4 and for 3.1 dB(A) for Option 5. The benefits during the appraisal period are listed in the tables below.
Benefits Costs Year Acc. noise reduction
dB Social
benefits
M €*
Health
benefits
M €*
Abatement
savings
M €**
Total
benefits
M €
Acc. total
benefits
M €
Industry
costs
M €*
Acc. total
costs
M €
Acc. net
Benefits
M €
2010 0,0 0 0 0 0 0 42,3 42 -42 2011 0,0 0 0 0 0 0 40,7 83 -83 2012 0,0 0 0 0 0 0 39,1 122 -122 2013 0,0 0 0 0 0 0 1027,3 1149 -1149 2014 0,0 0 0 0 0 0 851,8 2001 -2001 2015 0,2 744 11 4 759 759 688,3 2690 -1931 2016 0,3 1487 33 8 1529 2287 536,2 3226 -938 2017 0,5 2232 65 13 2310 4597 362,5 3588 1009 2018 0,7 2979 108 17 3104 7701 232,4 3821 3881 2019 0,9 3731 160 22 3913 11614 111,7 3932 7681 2020 1,1 4489 221 27 4737 16351 0 3932 12418

EN 33 EN
2021 1,3 5255 291 33 5580 21930 0 3932 17998 2022 1,5 6033 370 39 6442 28373 0 3932 24440 2023 1,7 6824 458 46 7328 35700 0 3932 31768 2024 2,0 7633 554 53 8239 43940 0 3932 40007 2025 2,2 8462 659 60 9181 53121 0 3932 49188 2026 2,5 9318 771 68 10157 63278 0 3932 59345 2027 2,5 9139 880 69 10088 73365 0 3932 69433 2028 2,5 8964 984 69 10018 83383 0 3932 79451 2029 2,5 8793 1084 70 9947 93331 0 3932 89398 2030 2,5 8625 1181 71 9876 103207 0 3932 99274
94707 7831 669 3932 * 4% discount rate applied ** 1% interest rate applied
Table 11: Societal benefits and industry costs of policy Option 4 in million Euros
Benefits Costs Year Acc. noise reduction
dB Social
benefits
M €*
Health
benefits
M €*
Abatement
savings
M€**
Total
benefits
M €
Acc. total
benefits
M €
Industry
costs
M €*
Acc. total
costs
M €
Acc. net
benefits
M €
2010 0,0 0,0 0 0 0 0 111,1 111 -111 2011 0,0 0,0 0 0 0 0 106,9 218 -218 2012 0,0 0,0 0 0 0 0 102,7 321 -321 2013 0,0 0,0 0 0 0 0 1528,5 1849 -1849 2014 0,1 637,5 10 4 651 651 1273,3 3123 -2472 2015 0,3 1270,8 29 7 1307 1958 1035,5 4158 -2200 2016 0,5 2044,9 59 12 2116 4074 814,1 4972 -898 2017 0,6 2822,0 100 17 2939 7014 523,8 5496 1518 2018 0,8 3604,2 151 23 3778 10792 335,8 5832 4960 2019 1,0 4393,3 212 29 4634 15426 161,4 5993 9433 2020 1,2 5191,8 283 35 5510 20936 0,0 5993 14943 2021 1,5 6002,3 363 42 6407 27343 0,0 5993 21350 2022 1,7 6827,9 453 49 7330 34673 0,0 5993 28680 2023 1,9 7672,2 551 56 8280 42953 0,0 5993 36960 2024 2,2 8539,3 659 65 9263 52216 0,0 5993 46223 2025 2,5 9434,2 776 73 10283 62499 0,0 5993 56506 2026 2,8 10362,9 901 83 11347 73846 0,0 5993 67853 2027 3,1 11332,7 1035 94 12462 86308 0,0 5993 80314 2028 3,1 11115,9 1165 94 12375 98683 0,0 5993 92690 2029 3,1 10903,2 1289 95 12288 110970 0,0 5993 104977 2030 3,1 10694,5 1409 96 12200 123170 0,0 5993 117177
112849,7 9446 875 5993 * 4% discount rate applied ** 1% interest rate applied
Table 12: Societal benefits and industry costs of policy Option 5
The comparison between overall costs and benefits clearly shows that the societal benefits far outweigh the costs to industry37. For Option 4 the accumulated total benefits are 103207 million Euros against 3932 million Euros accumulated costs. For Option 5 the benefits are 123170 million Euros compared to costs of 5993 million Euros. In 2030 the net benefits amount to 99 billion Euros for Option 4 and 117 billion Euros for Option 5. The benefits outweigh the costs by a factor 26.2 for Option 4 and 20.6 for Option 5.
Valuation of health effects
37 Although industry will try to pass on these costs to the customers they have to be borne by industry in
the first place.

EN 34 EN
The WHO report on valuation of transport related health effects38 advises to separate the valuation of annoyance and morbidity (illness) effects. Annoyance and sleep disturbance are valued according to a hedonic pricing principle based on the revealed preference method as discussed above. These do not include health costs. The health benefits are defined in terms of savings on costs due to illness and life years lost. These are valued on the basis of the Value of Life Years Lost (VLYL) and the Cost of Illness (COI).
The estimates are derived from a Swiss study and scaled up in proportion to the ratio of Swiss population (7.6 Million) relative to that of the EU27 (500 Million). The annual health benefits for the EU27 then amount to 84.5 million Euros per dB(A) noise reduction, which is equivalent to 5.92 € per person per dB(A) per year.
Benefits from abatement savings
Benefits from savings on noise abatement due to quieter traffic are assessed by estimating the reduced effective noise levels along roads where normally noise barriers, quiet road surfaces or façade insulation would be required. Noise barriers are typically only applicable for motorways and arterial roads where large noise reductions of 10-15 dB(A) are necessary. Quiet road surfaces are a solution for all road types where tyre noise is predominant, although the reduction potential is limited to around 5 dB for motorways and 2,3 dB(A) for urban situations. Façade insulation, with potentially large reduction potential up to around 30 dB(A) is applicable in all situations but is considered here as one of the few available solutions for main and arterial roads in urban areas.
Other solutions such as traffic restrictions, rerouting and speed restrictions are also possible, but tend to have relatively low costs and are not always applicable. These options are therefore not included in the analysis.
The savings are calculated here assuming a critical noise level that requires action to be taken to reduce noise levels. Figures on overall noise abatement spending are difficult to obtain for the whole EU as investment levels differ strongly between countries and even within countries there can be large differences between national and local authority abatement programmes and available funding. There is also a difference in investment levels for new roads and existing ones, as it is easier to factor in costs for noise barriers on new roads.
In situations where the traffic noise is a up to 3 dB(A) above the threshold for noise abatement, a reduction in traffic noise due to policy options 4 and 5 can enable the road authority to avoid some investments. In other situations it may be possible, due to reduced traffic noise levels, to apply quiet road surfaces instead of more expensive noise barriers or façade insulation.
The benefits of savings are therefore calculated for avoided noise abatement and for reduced noise abatement. This is done separately for situations where barriers may be applied and in the urban situation where noise insulation is used.
38 H.J. Boesch et al: Economic Valuation of Transport-related Health Effects: Review of Methods and
Development of Guidance, with a Special Focus on Children, World Health Organization 2008
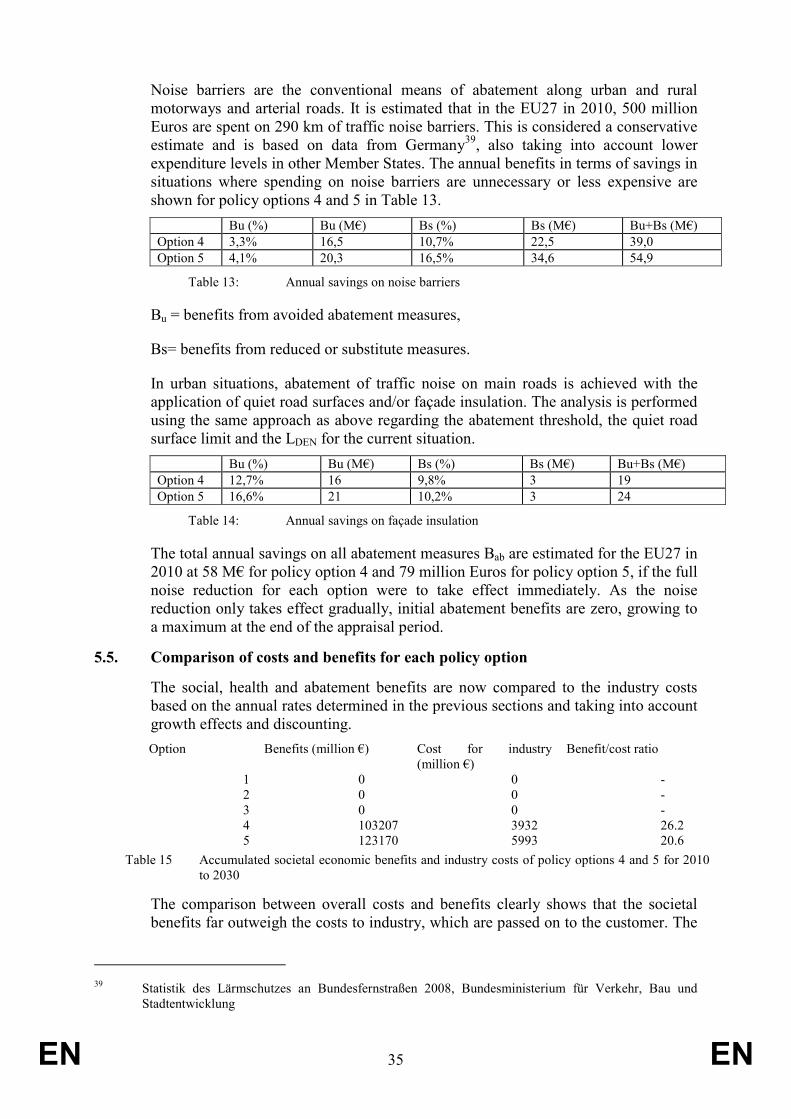
EN 35 EN
Noise barriers are the conventional means of abatement along urban and rural motorways and arterial roads. It is estimated that in the EU27 in 2010, 500 million Euros are spent on 290 km of traffic noise barriers. This is considered a conservative estimate and is based on data from Germany39, also taking into account lower expenditure levels in other Member States. The annual benefits in terms of savings in situations where spending on noise barriers are unnecessary or less expensive are shown for policy options 4 and 5 in Table 13.
Bu (%) Bu (M€) Bs (%) Bs (M€) Bu+Bs (M€) Option 4 3,3% 16,5 10,7% 22,5 39,0 Option 5 4,1% 20,3 16,5% 34,6 54,9
Table 13: Annual savings on noise barriers
Bu = benefits from avoided abatement measures,
Bs= benefits from reduced or substitute measures.
In urban situations, abatement of traffic noise on main roads is achieved with the application of quiet road surfaces and/or façade insulation. The analysis is performed using the same approach as above regarding the abatement threshold, the quiet road surface limit and the LDEN for the current situation.
Bu (%) Bu (M€) Bs (%) Bs (M€) Bu+Bs (M€) Option 4 12,7% 16 9,8% 3 19 Option 5 16,6% 21 10,2% 3 24
Table 14: Annual savings on façade insulation
The total annual savings on all abatement measures Bab are estimated for the EU27 in 2010 at 58 M€ for policy option 4 and 79 million Euros for policy option 5, if the full noise reduction for each option were to take effect immediately. As the noise reduction only takes effect gradually, initial abatement benefits are zero, growing to a maximum at the end of the appraisal period.
5.5. Comparison of costs and benefits for each policy option
The social, health and abatement benefits are now compared to the industry costs based on the annual rates determined in the previous sections and taking into account growth effects and discounting.
Option Benefits (million €) Cost for industry (million €)
Benefit/cost ratio
1 0 0 - 2 0 0 - 3 0 0 - 4 103207 3932 26.2 5 123170 5993 20.6
Table 15 Accumulated societal economic benefits and industry costs of policy options 4 and 5 for 2010 to 2030
The comparison between overall costs and benefits clearly shows that the societal benefits far outweigh the costs to industry, which are passed on to the customer. The
39 Statistik des Lärmschutzes an Bundesfernstraßen 2008, Bundesministerium für Verkehr, Bau und
Stadtentwicklung

EN 36 EN
benefits outweigh the costs by a factor 26.2 for Option 4 and factor 20.6 for Option 5.
5.6. Summary of impacts
Five different policy options for the future test method for vehicle noise emission and corresponding limit values were studied on the basis of recent vehicle test data. The conclusions on these 5 options for the period 2010 – 2030 are presented in the table below:

EN 37 EN
Economic impact Impacts
Option
Environmental impact
Costs for industry (development and production costs)
Benefits for society (hedonic pricing benefits, health and noise abatement savings benefits)
Social impact
Negative impact due to traffic increase
No cost No benefits Negative impact due to traffic increase
Option 1 No policy change: old test method and the existing limit values
(0) (0) (0) (0) Average increase in traffic noise of 1,7 dB(A)
No cost
Negative Impact
Average increase of highly annoyed people by 16% Average increase of highly sleep disturbed people by 11%
Option 2 New test method and the existing limit values
(--) (0) (--) (-)
Negative impact due to traffic increase
No cost No benefits Negative impact due to traffic increase
Option 3 New test method and limit values equivalent to old ones
(0) (0) (0) (0) EUR 3932 million
EUR 103207 million (94707 million EUR of social benefits + 7831 million EUR of health benefits + 669 million EUR of abatement savings)
Average reduction of traffic noise between: - 2,5 and - 2,8 dB(A)
cost benefit ratio 26.2
Average reduction of highly annoyed people by 20% Reduction of highly sleep disturbed people by 19%
Option 4 New test method and reduced limit values in one stage
(+) (-) (+) (+)
EUR 5993 million
EUR 123170 million (112849 million EUR of social benefits + 9446 million EUR of health benefits + 875 million EUR of abatement savings)
Option 5 New test method and reduced limit values in two stages
Average reduction of traffic noise between: - 3,1 and -4,0 dB(A)
cost benefit ratio 20.6
Reduction of highly annoyed people by 25 % Reduction of highly sleep disturbed people by 19 %

EN 38 EN
Table 16: Comparison of Options in terms of their economic, environmental and social impacts
(++) (--) (++) (++)

EN 39 EN
Criterion Option
Effectiveness Efficiency Coherence
Option 1
Does not fulfil general and specific objectives because noise level is not reduced
Option not efficient although it will not generate additional cost for industry as it will not lead to a reduction of noise exposure to citizens
This option is not coherent with the general, specific or operational policy objectives because noise level is not reduced
Option 2
Does not fulfil general and specific objectives because noise level is increased
Option very inefficient although it will not generate additional cost for industry because it will lead to an increase of noise exposure to citizens
This option is not coherent with the general, specific or operational policy objectives because noise level is not reduced
Option 3
Does not fulfil general and specific objectives because noise level is not reduced
Option not efficient although it will not generate additional cost for industry as it will not lead to a reduction of noise exposure to citizens
This option is not coherent with the general, specific or operational policy objectives because noise level is not reduced
Option 4
Good effectiveness, general and specific objectives are fulfilled, acceptable reduction of noise levels
Excellent efficiency, cost benefit ratio is 26.2
This option is coherent with the general, specific or operational policy objectives and would provide a good balance between environmental and economic impacts
Option 5
Very good effectiveness, general and specific objectives are fulfilled, substantial reduction of noise levels
Very good efficiency, cost benefit ratio is 20.6
This option is very coherent with the general, specific or operational policy objectives and would achieve best the environmental goal to reduce the number of highly annoyed or sleep disturbed people
Table 17: Comparison of options in relation to the objectives
Option 1 does not offer any benefit for the reduction of environmental noise. Furthermore the current test method does not have significant advantages above the new test method, so this option is not recommended as it does not fulfil the objectives. This option is not supported by any stakeholder.
Option 2 in fact increases the limit values, because new test method B produces lower test results than the current test method. This option may lead to an increase of road traffic noise impact of around 1,7 dB(A) and will correspond to an increase of the number of highly noise annoyed people by 16 % and the number of highly sleep disturbed people by 11% and is therefore not advisable. It would be in contradiction to the objectives. This option is not supported by any stakeholder.
Option 3 may be introduced without negative consequences for the current vehicle fleet, but it does not produce any positive effect for the road traffic noise impact. It is therefore not recommended. It does not fulfil the objectives and is not supported by any stakeholder.

EN 40 EN
Option 4 is likely to result in a reduction of the noise impact LDEN and Lnight of 2,5 dB(A) for roads with free flowing traffic. For roads with intermittent traffic, where power train noise is dominant, the noise impact reduction is estimated at 2,8 dB(A). The noise impact reduction will correspond to a decrease of the number of highly noise annoyed people by 20 % and the number of highly sleep disturbed people by 19%. As the economic consequences of this policy change for industry are considered manageable, this option can be recommended. This option will yield the highest Benefit-Cost Ratio (26.2). However, the positive environmental and social impact of Option 4 will be lower than the impacts of Option 5. All stakeholders support the introduction of a new measurement method with new limit values. The opinion regarding the stringency of the limits and timeframe for their application is differing. As can be expected industry prefers lenient limit values which are introduced following a long transitional period while some Member States and NGOs prefer tighter limits with a short transition.
Option 5 is likely to result in a reduction of the noise impact LDEN and Lnight of 3,1 dB(A) for free flowing traffic and up to 4 dB(A) for intermittent traffic. The reduction of the number of highly annoyed people will be 25 % and the number of highly sleep disturbed people by 19%. Also for this option the economic consequences for industry are considered manageable. The Benefit-Cost Ratio of this option (20.6) is somewhat lower than for Option 4, but, as this option will give the highest positive environmental and social impacts, it is therefore considered as the preferred option. The two step approach in this option is preferred by the majority of stakeholders, including industry. As above, the position regarding the stringency and the transitional provisions deviates.
5.7. Other impacts of the preferred option
Administrative burdens
The administrative burden for stakeholders is negligible. The procedure of the European vehicle type-approval system remains unchanged. Although the noise test method is modified, the same test track and test instruments can be used. During the monitoring period of the last years industry and approval authorities gathered sufficient expertise allowing a smooth transition from one test method to the other. The change in limit values as such does not lead to an increase in administrative burden.
Impacts on third countries
As it has been assessed in the study (see paragraph 8.4 in the TNO study) the impact on third countries is considered to be not significant. Even certain vehicle types which are not used on the European market like the Japanese KEI cars could fulfil the proposed measures and there is no evidence that the new test method would not be suitable or representative for these categories of vehicles.
Impacts on SMEs
The impacts on SMEs are negligible. The vast majority of automobile producers are multi national companies. Certain niche products of smaller companies are manufactured in small series only which are exempted from the application of this legislation and treated under national law.
EN 41 EN
6. MO�ITORI�G A�D EVALUATIO�
6.1. Indicators of progress towards meeting the objectives
It is important to monitor over time the technical advancement in the industry, in order to track progress towards the reduction of noise emission values of motor vehicles. Accordingly, one of the key indicators to be taken into account for evaluating the performance of the proposed action is the noise monitoring under the Environmental Noise Directive. A noise reduction of motor vehicles should be reflected in a reduction of environmental noise in particular in urban areas.
Though, these depend also on traffic intensity, driving behaviour and other factors. Therefore, an additional indicator is the monitoring of the type-approval values of new models of motor vehicles. A substantial reduction in the measured values is an appropriate indicator whether the chosen option has positively contributed to the environmental objectives related to this policy initiative. This could best be done by continuing the dialogue between the Commission and Member States' authorities, in particular the automotive type-approval authorities.
Findings from monitoring might recommend, taking into account the experience with the first step in noise reduction, developing a continuous strategy of regular limit value reductions until a considerably lower noise emission level is attained, that cannot be further reduced without fundamental changes in vehicle technology or in transport modalities. By timely announcing such a long term strategy the industry will be able to anticipate the future requirements in time and to build its development strategy for new vehicle types on this knowledge.
6.2. Ongoing dialogue with stakeholders
A constant dialogue with the industry, aimed at monitoring the sector and its ability to develop suitable solutions within the next few years will be of utmost importance. In view of the implementation of the improved noise emission requirements, it will be essential to monitor the market and the development of different approaches and technologies towards a reduction of vehicle noise. This includes the automotive manufacturers and the suppliers for key products like tyres, exhaust silencers, gear boxes, engines, etc.. One suitable way of achieving this constant dialogue is to rely on the Working Group for Motor Vehicles (WVWG), where these stakeholders are represented.
The reduced noise levels of motor vehicles are controlled and verified through the permanent type-approval process and the development of the environmental noise situation is monitored by the ongoing noise mapping within the Member States.

EN 42 EN
A��EXES
Annex 1:List of European Directives and amendments related to noise from road traffic
Motor vehicles exterior noise
Directive / amendment
70/157/EC Directive on the approximation of the laws of the Member States relating to the permissible sound level and the exhaust system of motor vehicles
73/350/EC Adapting 70/157/EC to technical progress
77/212/EC Amendment of 70/157/EC
81/334/EC Adapting 70/157/EC to technical progress
84/372/EC Adapting 70/157/EC to technical progress
84/424/EC Amendment of 70/157/EC
89/491/EC Adapting 70/157/EC (e.a.) to technical progress
92/97/EC Amendment of 70/157/EC
96/20/EG Adapting 70/157/EC to technical progress
1999/101/EC Adapting 70/157/EC to technical progress
2007/34/EC Amending 70/157/EEC for the purpose of technical progress; introducing test method B for the purpose of monitoring from 6 July 2008 until 6 July 2010
2007/46/EC Framework Directive - establishing a framework for the approval of motor vehicles and their trailers, and of systems, components and separate technical units intended for such vehicles
Tyres
92/23/EC Directive relating to tyres for motor vehicles and their trailers and to their fitting
2001/43/EC Amendment of 92/23/EC introducing noise limits for tyres
Regulation (EC) No 661/2009
Concerning type approval requirements for the general safety of motor vehicles etc., including stricter limit values for tyre rolling noise, that will become valid from 1 November 2012, 1 November 2013 and 1 November 2016.
Environmental noise
2002/49/EC Directive relating to the assessment and management of environmental noise

EN 43 EN
Annex 2:Determination of the best suitable test method
The following key problems were looked at in order to determine the best suitable test method
(a) What will be the effectiveness of the new method B in comparison to the current method A, in terms of:
practical applicability;
representativeness of the test results for the noise emission of road vehicles under urban driving conditions;
significance of the test method: to what extent can the new test method prevent that the noise emission under other operating conditions than the test conditions exceeds the test results significantly;
possibilities to prevent adaptation of the vehicle and its engine control unit to the test conditions;
control of the selection of test tyres
(b) How should the limit values for noise emission of the different vehicle categories be changed for the different policy options:
(c) How should the allowances that are currently in force for special vehicles (sports cars, off-road vehicles and vehicles with a direct-injection Diesel engine) be treated under a new test procedure with the possibility of new limit values: should they be maintained, replaced by new sub-categories or cancelled?
(d) What will be the environmental, social and economical impact of the revision of the test procedure together with the related administrative changes?
(e) Is the new test method expected to cause problems for the efficiency of the noise measurements? Could the test method be modified in order to prevent possible problems?
(f) Can the new test method guarantee that the noise emission during other operating conditions than the test conditions does not exceed the test results significantly? What type of off-cycle provisions can be introduced to achieve this goal anyhow?
Annex 3:Evaluation of the new test method (method B)
The practicability and manageability of the new test method was investigated by means of a small enquiry among a number of type approval authorities that had submitted significant numbers of test report files for the database. Based on the response from these type approval authorities the following conclusions can be drawn:
EN 44 EN
The complexity of the new method B for light vehicles (M1, N1 and N2 < 3,5t) is approximately three times higher than of the current method A;
For these vehicles the new method B requires more attention to avoid errors and to achieve the necessary measurement accuracy than method A;
Depending on the type of measuring equipment (fully integrated or separate systems) the management of the test process may be rather time consuming;
Method B is more sensitive to environmental parameters, because the test results for light vehicles are lower than for method A;
Nevertheless, method B is considered reproducible and manageable;
For light vehicles there is some ambiguity in the instructions for the choice of gear ratio for automatic transmissions: if an automatic transmission can be locked in a specific gear it is not clear whether the vehicle in question should be tested with locked gears or in the automatic (‘Drive”) position of the transmission.
For buses (categories M2 and M3) the complexity of method B is not greater than of method A.
For heavy goods vehicles the test procedure of method B is more complex than method A due to the requirements for loading of the vehicle;
The instructions for loading of heavy goods vehicles are not completely clear and unambiguous.
The representativeness of method B for the average noise emission of vehicles in normal traffic is considered better than of method A. This is mainly due to the fact that method B is based on a combination of an acceleration test and a constant speed test. The required acceleration may be considered realistic when compared to accelerations achieved in normal traffic. As the final result is obtained by weighted averaging of both partial test results, the balance between the contributions from powertrain noise and tyre rolling noise in this result is approximately 50-50%.
The consequence is that the test result is less representative for conditions with higher noise emissions, e.g. during fast acceleration. Moreover, as the acceleration test is mostly carried out at rather low engine speeds, the method is not very suitable to reveal noise emission effects that occur mainly at high engine speeds, such as exhaust system modifications.
A concern from the Japanese Automobile Standards Internationalization Center that test method B would not be suitable or representative for the special sub-categories of very small M1 and N1 vehicles that are indicated in Japan as Kei-cars, could not be confirmed after a comparative analysis of the Kei-car noise emission test results and the general test results of M1 and N1 vehicles.
In the available data files of the test results there is no evidence of optimisation of the vehicles to comply with test method B. Therefore the distributions of method B test results show a more natural tapering off to higher noise emission values than the results of method A, which cut off rather sharply at the current limit values. It may
EN 45 EN
be expected that after a longer period of adaptation to the new method, similar effects will develop. For passenger cars this may result in a reduction of the noise emission test results with 1 to 7 dB(A) and may concern 10 – 15 % of the vehicles.
In test method B stricter instructions are give for the mounting of tyres during the test than in test method A. Especially for trucks this should result in the application of representative traction tyres on drive axles during the test instead of steering tyres, as is currently rather common. From the data files it appears that traction tyres were generally used on the drive axles during test B. A number of trucks was tested with several types of tyres, so an analysis could be made of the difference in noise emission between traction tyres and steering tyres mounted on the drive axles. This difference appeared to be 0,6 to 1,0 dB(A), depending on the type of traction tyre. The conclusion is that the choice of tyres on the drive axle of trucks and the effect of high torque exerted on traction tyres does not have a major influence on the test results of heavy trucks.
Recommended modifications of test method B
In view of the observations and conclusions discussed above the following recommendations for modifications of test method B can be made:
To delete the requirement that the acceleration during the Wide Open Throttle test of light vehicles shall not exceed 2 m/s2;
To revise the instructions for the choice of gear ratios for automatic transmissions that can be locked in a specific gear ratio;
To revise the instructions for the loading of heavy vehicles and the distribution of the load over the axles of the vehicle.
Off-cycle emission provisions
Due to the emphasis of test method B on representativeness for noise emission in normal traffic it is less suitable to reveal and control the noise emission under worst case conditions, e.g. during fast acceleration and during operation at high engine speeds. This observation is primarily relevant for passenger cars, in particular with a high rated engine power, because these vehicles have a large range of operating conditions that may deviate significantly from the conditions during the test. In order to control the maximum noise emissions of a vehicle in a more effective way than test method B is capable of, off-cycle emission provisions are considered to be essential.
The methodology for Additional Sound Emission Provisions (ASEP), that is being developed in UNECE GRB Informal Group ASEP, was studied, as well as some alternative methods to limit off-cycle emissions. This resulted in the following conclusions:
For the near future, the approach of the ASEP methodology will be the most effective way to limit and control off-cycle emissions of vehicles of category M1 and N1;

EN 46 EN
For other vehicle categories, off-cycle emission provisions do not seem necessary, because the test result of method B may be considered as an adequate predictor of the noise emission under deviating operating conditions;
Both methods developed for the ASEP methodology, method 1 developed in the GRB Informal Group ASEP and method 2 submitted by the Netherlands, suffer from serious shortcomings, that prevent their immediate implementation;
Method 2, submitted by the Netherlands, is recommended for further development, because is has the best potential to match the objectives for an off-cycle provision method;
The recommendations for modification of ASEP method 2
To remove the 2 m/s2 boundary in method B (see also 0);
To define the limit curve of method 2 in terms of noise emission as function of vehicle speed, rather than as function of engine speed;
To increase the 4 m/s2 boundary from the ASEP control range to 5 m/s2;
To expand the ASEP regulation to partial throttle accelerations;
To change the ASEP coefficients from Delta = 8, Margin = 2, Slope below = 3 into Delta = 9, Margin = 3, Slope below = 3;
To increase the Delta to 12 for vehicles with PMR > 150 kW/t;
To include the ASEP performance of replacement exhaust systems on the basis of a back-to-back test compared to the original system.
Further recommendations:
To introduce a general requirement that the manufacturer shall guarantee that the vehicle shall not under any operating condition produce a noise emission that cannot be predicted from the results of the type approval test according to method B and generally accepted physical laws relating noise emission to engine load and engine speed;
To designate the ASEP methodology as a method of testing whether the guarantee of the manufacturer is fulfilled, but not as a separate requirement that would supplement the basic limit value requirements based on test method B;
To consider for the more distant future the development and introduction of an indoor noise emission test on a test bench based on a comprehensive test cycle that should incorporate many different operating conditions, similar to the test cycles for CO2 and exhaust emissions.
Annex 4:Calculation of the equivalent sound pressure level at a characteristic distance
from the road
(1) For policy option 1 noise emission values are based on method A current limit values. For the other policy options, noise emission values are based on method B and equivalent limit values according to Option 3.

EN 47 EN
(2) All vehicle categories and subcategories are clustered into 5 groups:
Group 1 – Passenger cars = Cat M1 + Cat M1G
Group 2 – Busses = Cat M2 > 3,5 t + Cat M3
Group 3 – Vans = Cat N1 + Cat N1G + Cat M2 < 3,5 t
Group 4 – Lorries = Cat N2
Group 5 – Heavy Trucks = Cat N3 + Cat N3G
(3) For each group the weighted average limit values for each policy option are determined with weighting factors based on numbers of vehicles in the Circa database.
(4) For all policy options, the shifts in average noise emission per group in normal traffic are assumed to be equal to the shifts in limit values per group.
(5) The changes of the average noise emission per group for the various policy options are derived from the test results for test B in the CIRCA database. For the smaller vehicles, the noise emission is split in accelerating and free flowing traffic conditions. The WOT test result of test method B is attributed to accelerating vehicles (intermittent traffic) and the constant speed test result is attributed to free flowing traffic. For the larger vehicles only the acceleration test results are available, which are used for both intermittent and free flowing traffic.
(6) The actual average noise emission values per group in real traffic are extracted from the UBA report. In this report the noise emission per vehicle as a function of driving speed is expressed in regression equations both for accelerating vehicles and for free flow traffic. For the determination of the noise emission, the speed for the small vehicles (Group 1 and 3) is chosen at 50 km/h; for buses 30 km/h and for lorries and trucks 40 km/h. The measurements on which this report is based were done in 2001/2002. In total 29767 vehicles were measured, of which 21729 were passenger cars. The noise emission values from this are considered representative of the current noise emission of European traffic. Therefore these values are used as reference values for the computation of the noise emission effects of the different policy options.
(7) The predicted increases and reductions of the acceleration noise and the constant speed noise for the different policy options were added to noise emissions extracted from the UBA report. Options 1 and 3 were both set to be equal to the UBA report emissions: Option 1 because it represents the current situation and Option 3 because it is tuned to be equivalent to the current situation after introduction of test method B.
(8) Option 2 actually implies an increase of the limit values because it employs the current limit values in combination with test method B. As test method B gives lower test results than test method A, keeping the current limit values in fact increases the margin for approval of the noise emission.

EN 48 EN
(9) Options 4 and 5 imply a reduction of limit values which is translated into a reduction of average noise emission values in real traffic. For Option 5, which represents a two step reduction, only the final values have been taken into account. For both options the predicted reduction of the free flowing traffic noise for the smaller vehicles is based on the expected reductions of tyre-road noise due to the adapted rolling noise requirements that will come into force from 2012 according to EC Regulation 661/2009. For the larger vehicles, the reduction of free flowing traffic noise is assumed to be the same as the reduction of the acceleration noise.
Annex 5:Overview of road types and lengths with corrections for non-residential
stretches, roads with restricted access and low traffic volume
Road type
Assumed %
length
Road
length
kkm Adjustment Deduct
Effective
length
kkm %intermittent %freeflow
Residential 33,0% 1661
nonresid.,
restricted or low
intensity 35% 1079 33% 67%
Main 5,0% 252 nonresid. 20% 201 33% 67%
Arterial 2,0% 101 nonresid. 10% 91 0% 100%
Urban Mwy 0,1% 5 nonresid. 20% 4 0% 100%
Rural Mwy 1,9% 96 nonresid. 50% 48 0% 100%
Rural road 58,0% 2919 nonresid. 50% 1459 0% 100%
Total 100,0% 5032 2882
Annex 6:Parameters used for the economic analysis
In the economic analysis the following parameters were chosen:
– Appraisal period – the start year is set at 2010 as development of quieter vehicles may already commence then. The end year is set at 2030 (new limits from 2013, average vehicle life of 13 years, this way a complete life cycle of vehicles is covered);
– A discount rate rd of 4% corresponding to the Impact Assessment Guidelines, applied to industry costs C, noise valuation and health benefits B according to
Bd,j = Bj/(1+rd)j and Cd,j = Cj/(1+rd)
j
(discounted benefits Bd,j in year j, Benefit Bj in year j and discount rate rd)
– An interest rate ri set at 1% (corresponding to a conservative growth rate of the GDP per annum) is applied to the valuation of noise (as done in previous studies), and to abatement savings, according to;
Bg,j = Bj*(1+ri)j
(increased benefits Bg,j in year j, Benefit Bj in year j and interest rate ri)
Abatement savings are not discounted as they are avoided costs, but a 1 % interest rate is applied for price indexing.
– Population growth is estimated to be 1%.

EN 49 EN
Annex 7:Calculation of the percentage of annoyed and sleep disturbed people
Dose-effect curves for annoyance and sleep disturbance as developed by Miedema et al. and also described in the EU position paper on dose-response relationships, have been used. The percentage of highly annoyed people %HA is given as a function of LDEN : %HA = 9,868.10-4(LDEN -42)3 – 1,436.10-2(LDEN -42)2 +0,5118.(LDEN -42) The percentage of annoyed people %A is given as a function of LDEN : %A = 1,795.10-4(LDEN -37)3 + 2,110.10-2(LDEN -37)2 + 0,5353(LDEN -37) The percentage of highly sleep disturbed people %HSD is given as a function of Lnight : %HSD = 20,8 – 1,05 Lnight + 0,01486 (Lnight)
2 The percentage of sleep disturbed people %SD is given as a function of Lnight: %SD = 13,8 – 0,85 Lnight + 0,01670 (Lnight)
2
Annex 8:Derivation of future traffic noise emission levels
In order to explain the computation procedure for the future noise emission levels in real traffic the complete derivation of one of the levels, the maximum A-weighted pass-by sound pressure level of accelerating vehicles according to option 4 (Ltraf,opt4,acc ) is given as an example of this computation procedure. For other traffic conditions and other policy options similar derivations were used, that may deviate slightly from the given example.
Example Ltraf,opt4,acc
The quantity Ltraf,opt4,acc , the maximum A-weighted pass-by sound pressure level per vehicle in real traffic for accelerating vehicles of a specific vehicle group for future policy option 4 is given by:
)LL(LL opt,WOTopt,WOTacc,UBA,trafacc,opt,traf 344 −+=
Where:
Ltraf,UBA,acc is the average noise emission value calculated with the regression equation from the UBA report for accelerating vehicles of the relevant vehicle group
The reduction of the noise emission during acceleration in real traffic for future policy option 4 is calculated from the difference between the predicted average WOT (Wide Open Throttle) test result for policy option 4, LWOT,opt4 , and the average WOT test result for policy Option 3, LWOT,opt3, which is equivalent to the current situation. The predicted value LWOT,opt4 can be derived as:
)k/()L.kL(L popt.CRSpopt,Urbanopt,WOT −−= 1444
Where:

EN 50 EN
)LL(LL opt,itlimopt,itlimopt,Urbanopt,Urban 3434 −+=
33
33
opt,CRSopt,WOT
opt,WOTop,Urbanp
LL
LLk
−−= is the average partial power factor that can be derived from
the database with vehicle test results according to test B:
testB,WOTrepopt,WOT LL =3
testB,Urbanopt,Urban LL =3
testB,CRSrepopt,CRS LL =3
Both limit values for options 3 and 4 (Llimit,opt3 ; Llimit,opt4) are taken from the table with proposed limit values per policy option. The mean limit value for a vehicle group is obtained by weighted averaging of the limit values per vehicle (sub)category, where the weighting factors are the numbers of each vehicle (sub) category in the database.
Furthermore the predicted value of the constant speed test result according to method B under policy option 4 is obtained with the following equation:
)lg(.L/)L(L(
opt,CRSopt,CRS,Engine/)opt,Roll 10
43104 101010 +=
In this equation the rolling noise contribution to the test result (LRoll,opt4) is assumed to be equal during the acceleration test and the constant speed test. The average value of this quantity in option 4 the value is based on the average value derived from the current test results (LRoll,opt3) reduced with average reduction of tyre-road noise due to the reduction of the limit values for rolling noise according to EU Regulation 661/2009:
tyre,itlimopt,Rollopt,Roll LLL ∆+= 34
For the C1 class of tyres the average reduction is estimated at -3,8 dB(A), and for C2 and C3 class of tyres at -3,0 dB(A).
The power train noise contribution to the constant speed test result of method B (LPowTr,CRS,opt3) is estimated at:
dBLL opt,CRSopt,CRS,Engine 433 −=
Annex 9:Millions of highly annoyed people per road type for each policy option
Millions Highly
Annoyed
Residential
(urban/
suburban)
intermittent
Residential
(urban/
suburban)
free flow
Main roads
(urban/
suburban)
intermittent
Main roads
(urban/
suburban)
free flow
Arterial
roads
(urban/
suburban)
Urban
motorways
(urban/
suburban)
Rural
motorways
Rural roads Total
Option 1 7,2 8,7 8,4 11,2 15,5 1,1 0,8 1,9 54,9
Option 2 8,6 10,5 9,6 13,0 17,5 1,3 0,9 2,2 63,5
Option 3 7,2 8,7 8,4 11,2 15,5 1,1 0,8 1,9 54,9
Option 4 5,5 6,5 6,6 9,1 12,8 0,9 0,6 1,5 43,5
Option 5 4,8 6,1 6,0 8,9 12,5 0,9 0,6 1,4 41,3

EN 51 EN
Annex 10:Millions of highly sleep disturbed people per road type for each policy option
Millions Highly Sleep Disturbed
Residential (urban/ suburban) intermittent
Residential (urban/ suburban) free flow
Main roads (urban/ suburban) intermittent
Main roads (urban/ suburban) free flow
Arterial roads (urban/ suburban)
Urban motorways (urban/ suburban)
Rural motorways
Rural roads
Total
Option 1 3,4 5,7 3,1 5,3 7,0 0,6 0,4 1,2 26,6 Option 2 4,0 6,5 3,4 6,0 7,6 0,6 0,4 1,3 29,8 Option 3 3,4 5,7 3,1 5,3 7,0 0,6 0,4 1,2 26,6 Option 4 2,8 4,8 2,5 4,4 6,0 0,5 0,3 1,0 22,4 Option 5 2,6 4,7 2,3 4,3 5,9 0,5 0,3 0,9 21,6
Annex 11:Effect of fleet and mileage growth on average car fleet emission
The reduction in traffic noise levels will be diminished over time if the fleet size and annual mileage grows. These affects are illustrated for options 4 and 5 in the figures below.
Decrease of car fleet emission for option 4
69
70
71
72
73
74
75
2012 2017 2022 2027 2032
accelerating
free flowing
accelerating accounted for mileage
free flowing accounted for mileage
Avera
ge car fleet em
issio
n [dB(A
)]

EN 52 EN
Decrease of the average noise emission of the whole car fleet taking fleet size growth and mileage growth into account, for option 4.
Decrease of car fleet emission for option 5
69
70
71
72
73
74
75
2012 2017 2022 2027 2032
accelerating
free flowing
accelerating accounted for mileage
free flowing accounted for mileage
Avera
ge c
ar fleet em
issio
n [dB(A
)]
Decrease of the average noise emission of the whole car fleet taking fleet size growth and mileage growth into account, for option 5.
Annex 12:Tyre-road noise and power train noise contributions to test results
Tyre road noise (= rolling noise) contributions can be computed for those vehicles for which test method B prescribes a constant speed test in addition to the WOT (Wide Open Throttle) test. This is the case for vehicle categories M1, M1G, M2 (< 3500kg), N1 and N1G.
For these vehicles the following test results are reported for method B:
Lwot rep is the reported test result of the WOT test
Lcrs rep is the reported test result of the constant speed (cruise-by) test
Lurban = Lwot rep – kp.(Lwot rep – Lcrs rep) is the final result of test method B
In which:
kp = 1 – (aurban / awot test) is the partial power factor for urban driving.
Based on a few assumptions it is possible to estimate the rolling noise contribution and the power train noise contribution during the constant speed test and the WOT test.
The first assumption is that the measured total noise emission Lcrs rep during the constant speed test is dominated by rolling noise. As a rather conservative estimate it is assumed that the power train noise emission (LPT crs )during the constant speed test is on average 4 dB(A) lower than the rolling noise emission:
LPT crs = Lroll crs – 4 dB(A)

EN 53 EN
Based on the summation formula:
)/L()/L(repcrs
crsrollcrsPTlg(.L1010
101010 +=
One can derive that:
dB(A)51
dB(A)461
,L
,LL
repcrs
repcrscrsroll
−≈
−=
The second assumption is that the rolling noise during the WOT test at 50 km/h is equal to the rolling noise during the constant speed test at 50 km/h:
Lroll wot = Lroll crs
In that case is the power train noise during the WOT test:
)/),L(()/L(
)/L()/L(wotPT
crsrepwot
wotrollrepwot
.lg(
.lg(L
105110
1010
101010
101010
−−=
−=
With the two assumptions mentioned above both the rolling noise and the power train noise in the WOT test and the constant speed test can be computed. This was done for each vehicle and the results were averaged per vehicle category
Annex 13:Prediction of tyre-road noise contribution to future test results
After this step a prediction of the effects of the future lowering of limit values for rolling noise of tyres can be given. As mentioned in stricter limit values for rolling noise of tyres will be introduced starting from 1 November 2012. The reduction of the limit values is given in Table. For the C1 tyres a weighted average of the limit value reductions with emphasis on the mid sized tyres is 3,8 dB(A).
Table - Current and future limit values for tyre rolling noise.
Reduction
Tyre class Limit value Tyre class Limit value Limit values
C1a < 145 72 70 -2
C1b > 145 < 165 73 70 -3
C1c < 165 < 185 74 C1A < 185 70 -4
C1d > 185 < 215 75 C1B > 185 < 215 71 -4
C1e > 215 76 C1C > 215 < 245 71 -5
76 C1D > 245 < 275 72 -4
76 C1E > 275 74 -2
Weighted average C1 tyres -3,8
Tyre class Limit value Tyre class Limit value Limit values
C2 Normal 75 Normal 72 -3
C2 Snow 77 Traction 73 -4
C3 Normal 76 Normal 73 -3
C3 Snow 78 Traction 75 -3
Average C2 and C3 tyres -3,3
Class limit values - NewClass limit values - Old
Category of use Category of use
Nominal section width Nominal section width
A third assumption is that the reduction of the rolling noise limit values will lead after a transition period of a couple of years to a downward shift of the noise emission values of the
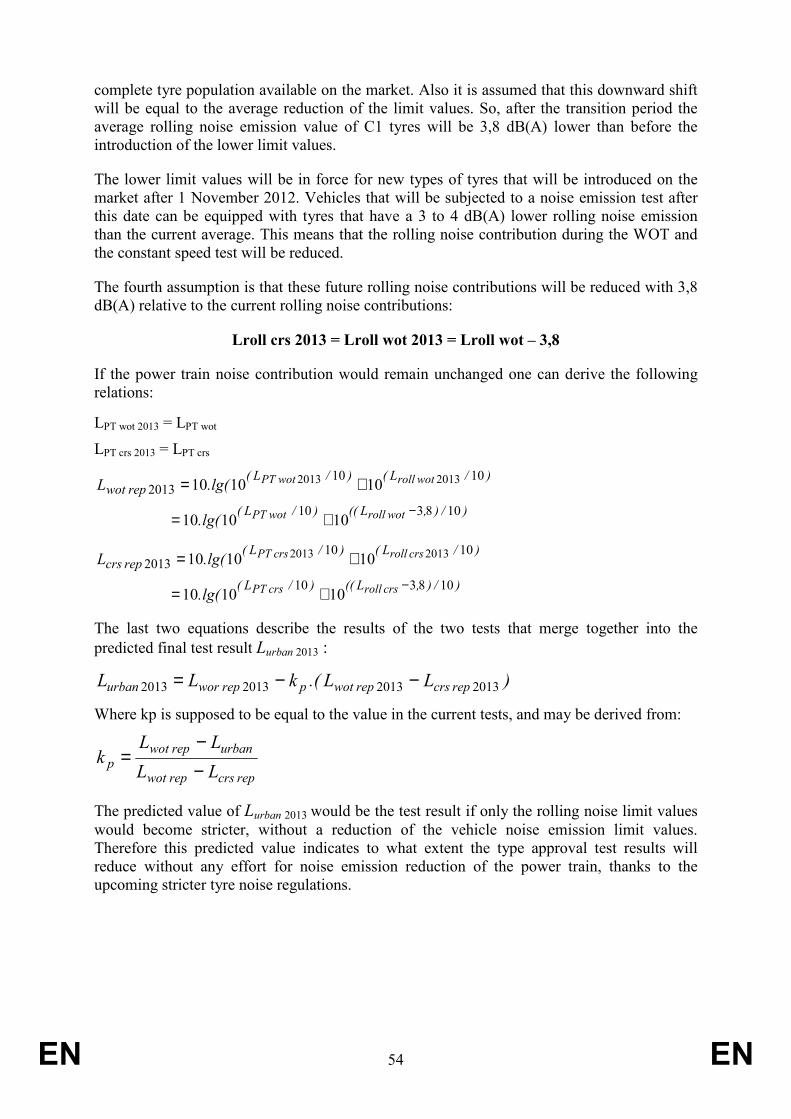
EN 54 EN
complete tyre population available on the market. Also it is assumed that this downward shift will be equal to the average reduction of the limit values. So, after the transition period the average rolling noise emission value of C1 tyres will be 3,8 dB(A) lower than before the introduction of the lower limit values.
The lower limit values will be in force for new types of tyres that will be introduced on the market after 1 November 2012. Vehicles that will be subjected to a noise emission test after this date can be equipped with tyres that have a 3 to 4 dB(A) lower rolling noise emission than the current average. This means that the rolling noise contribution during the WOT and the constant speed test will be reduced.
The fourth assumption is that these future rolling noise contributions will be reduced with 3,8 dB(A) relative to the current rolling noise contributions:
Lroll crs 2013 = Lroll wot 2013 = Lroll wot – 3,8
If the power train noise contribution would remain unchanged one can derive the following relations:
LPT wot 2013 = LPT wot
LPT crs 2013 = LPT crs
)/),L(()/L(
)/L()/L(repwot
wotrollwotPT
wotrollwotPT
lg(.
lg(.L
108310
10102013
101010
101010 20132013
−+=
+=
)/),L(()/L(
)/L()/L(repcrs
crsrollcrsPT
crsrollcrsPT
lg(.
lg(.L
108310
10102013
101010
101010 20132013
−+=
+=
The last two equations describe the results of the two tests that merge together into the predicted final test result Lurban 2013 :
)LL.(kLL repcrsrepwotprepworurban 2013201320132013 −−=
Where kp is supposed to be equal to the value in the current tests, and may be derived from:
repcrsrepwot
urbanrepwotp
LL
LLk
−−
=
The predicted value of Lurban 2013 would be the test result if only the rolling noise limit values would become stricter, without a reduction of the vehicle noise emission limit values. Therefore this predicted value indicates to what extent the type approval test results will reduce without any effort for noise emission reduction of the power train, thanks to the upcoming stricter tyre noise regulations.


