Cotton Production and Processing Laboratory Lubbock, TX & Cotton Incorporated Researcher Mathew G....
34
Cotton Production and Processing Laboratory Lubbock, TX & Cotton Incorporated Researcher Mathew G. Pelletier
-
Upload
emil-roberts -
Category
Documents
-
view
214 -
download
0
Transcript of Cotton Production and Processing Laboratory Lubbock, TX & Cotton Incorporated Researcher Mathew G....

Cotton Production and Processing LaboratoryLubbock, TX
& Cotton Incorporated
Researcher Mathew G. Pelletier

Research Goal
• Development of accurate bale moisture sensing.
• Focus on issues relevant to wet bales

•Adding moisture reduces bale packing forces. This effect minimizes the number of repair cycles required to maintain the bale press.
•Adding moisture also adds weight back to bale, so there’s also an economic incentive for moisture restoration.
Moisture Restoration before the Bale Press

Excess Bale Moisture in storageCauses Change in Color Grade
Color Change in Storage due to Excess Moisture
-8
-7
-6
-5
-4
-3
-2
-1
0
1
2
3
%Moisture
Co
lor
cha
ng
e
Rd (reflectance)
+b (Yellowness)

New CC Loan rules dictate all bales must be certified by the gin to contain less than 7.5% M.C. at
ANY point in the bale.

Moisture Sensing Technologies
• Resistance sensors (bale probes, bale-press)
• Capacitance roller conveyor
• Infrared (top 1mm of surface only)
• Microwave through transmission (2 types)– Signal absorbance (Vomax, Malcalm)– Signal propagation time (USDA-ARS;
Pelletier)

Current industry standard for testing bale moisture is
By hand-held resistance sensors.
How accurate are they really for use with wet cotton bales?

To test the accuracy of the hand-held sensors;
A nation-wide test was conducted by all 3 of USDA-ARS cotton gin labs

Hand-held Resistance Sensorsfor Bale Moisture Measurement

AQB-SC versus Oven Moisture:Uncertainty (95%) +/-2.31% (as read by meter)
After correction for slope-offset; Uncertainty (95%) = +/-1.83%M.C.
y = 0.578x + 1.6066
R2 = 0.5314
0.00
2.00
4.00
6.00
8.00
10.00
12.00
4.0 6.0 8.0 10.0 12.0 14.0
AQB-SC Meter Readings (%M.C.)
Ove
n %
M.C
.

AQB-BS versus Oven Moisture:Uncertainty (95%) +/-3.34% (as read by meter)
After correction for slope-offset; Uncertainty (95%) = +/-2.33%M.C.
y = 0.4267x + 3.1301
R2 = 0.3707
0.00
2.00
4.00
6.00
8.00
10.00
12.00
2.0 4.0 6.0 8.0 10.0 12.0 14.0
AQB-BS Meter Readings (%M.C.)
Ove
n %
M.C
.

DHT-EC versus Oven Moisture:Uncertainty (95%) +/-1.95% (as read by meter)
y = 0.7309x + 3.0362
R2 = 0.4665
3.50
4.50
5.50
6.50
7.50
8.50
9.50
3.5 4.5 5.5 6.5 7.5 8.5 9.5DHT-EC Meter Readings (%M.C.)
Ove
n %
M.C
.

How well do the meters agree to each other?

Comparison between commercial hand-held bale moisture meters (low freq. resistance)
0
2
4
6
8
10
0 2 4 6 8 10
Oven Tested %M.C.
Ave
rage
Met
er
Rea
ding
%M
.C.
DHT-EC
SDB-LP
AQB-BS
AQB-SC

What are the error sources?
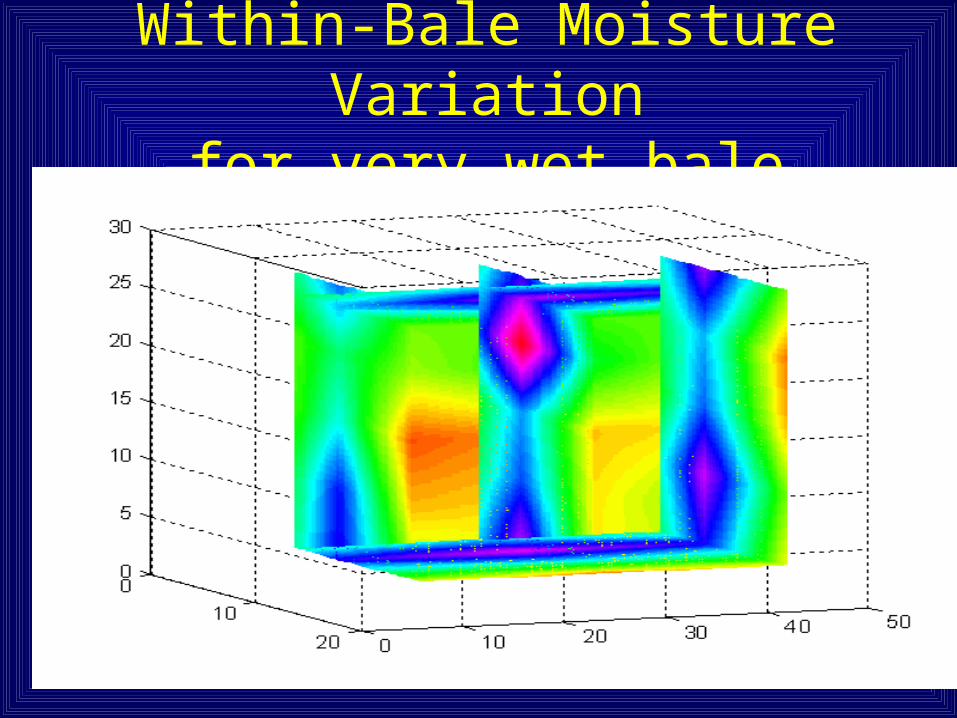
Within-Bale Moisture Variationfor very wet bale

Low MHz Frequency Roller Conveyor Capacitance Sensor
-2.5 -2 -1.5 -1 -0.5 0 0.5 1 1.5 2 2.5
-1.5
-1
-0.5
0
0.5
1
1.5
f
This slide and study addresses slide shows by Uster at Beltwide presentations that state a roller-resistance style sensor can measure into the depth of the bale with rf capacitive type sensing.This model clearly shows that at best you're only getting very minor penetration and the technique is blind to the interior of the bale.

Surface Sensors can’t detect interior moisture

How to detect interior wet spots per FSA/CC mandate?
Disadvantages of current microwave moisture sensors
• Modern Microwave systems average moisture over large sensing areas.
• The large sampling volume dilutes or misses localized high moisture areas

Experimental USDA-ARS Microwave Sensor for bale moisture

Sensing of local moisture variability critical for wet bale
moisture determination
• Experimental Lubbock Gin Lab Microwave Imaging system in development to sense internal wettest spot in bale.

Impulse response of microwave imager
-0.3
0.0
0.3
0.6
1.0
1.3
-60 -40 -20 0 20 40 60
Distance to Imaging Axis (cm)
Pro
pa
ga
tion
De
lay
(ps)

Microwave Pencil Beam Imaging Can Resolve Interior Moisture

Advantages to Pencil Beam Microwave Imaging
• Ability to measure wettest spot in bale per new 2006 FSA CC Regulations
• Local moisture as well as large sample estimation of moisture available through full bale scanning

• With what accuracy can the new microwave imaging technique perform quantitative analysis?
• To test accuracy; the microwave imager was tested on a set of known permittivitty standards (traceable to NIST labs).

Chemical Concentration versus Measured Propagation Delay
(Propagation delay range chosen to match typical range for U.D. cotton bales ranging from 5.5 - 8.5% M.C.)
R2 = 0.9988
0.15
0.2
0.25
0.3
0.35
0.4
0.45
0 0.05 0.1 0.15 0.2 0.25 0.3 0.35
Chemical Concentration (by mass)
Me
as
ure
d P
rop
ag
ati
on
D
ela
y (
ns
).

NIST Propagation Delay versus Measured Propagation Delay
(Propagation delay range chosen to match typical range for U.D. cotton bales ranging from 5.5 - 8.5%M.C.)
R2 = 0.9974
0.15
0.2
0.25
0.3
0.35
0.4
0.45
0.15 0.2 0.25 0.3 0.35 0.4 0.45
NISTPropagation Delay (ns)
Me
asu
red
Pro
pa
ga
tion
De
lay
(ns)
.
f

Equivalent Cotton Moisture versus Predicted Cotton Moisture
Accuracy (95% confidence) = 0.097%M.C.
R2 = 0.9978
5.5
6
6.5
7
7.5
8
8.5
5.5 6 6.5 7 7.5 8 8.5
% Moisture Content
Pre
dict
ed %
Moi
st.

Controlled Testing of Microwave Imager on Mini-Cotton bales
Goals:
• Verify new Imaging System has comparable accuracy to standard microwave sensors.
• Establish cotton bale’s true permittivity for creation of a standard linkage by which all future sensors and cotton bale-moisture can be traced to NIST Laboratory measurements.


Microwave Imager test on mini-bales
R2 = 0.9628
4
6
8
10
12
14
4 6 8 10 12 14
%M.C.
Pre
dict
ed %
M.C
.
Conclusion
• Wet bales exhibit extreme amounts of local variability.
• A suitable sensing system for moisture restoration systems must be able to sense local variability and control to the wettest spot in the bale; not the average.
• New USDA-ARS Microwave Imager shows promise for detection of local moisture variability in addition to average bale moisture

Bale Moisture Sensors must be able to
Resolve Interior Spot Moisture, Not just Surface or Average Moisture