Cotton Classification: Understanding the Data
14
www.ams.usda.gov/cotton/UnderstandingtheData C&T HQ: 3275 Appling Rd, Memphis, TN 38133 Phone: 901-384-3000 www.ams.usda.gov/cotton-tobacco Cotton Tobacco
Transcript of Cotton Classification: Understanding the Data

www.ams.usda.gov/cotton/UnderstandingtheDataC&T HQ: 3275 Appling Rd, Memphis, TN 38133
Phone: 901-384-3000www.ams.usda.gov/cotton-tobacco
Cotton Tobacco

1
USDA, AMS, Cotton & Tobacco Program
Universal Classification Data Format
(Applicable to All Methods of Data Dissemination for Form 1 Classification Offered by the Cotton & Tobacco Program)
0BFIELD NAME
2BCOLUMN
Permanent Bale Identification (PBI) 01-12 Gin Code Number (01-05) Gin Bale Number (06-12) Date Classed (YYYYMMDD) 13-20 Module, Trailer, or Single Bale 21 Module/Trailer Number 22-26 Number of Bales in Module/Trailer 27-28 Official Color Grade 29-30 Length (Staple - 32nds of an inch) 31-32 Micronaire 33-34 Strength (grams/tex) 35-37 Leaf Grade 38 Extraneous Matter 39-40 Remarks 41-42 Instrument Color Grade 43-44 Color Quadrant 45 Color Rd 46-48 Color +b 49-51 Trash Percent Area (Non Lint Content) 52-53 Length (100ths of an inch) 54-56 Length Uniformity Index (percent) 57-59 Upland or Pima 60 Record Type 61 Record Status 62 CCC Loan Premiums and Discounts 63-67
Appendix A: Module Averaging Appendix B: Official Color Grades for American Upland Cotton Chart Appendix C: HVI Color Grades for American Upland Cotton Chart-2008 Appendix D: HVI Color Grades for American Pima Cotton Chart-2008
Updated July 13, 2018

2
The classification system for American Upland and Pima cotton consists of classer identification of extraneous matter (if any) and instrument measurements for color grade, leaf grade, length, micronaire, strength, length uniformity index, color Rd, color +b, and trash percent area. All instrument measurements utilized in USDA cotton classification are from Uster High Volume Instrument (HVI)* systems. Most classification data is disseminated to the industry via the Internet. In order to provide classification data for individual bales, the incoming permanent bale identification must meet certain requirements that are discussed below. For ease of explanation, the Universal Classification Data Format is used as an example for explaining the various quality measurements. *High Volume Instrument (HVI) is patented by Uster Technologies.
Permanent Bale Identification (PBI) (Columns 1-12) A bar-coded bale identification tag, preprinted with the gin code number and gin bale number (individually referenced below), is placed between the two halves of the sample for identification purposes. This is a Permanent Bale Identification (PBI) tag, which gives each bale a unique 12-digit number that is not repeated within a five year period. The Classing Office scans the bar codes to enter the PBI into its computer prior to classing the sample.
Gin Code Number (Columns 1-5) The gin code number is composed of the first five digits of the PBI. The first two digits denote the Classing Office, and the last three digits identify the gin. The local Classing Office assigns this code number. Gin Bale Number (Columns 6-12) The gin bale number is composed of the last seven-digits of the PBI and is assigned by the gin. Date Classed (Columns 13-20) This is the date the classification data for the bale was released by the Classing Office. The format is YYYYMMDD. Module, Trailer, or Single Bale (Column 21) This one-digit code indicates whether the sample was outturned as a single bale or as a bale that was module/trailer averaged.
3
Single bale = 0 Module = 1 Trailer = 2
Detailed information on Module Averaging is shown on Appendix A.
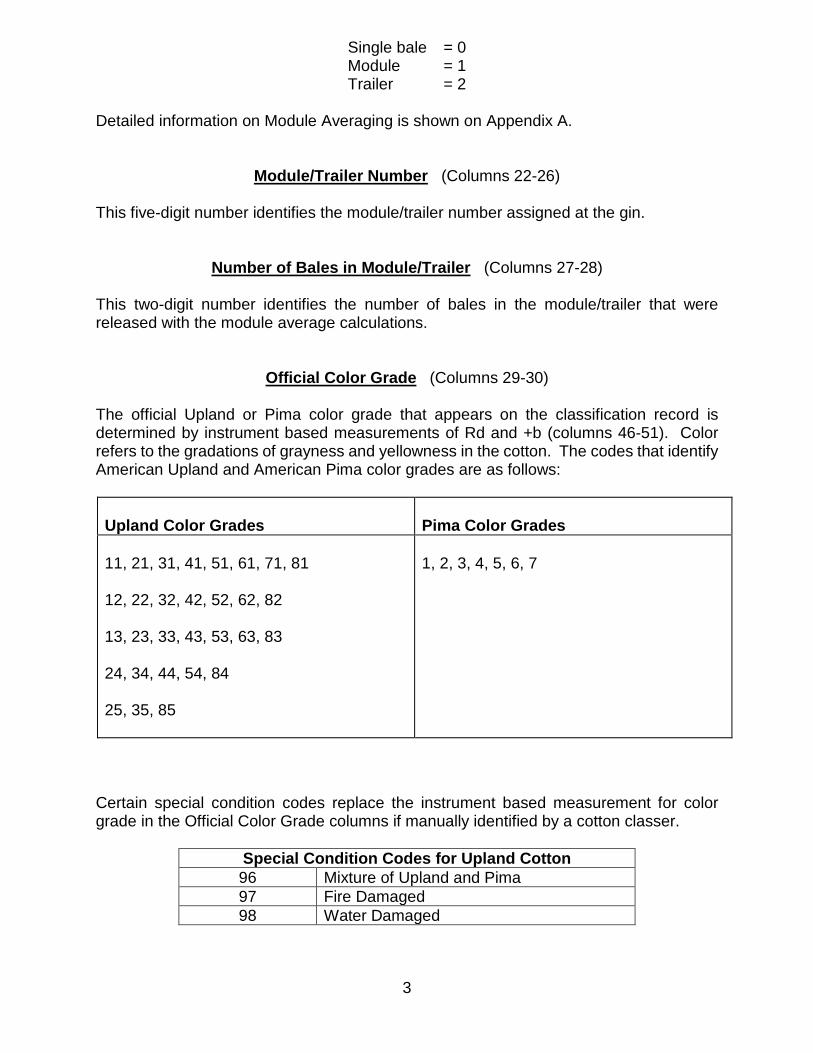
Module/Trailer Number (Columns 22-26) This five-digit number identifies the module/trailer number assigned at the gin. Number of Bales in Module/Trailer (Columns 27-28) This two-digit number identifies the number of bales in the module/trailer that were released with the module average calculations. Official Color Grade (Columns 29-30) The official Upland or Pima color grade that appears on the classification record is determined by instrument based measurements of Rd and +b (columns 46-51). Color refers to the gradations of grayness and yellowness in the cotton. The codes that identify American Upland and American Pima color grades are as follows:
Upland Color Grades
Pima Color Grades
11, 21, 31, 41, 51, 61, 71, 81 12, 22, 32, 42, 52, 62, 82 13, 23, 33, 43, 53, 63, 83 24, 34, 44, 54, 84 25, 35, 85
1, 2, 3, 4, 5, 6, 7
Certain special condition codes replace the instrument based measurement for color grade in the Official Color Grade columns if manually identified by a cotton classer.
Special Condition Codes for Upland Cotton 96 Mixture of Upland and Pima 97 Fire Damaged 98 Water Damaged

4
Special Condition Codes for Pima Cotton 93 Mixture of Pima and Upland 94 Fire Damaged 95 Water Damaged
Length (Staple - 32nds of an inch) (Columns 31-32) &
Length (100ths of an inch) (Columns 54-56) Classification instruments measure length in hundredths of an inch. Length is reported on the classification record in both 32nds and 100ths of an inch. Length measurements are converted to 32nds of an inch as shown below:
3BUpland Length Conversion Chart Length (32nds)
Length (Inches)
Length (32nds)
Length (Inches)
24 0.79 & shorter 36 1.11 – 1.13 26 0.80 – 0.85 37 1.14 – 1.17 28 0.86 – 0.89 38 1.18 – 1.20 29 0.90 – 0.92 39 1.21 – 1.23 30 0.93 – 0.95 40 1.24 – 1.26 31 0.96 – 0.98 41 1.27 – 1.29 32 0.99 – 1.01 42 1.30 – 1.32 33 1.02 – 1.04 43 1.33 – 1.35 34 1.05 – 1.07 44 & + 1.36 & + 35 1.08 – 1.10
4BAmerican Pima Length Conversion Chart 1BLength (32nds) Length (Inches)
40 1.20 and lower 42 1.21 – 1.25 44 1.26 – 1.31 46 1.32 – 1.36 48 1.37 – 1.42 50 1.43 – 1.47 52 1.48 & +
Micronaire (Columns 33-34) Cotton’s resistance to air flow per unit mass is measured to determine micronaire. Micronaire is a measure of the cotton’s fineness and is reported to the nearest tenth. Micronaire and maturity are highly correlated within a cotton variety.

5
Strength (grams/tex) (Columns 35-37) The fiber strength measurement is made by clamping and breaking a bundle of fibers with a 1/8-inch spacing between the clamp jaws. Results are reported in terms of grams per tex to the nearest tenth. A tex unit is equal to the weight in grams of 1,000 meters of fiber. Therefore, the strength reported is the force in grams required to break a bundle of fibers one tex unit in size. The following table shows some general descriptions of strength measurements in grams per tex.
5BFiber Strength Table
Descriptive Designation
Strength (grams per tex)
Weak 23.4 & below Intermediate 23.5 – 25.4 Average 25.5 – 28.4 Strong 28.5 – 30.4 Very Strong 30.5 & above
Leaf Grade (Column 38) Leaf refers to particles of the cotton plant’s leaf which remain in the lint after the ginning process. Upland leaf grades are determined by the HVI instrument based measurements of Percent Area (columns 52-53) and Particle Count (not a reported classification measurement) and are identified as numbers 1 through 7, all represented by physical standards. Upland leaf grade 8 (Below Grade) is used to identify samples having more leaf than leaf grade 7. American Pima leaf grades are also determined by the HVI and are identified as numbers 1 through 6, all represented by physical standards, and leaf grade 7 (Below Grade), which is used to describe samples having more leaf than leaf grade 6. Extraneous Matter (Columns 39-40) Extraneous matter is any substance in the cotton other than fiber or leaf. Extraneous matter is determined by the classer. Examples of extraneous matter are bark, grass, spindle twist, seed coat fragments, dust, and oil. The kind of extraneous matter and an indication of the amount (light or heavy), are noted by the classer on the classification record. The amount of extraneous matter in the cotton is reported as level 1 or level 2, with level 2 indicating the heavier contamination. The code numbers identifying the presence and level of extraneous matter in a sample are as follows:

6
6BExtraneous Matter
01 Prep Level 1 02 Prep Level 2 11 Bark Level 1 12 Bark Level 2 21 Grass Level 1 22 Grass Level 2 31 Seed Coat Fragments Level 1 32 Seed Coat Fragments Level 2 41 Oil Level 1 42 Oil Level 2 51 Spindle Twist Level 1 52 Spindle Twist Level 2 61 Other Level 1 62 Other Level 2 71 *Plastic Level 1 72 *Plastic Level 2
* Implemented with the 2018 crop. Unlike plant-based extraneous matter such as bark, grass or seed coat fragments, plastic extraneous matter is generally not uniformly distributed throughout a plastic-contaminated bale. Therefore, a sample from a plastic-contaminated bale submitted for classification may or may not have plastic extraneous matter present. Remarks (Columns 41-42) The instrument assigns the remarks code 75 where applicable. Classers identify other special conditions that may cause processing problems and lower yarn quality. The following remarks codes identify special condition cotton:
75 Other Side Two or More Color Grades and/or Color Groups or One Color Grade and One Color Group Higher
76 Reginned 77 Repacked 78 Redder Than Normal (Pima) 92 Pima Ginned on Saw Gin
Instrument Color Grade (Columns 43-44) Color Quadrant (Column 45) Color Rd (Columns 46-48) Color +b (Columns 49-51) As previously explained, instrument based color is used to determine the official color grade for Upland and Pima cotton (columns 29-30) unless superseded by a special condition code. This same color grade is also reported in columns 43-44. Color grade subdivisions are reported as Color Quadrants (column 45) and the individual instrument

7
measured components of Rd and +b are reported to the nearest tenth in columns 46-51. Color measurements are in terms of grayness and yellowness. Grayness (Color Rd) indicates how light or dark the sample is, and Yellowness (Color +b) indicates how much yellow color is in the sample. The color diagram for color grades of American Upland cotton, Appendix B, was constructed to match the Universal color grade standards for American Upland cotton. Each color grade is subdivided to denote differences within a color grade. This information is reported as a two-digit Color Grade and a single-digit Color Quadrant. This three-digit number is derived by locating on the diagram the intersection of the Rd and +b readings as referenced on Appendix C.
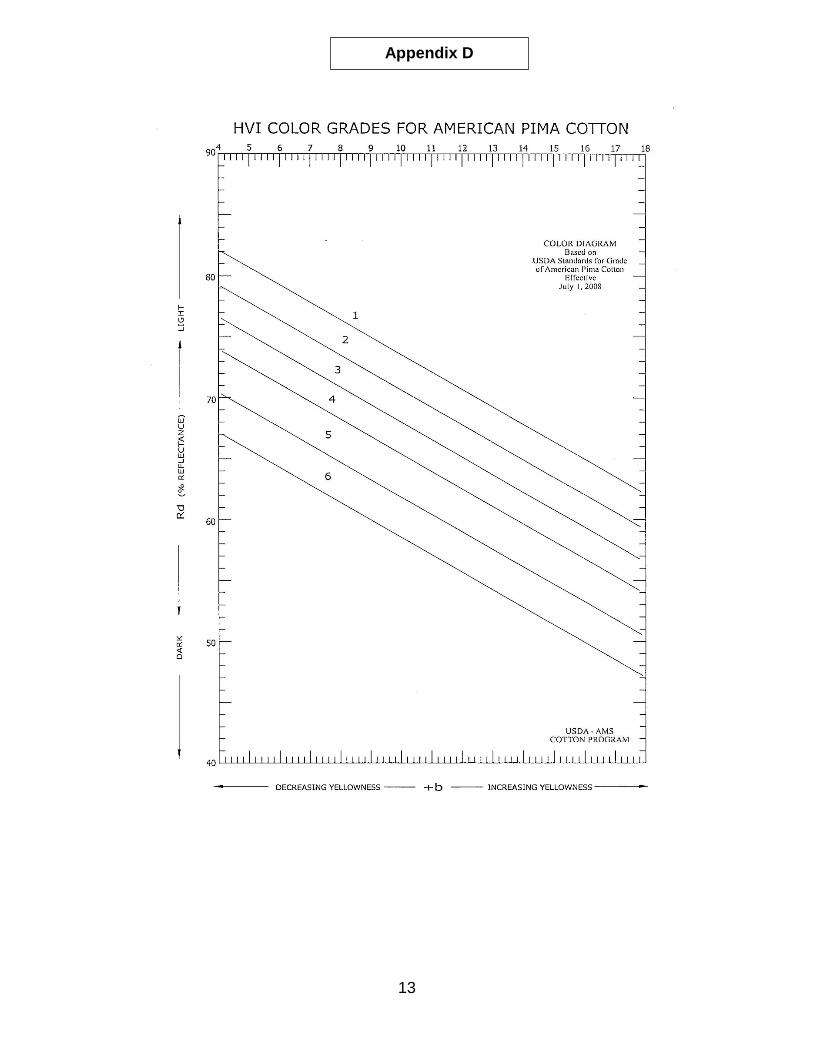
The color diagram for color grades of American Pima cotton, Appendix D, is based on the official standards for American Pima cotton. Color grades shown in the chart are the one-digit color grades of American Pima. Two digits are shown on the classification record, the first digit being zero (0). Color Quadrants are not used for American Pima color.
Trash Percent Area (Non Lint Content) (Columns 52-53) The two-digit trash percent area reported on the classification record is the percent of the sample surface covered by trash particles as determined by the instrument to the nearest tenth. Trash particles include extraneous matter such as grass, bark, etc., but these particles cannot be distinguished one from another by this measurement. Length Uniformity Index (Percent) (Columns 57-59) Length uniformity index is a three-digit number that is a measure of the degree of uniformity of the fibers in a sample to the nearest tenth. The descriptive terms listed below may be helpful in explaining the measurement results.
Descriptive Designation 7BLength Uniformity Very Low Below 76.5 Low 76.5 – 79.4 Average 79.5 – 82.4 High 82.5 – 85.4 Very High Above 85.4
Upland or Pima (Column 60) This one-digit code indicates whether the sample is Upland or American Pima. 1 = Upland 2 = Pima

8
Record Type (Column 61) This one-digit code indicates the type of record, as follows: 0 = Original 1 = Review 2 = Rework
Record Status (Column 62) This one-digit code indicates whether or not the manual classing information has been corrected: 0 = Not a correction 1 = Correction CCC Loan Premiums and Discounts (Columns 63-67) This five-digit code gives the CCC loan premium and discount points for Upland cotton. The physical loan price for Pima cotton is shown in cents per pound. Columns 63-67 will be left blank if the bale is not eligible for loan.
Upland – Column 63 (+) if Premium, (-) if Discount

9
Module/Trailer Averaging Fact Sheet Background The Cotton and Tobacco Program first offered Module/Trailer Averaging to the cotton industry in 1991 as a means to improve the accuracy of instrument strength readings. The success of this 1991 pilot project resulted in increased industry participation and the expansion of Module/Trailer Averaging to include additional instrument measurements for the 1992 and 1993 crops. Beginning with the 1994 crop, Module/Trailer Averaging included only the quality factors of mike, strength, length, and length uniformity. Results from this project show conclusively that Module/Trailer Averaging significantly improves the laboratory-to-laboratory reproducibility of instrument measurements. The Cotton and Tobacco Program continues to offer Module/Trailer Averaging to the cotton industry on a voluntary basis. Listed below are some important facts regarding Module/Trailer Averaging:
Participation for the Last 10 years
Crop Year Number of Gins
Number of Bales Module/Trailer
Averaged Percent of Bales Classed
by USDA 2008 200 3.1 million 26 2009 188 2.7 million 24 2010 186 4.0 million 23 2011 177 3.8 million 26 2012 195 4.7 million 28 2013 227 4.1 million 33 2014 249 5.6 million 35 2015 261 5.0 million 40 2016 268 7.1 million 43 2017 282 9.6 million 48
Reproducibility (Five-Year Production 2011-2015)
Instrument Measurement
Reproducibility of Reproducibility Individual Test vs. of Module/Trailer Quality Assurance Averaging vs. QA
Percent Reproducibility Improvement Achieved By Using Module/Trailer
Averaging Micronaire 85.4 86.9 1.5 Strength 80.8 93.3 12.6 Length 79.5 91.4 11.9 Length Uniformity Index 79.5 94.1 14.5
Appendix A
10
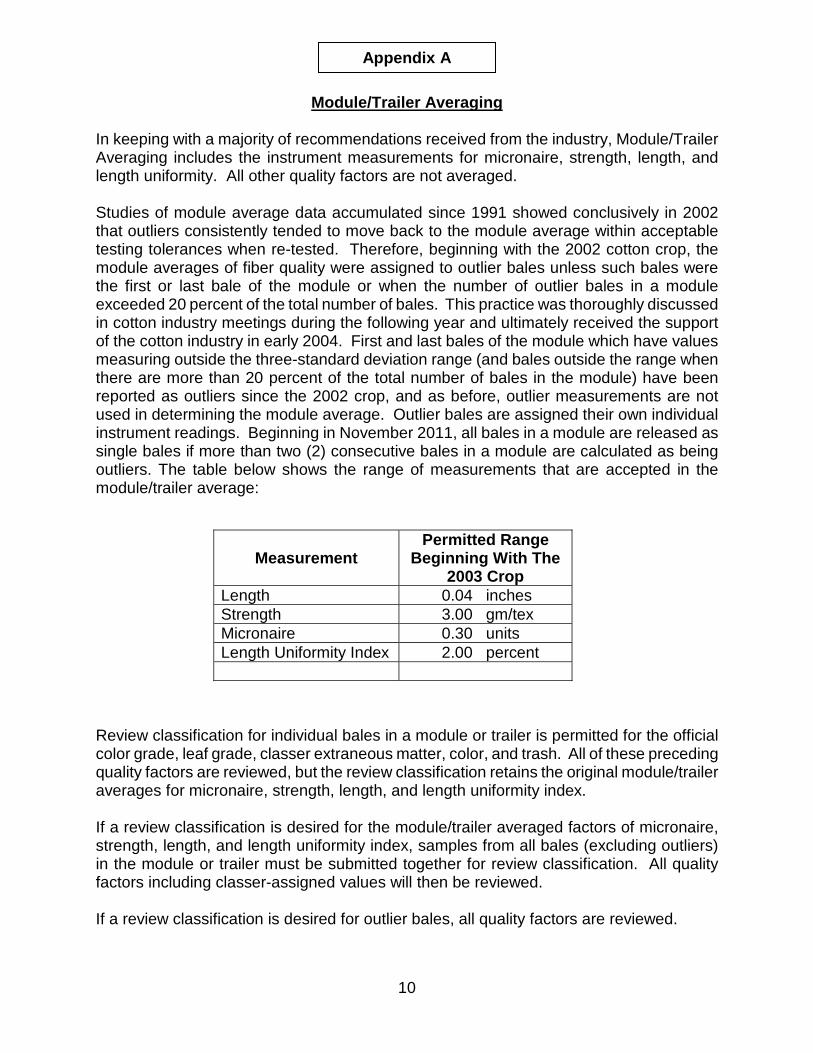
Module/Trailer Averaging
In keeping with a majority of recommendations received from the industry, Module/Trailer Averaging includes the instrument measurements for micronaire, strength, length, and length uniformity. All other quality factors are not averaged. Studies of module average data accumulated since 1991 showed conclusively in 2002 that outliers consistently tended to move back to the module average within acceptable testing tolerances when re-tested. Therefore, beginning with the 2002 cotton crop, the module averages of fiber quality were assigned to outlier bales unless such bales were the first or last bale of the module or when the number of outlier bales in a module exceeded 20 percent of the total number of bales. This practice was thoroughly discussed in cotton industry meetings during the following year and ultimately received the support of the cotton industry in early 2004. First and last bales of the module which have values measuring outside the three-standard deviation range (and bales outside the range when there are more than 20 percent of the total number of bales in the module) have been reported as outliers since the 2002 crop, and as before, outlier measurements are not used in determining the module average. Outlier bales are assigned their own individual instrument readings. Beginning in November 2011, all bales in a module are released as single bales if more than two (2) consecutive bales in a module are calculated as being outliers. The table below shows the range of measurements that are accepted in the module/trailer average:
Measurement
Permitted Range Beginning With The
2003 Crop Length 0.04 inches Strength 3.00 gm/tex Micronaire 0.30 units Length Uniformity Index 2.00 percent
Review classification for individual bales in a module or trailer is permitted for the official color grade, leaf grade, classer extraneous matter, color, and trash. All of these preceding quality factors are reviewed, but the review classification retains the original module/trailer averages for micronaire, strength, length, and length uniformity index. If a review classification is desired for the module/trailer averaged factors of micronaire, strength, length, and length uniformity index, samples from all bales (excluding outliers) in the module or trailer must be submitted together for review classification. All quality factors including classer-assigned values will then be reviewed. If a review classification is desired for outlier bales, all quality factors are reviewed.
Appendix A

11
Appendix B

12
Appendix C
13
Appendix D