Country Operational Plan for the Scale-up of Voluntary Medical Male
SEPTEMBER 2012
This publication was produced by the Ministry of Health of Tanzania with technical and financial support
from the U.S. President’s Emergency Plan for AIDS Relief (PEPFAR) through the U.S. Agency for
International Development (USAID) and the Joint United Nations Program on HIV/AIDS (UNAIDS).
COSTS AND IMPACTS OF SCALING UP
VOLUNTARY MEDICAL MALE CIRCUMCISION
IN TANZANIA
The United Republic of Tanzania
Ministry of Health and Social Welfare

Suggested citation: Ally, Mariam, May Bukuku, Veena Menon, Urbanus Kioko, Bennet Fimbo, Moke
Magoma, Steven Forsythe, and Emmanuel Njeuhmeli. 2012. Costs and Impacts of Scaling Up Voluntary
Medical Male Circumcision in Tanzania. Tanzanian Ministry of Health and Social Welfare, USAID | Health Policy Initiative Costing Task Order and Joint United Nations Program on HIV/AIDS.
The USAID | Health Policy Initiative Costing Task Order is funded by the U.S. Agency for International
Development under Contract No. GPO-I-01-05-00040-00, beginning July 1, 2010. The Costing Task
Order is implemented by Futures Group, in collaboration with the Futures Institute and the Centre for Development and Population Activities (CEDPA).
COSTS AND IMPACTS OF SCALING UP
VOLUNTARY MEDICAL MALE CIRCUMCISION IN TANZANIA
SEPTEMBER 2012
The views expressed in this publication do not necessarily reflect the views of the U.S. Agency for
International Development or the U.S. government and UNAIDS.


iii
CONTENTS
Acknowledgments ............................................................................................................ iii
Executive Summary ......................................................................................................... iii
Abbreviations ..................................................................................................................... v
1. Introduction ................................................................................................................. 1
1.1. Voluntary Medical Male Circumcision in Tanzania ................................................................... 2
1.2. Description of the DMPPT and VMMC Costing Workbook ................................................ 5
1.3. Study Objective ................................................................................................................................ 6
2. Methodology ................................................................................................................ 7
2.1. Study Design ..................................................................................................................................... 7
2.2. Study Population .............................................................................................................................. 8
2.3. Service Delivery Models for Voluntary Medical Male Circumcision in Tanzania ........... 10
2.4. Data Collection, Management, and Analysis ........................................................................... 11
3. Results of Costing and Modeling ............................................................................. 15
3.1. Cost of VMMC per Service Delivery Model: Campaign vs. Non-Campaign ................... 15
3.2. Cost per VMMC Performed at Island
Outreach Sites (Goziba Islands in Kagera Region) ........................................................................ 20
3.3. Impact of Scaling Up Voluntary Medical Male Circumcision in Tanzania ......................... 21
3.4. Total Number of Male Circumcisions...................................................................................... 22
3.5. Impact of VMMC Scale-Up on HIV Infection ......................................................................... 23
3.6. Impact of VMMC Scale-Up on Annual AIDS-Related Deaths ............................................. 24
3.7. Impact on the Rate of New HIV Infections by Age and Sex ............................................... 25
3.8. Impact of Male Circumcision on Incidence of HIV Infection .............................................. 26
3.9. Number of VMMC per Infection Averted .............................................................................. 27
3.10. Cost Implications of Scaling Up VMMC ................................................................................. 27
3.11. Regional Analysis—Cost Implications of Scaling Up VMMC ............................................. 28
3.12.Net Cost Savings and Cumulative Net Cost Savings per
Adult HIV Infection Averted .................................................................................................... 28
4. Discussion and Conclusion ....................................................................................... 29
4.1. Study Limitations........................................................................................................................... 30
4.2. Recommendations ........................................................................................................................ 31
Appendix 1: Amoritization Assumptions for Capital Goods ...................................... 32
Appendix 2: Assumptions and Limitations ................................................................... 36
References ........................................................................................................................ 39
iii
ACKNOWLEDGMENTS
This study resulted from a productive collaboration among the Ministry of Health and Social Welfare
(MOHSW) of Tanzania, the U.S. Agency for International Development (USAID), and the Joint United
Nations Program on HIV/AIDS (UNAIDS). The USAID | Health Policy Initiative, Costing Task Order—
supported by the U.S. President’s Emergency Plan for AIDS Relief (PEPFAR) and implemented by
Futures Group in collaboration with Futures Institute—jointly conducted the costing activity with the
MOHSW. UNAIDS supported the activity though the Southern Africa Technical Support Facility (TSF).
Two principal investigators led the study: Dr. Steven Forsythe (USAID | Health Policy Initiative Costing
Task Order) and Ms. Mariam Ally (Head of Health Care Financing and Senior Economist, MOHSW).
The co-investigators included the following individuals:
Ms. Veena Menon, Senior Policy Analyst, Futures Group, Washington, DC
Dr. May Bukuku, Acting Information, Education, and Communication (IEC) Program Director,
National AIDS Control Program (NACP), Ministry of Health and Social Welfare (MOHSW)
Dr. Bennet Fimbo, Former Head IEC Unit, NACP, MOHSW
Dr. Emmanuel Njeuhmeli, Senior Biomedical Prevention Advisor, USAID Office of HIV/AIDS
Dr. Urbanus Kioko, University of Nairobi, Kenya
The MOHSW thanks the following people for their valuable contribution:
Dr. Debora Kajoka, Former Acting Program Manager, NACP, MOHSW
Dr. Redempta Mbatia, Former Director, International Center for AIDS Care and Treatment
Programs (ICAP)
Ms. Hally Mahler, Maternal and Child Health Integrated Program (MCHIP) (managed by
Jhpiego)
Dr. Abubakar Mwinyi, Prevention Coordinator, ICAP
Mr. Beatus Musoma, Vertical Programme Manager, Medical Stores Department (MSD),
MOHSW
Mr. Baraka Mpora, IEC Officer, NACP, MOHSW
Mr. Baldwin Kileo, MCHIP (managed by Jhpiego)
Dr. R. Swai, Former Programme Manager, NACP, MOHSW
The MOHSW would also like to thank the facility VMMC (voluntary medical male circumcision)
coordinators and site managers who helped to facilitate the data collection exercise, as well as the data
collectors—Faustine Nelson Njau, Sophia Matumula Said, Eliud Ihara and Bernard Kitula.
iii
EXECUTIVE SUMMARY
Tanzania is undertaking several activities to support the development of policy guidelines and a strategy
for voluntary medical male circumcision (VMMC). Given the evidence of the effectiveness of VMMC in
preventing the spread of HIV, the Government of Tanzania has adopted the medical practice as a
prevention strategy. To plan for the most efficient and effective scale-up of services, it is useful to
determine the costs and impacts of VMMC scale-up on the number of infections averted. This study
therefore aimed to estimate the unit cost per VMMC across three different service delivery models, to
help policymakers determine the costs and impacts of various options for scaling up VMMC services in
the country.
The study used the Decision Makers’ Program Planning Tool (DMPPT)1 to estimate the cost and impact
of scaling up VMMC on infections averted (http://www.malecircumcision.org). The cost analysis was
conducted from the perspective of health providers in the Iringa, Mbeya, and Kagera regions. Three
different VMMC delivery models (non-campaign, campaign, and mobile island outreach) were
considered, allowing for comparison of the unit costs across service delivery models. Non-campaign sites
are dedicated VMMC sites established at existing district and regional health delivery centers. The
campaign service delivery model is coordinated from these dedicated sites and largely implemented in a
stand-alone, temporary facility. Finally, the island outreach service delivery model comprises a team of
VMMC providers offering services in hard-to-reach areas. In the regions studied, non-campaign sites
were present in all three regions (Iringa, Mbeya and Kagera), the campaign model was used in just two
regions (Iringa and Kagera), and the island outreach model was used in only one region (Kagera). A total
of 12 sites were costed, representing three different service delivery models (some sites represented both
campaign and non-campaign service delivery models).
Our analysis shows that the average unit cost of performing VMMC in Tanzania (across all service
delivery models) is $46.61. Of the unit costs for non-campaign service delivery ($45.38), campaign
($45.98) and mobile ($128.60) service delivery models, the last was found to be significantly more
expensive. This high cost is attributable to high indirect costs, which account for the largest share of the
unit cost (64 percent) for island outreach sites. The relative costs of circumcision do not vary between
campaign and non-campaign sites. For both these service delivery models, 70 percent of the costs at
campaign and non-campaign sites are spent on salaries and consumables. The countrywide average unit
costs for each type of service delivery model are derived by averaging the unit costs of the three regions,
weighted according to number of circumcisions performed. Scaling up VMMC in Tanzania will yield
significant benefits – around $6000 in savings for averted treatment costs for each infection averted,
especially after the initial scale-up period. It is estimated that over a 15 year time frame a successful
VMMC program in Tanzania can prevent one HIV infection for every 19 circumcisions performed.
In addition to estimating costs, the DMPPT projects the impact of VMMC on the number of new HIV
infections. In the absence of VMMC the annual number of new infections is projected to rise from 84,000
in 2010 to 86,000 in 2025; but with VMMC, a significant decline to 64,000 is expected over the same
time period. Over the 15 years from 2010–2025, VMMC could avert almost 197,000 or 14.5 percent of all
new cases. Projected HIV infections decline marginally from 2010–2013 and the decline thereafter is
much faster, illustrating the long-term positive impact of scaling up VMMC.
Scaling up adult VMMC to reach 80 percent of men between ages 15 and 49 in regions where current
coverage is less than 80 percent (pushing the overall national coverage to 87.1 percent coverage by 2015)2
1 The DMPPT and manual are available at: http://www.malecircumcision.org/programs/DMPPT.html. 2 The national coverage estimate of 87.1% is based on estimates that the 8 targeted regions would reach an 80% coverage level
and the 13 non-targeted regions would retain their current levels of coverage.

iv
would avert nearly 28,000 new adult HIV infections through 2015 and almost 169,000 between 2016 and
2025—at an additional cost of $125.1 million through 2015 and an additional $59.5 million between 2016
and 2025. This would result in an average cost of $4,700 per HIV infection averted between 2010 and
2015, and $1,100 between 2010 and 2025. The results also indicate that increasing the prevalence of
VMMC from current levels to 87.1 percent by 2015 would produce a discounted net savings3 per
infection averted of $6,300 during the 2010–2025 time period.
This analysis makes it clear that VMMC could have an immediate impact on HIV transmission, but the
full impact on prevalence and deaths will only be apparent in the longer term—about 10–15 years from
now. The reason is largely because VMMC averts infections some years into the future among people
who have been circumcised. In the near term, the direct benefits of VMMC among men are likely to be
greater than that for women, since VMMC will directly impact HIV infections among men. However, in
the long run, both men and women will benefit substantially from the male circumcision program. The
analysis shows that scaling up VMMC will have a significant effect on the incidence of HIV. The results,
which are similar to findings from similar studies performed in Kenya, Zambia, and Zimbabwe, show that
with 80 percent coverage in the eight targeted regions, HIV incidence would fall significantly in Tanzania
from 0.39 percent in 2010 to 0.26 percent by 2025.
While the results indicate that scaling up VMMC coverage to 80 percent by 2015 in the targeted regions
would significantly reduce the number of new HIV infections, this would require increasing the annual
number of circumcision procedures from around 410,000 in 2010 to about 1.3 million in 2013 before
leveling off to about 480,000 after 2015. In addition, scaling up VMMC to reach the target by 2015 will
require a rapid increase in the number of circumcisions performed for the years 2010–2015, which will be
achieved in large part through intensified efforts to provide VMMC to the existing cohort of
uncircumcised men in the country.
3 Net savings are defined as the cost per infection averted relative to the discounted lifetime cost of treatment.

v
ABBREVIATIONS
AIDS Acquired Immune Deficiency Syndrome
CDC Centers for Disease Control and Prevention
DHS Demographic and Health Survey
DOD (United States) Department of Defense
DMPPT Decision Makers’ Program Planning Tool
HIV Human Immunodeficiency Virus
HPI Health Policy Initiative
HTC HIV Testing and Counseling
ICAP International Center for AIDS Care and Treatment Programs
IEC Information, Education, and Communication
MCHIP Maternal and Child Health Integrated Program
MOHSW Ministry of Health and Social Welfare
MOVE Models for Optimizing the Volume and Efficiency
MSD Medical Stores Department
NACP National AIDS Control Program
NGO Nongovernmental Organization
PITC Provider-Initiated Testing and Counseling
RA Research Assistants
TWG Technical Working Group
UNAIDS Joint United Nations Program on HIV/AIDS
USAID United States Agency for International Development
VCT Voluntary Counseling and Testing
VMMC Voluntary Medical Male Circumcision
WHO World Health Organization

1
I. INTRODUCTION
There is now clear evidence that VMMC significantly reduces the risk of heterosexually acquired HIV
infection in men by approximately 60 percent. This finding has been supported by at least three
randomized controlled clinical trials, which indicate that men who undergo VMMC by trained health
professionals in properly equipped settings show lower levels of HIV infection than uncircumcised men
(Auvert et al., 2005; Bailey et al., 2007; Gray et al., 2007; and William et al., 2006). Biological studies of
the foreskin also show that it contains a high concentration of cells susceptible to HIV infection. This is
one of three potential biological explanations of why circumcision may reduce HIV infection (the other
two being a reduction in sexually transmitted infections and a reduction in the likelihood of microtears
and trauma to the foreskin).
Based on the data from the clinical trials, it is estimated that circumcision across sub-Saharan Africa
could prevent up to 3.36 million new HIV infections, resulting in net savings (due to averted care and
treatment costs) amounting to $16.51 billion4 between 2011 and 2025 (Njeuhmeli et al., 2011). In light of
conclusive evidence that VMMC provides partial protection against HIV acquisition for men, the World
Health Organization (WHO) and Joint United Nations Program on HIV/AIDS (UNAIDS) recommended
that VMMC programs be added to the existing comprehensive HIV prevention package of services in
countries with predominantly heterosexual epidemics (WHO, 2010). The government of Tanzania has
identified low prevalence of VMMC as a contributing factor to the spread of HIV in some regions in the
country, and following the WHO-UNAIDS recommendation, has incorporated VMMC in the HIV
prevention portfolio.
WHO and UNAIDS, in collaboration with the U.S. President’s Emergency Plan for AIDS Relief
(PEPFAR), have been supporting countries with information and tools to assess the current situation and
develop future plans for VMMC scale-up. Part of this work involved a collaboration between UNAIDS
and the USAID | Health Policy Initiative (HPI), Task Order 1, to develop the Decision Makers’ Program
Planning Tool (DMPPT), which estimates the potential impact and costs of alternative approaches to
scaling up medical VMMC services (Bollinger et al., 2009a). This tool has been previously applied as
part of a desk review in 13 countries in sub-Saharan Africa (Tanzania included) to provide information
for countries’ VMMC policy development. Although the tool was used to estimate the impacts of a
VMMC campaign in Tanzania, certain variables and inputs comprised regional averages or estimates that
were not always based on country-specific unit costs or approved epidemiological and demographic data.
This initial desktop exercise aimed to inform decision makers in the early stages of formulating country
policies with respect to VMMC. UNAIDS and WHO have encouraged on-going use of the DMPPT to
guide the development of policy and implementation of the VMMC program, and to refine cost estimates.
As a result, the Tanzania Ministry of Health and Social Welfare (MOHSW) requested technical assistance
from the USAID | Health Policy Initiative Costing Task Order to guide the application and use of the
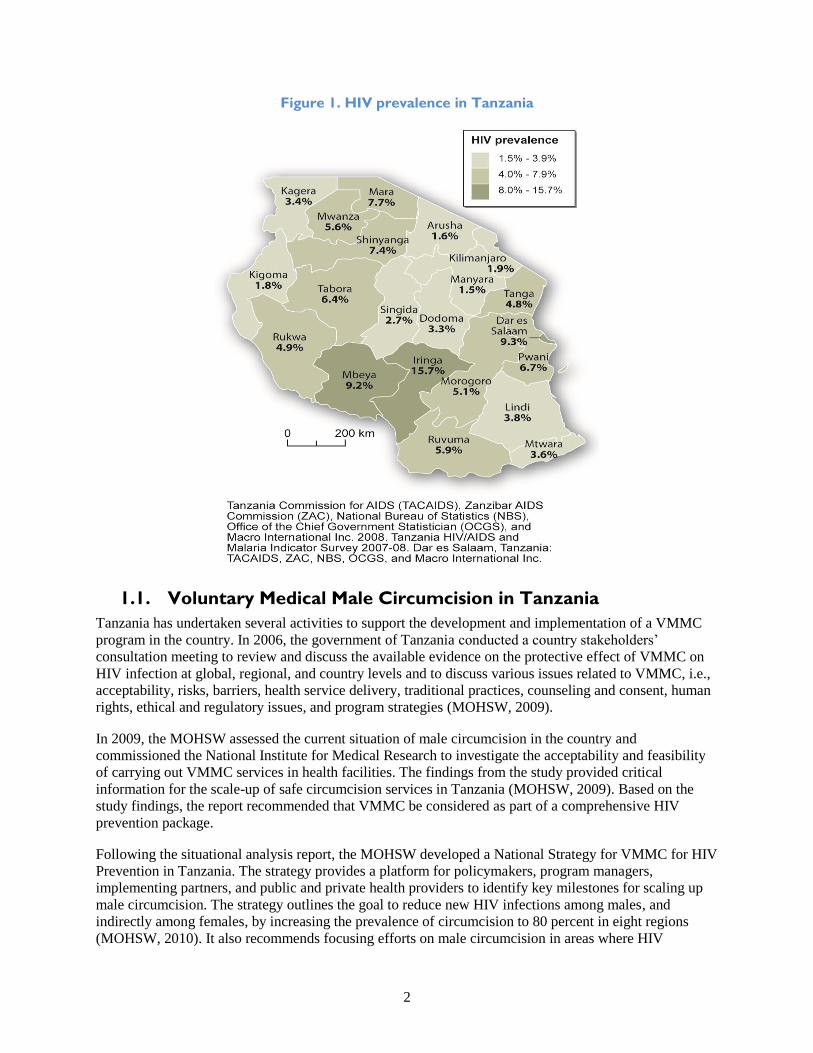
DMPPT, while incorporating up-to-date and accurate costing data. Figure 1 shows the rates of HIV
prevalence across Tanzania.
4 All costs are in US$ unless otherwise noted; exchange rate: US$1 = Tsh 1469 (2010).
2
Figure 1. HIV prevalence in Tanzania
1.1. Voluntary Medical Male Circumcision in Tanzania
Tanzania has undertaken several activities to support the development and implementation of a VMMC
program in the country. In 2006, the government of Tanzania conducted a country stakeholders’
consultation meeting to review and discuss the available evidence on the protective effect of VMMC on
HIV infection at global, regional, and country levels and to discuss various issues related to VMMC, i.e.,
acceptability, risks, barriers, health service delivery, traditional practices, counseling and consent, human
rights, ethical and regulatory issues, and program strategies (MOHSW, 2009).
In 2009, the MOHSW assessed the current situation of male circumcision in the country and
commissioned the National Institute for Medical Research to investigate the acceptability and feasibility
of carrying out VMMC services in health facilities. The findings from the study provided critical
information for the scale-up of safe circumcision services in Tanzania (MOHSW, 2009). Based on the
study findings, the report recommended that VMMC be considered as part of a comprehensive HIV
prevention package.
Following the situational analysis report, the MOHSW developed a National Strategy for VMMC for HIV
Prevention in Tanzania. The strategy provides a platform for policymakers, program managers,
implementing partners, and public and private health providers to identify key milestones for scaling up
male circumcision. The strategy outlines the goal to reduce new HIV infections among males, and
indirectly among females, by increasing the prevalence of circumcision to 80 percent in eight regions
(MOHSW, 2010). It also recommends focusing efforts on male circumcision in areas where HIV
3
prevalence is 15 percent or more and circumcision prevalence is less than 20 percent. In addition, VMMC
activities are to focus on men ages 10–24 years because they are already sexually active or will soon
become sexually active. The strategy also recommends that the delivery of VMMC services be integrated
within the existing public and private health delivery system, comprising referral, specialized, regional,
and district hospitals and primary health facilities.
To operationalize the VMMC strategy, the MOHSW identified eight regions as phase one regions to scale
up VMMC services based on high HIV prevalence levels and low male circumcision levels: Iringa,
Mbeya, Shinyanga, Rukwa, Tabora, Mwanza, Kagera, and Mara. The strategic plan outlines the initial
scale-up of VMMC using three approaches within these eight low circumcision prevalence regions:
Short-term adult VMMC (15–34 years) program5 lasting five years and delivered through public,
private nongovernmental organization (NGO), integrated/non-campaign, and outreach clinics
Medium-term adolescent VMMC program for 10–14 year olds
Long-term neonatal VMMC program targeting neonates and fully integrated in existing health
services
To scale-up VMMC in the country, the Tanzania government established a national VMMC Technical
Working Group (TWG), led by the MOHSW, comprising a broad range of representatives from
government departments at the national, regional, and district levels; development partners; key civil
society organizations; and networks of people living with HIV. The mandate of the VMMC TWG is to
Lead and coordinate the scale-up of VMMC activities in the country,
Advise the MOHSW and its partners, and
Provide the necessary technical guidance in planning for the scale-up and oversee the
implementation of a national VMMC program.
Regional planning meetings were organized in the eight low circumcision selected regions to develop
VMMC action plans and budgets. Each regional working groups developed two-year plans (2011–2012)
for VMMC, targeting the first (10–24 years) and second (25–34 years) priority age groups.
Other events in the operationalization of the VMMC strategy included the following:
Maternal and Child Health Integrated Program (MCHIP) (USAID-funded program managed by
Jhpiego) training for new providers in VMMC service provision.
Establishment of demonstration sites in Mbeya, Iringa, and Kagera.
Sensitization meetings with stakeholders at regional and districts levels to mobilize the
community and create demand for rapid scale-up of VMMC and plan implementation. These
meetings served to help
o Develop and produce technical and financial materials to facilitate plan implementation;
o Identify development partners, NGOs, and human resources to implement services;
o Approve the use of government facilities for campaigns;
o Create local ownership of campaigns; and
5 Although the country program focuses on adults age 15 to 34, the model used in this analysis includes VMMC for adult males
age 15 to 49 to allow for comparison with estimates from other countries.

4
o Provide a forum for the creation of a taskforce to oversee the planning and
implementation of campaigns.
Formation of a steering committee at the regional and district levels.
Formation of a technical committee at the district level and establishment of a demand-creation
task force at the regional level.
At each site, all stakeholders and the community health management teams participated in an orientation
workshop on VMMC services. The partners also conducted needs assessments for equipment and
infrastructure renovations, after which a memorandum of understanding was drafted between the
development partner supporting VMMC in the region and each site.
The delivery of VMMC services in Tanzania incorporates many of the recommendations for increasing
program efficiency that were outlined in WHO’s “Models for Optimizing the Volume and Efficiency of
MC Services (MOVE).” The WHO guidelines recommend increasing efficiencies in use of staff time and
facility space, and also propose strategies to increase productivity of program managers, while ensuring
high quality of service delivery. These strategies include optimizing the use of facility space (using
multiple surgical beds in one room); maximizing staff time (using the forceps-guided surgical technique,
task shifting and task sharing); using VMMC kits that include disposable consumables and sets of
reusable or disposable surgical instruments; and employing a multi-disciplinary team of trained and
certified providers drawn from available service providers in health facilities to provide VMMC services.
The recommended team of providers includes a surgeon (medical officer, assistant medical officer,
clinical officer, or trained nurse); surgical assistant; and trained counsellor to provide counselling and
testing services. The degree of MC prevalence in Tanzania is shown in Figure 2.
Figure 2. VMMC prevalence in Tanzania6
6 Male circumcision estimates are also available from the Tanzania HIV/AIDS and Malaria Indicator Survey (2007-08)

5
1.2. Description of the DMPPT and VMMC Costing Workbook
The DMPPT was developed to support policy formulation and planning for the scale-up of safe VMMC
services. It enables analysts and decision makers to understand the costs and impacts of policy options
regarding VMMC. The tool is part of a bigger toolkit developed by the WHO and UNAIDS that provides
guidelines on comprehensive approaches to VMMC, including types of surgical procedures and key
policy and cultural issues (WHO and UNAIDS, 2008). As noted earlier, the DMPPT is designed to help
countries collect and analyze information to provide policymakers and planners with insights into several
key questions, such as the following:
How much will it cost to scale up VMMC services?
What is the expected impact of scaling up VMMC services? How many infections could be
averted?
What is the impact of providing VMMC to all adult men versus targeting services to adolescents,
young men, newborns, men at high risk of HIV, or other special populations, such as the military
or university students?
What targets are feasible and how quickly can services be scaled up?
How do the costs vary depending on the delivery strategy, including the types of facilities that
will offer services?
Is VMMC cost-effective when compared to other prevention interventions?
Will VMMC result in cost savings when compared to antiretroviral treatment costs?
How can VMMC be integrated into a comprehensive package of prevention services for men at
the service delivery sites?
The DMPPT has two modules: costing and impact. The first component comprises a Male Circumcision
Costing Workbook (MC Workbook), which is an Excel workbook that has been designed to facilitate the
development of a unit cost for male circumcision at the facility level. The tool requires the collection and
analysis of direct costs (personnel, VMMC commodities, and training) and indirect costs (indirect
personnel, overhead, and capital). Capital and initial training costs are annualized for inclusion in the unit
cost analysis.
The impact module requires key input assumptions about the epidemiological and demographic data in
the country (demographic data, current prevalence of male circumcision, and sexual behavior of the target
group, HIV prevalence trends, priority populations, target coverage levels, and service delivery models).
Other inputs include the unit cost of circumcision in various settings (which is derived from the cost
module) and the mix of service delivery methods. These assumptions are used to examine the impact of
VMMC scale-up on infections averted and the associated costs.
In estimating the contribution of direct personnel costs, the time spent on each circumcision case is taken
into account. The time spent on each male circumcision is then multiplied by the hourly rate of the
clinical personnel. Although the cost associated with demand creation is calculated in the tool, it does not
contribute to the unit cost of VMMC. Instead, national-level demand-creation costs are included in the
DMPPT as a lump-sum annual expense. The reason for excluding the demand-creation costs in facility-
based unit costs is because the amount spent on demand creation is not directly related to the number of
clients who are circumcised at the facility level.

6
1.3. Study Objective
The primary objective of this study was to determine the costs and impacts of various options for scaling
up VMMC in Tanzania, to inform the MOHSW’s plans for scaling up the country’s VMMC national
program. The results provide information on the unit costs of performing VMMC for different service
delivery models, and also provide an approximate estimate of total resources required to scale up VMMC
services throughout the country. The data will inform policymakers, planners, and funders of the true
costs of providing VMMC services using different service delivery models. These data will be used to
help the MOHSW plan for and mobilize additional resources for VMMC program implementation.
The specific objectives of the activity were to:
Calculate accurate unit costs for specific types of VMMC service delivery in Tanzania;
Update the DMPPT with the latest demographic and epidemiological data and facility-based
costing information; and
Provide an estimate of resources required for scaling up VMMC to the target coverage level, and
project infections averted as a result of scale-up.
7
2. METHODOLOGY
2.1. Study Design
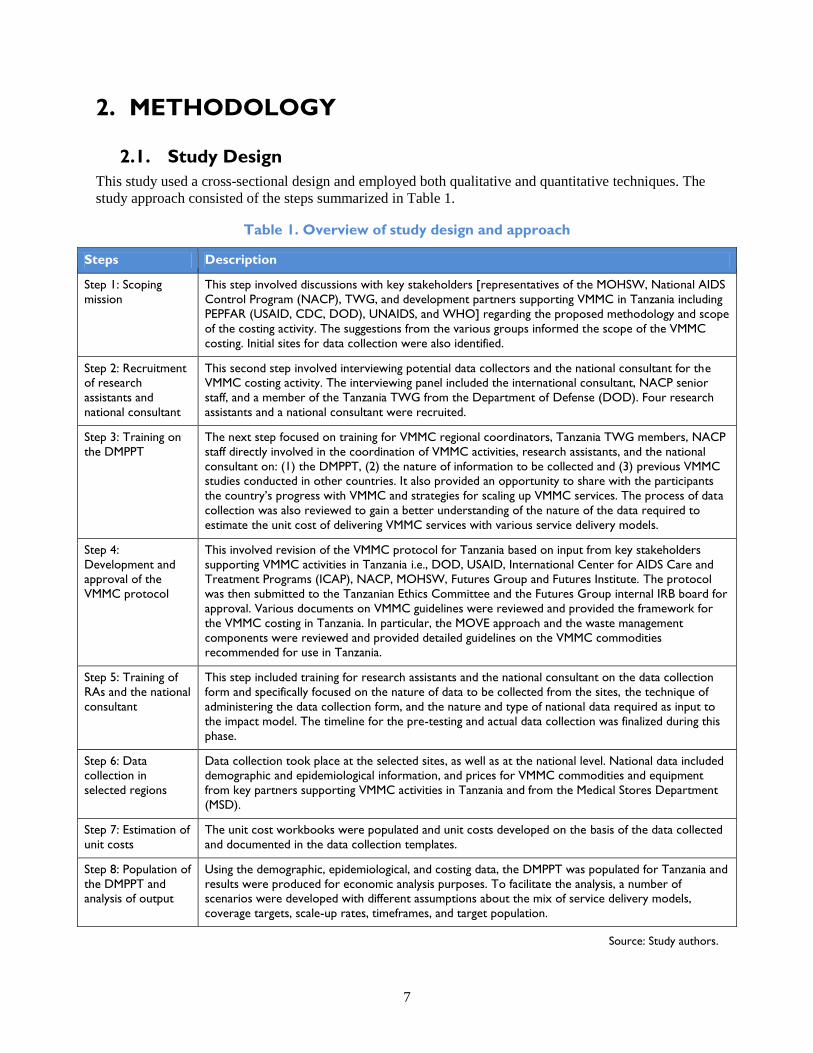
This study used a cross-sectional design and employed both qualitative and quantitative techniques. The
study approach consisted of the steps summarized in Table 1.
Table 1. Overview of study design and approach
Steps Description
Step 1: Scoping
mission
This step involved discussions with key stakeholders [representatives of the MOHSW, National AIDS
Control Program (NACP), TWG, and development partners supporting VMMC in Tanzania including
PEPFAR (USAID, CDC, DOD), UNAIDS, and WHO] regarding the proposed methodology and scope
of the costing activity. The suggestions from the various groups informed the scope of the VMMC
costing. Initial sites for data collection were also identified.
Step 2: Recruitment
of research
assistants and
national consultant
This second step involved interviewing potential data collectors and the national consultant for the
VMMC costing activity. The interviewing panel included the international consultant, NACP senior
staff, and a member of the Tanzania TWG from the Department of Defense (DOD). Four research
assistants and a national consultant were recruited.
Step 3: Training on
the DMPPT
The next step focused on training for VMMC regional coordinators, Tanzania TWG members, NACP
staff directly involved in the coordination of VMMC activities, research assistants, and the national
consultant on: (1) the DMPPT, (2) the nature of information to be collected and (3) previous VMMC
studies conducted in other countries. It also provided an opportunity to share with the participants
the country’s progress with VMMC and strategies for scaling up VMMC services. The process of data
collection was also reviewed to gain a better understanding of the nature of the data required to
estimate the unit cost of delivering VMMC services with various service delivery models.
Step 4:
Development and
approval of the
VMMC protocol
This involved revision of the VMMC protocol for Tanzania based on input from key stakeholders
supporting VMMC activities in Tanzania i.e., DOD, USAID, International Center for AIDS Care and
Treatment Programs (ICAP), NACP, MOHSW, Futures Group and Futures Institute. The protocol
was then submitted to the Tanzanian Ethics Committee and the Futures Group internal IRB board for
approval. Various documents on VMMC guidelines were reviewed and provided the framework for
the VMMC costing in Tanzania. In particular, the MOVE approach and the waste management
components were reviewed and provided detailed guidelines on the VMMC commodities
recommended for use in Tanzania.
Step 5: Training of
RAs and the national
consultant
This step included training for research assistants and the national consultant on the data collection
form and specifically focused on the nature of data to be collected from the sites, the technique of
administering the data collection form, and the nature and type of national data required as input to
the impact model. The timeline for the pre-testing and actual data collection was finalized during this
phase.
Step 6: Data
collection in
selected regions
Data collection took place at the selected sites, as well as at the national level. National data included
demographic and epidemiological information, and prices for VMMC commodities and equipment
from key partners supporting VMMC activities in Tanzania and from the Medical Stores Department
(MSD).
Step 7: Estimation of
unit costs
The unit cost workbooks were populated and unit costs developed on the basis of the data collected
and documented in the data collection templates.
Step 8: Population of
the DMPPT and
analysis of output
Using the demographic, epidemiological, and costing data, the DMPPT was populated for Tanzania and
results were produced for economic analysis purposes. To facilitate the analysis, a number of
scenarios were developed with different assumptions about the mix of service delivery models,
coverage targets, scale-up rates, timeframes, and target population.
Source: Study authors.

8
2.2. Study Population
Selection of sites
Tanzania’s National Multisectoral HIV Prevention Strategy 2009–2012 recommends a targeted scale-up
of VMMC in eight out of the 21 regions that have the highest burden of HIV and lowest prevalence of
male circumcision (MOHSW, 2010). The eight regions for initial scale-up include Iringa, Kagera, Mara7,
Mbeya, Mwanza, Rukwa, Shinyanga, and Tabora. Table 2 outlines both male HIV prevalence and MC
prevalence in each of the regions.
Table 2. Male HIV prevalence and male circumcision prevalence in Tanzania
Targeted Regions HIV Prevalence MC Prevalence
Iringa 15.7% 37.7%
Kagera 3.4% 26.4%
Mbeya 9.2% 34.4%
Mara 7.7% 89.0%
Mwanza 5.5% 54.1%
Rukwa 4.9% 31.4%
Shinyanga 7.4% 26.5%
Tabora 6.4% 42.8%
Non-targeted Regions HIV Prevalence MC Prevalence
Dar es Salaam 9.3% 97.9%
Ruvuma 5.9% 68.9%
Pwani 6.7% 96.9%
Morogoro 5.1% 93.1%
Lindi 3.8% 93.3%
Tanga 4.8% 95.0%
Dodoma 3.3% 96.9%
Mtwara 3.6% 93.1%
Singida 2.7% 90.9%
Kilimanjaro 1.9% 97.0%
Manyara 1.5% 97.3%
Arusha 1.6% 96.2%
Kigoma 1.8% 68.4%
Source: MOHSW, 2010. National Strategy for Scaling Up Male Circumcision for HIV Prevention.
7 While the prevalence of male circumcision in Mara already exceeds 80 percent, the Rorya District in the Mara region has an
MC prevalence of only 30 percent and thus was the focus of the analysis.

9
As mentioned earlier, VMMC implementation began in three demonstration regions: Iringa, Mbeya, and
Kagera. Per the recommendation of the MC TWG and the MOHSW/NACP, all three regions were
included in this unit cost assessment. The distribution of facilities by location and service delivery model
in each of the three regions is shown in Table 3. A total of 12 sites were costed, some of which offered
VMMC as part of both a campaign and non-campaign service delivery model. As a result, 14 unit costs
were developed (11 non-campaign, 2 campaign and 1 island).
Table 3. Distribution of facilities by location and service delivery model
Region Implementing
Partner/Donor
No. of
Sites Name of Site Location
Service
Delivery
Model
Commencement
Date of VMMC
Services
Iringa MCHIP 5 Ngome Health
Center Iringa urban
Non-
campaign June 2010
Mafinga District
Hospital Mufindi
Non-
campaign June 2010
Iringa Regional
Hospital Iringa urban
Non-
campaign
&
Campaign
September 2009
Tosamaganga DD
Hospital
Iringa rural
district
Non-
campaign June 2010
Lugoda Hospital Mufindi
District
Non-
campaign June 2010
Mbeya DOD 4
Mbeya Referral
Hospital Mbeya MC
Non-
campaign
&
Campaign
March 2010
Mbeya Regional
Hospital Mbeya MC
Non-
campaign
September 2010
Metta Maternity
Hospital Mbeya MC
Non-
campaign May 2010
Mbalizi Military
Hospital
Mbalizi
District
Non-
campaign January 2010
Kagera ICAP 3 Kagera Regional
Hospital Bukoba
Non-
campaign October 2009
Rubya
Designated
District Hospital
Rubya Non-
campaign September 2010
Goziba in Lake
Victoria
Mobile
island
January 2011
(Campaign)

10
2.3. Service Delivery Models for Voluntary Medical Male
Circumcision in Tanzania
Scaling up VMMC to reach the target of 87.18 percent of all adult and newborns in Tanzania requires
various service delivery models. The 87.1 percent target for male circumcision was obtained first by
assessing the current coverage by region, which was available from the 2010 National Strategy for
Scaling Up Male Circumcision for HIV Prevention. Regions where coverage is currently less than 80
percent were assumed to achieve 80 percent coverage, while regions where male circumcision was
already above 80 percent were assumed to remain at current levels. When the coverage rates for each
region were averaged together, the nationwide target for circumcision coverage was determined to be 87.1
percent.
In areas with traditional cultural male circumcision, the scale-up strategy is aimed at promoting VMMC
services within existing health facilities. In non-circumcising areas, the recommended approach is to
promote and scale up: (1) non-campaign facility services in regional and district hospitals, (2) outreach
services (health centers and dispensaries), and (3) mobile service delivery among hard-to-reach
populations.
Tanzania has adopted three VMMC service delivery models, each of which is summarized below:
Non-campaign. This is a dedicated service delivery model established within the existing public and
private health delivery system (including district, regional, and referral hospitals and health centers). Each
site has a minimum of four beds per surgical room and is staffed by a team of six VMMC providers (one
medical officer, two bed nurses, one counselor, one follow-up nurse, and one nursing assistant) and a
cleaner. To optimize service delivery, the medical officer/clinical officer or a physician performs some
steps of the surgery including removal of the foreskin, hemostasis, and placement of the four mattress
sutures, while the nurse aides perform all the other surgical steps including preparation of the patient,
injection of the anesthetic, placement of secondary sutures, and bandaging. This gives the surgeon more
time to focus on providing additional circumcisions. The VMMC counseling services and HIV counseling
and testing (HTC) services are provided by the counselors who are also trained nurses. On average, this
team can carry out 30–60 circumcisions per day depending on demand.
Campaign. These are coordinated from the dedicated sites and, at present, are primarily implemented
within existing facilities (usually a district, regional, or referral hospital and health center) by MCHIP and
ICAP in order to meet the demand for VMMC services. The campaign service delivery model occurs at
fixed sites but provides services as part of a campaign event. The campaign site is assigned to co-site
managers, which are usually the medical officers in charge of the facility and a staff member from the
partner supporting the VMMC services in the region. The co-site manager is responsible for the day-to-
day activities and oversees all logistics for human resources and supplies in the site. In addition to the co-
site manager, each site has between two and three surgeons, four to eight bed nurses, two to four VMMC
counselors, one data clerk, one equipment/commodity manager, one equipment sterilizer, one
receptionist, two decontamination personnel, one store keeper, one follow-up nurse, one post-operation
nurse, one runner nurse, and a driver.
8 This is extrapolated from regional coverage estimates in the 2010 Demographic and Health Survey (DHS). The proportion of
total population circumcised is arrived at by calculating the proportion of percent circumcised in each region to the total
population in that region (based on DHS sample size). The total for all regions gives us the national average of the circumcised
population in the country.

11
On average, the team performs about 40 to 100 circumcisions per day depending on demand. All the
counselors working in the campaigns have undergone facility-based training in HIV testing and
counseling (HTC). Where there is a shortage of counselors, outreach HTC partners relocate to the
campaign sites. The target group during campaigns includes young males who are not sexually active and
young males aged 10 to 24 years (as per the national strategy). During the campaigns, the strategy for
demand creation employs peer educators (especially those already circumcised); community mobilization
through radio ads; and distribution of information, education, and communication materials.
Mobile/Island Outreach. This service delivery model comprises a team of VMMC providers offering
services in hard-to-reach areas, with services being coordinated from a non-campaign site located at a
hospital. Island outreach to the islands of Lake Victoria is one example of a mobile service delivery
model. Traditionally the islands have lacked access to many health interventions, given the relatively
small populations and the difficulty of reaching individuals on these islands. However, given the mobility
of fishermen on these islands, the population is perceived to be at high risk of HIV infection. Thus
VMMC interventions on these islands were prioritized.
In the case of Kagara, this service delivery model is coordinated from the non-campaign site at Kagera
Regional Hospital. The island outreach team travels to the islands by boat with all the necessary
equipment and commodities required for an island outreach operation. Because of a lack of health
facilities on some of the islands, outreach activities are carried out in special tents acquired for VMMC
services. The team comprises two surgeons, four bed nurses, two VMMC counselors, one data clerk, one
equipment/commodity manager, one equipment sterilizer, one receptionist, two decontamination
personnel, one store keeper, one follow-up nurse, one post-operation nurse, one runner nurse, government
officials, the medical officer in charge, and the VMMC coordinator in the region. All the counselors
working in the mobile sites have undergone facility-based training in HTC.
2.4. Data Collection, Management, and Analysis
This section briefly describes the data collection, management, and analysis processes.
Development of survey instrument
A detailed data collection survey was used in Tanzania to gather information in the demonstration sites.
The survey was based on existing data collection tools used in other countries and modified to reflect
specific information required in the Tanzanian setting for calculation of the unit cost. The survey enables
the collection of financial data, operational data, and VMMC programmatic data. Most financial
information (e.g., price of commodities and equipment) were extracted from the database of partners
supporting VMMC services in each region. Additional information on the number of VMMC completed,
cost of training, number of personnel trained, and prices of drugs and supplies were obtained from the
partners. A copy of the survey is attached as Annex C.
Selection of research assistants
The research assistants hired to collect data were interviewed by a panel of senior NACP staff, the DOD
representative, and the international consultant. A total of four research assistants were recruited. The
team included two pharmacists with prior experience in data collection and two data collectors with a
background in social work. The research assistants were trained using the survey before commencing the
exercise. In addition, all the data collectors attended the DMPPT training with the NACP VMMC
regional coordinators and representatives from development partners supporting VMMC activities in
Tanzania.

12
Sources of data
Data were collected from various sources. Tables 4 and 5 summarize the most important data sources for
the various components of the unit costing tool and the DMPPT.
Data capturing and analysis
All the data collected were checked and entered by the international consultant and study investigators
into the unit costing tool and the DMPPT. Prior to data capturing, the unit costing workbooks were
adjusted to take into account the additional input data, including waste management.
Cost analysis
The cost analysis was divided into two components: (1) defining the intervention (based on the VMMC
protocol and conducting key informant interviews with current providers of circumcision); and (2) costing
adult9 VMMC (collecting direct and indirect cost data—financial, human resources, drugs, supplies, and
equipment costs—from providers). An ingredients approach to costing was followed, whereby all the
inputs were listed and their contribution to the overall cost was then quantified. Different service
providers and service delivery models (non-campaign, campaign, and island outreach) were considered,
allowing for comparison and validation. The costing was largely informed by the actual costs incurred at
the selected sites. Personnel costs for clinical staff were calculated at a rate equal to that currently being
paid to doctors and nurses working in the public sector, with the exception of Ngome Hospital, a private
facility. The salary scale for health personnel is relatively higher than the government rate for permanent
staff. The unit costs were adjusted for the probability of, and cost associated with, complications.
Table 4. Summary of data sources—costing
Type of Data Source of Data
Programmatic and
non-financial
operational data
Programmatic data were collected through key informant interviews at the facility. Informants
included the doctors and nurses responsible for male circumcision and counseling, as well as
senior administrative staff. In all sites, the number of circumcisions completed was extracted
from the VMMC register at the facility.
Staffing and time
spent
Information on time taken for the VMMC activities was obtained through interviews with key
informants in the facility. In several of the sites, the time taken for VMMC procedures was
estimated by the VMMC providers. A time-motion study, evaluating time required for each
procedure, was not performed as part of this study.
Staff salaries were extracted from official government pay scales for each cadre, while
information on overtime allowance was obtained from key informants at the facility. In addition
to the interviews, some information on allowances paid to VMMC providers was obtained from
the partners supporting VMMC activities in the region. This information was used to validate
questionnaire information with respect to additional allowances paid by partners to VMMC
service providers.
Equipment,
commodities, and
consumables and
supply chain
management
The cost of equipment, commodities, and consumables were extracted from official invoices
provided by partners supporting VMMC services in each region. For Iringa, the price of
equipment, commodities, and consumables came from MCHIP. In Mbeya and Kagera, the prices
of commodities, equipment and supplies came from the Medical Stores Department (MSD).
Both the MSD prices and those obtained from MCHIP include the cost of supply chain
management (e.g., logistics, warehousing, and distribution to the sites).
9 The focus of this cost analysis was to calculate the unit cost of an adult male circumcision. Further analysis is required to assess
how the cost of neonatal circumcision would differ from the cost of adult male circumcision.
13
Type of Data Source of Data
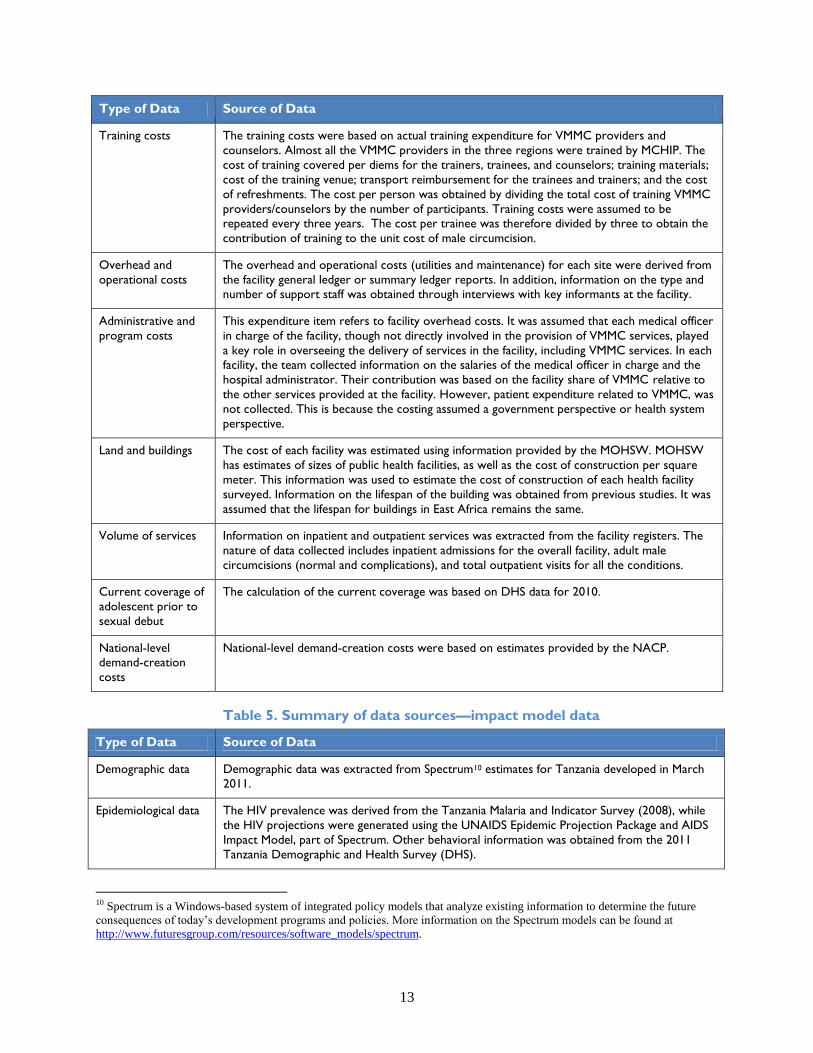
Training costs The training costs were based on actual training expenditure for VMMC providers and
counselors. Almost all the VMMC providers in the three regions were trained by MCHIP. The
cost of training covered per diems for the trainers, trainees, and counselors; training materials;
cost of the training venue; transport reimbursement for the trainees and trainers; and the cost
of refreshments. The cost per person was obtained by dividing the total cost of training VMMC
providers/counselors by the number of participants. Training costs were assumed to be
repeated every three years. The cost per trainee was therefore divided by three to obtain the
contribution of training to the unit cost of male circumcision.
Overhead and
operational costs
The overhead and operational costs (utilities and maintenance) for each site were derived from
the facility general ledger or summary ledger reports. In addition, information on the type and
number of support staff was obtained through interviews with key informants at the facility.
Administrative and
program costs
This expenditure item refers to facility overhead costs. It was assumed that each medical officer
in charge of the facility, though not directly involved in the provision of VMMC services, played
a key role in overseeing the delivery of services in the facility, including VMMC services. In each
facility, the team collected information on the salaries of the medical officer in charge and the
hospital administrator. Their contribution was based on the facility share of VMMC relative to
the other services provided at the facility. However, patient expenditure related to VMMC, was
not collected. This is because the costing assumed a government perspective or health system
perspective.
Land and buildings
The cost of each facility was estimated using information provided by the MOHSW. MOHSW
has estimates of sizes of public health facilities, as well as the cost of construction per square
meter. This information was used to estimate the cost of construction of each health facility
surveyed. Information on the lifespan of the building was obtained from previous studies. It was
assumed that the lifespan for buildings in East Africa remains the same.
Volume of services
Information on inpatient and outpatient services was extracted from the facility registers. The
nature of data collected includes inpatient admissions for the overall facility, adult male
circumcisions (normal and complications), and total outpatient visits for all the conditions.
Current coverage of
adolescent prior to
sexual debut
The calculation of the current coverage was based on DHS data for 2010.
National-level
demand-creation
costs
National-level demand-creation costs were based on estimates provided by the NACP.
Table 5. Summary of data sources—impact model data
Type of Data Source of Data
Demographic data Demographic data was extracted from Spectrum10 estimates for Tanzania developed in March
2011.
Epidemiological data The HIV prevalence was derived from the Tanzania Malaria and Indicator Survey (2008), while
the HIV projections were generated using the UNAIDS Epidemic Projection Package and AIDS
Impact Model, part of Spectrum. Other behavioral information was obtained from the 2011
Tanzania Demographic and Health Survey (DHS).
10 Spectrum is a Windows-based system of integrated policy models that analyze existing information to determine the future
consequences of today’s development programs and policies. More information on the Spectrum models can be found at
http://www.futuresgroup.com/resources/software_models/spectrum.
14
Three sets of unit costs were calculated for the non-campaign, campaign, and island outreach service
delivery models. The rationale for keeping the unit costs separate was that there were important
differences in various components of the models; for example: (1) the number of VMMC providers
involved in the service provision during the campaigns is higher than non-campaigns; (2) during
campaigns additional surgical bays are added per site; (3) the campaign model fully utilizes the bays
during the VMMC campaigns, whereas the other models do not; and (4) a significantly higher number of
VMMCs are performed during the campaign period relative to the non-campaign periods. The weighted
unit cost for non-campaign, campaign, and island outreach sites in each region were used to generate an
average weighted unit cost per type of service delivery model in Tanzania. Overhead costs such as
equipment, utilities, transport, maintenance, and support were calculated based on the relative share of
VMMC compared to the total facility workload.
Two key scenarios were developed for analysis purposes. The first scenario assumes achievement of the
national VMMC coverage of 87.1 percent of the target group (males ages 15–49) by 2015. The second
scenario assumes that coverage will remain the same (i.e., 66.8% of all adult males are circumcised). The
87.1 percent was calculated using data on male circumcision in the Demographic and Health Survey
(DHS) for 2010.
Finally, the analysis adopts the perspective of a service provider in Tanzania and costs are for 2010.
When conducting the cost-effectiveness analysis, future costs and benefits are discounted to 2010 at 3
percent annually. This discount rate has been recommended by UNAIDS and has been used in previous
VMMC costing studies (Auvert et al., 2008; and Bollinger et al., 2009b). Costs incurred by VMMC
clients (e.g., client travel costs, clients’ opportunity cost of travel time, their opportunity cost of post-
operative healing time, etc.) were excluded from the analysis.
Quality assurance and validation of the data
The team followed an internal and external process for ensuring quality of data collection and outputs
from the unit costing tool and DMPPT. The data recorded on the surveys were captured by the co-
principal investigator and international consultants and entered into the unit costing tool. The lead
consultant and the team leader checked the unit cost calculations and analysis spreadsheets for accuracy,
completeness, and reasonableness. The international consultant conducted a site visit and checked and
traced, on a sample basis, some of the questionnaire data back to source data at the site.
Validation of data and output was carried out by Ms. Veena Menon, Futures Group; Dr. Steven Forsythe,
Futures Institute; and USAID and UNAIDS staff members. Formal dissemination of the cost study
findings to a wider audience, such as the inter-agency task force on VMMC, had not yet taken place at the
time of writing this report.
15
3. RESULTS OF COSTING AND MODELING
3.1. Cost of VMMC per Service Delivery Model: Campaign vs. Non-
Campaign
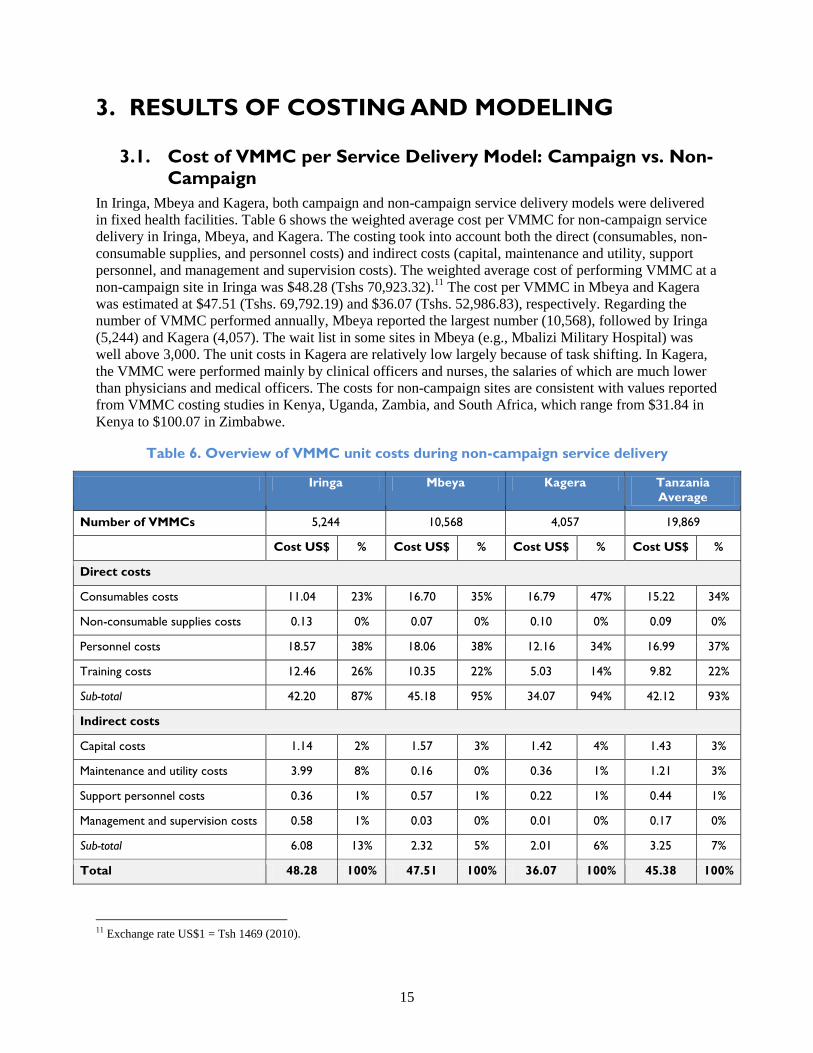
In Iringa, Mbeya and Kagera, both campaign and non-campaign service delivery models were delivered
in fixed health facilities. Table 6 shows the weighted average cost per VMMC for non-campaign service
delivery in Iringa, Mbeya, and Kagera. The costing took into account both the direct (consumables, non-
consumable supplies, and personnel costs) and indirect costs (capital, maintenance and utility, support
personnel, and management and supervision costs). The weighted average cost of performing VMMC at a
non-campaign site in Iringa was $48.28 (Tshs 70,923.32).11
The cost per VMMC in Mbeya and Kagera
was estimated at $47.51 (Tshs. 69,792.19) and $36.07 (Tshs. 52,986.83), respectively. Regarding the
number of VMMC performed annually, Mbeya reported the largest number (10,568), followed by Iringa
(5,244) and Kagera (4,057). The wait list in some sites in Mbeya (e.g., Mbalizi Military Hospital) was
well above 3,000. The unit costs in Kagera are relatively low largely because of task shifting. In Kagera,
the VMMC were performed mainly by clinical officers and nurses, the salaries of which are much lower
than physicians and medical officers. The costs for non-campaign sites are consistent with values reported
from VMMC costing studies in Kenya, Uganda, Zambia, and South Africa, which range from $31.84 in
Kenya to $100.07 in Zimbabwe.
Table 6. Overview of VMMC unit costs during non-campaign service delivery
Iringa Mbeya Kagera Tanzania
Average
Number of VMMCs 5,244 10,568 4,057 19,869
Cost US$ % Cost US$ % Cost US$ % Cost US$ %
Direct costs
Consumables costs 11.04 23% 16.70 35% 16.79 47% 15.22 34%
Non-consumable supplies costs 0.13 0% 0.07 0% 0.10 0% 0.09 0%
Personnel costs 18.57 38% 18.06 38% 12.16 34% 16.99 37%
Training costs 12.46 26% 10.35 22% 5.03 14% 9.82 22%
Sub-total 42.20 87% 45.18 95% 34.07 94% 42.12 93%
Indirect costs
Capital costs 1.14 2% 1.57 3% 1.42 4% 1.43 3%
Maintenance and utility costs 3.99 8% 0.16 0% 0.36 1% 1.21 3%
Support personnel costs 0.36 1% 0.57 1% 0.22 1% 0.44 1%
Management and supervision costs 0.58 1% 0.03 0% 0.01 0% 0.17 0%
Sub-total 6.08 13% 2.32 5% 2.01 6% 3.25 7%
Total 48.28 100% 47.51 100% 36.07 100% 45.38 100%
11 Exchange rate US$1 = Tsh 1469 (2010).
16
A comparison of the expense categories highlights some differences between the sites in the three regions
during non-campaign service delivery. Personnel costs account for the single biggest contribution to the
unit costs in all three provinces—about 38 percent of the total costs in Iringa and Mbeya and 34 percent in
Kagera. Personnel costs per VMMC are significantly higher in Iringa and Mbeya ($18.57 and $18.06)
compared with Kagera ($12.16). This is attributable to overtime allowances paid to VMMC service
providers in Iringa and Mbeya for after-hours work and fixed government scale salaries for Kagera
service providers.
Consumables include drugs and supplies, while non-consumable supplies include items such as surgical
gowns, sterile drapes, and surgical equipment used during pre- and post-circumcision. Consumable costs
account for 23 percent, 35 percent, and 47 percent in Iringa, Mbeya, and Kagera, respectively, and are the
second biggest contributor to the total unit cost.
Average unit costs for non-campaign sites in Tanzania
As we see above in Table 6, the unit costs for Tanzania are derived by averaging the unit costs of the
three regions (weighted according to number of VMMC performed). The average unit cost is estimated at
$45.38 for non-campaign sites in Tanzania.
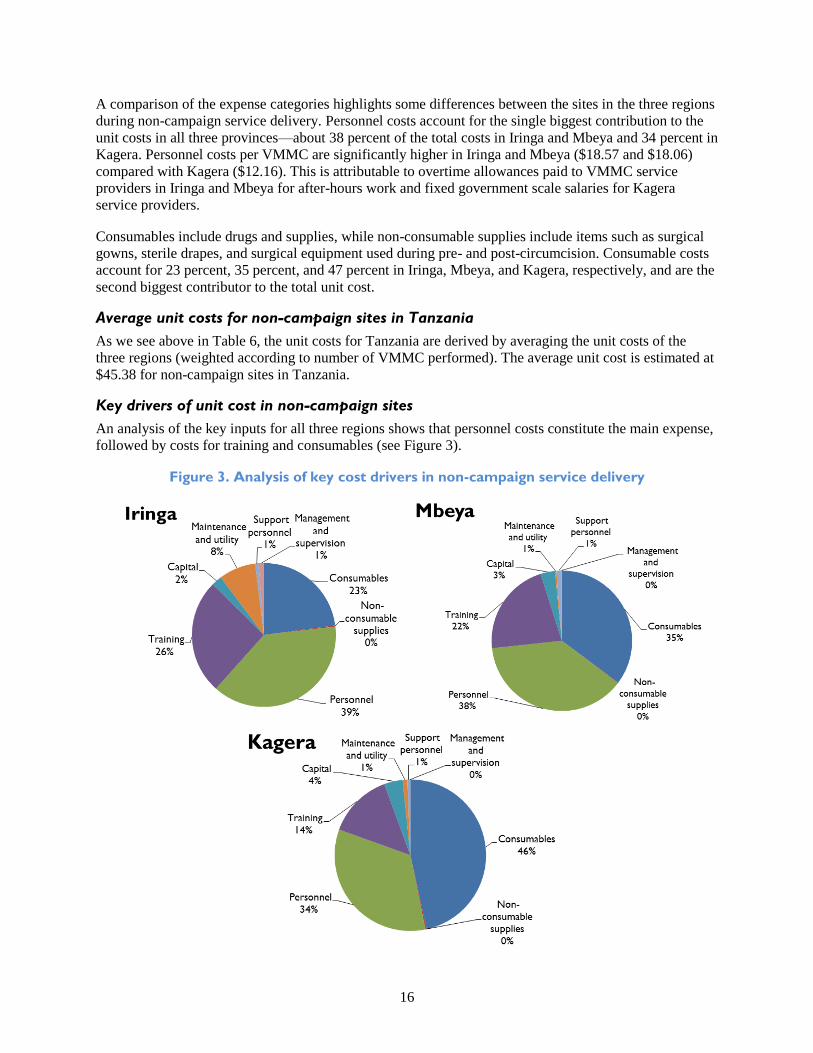
Key drivers of unit cost in non-campaign sites
An analysis of the key inputs for all three regions shows that personnel costs constitute the main expense,
followed by costs for training and consumables (see Figure 3).
Figure 3. Analysis of key cost drivers in non-campaign service delivery
17
There is a substantial difference in maintenance and utility costs among the three regions. These costs are
relatively higher in Iringa ($3.99) than in Mbeya and Kagera ($0.16 and $0.36, respectively) (see Table
6). Thus, indirect costs are divided between the total numbers of health clients. It is worth noting that
capital equipment costs are relatively small for all three provinces, as these are annualized over their
useful lives and are spread over the total number of VMMC.
Although the protocol was modified to include the collection of information on waste management, this
information was not available at the sites or in the MSD and thus was excluded from the calculation of
unit costs. The costs of supply chain management and logistics are included in the individual cost of
commodities and supplies, as obtained from the implementing partners.
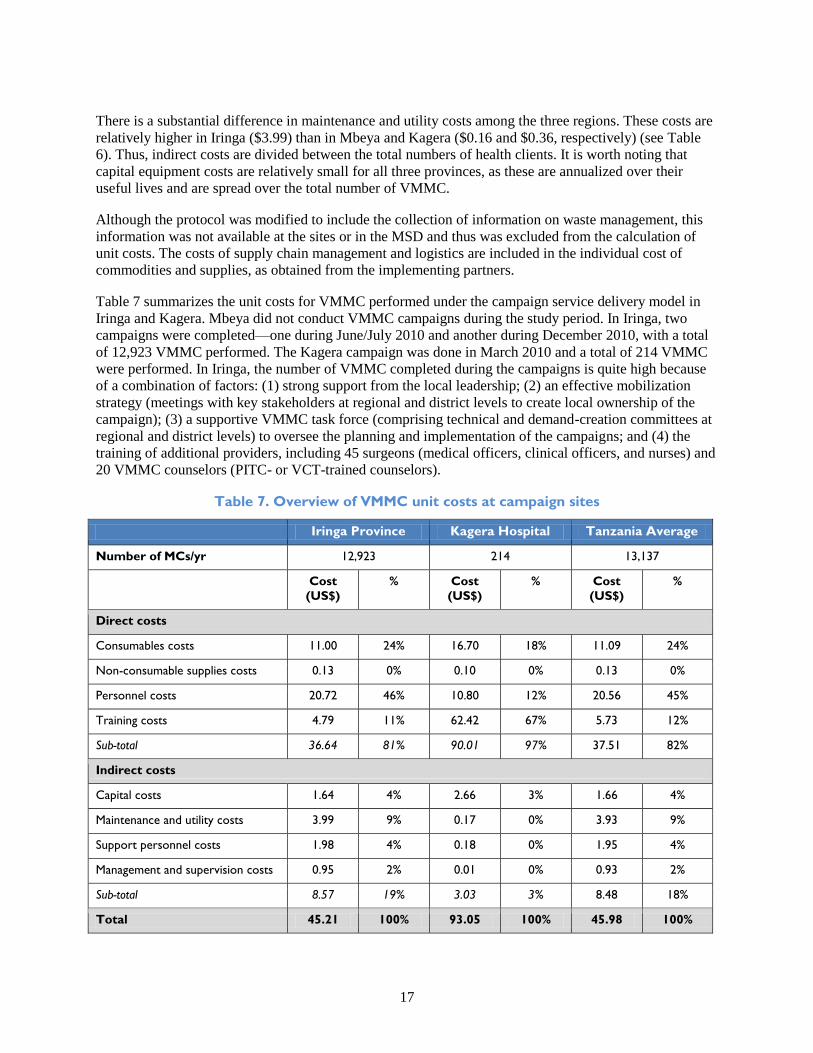
Table 7 summarizes the unit costs for VMMC performed under the campaign service delivery model in
Iringa and Kagera. Mbeya did not conduct VMMC campaigns during the study period. In Iringa, two
campaigns were completed—one during June/July 2010 and another during December 2010, with a total
of 12,923 VMMC performed. The Kagera campaign was done in March 2010 and a total of 214 VMMC
were performed. In Iringa, the number of VMMC completed during the campaigns is quite high because
of a combination of factors: (1) strong support from the local leadership; (2) an effective mobilization
strategy (meetings with key stakeholders at regional and district levels to create local ownership of the
campaign); (3) a supportive VMMC task force (comprising technical and demand-creation committees at
regional and district levels) to oversee the planning and implementation of the campaigns; and (4) the
training of additional providers, including 45 surgeons (medical officers, clinical officers, and nurses) and
20 VMMC counselors (PITC- or VCT-trained counselors).
Table 7. Overview of VMMC unit costs at campaign sites
Iringa Province Kagera Hospital Tanzania Average
Number of MCs/yr 12,923 214 13,137
Cost
(US$)
% Cost
(US$)
% Cost
(US$)
%
Direct costs
Consumables costs 11.00 24% 16.70 18% 11.09 24%
Non-consumable supplies costs 0.13 0% 0.10 0% 0.13 0%
Personnel costs 20.72 46% 10.80 12% 20.56 45%
Training costs 4.79 11% 62.42 67% 5.73 12%
Sub-total 36.64 81% 90.01 97% 37.51 82%
Indirect costs
Capital costs 1.64 4% 2.66 3% 1.66 4%
Maintenance and utility costs 3.99 9% 0.17 0% 3.93 9%
Support personnel costs 1.98 4% 0.18 0% 1.95 4%
Management and supervision costs 0.95 2% 0.01 0% 0.93 2%
Sub-total 8.57 19% 3.03 3% 8.48 18%
Total 45.21 100% 93.05 100% 45.98 100%
18
The weighted average cost per VMMC performed was $45.21 in Iringa and $93.05 in Kagera. Personnel
costs account for the largest share (46%) of the unit cost in Iringa, while training costs account for the
largest expense (67%) in Kagera. The high cost of personnel in Iringa is largely attributable to the
overtime paid to VMMC providers and the large number of VMMC personnel involved in service
provision during the campaign period. The high unit cost in Kagera is mainly attributable to the cost
being spread over a small number of VMMC performed during the campaign period (only 214
circumcisions were performed at Kagera Hospital). In Kagera, the training costs are also high because a
large number of VMMC staff underwent the training relative to the actual number of VMMC performed
during the campaign period. For instance, a total 24 VMMCs providers (3 doctors, 13 nurses, and 8
counselors) were trained on VMMC service provision at a cost of $13,357.
Overall, direct costs account for 81 percent and 97 percent of the total cost per VMMC performed in
Iringa and Kagera, respectively. The indirect costs, which include capital costs, account for 8.6 percent of
total costs in Iringa and 3 percent of the total costs in Kagera. During the campaign, all the VMMC were
performed in non-campaign facilities. The main difference between the non-campaign service delivery
and campaign sites is that VMMC facilities were outfitted with between four and six bays to handle a
higher volume of clients in the campaign sites.
Maintenance and utility costs account for about 4 percent in Iringa and less than 1 percent in Kagera.
Maintenance costs include expenses for renovating new sites for VMMC provision, as well as emergency
vehicle maintenance. Utilities included fuel consumption, transport costs, and electricity costs. In Kagera,
the costs are lower because the share of VMMC to the facility workload was quite small due to the small
number of VMMC performed in March 2010.
It is interesting to note that capital equipment costs contribute relatively little to the unit costs (1% in the
non-campaign model) these costs were annualized over their useful lives and, in turn, were spread over a
relatively high number of VMMCs.
Average unit costs at campaign sites in Tanzania
The overall unit cost for campaign sites in Tanzania is derived by taking the weighted average of the unit
costs for the two regions, with weighting determined by the number of VMMCs performed). The average
unit cost is estimated at $45.98 for all campaign sites in Tanzania, as shown in Table 7, above.
Key drivers of unit cost for campaign sites
An analysis of the key inputs for the two regions shows that unlike the non-campaign service delivery
models, personnel costs are not consistently the main expense in the campaign service delivery model. At
the sites in Kagera, training costs account for the biggest expense. Consumables also feature as one of the
highest expenses (see Figure 4).
Table 8 provides a snapshot of the key drivers of unit costs in both non-campaign and campaign sites.

19
Figure 4. Key cost drivers in the campaign model
Table 8. Snapshot—key drivers of unit costs
Fixed Sites
Non-Campaign Campaign
Personnel costs (39%, Iringa, Mbeya) Personnel costs (46% Iringa)
Consumables (46% Kagera) Training costs (67% Kagera)

20
3.2. Cost per VMMC Performed at Island Outreach Sites (Goziba
Islands in Kagera Region)
We calculated the costs of performing VMMC in island outreach sites separately, as the costs to reach
island sites (unique to Kagera Province) are significantly higher than non-campaign or campaign sites.
For example, the costs of the programs on Goziba Island included boat rentals, which were required to
reach individuals on these islands.
Table 9 presents the breakdown of direct and indirect costs for VMMC provision in the Goziba Islands in
Lake Victoria. These are hard to reach and there are no health facilities on the islands. Staff is drawn from
the Kagera Regional Hospital provide VMMC services. The islands are only reachable by boat, and once
there, the staff performs VMMC in tents specifically procured for VMMC services. The unit cost per
VMMC was found to be high at $128.60. This is attributable to high indirect costs, which account for the
largest share of the unit cost (64%).
Table 9. VMMC unit costs for island outreach service delivery—Goziba Islands in Kagera
Number of MCs Performed 415
Direct costs % of total unit cost
Consumables costs 16.87 13%
Non-consumable supplies costs 0.10 0%
Personnel costs 14.80 12%
Training costs 14.28 11%
Subtotal 46.05 36%
Indirect costs % of total unit cost
Capital costs 39.74 31%
Maintenance and utility costs 38.38 30%
Support personnel costs 4.32 3%
Management and supervision costs 0.11 0%
Subtotal 82.55 64%
TOTAL 128.60 100%
Overall, the cost per VMMC is high at $128.60 relative to the costs for non-campaign (both during
campaign and outside of campaign). This is largely due to the following:
1. The high cost of tents procured specifically for VMMC services in the islands. The large tent,
fully equipped with VMMC bays and other inputs used in performing VMMC, costs $40,000
each. A smaller tent is slightly cheaper at about $20,000 per tent.

21
2. The number of VMMC performed is relatively small, thus, costs are spread over a smaller
number of procedures. We assume that the unit cost will go down as VMMC is offered to more
men.
3. Maintenance and utilities costs are high because of the cost of hiring two boats: one for the
transportation of drugs and supplies and another for staff.
3.3. Impact of Scaling Up Voluntary Medical Male Circumcision in
Tanzania
Model assumptions
The following key assumptions were used in the impact model. For a detailed description of these
assumptions, see Appendix 1.
HIV prevalence rates and epidemiological assumptions
Trends in HIV prevalence in Tanzania were obtained from Spectrum data, which were last updated in
March 2010. Further details on HIV prevalence by gender and age group were derived from the Tanzania
AIDS and Malaria Indicator Survey 2007–2008.
By modeling historical data on HIV prevalence from the onset of the HIV epidemic in 1985, the DMPPT
is able to project prevalence estimates up to 2015. The data show that the estimated HIV prevalence rate
rose steadily, peaking at 6.83 percent in 1997, and then declined to 4.53 percent in 2010. It is projected to
decline further to 3.73 percent by 2015.
Effectiveness
Effectiveness is defined as the number of HIV infections averted. The model assumes a 60 percent
reduction in risk of infection for a circumcised man engaging in unprotected sex with an HIV-positive
woman. The model also assumes that circumcision is not effective in reducing male-to-female
transmission and that it would not cause an increase in risk compensation (increased risk taking as a result
of being circumcised).12
Although circumcision offers direct benefits to only circumcised men, women
and uncircumcised men accrue indirect benefits (Kahn et al., 2006; Auvert et al., 2005; Hallett et al.,
2008; Williams et al., 2006; and Njeuhmeli et al, 2011) since HIV prevalence will decline eventually, thus
reducing risk of infection for both men and women.
Economics
The DMPPT discounts all costs and benefits of male circumcision and uses a discount rate of 3 percent
per annum. Therefore, the discounted costs and benefits do not represent the actual cash flow in each
period but rather a measure of economic value. To calculate the discounted benefit of an infection
averted, a discounted lifetime cost of antiretroviral therapy was assumed to be $7,400.
The model also estimated an annual demand-creation cost of $862,917 per annum. This amount is based
on a budget analysis prepared by MOHSW/NACP for the eight regions earmarked for VMMC scale-up in
Tanzania. While some service providers have actual expenditures on demand creation in the regions they
support, information on planned expenditures based on populations to be reached and regional differences
on a yearly basis are hard to come by (e.g., would costs for demand creation need to increase or decrease
12 DMPPT allows the user to analyze various assumptions about risk compensation. As an initial assumption, it was assumed that
there would not be any increased risk taking behavior as a result of male circumcision.
22
over time). The model therefore assumes that the demand-creation cost shown above would be evenly
spent over five years.
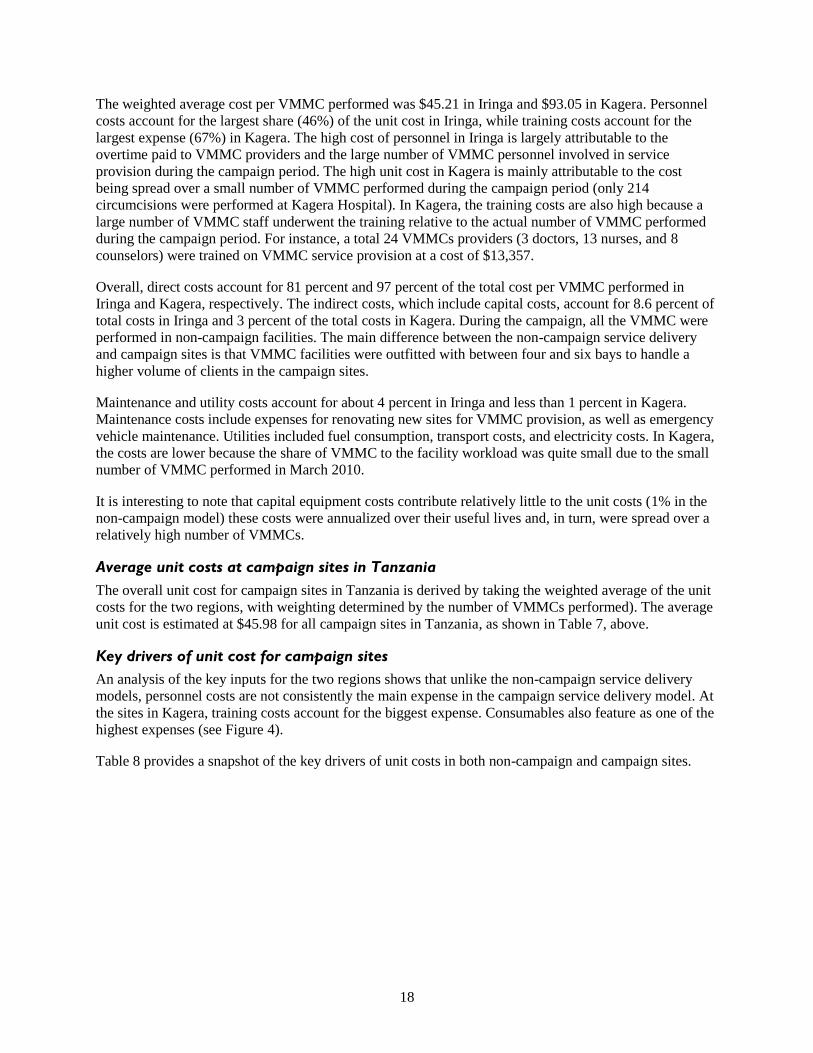
3.4. Total Number of Male Circumcisions
Figure 5 and Table 10 present the number of circumcisions that would need to be performed to scale-up
coverage of VMMC to 87.1 percent of HIV-negative males between ages 15 and 49 by 2015. It shows the
number of circumcisions performed each year for the base scenario, where the current rate of
circumcision prevalence (66.8%) is increased to reach the target of 87.1 percent of males between the
ages of 15 and 49 by 2015. This trajectory results in a large increase in the number of circumcisions
required per year in the short term, rising from 410,000 in 2010 and peaking at almost 1.3 million
circumcisions in 2013 and dropping to about 480,000 circumcisions annually from 2016 to 2030 (see
Table 10).
Figure 5. Number of VMMCs performed to achieve 87.1% coverage
0
200
400
600
800
1,000
1,200
1,400
2005
2006
2007
2008
2009
2010
2011
2012
2013
2014
2015
2016
2017
2018
2019
2020
2021
2022
2023
2024
2025
Th
ou
san
ds
Baseline
MC Projection
Table 10. Number of circumcisions at 87.1% coverage
Year
Base
Projection
MC
Projection Difference Year
Base
Projection
MC
Projection Difference
2010 368,798 410,262 41,464 2019 369,782 478,292 108,510
2011 368,907 604,345 235,438 2020 369,891 478,493 108,602
2012 369,016 1,260,918 891,902 2021 370,001 478,703 108,702
2013 369,126 1,302,771 933,646 2022 370,110 478,912 108,802
2014 369,235 698,381 329,146 2023 370,220 479,123 108,903
2015 369,344 511,396 142,052 2024 370,329 479,333 109,003
2016 369,453 482,331 112,877 2025 370,439 479,508 109,069
2017 369,563 478,493 108,931 2010–
2015 2,214,426 4,788,073 2,573,648
2018 369,672 478,154 108,482 2016–
2025 3,699,459 4,791,342 1,091,883

23
Figure 6 illustrates Tanzania’s progress to date, relative to the number of VMMC required to achieve its
target. In 2011, the actual number of circumcisions was only 40 percent of the national target. In 2012, it
is projected that Tanzania will need to circumcise close to one million males, which represents a ten-fold
increase from what was achieved in 2011.
Figure 6. Comparison of progress toward achieving targets—Tanzania
0
200
400
600
800
1,000
1,200
2010 2011 2012
Th
ou
san
ds
VMMC Performed
VMMC Required
3.5. Impact of VMMC Scale-Up on HIV Infection
Figure 7 and Table 11 show the projected impact of VMMC scale-up on the number of new adult HIV
infections. Scaling up adult VMMC to reach 87.1 percent coverage by 2015 would result in averting
almost 28,000 new HIV infections through 2015. The results also indicate that the annual number of new
infections in the 87.1 percent scale-up scenario declines from 84,000 in 2010 to 64,000 by 2025. Overall,
between 2010 and 2025, a cumulative total of about 196,560 HIV infections, or 14.5 percent of total new
HIV infections, are averted as a result of the VMMC scale-up. HIV infections decline marginally from
2010–2013, and thereafter, the pace of reduction is faster, illustrating the long-term positive effect of
scaling up VMMC. With no VMMC scale-up, the annual number of new infections will rise from 83,742
in 2010 to 85,532 by 2025.
Figure 7. Number of new adult HIV infections (87.1% coverage)
0
10
20
30
40
50
60
70
80
90
2009 2011 2013 2015 2017 2019 2021 2023 2025
Th
ou
san
ds
Baseline
MC Projection
24
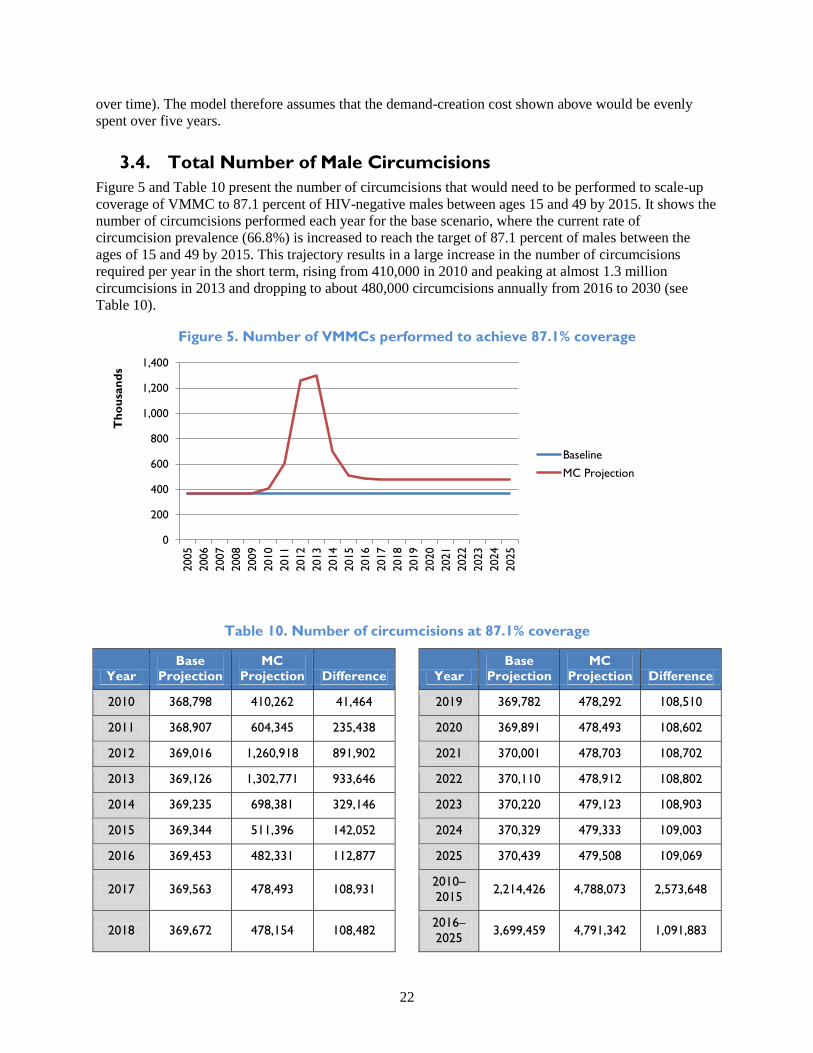
Table 11. Number of infections and infections averted (87.1% coverage)
2010 2011 2012 2013 2014 2015 2016 2017
Base 83,742 83,807 83,913 84,070 84,272 84,508 84,758 85,001
MC scale-up 83,685 83,328 81,604 78,283 75,529 74,194 73,248 72,314
Infections averted 57 479 2,309 5,786 8,743 10,314 11,510 12,687
2018 2019 2020 2021 2022 2023 2024 2025
Base 85,215 85,384 85,498 85,551 85,548 85,533 85,528 85,532
MC scale-up 71,320 70,251 69,113 67,923 66,707 65,522 64,403 63,875
Infections averted 13,895 15,133 16,385 17,628 18,841 20,011 21,124 21,657
3.6. Impact of VMMC Scale-Up on Annual AIDS-Related Deaths
Figure 8 shows the projected impact of scaling up VMMC to 87.1 percent on the annual cumulative
number of AIDS-related deaths. The results indicate that male circumcision could avert almost 24,000
deaths between 2010 and 2025. The reductions in annual deaths with no VMMC scale-up are far fewer. In
both cases, the projected impact of VMMC on AIDS-related deaths is small until 2013. Thus, the
intervention may not lead to fewer AIDS-related deaths in the short term, but in the longer term, a
reduction of comparable magnitude is achieved.
Figure 8. Annual number of AIDS-related deaths
60
62
64
66
68
70
72
74
76
78
80
2009
2010
2011
2012
2013
2014
2015
2016
2017
2018
2019
2020
2021
2022
2023
2024
2025
Th
ou
san
ds
No Scale-Up
MC Scale-Up
The HIV prevalence with VMMC scale-up decreases from 3.92 percent in 2010 to 3.11 percent by 2025.
The prevalence among men drops from 3.3 percent (no VMMC scale-up) to 2.58 percent (87.1% scale-
up). There is also significant reduction in the prevalence among women as a result of male circumcision.
Female prevalence for HIV is projected to decrease from 4.53 percent in 2010 to 3.64 percent in 2025
with 87.1 percent scale-up.

25
3.7. Impact on the Rate of New HIV Infections by Age and Sex
Figure 9 and Table 12 show the projected impact of VMMC scale-up on the number of new infections
among women and men. The cumulative impact on both males and females of VMMC scale-up from
2010 to 2025 is shown in the age groups 15 to 49 for both men and women. With VMMC scale-up, the
number of new HIV infections for men ages 15 to 49 years is expected to drop by almost half from
38,233 in 2010 to 28,983 in 2025. With no scale-up, the number of infections for men ages 15 to 49 years
is expected to rise from 38,233 in 2010 to 40,727. The number of new HIV infections for women during
the same time period is expected to decrease from about 45,452 in 2010 to 34,892 in 2025 with VMMC
scale-up. It is evident from these results that VMMC scale-up is projected to significantly reduce new
infections.
Although there are currently no known direct benefits of VMMC for women, available data suggest that
there are important indirect health benefits, particularly a reduced risk of exposure to HIV and other
sexually transmitted infections through the reduction in HIV infection among men. Lower HIV incidence
due to high prevalence of male circumcision means that the likelihood of women encountering an HIV-
positive male sexual partner will gradually decline. Therefore, scaling up the VMMC program in
Tanzania could result in significant gains for HIV prevention for both men (directly) and women
(indirectly).
Figure 9. New adult HIV infections averted by age and sex
0
5
10
15
20
25
30
35
40
45
50
2009
2010
2011
2012
2013
2014
2015
2016
2017
2018
2019
2020
2021
2022
2023
2024
2025
Th
ou
san
ds
Male 15–49 (No Scale-Up)
Male 15–49 (MC Scale-Up)
Female 15–49 (No Scale-Up)
Female 15–49 (MC Scale-Up)
Table 12. New adult HIV infections averted by age and sex (in thousands)
Male 15–49
(No Scale-Up)
Male 15–49
(MC Scale-Up)
Female 15–49
(No Scale-Up)
Female 15–49
(MC Scale-Up)
2009 37,726 37,726 45,968 45,968
2010 38,289 38,233 45,453 45,452
2011 38,755 38,293 45,052 45,035
2012 39,105 36,918 44,809 44,686
2013 39,344 34,094 44,726 44,190
2014 39,492 32,065 44,780 43,465

26
Male 15–49
(No Scale-Up)
Male 15–49
(MC Scale-Up)
Female 15–49
(No Scale-Up)
Female 15–49
(MC Scale-Up)
2015 39,580 31,517 44,928 42,677
2016 39,640 31,335 45,118 41,913
2017 39,699 31,161 45,302 41,153
2018 39,779 30,954 45,436 40,366
2019 39,888 30,719 45,496 39,532
2020 40,028 30,459 45,470 38,653
2021 40,187 30,176 45,364 37,747
2022 40,352 29,866 45,196 36,842
2023 40,512 29,529 45,021 35,994
2024 40,660 29,169 44,868 35,234
2025 40,727 28,983 44,805 34,892
3.8. Impact of Male Circumcision on Incidence of HIV Infection
Available data from randomized controlled trials indicate that male circumcision has the potential to
reduce HIV incidence for women and uncircumcised men, as well as for those circumcised (Hallett et al.,
2008; Njeuhmeli et al, 2011). When VMMC is scaled up, the incidence of HIV will drop from 0.39
percent in 2010 to 0.26 percent in 2025. Without VMMC scale-up, HIV incidence will decrease
marginally from 0.39 percent in 2010 to 0.35 (see Figure 10 and Table 13). These results clearly show
that higher VMMC prevalence has the potential to significantly lower HIV incidence and provide a cost-
effective prevention strategy.
Figure 10. Adult incidence of HIV
0.00%
0.05%
0.10%
0.15%
0.20%
0.25%
0.30%
0.35%
0.40%
0.45%
2009
2010
2011
2012
2013
2014
2015
2016
2017
2018
2019
2020
2021
2022
2023
2024
2025
Baseline Projection
MC Projection
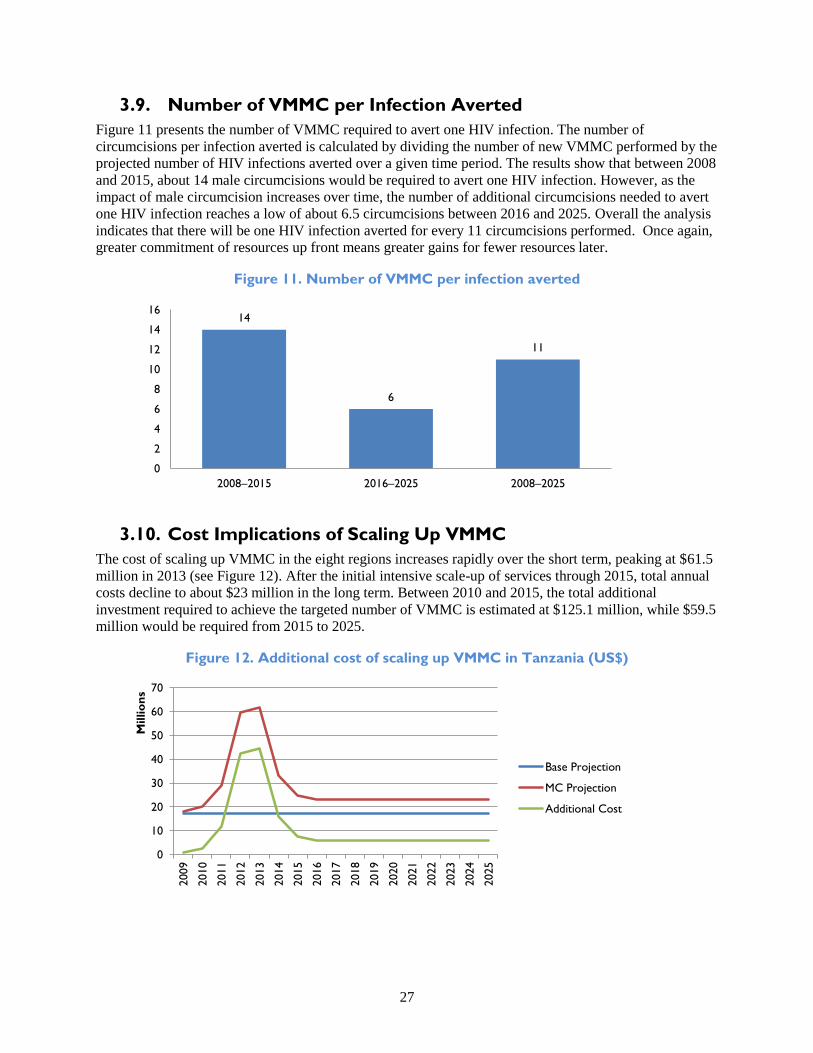
27
3.9. Number of VMMC per Infection Averted
Figure 11 presents the number of VMMC required to avert one HIV infection. The number of
circumcisions per infection averted is calculated by dividing the number of new VMMC performed by the
projected number of HIV infections averted over a given time period. The results show that between 2008
and 2015, about 14 male circumcisions would be required to avert one HIV infection. However, as the
impact of male circumcision increases over time, the number of additional circumcisions needed to avert
one HIV infection reaches a low of about 6.5 circumcisions between 2016 and 2025. Overall the analysis
indicates that there will be one HIV infection averted for every 11 circumcisions performed. Once again,
greater commitment of resources up front means greater gains for fewer resources later.
Figure 11. Number of VMMC per infection averted
14
6
11
0
2
4
6
8
10
12
14
16
2008–2015 2016–2025 2008–2025
3.10. Cost Implications of Scaling Up VMMC
The cost of scaling up VMMC in the eight regions increases rapidly over the short term, peaking at $61.5
million in 2013 (see Figure 12). After the initial intensive scale-up of services through 2015, total annual
costs decline to about $23 million in the long term. Between 2010 and 2015, the total additional
investment required to achieve the targeted number of VMMC is estimated at $125.1 million, while $59.5
million would be required from 2015 to 2025.
Figure 12. Additional cost of scaling up VMMC in Tanzania (US$)
0
10
20
30
40
50
60
70
2009
2010
2011
2012
2013
2014
2015
2016
2017
2018
2019
2020
2021
2022
2023
2024
2025
Millio
ns
Base Projection
MC Projection
Additional Cost

28
3.11. Regional Analysis—Cost Implications of Scaling Up VMMC
Scaling up adult VMMC to reach 80 percent of men between ages 15 and 49 in regions where current
coverage is less than 80 percent (pushing the overall national coverage to 87.1 percent coverage by
2015)13
would necessitate around 2.8 million VMMCs at an additional cost of $134 million through
202514
(see Table 14).
Table 14. Regional targets and additional cost of scaling up VMMC
Target
VMMC
2010–2015
Target
VMMC
2016–2025
Total target
VMMC
Cost to
reach target
2010–2015
Cost to
reach target
2016–2025
Total Costs
to reach
targets
Iringa 178,899 73,113 252,012 8,339,286 8,339,286 16,678,571
Kagera 351,707 142,752 494,459 16,394,628 6,654,300 23,048,928
Mbeya 287,424 116,774 404,198 13,398,116 5,443,350 18,841,466
Mara 26,105 8,461 34,566 1,216,848 394,410 1,611,258
Mwanza 252,338 99,875 352,213 11,762,602 4,655,631 16,418,233
Rukwa 183,036 83,812 266,848 8,532,124 3,452,290 11,984,414
Shinyanga 481,163 195,934 677,097 22,429,147 9,133,370 31,562,517
Tabora 207,218 84,980 292,198 9,659,354 3,961,294 13,620,648
Total 2,773,592 $133,766,035
3.12. Net Cost Savings and Cumulative Net Cost Savings per Adult
HIV Infection Averted
The discounted net costs per adult HIV infection averted are the cumulative net costs of the scaled-up
VMMC program, divided by the cumulative number of adult HIV infections averted over the relevant
timeframe (both of which are discounted). In addition, net cost savings is the difference between the
benefits of averting an HIV infection (the discounted lifetime ARV treatment costs avoided) and the costs
(resources required to perform enough circumcisions to avert an HIV infection).
The discounted cost of averting an HIV infection for the time period 2010–2015 is $4,700, while
discounting the costs over the entire period of 2010–2025 results in a much lower discounted cost of
$1,100 per HIV infection averted. The net discounted savings for the period 2010–2015 amounts to
$2,700, while the total discounted savings from 2010–2025 are much higher at $6,300. Thus, net savings
associated with preventing an HIV infection through VMMC are quite substantial, while the financial cost
of averting an HIV infection is small when compared to the financial benefit.
13 The national coverage estimate of 87.1% is based on estimates that the 8 targeted regions would reach an 80% coverage level
and the 13 non-targeted regions would retain their current levels of coverage.
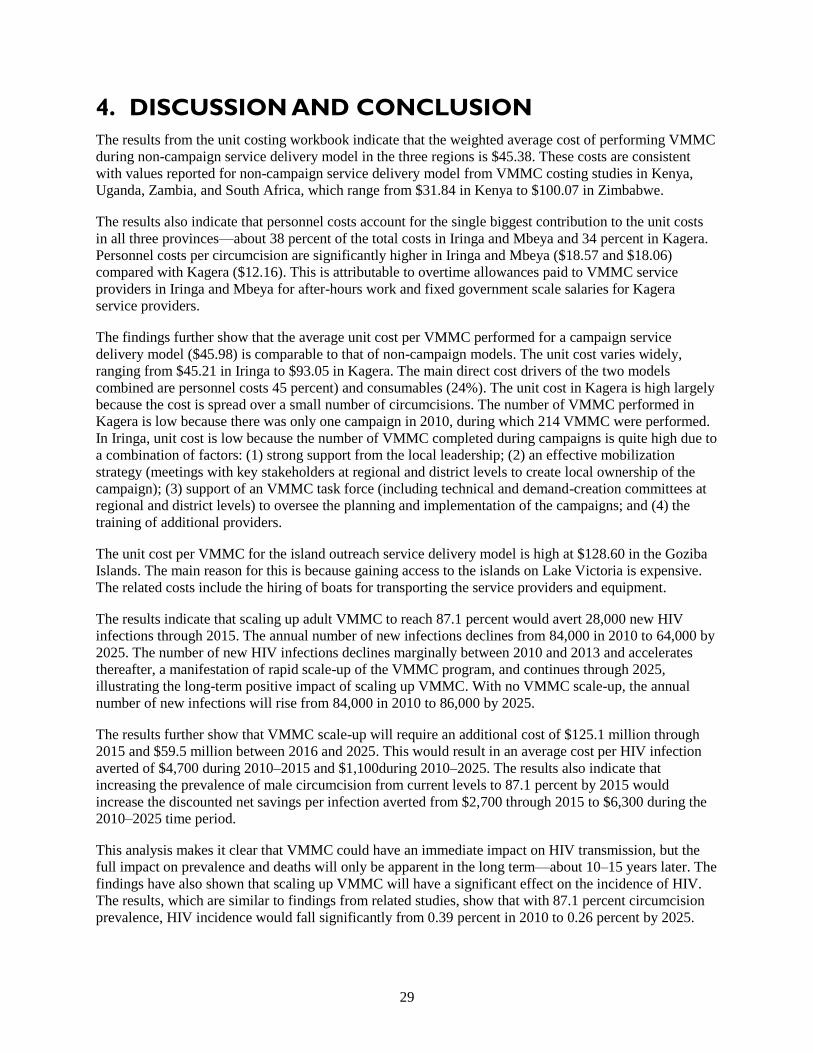
29
4. DISCUSSION AND CONCLUSION
The results from the unit costing workbook indicate that the weighted average cost of performing VMMC
during non-campaign service delivery model in the three regions is $45.38. These costs are consistent
with values reported for non-campaign service delivery model from VMMC costing studies in Kenya,
Uganda, Zambia, and South Africa, which range from $31.84 in Kenya to $100.07 in Zimbabwe.
The results also indicate that personnel costs account for the single biggest contribution to the unit costs
in all three provinces—about 38 percent of the total costs in Iringa and Mbeya and 34 percent in Kagera.
Personnel costs per circumcision are significantly higher in Iringa and Mbeya ($18.57 and $18.06)
compared with Kagera ($12.16). This is attributable to overtime allowances paid to VMMC service
providers in Iringa and Mbeya for after-hours work and fixed government scale salaries for Kagera
service providers.
The findings further show that the average unit cost per VMMC performed for a campaign service
delivery model ($45.98) is comparable to that of non-campaign models. The unit cost varies widely,
ranging from $45.21 in Iringa to $93.05 in Kagera. The main direct cost drivers of the two models
combined are personnel costs 45 percent) and consumables (24%). The unit cost in Kagera is high largely
because the cost is spread over a small number of circumcisions. The number of VMMC performed in
Kagera is low because there was only one campaign in 2010, during which 214 VMMC were performed.
In Iringa, unit cost is low because the number of VMMC completed during campaigns is quite high due to
a combination of factors: (1) strong support from the local leadership; (2) an effective mobilization
strategy (meetings with key stakeholders at regional and district levels to create local ownership of the
campaign); (3) support of an VMMC task force (including technical and demand-creation committees at
regional and district levels) to oversee the planning and implementation of the campaigns; and (4) the
training of additional providers.
The unit cost per VMMC for the island outreach service delivery model is high at $128.60 in the Goziba
Islands. The main reason for this is because gaining access to the islands on Lake Victoria is expensive.
The related costs include the hiring of boats for transporting the service providers and equipment.
The results indicate that scaling up adult VMMC to reach 87.1 percent would avert 28,000 new HIV
infections through 2015. The annual number of new infections declines from 84,000 in 2010 to 64,000 by
2025. The number of new HIV infections declines marginally between 2010 and 2013 and accelerates
thereafter, a manifestation of rapid scale-up of the VMMC program, and continues through 2025,
illustrating the long-term positive impact of scaling up VMMC. With no VMMC scale-up, the annual
number of new infections will rise from 84,000 in 2010 to 86,000 by 2025.
The results further show that VMMC scale-up will require an additional cost of $125.1 million through
2015 and $59.5 million between 2016 and 2025. This would result in an average cost per HIV infection
averted of $4,700 during 2010–2015 and $1,100during 2010–2025. The results also indicate that
increasing the prevalence of male circumcision from current levels to 87.1 percent by 2015 would
increase the discounted net savings per infection averted from $2,700 through 2015 to $6,300 during the
2010–2025 time period.
This analysis makes it clear that VMMC could have an immediate impact on HIV transmission, but the
full impact on prevalence and deaths will only be apparent in the long term—about 10–15 years later. The
findings have also shown that scaling up VMMC will have a significant effect on the incidence of HIV.
The results, which are similar to findings from related studies, show that with 87.1 percent circumcision
prevalence, HIV incidence would fall significantly from 0.39 percent in 2010 to 0.26 percent by 2025.

30
While the results indicate that scaling up VMMC coverage to 87.1 percent by 2015 would significantly
reduce the number of new HIV infections, this would require increasing the annual number of
circumcision procedures to about 1.3 million in 2013 before leveling off to about 480,000 after 2015.
In addition, scaling up VMMC to reach the target of 87.1 percent by 2015 requires a rapid increase in the
number of circumcisions performed during 2010–2013. This is largely due to intensified efforts to
provide VMMC services to the existing cohort of uncircumcised men in the country.
4.1. Study Limitations
Some limitations of this study are worth noting:
The unit cost does not include the cost of personnel seconded by implementation partners to
monitor and supervise the implementation of VMMC services and the management costs incurred
by the partners despite overseeing the overall implementation of the VMMC services for the same
reason—these costs are calculated from the perspective of the government as the implementer.
This analysis only considered the impact of VMMC on reducing HIV transmission and the
number of HIV infections averted. It is, however, increasingly being realized that the scaling up
of VMMC offers an opportunity to improve the delivery of male reproductive health services. A
similar analysis of the costs and benefits of VMMC within the context of a comprehensive
package of male reproductive health services might be useful.
In Tanzania, a large proportion of clientele seeking campaign services are 10–24 year olds. As a
result, coverage has been lower among those men over the age of 30. However, the model
assumes constant coverage across all age groups.
The activity targeted males aged 15–49 years as a priority population group for VMMC and
excluded early infant circumcision in the analysis since this program does not exist.
The DMPPT impact model calculated trends in HIV prevalence for the country as a whole and
did not make estimates that were specific to any individual region. This was because the
reliability of prevalence estimates at the regional level was much more uncertain. However, since
the scale-up of circumcision in the country is occurring in targeted regions, the actual impact of
VMMC may be either underestimated or overestimated, depending on the actual trends in
individual regions.
The report uses the global default value for lifetime discounted ART costs ($7,500), because
Tanzania-specific information is lacking. If Tanzania pays less for treatment than this global
default indicates, the financial savings associated with male circumcision would be less due to an
overestimation of treatment costs. Conversely, if the lifetime cost of treatment is higher in
Tanzania than this global value suggests, the savings could be higher than indicated in this paper.
In calculating the unit cost of VMMC, this study did not conduct a time-motion analysis of
human resource use at the facility level. Instead reported labor time required to perform the
surgery was collected from interviews with those performing the operation. Thus, the actual unit
costs could vary from what is calculated here, depending on whether the time estimates were
overestimated or underestimated.
Although the protocol was modified to include the collection of information on waste
management, this information was not available at the sites or in the MSD and thus was excluded
from the calculation of unit costs.

31
As already indicated, this analysis collected unit cost estimates at the health facility level. Thus
this analysis did not include estimates of the costs incurred by patients as they obtain
transportation to the facility and incurred lost labor costs associated with the procedure.
In addition, since this analysis only accounted for expenditures on VMMC, it did not include the
cost or impact of traditional circumcision practices.
The future allocation of circumcisions in campaign, non-campaign and island outreach sites is
uncertain. However, since the unit cost at campaign sites ($45.98) is comparable to that of non-
campaign sites ($45.38), the actual distribution of circumcisions will only minimally affect the
total resources required.
4.2. Recommendations
Based on the findings above, developing a population- and access-based detailed implementation plan for
scale-up of the VMMC program in Tanzania is essential, especially as there are service sites where
demand is high and the wait list is long. In the non-campaign sites, provision of VMMC services is on a
part-time basis. All personnel involved in the provision of services are full-time employees in government
health facilities and work on VMMC service provision for limited hours. If the demand for VMMC
services is to be met within the short-term period (catch-up period lasting 5 years), full time staff
assignment is essential. Staff retention for continuous provision of services is also essential. For instance,
the issue of overtime for staff providing VMMC services beyond their normal working hours needs to be
revisited and, if possible, harmonized in all the regions regardless of the partner supporting VMMC
services. Demand creation is also critical to ensure the success of VMMC. In view of this, there is a need
for the MOHSW/NACP to develop a coherent strategy and implementation plan for demand creation.
Finally, mobilizing resources for VMMC (by MOHSW and development partners) is critical to program
success.

32
APPENDIX 1: AMORTIZATION ASSUMPTIONS FOR
CAPITAL GOODS
# Item Amortization
Period (Years)
Justification Source
1. Diathermy
machine
5 Comparable item—
Examination, surgery
equipment
DMPPT default
2. Diathermy
pencil
5 Comparable item—
Examination, surgery
equipment
DMPPT default
3. Diathermy
plate
5 Comparable item—
Examination, surgery
equipment
DMPPT default
4. Foot pedals 5 Comparable item—
Examination, surgery
equipment
DMPPT default
5. Hand piece 5 Comparable item—
Examination, surgery
equipment
DMPPT default
6. Hand piece
(neutral
electrode)
and or plate
5 Comparable item—
Examination, surgery
equipment
DMPPT default
7. Generator
and
incinerator
10 Comparable country—
Kenya
(Changed model default of 7 years)
WHO CHOICE database
http://www.who.int/choice/costs/prices_t4/
en/index.html
8. AC unit for
surgical
marquees
9.3 Comparable item—AC WHO CHOICE database
http://www.who.int/choice/costs/prices_t1/
en/index.html
9. Refrigerators,
coolers
10 Comparable country—
Kenya
(Changed 7 year default in the model)
WHO CHOICE database
http://www.who.int/choice/costs/prices_t4/
en/index.html
10. Bed blocks 7 Comparable item—Beds DMPPT default
11. Operating
stool
8 Comparable item—
Chairs in Kenya
WHO CHOICE database
http://www.who.int/choice/costs/prices_t4/
en/index.html
12. Operating
table
8 Comparable item—
Chairs in Kenya
WHO CHOICE database
http://www.who.int/choice/costs/prices_t4/
en/index.html
13. Recovery
chair
8 Comparable item—
Chairs in Kenya
WHO CHOICE database
http://www.who.int/choice/costs/prices_t4/
en/index.html

33
# Item Amortization
Period (Years)
Justification Source
14. Wooden
spine board
(instead of
patient
trolley)
8 Comparable item—
Chairs in Kenya
WHO CHOICE database
http://www.who.int/choice/costs/prices_t4/
en/index.html
15. Step ladder 8 Comparable item—
Chairs in Kenya
WHO CHOICE database
http://www.who.int/choice/costs/prices_t4/
en/index.html
16. Trolley
(emergency
crash cart
8 Comparable item—
Chairs in Kenya
WHO CHOICE database
http://www.who.int/choice/costs/prices_t4/
en/index.html
17. Office
furniture
8 Comparable item—
Chairs in Kenya
(Changed model default of 7 years)
WHO CHOICE database
http://www.who.int/choice/costs/prices_t4/
en/index.html
18. Pump,
suction,
mechanical,
twin pump
5 Comparable item—
Examination, surgery
equipment
DMPPT default
19. Stand,
infusion, 2
hooks, on
castors
5 Comparable item—
Examination, surgery
equipment
DMPPT default
20. Penis models 5 Comparable item—
Examination, surgery
equipment
DMPPT default
21. Centrifuge,
automatic
7 Comparable item—
Laboratory equipment
DMPPT default
22. Pressure
cooker
sterilizer
7 Comparable item—
Laboratory equipment
DMPPT default
23. Instrument
brush
5 Comparable item—
Laboratory equipment
DMPPT default
24. Lockable
steel cabinets
10 Comparable item—
cupboards in Kenya
WHO CHOICE database
http://www.who.int/choice/costs/prices_t4/
en/index.html
25. Fire
extinguisher
5 Fire protection
equipment
IRS
http://www.irs.gov/businesses/article/0,,id=1
59973,00.html
26. Standing lamp 10 Comparable item—
Voltage stabilizers
WHO CHOICE database
http://www.who.int/choice/costs/prices_t4/
en/index.html
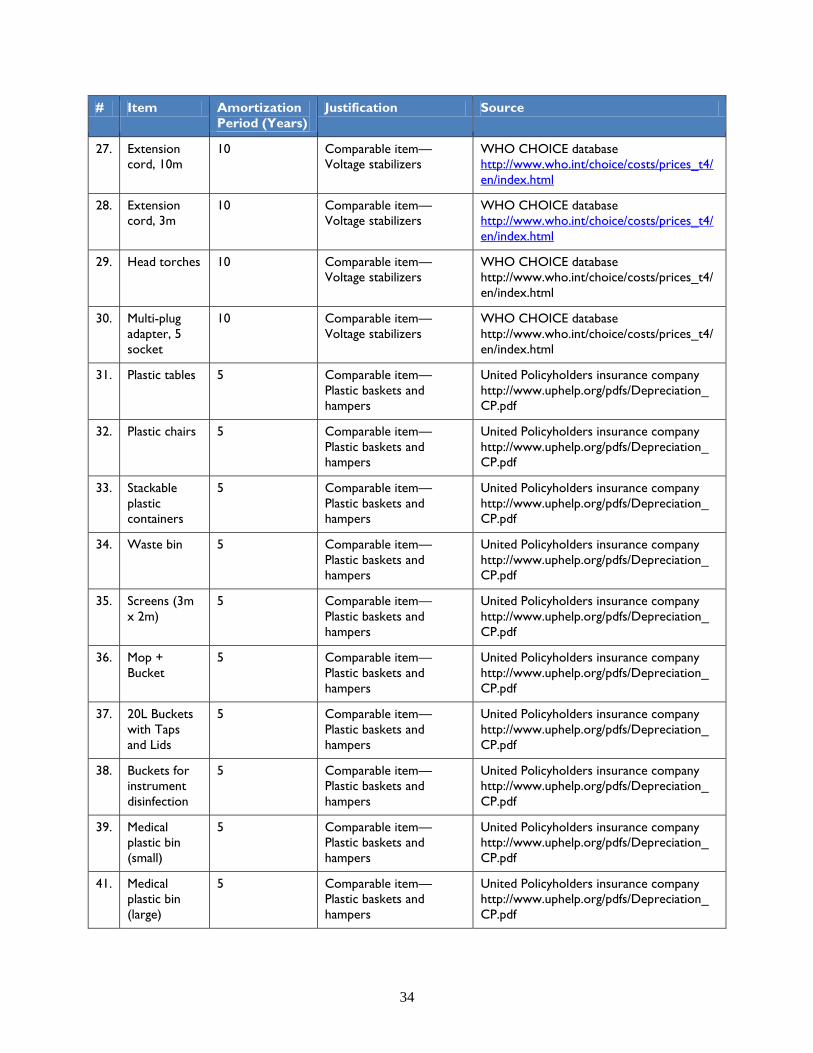
34
# Item Amortization
Period (Years)
Justification Source
27. Extension
cord, 10m
10 Comparable item—
Voltage stabilizers
WHO CHOICE database
http://www.who.int/choice/costs/prices_t4/
en/index.html
28. Extension
cord, 3m
10 Comparable item—
Voltage stabilizers
WHO CHOICE database
http://www.who.int/choice/costs/prices_t4/
en/index.html
29. Head torches 10 Comparable item—
Voltage stabilizers
WHO CHOICE database
http://www.who.int/choice/costs/prices_t4/
en/index.html
30. Multi-plug
adapter, 5
socket
10 Comparable item—
Voltage stabilizers
WHO CHOICE database
http://www.who.int/choice/costs/prices_t4/
en/index.html
31. Plastic tables 5 Comparable item—
Plastic baskets and
hampers
United Policyholders insurance company
http://www.uphelp.org/pdfs/Depreciation_
CP.pdf
32. Plastic chairs 5 Comparable item—
Plastic baskets and
hampers
United Policyholders insurance company
http://www.uphelp.org/pdfs/Depreciation_
CP.pdf
33. Stackable
plastic
containers
5 Comparable item—
Plastic baskets and
hampers
United Policyholders insurance company
http://www.uphelp.org/pdfs/Depreciation_
CP.pdf
34. Waste bin 5 Comparable item—
Plastic baskets and
hampers
United Policyholders insurance company
http://www.uphelp.org/pdfs/Depreciation_
CP.pdf
35. Screens (3m
x 2m)
5 Comparable item—
Plastic baskets and
hampers
United Policyholders insurance company
http://www.uphelp.org/pdfs/Depreciation_
CP.pdf
36. Mop +
Bucket
5 Comparable item—
Plastic baskets and
hampers
United Policyholders insurance company
http://www.uphelp.org/pdfs/Depreciation_
CP.pdf
37. 20L Buckets
with Taps
and Lids
5 Comparable item—
Plastic baskets and
hampers
United Policyholders insurance company
http://www.uphelp.org/pdfs/Depreciation_
CP.pdf
38. Buckets for
instrument
disinfection
5 Comparable item—
Plastic baskets and
hampers
United Policyholders insurance company
http://www.uphelp.org/pdfs/Depreciation_
CP.pdf
39. Medical
plastic bin
(small)
5 Comparable item—
Plastic baskets and
hampers
United Policyholders insurance company
http://www.uphelp.org/pdfs/Depreciation_
CP.pdf
41. Medical
plastic bin
(large)
5 Comparable item—
Plastic baskets and
hampers
United Policyholders insurance company
http://www.uphelp.org/pdfs/Depreciation_
CP.pdf

35
# Item Amortization
Period (Years)
Justification Source
42. Detergent
soap bucket
5 Comparable item—
Plastic baskets and
hampers
United Policyholders insurance company
http://www.uphelp.org/pdfs/Depreciation_
CP.pdf
43. Broom 5 Comparable item—
Plastic baskets and
hampers
United Policyholders insurance company
http://www.uphelp.org/pdfs/Depreciation_
CP.pdf
44. Markers 8 Comparable item—Office
furniture
(Changed model default of 7 years) WHO
CHOICE database
http://www.who.int/choice/costs/prices_t4/
en/index.html
45. Pens 8 Comparable item—Office
furniture
(Changed model default of 7 years)
WHO CHOICE database
http://www.who.int/choice/costs/prices_t4/
en/index.html
46. Tap stand 7 Comparable item—
Other
DMPPT default
47. Water tank 7 Comparable item—
Other
DMPPT default
48. Tents 7 Comparable item—
Other
DMPPT default
49. Vehicles—
4WD
8 Comparable country—
4WD in Kenya
WHO CHOICE database
http://www.who.int/choice/costs/prices_t4/
en/index.html
50. Laryngoscope 5 Comparable item—
Examination, surgery
equipment
DMPPT default
51. Glucometer 5 Comparable item—
Examination, surgery
equipment
DMPPT default
52. BP machine 5 Comparable item—
Examination, surgery
equipment
DMPPT default
53. Safety
box/sharps
box
7 Comparable item—
Laboratory equipment
DMPPT default
54. Ambu bags 5 Comparable item—
Examination, surgery
equipment
DMPPT default

36
APPENDIX 2: ASSUMPTIONS AND LIMITATIONS
# Item Justification Source
Unit cost calculations
1. Commodity prices:
When prices are unavailable for specific facility, use
comparable numbers from other implementers.
Consistency in unit cost calculations. Data collected from facilities
2. Target period for analysis:
Unit cost analysis based on 2010 calendar year data.
Best data available for this period. Implementing partners in
Tanzania (MCHIP, ICAP,
DOD)
3. Three levels of unit cost analysis:
Unit cost calculation is done separately for three modes of
service delivery:
1. VMMC non-campaign
2. VMMC campaigns
3. VMMC island outreach sites
VMMCs performed during campaign were subtracted from
total VMMCs performed at the facility to arrive at the
number of VMMCs done outside of campaigns.
Wide variations in unit costs exist between the two
modes of service delivery.
Number of VMMCs performed during a campaign
period is much higher than outside of campaign. As a
result, campaigns are more cost-effective.
Island—very high expenses for fewer people will skew
costs if included in the campaign; a separate unit cost
analysis is best.
Costing team based on a
review of financial data
4. Annualized data:
For facilities that were operational for only part of the year
in 2010, data were annualized to ease comparison.
(VMMCs performed during campaigns were first subtracted
from the total number to reflect VMMCs done outside of
campaign.)
For all regions:
o Subtracted campaign clients from total VMMCs
o Remainder = number of non-campaign VMMCs
o For example, to annualize 11 months: (∑11
months/11)*12
Data available for:
Iringa:
o Iringa Regional Hospital – 11 Months
o Lugoda – 7 Months
o Ngome – 6 Months
o Mafinga – 6 Months
o Tosamaganga – 6 Months
Mbeya:
o Metta Hospital – 8 months
o Mbeya Referral Hospital – 11 months
o Mbalizi – 11 Months
o Mbeya Regional Hospital – 4 months
MCHIP managed by Jhpiego
(implementer in Iringa)
DOD (implementer in
Mbeya)
ICAP (implementer in
Kagera)
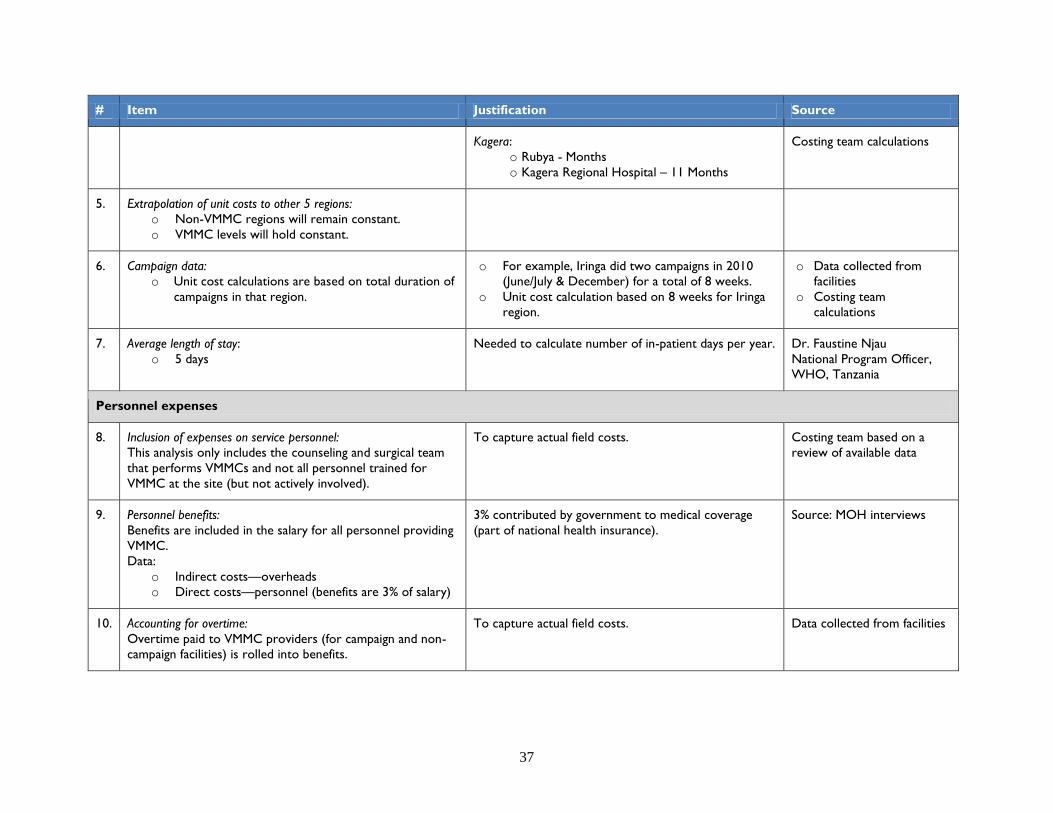
37
# Item Justification Source
Kagera:
o Rubya - Months
o Kagera Regional Hospital – 11 Months
Costing team calculations
5. Extrapolation of unit costs to other 5 regions:
o Non-VMMC regions will remain constant.
o VMMC levels will hold constant.
6. Campaign data:
o Unit cost calculations are based on total duration of
campaigns in that region.
o For example, Iringa did two campaigns in 2010
(June/July & December) for a total of 8 weeks.
o Unit cost calculation based on 8 weeks for Iringa
region.
o Data collected from
facilities
o Costing team
calculations
7. Average length of stay:
o 5 days
Needed to calculate number of in-patient days per year. Dr. Faustine Njau
National Program Officer,
WHO, Tanzania
Personnel expenses
8. Inclusion of expenses on service personnel:
This analysis only includes the counseling and surgical team
that performs VMMCs and not all personnel trained for
VMMC at the site (but not actively involved).
To capture actual field costs. Costing team based on a
review of available data
9. Personnel benefits:
Benefits are included in the salary for all personnel providing
VMMC.
Data:
o Indirect costs—overheads
o Direct costs—personnel (benefits are 3% of salary)
3% contributed by government to medical coverage
(part of national health insurance).
Source: MOH interviews
10. Accounting for overtime:
Overtime paid to VMMC providers (for campaign and non-
campaign facilities) is rolled into benefits.
To capture actual field costs. Data collected from facilities

38
# Item Justification Source
11. Costs of training personnel:
Used one implementer data (MCHIP) for all regions.
MCHIP conducting training for service providers for all
implementers.
MCHIP training expense
sheet
12. In-service training:
Used default assumption in model =10 % of salary of
personnel.
In Tanzania, Ministry pays for in-service training, not
added to salary.
Added to salary in our costing sheet for ease of
calculation.
13. Direct-cost personnel:
Changed personnel time requirements per VMMC
intervention.
Match actual time taken in the field. Data collected from facilities
Other expenses
14. Demand creation costs:
Community mobilization costs and demand-creation costs as
incurred by the implementers are excluded from the unit
cost analysis.
Demand-creation costs are excluded even if the
implementer incurred such expenses in 2010. These
costs are calculated in total for all 8 regions (where
VMMC is currently offered or will be offered). This
total cost is used in the impact model.
Costing team
15. Supply chain costs:
Items directly related to service delivery at a facility (e.g.,
equipment, kits, etc.) are included in the unit cost of
individual commodities.
Costs associated with multiple facilities and maintaining a
supply chain system (e.g., transportation of the kits, quality
control, labor costs, etc.) are calculated separately as a total
for all the facilities.
Unit cost for all items includes all supply chain costs
(i.e., warehousing, quality control, etc.)
Supply chain costs vary with the size of the order.
16. Adverse events data:
Default values for haemorrhage and sepsis are too high for
Tanzania.
Use available data to extrapolate to other facilities.
Data not available in this format for all facilities.
Implementing partners in
Tanzania (JMCHIP, ICAP,
DOD)
Costing team calculations
39
REFERENCES
Auvert, B., D. Taljaard, E. Lagarde, et al. 2005. “Randomized, controlled intervention trial of male
circumcision for reduction of HIV infection risk: The ANRS 1265 trial.” PLoS Medicine 2(11): e298.
Auvert, B., E. Marseille, E.L. Korenromp, et al. 2008. “Estimating the resources needed and savings
anticipated from roll-out of adult male circumcision in sub-Saharan Africa.” PLoS One 3(8): e2679.
Bollinger, L., W.D. Cormier Plosky, and J. Stover. 2009a. Male Circumcision: Decision Makers’
Program Planning Tool, Calculating the Cost and Impacts of a Male Circumcision Program.
Washington, DC: Futures Group, USAID | Health Policy Initiative, Task Order 1, and United Nations
Program on HIV/AIDS.
Bollinger, L.A., J. Stover, G. Musuka, et al. 2009b. “The cost and impact of male circumcision on
HIV/AIDS in Botswana.” J Int AIDS Soc 12:7.
Demographic and Health Survey (Tanzania). 2010.
Demographic and epidemiologic data from Spectrum files using country-specific data from UNAIDS, UN
Population Division.
Hallett, T.B., K. Singh, J.A. Smith, R.G. White, L.J. Abu-Raddad, and G.P. Garnett. 2008.
“Understanding the impact of male circumcision interventions on the spread of HIV in southern Africa.”
PLoS One 3: e2212.
James, G., J.G. Kahn, E. Marseille, and B. Auvert. 2006. “Cost-effectiveness of male circumcision for
HIV prevention in a South African setting.” PLoS Med 3(12): e517.
MOHSW. 2010. National Strategy for Scaling Up male Circumcision for HIV Prevention.
MOHSW. 2009. Situation Analysis for Male Circumcision in Tanzania.
Njeuhmeli, E., S. Forsythe, J. Reed, M. Opuni, L. Bollinger, N. Heard, D. Castor, J. Stover, T. Farley,
V. Menon, and C. Hankins. 2011. Voluntary Medical Male Circumcision: Modeling the Impact and Cost
of Expanding Male Circumcision for HIV Prevention in Eastern and Southern Africa. PloS Med 8(11):
e1001132.
UNAIDS informational website on medical MC. Available at: http://www.malecircumcision.org.
Williams, B.G., J.O. Lloyd-Smith, E. Gouws, C. Hankins, W.M. Getz, et al. 2006. “The potential impact
of male circumcision on HIV in sub-Saharan Africa.” PLoS Med 3(7).
WHO. 2010. Considerations for Implementing Models for Optimizing the Volume and Efficiency of Male
Circumcision Services. Geneva: WHO.
WHO and UNAIDS. 2008. Operational Guidance for Scaling Up Male Circumcision Services for HIV
Prevention. Geneva: WHO.


Health Policy Initiative, Costing Task Order
Futures Group
One Thomas Circle, NW, Suite 200
Washington, DC 20005 USA
Tel: (202) 775-9680
Fax: (202) 775-9694
Email: [email protected]
http://ghiqc.usaid.gov
http://www.healthpolicyinitiative.com