Costing Ready Referencer
23
COSTING READY REFERENCER
-
Upload
raghavendraspai -
Category
Documents
-
view
219 -
download
0
Transcript of Costing Ready Referencer
8/14/2019 Costing Ready Referencer
http://slidepdf.com/reader/full/costing-ready-referencer 1/23
COSTING READY REFERENCER

8/14/2019 Costing Ready Referencer
http://slidepdf.com/reader/full/costing-ready-referencer 2/23
Costing: Ready Reference 2.
Definition of Costing, Cost Accounting and Cost Accountancy:
Costing: The Technique and process of ascertaining costs.
Cost Accounting: The process of accounting for cost which begins with the recording of income and expenditure or the bases onwhich they are calculated and ends with the preparation of periodical statements and reports for ascertaining and controlling costs.
Cost Accountancy: The application of costing and cost accounting principles, methods and techniques to the science, art and
practice of cost control and the ascertainment of profitability of information derived there from for the purpose of managerialdecision making.
CLASSIFICATION OF COSTS:
Manufacturing
We first classify costs according to the three elements of cost:a) Materials b) Labour c) Expenses
Product and Period Costs: We also classify costs as either
1. Product costs: the costs of manufacturing our products; or
2. Period costs: these are the costs other than product costs that are charged to, debited to, or written off to the incomestatement each period.
The classification of Product Costs:
Direct costs: Direct costs are generally seen to be variable costs and they are called direct costs because they are directlyassociated with manufacturing. In turn, the direct costs can include:
• Direct materials: plywood, wooden battens, fabric for the seat and the back, nails, screws, glue.
• Direct labour: sawyers, drillers, assemblers, painters, polishers, upholsterers
• Direct expense: this is a strange cost that many texts don't include; but (International Accounting Standard) IAS 2, forexample, includes it. Direct expenses can include the costs of special designs for one batch, or run, of a particular set of tables and/or chairs, the cost of buying or hiring special machinery to make a limited edition of a set of chairs.
Total direct costs are collectively known as Prime Costs and we can see that Product Costs are the sum of Prime costs andOverheads.
Indirect Costs: Indirect costs are those costs that are incurred in the factory but that cannot be directly associate withmanufacture. Again these costs are classified according to the three elements of cost, materials labour and overheads.
• Indirect materials: Some costs that we have included as direct materials would be included here.
• Indirect labour: Labour costs of people who are only indirectly associated with manufacture: management of a departmentor area, supervisors, cleaners, maintenance and repair technicians
• Indirect expenses: The list in this section could be infinitely long if we were to try to include every possible indirect cost.Essentially, if a cost is a factory cost and it has not been included in any of the other sections, it has to be an indirectexpense. Here are some examples include:
Depreciation of equipment, machinery, vehicles, buildingsElectricity, water, telephone, rent, Council Tax, insurance
Total indirect costs are collectively known as Overheads.
Finally, within Product Costs, we have Conversion Costs: these are the costs incurred in the factory that are incurred in theconversion of materials into finished goods.
The classification of Period Costs:
The scheme shows five sub classifications for Period Costs. When we look at different organisations, we find that they haveperiod costs that might have sub classifications with entirely different names. Unfortunately, this is the nature of the classification of period costs; it can vary so much according to the organisation, the industry and so on. Nevertheless, such a scheme is useful inthat it gives us the basic ideas to work on.
Administration Costs: Literally the costs of running the administrative aspects of an organisation. Administration costs will includesalaries, rent, Council Tax, electricity, water, telephone, depreciation, a potentially infinitely long list. Notice that there are costshere such as rent, Council Tax, that appear in several sub classifications; in such cases, it should be clear that we are paying rent onbuildings, for example, that we use for manufacturing and storage and administration and each area of the business must pay for itsshare of the total cost under review.
Without wishing to overly extend this listing now, we can conclude this discussion by saying that the costs of Selling, thecosts of Distribution and the costs of Research are all accumulated in a similar way to the way in which Administration Costs areaccumulated. Consequently, our task is to look at the selling process and classify the costs of running that process accordingly:advertising, market research, salaries, bonuses, electricity, and so on. The same applies to all other classifications of period coststhat we might use.

8/14/2019 Costing Ready Referencer
http://slidepdf.com/reader/full/costing-ready-referencer 3/23
Costing: Ready Reference 3.
Finance Costs: Finance costs are those costs associated with providing the permanent, long term and short term finance. That is,within the section headed finance costs we will find dividends, interest on long term loans and interest on short term loans.
Finally, we should say that we can add any number of subclassifications to our scheme if we need to do that to clarify theways in which our organisation operates. We will also add further subclassifications if we need to refine and further refine out costanalysis.
COST SHEET – FORMAT
Particulars Amount Amount
Opening Stock of Raw MaterialAdd: Purchase of Raw materialsAdd: Purchase ExpensesLess: Closing stock of Raw Materials
Raw Materials ConsumedDirect Wages (Labour)Direct Charges
*********************
Prime cost (1) ***Add :- Factory Over Heads:
Factory RentFactory PowerIndirect Material
Indirect Wages Supervisor SalaryDrawing Office SalaryFactory InsuranceFactory Asset Depreciation
*********
***************
Works cost Incurred ***Add: Opening Stock of WIPLess: Closing Stock of WIP
******
Works cost (2) ***Add:- Administration Over Heads:-
Office RentAsset DepreciationGeneral ChargesAudit FeesBank Charges
Counting house SalaryOther Office Expenses
***************
******Cost of Production (3) ***Add: Opening stock of Finished GoodsLess: Closing stock of Finished Goods
******
Cost of Goods Sold ***Add:- Selling and Distribution OH:-
Sales man CommissionSales man salaryTraveling ExpensesAdvertisementDelivery man expensesSales TaxBad Debts
*********************
Cost of Sales (5) ***
Profit (balancing figure) ***Sales ***
Notes:-
1) Factory Over Heads are recovered as a percentage of direct wages
2) Administration Over Heads, Selling and Distribution Overheads are recovered as a percentage of works cost.
MATERIAL
1. Reorder level = Maximum usage * Maximum lead time(Or) Minimum level + (Average usage * Average Lead time)
2. Minimum level = Reorder level – (Average usage * Average lead time)
3. Maximum level = Reorder level + Reorder quantity – (Minimum usage * Minimum lead time)
4. Average level = Minimum level +Maximum level / 2 (OR) Minimum level + ½ Reorder quantity
5. Danger level (or) safety stock level =Minimum usage * Minimum lead time (preferred)

8/14/2019 Costing Ready Referencer
http://slidepdf.com/reader/full/costing-ready-referencer 4/23
Costing: Ready Reference 4.
(or) Average usage * Average lead time(or) Average usage * Lead time for emergency purposes
6. EOQ (Economic Order Quantity - Wilson’s Formula) = √2AO / CWhere, A = Annual usage units
O = Ordering cost per unitC = Annual carrying cost of one unit
i.e. Carrying cast % * Carrying cost of unit
7. Associated cost = Buying cost per annum + Carrying cost per annum
8. Under EOQ Buying cost = Carrying cost
9. Carrying Cost = Average inventory * Carrying cost per unit per annum * Carrying cost %(Or) Average Inventory * Carrying cost per order per annum
10. Average inventory = EOQ/2
11. Buying cost = Number of Orders * ordering cost
12. Number of Orders = Annual Demand / EOQ
13. Inventory Turnover (T.O) Ratio = Material consumed / Average Inventory
14. Inventory T.O Period = 365 / Inventory Turn over Ratio
15. Safety stock = (Annual Demand / 365) *(Maximum lead time - Average lead time)
16. Total Inventory cost = Ordering cost + Carrying cost of inventory +Purchase cost
17. Input Output Ratio = Quantity of input of material to production / Standard material content of actualOutput
Remarks :-
i. High Inventory T.O Ratio indicates that the material in the question is fast moving
ii. Low Inventory T.O Ratio indicates over investment and locking up of working capital in inventories
Pricing of material Issues:-
1. Cost price method:-
a. Specific price methodb. First in First Out method (FIFO)
c. Last in First Out method (LIFO)d. Base stock method
2. Average price method:-
a. Simple average price method = Total unit price/ Total No. of purchases.
b. Weighted average price method = Total cost / Total No. of units
c. Periodic simple average price method = Total unit price of certain period / Total Number of purchases of that period (This rate is used for all issues for that period. Period means a month (or) week (or) year)
d. Periodic weighted average price method = Total cost of certain period / Total Number of units of that period
e. Moving simple average price method = Total of periodic simple average of certain number of periods / Number of periods
f. Moving weighted average price method = Total of periodic weighted average of certain number of periods / Number of
periods
3. Market price method:-
a. Replacement price method = Issues are valued as if it was purchased now at current market priceb. Realizable price method = Issues are valued at price if it is sold now
4. Notional price method:-

8/14/2019 Costing Ready Referencer
http://slidepdf.com/reader/full/costing-ready-referencer 5/23
Costing: Ready Reference 5.
a. Standard price method = Materials are priced at pre determined rate (or) Standard rate.
b. Inflated price method = The issue price is inflated to cover the losses incurred due to natural(or)climatic losses
5. Re use price method = When materials are returned (or) rejected it is valued at different price. There is no finalprocedure for this method.
ABC Analysis (or) Pareto Analysis :- In this materials are categorized into
Particulars Quantity Value
“A” – Important material 10% 70% “B” – Neither important nor unimportant 20% 20% “C” – UN Important 70% 10%
Note:-
1. Material received as replacement from supplier is treated as fresh supply
2. If any material is returned from Department after issue, it has to be first disposed in the next issue of material
3. Loss in the book balance of stock and actual is to be transferred to Inventory adjustment a/c and from there if the loss is
normal it is transferred to Over Head control a/c. If it is abnormal it is transferred to costing profit and loss a/c.
4. CIF = Cost Insurance and Freight (This consignment is inclusive of prepaid insurance and freight)
5. FOB = Free on Board (Materials moving by sea – insurance premium is not paid)
6. FOR = Free on Rail (Insurance and freight is not borne by the supplier but paid by the company purchase)7. For each receipt of goods = Goods Receipt note
8. For each issue of goods = Materials Requisition note (or) Material Issue note
Accounting Treatment :-
1. Normal Wastage = It should be distributed over goods output increasing per unit cost2. Abnormal Wastage= It will be charged to costing profit and loss a/c3. Sale value of scrap is credited to costing profit and loss a/c as an abnormal gain.4. Sale proceeds of the scrap can be deducted from material cost or factory overheads.5. Sale proceeds of scrap may be credited to particular job.6. Normal Defectives = cost of rectification of defectives should be charged to specific7. Abnormal Defectives = This should be charged to costing profit and loss a/c8. Cost of Normal spoilage is to borne by good units9. Abnormal spoilage should be charged to costing profit and loss a/c
LABOUR:
Method of Remuneration:
1. Time Rate system
a) Flat time Rateb) High wage systemc) Graduated time rate
2. Payment by Results
a) Piece rate systemi) Straight piece rateii) Differential piece rate
•
Taylor system• Merrick system
b) Group Bonus Systemi) Budgeted Expensesii) Towne gain sharing schemeiii) Cost efficiency bonusiv) Priest man system
c) Combination of Time and Piece ratei) Gantt task and Bonus schemeii) Emerson Efficiency systemiii) Point scheme
• Bedaux system• Haynes manit system
d) Premium bonus plansi) Halsey premium planii) Halsey weir premium planiii) Rowan schemeiv) Barth schemev) Accelerating premium bonus scheme

8/14/2019 Costing Ready Referencer
http://slidepdf.com/reader/full/costing-ready-referencer 6/23
Costing: Ready Reference 6.
e) Other incentive schemesi) Indirect monetary incentive
• Profit sharing• Co-partnership
ii) Non-Monetary Incentive
1. Time rate system = Hours worked * Rate per hour (Basic wages)
2. Piece rate system:
a. Straight piece rate earnings = Number of units produced * Rate per unit
b. Differential Piece rate
i. F.W.Taylor’s differential rate system» 83% of piece rate when below standard» 125% of piece rate when above or at standard
ii. Merrick differential or multiple piece rate system
Efficiency level Piece rate
» up to 83% »Normal piece rate
» 83% to 100% » 110% of Normal rate» Above 100% » 120% of Normal rate
iii. Gantt Task and Bonus system
Output Payment
» Below standard » Time rate (guaranteed)» At standard » 20% Bonus of Time rate» Above standard » 120% of ordinary piece rate
iv. Emerson’s Efficiency system
Efficiency Payment» Below 66.7% » Hourly Rate» from 66.7% to 100% » Hourly rate (+) increasing bonus according to degree of efficiency on the basis of step
bonus rates» Above 100% » Hourly rate (+) 20% Bonus (+) additional bonus of 1% of hourly rate for every 1% increase
in efficiency
v. Halsey Premium Plan = Basic wages + 50% of time saved * Hourly Rate
vi. Halsey Weir Premium Plan= Basic wages + 30% of time saved * Hourly rate
vii. Rowan Plan = Basic wages + Time saved / Time allowed * Basic Wages
viii. Bedaus Point system = Basic wages + 75% * Bedaus point/60 * Rate/hr
ix. Barth’s System = Hourly rate * √Std time *Time taken
Labour Turnover:-
1. Separation rate method = Separation during the period / Average No. of worker’s during the period
2. Net labour T.O rate (or) Replacement method = Number of replacements / Average No. of worker’s during the period
3. Labour flux rate = No. of separation + No. of replacement / Average No. of worker’s during the period
Accounting Treatment
1. Normal Idle time = Charged to factory overheads
2. Normal but un-controllable = It should be charged to job by inflating wage rate.
3. Abnormal = It should be charged to costing P & L a/c
OVER HEADS

8/14/2019 Costing Ready Referencer
http://slidepdf.com/reader/full/costing-ready-referencer 7/23
Costing: Ready Reference 7.
Reapportionment of service department expenses over production department :-
1. Direct redistribution method:• Service department costs are divided over production department.• Ignore service rended by one dept. to another
2. Step method of secondary distribution (or) Non reciprocal method: Service department which serves largest number of
service department is divided first and go on.
3. Reciprocal service method:
i. Simultaneous equation method (or) Algebraic method: Equation is formed between service departments and is solved tofind the amount due.
ii. Repeated distribution method: Service department cost separated repeatedly till figure of service dept. is exhausted or toosmall.
iii. Trial and Error method: Cost of service department is apportioned among them repeatedly till the amount is negligible andthe total is divided among production department.
Treatment of Over/Under absorption of overheads:-
i. If under absorbed and over absorbed overheads are of small value then it should betransferred to costing profit and loss a/c
ii. If under and over absorption occurs due to wrong estimates then cost of product manufactured should be adjustedaccordingly.
iii. If the same accrued due to same abnormal reasons the same should be transferredto costing profit & loss a/c
Apportionment of overhead expenses – Basis
a. Stores service expenses = Value of materials consumed
b. Factory rent = Floor area
c. Municipal rent, rates and taxes = floor area
d. Insurance on Building and machinery = Insurable value
e. Welfare department expenses
f. SupervisionNumber of Employees
g. Amenities to employee’s
h. Employees liability for insurance
i. Lighting power = Plug point
j. Stores over heads = Direct material
k. General over heads = Direct wages
Reapportionment of service department cost to production department :-
1. Maintenance dept. = Hours worked for each dept.
2. Pay roll and time keeping = Total labour (or) machine hours (or) Number of employees in each department
3. Employment (or) Personnel department = Rate of labour T.O (or) No. of employees of each department
4. Stores Keeping department = No. of requisitions (or) value of materials of each department
5. Purchase department = No. of purchase orders value of materials of each department
6. Welfare, ambulance, canteen, service, recreation room expenses = No. of employees in each department.
7. Building service department = Relative area each dept.
8. Internal transport service (or) overhead crane service = weight, value graded product handled, weight and distancetraveled.

8/14/2019 Costing Ready Referencer
http://slidepdf.com/reader/full/costing-ready-referencer 8/23
Costing: Ready Reference 8.
9. Transport department = Crane hours, truck hours, truck mileage, Number of packages.
10. Power house (electric power cost) = Housing power, horse power machine hours, No. of electric points etc.
11. Power house = Floor area, cubic content.
RECONCILATION OF COST AND FINANCIAL A/C
Causes of differences:-
1. Purely financial items :
i. Appropriation of profits Transferred to reserves, goodwill, preliminary expenses, dividend paid etc.►
ii. Loss on sale of investment, penalties and fines
iii. Income Interest received on Bank deposits, profit on sale of investments, fixed assets, transfer fees.►
2. Purely cost account items: - Notional Rent / Interest / Salary
3. Valuation of stock:-
i. Raw-material = In financial a/c’s stock is valued at cost or market valueWhichever is less, while in cost a/c’s it is valued at LIFO, FIFO etc.
ii. Work in progress = In financial a/c’s administrative expenses are also considered while valuing stock, but in cost a/c’s itmay be valued at prime (or) factory cost (or) cost of production
iii. Finished Goods = In financial a/c’s it is valued at cost or market price whichever is less, in cost a/c’s it is valued at total costof production.
4. Overheads: In financial = Actual expenses are takenIn cost = Expenses are taken at predetermined rate.
5. Depreciation: In financial = Charged in diminishing or fixed balance methodIn cost = Charged in machine hour rate
6. Abnormal Gains: In financial = Taken to profit & Loss a/cIn cost = Excluded to cost a/c’s or charged in costing profit & Loss a/c
JOB AND BATCH COSTING:
With job costing, we are dealing with one off situations. We are dealing with organisations that carry out functions andservices on a one at a time basis. Good examples of job costing situations include jobbing builders: the builder who will provide ahouseholder, or a shop owner, or a factory owner with a service that he provides for no one else. The jobbing builder will build anextension, or renovate some property to a design that will probably not be copied anywhere else at any time: it is a one off job. Jobcosting can apply in non manufacturing situations as well as in manufacturing situations.
Even though many jobbing enterprises are small scale, we are not suggesting that all jobbing enterprises are small scaleenterprises. An engineering shop may be working on a job for a customer that takes several months and many man and machinehours to complete.
Here are two definitions:
A job is “A customer order or task of relatively short duration” Job costing is “A form of specific order costing; the attribution of cost to jobs” Batch costing is not normally seen as much of an advance on job costing.
A batch is A group of similar articles which maintains its identity throughout one or more stages of production and is treatedas a cost unit Batch costing is A form of specific order costing; the attribution of costs to batches.
Economic Batch Quantity = EBQ = √2AS/CWhere, A = Annual Demand
S = Setting up cost per batch
C = Carrying cost / unit of production.
PROCESS COSTING
Format of process a/c

8/14/2019 Costing Ready Referencer
http://slidepdf.com/reader/full/costing-ready-referencer 9/23
Costing: Ready Reference 9.
Particulars Unit Rate Rs. Particulars Unit Rate Rs.
To Direct material By Normal LossTo Direct Labour By Units transferred
to other processTo Indirect materialTo Other Expenses By Abnormal loss (B/F)To Abnormal gain(B/F)Total Total
Format of Abnormal loss
Particulars Unit Rs. Particulars Unit Rs.
To Process a/c By Sale of wasted unitsBy costing P & L a/c
Total Total
Format of Abnormal gain a/c
Particulars Units Rs. Particulars Units Rs.
To Normal Loss a/c By Process a/c (names of different process)To costing P&la/c
Total Total
1. To find the cost per unit for valuation of units to be trans. to next process and also for abnormal, loss or gain =Total process cost – Salvage value of normal spoilage / Total units introduced – Normal loss in units
2. To find abnormal loss (or) gain (all in units): = Units from previous process + fresh units introduced – Normalloss – units transferred to next process (If the result is positive then abnormal loss. If negative then abnormal gain)
3. In case of opening WIP and closing WIP are given then there are different methods of valuation of closing WIPi) FIFO Method ii) LIFO Methodiii) Average Method iv) Weighted Average Method
4. Various statements to be prepared while WIP is given:i) Statement of equivalent productionii) Statement of costiii) Statement of apportionment of costiv) Process cost a/c
5. FIFO Method: In these method total units transferred to next process includes full opening stock units and theclosing stock includes the units introduced during the process. In this method the cost incurred during the process isassumed as to be used
a) First to complete the units already in processb) Then to complete the newly introduced unitsc) For the work done to bring closing inventory to given state of completion
6. LIFO Method: Cost incurred in process is used for:
a. First to complete newly introduced units
b. Then to complete units already in process in this method closing stock is divided into two :i) Units which represent opening stock but lie at the end of the periodii) Newly introduced units in closing stock.
7. Average Method: In this methoda. No distinction is made between opening stock and newly introduced material.
b. In finding cost per unit, cost incurred for opening stock is also to be added with current cost. (This addition is notdone in LIFO & FIFO method as cost incurred in that process is only taken)
8. Weighted average method: This method is only used when varied product in processed through a single process. Generalprocedure is adopted here.
a. Statement of weighted average production should be prepared. Under this statement output of each products isexpressed in terms of points.
b. Cost of each type of product is computed on basis of Points.
Points of vital importance in case of Abnormal Gain / Loss:
a. Calculate cost per unit by assuming there is no abnormal loss / gain

8/14/2019 Costing Ready Referencer
http://slidepdf.com/reader/full/costing-ready-referencer 10/23
Costing: Ready Reference 10.
b. Cost per unit arrived above should be applied for valuation of both abnormal Loss/gain units and output of theprocess.
c. Separate a/c for both abnormal loss/gain is to be prepared.
JOINT PRODUCT AND BY PRODUCT COSTING
Methods of apportioning joint cost over joint products :
1. Physical unit method = Physical base to measure (i.e.) output quantity is used to separate joint cost. Joint cost can beseparated on the basis of ratio of output quantity. While doing this wastage is also to be added back to find total quantity.
2. Average unit cost method = In this method joint cost is divided by total units Produced of all products and average cost perunit is arrived and is multiplied With number of units produced in each product.
3. Survey method or point value method = Product units are multiplied by points or weights and the point is divide on thatbasis.
4. Standard cost method = Joint costs are separated on the basis of standard cost set for respective joint products.
5. Contribution margin method = Cost are divided into two categories (i.e.) variable and fixed. Variable costs are separated onunit produced. Fixed on the basis of contribution ratios made by different products.
6. Market value method:-
a. Market value at the point of separation: Joint cost to sales revenue percentage is found which
is called as multiplying factor = Joint cost / Sales Revenue * 100
Joint cost for each product is apportioned by applying this % on sales revenue of each product.
• Sales revenue = Sales Revenue at the point of separation.• This method cannot be done till the sales revenue at the separation point is given.
b. Market value after processing: Joint cost is apportioned on the basis of total sales Value of each product after further processing.
c. Net Realizable value method = Form sales value following items are deductedi) Estimated profit margin
ii) Selling and distribution expenses if any included.iii) Post split off costThe resultant amount is net realizable value. Joint cost is apportioned on this basis.
Bi-product → Method of accounting
• Treat as other income in profit and loss a/c• Net Realizable value of Bi-product is reduced from cost of main product.• Instead of standard process, Standard cost or comparative price or re-use price is credited to joint process a/c.
OPERATION COSTING
Service costing is “A cost accounting method concerned with establishing the costs of services rendered”. Service costing isalso applied within a manufacturing setting.
The Differences Between Product Costing and Service Costing?• There may be very few, if any, materials to worry about• Overheads will comprise the most significant portion of any costs of which, labour costs may well comprise as much as 70%
No. Enterprise Cost per unit
1. Railways or bus companies Per passenger-kilometer2. Hospital Per patient/day, per bed/day3. Canteen Meals served , cups of tea4. Water supply service Per 1000 gallons5. Boiler House 1000 kg of steam6. Goods Transport Per tonne km, quintal km
7. Electricity Boards Per kilowatt – hours8. Road maintenance department Per mile or road maintenance9. Bricks One thousand10. Hotel Per room/day
In this various terms such as passenger km, quintal km, tonne km, these are all known as composite units and arecomputed in 2 ways:
8/14/2019 Costing Ready Referencer
http://slidepdf.com/reader/full/costing-ready-referencer 11/23
Costing: Ready Reference 11.
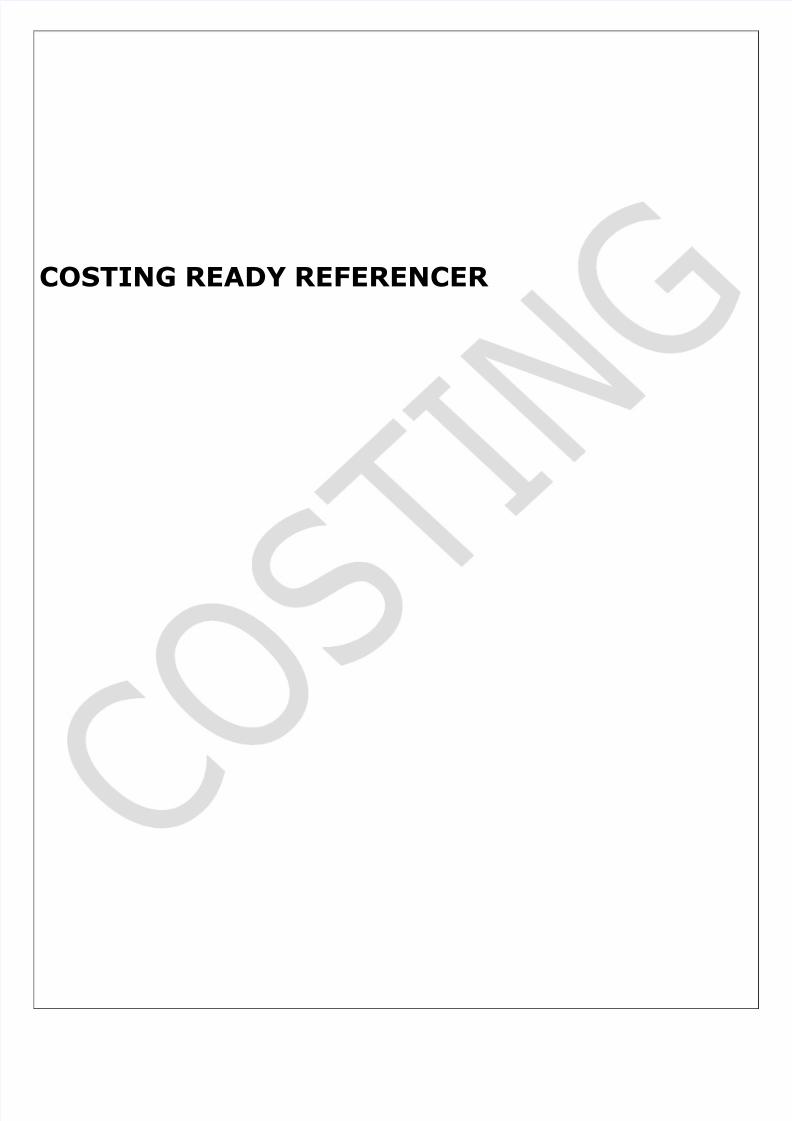
a) Absolute (weighted average): (e.g.) ton km - Multiplying total distance by respective load quantity.b) Commercial (simple average): (e.g.) ton Km–Multiplying total distance by average load quantity
All accumulated cost is classified into 3 categories:1. Standing charges (or) fixed cost2. Running cost (or) variable cost3. Maintenance charges (or) semi variable cost
Running charges = Fuel, Driver Wages, Depreciation, oil etc.Maintenance charges = Supervision salary, Repairs and Maintenance
Note:-
• % of factory overheads on direct wages
• % of administration overheads on works cost
• % of selling & distribution overheads on works cost
• % of profit on sales
Operating cost sheet :-
Particulars Total cost Cost per kmA Standing charges :-
License fees
Insurance PremiumRoad taxGarage rentDriver’s wagesAttendant-cum-cleaner’s wagesSalaries and wages of other staff
TotalB Running charges :-
Repairs and maintenanceCost of fuel (diesel, petrol etc.)Lubricants, grease and oilCost of tires, tubes and other spare partsDepreciation
TotalC Total charges [ (A) + (B) ]
CONTRACT COSTING
Contract costing is “A form of specific order costing; attribution of costs to individual contracts”.
A contract cost is “Aggregated costs of a single contract; usually applies to major long term contracts rather than short term jobs”.
Features of long term contracts:
• By contract costing situations, we tend to mean long term and large contracts: such as civil engineering contracts forbuilding houses, roads, bridges and so on. We could also include contracts for building ships, and for providing goods andservices under a long term contractual agreement.
• With contract costing, every contract and each development will be accounted for separately; and does, in many respects,contain the features of a job costing situation.
• Work is frequently site based.
We might have problems with contract costing in the following areas• Identifying direct costs• Low levels of indirect costs• Difficulties of cost control• Profit and multi period projects
The source of the following has eluded me: my sincere gratitude for whoever the author might be.
"Contract Costing such jobs take a long time to complete & may spread over two or more of the contractor's accounting years”.
Features of a Contract:
• The end product• The period of the contract
• The specification• The location of the work• The price• Completion by a stipulated date• The performance of the product
Collection of Costs:

8/14/2019 Costing Ready Referencer
http://slidepdf.com/reader/full/costing-ready-referencer 12/23
Costing: Ready Reference 12.
Desirable to open up one or more internal job accounts for the collection of costs. If the contract not obtained, preliminary costsbe written off as abortive contract costs in P&L In some cases a series of job accounts for the contract will be necessary:
• to collect the cost of different aspects• to identify different stages in the contract
Special features:
• Materials delivered direct to site.•
Direct expenses• Stores transactions.• Use of plant on site
Two possible accounting methods:
Where a plant is purchased for a particular contract & has little further value to the business at the end of the contractWhere a plant is bought for or used on a contract, but on completion of the contract it has further useful life to the businessAlternatively the plant may be capitalised with Maintenance and running costs charged to the contract."
Format:-
Particulars Rs. Particulars Rs.
To Materialsa. Purchased directly
b. Issue from sitec. Supplied by contractee
**
****
By materials returned **By Material sold (cost price)
**
To Wages and salaries ** By WIPWork certifiedWork Uncertified
****
To Other direct Expenses **To Sub-contractor fees **To Plant & Machinery (purchase
price/Book value) **By Materials at site **
To Indirect expenditure (apportioned share of overheads) ** By Plant and machinery(WDV)**
To Notional profit (Surplus) **Total Total **
Profit of Incomplete contract :-
1. When % of completion is less than or equal to 25% then full Notional profit is transferred to reserve.
2. When % of completion is above 25% but less than 50% following amount should be credited to profit & loss a/c = 1/3 *Notional Profit * {Cash received / Work certified}
3. When % of completion is more than or equal to 50% then the amount transferred to profit is =2/3 * Notional Profit * {Cash received / Work certified} [Balance is transferred to reserve a/c] % of completion = {Workcertified/Contract price} * 100
4. When the contract is almost complete the amount credited to profit & loss a/c is
a. Estimated total profit * {Work certified / Contract price}b. Estimated total profit * {Cash received / Contract price}c. Estimated total profit * {Cost of work done / Estimated total profit}d. Estimated total profit * {Cost of work done*Cash received / Estimated total cost * Work certified}
5. Work-In-Progress is shown in Balance Sheet as follows:-
Skeleton Balance sheet
Liabilities (RS) Asset (Rs)
Profit & loss a/c (will include)Profit on contract (Specify
the contract number)Less : Loss on contract
(Specify the contract number)Sundry creditors (will include)
Wages accruedDirect expenses accruedAny other expenses
(Specify)
Work-in-progressValue or work certifiedCost of work uncertifiedLess :- Reserve for unrealized profitLess :- Amount received from contractee
6. Escalation Clause = This is to safeguard against likely change in price of cost elements rise by and certain % over the pricesprevailing at the time tendering the contractee has to bear the cost.
MARGINAL COSTING

8/14/2019 Costing Ready Referencer
http://slidepdf.com/reader/full/costing-ready-referencer 13/23
Costing: Ready Reference 13.
Statement of profit:-
Particulars Amount
Sales ***Less:-Variable cost ***Contribution ***Less:- Fixed cost ***
Profit ***
1. Sales = Total cost + Profit = Variable cost + Fixed cost + Profit
2. Total Cost = Variable cost + Fixed cost
3. Variable cost = It changes directly in proportion with volume
4. Variable cost Ratio = {Variable cost / Sales} * 100
5. Sales – Variable cost = Fixed cost + Profit
6. Contribution = Sales * P/V Ratio
7. Profit Volume Ratio [P/V Ratio]:-• {Contribution / Sales} * 100• {Contribution per unit / Sales per unit} * 100• {Change in profit / Change in sales} * 100• {Change in contribution / Change in sales} * 100
8. Break Even Point [BEP]:-• Fixed cost / Contribution per unit [in units]• Fixed cost / P/V Ratio [in value] (or) Fixed Cost * Sales value per unit / (Sales – Variable cost per unit)
9. Margin of safety [MOP]• Actual sales – Break even sales• Net profit / P/V Ratio• Profit / Contribution per unit [In units]
10. Sales unit at Desired profit = {Fixed cost + Desired profit} / Cont. per unit
11. Sales value for Desired Profit = {Fixed cost + Desired profit} / P/V Ratio
12. At BEP Contribution = Fixed cost
13. Variable cost Ratio = Change in total cost / Change in total sales * 100
14. Indifference Point = Point at which two Product sales result in same amount of profit= Change in fixed cost / Change in variable cost per unit (in units)= Change in fixed cost / Change in contribution per unit (in units)= Change in Fixed cost / Change in P/Ratio (in Rs.)
= Change in Fixed cost / Change in Variable cost ratio (in Rs.)
15. Shut down point = Point at which each of division or product can be closed = Maximum (or) Specific (or) Available fixedcost / P/V Ratio (or) Contribution per unit
If sales are less than shut down point then that product is to shut down.
Note :-
• When comparison of profitability of two products if P/V Ratio of one product is greater than P/V Ratio of other Product then it is more profitable.
• In case of Indifference point if Sales > Indifference point --- Select option with higher fixed cost (or) select
option with lower fixed cost.
STANDARD COSTING
Method one of reading:-
Material:-
1) SP * SQ / (1)

8/14/2019 Costing Ready Referencer
http://slidepdf.com/reader/full/costing-ready-referencer 14/23
Costing: Ready Reference 14.
2) SP * AQ / (2)3) SP * RSQ / (3)4) AP * AQ / (4)
a. Material cost variance = (1) – (4)
b. Material price variance = (2) – (4)
c. Material usage variance = (1) – (2)
d. Material mix variance = (3) – (2)
e. Material yield variance = (1) – (3)
Labour :-
1) SR * ST2) SR * AT (Paid)3) SR * RST4) AR * AT5) SR * AT (Worked)
a. Labour Cost variance = (1) – (4)
b. Labour Rate variance = (2) – (4)
c. Labour Efficiency variance = (1) – (2)
d. Labour mix variance = (3) – (5)
e. Labour Idle time variance = (5) – (2)
Variable Overheads cost variance :-
1) SR * ST2) SR * AT3) AR * AT
a. Variable Overheads Cost Variance = (1) – (3)
b. Variable Overheads Expenditure Variance = (2) – (3)
c. Variable Overheads Efficiency Variance = (1) – (2)
[Where: SR =Standard rate/hour = Budgeted variable OH / Budgeted Hours]
Fixed Overheads Cost Variance:-
1) SR * ST2) SR * AT (Worked)3) SR * RBT4) SR * BT5) AR * AT (Paid)
a. Fixed Overheads Cost Variance = (1) – (5)
b. Fixed Overheads Budgeted Variance = (4) – (5)
c. Fixed Overheads Efficiency Variance = (1) – (2)d. Fixed Overheads Volume Variance = (1) – (4)
e. Fixed Overheads Capacity Variance = (2) – (3)
f. Fixed Overheads Calendar Variance = (3) – (4)
Sales value variance:-
1) BP * BQ2) BP * AQ3) BP * BM4) AP * AQ
a. Sales value variance = (4) – (1)
b. Sales price variance = (4) – (2)c. Sales volume variance = (2) – (1)
d. Sales mix variance = (2) – (3)
e. Sales quantity variance = (3) – (1)
Note :-
8/14/2019 Costing Ready Referencer
http://slidepdf.com/reader/full/costing-ready-referencer 15/23
Costing: Ready Reference 15.
i. Actual margin per unit (AMPU) = Actual sale price – selling cost per unit
ii. Budgeted margin per unit (BMPU) = Budgeted sale price – selling price per unit
Sales margin variance :-
1) BMPU * BQ2) BMPU * AQ3) BMPU * BM4) AMPU * AQ
a. Sales margin variance = (4) – (1)
b. Sales margin price variance = (4) – (2)
c. Sales margin volume variance = (2) – (1)
d. Sales margin mix variance = (2) – (3)
e. Sales margin quantity variance = (3) – (1)
Control Ratio :-
1. Efficiency Ratio = Standard hours for actual output / Actual hours worked * 100
2. Capacity Ratio = Actual Hours Worked / Budgeted Hours * 100
3. Activity Ratio = Actual hours worked / Budgeted Hours * 100
Verification: Activity Ratio = Efficiency * Capacity Ratio
STANDARD COSTING
Method two of reading:-
Material:-
a. Material cost variance = SC – AC = (SQ*AQ) – (AQ*AP)
b. Material price variance = AQ (SP – AP)
c. Material usage variance = SP (SQ – AQ)
d. Material mix variance = SP (RSQ – AQ)
e. Material yield variance = (AY – SY for actual input) Standard material cost per unit of output
f. Material revised usage variance (calculated instead of material yield variance) = [standard quantity – Revisedstandard
for actual output quantity] * Standardprice.
Labour :-
a. Labour Cost variance (LCV) = SC – AC = (SH*SR) – (AH*AR)
b. Labour Rate variance (LRV) = AH (SR - AR)
c. Labour Efficiency or time variance = SR (SH –AH)
d. Labour Mix or gang composition Variance = SR(RSH-AH)
e. Labour Idle Time Variance = Idle hours * SR
f. Labour Yield Variance = [Actual Output – Standard output for actual input] * Standard labourCost / unit of output.
g. Labour Revised Efficiency Variance (instead of LYV) = [Standard hours for actual output – Revised standard hours] *Standard rate
Notes :- i) LCV = LRV + LMV + ITV + LYVii) LCV = LRV + LEV + ITV
iii) LEV = LMV, LYV (or) LREV
Overhead variance :- (general for both variable and fixed)
a. Standard overhead rate (per hour) = Budgeted Overheads / Budgeted Hours

8/14/2019 Costing Ready Referencer
http://slidepdf.com/reader/full/costing-ready-referencer 16/23
Costing: Ready Reference 16.
b. Standard hours for actual output = Budgeted hours * Actual Output / Budgeted output
c. Standard OH = Standard hrs for actual output * Standard OH rate per hour
d. Absorbed OH = Actual hrs * Standard OH rate per hour
e. Budgeted OH = Budgeted hrs * Standard OH rate per hour
f. Actual OH = Actual hrs * Actual OH rate per hour
g. OH cost variance = Absorbed OH – Actual OH
Variable Overheads variance :-
a. Variable OH Cost Variance = Standard OH – Actual OH
b. Variable OH Exp. Variance = Absorbed OH – Actual Variable OH
c. Variable OH Efficiency Variance = Standard OH – Absorbed OH= [Standard hours for actual output – Actual hours * Standard rate for variable OH
Fixed Overheads variance :-
a. Fixed OH Cost Variance = Standard OH – Actual OH b. Fixed OH expenditure variance = Budgeted OH – Actual OH
c. Fixed OH Efficiency Variance (Hours based) = Standard OH (units based) – Absorbed OH
d. Fixed OH Volume Variance = Standard OH – Budgeted OH= [Standard hrs for actual output – Budgeted hours] * standard rate
e. Fixed OH capacity variance = Absorbed OH–Budgeted OH
f. Fixed OH Calendar Variance = [Revised budgeted hrs – Budgeted hrs] * Standard rate/hrs
Note:- When there is calendar variance capacity variance is calculated as follows :-Capacity variance = [Actual hours (Revised) – Revised Budgeted hours] * Standard rate / hour
Verification :-
i. Variable OH cost variance = Variable OH Expenditure variance + Variable OH Efficiency variance
ii. Fixed OH cost variance = Fixed OH Expenditure variance + Fixed OH volume variance
iii. Fixed OH volume variance= Fixed OH Efficiency variance + Capacity variance + Calender variance
Sales variances :-
Turnover method (or) sales value method :-
a. Sales value variance = Actual Sales – Budgeted Sales
b. Sales price variance = [Actual Price – Standard price] * Actual quantity= Actual sales – standard sales)
c. Sales volume variance = [Actual-Budgeted quantity] *Standard price
= Standard sales – Budgeted salesd. Sales mix variance = [Actual quantity – Revised standard quantity] * Standard price
= Standard sales – Revised sales
e. Sales quantity variance = [Revised standard variance – Budgeted quantity] * Standard price= Revised Standard sales – Budgeted sales
Profit method:-
a. Total sales margin variance = (Actual Profit–Budgeted price)= {Actual quantity * Actual profit per unit}- {Budgeted quantity * Standard profit perunit}
b. Sales margin price variance =Actual profit–Standard profit= {Actual Profit per unit – Standard profit per unit} * Actual quantity of sales
c. Sales margin volume variance = Standard profit – Budgeted Profit= {Actual quantity – Budgeted quantity} * Standard profit per unit
d. Sales margin mix variance = Standard profit – Revised Standard profit= {Actual quantity – Revised standard quantity} * Standard profit per unit
e. Sales margin quantity variance = Revised standard profit - Budgeted profit= {Revised standard quantity – Budgeted quantity} * Standard profit per unit

8/14/2019 Costing Ready Referencer
http://slidepdf.com/reader/full/costing-ready-referencer 17/23
Costing: Ready Reference 17.
STANDARD COSTING
Diagrammatic Representation: -
Material Variance: -
Material cost variance = SC – AC = (SQ*AQ) – (AQ*AP)
Labour Variances:-
Labour Cost variance = SC – AC = (SH*SR) – (AH*AR)
Fixed Overhead Variance : -
a. Standard OH = Standard hrs for actual output * Standard OH rate per hour
b. Absorbed OH = Actual hrs * Standard OH rate per hour
c. Budgeted OH = Budgeted hrs * Standard OH rate per hour
d. Actual OH = Actual hrs * Actual OH rate per hour
e. Revised Budgeted Hour = Actual Days * Budgeted Hours per day(Expected hours for actual days worked)
When Calendar variance is asked then for capacity variance Budgeted Overhead is (Budgeted days * Standard OH rate perday)
Revised Budgeted Hour (Budgeted hours for actual days) = Actual days * Budgetedhours per day
Variable Overhead Variance : -
Sales Value Variances : -

8/14/2019 Costing Ready Referencer
http://slidepdf.com/reader/full/costing-ready-referencer 18/23
Costing: Ready Reference 18.
Sales value variance = Actual Sales – Budgeted Sales
Sales Margin Variances : -
Total sales margin variance = (Actual Profit–Budgeted price)= {Actual quantity * Actual profit per unit} - {Budgeted quantity * Standard profit per unit}
[Where :-
SC = Standard Cost, AC = Actual CostSP = Standard Price, SQ = Standard QuantityAP = Actual Price, AQ = Actual QuantityAY = Actual Yield, SY = Standard YieldRSQ = Revised Standard Quantity, SR = Standard Rate,ST = Standard Time AR = Actual Rate,AT = Actual Time RST = Revised Standard Time,BP = Budgeted Price, BQ = Budgeted QuantityRBT = Revised Budgeted Time AMPU = Actual Margin per UnitBMPU = Budgeted Margin per Unit
Reconciliation:-
Reconciliation statement is prepared to reconcile the actual profit with the budgeted profit
Particulars Favorable Unfavorable (Rs)
Budgeted Profit :Add Favorable variancesLess Unfavorable variancesSales Variances : Sales price variance
Sales mix varianceSales quantity variance
Cost variance :-Material : Cost variance
Usage varianceMix variance
Labour : Rate varianceMix varianceEfficiency variance
Idle time varianceFixed overhead variance : Expenditure variance
Efficiency varianceFixed overhead variance : Expenditure variance
8/14/2019 Costing Ready Referencer
http://slidepdf.com/reader/full/costing-ready-referencer 19/23
Costing: Ready Reference 19.
Efficiency varianceCapacity varianceCalendar variance
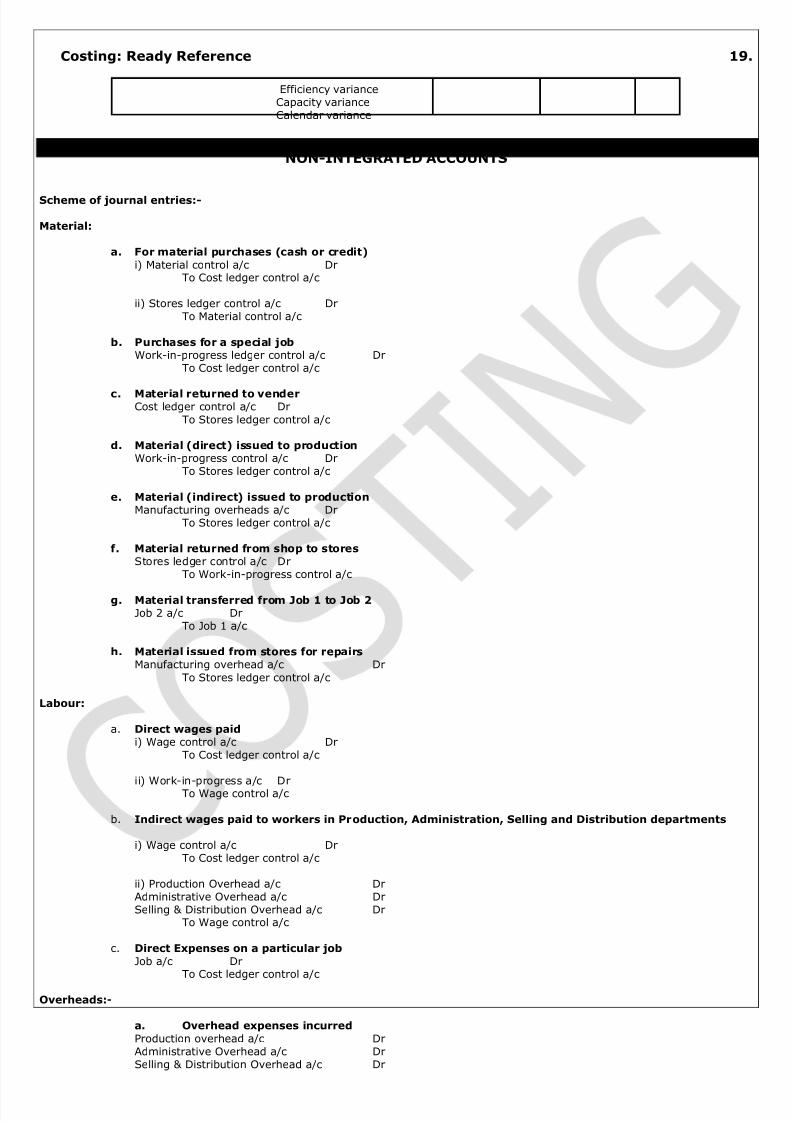
NON-INTEGRATED ACCOUNTS
Scheme of journal entries:-
Material:
a. For material purchases (cash or credit)
i) Material control a/c DrTo Cost ledger control a/c
ii) Stores ledger control a/c DrTo Material control a/c
b. Purchases for a special job
Work-in-progress ledger control a/c DrTo Cost ledger control a/c
c. Material returned to venderCost ledger control a/c Dr
To Stores ledger control a/c
d. Material (direct) issued to production
Work-in-progress control a/c DrTo Stores ledger control a/c
e. Material (indirect) issued to production
Manufacturing overheads a/c DrTo Stores ledger control a/c
f. Material returned from shop to stores
Stores ledger control a/c DrTo Work-in-progress control a/c
g. Material transferred from Job 1 to Job 2
Job 2 a/c DrTo Job 1 a/c
h. Material issued from stores for repairs
Manufacturing overhead a/c DrTo Stores ledger control a/c
Labour:
a. Direct wages paid
i) Wage control a/c DrTo Cost ledger control a/c
ii) Work-in-progress a/c DrTo Wage control a/c
b. Indirect wages paid to workers in Production, Administration, Selling and Distribution departments
i) Wage control a/c DrTo Cost ledger control a/c
ii) Production Overhead a/c DrAdministrative Overhead a/c DrSelling & Distribution Overhead a/c Dr
To Wage control a/c
c. Direct Expenses on a particular job
Job a/c DrTo Cost ledger control a/c
Overheads:-
a. Overhead expenses incurred
Production overhead a/c DrAdministrative Overhead a/c DrSelling & Distribution Overhead a/c Dr

8/14/2019 Costing Ready Referencer
http://slidepdf.com/reader/full/costing-ready-referencer 20/23
Costing: Ready Reference 20.
To cost ledger control a/c
b. Carriage inward
Manufacturing Overhead a/c DrTo Cost ledger control a/c
c. Production Overheads recovered
Work-in-progress control a/c Dr
To Production Overhead a/c
d. Administrative Overhead recovered from finished goods
Finished goods ledger control a/c DrTo Administrative Overhead a/c
e. Selling and Distribution Overhead recovered from sales
Cost of sales a/c DrTo Selling & Distribution a/c
f. If over/under absorbed amounts are carried forward to subsequent year, the
balance of each Overhead account will have to be transferred to respective
Overhead suspense (or reserve) Accounts as follows:
i) For over recovery : Production Overhead a/c DrTo Production overhead suspense a/c
ii) For under recovery : Administrative Overhead Suspense a/c DrTo Administrative Overhead a/c
Selling & Distribution Overhead Suspense a/c DrTo Selling & Distribution Overhead a/c
g. In case the Under/Over absorbed overheads are transferred to costing profit & loss a/c then the relevant entries are: i) For Over recovery: Production Overhead a/c Dr
To Costing Profit & Loss a/c
ii) For Under recovery: Costing Profit & Loss a/c DrTo Administration Overhead a/c
Sales:-
For sales effected: Cost ledger control a/c DrTo Costing Profit & Loss a/c
Profit / Loss:
In case of profit the entry is as follows
Costing Profit & Loss a/c DrTo Cost ledger control a/c
Reverse the entry in case of loss
The main accounts which are usually prepared when a separate cost ledger is maintained is as follows:-
a. Cost ledger control a/cb. Stores ledger control a/cc. Work-in-progress control a/cd. Finished goods control a/c
e. Wage control a/cf. Manufacturing/Production/Works Overheads a/cg. Administrative Overhead a/ch. Selling & Distribution Overhead a/ci. Cost of sales a/c j. Costing profit & loss a/c
Transfer Pricing
A transfer price is the amount of money that one unit of an organisation charges for goods and services to another unit of
an organisation.
One of the key aspects here is that a transfer price is equivalent to an ordinary selling price and that any department ordivision that sets a transfer price is effectively selling its goods and services at a profit or a loss to another department or divisionwithin its organisation. Any part of an organisation using transfer pricing will be classed as a profit centre: since it is operating with aview to making a profit (whether positive, profit, or negative, loss). If goods and services are transferred between departments anddivisions at cost, then no profit or loss arises and the issue of transfer pricing does not, or should not, arise.

8/14/2019 Costing Ready Referencer
http://slidepdf.com/reader/full/costing-ready-referencer 21/23
Costing: Ready Reference 21.
Organisations have a system of transfer pricing, therefore, in order to assess the efficiency and effectiveness of its
department and divisional managers. This maybe in spite of the fact that transfer prices may be artificial in the sense that it is feltthat there is no rationale for “selling” between departments and divisions.
Criteria for fixing Transfer Pricing:-
i) External Capacity not fully utilized = Variable Cost
ii) Capacity fully Utilizeda) If single product :-
Selling Price (–) Selling Expenses
b) If multiple productVariable cost + Opportunity cost (measured on the basis of Product actually sacrificed)
iii) If no market for Intermediate productCost of supplying division of optimum level(-) Cost of the supplying division at previous output level / Difference in Output
(This would be equal to Variable cost when Fixed Cost is same at all levels)
Note:-
i) Ignore Variable Selling expenses on Inter Department Transfer ii) In case of (ii) above If selling expenses is not given we have to assume some % as selling Expenses but it should not
exceed 5% .
Budgetary Control
Budget Ratios:-
1) Capacity usage Ratio = Budgeted Hours / Maximum possible working hours in budget period * 100
2) Standard Capacity Employed Ratio = Actual Hours Worked / Budgeted hours * 100
3) Level of Activity Ratio = Standard Hours for Actual Production / Standard Hours for Budgeted Production * 100
4) Efficiency Ratio = Standard Hours for Actual Production / Actual Hours * 100
5) Calendar Ratio = Actual Working days / Budgeted working days * 100
Zero Base Budgeting:
The name zero base budgeting derives from the idea that such budgets are developed from a zero base: that is, at thebeginning of the budget development process, all budget headings have a value of ZERO. This is in sharp contrast to the incrementalbudgeting system in which in general a new budget tends to start with a balance at least equal to last year's total balance, or anestimate of it.
Definition of Zero Base Budgeting (ZBB)
“A method of budgeting whereby all activities are re-evaluated each time a budget is set. Discrete levels of each activity arevalued and a combination chosen to match funds available”.
Objectives and Benefits of ZBB
What zero base budgeting tries to achieve is an optimal allocation of resources that incremental and other budgetingsystems probably cannot achieve. ZBB starts by asking managers to identify and justify their area(s) of work in terms of decisionpackages (qv).
An effective zero base budgeting system benefits organisations in several ways. It will
• Focus the budget process on a comprehensive analysis of objectives and needs

8/14/2019 Costing Ready Referencer
http://slidepdf.com/reader/full/costing-ready-referencer 22/23
Costing: Ready Reference 22.
• Combine planning and budgeting into a single process• Cause managers to evaluate in detail the cost effectiveness of their operations• Expand management participation in planning and budgeting at all levels of the organisation
Activity Based costing
In Traditional Method we split the Over Head incurred in production, based on machine hours which are not acceptable formany reasons.
In ABC method Over Head are splited according to the related activity, for each type of Over Head. Overhead areapportioned among various Production cost centers on the basis of Activity cost drivers.
Relevant Costing - some theory
Introduction: -
A management decision involves predictions of costs & revenues. Only the costs and revenues that will differ among
alternative actions are relevant to the decision. The role of historical data is to aid the prediction of future data. But historical data
may not be relevant to the management decision itself. Qualitative factors may be decisive in many cases, but to reduce the number
of such factors to be judged, accountants usually try to express many decision factors as possible in quantitative terms.
Meaning of Relevant Costs: -
Relevant costs represent those future costs that will be changed by a particular decision. While irrelevant costs are those
costs that will not be affected by a decision. In the short run, if the relevant revenues exceed the relevant costs then it will be
worthwhile accepting the decision. Therefore relevant costs playa major role in the decision-making process of an organization. A
particular cost can be relevant in one situation but irrelevant in another, the important point to note is that relevant costs represent
those future costs that will be changed by a particular decision, while irrelevant costs are those costs that will not be affected by that
decision. We shall now see what are relevant costs and revenues for decision-making process. In summary relevant information
concerns:
Other Important Terminologies : -
Relevant costs are costs appropriate to aiding the making of specific management decisions. Actually, to affect a decision a
cost must be:
Future: Past costs are irrelevant as they are not affected them by future decisions & decisions should be made as to what is best
now.
Incremental: This refers to additional revenue or expenditure, which may appear as a result of our decision-making.
(A cash flow - Such charges as depreciation may be future but do not represent cash flows and, as such, are not relevant.)
Sunk costs: Past costs, not relevant for decision making
Committed costs: This is future in nature but which arise from past decisions, perhaps as the result of a contract.
Relevant Costs: Problem areas:
1 Problems in determining the relevant costs of materials:
When considering various decisions, if the any materials required is not taken from existing stocks but would be purchased
on a later date, then the estimated purchase price would be the relevant material cost. A more difficult problem arises when
materials are taken from existing stock. In this situation the relevant cost of materials for a particular job (say job X) depends on
Material is in regular use of the company
Material is not in regular use of the company
Material is in short supply.
If the material is in regular use of the company then the material taken from existing stock requires replacement for the
purpose of regular use therefore the relevant cost of material will be the Replacement cost.
If the material is not in regular use of the company the relevant cost of the materials depends on their alternative use. The
alternative use of the materials will be either to sell them or to use them on other jobs. Hence the cost of using the materials results
in an opportunity cost consisting of either
The net sales revenue if the materials were sold (or) The expense that would be avoided if the materials were used on some other

8/14/2019 Costing Ready Referencer
http://slidepdf.com/reader/full/costing-ready-referencer 23/23
Costing: Ready Reference 23.
job Whichever is greater.
If the material is in short supply the only way material for the job under consideration can be obtained is by reducing
production of some other product / job. This would release material for the order. but the reduced production will result in loss of
contribution which should be taken in to account when ascertaining the relevant costs for the specific order. Therefore the relevant
cost will be Contribution lost (before the material cost since the material cost will be incurred in any case) will be the relevant cost.
labour:2 Determining the direct labour that are relevant to short - term decision depends on the circumstances.
Where a company has temporary sparse capacity and the labour force is to be maintained in the short - term, the direct
labour cost incurred will remain same for all alternative decisions. The direct labour cost will therefore be irrelevant for short - term
decision - making purposes.
However where casual labour is used and where workers can be hired on a daily basis; a company may then adjust the
employment of labour to exactly the amount required to meet the production requirements. The labour cost will increase if the
company accepts additional work, and will decrease if production is reduced. In this situation the labour cost be a relevant cost for
decision - making purposes.
In a situation where full capacity exists and additional labour supplies are unavailable in the short - term, and where no
further overtime working is possible, the only way that labour resources could then be obtained for a specific order would be to
reduce existing production. This would release labour for the order. but the reduced production will result in loss of contribution,
which should be taken in to account when ascertaining the relevant costs for the specific' order. Therefore the relevant cost will beContribution lost (before the labour cost) will be the relevant cost.
PROBLEMS
1. In a firm, material A has no alternative uses and 200 units of which lie in stock. The information below has been collected. You are
required to find the relevant price of 120 units and 250 units respectively.
Book value
Current price
Sale price obtainable
Rs.2 per kg Rs.3 per kg Rs.2.80 per kg
2. Assume in the above problem the material is in regular use of the company
3. Assume in the above problem the material is in short ‘supply and it is not possible to obtain the stock of material for some more
time. At present the material is used in another product on which a contribution at the rate of Rs.1 O/unit is earned (after meeting
the material cost). Each unit of the product requires 1 KG of Raw material A.