COSTING OF HEALTH AND WELLNESS CENTRES
28
COSTING OF HEALTH AND WELLNESS CENTRES A CASE STUDY OF GUJARAT January 2021 Indrani Gupta Mayur Trivedi Vishal Jani Kanksha Barman Avantika Ranjan Manas Sharma
Transcript of COSTING OF HEALTH AND WELLNESS CENTRES

COSTING OF HEALTH AND
WELLNESS CENTRES
A CASE STUDY OF GUJARAT
January 2021
Indrani Gupta
Mayur Trivedi
Vishal Jani
Kanksha Barman
Avantika Ranjan
Manas Sharma

1
(January 2021)
Indrani Gupta (IEG)
Mayur Trivedi (IIPHG)
Vishal Jani (IIPHG)
Kanksha Barman (IEG)
Avantika Ranjan (IEG)
Manas Sharma (IIPHG)
ABSTRACT
The National Health Policy 2017 recommended the establishment of Health and Wellness
Centres (HWC) as the primary platform to deliver comprehensive primary health care in India
and emphasised that about two-thirds of the health budget of the government should be invested
on primary care. In February 2018, the government announced its plan to create 1,50,000
HWCs under the Ayushman Bharat initiative by transforming the already existing Sub Centres
(SCs), Primary Health Centres (PHCs) and Urban PHCs (UPHCs) as HWCs by 2022. The
operationalisation of HWC has been planned in a phased manner. However, for scaling up and
replicability, it is imperative for the government to know how much to budget for this initiative,
so that there are no interruptions in the smooth flow of services.
Taking Gujarat as a case study, the study took a sample of eight HWCs one of each kind from
two districts for estimating the total and per-unit costs for each type of HWC using OPD
footfalls as an indicator for measuring output, estimated the incremental unit costs – the
difference between the pre- and post-conversion unit costs - to understand the cost implications
of the conversion, and estimated the possible total costs in relation to the health budget of the
state to understand the financial implication of scaling up HWCs.
The results indicated that though the costs have gone up after conversion, OPD footfalls have
also increased at all facilities, but most significantly for the SCs, resulting in costs per OPD
footfalls coming down significantly. For nearly all the centres, there has been a fall in the
incremental costs indicating that the conversion to HWC been quite economical.
It was estimated that a total of about INR 713 crores will be spent on running 1500 HWCs in
the year 2020-21; however, the incremental costs of scaling up would be significantly less at
about INR 93 crores, with the lowest incremental costs for SCs.
More research with additional data points would be required to confirm these tentative findings,
but the results could be used as a baseline for future such studies.
COSTING OF HEALTH AND WELLNESS CENTRES
A CASE STUDY OF GUJARAT

2
ACKNOWLEDGEMENT
The authors would like to thank ACCESS HEALTH for financially supporting this research.
The comments and suggestions received during early discussions, and in particular from
Maulik Chokshi and Tushar Mokashi are acknowledged with thanks.
The administrative and infrastructure support lent by the Institute of Economic Growth, Delhi
and the Indian Institute of Public Health, Gandhinagar, are sincerely acknowledged.
The authors are grateful to Shri Jaiprakash Shivahare, Commissioner of Health, Gujarat for
granting the team permission to conduct the study in Gujarat. The authors would also like to
acknowledge the officials in the HWC Cell, Gujarat and officials at the state, district and block
level health offices for facilitating data collection. Finally, the authors would like to thank the
officials at each of the health facilities for their unwavering support in providing data.

3
1 INTRODUCTION
The Report of the Task Force on Comprehensive Primary Health Rollout, Ministry of Health
and Family Welfare (MoHFW, 2015) stated that primary health care is the only affordable and
effective path for India to Universal Health Coverage (UHC). The National Health Policy 2017
recommended the establishment of Health and Wellness Centres (HWC) as the primary
platform to deliver comprehensive primary health care in India and also emphasised that about
two-thirds of the health budget of the government should be invested on primary care.
Since then, HWCs under Ayushman Bharat have been the focus of government policy to
strengthen primary care in the country. HWCs are envisaged to deliver Comprehensive Primary
Health Care (CPHC), with a broad range of services that go beyond maternal and child health
care to include care for non-communicable diseases, palliative and rehabilitative care, oral, eye,
ENT care, mental health and first-level care for emergencies and trauma, including free
essential drugs and diagnostic services (MoHFW, 2018).
To deliver CPHC through HWCs, the government envisioned a paradigm shift at all levels of
the health system, shown in the diagram below.
Figure 1: Ensuring Comprehensive Primary Health Care through HWC
Source: Operational guidelines for CPHC through HWC, MoHFW, 2018
In February 2018, the government announced its plan to create 1,50,000 HWCs by
transforming the already existing Sub Centres (SCs), Primary Health Centres (PHCs) and

4
Urban PHCs (UPHCs) as HWCs by 2022. In metropolitan cities, some PHCs being managed
by the Municipal Corporation, called Corporation Urban PHCs (CUPHCs) were also proposed
to be converted to HWCs. It was also proposed that such care could additionally be provided/
complemented through outreach services, Mobile Medical Units (MMUs), camps, and home-
based as well as community-based care.
The operationalisation of HWCs has been planned in a phased manner till the year 2022; as of
25th September 2020, a total of 45,895 HWCs have been established, consisting of 24,963 SCs,
17,324 PHCs and 3,608 UPHCs (MoHFW National Health Portal).
At the Centre, the National Health Mission (NHM) is administratively responsible for looking
after the activities of the HWCs. For each state, the state HWC Cell is the key body responsible
for conversion of the health centres to HWCs.
The expanded range of services at HWCs comprise a comprehensive and exhaustive list but
has been planned in an incremental manner and comprise the following:
Care in pregnancy and childbirth.
Neonatal and infant health care services
Childhood and adolescent health care services.
Family planning, Contraceptive services and Other Reproductive Health Care services
Management of Communicable diseases: National Health Programmes
Management of Common Communicable Diseases and General Out-patient care for
acute simple illnesses and minor ailments
Screening, Prevention, Control and Management of Non-Communicable diseases and
chronic communicable diseases like TB and Leprosy
Basic Oral health care
Care for Common Ophthalmic and ENT problems
Elderly and Palliative health care services
Emergency Medical Services
Screening and Basic management of Mental health ailment
However, as a first step, screening, prevention, control and management of non-communicable
diseases and chronic communicable diseases like tuberculosis and leprosy has been introduced
at HWCs. Although significant progress has already been made with respect to the HWCs

5
operationalisation, some proposed activities like mental health are in the process of
implementation.
The aim of the expanded services is to provide medical facilities closer to people and to provide
diagnostic services and essential medicines free of cost at the centres. This will facilitate last-
mile connectivity, especially for the most disadvantaged and vulnerable populations. A
continuum of care approach will be ensured at the HWCs by establishing a network of referral
and back-referral linkages.
A Community Health Officer (CHO) placed at SC level AB-HWCs will facilitate the efforts
of the primary healthcare team. The CHO is a B.Sc. / GNM Nurse or a qualified Ayurveda
Practitioner, who additionally also undergoes training for six months in a Certificate Course in
Community Health (CCCH). The CHO will lead the team comprising of frontline workers
(MPHWs & ASHAs).
Performance Linked Payments (PLPs) have been introduced to ensure the efforts of the Primary
Health Care team at SC level AB-HWCs, in terms of providing outreach services, population-
based screening and service delivery. This is aimed towards improved health outcomes. PLPs
have been built for the primary healthcare team for rewarding the hard work and to encourage
and motivate the team including ASHAs (Accredited Social Health Activists – the world’s
largest health volunteer workforce) to perform better.
The operationalisation of HWC has been planned in a phased manner. However, for scaling up
and replicability, it is imperative for the government to know how much to budget for this
initiative, so that there are no interruptions in the smooth flow of services. Before this study,
there has not been a comprehensive economic costing of the HWCs that take into account the
different conversion approaches, based on the initial condition of primary care services.
This research aimed to estimate the recurrent and incremental costs of running HWCs across
different models of conversion in the state of Gujarat.
OBJECTIVES AND RATIONALE
a. Literature review of functional models of primary care globally with a focus on costs
b. Analyse the different HWC types functioning in the state of Gujarat based on a sample
of HWCs

6
c. Estimate the total and per-unit costs for each type of HWC, using a suitable indicator
for measuring output, and analyse the differences across types of HWC, for pre-
conversion and post-conversion costs
d. Estimate the incremental unit costs – the difference between the pre- and post-
conversion unit costs to understand the cost implications of the conversion
e. Based on the results, indicate an estimate of total costs of scaling up HWCs in the state
of Gujarat
Gujarat has been implementing various reproductive, maternal, neonatal, child, and adolescent
health (RMNCH+A) programmes along with a focus on prevention and control of non-
communicable diseases, mental health problems and malnutrition. Gujarat has also been a
front- runner in the response to the Government of India’s announcement to create HWCs by
transforming existing primary health care facilities in urban and rural areas. Thus, the state has
undertaken upgradation of building and facilities of existing SCs and PHCs in rural areas, and
UPHCs in urban areas, and initiated training of Mid-Level Healthcare Providers (MLHP), also
known as community health officers (CHO). Thus, it was deemed appropriate to take Gujarat
as a case study for the costing exercise.
As of 2020, the state has an infrastructure of 11,114 primary health care facilities across its 33
districts. This includes 1475 PHCs and 9231 SCs in rural areas, 198 UPHCs across 159
Nagarpalikas in towns, and 210 CUPHCs in eight municipal corporations in big cities
(Government of Gujarat).
As per the approved plans for Gujarat, nearly all PHCs and CUPHCs, and half of the SCs and
UPHCs are proposed to be converted into HWCs by the end of 2021. It is important to note
that 1475 SCs are located on the premises of their PHCs and need not be separately converted
as HWCs. Therefore, while all SCs are planned to be converted, the ones located within a PHC
are not separately included in the number. Excluding these, the number of SCs is 7756. Of
these, around two-thirds are planned to be converted during 2018-2021.
At the time of this research, all phase-1 and most of the phase-2 HWCs are operational with a
filled position of a community health officer (CHO).
Based on the 2019 MoHFW report Ayushman Bharat Health and Wellness Centres (MoHFW,
2019b) on HWCs, it is evident that compared to most large states, Gujarat has a higher number
of operational HWCs, higher footfalls at HWCs, and more yoga/wellness sessions conducted.

7
Thus, it was decided that given an overall functional health care system and substantial focus
on primary care as well as progress made on HWC, Gujarat would make a suitable case study
for the costing exercise.
2 COSTS OF INTEGRATED PRIMARY CARE: EVIDENCE FROM LITERATURE REVIEW
One of the first costing studies in Africa is from Burkina Faso in 1999 (Mugisha, Kouyate,
Dong and Sauerborn, 2002). The objective of the study was to estimate sector-wide disease-
specific cost of health care interventions at primary health facilities in Nouna, in rural Burkina
Faso. The collected data was categorised as recurrent expenditure (drugs, salaries and
maintenance), resource consumption data (staff time, drugs, and building space) and
equipment, disease data, and also by distribution of costs by source. Costs were estimated using
a step-down cost accounting procedure which was based on observation of the facility’s
production processes to be able to associate costs to specific outputs. The study found that staff
resources accounted for 32% of the annual costs, equipment for 25%, recurrent revenues for
39% and building costs for 4% of the total annual costs.
A costing study from Pakistan (Green, Ali, Naeem and Vassall, 2001) with the objective of
estimating the cost per OP visit to Basic Health Units (BHU) in the province of Khyber
Pukhtonkhwa and Federally Administered Tribal Areas of Pakistan was conducted for the year
2005-06. Costs were reported in two formats: as a list of costs broken down into different
components such as salaries, medicines and maintenance etc., and also per capita costs. A
selection of BHUs was taken across districts in the study region and for each unit, expenditures
were taken from the district health office for salaries, equipment, furniture, medicines and other
supplies, and utility bills, and these were then split into total costs and recurring costs.
Recurring cost included all costs except building, equipment, furniture and major repairs. The
study reported that staff salaries and building cost were the two major cost components of the
total costs, constituting 52% and 28% of the mean total cost respectively. Additionally, looking
at just the recurrent cost, staff salaries constituted 90% of the mean recurring cost across
centres. The investigators looked at previous costing studies in Pakistan and concluded that the
share of salaries in the total cost of a BHU had increased from 86% to 90% from 1995 to 2006.
They used these results to draw certain conclusions about the cost efficiency of the health
centres.
A study from Indonesia (Abdullah, Hort, Abidin and Amin, 2012) aimed to develop a simple
and transparent costing tool that would enable health planners to calculate the unit costs of

8
providing basic health services. Based in the Aceh province, the approach used a normative
costing approach that estimated costs on the basis of the activities and inputs that were
considered to be required to achieve performance outputs, enabling a clear linkage between
costs and outputs. The costing model was developed in phases from 2007 to 2010 during which
data and information was sought from programme managers and health officials at various
levels of the government, and also from the staff of the health facilities. The model was tested
at various stages to verify the extent to which the activities matched actual programmes and
the quality of data available, and then refined to be made as accurate as possible. The results
indicated that the unit costs of providing basic health services derived from this costing model
were relatively similar to findings from other studies.
Two more recent studies that depict different costing models are a 2016 study in Ghana and
another one in Haiti in the same year.
The objective of the first study (Dalaba, Welaga and Matsubara, 2017) was to estimate the cost
of providing health care in PHC facilities such as Health Centres (HCs) and Community-based
Health Planning and Services (CHPS) in Ghana. The cost heads included were personnel costs,
administrative costs (or overheads), medicine and consumables costs, equipment costs and
vehicle costs. Building costs were not included due to lack of reliable data on these costs. The
study collected data for the calendar year 2015 across 9 facilities, and found that personnel
costs accounted for the largest proportion of the total annual cost for both types of facilities –
75% for CHPS and 64% for HC. Medicines and consumables accounted for 15% of the total
costs at CHPS and 25% of the total cost at HC. Additionally, by estimating the total cost of
running the primary health facility during a one-year period the study was also able to estimate
the unit cost per OPD visit (total cost divided by total OPD attendance) and the unit cost per
capita (total cost divided by total population covered by the facility).
The objective of the Haiti study (McBain et al., 2018) was to implement a costing analysis in
five out-patient departments of healthcare facilities in Haiti, in order to provide a basis for a
cost-effectiveness analysis. The study used a time-driven activity-based costing approach
which takes the patient, not a clinical department, as the unit of analysis. Data was collected
during 2014-15 on patient characteristics, patient arrival time, patient wait time, patient
consultation time, primary diagnosis, medicines prescribed, and laboratories ordered time
stamps for consultation times. To estimate the cost of the selected outpatient services, the
capacity cost rate for each type of resource, personnel, equipment and space used during a

9
health-care visit, was calculated by dividing the annual cost of each resource by the total
number of minutes that the resource could be used per year. To obtain the total cost of care for
a patient, the reported minutes for each resource used was multiplied with its associated
calculated capacity cost rate and presented as a total sum of the patient visit. The study found
that the cost of care for the same conditions varied widely across the five facilities, due to
heterogeneity in staffing and resources. Comparing the findings across facilities led to insights
on good and bad practices followed at the different facilities and allowed the investigators to
suggest alternative best practices as well a clear understanding of managing and allocating
resources.
In India, studies on costing of primary care are few.
One of the first costing studies in India was to estimate the distribution of costs incurred in a
Primary Health Centre in Chhainsa, Haryana (Anand, Pandav, Kapoor, Kumar and Nath,
1995). The study calculated the total costs incurred in running the PHC for one year and then
apportioned those costs under different activity heads on the basis of time and space utilisation.
Capital and recurrent costs were calculated separately; with the land, building, equipment with
a life of more than a year, furniture and vehicle costs being taken as capital expenditure, and
salaries, drugs and consumable equipment, and maintenance costs being a recurrent
expenditure. The study calculated costs for the financial year 1991-92 and found that salaries
were 62% of the total annual cost, drugs and supplies were 14% and capital costs were 21% of
the annual cost.
Another study to assess the total annual and per capita cost of delivering the package of health
services at the PHC and CHC level was conducted across a number of facilities in three North
Indian states – Haryana, Punjab and Himachal Pradesh (Prinja et al., 2016). This study used a
bottom-up costing method for the collection of data on all resources spent on the delivery of
health services in the selected health facilities. For the FY 2012-13, the capital resources
identified comprised building, equipment and other non-consumables which lasted for a period
of more than one year. Trainings which were not likely to be repeated within a one-year period
were also treated as capital costs. Recurrent costs comprised staff salaries, drugs, consumables
and overheads such as water, electricity bills etc, as well as incentives paid under various health
schemes and other annual maintenance grants. The study found that on an average for a PHC,
human resources accounted for 53% of the total annual cost, drugs and consumables for 22%,
and the remaining were split between capital costs and maintenance costs. Similarly, on an

10
average for a CHC, human resources accounted for 59% of the total annual cost, drugs and
consumables for 11%, and government scheme fund accounted for 10% of the annual costs.
Building costs, lab expenses, overheads, equipment and furniture, stationery and IEC costs,
and cash benefits together accounted for the remaining 20%. The study also went on to estimate
unit costs per service for each type of service provided at the facilities.
3 METHODOLOGY AND DATA
A. APPROACH TO COSTING
Approaches to estimating costs in healthcare have been broadly categorised into two
categories: top-down and bottom-up. The top-down or standard costing approach calculates
the total health care expenditure of a health facility in terms of both capital and recurrent costs
and divides it by a measure of total services provided by the facility, to determine a cost per
patient. The bottom-up or micro-costing approach requires all of the resources that are used by
individual patients to be identified. This type of costing requires comprehensive knowledge of
the treatment and services provided to individual patients. This includes the value of drugs and
supplies used in treating the patient, physician or nursing costs for the patient, cost of
equipment used by the patient, and cost of infrastructure and maintenance as a function of each
patient. While micro-costing is more accurate, it also is more expensive and time-consuming.
It is possible to combine the two approaches to come up with a healthcare costing plan that is
optimal for the situation.
Currently, the estimated costs used for allocation of resources in India generally follow line-
item based budgeting: in other words, the usual budget lines of personnel, equipment, drugs
etc. required for converting to HWCs are being costed by department and funds allocated. It is
possible in this structure to miss other costs which can be elicited only by understanding how
each type of HWC functions and using an approach based on functional categories. This, for
example, would allow the inclusion of shared costs including costs of drugs and medicines that
are being drawn from other government programmes.
Economic costing differs from financial costing in three main ways: (a) inclusion of costs of
the goods/services whose price do not correctly reflect their value if used elsewhere, (b)
inclusion of the value of gifts and donations and (c) suitable discount rate for annualising
capital costs. In addition, economists also include shared costs, comprising of costs of

11
personnel, consumables and equipment used that come from sources other than the main
programme being analysed, for instance, physicians whose salaries are being charged to other
projects but give some of their time to the programme as well.
However, in the case of HWC, none of the three main concerns is critical; since the costing is
done from a programmatic point of view and not from a societal perspective, the shadow prices
are not being used in any case. Secondly, there have been no gifts and donations involved in
the HWC initiative. Finally, since the transition to HWC has been from existing primary care
facilities, there has not been any significant capital costs involved except the initial start-up
costs that are quite nominal. However, the most important methodological addition has been
to include costs of resources used that come from outside the HWC programme but help in
running of the HWCs. Thus, the recurrent costs of running the HWC becomes more relevant
in this context. This will be discussed in more detail in the following section.
B. TOTAL RECURRENT COSTS, UNIT COSTS AND INCREMENTAL COSTS
While the aim was to do economic costing including capital costs, operationally, the capital
costs involved in the HWC conversion were marginal and did not require calculations of
present values. Thus, the estimated costs are the recurrent costs of running HWCs.
The aim was to compare pre-conversion and post-conversion cost data for each of the HWCs.
This required one full year of cost data for each of these two phases and a suitable indicator for
measuring performance of the facility.
The performance indicator data is available from the HMIS as well as the HWC portal. While
a lot of detailed data on various indicators like screening, diagnosis and treatment for a number
of conditions like hypertension, breast cancer, diabetes, oral cancer etc. could have been
extracted, the analysis of costs required one summary measure that would reflect the overall
performance of the facility. Thus, after much deliberation, it was decided to use OPD
attendance data or total OPD visits from the HMIS as the denominator to total costs, to obtain
unit cost data.
The incremental unit costs were estimated as the difference between the unit costs post-
conversion and pre-conversion.
Incremental unit costs of conversion= (TCpost/OPDpost) – (TCpre/OPDpre), where

12
TCpost, TCpre are total costs, and OPDpost, OPDpre are total OPD visits, for pre- and post-
conversion respectively.
Keeping this in mind, the following methodology and data collection steps were followed.
C. STUDY SITES AND SAMPLE SELECTION
As described earlier, in the first phase of the conversion of existing facilities into HWCs, 1,656
facilities were selected for transformation during 2018-19. The sample sites were selected from
these phase-1 facilities to ensure a full year of data before and after the operationalisation of
the HWCs. For the data collection purpose, eight HWCs were decided to be selected, one of
each kind, from two districts. This ensured representation of all four types of facilities, a
comparison across the districts, and ease of data collection. The criterion of having all four
types of HWCs in a district resulted in the selection of Gandhinagar and Rajkot districts, as
only those two districts could fulfil the requirement. Therefore, the sample sites were selected
from these districts.
To ensure logistical feasibility of collecting a range of data from one taluka/block health office,
it was decided to select rural sites of SC and PHC, and UPHC belonging to the same sub-
district unit i.e. taluka level in both the districts. Therefore, Gondal and Kalol blocks of Rajkot
and Gandhinagar were selected, respectively. Similarly, the selection of the SC was also from
the sampled PHC for the ease of data collection and based on the post of community health
officer being filled at the selected SC. The most functional CUPHC that was converted into
HWC in the first phase was selected from the district headquarter of both the districts. The site
selection process was carried out in consultation with the district health officials.
The details of the selected sites are given in the Table 1 below:
The costs cover three financial years 2017-18, 2018-19 and 2019-20 since different facilities
have different dates of conversion to HWC. Expenditure data of three financial years i.e. 2017-
18, 2018-19, and 2019-20 was collected. Annual costs were estimated by taking the date of
conversion for each centre and calculating expenditure at each centre for one year before, and
one year after this date of conversion. Wherever expenditure was monthly – such as staff
salaries – monthly data was used, and for items like drugs or vehicle costs, annuals costs were
totalled and averaged to calculate expenditure for the appropriate number of months for every
centre. This enabled the comparison of annual costs before the operationalisation (TCpre) and

13
after the operationalisation of the HWCs (TCpost). Capital costs being negligible, the recurrent
costs of HWCs were estimated.
Table 1: Conversion year and population covered by the selected sites
District Gandhinagar Rajkot
Type SC PHC UPHC CUPHC SC PHC UPHC CUPHC
Name Balva Soja Kalol Sector-2 Daliya Moviya Gondal NanaMauva
Conversion
(Month-
Year)
Mar-19 Nov-
18
Nov-
18
Aug-18 Mar-
19
Aug-18 Nov-18 Nov-18
Population 10265 38085 63413 64000 3265 30602 55647 180000
Source: Authors’ creation based on the data received from the HWC Cell, Gujarat and officials of the
respective facilities
4 ANALYSIS
A. TOTAL COSTS AND TOTAL COST PER CATCHMENT POPULATION
Total costs of each of the 8 centres are given in Table 2 below.
The first result is that the total costs differ widely even within a category: apart from the two
PHCs, where costs seem quite similar, in other cases, the costs differ significantly for each type
of facility. For instance, total cost for Daliya is half of that of Balva, but both are SCs. As will
be explained later, such difference in cost is largely because of the difference in catchment
population i.e. the size of the targeted area and number of beneficiaries to be covered.
It was also found that across districts and for all types of centres, the costs have gone up after
conversion to HWC. The maximum increase has been in the SCs in both the districts – with a
35 percent increase in Balva in Gandhinagar and a 45 percent increase in Daliya. The least
increase has been in the PHCs.
Rajkot district has seen a higher increase in costs as compared to Gandhinagar district for all
the types of centres except for the PHC.
Comparing the urban centres, there was a one-tenth increase in both the urban PHCs of
Gandhinagar, i.e. Kalol UPHC and Sector-2 CUPHC. On the other hand, both the urban PHCs

14
of Rajkot saw slightly more than one-fifth the increase with a 22 percent and 21 percent
increase in Gondal UPHC and Nana Mauva CUPHC respectively.
Table 2: Total Costs of the Centres: Pre and Post HWC (In INR)
Name of the HWC,
District Pre-HWC Costs Post-HWC Costs
Increase
(%)
Balva SC, GN 18,15,676 24,51,778 35
Daliya SC, RJ 8,89,542 12,89,710 45
Soja PHC, GN 1,04,26,575 1,14,03,214 9.4
Moviya PHC, RJ 1,12,88,805 1,20,25,011 6.5
Kalol UPHC, GN 57,94,576 63,86,146 10.2
Gondal UPHC, RJ 25,45,008 30,98,848 21.8
Sector 2 CUPHC, GN 58,93,440 64,66,320 9.7
Nana Mauva CUPHC, RJ 73,27,035 88,71,772 21.1
B. TOTAL OPD VISITS
As discussed in the methodology, to arrive at unit costs, the selected indicator is total OPD
visits, which would indicate the footfalls in the facility. Figure 2 shows the total OPD visits
for the two relevant years for each of the facilities.
1656 1000
12995
19145
10779 10186
16516
50072
4071 3825
16056 1968015081
12352
18578
50208
0
10000
20000
30000
40000
50000
60000
BalvaSC_GN
DaliyaSC_RJ
SojaPHC_GN
MoviyaPHC_RJ
KalolUPHC_GN
GondalUPHC_RJ
Sector 2CUPHC_GN
NanaMauvaCUPHC_RJ
Figure 2 :Total OPD Visits (Allopathic+AYUSH): Pre and Post-HWC
Pre-HWC Visits Post-HWC Visits

15
OPD visits differed significantly across the different facilities, with SCs witnessing the lowest
OPD visits. As can be seen from the figure below, the visits were largely comparable at both
SCs, PHCs and UPHCs. Only at the two CUPHCS, the number of visits differed to quite a large
extent at Nana Mauva and Sector-2.
However, the point of interest is to see whether the footfalls increased post conversion, and it
does seem as though it did for all the facilities but especially for the SCs. This is because the
position of a CHO was created with the intention of giving a boost to OPD where previously
regular OPD services could not be availed.
C. COSTS PER CATCHMENT POPULATION AND PER OPD VISITS
The total costs vary depending on the patient load and population of areas, so it is more useful
to look at costs per catchment population as well as per OPD visits. The catchment population
is the theoretical maximum in terms of number of people who can visit a HWC facility.
However, there is less than one-to-one correspondence between the two variables: while the
catchment population is total number of people living in a particular area, the OPD visits are
visits and not people. Thus, if OPD visits are 100, one cannot assume that 100 people visited
the facility, because one person may have visited the facility multiple times. Nevertheless,
since these facilities are mainly addressing primary care, it is possible that OPD visits closely
mirror total individual visits.
In Table 3, we present both these variables to see if any patterns are discernible.
Table 3: Total cost per catchment population and per OPD footfalls pre and post
HWC for all centres
Centre Total cost/catchment
population
Total cost/OPD footfalls
Pre
HWC
Post
HWC
Change
(%)
Pre
HWC
Post
HWC
Change
(%)
Balva SC 177 239 35% 1096 602 -45%
Daliya SC 272 395 45% 890 337 -62%
Soja PHC 274 299 9% 802 710 -11%
Moviya PHC 369 393 7% 590 611 4%
Kalol UPHC 91 101 10% 538 423 -21%
Gondal UPHC 46 56 22% 250 251 0%
Sector 2 CUPHC 92 101 10% 357 348 -2%
Nana Mauva CUPHC 41 49 21% 146 177 21%

16
What can be immediately gleaned from this table is that while cost per catchment population
has gone up for all the facilities post-conversion, costs per OPD footfalls has actually come
down significantly. This is especially true of the SCs. The only increase in costs per OPD
footfalls is for the CUPHC at Nana Mauva. So, while at the SCs, there has been the most
activities like expansion of HR and services, the additional footfalls still end up lowering the
costs.
From this table, one can plot the incremental costs per OPD visit, which is essentially
incremental costs divided by incremental OPD visits. These are shown in Figure 3.
The figure shows that in most cases, there has been a fall in the incremental costs indicating
that the conversion to HWC has actually been quite economical. The exceptions are Moviya
PHC, Gondal UPHC and Nana Mauva CUPHC, where the incremental costs have increased,
but the increase have been very nominal.
For the two SCs, the incremental costs are significantly lower indicating possibly significant
gains in the conversion of the SCs to HWC.
Another takeaway is that we can observe that increase in patients indicate that Rajkot CUPHC,
UPHC and PHC resulted in lower per OPD patient cost compared to their counterparts in
Gandhinagar. Now, when a new service is added, there is increase in cost but number of OPD
footfalls are not increasing in the same proportion as they were already working close to the
maximum capacity, all else remaining the same. The PHC at Moviya is an exception in terms
of extra activities such as a herbal garden, and quality accreditation efforts may have resulted
-494
-553
-92
21
-114
1
-9
30
-600
-500
-400
-300
-200
-100
0
100
Figure 3: Incremental costs per visit

17
in increase in cost and not the HWC conversion itself. So, the inference on the incremental cost
increase of Rajkot based facilities except SC may be looked at with some caution.
D. SHARE OF THE COMPONENTS
Figure 4 presents the shares of different components in total costs for the pre- and post-
conversion periods. The components are (a) human resources, (b) drugs, vaccines &
consumables, (c) infrastructure, (d) outreach & training, and (e) miscellaneous.
The main component was human resources for all the centres. Human resources consisted of
staff salaries, staff incentives and fees paid to consultants, though staff salaries comprised the
most significant portion. The share of human resources in the total share of the cost was highest
for the SCs, coming to about 85-88 percent for both Daliya and Balva. The share of human
resources was the least for the UPHCs, comprising about 58-60 percent for both Gondal and
Sector-2.
The share of drugs, vaccines and consumables was at a much lower second place for all the
facilities, being between 11 and 26 percent.
The most important result was that there was hardly any change in the shares of these
components before and after conversion as can be seen from Figure 4.
85 88 84 85 80 83 79 8071 72
57 58 58 6068 68
13 10 12 1111 10 11 10
14 15
1722 26 25
22 22
2 2 4 4 7 6 9 95 7
1310
10 10 6 633
4 5 3 4 1 12 1 1 1 7 3 9 53 1 3 3
0%
20%
40%
60%
80%
100%
Pre
-HW
C
Post
-HW
C
Pre
-HW
C
Post
-HW
C
Pre
-HW
C
Post
-HW
C
Pre
-HW
C
Post
-HW
C
Pre
-HW
C
Post
-HW
C
Pre
-HW
C
Po
st-H
WC
Pre
-HW
C
Post
-HW
C
Pre
-HW
C
Post
-HW
C
Balva SC Daliya SC Soja PHC Moviya PHC Kalol UPHC1
GondalUPHC 1
Sector 2CUPHC
Nana MauvaCUPHC
Figure 4: Shares of major expenditure items across Centres- Pre and Post
HWC (%)
Human resource Drugs, vaccines and consumables Infrastructure Outreach & training Misc

18
In terms of categories that contributed to the increase in costs, human resources were the main
cost drivers for the SCs and PHCs.
For the UPHCs and CUPHCs, increase in total costs of drugs, vaccines and consumables
contributed significantly as well to the total cost increase (between 33 and 42 percent for all
except 15 percent for Sector 2 CUPHC).
Looking deeper, items in this category were classified by the team into three sub-categories:
drugs, vaccines, and consumables. The drugs were then further categorised into the various
types of drugs based on what they were used to treat – Non-Communicable Diseases (NCD)
drugs, Communicable Diseases (CD) drugs, analgesic drugs, respiratory drugs, gastrointestinal
drugs, TB drugs, antimalarial drugs, nutritional supplements, and miscellaneous drugs.
Miscellaneous drugs were those that could not be categorised into any of the above, and also
those drugs that were locally purchased and for which a break-up could not be obtained.
Additionally, portions of untied funds from routine NHM grants were also used for purchasing
of drugs and were included as another separate sub-category.
Across the 8 centres, drugs accounted for almost 50 percent of the cost-share out of the three
sub-categories, both pre- and post-conversion to HWC. Vaccines were a close second over one-
third of expenses in this component, and consumables accounted for 16 percent of the cost pre-
conversion and 12 percent post-conversion.
Figures 5a and 5b show the share of components, pre and post-conversion to HWC,
respectively.
46%
16%
37%
Figure 5a: Share of components
pre-HWC
Drugs Consumables Vaccines
50%
12%
38%
Figure 5b: Share of components
post-HWC
Drugs Consumables Vaccines

19
Table 4 gives the monetary value of expenditure on drugs, consumables and vaccines in the
pre and post HWC periods, across all centres.
Table 4: Expenditure (in INR) on drugs, consumables and vaccines across centres,
pre and post-HWC
Component Pre-HWC Post-HWC Increase/Decrease (%)
Drugs 31,21,460 39,92,972 27.9
Consumables 11,01,457 10,00,902 -9.1
Vaccines 24,97,365 30,32,761 21.4
Total 67,20,281 80,26,635 19.4
Overall, between the two periods, expenditure on drugs increased by 28 percent followed by
vaccines at 21 percent. There was a decline in the expenditure on consumables between pre-
and post-conversion period by about 9 percent.
Figure 6 below shows the share of the cost of each component among drugs, pre- and post-
conversion. Drugs for communicable diseases was the highest among all categories. Further
inference is difficult because the value of drugs purchased is supply-driven and not based on
demand, and would not reflect purchases based on disease burden. To reach any conclusion
about what drives the values of drugs, one will have to look at trends in drug supply and
changes in drug prices over several years. The possibility that communicable diseases are still
an important source of disease burden resulting in greater demand on drugs related to these
diseases cannot be ruled, if one considers the significant increase post-conversion of CD and
TB drugs, which could be due to easing up of suppressed demand after the conversions to
HWCs.
12%
2%
36%
4%10%
4%
15%9% 6% 3%
16%
2%
41%
6% 5% 4%10% 7% 7%
2%
0%
10%
20%
30%
40%
50%
Figure 6: Share of drugs across sub-categories
Pre and Post-conversion
Pre-HWC Post-HWC

20
The most amount was spent on CD drugs (36% pre-conversion and 41% post-conversion).
Analgesic drugs accounted for 12% of the share of cost pre-conversion and 16% post-
conversion. Most of the increase in drugs expenditures took place in these two groups post the
conversion. Miscellaneous drugs and nutritional supplements saw a slight decline.
Figure 7 shows the percentage change in the cost share of each component among consumables,
pre- and post-conversion. It can be seen that only antimalarials and topical applications saw an
increase in share post-conversion, in addition to IV fluids and TB supplies. All other
components saw a decrease.
5 SCALING UP AND CENTRE-STATE SHARE IN COSTS OF RUNNING HWCS
From a policy perspective, it is important to assess how much the HWC initiative is going to
cost the exchequer and what additional burden will be placed on the health budget of the state.
The HWC model runs along the lines of NHM in terms of centre-state financing. For Gujarat,
this means that the centre’s share will be 60 percent and the state will bear 40 percent of the
total costs
Figure 8 gives the percentage share of the centre and state governments of the total expenses
on facilities. Despite the 40-60 share of NHM funds between states and the centre,
operationally, the states end up spending more than 60% on total costs especially for rural
26%
2%
23%
8%
3%5% 7%
2%
23%
30%
1%
21%
4% 5% 6% 5% 3%
24%
0%
10%
20%
30%
40%
Figure 7: Share of consumables across sub-categories
Pre and Post-conversion
Pre-HWC Post-HWC

21
HWCs.
The shares are somewhat lower for the urban HWCs. In terms of scaling up, therefore, these
shares would be important and will indicate how much of the total expenditure on HWCs the
Gujarat state will have to bear.
In all, a total of about INR 713 crores will be spent on running 1500 HWCs in the year 2020-
21; However, the incremental costs of scaling up would be significantly less at about INR 93
crores. The incremental costs are the most relevant information for the state government
because it indicates the additional budgetary requirements. With target of 1000 SCs to be
converted in 2020-21, the total cost of running these converted SCs would be considerably
lower at INR 187 crores, compared to INR 472 crores for running 403 converted PHCs (Table
5, below), and the incremental costs would be much lower at INR 52 and 35 respectively. The
incremental costs are lowest for CUPHC, followed by UPHC, PHC and SC respectively.
Table 5: Costs of scaling up, total and marginal (INR crores)
Type of HWC Target HWC by
2020-21
Total cost
(Average cost per
type*target number)
Incremental cost
(Incremental cost per
type*target number)
SC 1000 187 52
PHC 403 472 35
UPHC 69 33 4
CUPHC 28 21 3
All/Total 1500 713 94
23 26 3222 26 25
52 45 48 47 46 48
77 74 6878 74 75
48 55 52 53 54 52
2 0 1 7 -1 8 2 0 1 8 -1 9 2 0 1 9 -2 0 2 0 1 7 -1 8 2 0 1 8 -1 9 2 0 1 9 -2 0 2 0 1 7 -1 8 2 0 1 8 -1 9 2 0 1 9 -2 0 2 0 1 7 -1 8 2 0 1 8 -1 9 2 0 1 9 -2 0
S C P H C UP H C C UP H C
R UR AL UR B AN
Figure 8: Share of Centre and State Governments in the
Expenditure of HWC's (% ) across type of facil it i es
Centre State

22
In 2018-19, the health expenditure of the Department of Health and Family Welfare in Gujarat
was INR 8,34,182 lakhs, and the revised estimate for the 2020-21 budget was INR 9,03,741
lakhs. Based on the revised estimate, the total and incremental expenditure on HWC would be
around 7.9% and 1% of the revised estimate for 2020-21, respectively. The additional
allocation of 1% of total budget of the department towards HWC expansion seems a very
reasonable allocation.
6 SUMMARY AND RECOMMENDATIONS
This research was undertaken essentially to understand the financial implications of the HWC
initiative and scaling up the initiative for integrated primary care through the expansion of
HWCs in India. The effort was also to understand whether the costs of running the HWCs
differed across the type of conversion.
The results are comparable to the study on India reviewed before. The Prinja et al (2016) study
indicated that the average total cost per PHC in 2012-13 is INR 88,00,000. This is in line with
the average total cost per PHC (post-conversion) in our study of INR 1,17,14,113, accounting
for inflation. On comparing costs in USD, the Prinja study total cost is USD 162,092 and this
study gives a cost of USD 159,952, and the difference is likely due to a change in exchange
rate. Comparing costs in USD, the Prinja study indicates a cost per catchment population of
USD 3.14, which compares well with the present study cost of USD 4.72.
The results indicated that in terms of total costs, PHC-converted HWCs were most costly to
run, followed by CUPHC-converted facilities. SC-converted HWCs were the least expensive,
which were presumably under-utilised before the conversions, and saw increasing OPD
footfalls with the conversion to HWC. Thus, while the incremental cost per catchment
population seemed moderately high, deflating with total OPD footfalls changes the picture
significantly: in terms of incremental costs per OPD visit, the HWC initiative seems quite
economical. Of the 8 facilities studied, this cost was negative for 5, and only marginally
positive for the other three. For the SC-converted HWCs, the incremental costs were most
negative, indicating the success of the HWC initiative for the SCs.
In Gujarat, the NCD Programme, which includes NCD screening and regular treatment of
patients with conditions like diabetes and hypertension has been operational up to the level of
PHC, even before the launch of the HWC programme. This could explain why the data does
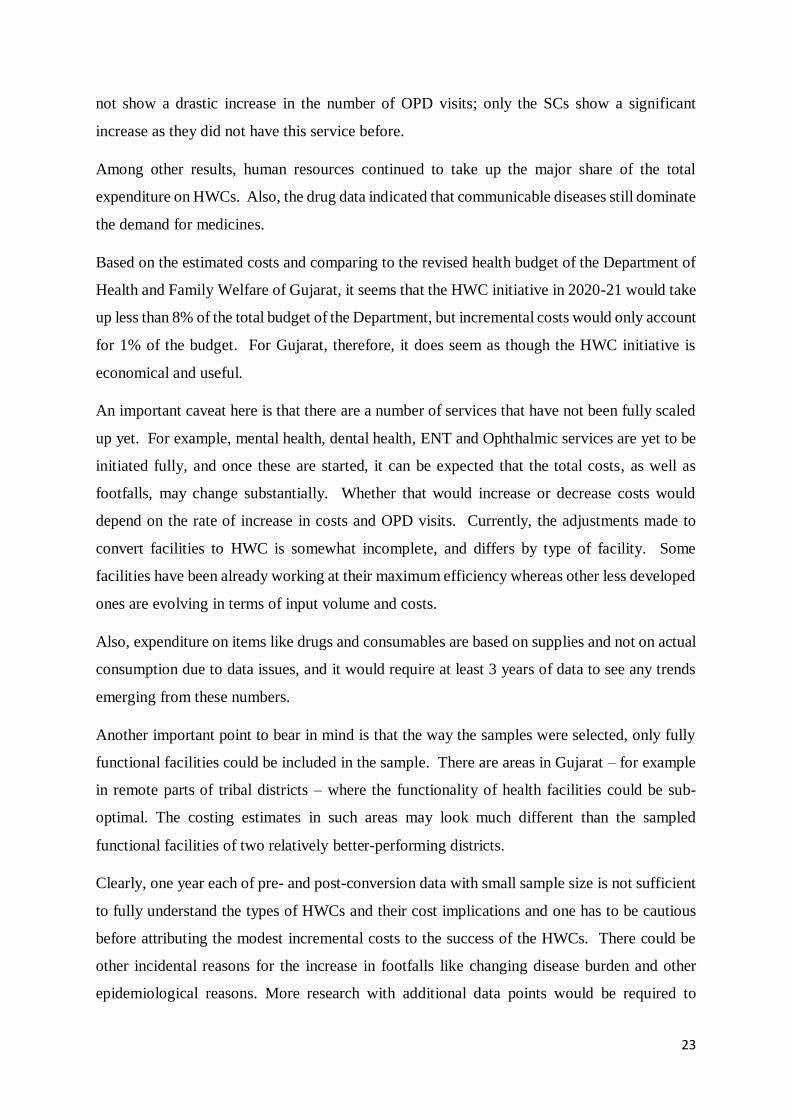
23
not show a drastic increase in the number of OPD visits; only the SCs show a significant
increase as they did not have this service before.
Among other results, human resources continued to take up the major share of the total
expenditure on HWCs. Also, the drug data indicated that communicable diseases still dominate
the demand for medicines.
Based on the estimated costs and comparing to the revised health budget of the Department of
Health and Family Welfare of Gujarat, it seems that the HWC initiative in 2020-21 would take
up less than 8% of the total budget of the Department, but incremental costs would only account
for 1% of the budget. For Gujarat, therefore, it does seem as though the HWC initiative is
economical and useful.
An important caveat here is that there are a number of services that have not been fully scaled
up yet. For example, mental health, dental health, ENT and Ophthalmic services are yet to be
initiated fully, and once these are started, it can be expected that the total costs, as well as
footfalls, may change substantially. Whether that would increase or decrease costs would
depend on the rate of increase in costs and OPD visits. Currently, the adjustments made to
convert facilities to HWC is somewhat incomplete, and differs by type of facility. Some
facilities have been already working at their maximum efficiency whereas other less developed
ones are evolving in terms of input volume and costs.
Also, expenditure on items like drugs and consumables are based on supplies and not on actual
consumption due to data issues, and it would require at least 3 years of data to see any trends
emerging from these numbers.
Another important point to bear in mind is that the way the samples were selected, only fully
functional facilities could be included in the sample. There are areas in Gujarat – for example
in remote parts of tribal districts – where the functionality of health facilities could be sub-
optimal. The costing estimates in such areas may look much different than the sampled
functional facilities of two relatively better-performing districts.
Clearly, one year each of pre- and post-conversion data with small sample size is not sufficient
to fully understand the types of HWCs and their cost implications and one has to be cautious
before attributing the modest incremental costs to the success of the HWCs. There could be
other incidental reasons for the increase in footfalls like changing disease burden and other
epidemiological reasons. More research with additional data points would be required to

24
confirm these tentative findings. However, being the first costing study on the HWCs in India,
this study could provide a baseline for future such studies.

25
REFERENCES
1. Abdullah, Asnawi, Krishna Hort, Azwar Zaenal Abidin, and Fadilah M. Amin. “How much
does it cost to achieve coverage targets for primary healthcare services? A costing model
from Aceh, Indonesia.” The International journal of health planning and management 27,
no. 3 (2012): 226-245.
2. Anand, K., C. S. Pandav, S. K. Kapoor, G. Kumar, and L. Nath. “Cost of health services
provided at a primary health centre.” National Medical Journal of India 8 (1995): 156-156.
3. Chapko, Michael K., Chuan‐Fen Liu, Mark Perkins, Yu‐Fang Li, John C. Fortney, and
Matthew L. Maciejewski. “Equivalence of two healthcare costing methods: bottom‐up and
top‐down.” Health Economics 18, no. 10 (2009): 1188-1201.
4. Dalaba, Maxwell Ayindenaba, Paul Welaga, and Chieko Matsubara. “Cost of delivering
health care services at primary health facilities in Ghana.” BMC health services
research 17, no. 1 (2017): 742.
5. Green, A., B. Ali, A. Naeem, and A. Vassall. “Using costing as a district planning and
management tool in Balochistan, Pakistan.” Health policy and planning 16, no. 2 (2001):
180-186.
6. Health and Family Welfare Department, Government of Gujarat. “Commissionerate of
Health – Rural health.” https://gujhealth.gujarat.gov.in/rural-health.htm. Accessed on 25
September 2020.
7. Health and Family Welfare Department, Government of Gujarat. “Commissionerate of
Health – Urban health.” https://gujhealth.gujarat.gov.in/urban-health.htm. Accessed on 25
September 2020.
8. McBain, Ryan K., Gregory Jerome, Fernet Leandre, Micaela Browning, Jonathan Warsh,
Mahek Shah, Bipin Mistry et al. “Activity-based costing of health-care delivery,
Haiti.” Bulletin of the World Health Organization 96, no. 1 (2018): 10.
9. Ministry of Health and Family Welfare, Government of India. “Ayushman Bharat – Health
and Wellness Centre.” National Health Portal. https://ab-hwc.nhp.gov.in. Accessed on 25
September 2020.
10. Ministry of Health and Family Welfare, Government of India. “Report of the Task Force
on Comprehensive Primary Health Care Rollout.” (2015).
11. Ministry of Health and Family Welfare, Government of India. “National Health Policy
2017.” (2017).

26
12. Ministry of Health and Family Welfare, Government of India. “Operational Guidelines for
Comprehensive Primary Health Care through Health and Wellness Centres.” (2018).
13. Ministry of Health and Family Welfare, Government of India. “Regional Workshops on
Operationalization of Ayushman Bharat Health and Wellness Centres – A Synthesis
Report.” (2019).
14. Ministry of Health and Family Welfare, Government of India. “Ayushman Bharat Health
and Wellness Centres – Accelerating towards health for all.” (2019).
15. Malik, Muhammad Ashar, Wahid Gul, and Farina Abrejo. “Cost of primary health care in
Pakistan.” J Ayub Med Coll Abbottabad 27, no. 1 (2015): 88.
16. Mogyorosy, Z., and P. Smith. “The main methodological issues in costing health care
services. A literature review.” Centre for Health Economics, The University of York.
(2005).
17. Mugisha, Frederick, Bocar Kouyate, Hengjin Dong, and R. Sauerborn. “Costing health care
interventions at primary health facilities in Nouna, Burkina Faso.” African journal of health
sciences 9, no. 1 (2002): 69-79.
18. Pavignani, Enrico, and Sandro Colombo. “Analysing disrupted health sectors: a modular
manual.” Analysing disrupted health sectors: A modular manual. World Health
Organization. (2009).
19. Prinja, Shankar, Aditi Gupta, Ramesh Verma, Pankaj Bahuguna, Dinesh Kumar, Manmeet
Kaur, and Rajesh Kumar. “Cost of delivering health care services in public sector primary
and community health centres in North India.” PloS one 11, no. 8 (2016): e0160986.

Recent IEG Working Papers:
Kumar, Neeraj and Mitra, Arup (Jan, 2021). What Causes Poor Child Health in India? Reflections from NFHS-5, Working Paper Sr. No.: 414
Chetty, V.K. and Pradhan, Basanta K. (2020). Harrod-Domar Formula for Two Sector Growth Models, A Data Envelopment Analysis Approach, Working Paper Sr. No.: 413
Sharma, Suresh and Vandana Sharma (2020). Efficiency Assessment of Maternal health services in the Aspirational Districts of EAG states in India: A Data Envelopment Analysis Approach, Working Paper Sr. No.: 412
Bishnoi, Ashwani and Sahoo, Pravakar (2020). BELT AND ROAD INITIATIVE: Developments, Economic and Strategic Implications, Working Paper Sr. No.: 411
Mitra, Arup and Sharma, Chandan (2020). Employment and TFP Impact of Technologies in the Developing World: Domestic versus Imported Expertise, Working Paper Sr. No.: 410
Das, Saudamini and Mishra, Ajit (2020). COVID lockdown, how people managed and impact of welfare schemes on informal sector workers: Evidence from Delhi slums, Working Paper Sr. No.: 409
Jha, Brajesh (2020). Farmers’ Stress, Income and the role of Non-Farm Business, Working Paper Sr. No.: 408
Brown, Trent(2020). Vocational Training, Extension, and the Changing Landscape of Agricultural Education in India, Working Paper Sr. No.: 407
Kumar, Abhishek and Joe, William(2020). Cost-Benefit Analyses of Nutrition Interventions in India’s Policy Framework, Working Paper Sr. No.: 406
IEG Working Paper No. 415
INSTITUTE OF ECONOMIC GROWTH
University Enclave, University of Delhi (North Campus) Delhi 110007, India
Tel: 27667288/365/424 Email: [email protected]
January 2021